Article

Effect of Pulse Electrodeposition Parameters on the Catalytic Performance of PtNi Oxygen Reduction


1
School of Chemical Engineering, East China University of Science and Technology, Shanghai 200237, China
2
State Key Laboratory of Green Chemical Engineering and Industrial Catalysis, School of Chemical Engineering, East China University of Science and Technology, Shanghai 200237, China
*
Author to whom correspondence should be addressed.
Catalysts 2026, 16(4), 293; https://doi.org/10.3390/catal16040293
Submission received: 4 March 2026 / Revised: 23 March 2026 / Accepted: 25 March 2026 / Published: 27 March 2026
(This article belongs to the Section Electrocatalysis)

Abstract

To overcome active site blockage and poor interfacial contact in traditional syntheses, PtNi bimetallic nanoparticles were grown in situ on a microporous carbon paper via pulse electrodeposition. Firstly, the impact of deposition potential was investigated. The results indicate that the deposition potential significantly modulates the surface Pt0/Pt2+ ratio; concurrently, a shift toward more negative potentials intensified nanoparticle agglomeration. The effects of the duty cycle were investigated at an optimal deposition potential of −0.95 to −0.4 V. A duty cycle of 30% yielded the optimal Pt0/Pt2+ ratio. Furthermore, TEM revealed a coexisting strain profile of bulk PtNi lattice contraction and localized expansion at peripheral Pt (111) facets. This synergistic tuning of surface valence and strain optimizes the thermodynamic balance between oxygen adsorption and intermediate desorption on Pt sites. In summary, the optimal catalyst, prepared at a deposition potential of −0.95 V and a duty cycle of 30%, showed the best reaction behavior in the oxygen reduction reaction with an initial onset potential of 0.92 V (vs. RHE). After 5000 cycles of testing, the catalyst showed a constant durability, with the onset potential degrading only marginally to 0.87 V. This work successfully demonstrates that the surface morphology and valence states of the catalyst can be effectively tailored by regulating the pulse voltage and duty cycle.

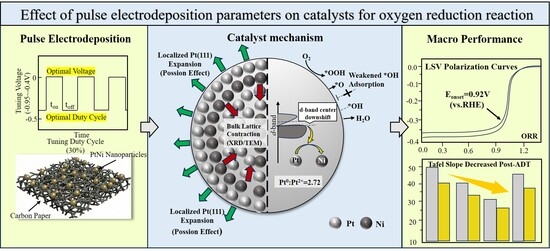
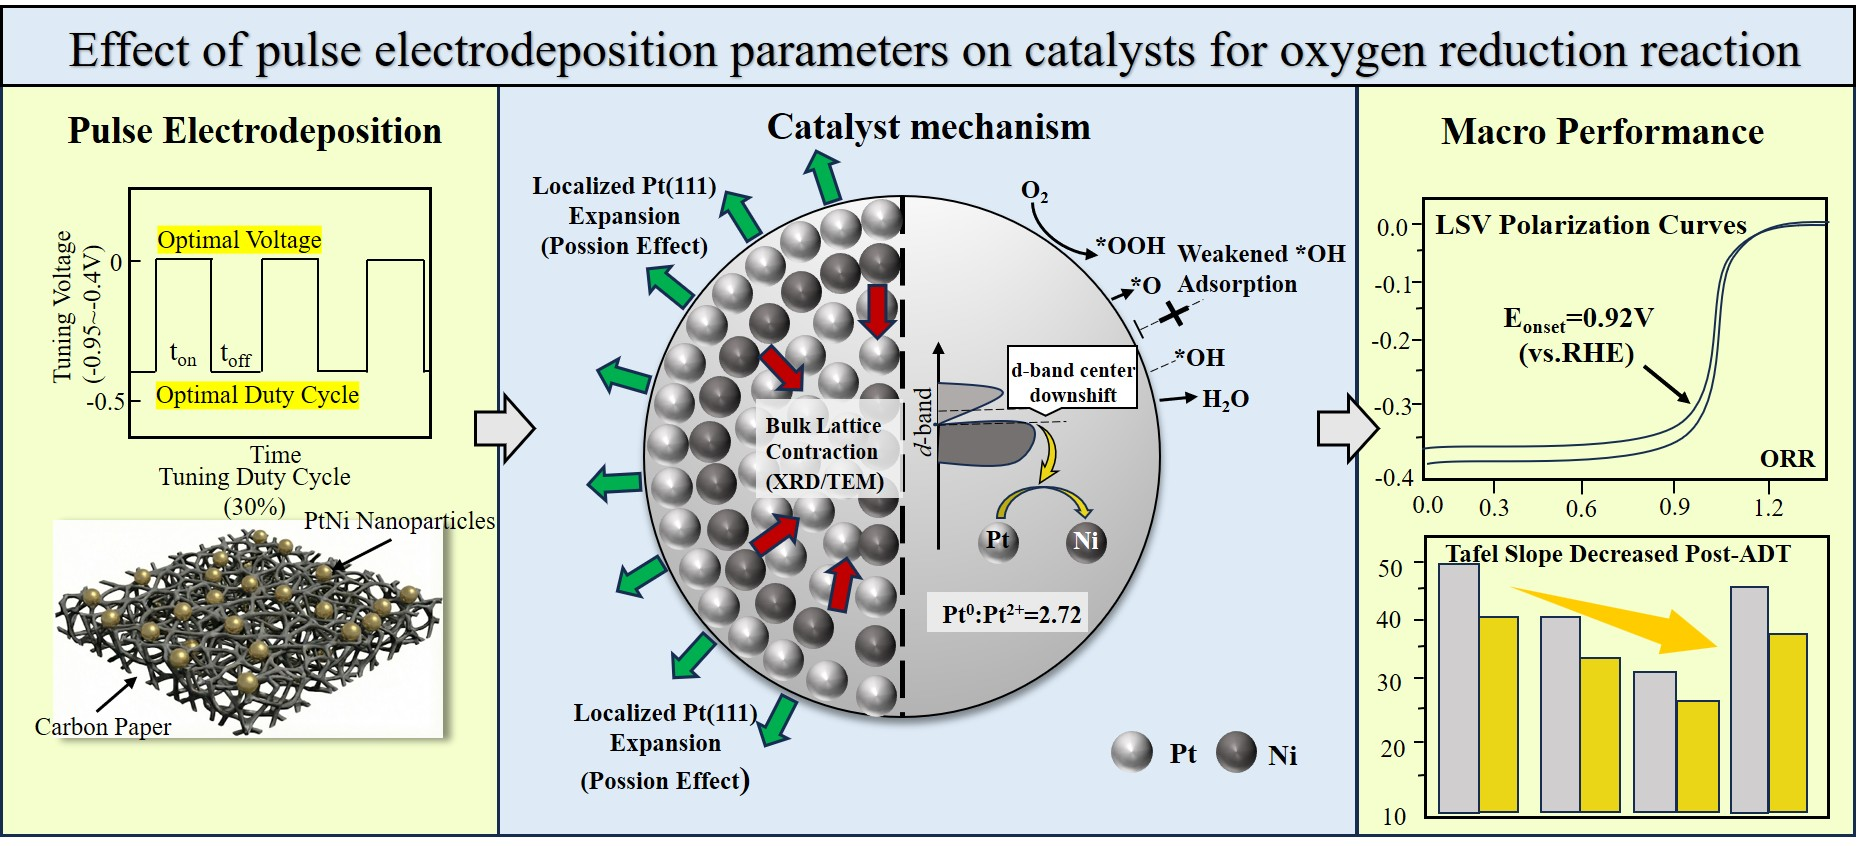
Graphical Abstract

1. Introduction

Proton exchange membrane fuel cells (PEMFCs), which directly convert the chemical energy of hydrogen into electricity, exhibit remarkable advantages including high energy conversion efficiency, zero emissions, and quiet operation. Consequently, they hold tremendous promise for applications in areas such as electric vehicles [1]. However, the widespread commercialization of PEMFCs is severely hindered by the sluggish kinetics of the cathodic oxygen reduction reaction (ORR). Furthermore, the state-of-the-art Pt-based catalysts suffer from prohibitive costs, resource scarcity, and a high susceptibility to CO poisoning [2]. Therefore, the development of cost-effective and highly active cathodic ORR catalysts is of paramount importance.
Traditional catalyst synthesis routes often result in suboptimal three-phase boundaries (TPBs) among the catalyst nanoparticles, the electrolyte, and the reactant gas (O2) [3], thereby leading to a low utilization of active sites. The integrated strategy of directly depositing the catalyst onto the gas diffusion layer (GDL) substrate [4] can effectively optimize this interfacial architecture. Electrodeposition techniques, particularly pulse electrodeposition (PED) [5], enable the in situ synthesis, uniform dispersion, and robust immobilization of catalyst nanoparticles directly on conductive substrates, thereby achieving an exceptionally high utilization of noble metals. Sriwannaboot et al. [6] employed pulse reverse electrodeposition to fabricate Pt-Co bimetallic catalysts. By selectively dissolving the less noble Co during the anodic reverse pulse, they precisely tailored the atomic percentage of Pt (at %) within the alloy. Increasing the anodic current density or the duration of the reverse pulse enriched the Pt content from 28 to 88 at %, significantly enhancing Pt utilization. Egetenmeyer et al. [7] utilized pulse electrodeposition to prepare low-loading Pt, PtNi, and PtCo nanocatalyst electrodes, achieving a uniform and fine-grained deposition of the catalyst nanoparticles. For Pt deposition, the optimal parameters were identified as a pulse on-time (Ton) of 5 ms, an off-time (Toff) of 195 ms, and a peak current density of at least 100 mA·dm−2. These results offer critical insights for the precision control of catalyst morphology and stoichiometric composition. Although nanoparticles produced via electrodeposition are typically larger than those synthesized by wet-chemical methods, this technique facilitates the fabrication of unique structural architectures such as petal-like [8], granular [9], dendritic [10], and polyhedral [11] morphologies. Such unique structures are conducive to exposing abundant active sites, thereby elevating the intrinsic electrocatalytic activity.
Pure Pt catalysts suffer from inherent limitations, such as low atomic utilization and insufficient stability [12], the design of Pt-based alloys by incorporating transition metals (e.g., Ni, Fe, Co) [13] has emerged as a viable strategy. This approach not only reduces Pt loading but also optimizes catalytic performance via electronic (ligand) and geometric (strain) effects [14]. In terms of the electronic effect, the lower electronegativity of Ni (1.91) compared to Pt (2.20) induces an electron transfer from Ni to Pt upon alloying. This results in a downshift of the Pt d-band center, which modulates the binding energy of oxygenated intermediates (*O, *OH) and consequently lowers the activation energy barrier for the ORR. Xia et al. [15] employed Density Functional Theory (DFT) calculations to demonstrate that a Pt (111) surface modified with single Ni atoms (Ni1/Pt (111)) exhibits an ORR overpotential as low as 0.21 V, indicating exceptional intrinsic activity. Thanh Duc Le et al. [16] investigated a composite electrocatalyst featuring the synchronous integration of Pt/Ni dual single atoms and Pt-Ni alloy nanoparticles. In acidic media, the catalyst achieved a half-wave potential of 0.912 V. Following a 10,000-cycle durability test, the half-wave potential exhibited a negative shift of only 16 mV. Moreover, the Pt atomic utilization reaches 0.033 gPt·kW−1, which is 5.6 times higher than that of commercial Pt/C. Regarding the geometric effect, the disparity between the atomic radius of Ni (0.124 nm) and that of Pt (0.139 nm) induces a lattice contraction in the Pt crystal. This modification creates a unique surface atomic arrangement that increases the density of active sites and improves their accessibility [17]. Experimental studies have confirmed that the ORR mass activity of PtNi alloy catalysts can be enhanced by several to tens of times compared to pure Pt catalysts. Moreover, precise compositional tuning (e.g., ordered intermetallic PtNi3) [18] and morphological engineering offer further avenues for the synergistic enhancement of activity and stability, providing a broad framework for the design of next-generation high-performance ORR catalysts.
In this work, PtNi nanoparticles were deposited onto carbon paper surfaces via pulse electrodeposition to investigate the impact of deposition potential and duty cycle on the catalytic performance for the oxygen reduction reaction. Firstly, the morphology and spatial distribution of the PtNi particles were characterized using scanning electron microscopy (SEM) and transmission electron microscopy (TEM). Secondly, X-ray diffraction (XRD) alongside high-resolution TEM were employed to investigate the crystallographic features of the carbon substrate and platinum (Pt) facets, as well as to assess the degree of alloying within the PtNi nanoparticles. Thirdly, X-ray photoelectron spectroscopy (XPS) was utilized to elucidate the variations in surface metal valence states and the synergistic interactions between Pt and Ni induced by different deposition conditions. Finally, the electrochemical performance was evaluated in a half-cell configuration using cyclic voltammetry (CV) and linear sweep voltammetry (LSV). The durability of the catalyst electrodes was assessed by monitoring changes in the electrochemically active surface area (ECSA), onset potential, and Tafel slope.

2. Results and Discussions

2.1. Physical Characterization and Half-Cell Performance Testing of Ni Under Different Deposition Voltages

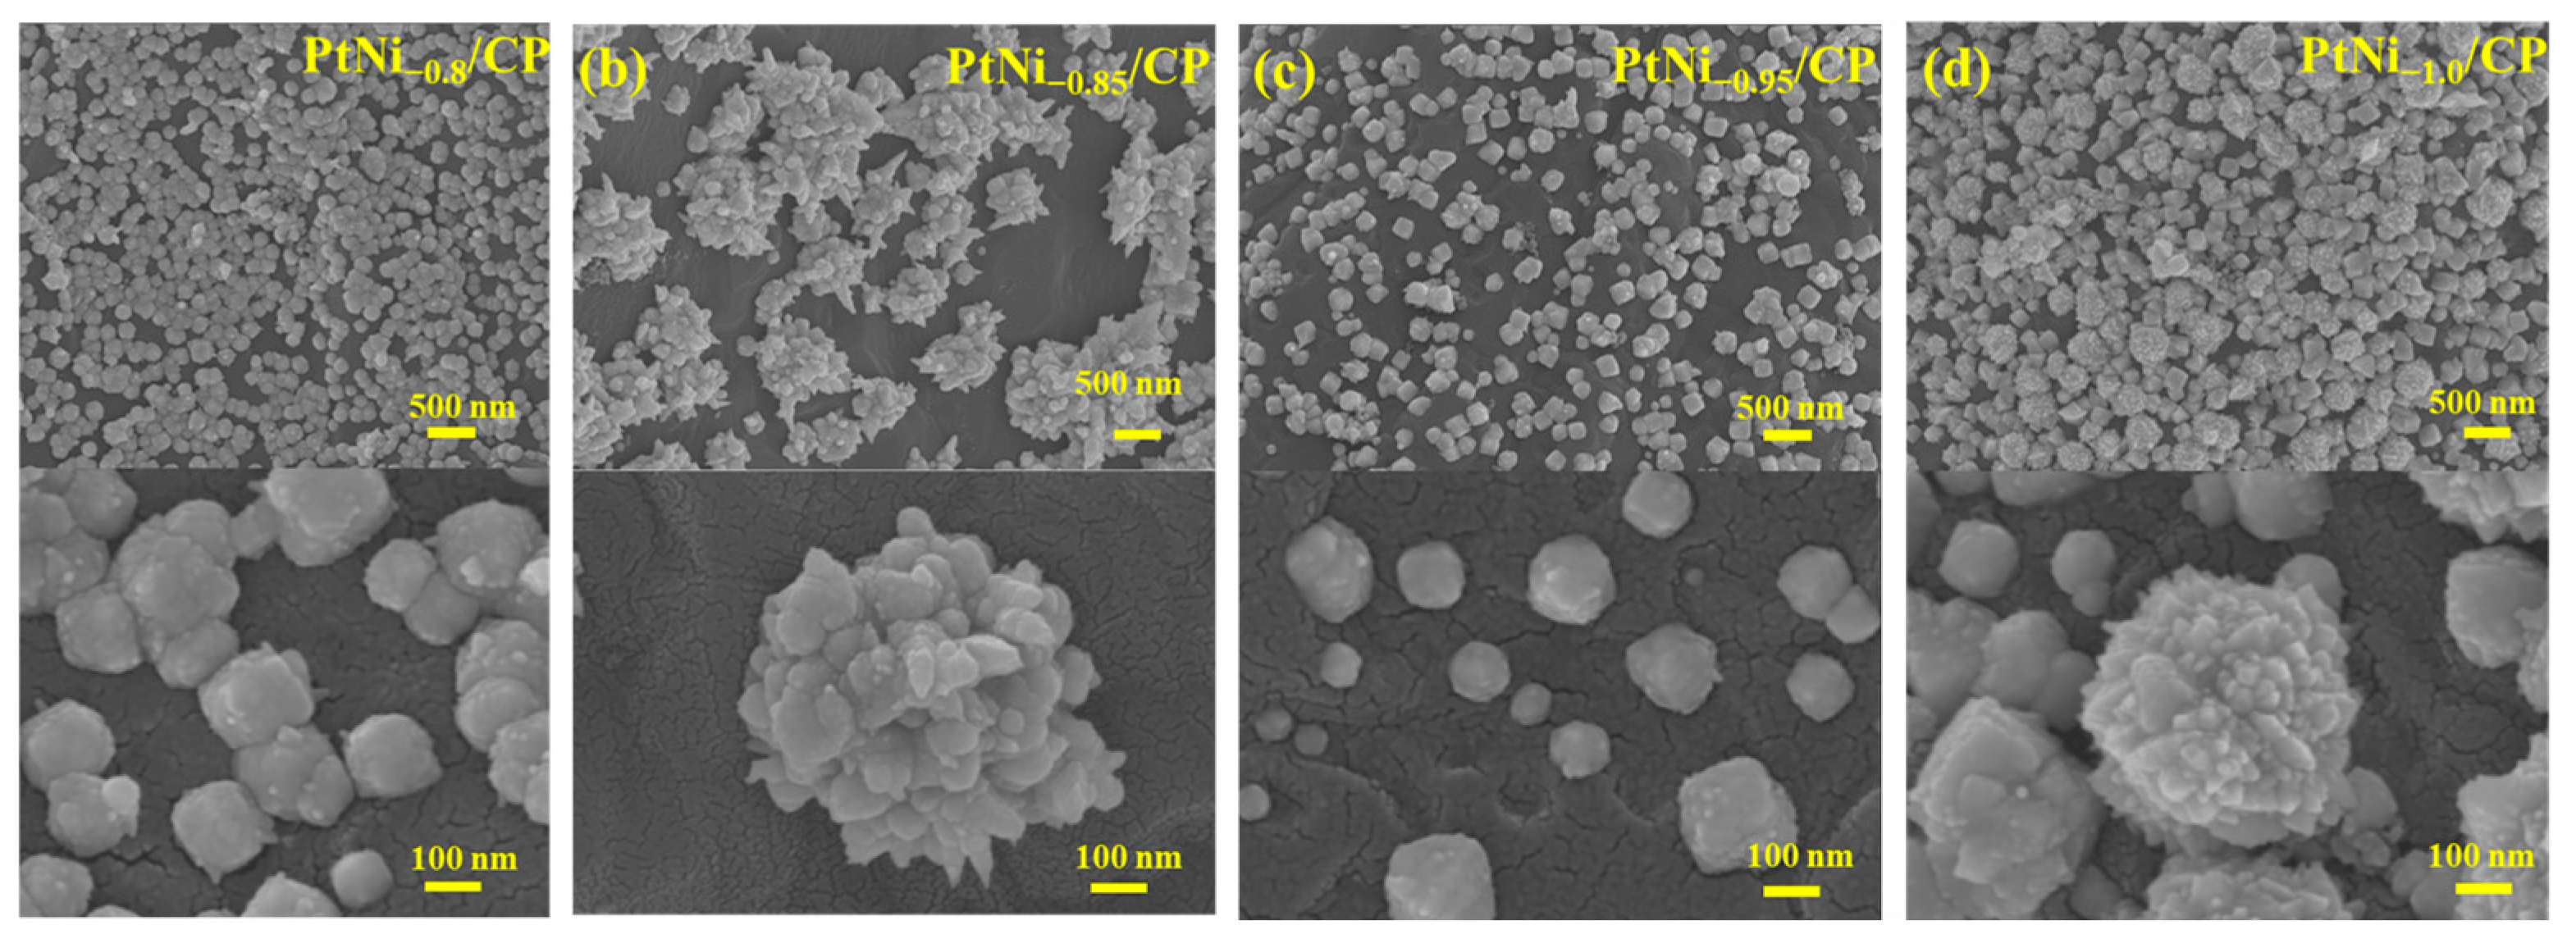
First, the morphology of the metal particles obtained at different deposition potentials was observed. Figure 1 presents SEM images of carbon paper treated under different Ni deposition potentials. The Ni deposition potential exerted a profound impact on the geometric morphology of the catalysts. At a relatively less negative potential of −0.8 V (vs. SCE), the nucleation overpotential is low. This results in a sluggish nucleation rate but allows for sufficient surface diffusion, thereby favoring the formation of small particles. As the deposition potential is shifted more negatively to a moderate value of −0.85 V (vs. SCE), the nucleation rate increases. However, the applied cathodic pulse potential remains insufficiently negative. Under conditions of an abundant ion supply, Ni preferentially deposits onto pre-existing nuclei, causing grain coarsening and the formation of large clusters. Consequently, the growth mechanism transitions from “layer-by-layer growth” to “dendritic growth” [19]. When the potential is further shifted negatively to −0.95 V (vs. SCE), the nucleation rate surpasses the crystal growth rate. This kinetic shift effectively promotes the migration of surface atoms and the uniform dispersion of the nanoparticles [20]. However, when the potential is further decreased to −1.0 V (vs. SCE), significant agglomeration and coarsening of the particles were observed. This deterioration is likely associated with the vigorous perturbation caused by the hydrogen evolution reaction (HER) and the consequent alteration of the local chemical environment at such high overpotentials. Furthermore, the deposition of Pt involved a galvanic displacement reaction with Ni [21]. An extended deposition duration facilitated the complete encapsulation or substitution of the pre-deposited Ni template by Pt, thereby fostering the formation of core–shell or alloyed structures with superior intrinsic potential for the ORR [22].
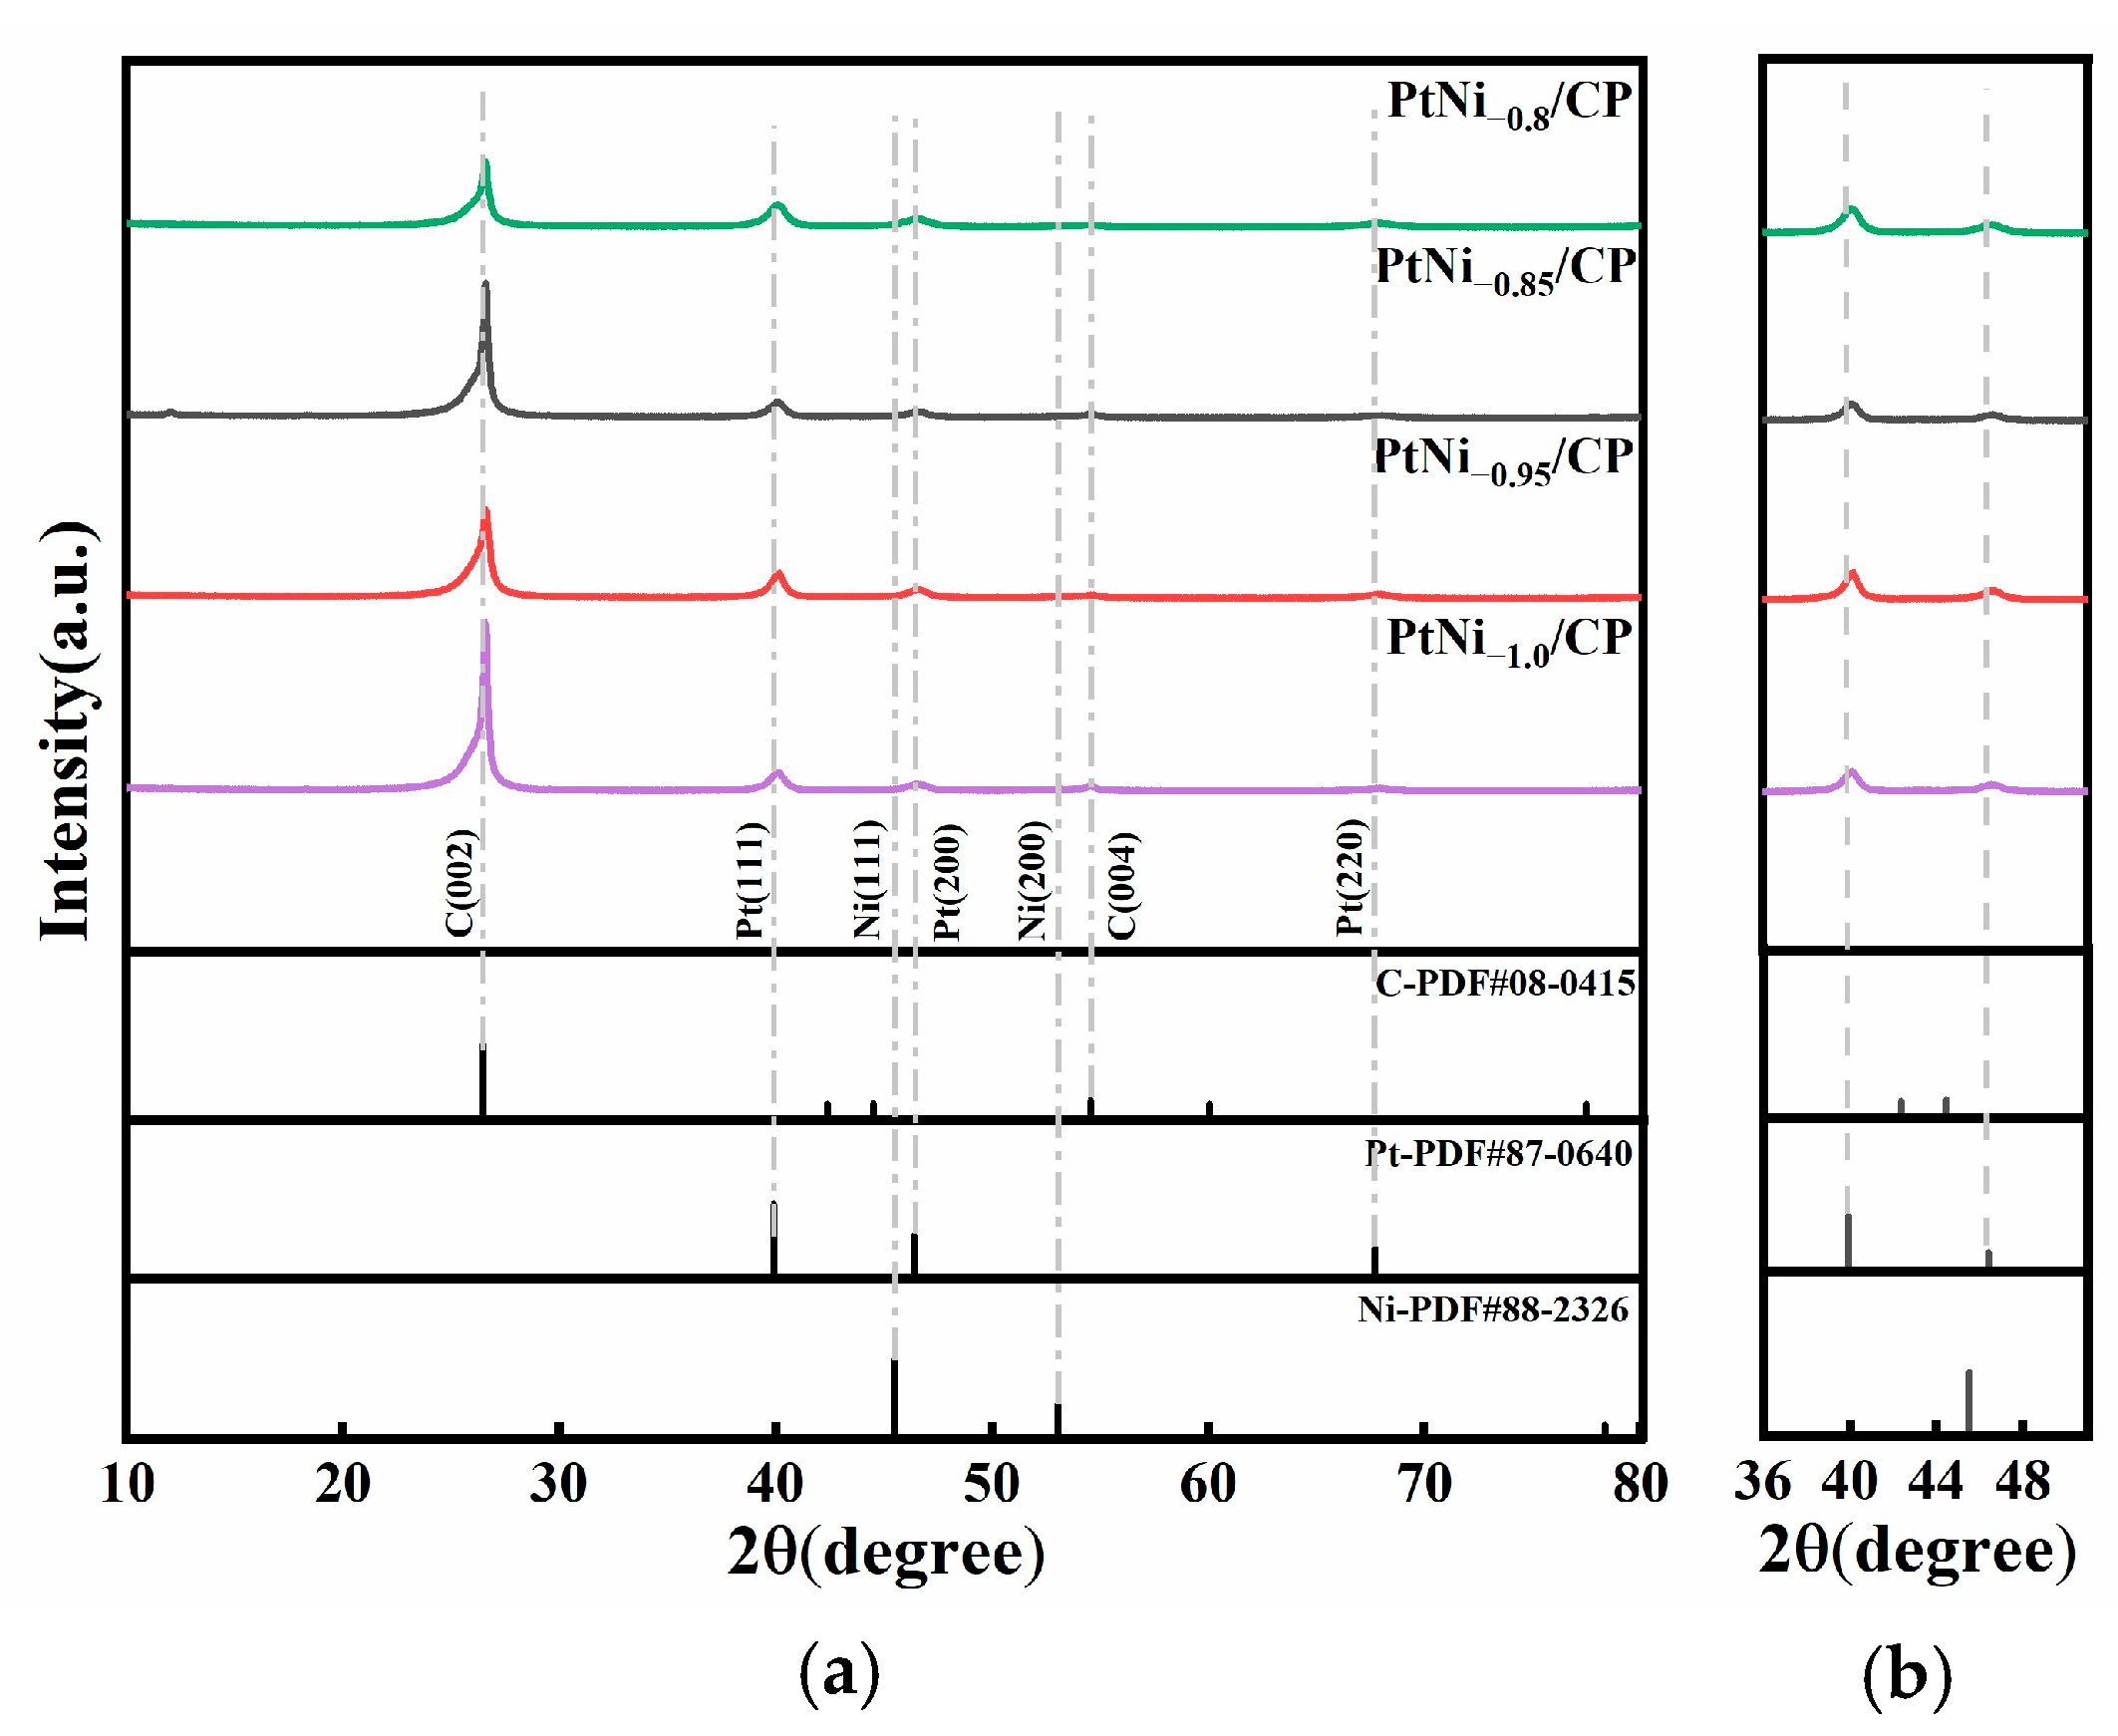
Beyond the surface morphology, we used XRD to investigate the internal crystal structure and alloying degree of these nanoparticles. As shown in Figure 2a, the catalyst electrodes exhibit distinct peaks at the C (002) and C (004) planes (JCPDS NO. 08-0415), indicating that the structural integrity of the carbon support was well-preserved during the synthesis process. Distinct peaks corresponding to the Pt (111) plane at 2θ = 40.1°, the Pt (200) plane at 2θ = 46.6°, and the Pt (220) plane at 2θ = 67.9° were observed (JCPDS NO. 87-0640). Figure 2b presents a magnified view of the XRD patterns in the regions corresponding to the Pt (111), Pt (200), and C (004) facets. Among the prepared samples, the PtNi−0.95/CP catalyst displays sharp and intense Pt (111) peaks, suggesting superior crystallinity and a high degree of structural ordering within the alloy. However, as the deposition potential shifted to more negative values, the intensity of the Pt (111) peak diminished, accompanied by peak broadening. This trend indicates a decline in crystallinity, likely attributable to the grain refinement effect or an increased density of lattice defects induced by the vigorous deposition conditions. Furthermore, relative to the standard pure Pt patterns, the Pt (111) and Pt (200) peaks of all PtNi alloy catalysts exhibit a positive shift toward higher angles to varying degrees [23]. This shift stems from the lattice contraction effect (compressive strain); since the atomic radius of Ni is smaller than that of Pt, the incorporation of Ni atoms results in a reduction in the Pt lattice parameters. This alloying effect not only modifies the geometric crystal structure but also effectively modulates the surface electronic structure. Specifically, it weakens the excessively strong Pt-O binding energy and optimizes the adsorption energy of oxygenated intermediates [24] thereby exposing abundant active sites and significantly enhancing the intrinsic oxygen reduction reaction (ORR) activity. Combined with the XRD data and Scherrer equation, the Pt crystallite sizes of the four catalysts are 7.71, 9.28, 10.66, and 12.96 nm, as shown in Table 1. As the deposition potential is shifted to more negative values, the thermodynamic driving force for electrocrystallization increases, which correlates with a clear increasing trend in the crystallite size. Notably, no diffraction peaks corresponding to crystalline Ni species were detected in the patterns (JCPDS NO. 88-2326). The observed peak shift, combined with the absence of independent Ni peaks, corroborates the formation of a Pt-Ni alloy phase rather than a simple physical mixture [25].
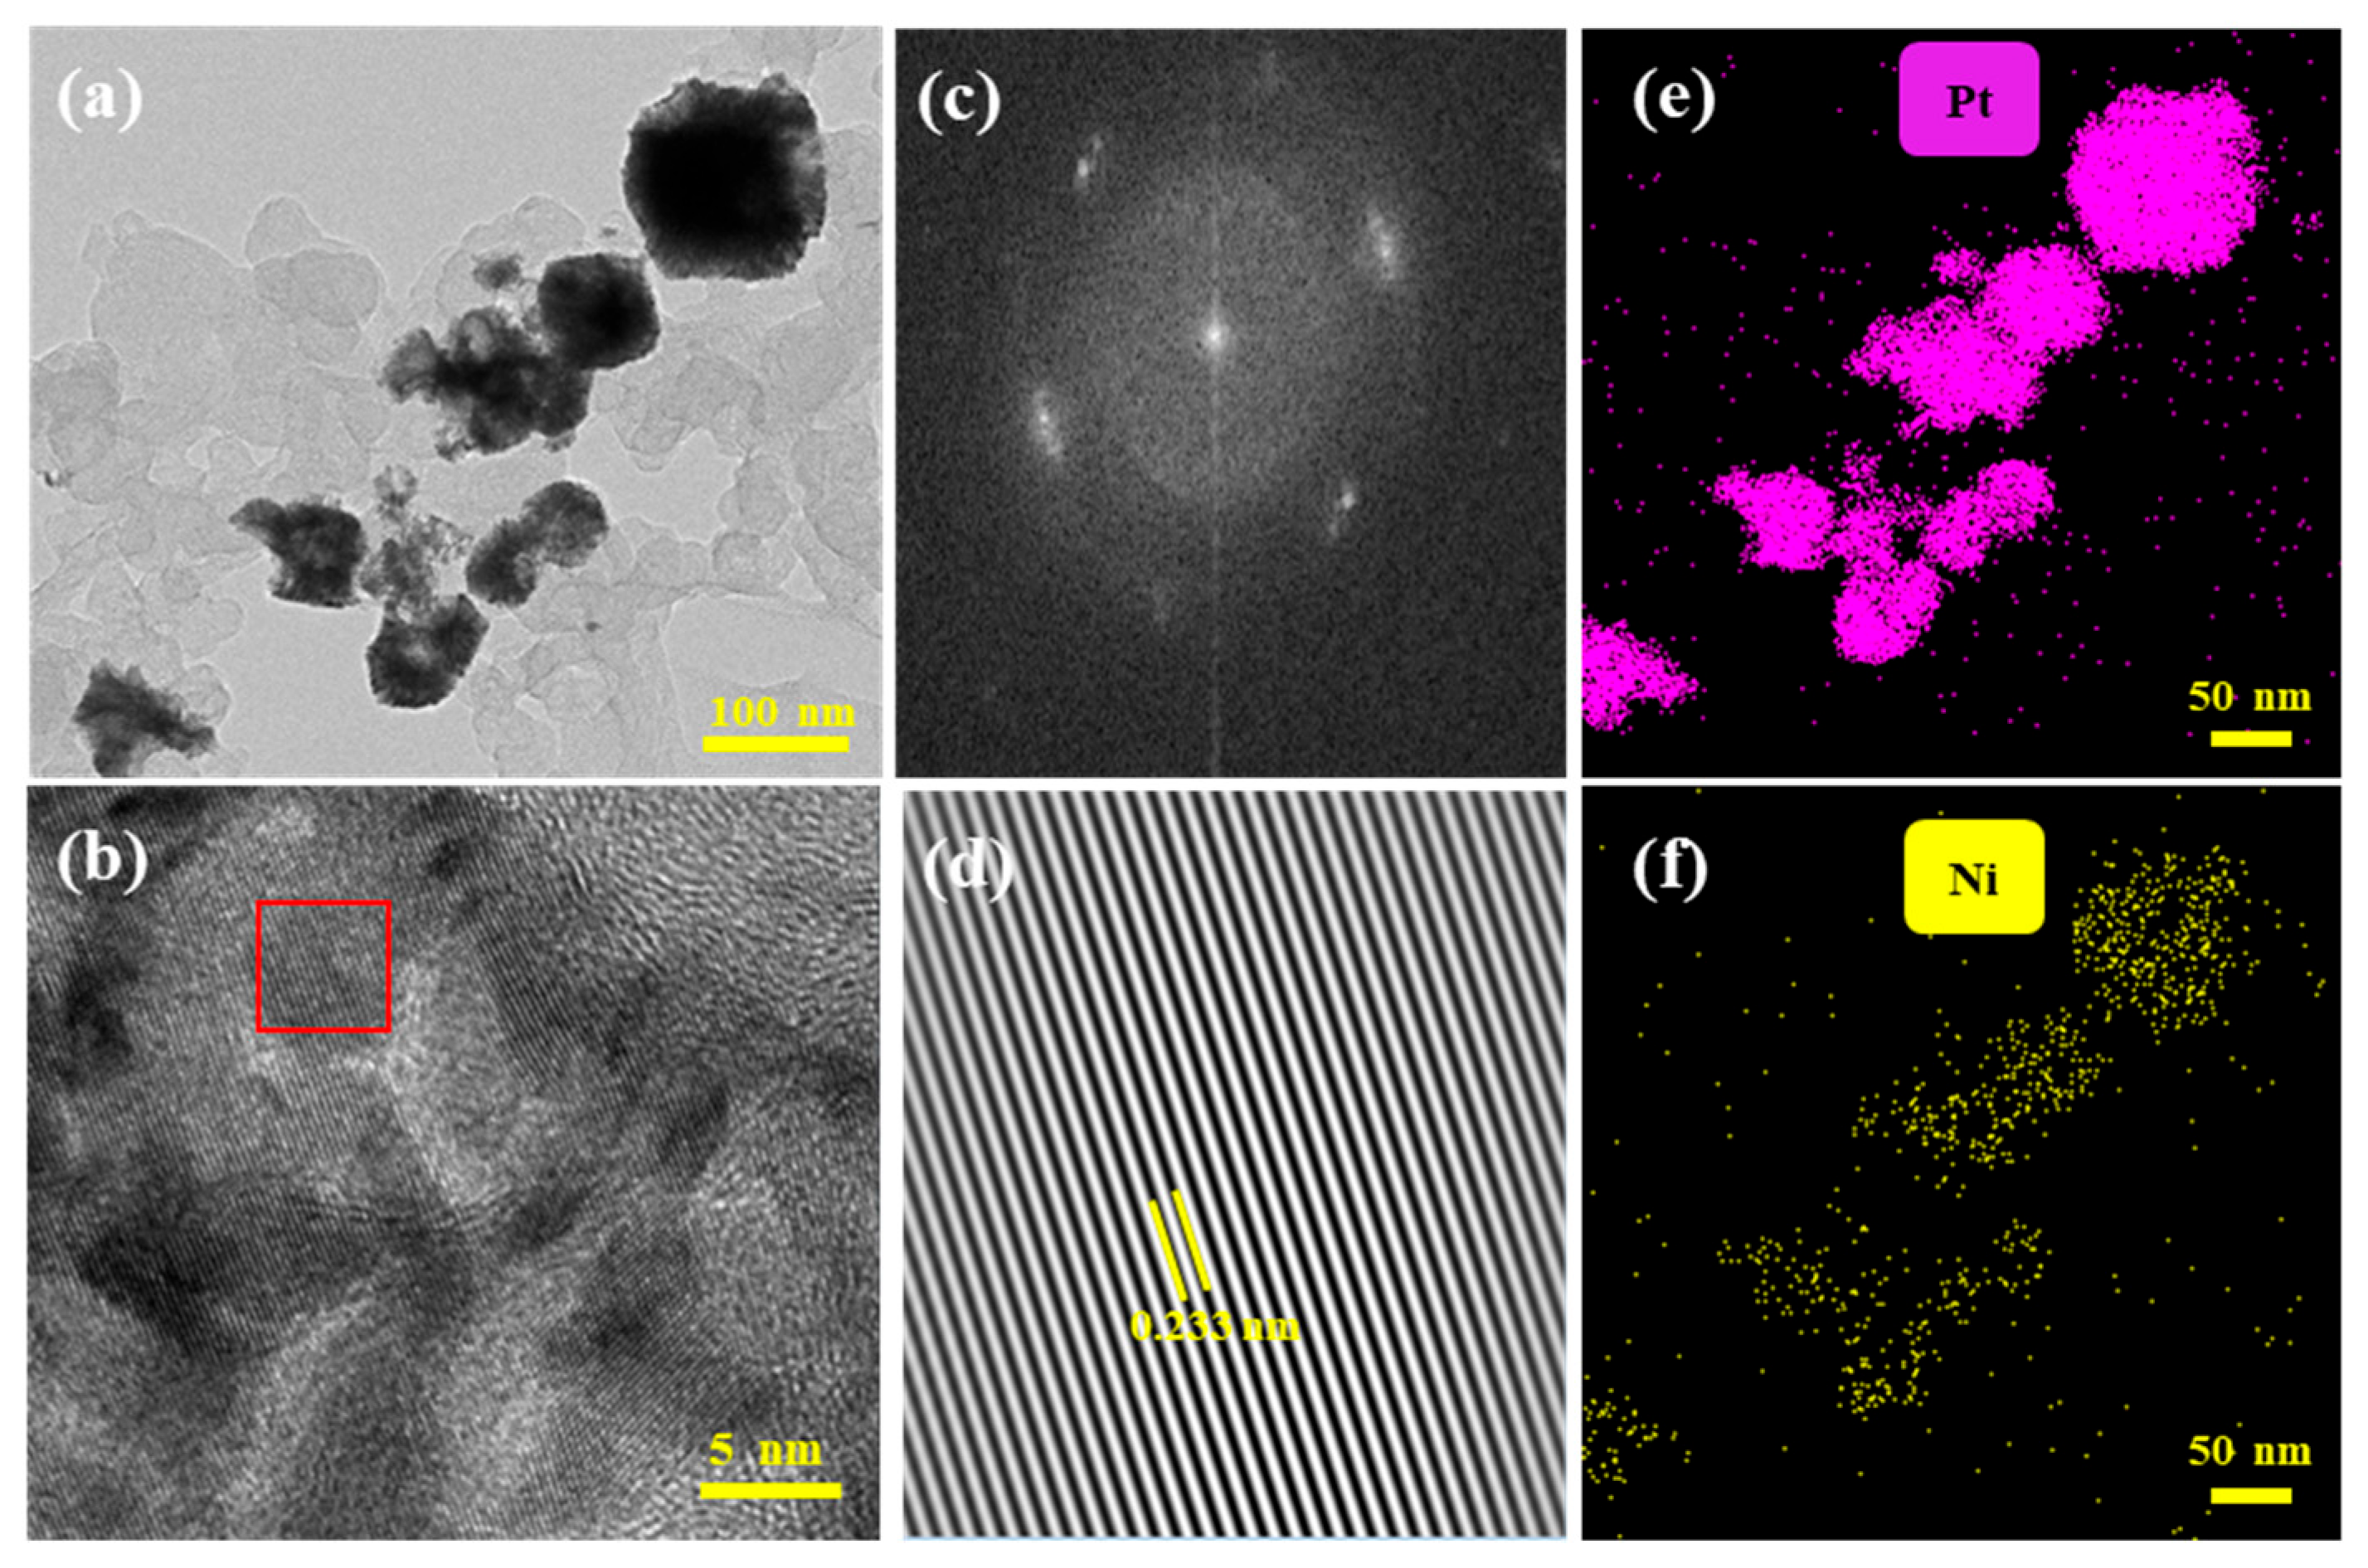
Figure 3 presents the transmission electron microscopy (TEM) image of the PtNi−0.95/CP catalyst. As revealed in Figure 3a, nanoparticles ranging from 50 to 100 nm in size are formed on the surface, which aligns with the morphological observations from the SEM analysis. Figure 3c displays the corresponding Fast Fourier Transform (FFT) pattern derived from the region enclosed by the red box in Figure 3b. Subsequently, Figure 3d shows the Inverse Fast Fourier Transform (IFFT) image generated from Figure 3c, which is utilized for detailed lattice structural analysis. According to the XRD analysis, the Pt (111) facet exhibits the most intense diffraction peak among all crystalline planes, corresponding to an interplanar spacing (d-spacing) of 0.225 nm. In contrast, the d-spacing measured from the high-resolution TEM image is 0.233 nm. Interestingly, while the XRD results indicate a macroscopic lattice contraction in the bulk PtNi alloy, the TEM analysis reveals a localized expansion in the d-spacing of the peripheral Pt (111) facets. This localized lattice expansion can be ascribed to the Poisson effect [26]. Specifically, to achieve lattice matching with the contracted PtNi alloy core, the outer Pt-rich skin is subjected to compressive strain in the in-plane direction. Consequently, this induces a compensatory expansion of the interplanar spacing in the out-of-plane direction. This unique structural architecture-characterized by macroscopic contraction and localized expansion not only optimizes the overall d-band center but also provides highly active, asymmetric adsorption sites. These geometric features are exceptionally conducive to the adsorption and subsequent activation of oxygen molecules and key reactive intermediates [27].
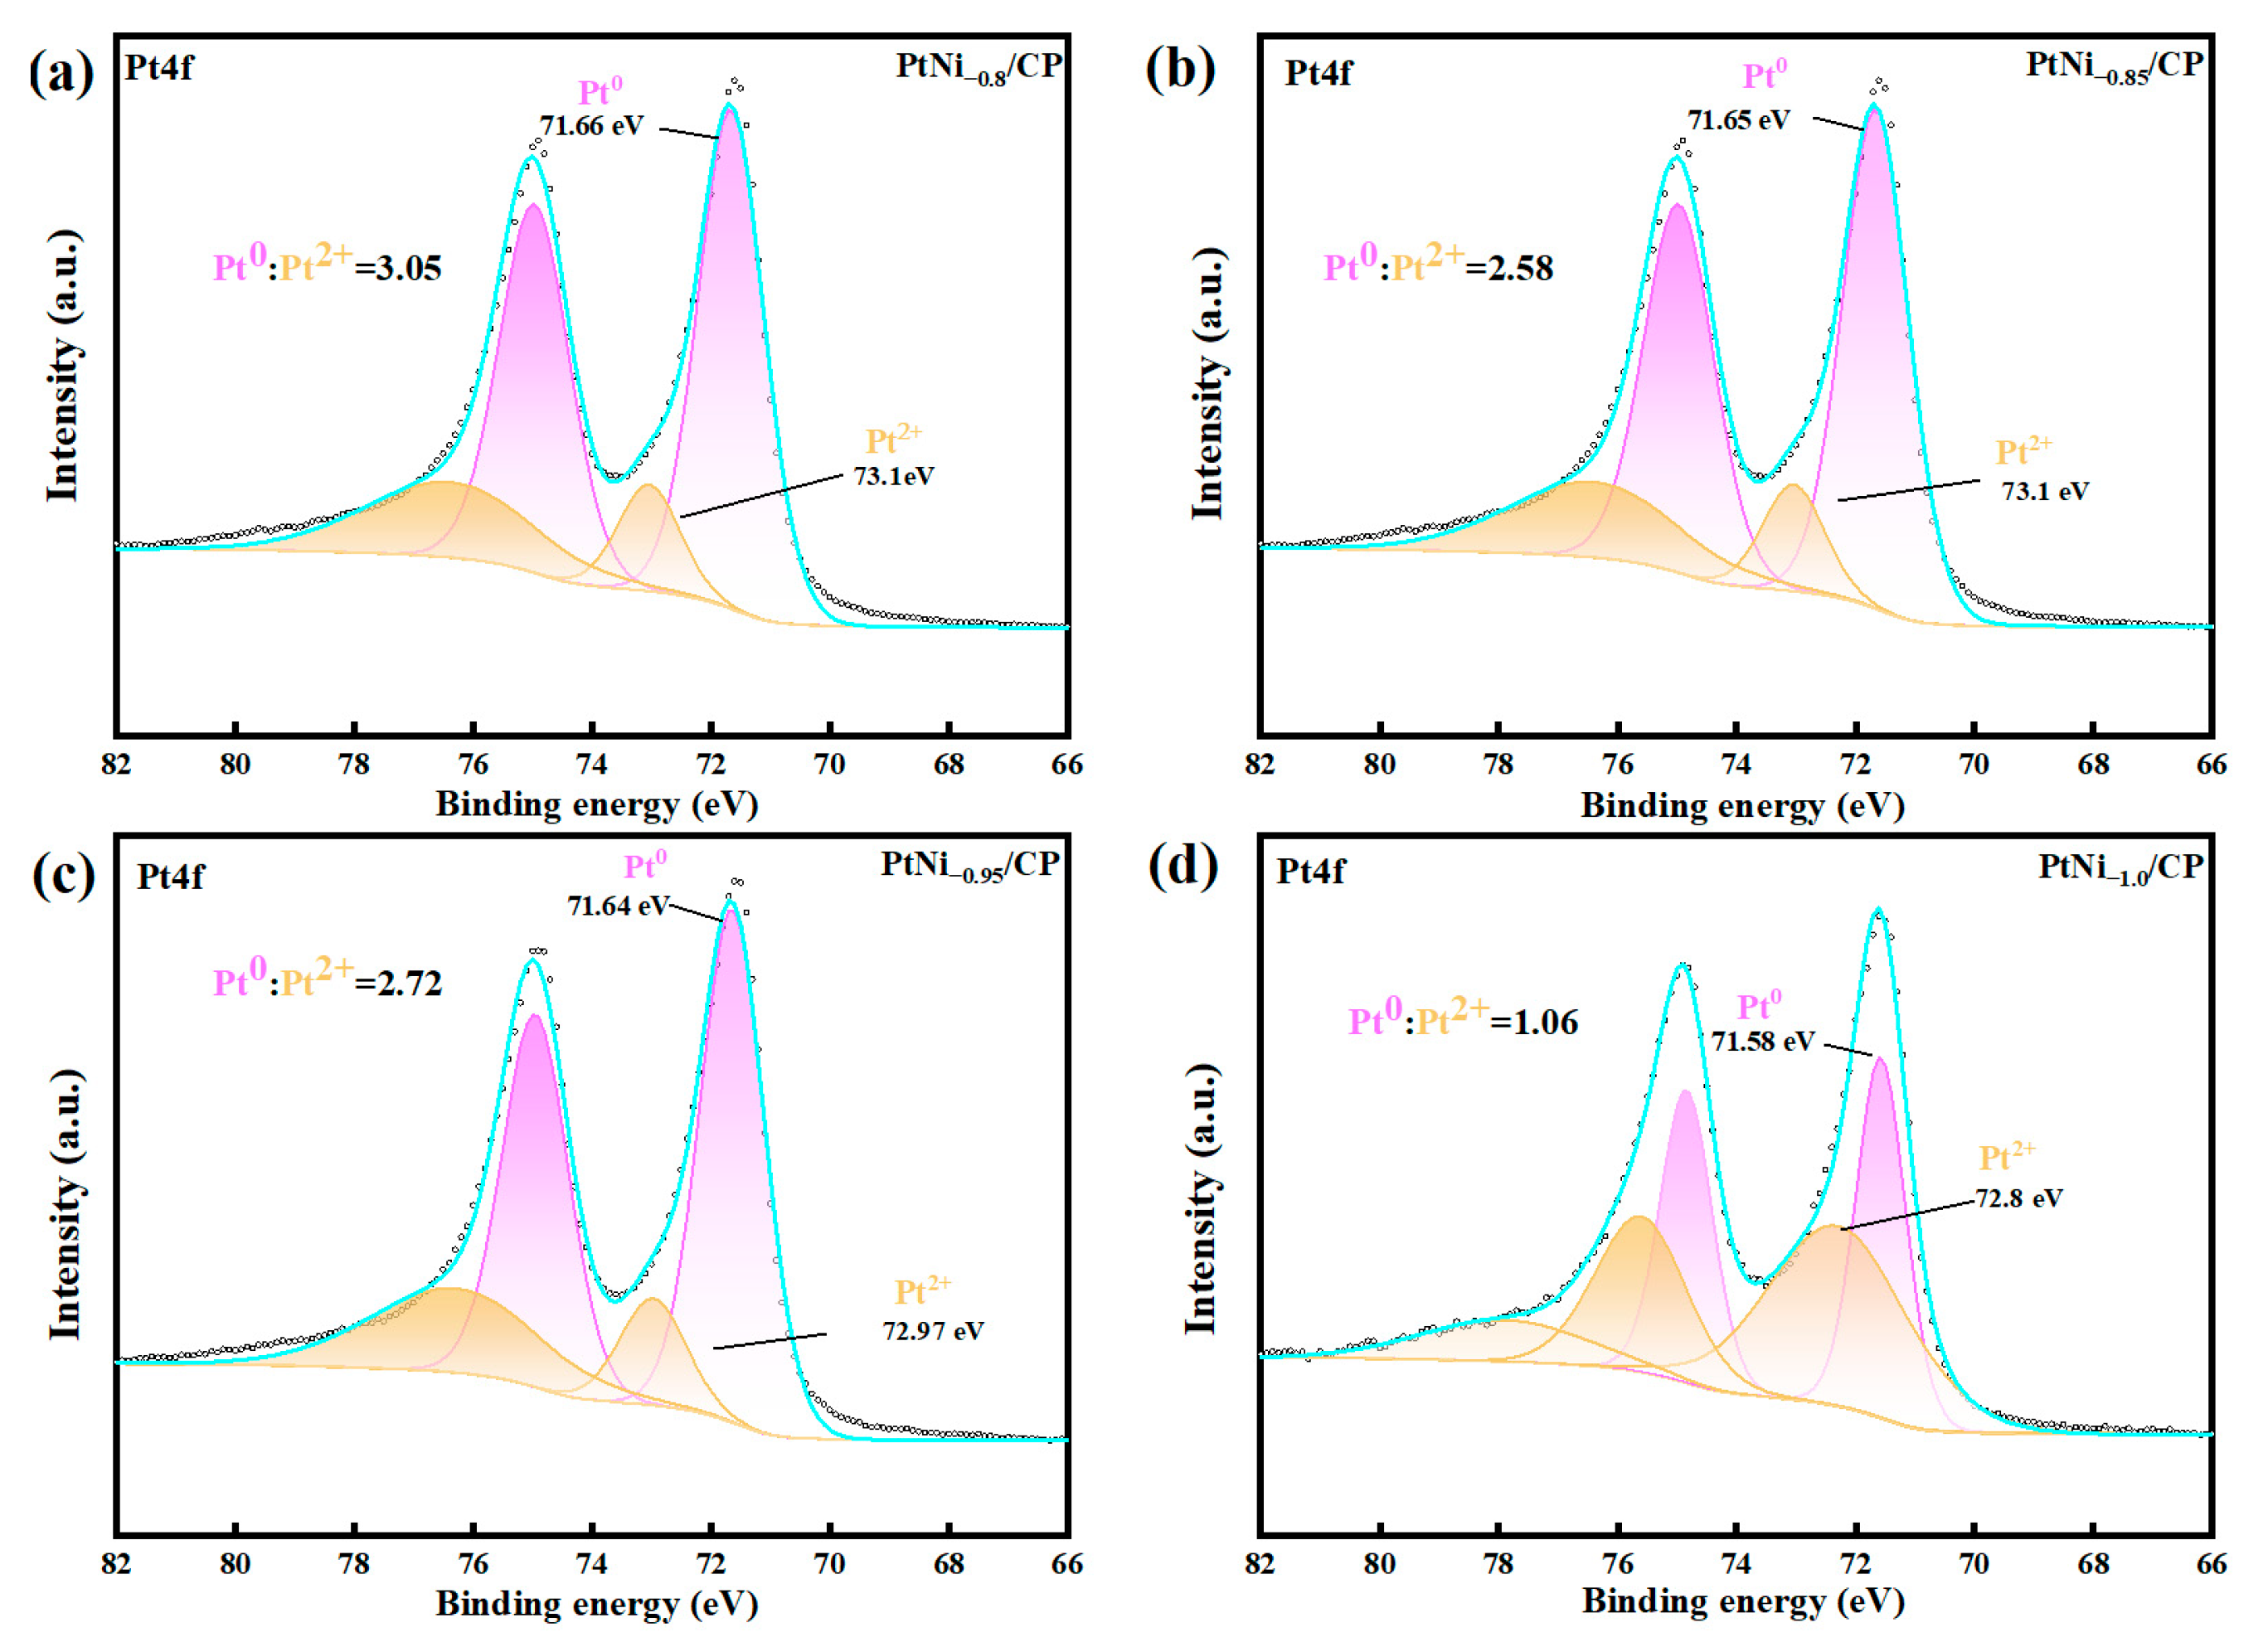
To investigate the surface elemental composition and verify the purity of the catalysts prepared at various deposition potentials, X-ray photoelectron spectroscopy (XPS) survey scans were performed, as shown in Figure S2. These spectra clearly illustrate the coexistence of the Pt, Ni, C, O, and F elements. The prominent C 1s and F 1s peaks originate from the carbon paper substrate and the polytetrafluoroethylene (PTFE) emulsion utilized for the hydrophobic treatment of the microporous layer, respectively. Furthermore, the weak O 1s signal can be ascribed to surface oxidation or adsorbed oxygen species. To further elucidate the influence of deposition potential on the surface valence states of the carbon paper-supported PtNi catalysts, high-resolution XPS spectra of the Pt 4f orbitals were acquired for the four different catalysts, as presented in Figure 4. Notably, no discernible signal was detected in the Ni 2p region. When considered alongside the XRD results, this absence suggests the formation of a dense Pt-rich skin or a core–shell architecture, which effectively screens the photoelectron signal from the underlying Ni species. The electronic structure evolution of the PtNi nanoalloys was evaluated by analyzing the binding energy shifts. The Pt 4f spectra for all samples exhibit a doublet consisting of Pt 4f7/2 (ranging from 70.80 to 73.67 eV) and Pt 4f5/2 (ranging from 74.20 to 77.18 eV). The Pt4f spectra were deconvoluted, and the resulting peaks were marked in purple and yellow, corresponding to Pt0, Pt2+. The peaks located at approximately 71.66 eV (Pt 4f7/2) and 74.98 eV (Pt 4f5/2) are assigned to Pt0, while the contributions at 72.85 eV and 76.38 eV correspond to Pt2+ [28]. Relative to the standard binding energy of Pt0 (71.20 eV), the Pt 4f7/2 peaks for all samples exhibited a distinct positive shift toward higher binding energies. Furthermore, a decrease in the binding energy of the Pt 4f region was observed as the deposition potential shifted negatively. According to the d-band center theory, this shift likely induces a higher electron occupancy of the antibonding states, thereby weakening the Pt-O binding strength. Consequently, the desorption of oxygenated intermediates is facilitated, accelerating the regeneration of active sites and enhancing the overall reaction kinetics.
Quantitative analysis based on the integration of Pt 4f peak areas revealed that the atomic ratios of Pt0 to Pt2+ for the catalysts prepared at different deposition potentials were 3.05, 2.58, 2.72, and 1.06, respectively. Notably, although the PtNi−0.8/CP sample exhibited the highest Pt0: Pt2+ ratio (3.05), its ORR performance was inferior to that of the PtNi−0.95/CP sample (ratio of 2.72). This finding suggests that the catalytic activity is not solely governed by the absolute abundance of metallic Pt0, but rather depends on achieving an optimal balance between metallic and oxidized species. According to the d-band center theory, this optimized surface electronic structure facilitates a downshift of the Pt d-band center, thereby modulating the binding energy of oxygenated intermediates (*O, *OH) [29,30]. Conversely, the suppressed performance observed in the sample prepared at −1.0 ~−0.4 V (ratio of 1.06) can be ascribed to an excessive proportion of oxidized species, which likely compromised electrical conductivity and blocked active sites. In summary, precise regulation of the deposition potential allows for the optimization of the surface Pt valence distribution, thereby leveraging the synergistic effect between Pt2+ and Pt0 to achieve superior electrochemical performance.
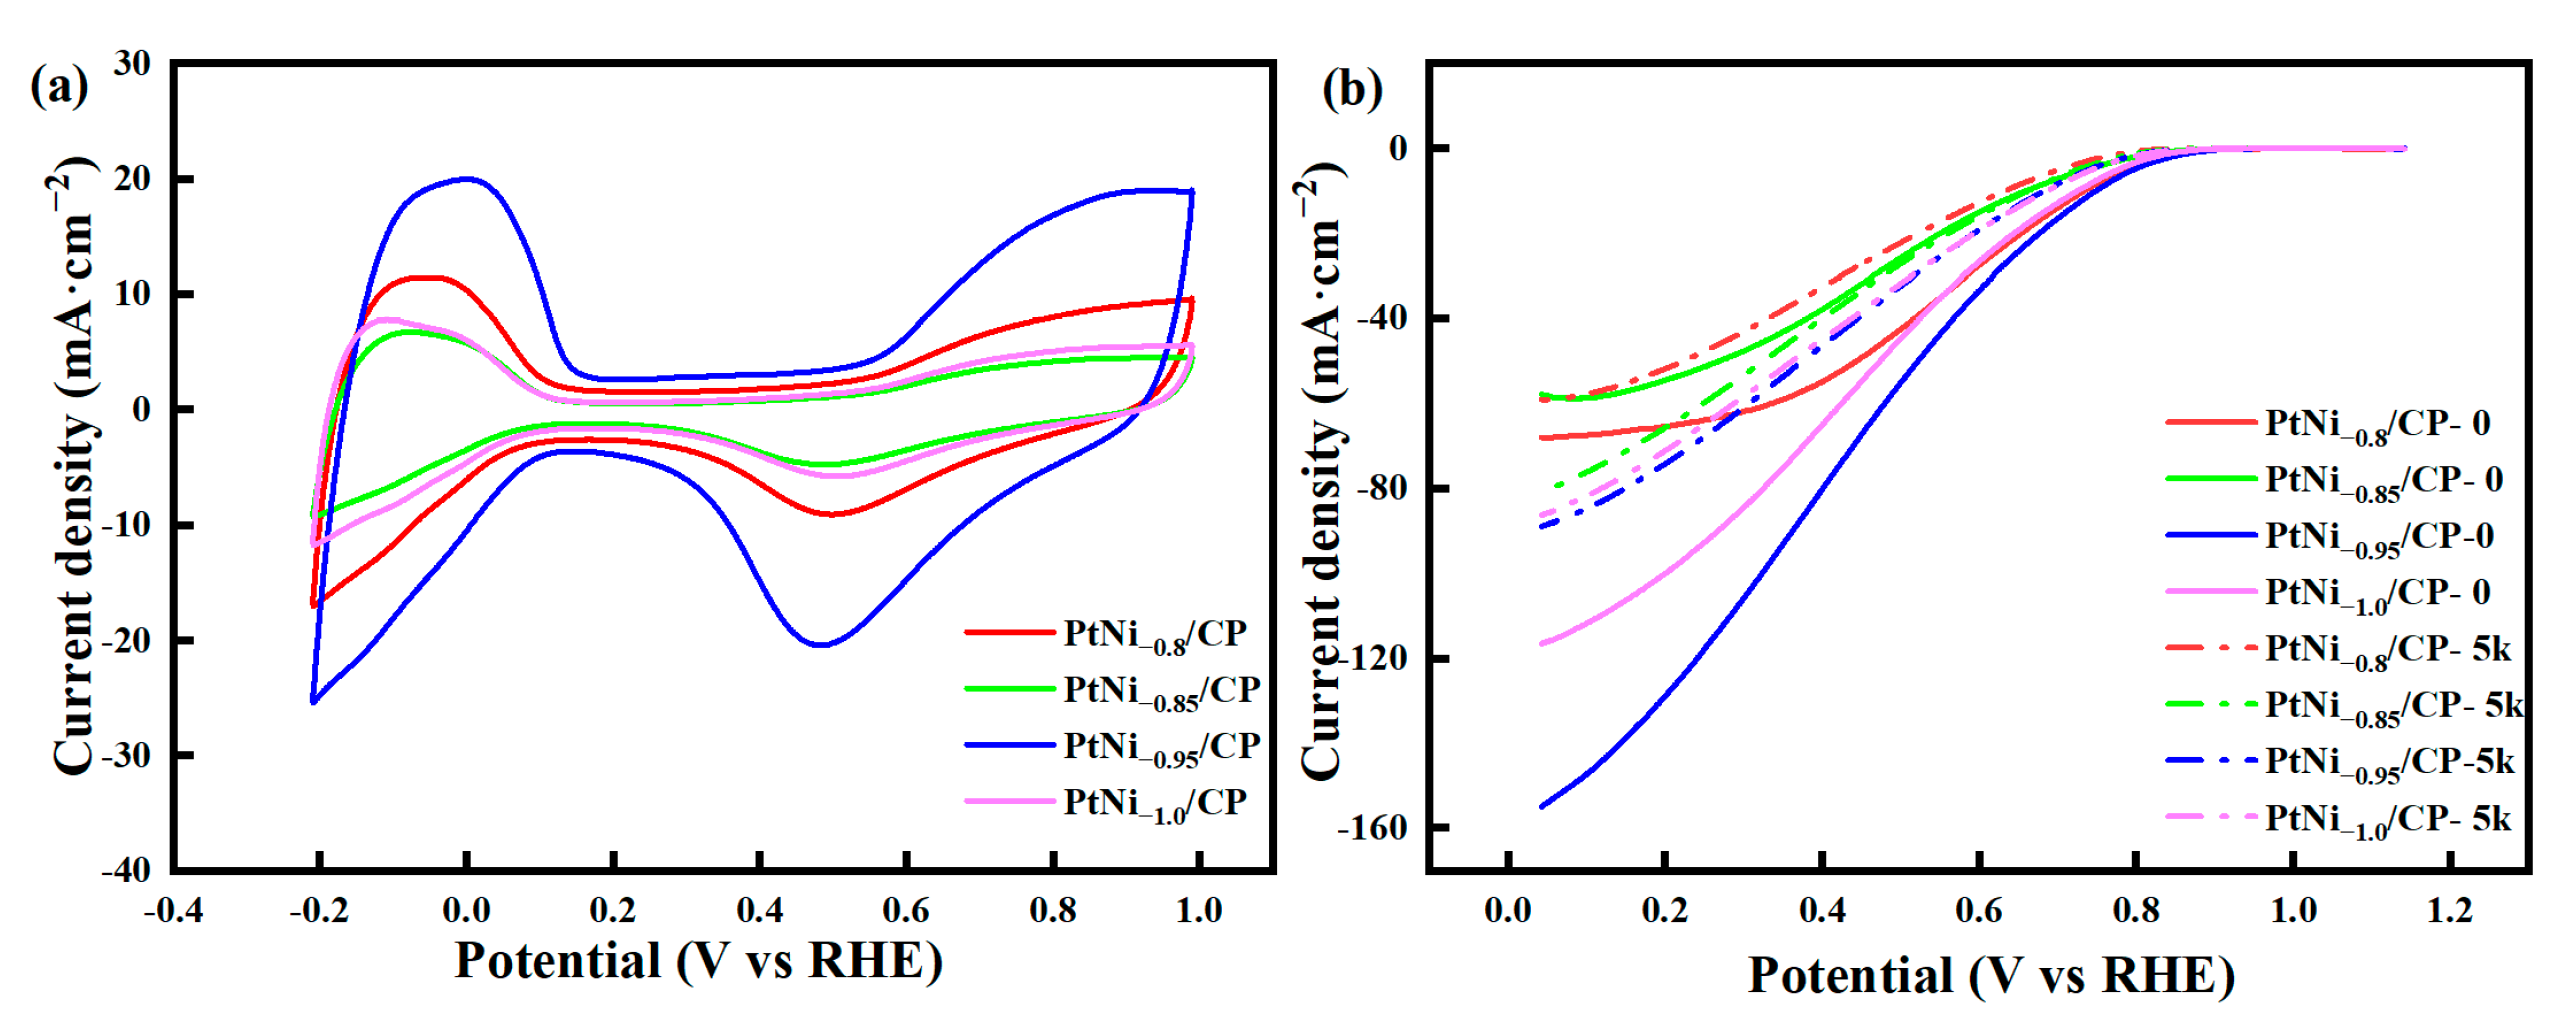
In order to evaluate the ORR activity of the catalyst electrodes, a series of CV and LSV tests were conducted in 0.5 M H2SO4 solutions saturated with Ar and O2 gases, respectively. Figure 5a presents the CV curves for the PtNi−0.8/CP, PtNi −0.85/CP, PtNi −0.95/CP, and PtNi−1.0/CP catalysts. Distinct hydrogen adsorption/desorption peaks are observed for all electrodes within the potential window of −0.2 to 0.1 V (vs. RHE) [31]. Based on the integration of these peaks, the calculated electrochemical active surface areas (ECSA) for the four catalysts are50.23, 35.89, 64.76, and 42.29 m2·gPt−1, respectively. Figure 5b illustrates the linear sweep voltammetry (LSV) curves (solid lines). The onset potential (Eonset) was defined as the potential corresponding to a current density of −0.1 mA·cm−2. The determined Eonset values for the PtNi−0.8/CP, PtNi−0.85/CP, PtNi−0.95/CP, and PtNi−1.0/CP electrodes are 0.88, 0.89, 0.92, and 0.90 V, respectively. A more positive onset potential signifies a reduced reaction overpotential, indicating superior intrinsic activity and high electron transfer efficiency, which facilitates the 4-electron pathway for the ORR. A comprehensive analysis of the ECSA and Eonset data reveals that the PtNi−0.95/CP sample simultaneously possesses the highest density of active sites and the most positive onset potential, preliminarily indicating superior electrochemical performance. To further investigate the reaction kinetics, Tafel plots were constructed by plotting the logarithm of the current density against the overpotential. These plots elucidate the relationship between the reaction rate and the electrode potential. Generally, a smaller Tafel slope implies a rapid increase in current density with overpotential, indicative of faster charge transfer kinetics and superior kinetic efficiency during the ORR. The calculated Tafel slopes for PtNi−0.8/CP, PtNi−0.85/CP, PtNi−0.95/CP, and PtNi−1.0/CP are 60.91, 56.80, 54.90, and 61.15 mV·dec−1, respectively. Although both the PtNi−0.85/CP and PtNi−0.95/CP samples exhibit low Tafel slopes, the PtNi−0.95/CP catalyst is superior due to its combination of a higher onset potential and a low Tafel slope, demonstrating the most efficient ORR kinetics among the series.
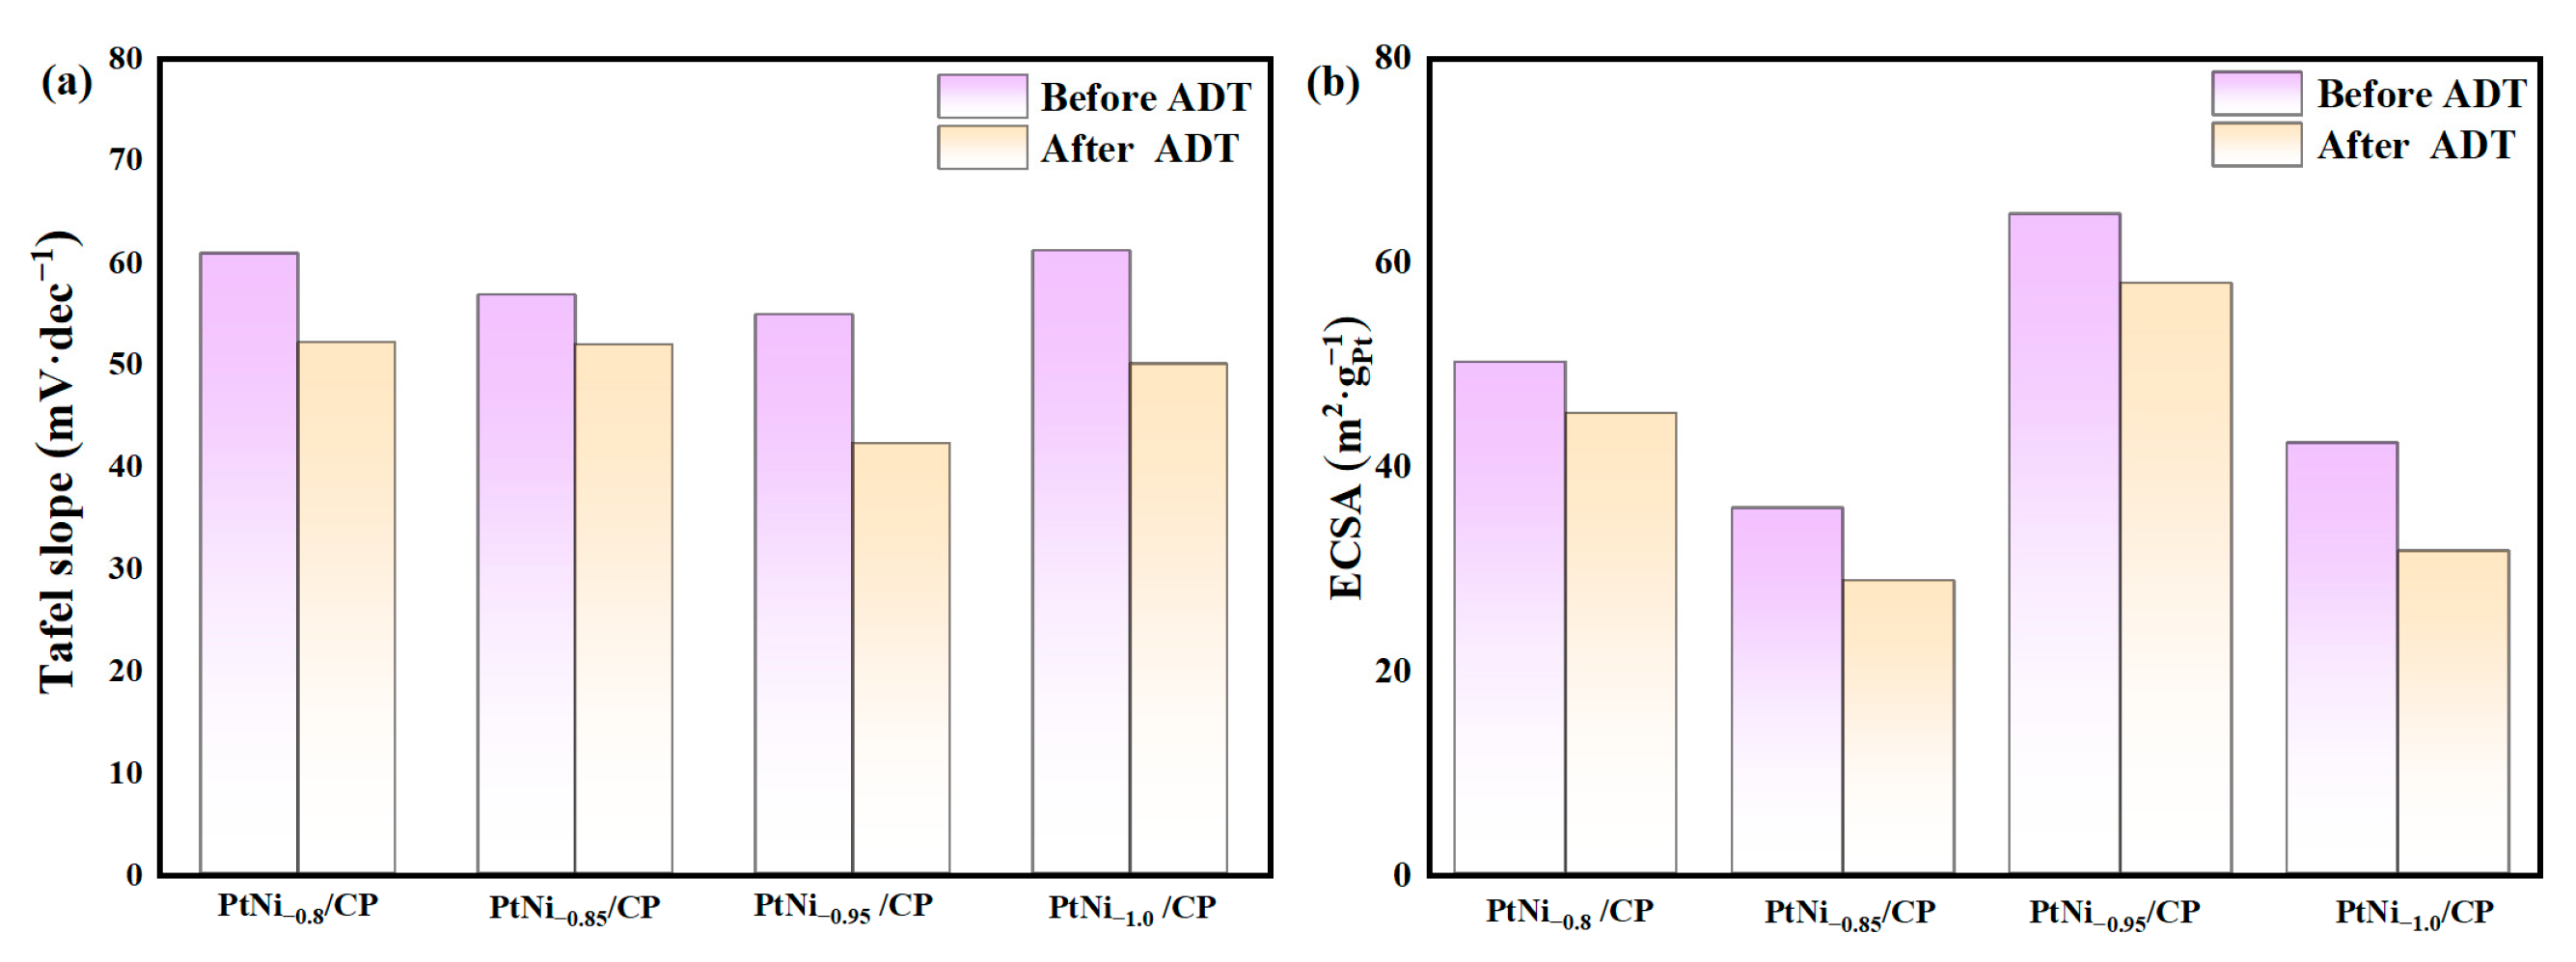
The durability of ORR catalysts is a critical parameter for assessing the practical viability of fuel cells. To evaluate this, accelerated durability tests (ADTs) were conducted by subjecting the four catalysts to 5000 potential cycles in an O2 saturated 0.5 M H2SO4 solution at a scan rate of 100 mV·s−1. As depicted by the dashed curves in Figure 5b, after 5000 cycles, the Eonset for PtNi−0.8/CP, PtNi−0.85/CP, PtNi−0.95/CP, and PtNi−1.0/CP degraded to 0.84 V, 0.85 V, 0.87 V, and 0.86 V, respectively. Figure 6 illustrates the ECSA and Tafel slopes before and after the ADT. Following the 5000-cycle test, the Tafel slopes were determined to be 52.13, 51.89, 42.23, and 50.04 mV·dec−1, respectively. It is observed that while the ECSA and Eonset of all catalyst electrodes exhibited varying degrees of degradation, the Tafel slopes paradoxically decreased post-ADT. This anomalous phenomenon is attributed to the dynamic surface reconstruction induced during the accelerated aging process [32]. Under potential cycling in an acidic environment, thermodynamically unstable surface Ni atoms undergo selective dissolution (dealloying). This process drives the rearrangement of surface Pt atoms, leading to the formation of a Pt-rich skin structure characterized by compressive strain. As elucidated by Stamenkovic et al. [29], this unique alloy structure effectively modulates the d-band center of surface Pt via both ligand and strain effects. Consequently, this weakens the excessively strong binding energy of oxygenated intermediates (e.g., OH*), thereby lowering the reaction energy barrier and optimizing the ORR kinetics. Therefore, despite the reduction in total ECSA caused by particle agglomeration during aging, the intrinsic activity of the surviving active sites is enhanced due to this electronic structure optimization, ultimately manifesting as a reduction in the Tafel slope.

2.2. Physical Characterization and Half-Cell Performance Testing of Ni Under Different Duty Cycles

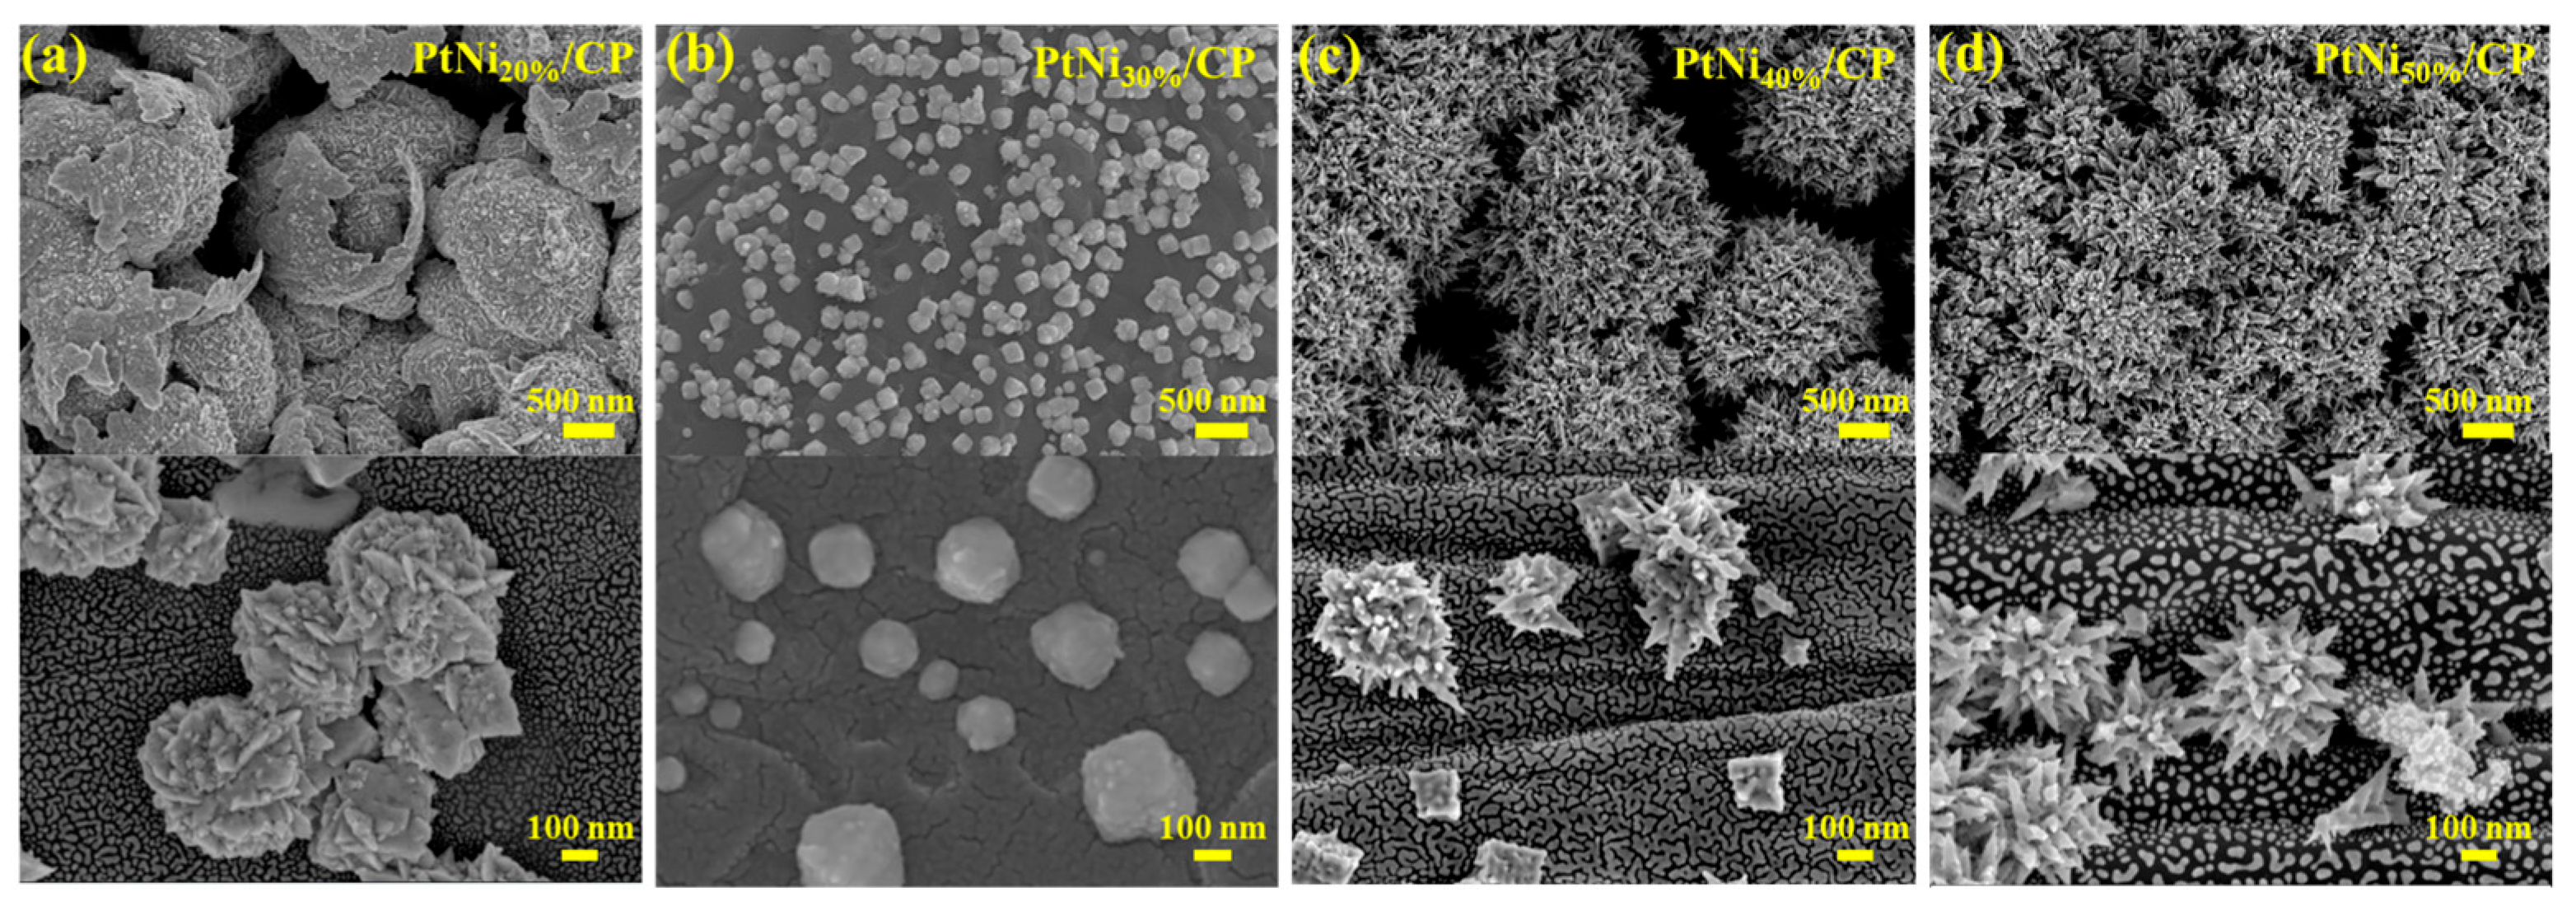
Subsequently, the effects of duty cycles on the morphology and activity were investigated. Figure 7 presents SEM images of carbon paper treated under different Ni deposition duty cycles. At a low duty cycle of 20%, the catalyst surface is covered by a uniform and continuous layer of dense clusters (Figure 7a), suggesting that a low duty cycle facilitates high-density instantaneous nucleation [33]. Upon increasing the duty cycle to 30% (Figure 7b), the surface morphology transitions into well-defined and regular nanocubes. This morphological evolution is attributed to facet-selective growth; specifically, an optimal on/off time ratio (ton/toff) promotes the thermodynamic stability and epitaxial growth of the Pt crystal planes [34]. However, as the duty cycle is further increased to 40% and 50% (Figure 7c,d), the particles undergo significant coarsening and agglomeration, gradually evolving into large island-like clusters and irregular aggregates. This structural deterioration occurs because the shortened off-time results in insufficient mass transport replenishment (i.e., incomplete relaxation of the diffusion layer). This transport limitation triggers localized preferential growth and severe agglomeration on the surfaces of pre-existing nuclei. Consequently, by modulating the duty cycle, the microstructural architecture of the catalysts can be systematically tailored, demonstrating a clear evolutionary pathway: from dense clusters to small discrete particles, subsequently to a loose mixture of clusters and small particles, and ultimately to entirely loose agglomerates.
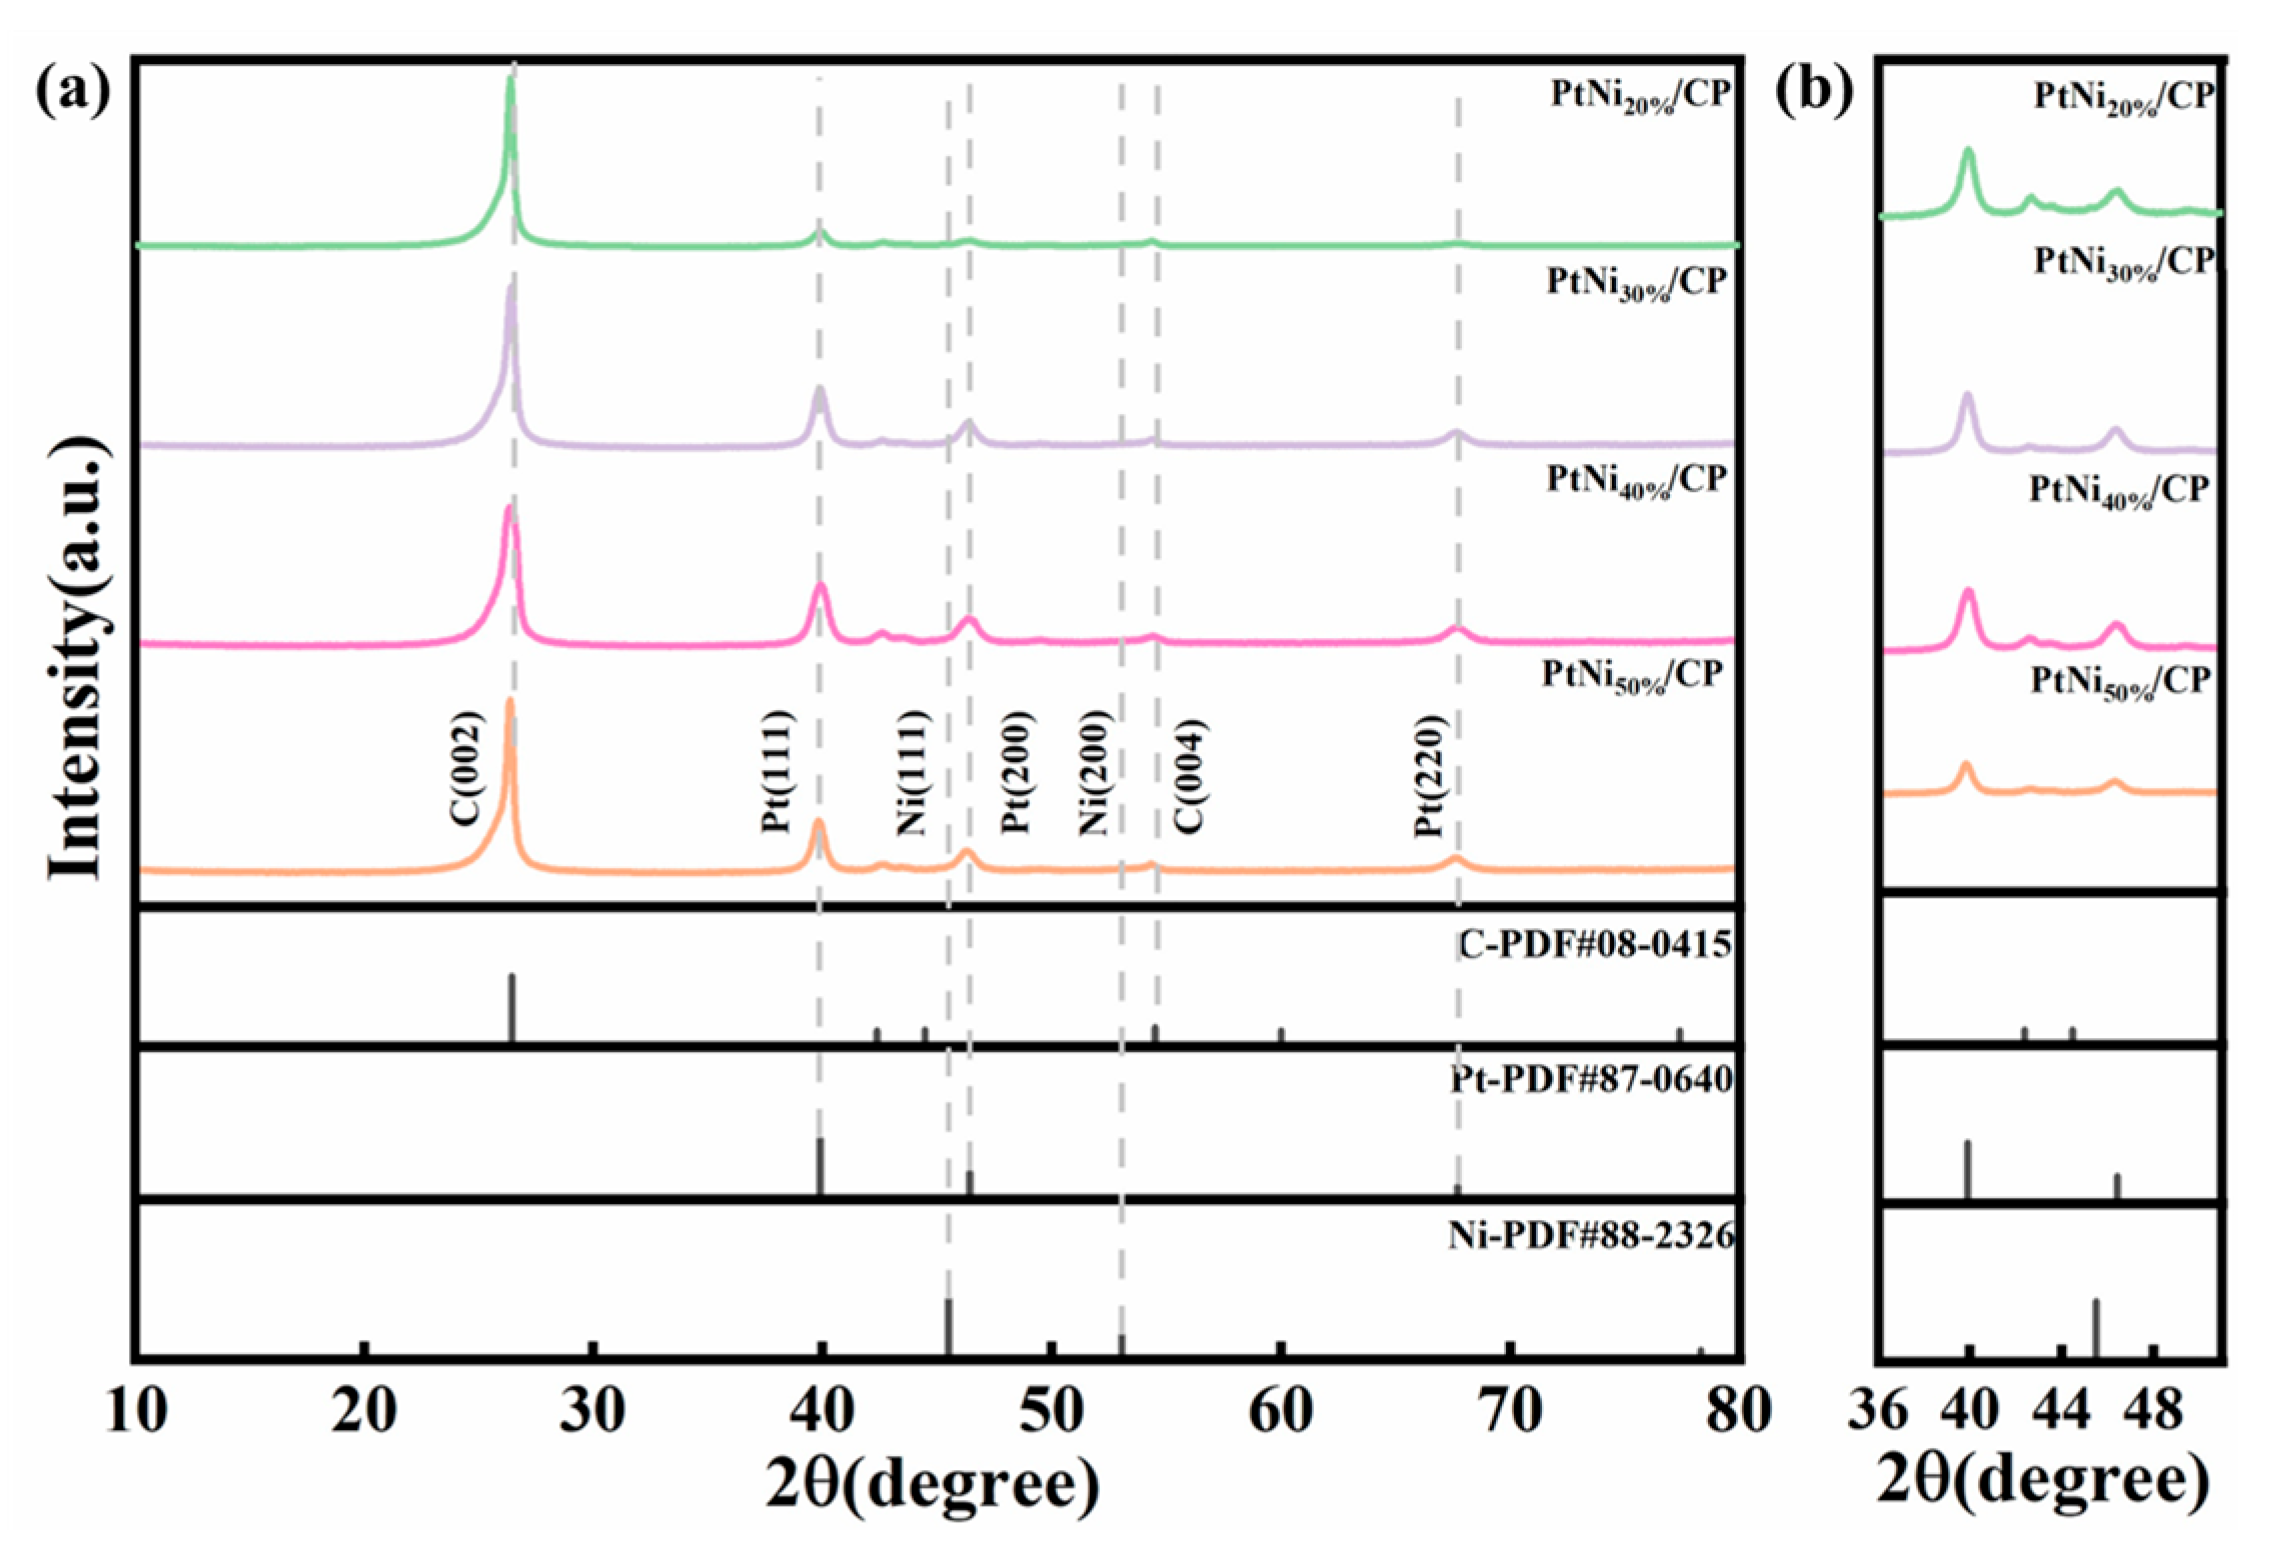
To further elucidate the impact of the duty cycle on the crystalline structure, the phases associated with Pt, Ni, and C in the catalysts prepared at various duty cycles were analyzed by XRD, as presented in Figure 8. All samples exhibited similar crystallographic characteristics. Prominent diffraction peaks observed near 2θ values of 39.8°, 47.9° and 67.5° are indexed to the (111), (200), and (220) planes of face-centered cubic (fcc) Pt, respectively. Consistent with prior observations, no diffraction peaks ascribable to crystalline Ni species were detected. Notably, relative to the standard patterns of pure Pt, the diffraction peaks for all PtNi catalysts exhibited a distinct positive shift toward higher 2θ angles. This shift shows a reduction in the interplanar spacing and a consequent lattice contraction, confirming the successful incorporation of Ni atoms into the Pt lattice to form an alloyed structure. Furthermore, as the duty cycle increased beyond the optimal value, the intensity of the Pt (111) peak gradually diminished. However, the PtNi30%/CP sample exhibited the sharpest and most intense diffraction peaks, suggesting that this specific duty cycle promotes superior crystallinity [35]. High crystallinity is conducive to enhancing both the structural stability and the electron transport rate of the catalyst. The average coherent domain sizes for the catalysts prepared under different duty cycles were calculated and presented in Table 2. The Pt crystallite sizes of the four catalysts are 11.11, 11.13, 11.31, and 15.69 nm. As the duty cycle increases, the Pt crystallite size progressively enlarges, reaching a maximum at a duty cycle of 50%. This structural coarsening indicates that the shortened off-time provides insufficient time for the mass transport relaxation of the electrolyte near the electrode, ultimately leading to severe particle agglomeration.
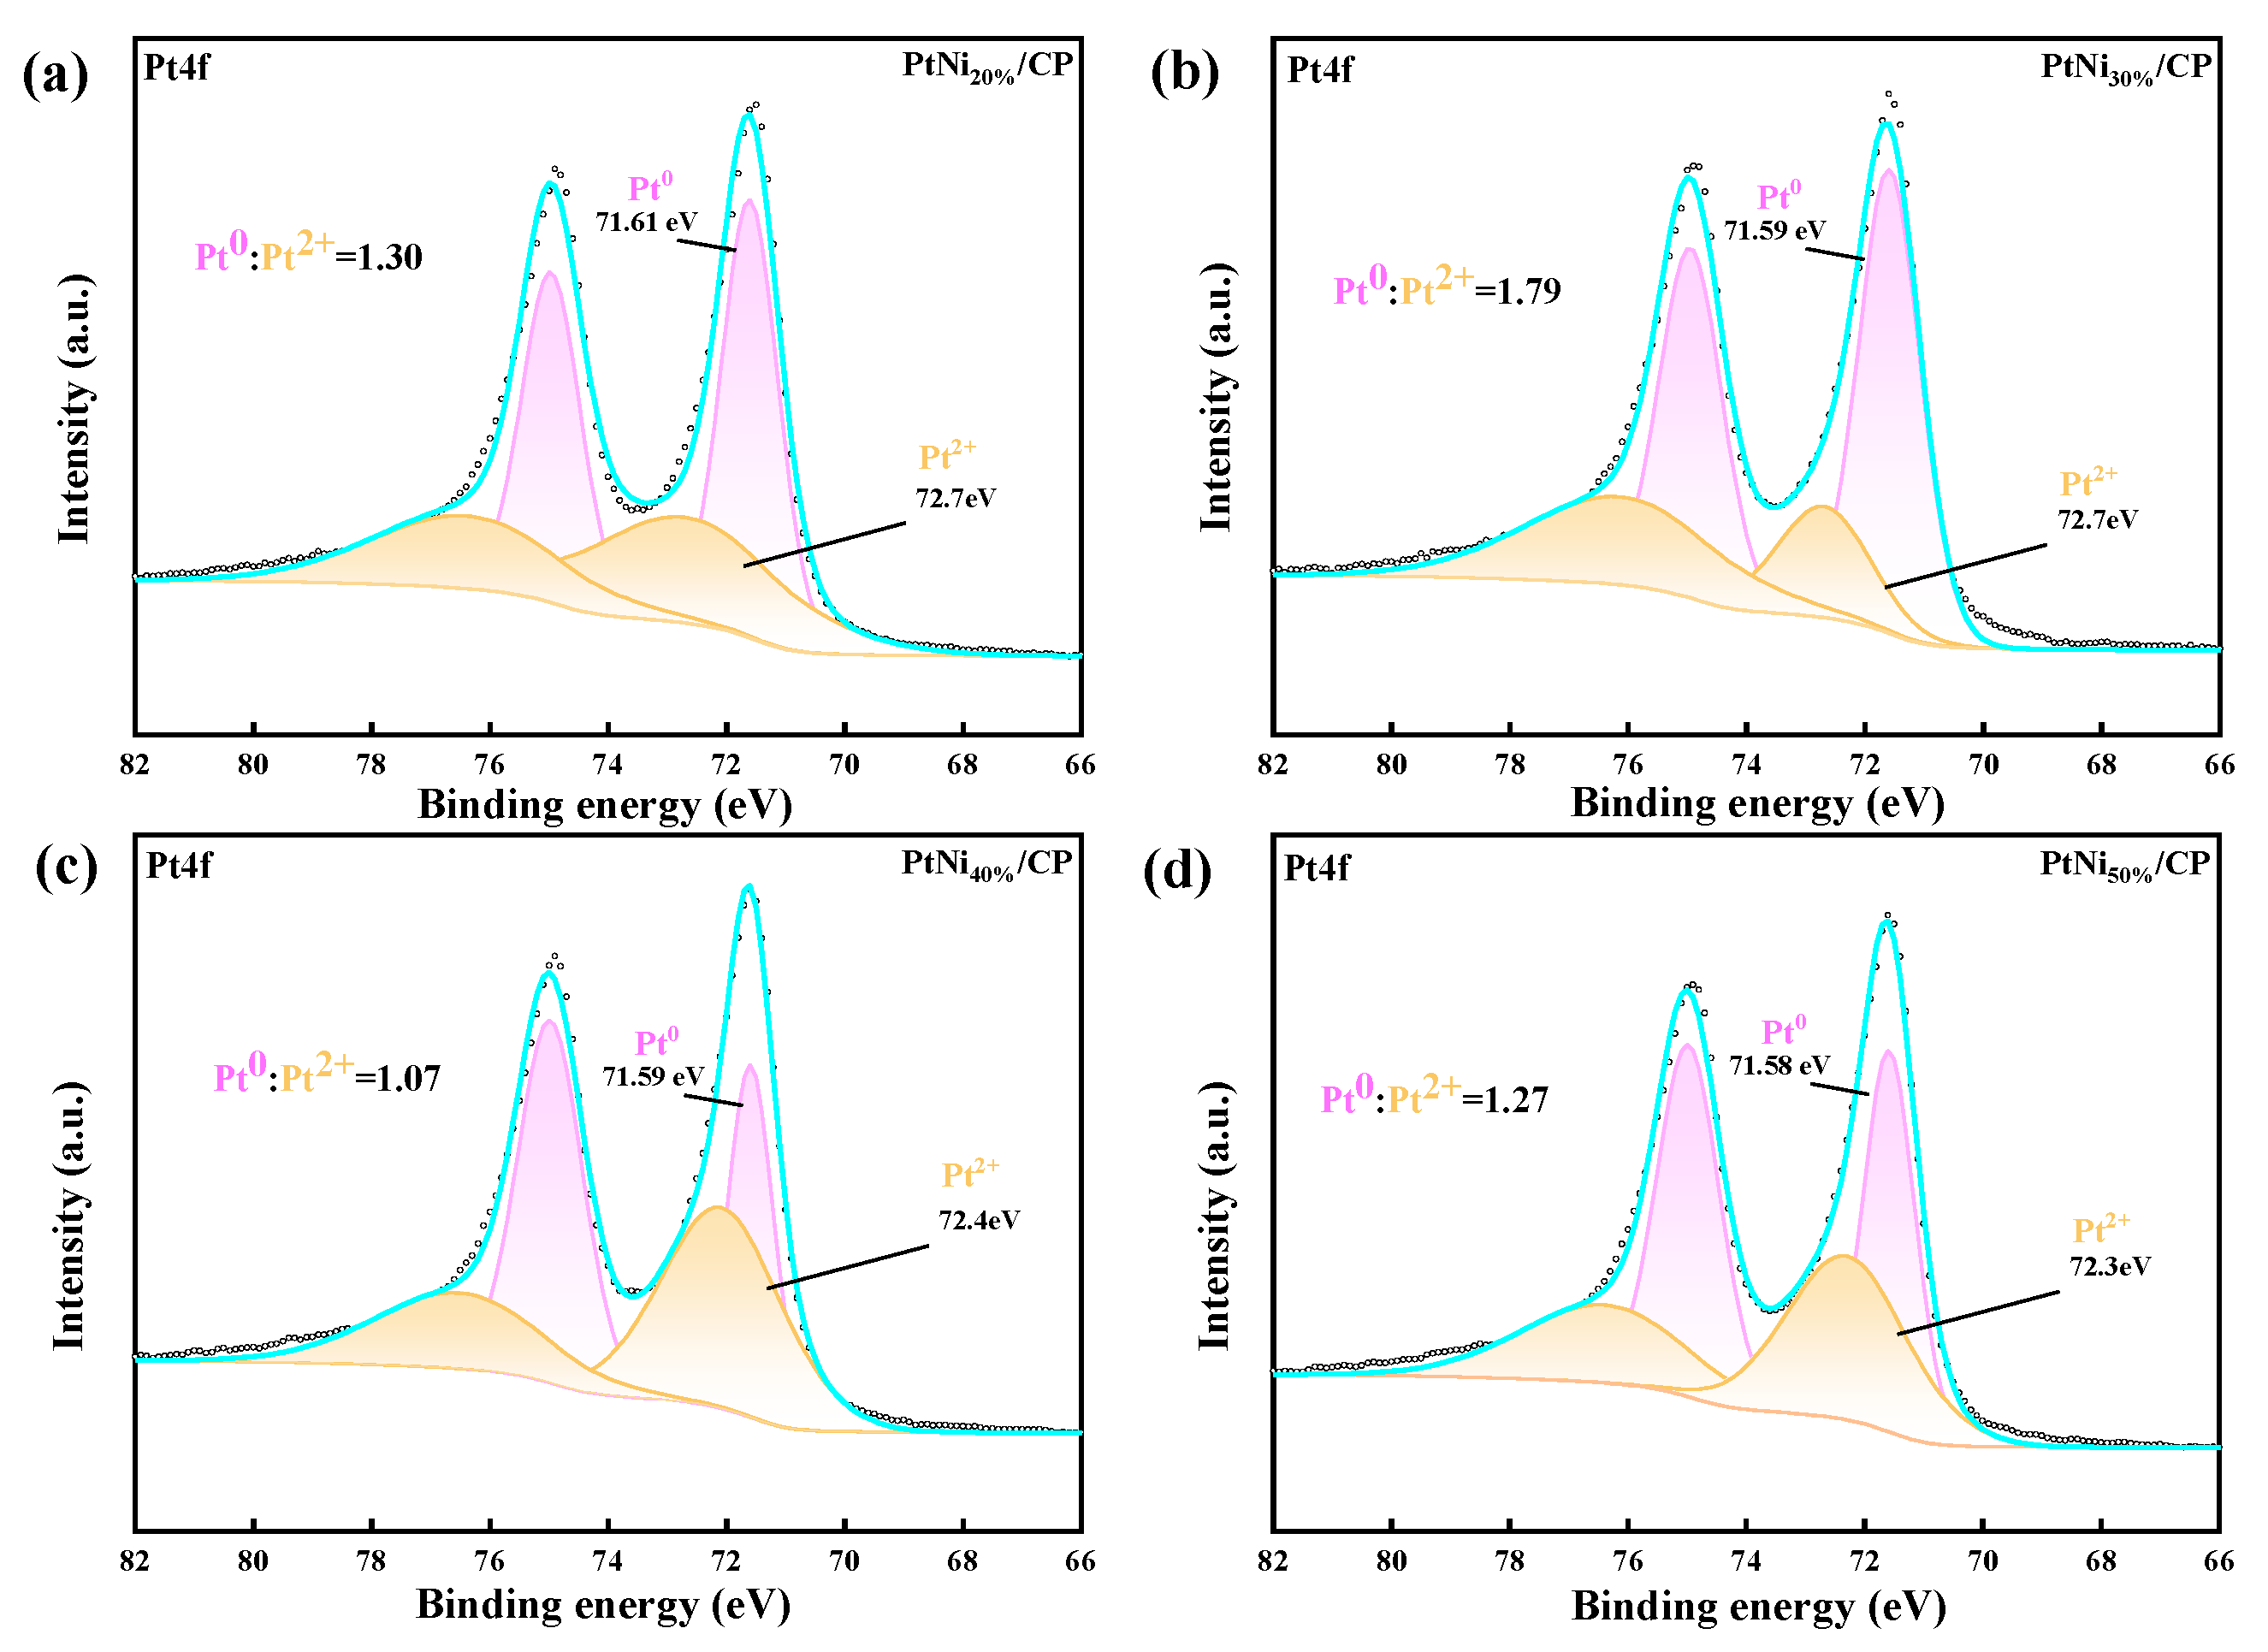
Similarly, the overall elemental composition of the catalyst electrodes prepared under different duty cycles was confirmed by their corresponding XPS survey spectra (Figure S3). Consistent with the potential-dependent series, all samples exhibit stable signals of Pt, Ni, C, O, and F without any noticeable impurity peaks, further confirming the reliability and cleanliness of the pulse electrodeposition process. To investigate in detail how the duty cycle influences the surface valence states, high-resolution XPS characterization was performed, as presented in Figure 9. Consistent with prior observations, no discernible peaks were detected in the Ni 2p region, implying a Pt-rich surface. All spectra exhibit the characteristic spin-orbit doublet. The primary peaks for the investigated series are located in the Pt 4f7/2 (ranging from 69.89 to 73.67 eV) and Pt 4f5/2 (ranging from 73.32 to 76.95 eV) regions. Through deconvolution, the peaks centered at approximately 71.59 eV (Pt 4f 7/2) and 74.98 eV (Pt 4f5/2) are assigned to metallic platinum (Pt0), while the additional peaks at 72.7 eV and 76.40 eV correspond to divalent oxidized platinum (Pt2+). Relative to the standard binding energy of Pt0 (71.20 eV), the Pt 4f7/2 peaks for all samples exhibited a significant positive shift toward higher binding energies. This shift is attributed to the strong electronic interaction (ligand effect) between Pt and Ni atoms, providing robust evidence for the successful formation of a PtNi alloy structure. Furthermore, a decrease in the binding energy of the Pt 4f region was observed as the duty cycle increased. This electronic modification weakens the adsorption strength of oxygenated species, thereby facilitating the desorption of reaction intermediates and accelerating the regeneration of active sites.
Quantitative analysis based on the integration of Pt 4f peak areas revealed that the atomic ratios of Pt0 to Pt2+ for the catalysts prepared at different duty cycles were 1.3, 1.79, 1.07, and 1.27, respectively. Notably, the optimal duty cycle of 30% effectively mitigated the excessive oxidation of surface Pt atoms, yielding the highest Pt0/Pt2+ ratio. A higher Pt0/Pt2+ ratio signifies an abundance of active sites for O2 adsorption and dissociation, alongside enhanced resistance to surface passivation. Conversely, deviation from this optimal duty cycle resulted in a marked increase in surface oxide content. This excessive oxidation likely occluded active sites and impeded electron transport, thereby limiting the overall catalytic performance.
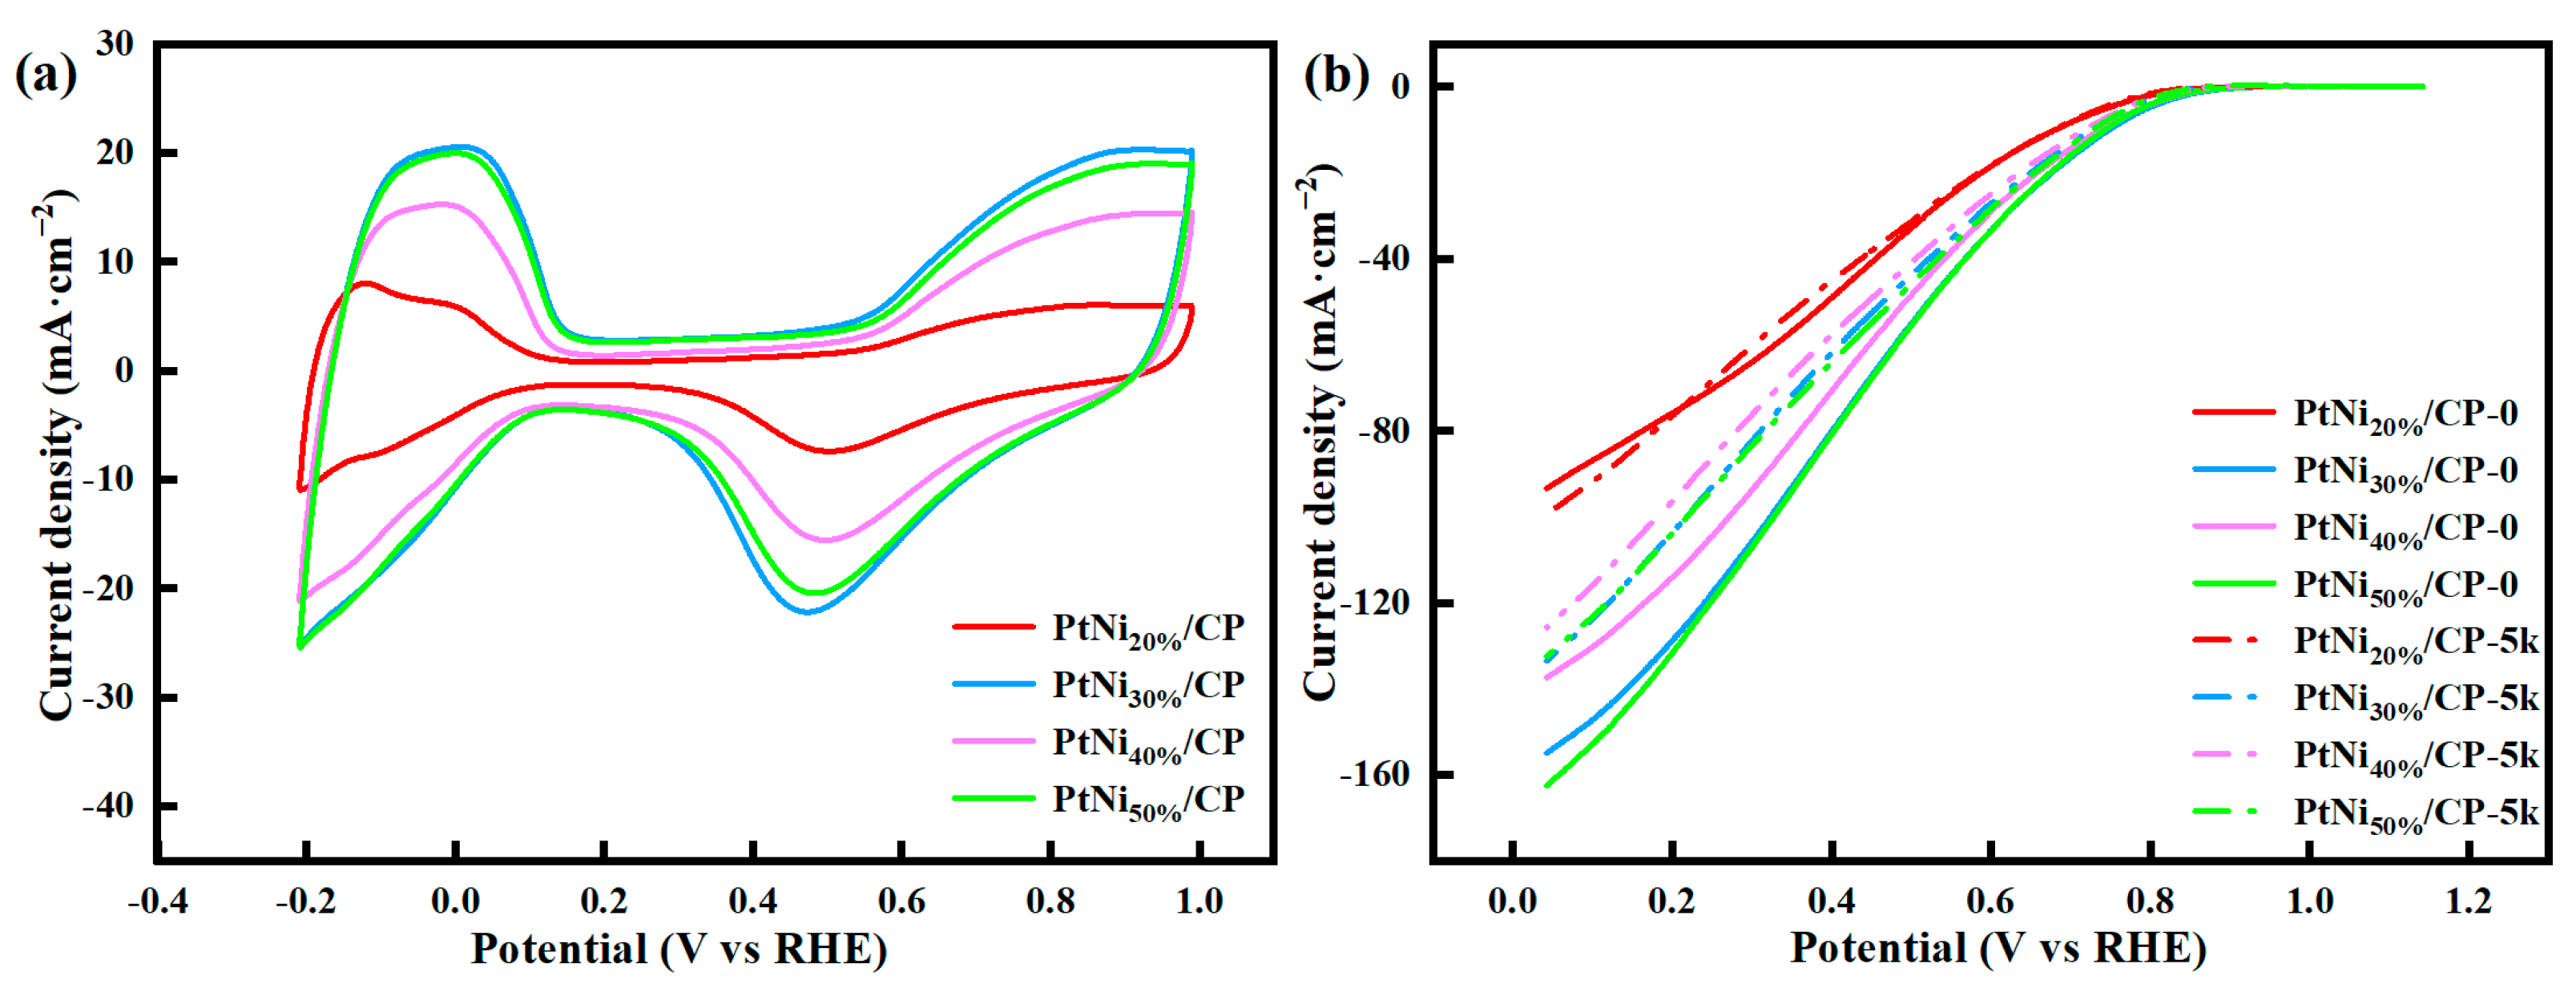
In order to evaluate the ORR activity of the catalyst electrodes, a series of CV and LSV tests were conducted in 0.5 M H2SO4 solutions saturated with Ar and O2 gases, respectively. Figure 10a displays the CV curves for the PtNi catalysts prepared with different duty cycles. Distinct hydrogen adsorption/desorption peaks are observed for all electrodes within the potential window of −0.2 to 0.1 V (vs. RHE). The calculated ECSA values for the PtNi20%/CP, PtNi30%/CP, PtNi40%/CP, and PtNi50%/CP samples are 34.35, 64.76, 45.96, and 63.58 m2·gPt−1, respectively. As the duty cycle increases, the ECSA exhibits a distinct bimodal trend. The initial peak in the ECSA is ascribed to the moderate duty cycle, which facilitates high-density nucleation and leads to the formation of finely dispersed nanoparticles. The second enhancement in the ECSA is likely driven by the selective dissolution of Ni, or an in situ dealloying process, occurring at higher duty cycles. This dynamic structural evolution generates a highly porous, Pt-rich surface architecture, thereby significantly expanding the available active surface area [36]. The solid lines in Figure 10b represents the LSV curves of the four different catalyst electrodes. The onset potential is determined at the current density of −0.1 mA·cm−2, with corresponding values for PtNi20%/CP, PtNi30%/CP, PtNi40%/CP, and PtNi50%/CP being 0.89, 0.92, 0.91 and 0.90 V, respectively. With the increase in duty cycle, the onset potential follows a typical volcano-shaped trend, peaking at the 30% duty cycle. A more positive onset potential signifies superior electron transfer efficiency, facilitating the 4-electron pathway and indicating enhanced ORR activity. Furthermore, the calculated Tafel slopes are 60.25, 54.90, 55.80, and 55.68 mV·dec−1, respectively. A comprehensive analysis of the electrochemical parameters reveals that the catalyst prepared at a 30% duty cycle exhibits the optimal ORR performance, characterized by the highest onset potential and a low Tafel slope. This superior performance is attributed to two synergistic factors: (1) a higher relative content of metallic Pt, which provides abundant active sites for the reaction; and (2) an optimized degree of alloying, which enhances the electron density on the Pt surface. This electronic modification promotes the ORR kinetics by weakening the adsorption strength of oxygenated intermediates.
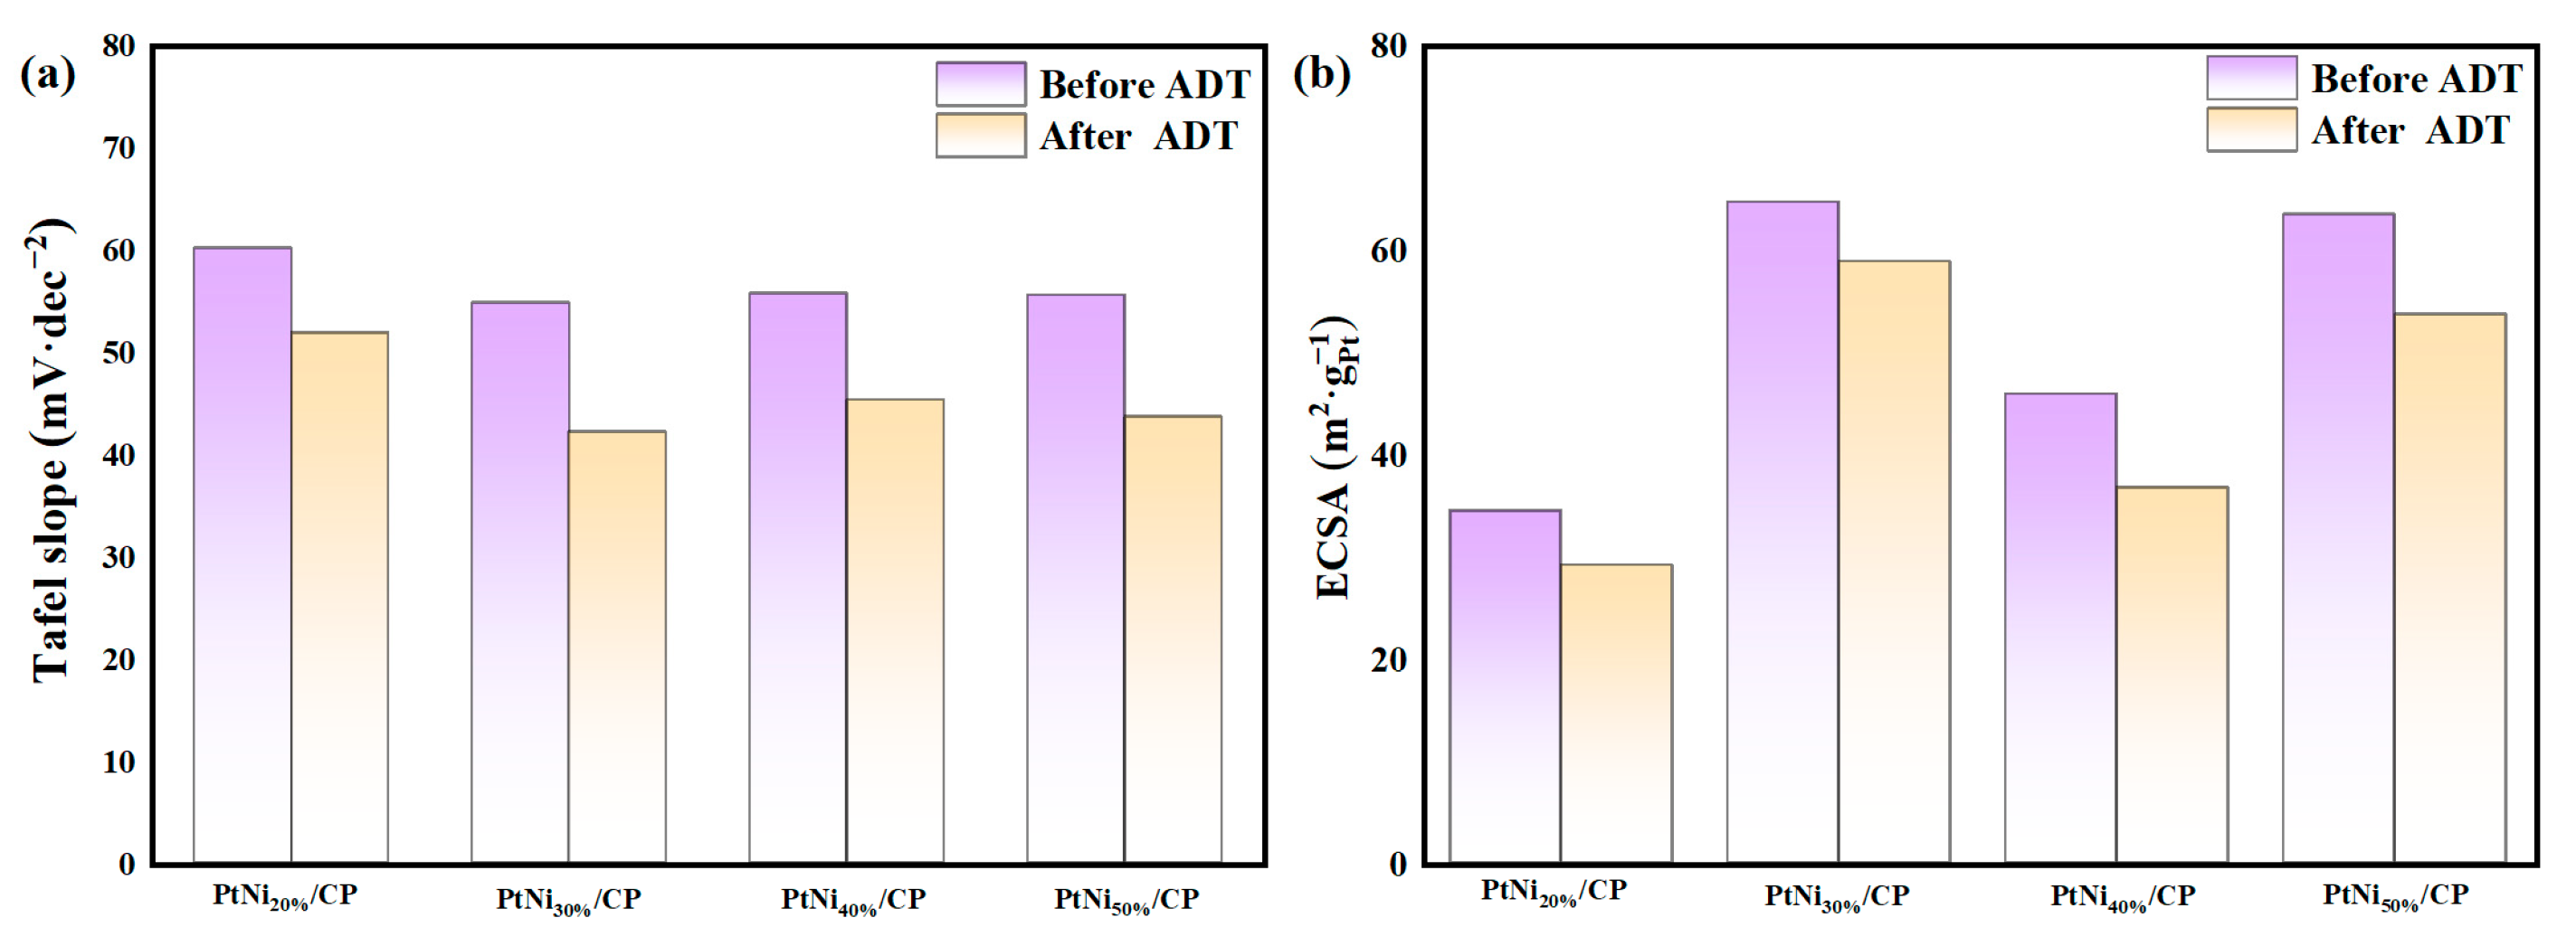
As illustrated by the dashed curves in Figure 10b, after 5000 cycles, the Eonset for the PtNi20%/CP, PtNi30%/CP, PtNi40%/CP, and PtNi50%/CP samples degraded to 0.86 V, 0.87 V, 0.87 V, and 0.86 V, respectively. Figure 11 presents a comparison of the ECSA and Tafel slopes before and after the ADT. Post-ADT, the Tafel slopes were determined to be 51.96, 42.23, 45.41, and 43.75 mV·dec−1, respectively. Notably, the catalyst prepared at a 30% duty cycle demonstrated superior stability, retaining the highest Eonset among the series. Interestingly, all four catalysts exhibited a reduction in Tafel slope following the ADT, implying enhanced reaction kinetics. In conjunction with the XRD and XPS analyses, this phenomenon implies that surface Ni atoms are selectively leached, leaving a Pt-rich skin that shields the underlying Ni. During potential cycling, this Pt-rich surface layer is subjected to compressive lattice strain induced by the subsurface Ni atoms. This strain effect effectively weakens the binding energy of oxygenated intermediates (specifically OH*) [29]. According to classical kinetic theory, this reduction in surface oxide coverage is directly responsible for the observed decrease in the Tafel slope [37].
To further evaluate the ORR performance, we compared our optimized catalyst with recently reported PtNi-based electrocatalysts (Table S1 in the Supplementary Materials). Because our catalyst is directly grown on the carbon paper via pulse electrodeposition, its particle size is relatively larger than that of some powder catalysts synthesized by complex chemical methods. However, this one-step, binder-free 3D electrode design offers significant practical advantages. It completely avoids the use of polymeric binders (such as Nafion) that usually block active sites and increase mass-transfer resistance in traditional powder electrodes. Consequently, despite the larger particle size, our catalyst still delivers a highly competitive onset potential of 0.92 V and a low Tafel slope of 54.9 mV·dec−1, demonstrating excellent apparent catalytic activity and structural stability.

3. Materials and Methods

3.1. Materials and Chemicals

The chemicals used in this study included NaOH (Shanghai Lingfeng Chemical Reagent Co., Shanghai, China), HCl (Shanghai Lingfeng Chemical Reagent Co., Shanghai, China), H3PO4 (Shanghai Lingfeng Chemical Reagent Co., Shanghai, China), KCl (Shanghai Lingfeng Chemical Reagent Co., Shanghai, China), Na2SO4 (Sinopharm Chemical Reagent Co., Ltd., Shanghai, China), Carbon Black (Sinopharm Chemical Reagent Co., Ltd., Shanghai, China), HNO3 (Shanghai Titan Scientific Co., Ltd., Shanghai, China), H2SO4 (Shanghai Titan Scientific Co., Ltd., Shanghai, China), H2PtCl6·6H2O (Shanghai Titan Scientific Co., Ltd., Shanghai, China), and (C2F4)n (Shanghai Boer Chemical Reagent Co., Ltd., Shanghai, China). The carbon paper (CP) used as the original carbon substrate had a thickness of 190 nm (Toray Industries, Inc., Tokyo, Japan). DMF (Shanghai Boer Chemical Reagent Co., Ltd., Shanghai, China) was used in electrodeposition. The water used in this work was deionized to 18 MΩ·cm using a Millipore purification system (Milli-Q, Merck, Burlington, MA, USA). All gases used in the study were of high purity grade (Air Liquid China Holding Co., Ltd., Shanghai, China). All raw materials were used as received without further purification.

3.2. Pre-Treatment of the Carbon Paper Substrate

The carbon paper used for electrodeposition was cut into 1 × 3 cm2 pieces. It was ultrasonically cleaned sequentially in 0.2 M NaOH solution, 0.2 M HCl solution, and deionized water for 3 min each. After sonication, the carbon paper was rinsed with deionized water until neutral and then dried in an oven. The microporous layer (MPL) was fabricated via a three-step procedure. Firstly, a homogeneous MPL ink was prepared by mixing carbon black, isopropanol, deionized water, and a polytetrafluoroethylene emulsion. The mixed solution was ultrasonicated at room temperature for 2 h and then placed on a stirring platform to be stirred for 30 min. Secondly, the pretreated CP was hydrophobized by immersion in a 10 wt% polytetrafluoroethylene emulsion for 10 min, retrieved, and dried at 80 °C. Following drying, the substrate underwent thermal treatment in a muffle furnace at 350 °C for 30 min. Finally, the well-dispersed MPL ink was transferred to an airbrush and uniformly sprayed onto both sides of the hydrophobized CP. The coated assembly was then sintered in a muffle furnace at 350 °C for 30 min under a nitrogen atmosphere to obtain the final MPL-coated gas diffusion layer.

3.3. Preparation of Catalyst Electrodes

Acidification and electrodeposition of the carbon paper were performed in an aqueous solution using a three-electrode electrochemical cell. The CHI660e electrochemical workstation was equipped with a 2 × 2 cm2 platinum foil as the counter electrode (CE), a saturated calomel electrode (SCE) as the reference electrode (RE), and a working electrode (WE). The working electrode consisted of the pre-treated CP, mounted on a platinum electrode clamp wrapped in a PTFE-coated platinum support to ensure electrical connection and uniform charge distribution across the CP during acidification. An area of 1 × 2 cm2 of the CP was immersed in the electrolyte, with excess area masked using polyimide tape. Electrochemical acidification was carried out in a 120 mL three-electrode electrolytic cell containing H3PO4 and HNO3 solution, with a rotational speed of 380 rpm. A constant potential of 1.8 V (vs. SCE) was applied for a duration of 300 s. Upon completion, the CP was retrieved and thoroughly rinsed with deionized water to eliminate any residual acid.
Stepwise electrodeposition of Ni and Pt nanoparticles was performed on the acidified CP substrates via a pulse electrodeposition method. For the deposition of Ni, the aqueous electrolyte contained 0.5 M Na2SO4, 0.5 M H2SO4, 10 mM NiSO4·6H2O and 60 mM N, N-dimethylformamide (DMF); whereas for Pt deposition, the aqueous electrolyte consisted of 0.1 M KCl, 0.5 M H2SO4, 2 mM H2PtCl6·6H2O, and 60 mM DMF. Nano Ni particles were electrodeposited onto the acidified CP substrates for 600 s. Subsequently, pulse electrodeposition of Pt was conducted on the Ni-decorated CP. The working voltage was pulsed between −0.2 V and 0 V (vs. SCE) with pulse durations of 0.2 s and 0.3 s, respectively. The total deposition time was 3000 s with a rotational speed of 380 rpm. After electrodeposition was complete, the CP was taken out and soaked in deionized water for 30 min to remove residual electrolytes from the surface. Finally, the CP was dried at 80 °C for 12 h in an oven to obtain the final catalyst electrodes. Since all samples consist of PtNi bimetallic nanoparticles directly deposited on carbon paper (CP) using a fixed anodic pulse potential of −0.4 V, a concise nomenclature format of “PtNiVariable/CP” is adopted throughout this manuscript to highlight the varied parameters and improve readability. For the series exploring cathodic deposition potentials (prepared at a fixed duty cycle of 30%), the samples are denoted as PtNi−0.80/CP, PtNi−0.85/CP, PtNi−0.95/CP, and PtNi−1.0/CP. For the series investigating pulse duty cycles (prepared at a fixed cathodic potential of −0.95 V), the samples are denoted as PtNi20%/CP, PtNi30%/CP, PtNi40%/CP, and PtNi50%/CP.

3.4. Electrochemical Test

The electrochemical performance of the catalyst electrode was tested using a CHI660e electrochemical workstation (CH Instruments, Shanghai, China). The three-electrode device for performance testing consists of a platinum wire electrode as CE, a saturated calomel electrode as RE, and a catalyst electrode WE clamped by a platinum electrode. The immersion area of the catalyst electrode in the electrolyte was maintained at 1 × 0.5 cm2. The electrolyte is 100 mL of 0.5 M H2SO4 solution, which is installed in the glass electrolytic cell, and the temperature is controlled by the water bath to be 25 °C. Prior to the test, two 100 mL aliquots of 0.5 M H2SO4 solution were purged with Ar and O2 gases for 30 min to yield Ar- and O2-saturated test solutions, respectively. Cyclic voltammetry (CV) is a commonly used method to test the redox performance of the working electrode. The catalyst electrode was activated by immersing it in an Ar saturated solution. In the potential window between 0.03–1.2 V (vs. RHE), the curve became stable after 20 cycles of activation at a scan rate of 100 mV·s−1, and then 3 cycles of complete scanning were performed. The CV curve of the last cycle was used to determine their ECSA by Equation (1). The electrode was then immersed in the O2 saturated test solution to test the current-potential response by linear sweep voltammetry (LSV). The operating potential was 0.6–1.0 V (vs. RHE), and the scanning rate was 100 mV·s−1. The potential corresponding to a current density of −0.1 mA cm−2 was taken as the onset potential (Eonset). The Tafel curve was converted from the LSV curve. The logarithm of the absolute value of the current density (j, mA·cm−2) from the LSV data was taken as the abscissa, and the potential was used as the ordinate to fit the Tafel slope. The catalyst electrode was subjected to accelerated durability testing (ADT) at operating conditions of 0.6–1.0 V (vs. RHE) and a scanning rate of 100 mV·s−1 for 5000 cycles. The CV and LSV curves of every 1000 cycles were measured to evaluate the stability and durability of the catalyst electrode.
E C S A = S H C · V · m P t
SH: area of hydrogen desorption peak, A·V; V: scanning speed, V·s−1; C: 0.21 mC·cm−2; mPt: the loading of Pt on the working electrode, g.
It should be noted that the ORR measurement procedure used here is different from the usual method using a rotating disk electrode (RDE) because the electrocatalyst is directly deposited on the GDL substrate and cannot be directly deposited on the RDE. Therefore, exact quantitative extraction of the kinetic current via the Koutecký–Levich equation and determination of parameters such as the half-wave potential are mathematically not feasible. Nevertheless, the onset potentials and Tafel slopes derived from the kinetic-controlled region provide highly reliable qualitative information to evaluate the kinetic trends between catalysts with different compositions.

3.5. Materials Characterization

PtNi loading on the self-made catalysts was determined by the inductively coupled plasma mass spectrometry (ICP-MS, Perkinelmer Co., Ltd., Waltham, MA, USA) with Equation (2). The catalyst microstructure and the size of PtNi nanoparticles were detected using a TEM (JEM-F200, Jeol Ltd., Tokyo, Japan), and the catalyst morphology was observed on a field emission SEM (Nova NanoSEM 450, FEI, Hillsboro, OR, USA). The energy-dispersive X-ray Spectroscopy (EDS, ZEISS Sigma 300, Zeiss Ltd., Oberkochen, Germany) was used to characterize the elemental composition of the samples. The XRD (Rigaku SmartLab SE, Rigaku Holdings Corporation, Tokyo, Japan) method was applied to characterize the carbon phase and crystal phase, which was fulfilled by adopting copper target Kα radiation (λ = 0.15405 nm, equipped with a monochromator) along with an operative voltage of 40 kV and a current of 40 mA. The scanning range was 2θ = 10–80° and the scanning rate was ω = 5°min−1. Additionally, the average coherent domain sizes of the nanoparticles were calculated based on the broadening of the prominent Pt (111) diffraction peak using Scherrer’s equation (Equation (3)) XPS (Thermo Scientific K-Alpha, Thermo Fisher Scientific, Waltham, MA, USA) was used to analyze the surface chemical elements of catalysts. And sample charging was corrected using the C1s peak at 284.8 eV as reference. All the experimental data were plotted using Origin software (Origin 2021, OriginLab Corporation, Northampton, MA, USA). Furthermore, the XRD and XPS data analyses were performed using MDI Jade software (MDI Jade 6, Materials Data, Inc., Livermore, CA, USA) and Thermo Avantage software (Avantage 5.9924, Thermo Fisher Scientific, Waltham, MA, USA), respectively.
m l o a d i n g = C 0 · V 0 S s a m p l e
mloading: Pt loading on catalyst electrodes, mg·cm−2; C0: concentration of Pt in the test solution was obtained by ICP-MS testing, mg·L−1; V0: volume of digestion solution at constant volume, mL; Ssample: area of catalyst electrode sample, cm2.
D = K λ β c o s θ
D: the crystallite size, nm; K: the Scherrer constant (0.89), λ: the X-ray wavelength (0.15405), nm; β: the full width at half maximum (FWHM) in radians, rad; θ: the Bragg diffraction angle, °.

4. Conclusions

In this work, PtNi bimetallic nanocatalysts with distinct morphologies were grown in situ on carbon paper substrates via an efficient and controllable pulse electrodeposition technique. By systematically modulating two critical parameters, deposition potential and pulse duty cycle, the correlations between electrochemical deposition parameters and crystal nucleation, growth kinetics, and the ultimate oxygen reduction reaction performance were elucidated. The pulse deposition potential governs the reaction overpotential and the nucleation driving force. Within the optimized potential range of −0.95 V to −0.4 V, the catalyst manifested a nanocubic morphology. As the deposition potential shifted, the content of surface oxidized species varied; notably, the catalyst prepared at a deposition potential of −0.95 V with a 30% duty cycle achieved an optimal surface Pt0/Pt2+ ratio (2.72), which significantly lowered the energy barrier for the ORR. Furthermore, the pulse duty cycle modulates the mass transport relaxation process at the deposition interface by adjusting the ratio of “on-time” to “off-time” (ton/toff). Increasing the duty cycle beyond the optimum led to particle coarsening and agglomeration, resulting in a reduction in the density of surface active sites. A duty cycle of 30% was found to induce the formation of PtNi nanocubes with a specific orientation, thereby promoting the exposure of active sites. Consequently, the catalyst prepared under the optimal conditions exhibited the highest onset potential (0.92 V vs. RHE) and a low Tafel slope (54.90 mV·dec−1), demonstrating superior ORR activity. Mechanistically, the coverage of Ni by a Pt-rich surface layer during deposition effectively weakened the binding strength of oxygenated intermediates. This reduction in surface oxide coverage directly contributed to the decrease in the Tafel slope observed after the accelerated durability test (ADT), indicative of enhanced intrinsic ORR activity.

Supplementary Materials

The following supporting information can be downloaded at: https://www.mdpi.com/article/10.3390/catal16040293/s1, Figure S1: (a,b) TEM image, (c) FFT pattern, (d) IFFT image, and (e,f) EDS elemental mapping images of PtNi−0.95/CP, Figure S2: XPS survey spectrum of PtNi−0.8/CP, PtNi−0.85/CP, PtNi−0.95/CP, and PtNi−1.0/CP, Figure S3: XPS survey spectrum of PtNi20%/CP, PtNi30%/CP, PtNi40%/CP, and PtNi50%/CP, Table S1: The catalytic performance of reported PtNi catalysts synthesized via different methods toward the oxygen reduction reaction. References [7,38,39,40,41,42] are cited in the Supplementary Materials.

Author Contributions

Conceptualization, methodology, writing—original draft preparation F.B.; writing—review and editing F.B. and Q.S.; supervision, project administration, funding acquisition, review and editing Q.Z. All authors have read and agreed to the published version of the manuscript.

Funding

This research received no external funding.

Data Availability Statement

The raw data supporting the conclusions of this article will be made available by the authors on request.

Conflicts of Interest

The authors declare no conflicts of interest.

References

  1. Zhang, F.; Zu, B.; Wang, B.; Qin, Z.; Yao, J.; Wang, Z.; Fan, L.; Jiao, K. Developing long-durability proton-exchange membrane fuel cells. Joule 2025, 9, 101853. [Google Scholar] [CrossRef] [Scilit]
  2. Yuan, C.; Zhang, S.; Zhang, J. Oxygen reduction electrocatalysis: From conventional to single-atomic platinum-based catalysts for proton exchange membrane fuel cells. Front. Energy 2023, 18, 206–222. [Google Scholar] [CrossRef] [Scilit]
  3. Hong, R.; Xing, L.; Wang, N.; Meng, L.; Du, L.; Ye, S. Ionomers: Behind-the-Scenes Influencer Determining the Performance of Membrane Electrode Assemblies in PEM Fuel Cells/Electrolyzers. ACS Energy Lett. 2026, 11, 1193–1207. [Google Scholar] [CrossRef] [Scilit]
  4. Silva, W.O.; Mabillard, A.; Soutrenon, M.; Gschwend, G.; Ligen, Y.; Joris, S.; Bondaz, L.; Agrawal, K.V.; Girault, H.H. Print-light-synthesis of electrocatalytically active gas diffusion electrodes for fuel cell applications. J. Mater. Chem. A 2025, 13, 7403–7412. [Google Scholar] [CrossRef] [Scilit]
  5. Park, H.; Choe, S.; Kim, H.; Kim, D.-K.; Cho, G.; Park, Y.; Jang, J.H.; Ha, D.-H.; Ahn, S.H.; Kim, S.-K. Direct fabrication of gas diffusion cathode by pulse electrodeposition for proton exchange membrane water electrolysis. Appl. Surf. Sci. 2018, 444, 303–311. [Google Scholar] [CrossRef] [Scilit]
  6. Sriwannaboot, J.; Kannan, A.; Tantavichet, N. Pulse-reverse electrodeposition of Pt–Co bimetallic catalysts for oxygen reduction reaction in acidic medium. Int. J. Hydrogen Energy 2020, 45, 7025–7035. [Google Scholar] [CrossRef] [Scilit]
  7. Egetenmeyer, A.; Baumgärtner, M.; Linckh, T.; Durneata, D.; Natter, H.; Hempelmann, R.; Radev, I.; Peinecke, V. Pulse electrodeposition of catalyst nanoparticles for application in PEM fuel cells. Trans. IMF 2017, 95, 9–19. [Google Scholar] [CrossRef] [Scilit]
  8. You, S.; Luo, P.; Fang, L.; Gao, J.; Liu, L.; Xu, H.; Zhang, H.; Wang, Y. Unique hierarchical flower-like PtNi alloy nanocrystals with enhanced oxygen reduction properties. Electrochim. Acta 2019, 294, 406–412. [Google Scholar] [CrossRef] [Scilit]
  9. Bae, S.J.; Yoo, S.J.; Lim, Y.; Kim, S.; Lim, Y.; Choi, J.; Nahm, K.S.; Hwang, S.J.; Lim, T.-H.; Kim, S.-K.; et al. Facile preparation of carbon-supported PtNi hollow nanoparticles with high electrochemical performance. J. Mater. Chem. 2012, 22, 8820–8825. [Google Scholar] [CrossRef] [Scilit]
  10. Tian, X.L.; Zhao, X.; Su, Y.Q.; Wang, L.J.; Wang, H.M.; Dang, D.; Chi, B.; Liu, H.F.; Hensen, E.J.M.; Lou, X.W.; et al. Engineering bunched Pt-Ni alloy nanocages for efficient oxygen reduction in practical fuel cells. Science 2019, 366, 850–856. [Google Scholar] [CrossRef] [Scilit]
  11. Zhou, W.; Wu, J.; Yang, H. Highly Uniform Platinum Icosahedra Made by Hot Injection-Assisted GRAILS Method. Nano Lett. 2013, 13, 2870–2874. [Google Scholar] [CrossRef] [Scilit]
  12. Haider, R.; Wen, Y.; Ma, Z.-F.; Wilkinson, D.P.; Zhang, L.; Yuan, X.; Song, S.; Zhang, J. High temperature proton exchange membrane fuel cells: Progress in advanced materials and key technologies. Chem. Soc. Rev. 2021, 50, 1138–1187. [Google Scholar] [CrossRef] [Scilit]
  13. Zhu, E.; Wu, M.; Xu, H.; Peng, B.; Liu, Z.; Huang, Y.; Li, Y. Stability of Platinum-Group-Metal-Based Electrocatalysts in Proton Exchange Membrane Fuel Cells. Adv. Funct. Mater. 2022, 32, 2203883. [Google Scholar] [CrossRef] [Scilit]
  14. Wu, Y.; Geng, S.; Liu, J.; Liu, Y.; Wang, K.; Wang, Y.; Song, S. Unveiling the Catalytic Potential of Facet Heterojunctions in Platinum Alloys for Oxygen Reduction Reaction. Angew. Chem. Int. Ed. 2025, 64, e202505699. [Google Scholar] [CrossRef] [Scilit] [PubMed]
  15. Xia, Z.; Zhu, X.; Chen, X.; Zhou, Y.; Luo, Q.; Yang, J. Unveiling the Composition-Dependent Catalytic Mechanism of Pt–Ni Alloys for Oxygen Reduction: A First-Principles Study. J. Phys. Chem. Lett. 2024, 15, 9566–9574. [Google Scholar] [CrossRef] [Scilit]
  16. Le, T.D.; Ahemad, M.J.; Kim, D.-S.; Lee, B.-H.; Oh, G.-J.; Shin, G.-S.; Nagappagari, L.R.; Dao, V.; Van Tran, T.; Yu, Y.-T. Synergistic effect of Pt-Ni dual single-atoms and alloy nanoparticles as a high-efficiency electrocatalyst to minimize Pt utilization at cathode in polymer electrolyte membrane fuel cells. J. Colloid Interface Sci. 2023, 634, 930–939. [Google Scholar]
  17. Jeong, C.; Lee, J.; Jo, H.; Lee, K.; Lee, S.; Ophus, C.; Ercius, P.; Cho, E.; Yang, Y. Atomic-scale 3D structural dynamics and functional degradation of Pt alloy nanocatalysts during the oxygen reduction reaction. Nat. Commun. 2025, 16, 8026. [Google Scholar] [CrossRef] [Scilit]
  18. Mou, X.; Zhang, Z.; Zhao, Z.; Liu, B.; Wang, X.; Yang, C.; Shen, L.; Zhang, Y.; Zhao, L.; Qu, W.; et al. Electron buffer effect in Cr–Pt3Ni catalysts for robust oxygen reduction electrocatalysis. Int. J. Hydrogen Energy 2025, 182, 151698. [Google Scholar] [CrossRef] [Scilit]
  19. Parlinska-Wojtan, M.; Tarnawski, T.R.; Depciuch, J.; De Marco, M.L.; Sobczak, K.; Matlak, K.; Pawlyta, M.; Schaeublin, R.E.; Chee, S.W. Understanding the Growth of Electrodeposited PtNi Nanoparticle Films Using Correlated In Situ Liquid Cell Transmission Electron Microscopy and Synchrotron Radiation. Nano Lett. 2024, 24, 12361–12367. [Google Scholar] [CrossRef] [Scilit] [PubMed]
  20. Simonov, A.N.; Cherstiouk, O.V.; Vassiliev, S.Y.; Zaikovskii, V.I.; Filatov, A.Y.; Rudina, N.A.; Savinova, E.R.; Tsirlina, G.A. Potentiostatic electrodeposition of Pt on GC and on HOPG at low loadings: Analysis of the deposition transients and the structure of Pt deposits. Electrochim. Acta 2014, 150, 279–289. [Google Scholar] [CrossRef] [Scilit]
  21. Maijenburg, A.W.; George, A.; Samal, D.; Nijland, M.; Besselink, R.; Kuiper, B.; Kleibeuker, J.E.; ten Elshof, J.E. Electrodeposition of micropatterned Ni|Pt multilayers and segmented Ni|Pt|Ni nanowires. Electrochim. Acta 2012, 81, 123–128. [Google Scholar] [CrossRef] [Scilit]
  22. Leteba, G.M.; Mitchell, D.R.G.; Levecque, P.B.J.; van Steen, E.; Lang, C.I. Topographical and compositional engineering of core–shell Ni@Pt ORR electro-catalysts. RSC Adv. 2020, 10, 29268–29277. [Google Scholar] [CrossRef] [Scilit]
  23. Strasser, P.; Koh, S.; Anniyev, T.; Greeley, J.; More, K.; Yu, C.; Liu, Z.; Kaya, S.; Nordlund, D.; Ogasawara, H.; et al. Lattice-strain control of the activity in dealloyed core-shell fuel cell catalysts. Nat. Chem. 2010, 2, 454–460. [Google Scholar] [CrossRef] [Scilit]
  24. Gasmi, A.; Ennaji, M.; Campos-Roldán, C.A.; Shekhar, A.T.; Bacabe, R.; Stodel, M.; Lecoeur, F.; Dupont, M.; Vinci, V.; Mirolo, M.; et al. Primacy of lattice distortion over strain in platinum fuel cell nanoalloy catalysts. Energy Environ. Sci. 2025, 18, 10078–10087. [Google Scholar] [CrossRef] [Scilit]
  25. Muntean, R.; Pascal, D.; Rost, U.; Podleschny, P.; Schumacher, M.; Mărginean, G. Studies on Pulse Electrodeposition of Pt-Ni binary Alloy for Electrochemical Cell Applications. In Proceedings of the 7th International Conference on Advanced Materials and Structures—AMS 2018, Timisoara, Romania, 28–31 March 2018; IOP Conference Series: Materials Science and Engineering; IOP Publishing: Bristol, UK, 2018. [Google Scholar]
  26. Jo, H.; Wi, D.H.; Lee, T.; Kwon, Y.; Jeong, C.; Lee, J.; Baik, H.; Pattison, A.J.; Theis, W.; Ophus, C.; et al. Direct strain correlations at the single-atom level in three-dimensional core-shell interface structures. Nat. Commun. 2022, 13, 5957. [Google Scholar] [CrossRef] [Scilit]
  27. Bu, L.; Zhang, N.; Guo, S.; Zhang, X.; Li, J.; Yao, J.; Wu, T.; Lu, G.; Ma, J.-Y.; Su, D.; et al. Biaxially strained PtPb/Pt core/shell nanoplate boosts oxygen reduction catalysis. Science 2016, 354, 1410–1414. [Google Scholar] [CrossRef] [Scilit] [PubMed]
  28. Li, J.; Zhao, L.; Liu, P. Boosting electrochemical property of carbon cloth for supercapacitors with electrodeposited aniline-based copolymers. Electrochim. Acta 2023, 462, 142706. [Google Scholar] [CrossRef] [Scilit]
  29. Stamenkovic, V.R.; Fowler, B.; Mun, B.S.; Wang, G.; Ross, P.N.; Lucas, C.A.; Marković, N.M. Improved Oxygen Reduction Activity on Pt3Ni(111) via Increased Surface Site Availability. Science 2007, 315, 493–497. [Google Scholar] [CrossRef] [Scilit] [PubMed]
  30. Wang, Y.; Wang, D.; Li, Y. A fundamental comprehension and recent progress in advanced Pt-based ORR nanocatalysts. SmartMat 2021, 2, 56–75. [Google Scholar] [CrossRef] [Scilit]
  31. Huang, J.-H.; Yeh, T.-K.; Wang, M.-Y. Preparation of Unique Flower-like Pt-Ni Alloy Catalysts as the Cathode of a PEMFC by Electrodeposition Technique. Electrochem. Soc. Trans. 2020, 97, 627–638. [Google Scholar]
  32. Gan, L.; Heggen, M.; O’Malley, R.; Theobald, B.; Strasser, P. Understanding and Controlling Nanoporosity Formation for Improving the Stability of Bimetallic Fuel Cell Catalysts. Nano Lett. 2013, 13, 1131–1138. [Google Scholar] [CrossRef] [Scilit]
  33. Tu, W.; Luo, W.; Chen, C.; Chen, K.; Zhu, E.; Zhao, Z.; Wang, Z.; Hu, T.; Zai, H.; Ke, X.; et al. Tungsten as “Adhesive” in Pt2CuW0.25 Ternary Alloy for Highly Durable Oxygen Reduction Electrocatalysis. Adv. Funct. Mater. 2019, 30, 1908230. [Google Scholar] [CrossRef] [Scilit]
  34. Chen, J.; Lim, B.; Lee, E.P.; Xia, Y. Shape-controlled synthesis of platinum nanocrystals for catalytic and electrocatalytic applications. Nano Today 2009, 4, 81–95. [Google Scholar] [CrossRef] [Scilit]
  35. Ma, C.; Zhao, D.; Ma, Z. Effects of duty cycle and pulse frequency on microstructures and properties of electrodeposited Ni–Co–SiC nanocoatings. Ceram. Int. 2020, 46, 12128–12137. [Google Scholar] [CrossRef] [Scilit]
  36. Yoo, J.; Park, Y.; Choi, J.; Roh, J.; Shin, K.; Cho, H.-S.; Cho, E.; Lee, C.; Lee, H.M. Electrochemical Dealloying of Ni-Rich Pt–Ni Nanoparticle Network for Robust Oxygen-Reduction Electrocatalysts. ACS Sustain. Chem. Eng. 2023, 11, 15460–15469. [Google Scholar] [CrossRef] [Scilit]
  37. Markovic, N.M.; Ross, P.N., Jr. Surface science studies of model fuel cell electrocatalysts. Surf. Sci. Rep. 2002, 45, 121–229. [Google Scholar] [CrossRef] [Scilit]
  38. Zhao, L.; Guo, Y.; Fu, C.; Luo, L.; Wei, G.; Shen, S.; Zhang, J. Electrodeposited PtNi nanoparticles towards oxygen reduction reaction: A study on nucleation and growth mechanism. Chin. J. Catal. 2021, 42, 2068–2077. [Google Scholar] [CrossRef] [Scilit]
  39. Chen, W.-H.; Chang, M.-H.; Wang, T.-W.; Wang, M.-S. Electrospun bimetallic PtNi nanowires as electrocatalyst for oxygen reduction reaction in PEMFCs. Int. J. Hydrogen Energy 2024, 51, 1487–1496. [Google Scholar] [CrossRef] [Scilit]
  40. Feng, Z.-W.; Chen, H.-Z.; Duan, X.; Tang, L.; Zhao, Y.-K.; Huang, L. Carbon Supported Octahedral PtNi Nanoparticles (Oct-PtNi/C) as a Cathode Catalyst for Proton Exchange Membrane Fuel Cells (PEMFCs) with Improved Activity and Durability. J. Electrochem. 2026, 32, 2515009. [Google Scholar] [CrossRef] [Scilit]
  41. Zou, L.; Fan, J.; Zhou, Y.; Wang, C.; Li, J.; Zou, Z.; Yang, H. Conversion of PtNi alloy from disordered to ordered for enhanced activity and durability in methanol-tolerant oxygen reduction reactions. Nano Res. 2015, 8, 2777–2788. [Google Scholar] [CrossRef] [Scilit]
  42. Zaccarine, S.F.; Alia, S.M.; McNeary, W.W.; Chattot, R.; Dzara, M.J.; Martens, I.; Mauger, S.A.; Weimer, A.W.; Drnec, J.; Pivovar, B.S.; et al. Optimization of Extended-Surface PtNi Nanowire Oxygen Reduction Electrocatalysts Produced via Atomic Layer Deposition. ACS Appl. Energy Mater. 2022, 5, 4587–4602. [Google Scholar] [CrossRef] [Scilit]
Figure 1. SEM images of (a) PtNi−0.8/CP, (b) PtNi−0.85/CP, (c) PtNi−0.95/CP, and (d) PtNi−1.0/CP.
Catalysts 16 00293 g001
Figure 2. (a) X-ray diffraction (XRD) patterns of PtNi−0.8/CP, PtNi−0.85/CP, PtNi−0.95/CP, and PtNi−1.0/CP (b) magnified view of the XRD patterns in the regions corresponding to the Pt (111) and Pt (200) facets. (The vertical dotted lines indicate the standard diffraction peak positions corresponding to the reference PDF cards.).
Catalysts 16 00293 g002
Figure 3. (a,b) TEM image, (c) FFT pattern, (d) IFFT image, and (e,f) EDS elemental mapping images of PtNi−0.95/CP. (The red box in (b) indicates the region used to derive the FFT pattern in (c).).
Catalysts 16 00293 g003
Figure 4. Pt4f of (a) PtNi−0.8/CP, (b) PtNi−0.85/CP, (c) PtNi−0.95/CP, and (d) PtNi−1.0/CP. (The circles represent the raw data, the blue line represents the fitted data, the purple lines correspond to Pt0, and the yellow lines correspond to Pt2+).
Catalysts 16 00293 g004
Figure 5. (a) Cyclic voltammetry (CV) diagrams and (b) linear sweep voltammetry (LSV) diagrams of PtNi−0.8/CP, PtNi−0.85/CP, PtNi−0.95/CP, and PtNi−1.0/CP.
Catalysts 16 00293 g005
Figure 6. (a) ECSA and (b) Tafel slope of the catalyst electrodes prepared under different deposition potentials before and after 5000 cycles aging in 0.5 M H2SO4, 10 mV·s−1 sweep rate, O2 environment.
Catalysts 16 00293 g006
Figure 7. SEM images of (a) PtNi20%/CP, (b) PtNi30%/CP, (c) PtNi40%/CP, (d) PtNi50%/CP.
Catalysts 16 00293 g007
Figure 8. (a) X-ray diffraction (XRD) patterns of PtNi20%/CP, PtNi30%/CP, PtNi40%/CP, and PtNi50%/CP. (b) magnified view of the XRD patterns in the regions corresponding to the Pt (111) and Pt (200) facets. (The vertical dotted lines indicate the standard diffraction peak positions corresponding to the reference PDF cards.).
Catalysts 16 00293 g008
Figure 9. XPS Pt4f of (a) PtNi20%/CP, (b) PtNi30%/CP, (c) PtNi40%/CP, and (d) PtNi50%/CP. (The circles represent the raw data, the blue line represents the fitted data, the purple lines correspond to Pt0, and the yellow lines correspond to Pt2+.).
Catalysts 16 00293 g009
Figure 10. (a) Cyclic voltammetry (CV) diagrams and (b) linear sweep voltammetry (LSV) diagrams of PtNi20%/CP, PtNi30%/CP, PtNi40%/CP, and PtNi50%/CP.
Catalysts 16 00293 g010
Figure 11. (a) ECSA and (b) Tafel slope of the catalyst electrodes prepared under different duty cycles before and after 5000 cycles aging in 0.5 M H2SO4, 10 mV·s−1 sweep rate, O2 environment.
Catalysts 16 00293 g011
Table 1. Properties of catalysts under different deposition potentials.
Catalysts Before ADTAfter ADT
Pt
loading
DPtECSAEonsetTafel
Slope
ECSAEonsetTafel
Slope
(mg
·cm−2)
(nm)(m2
·gPt−1)
(V) (vs. RHE)(mV
·dec−1)
(m2
·gPt−1)
(V) (vs. RHE)(mV
·dec−1)
PtNi−0.80/CP0.107.7150.230.8860.9149.380.8452.13
PtNi−0.85/CP0.129.2835.890.8956.8027.560.8551.89
PtNi−0.95/CP0.1110.6664.760.9254.9057.240.8742.23
PtNi−1.0/CP0.0912.9642.290.9061.1534.730.8650.04
Table 2. Properties of catalysts under different duty cycles.
Catalysts Before ADTAfter ADT
Pt
loading
DPtECSAEonsetTafel
Slope
ECSAEonsetTafel
Slope
(mg
·cm−2)
(nm)(m2
·gPt−1)
(V) (vs. RHE)(mV
·dec−1)
(m2
·gPt−1)
(V) (vs. RHE)(mV
·dec−1)
PtNi20%/CP0.1411.1134.350.8960.2529.230.8651.96
PtNi30%/CP0.1211.1364.760.9254.9058.980.8742.23
PtNi40%/CP0.1011.3145.960.9155.8036.780.8745.41
PtNi50%/CP0.1115.6963.580.9055.6853.760.8643.75
Disclaimer/Publisher’s Note: The statements, opinions and data contained in all publications are solely those of the individual author(s) and contributor(s) and not of MDPI and/or the editor(s). MDPI and/or the editor(s) disclaim responsibility for any injury to people or property resulting from any ideas, methods, instructions or products referred to in the content.