


Abstract
In the current investigation, the solar photocatalytic degradation of two cationic model dyes (methyl green (MG) and crystal violet (CV)) was studied using α-Fe2O3/ZnFe2O4 nanocomposite. The fine powder of nanoparticles was obtained by co-precipitation method at pH = 10 and characterized by X-ray diffraction (XRD), Field Emission Scanning Electron Microscopy (FESEM) and UV-vis spectroscopy. The surface properties were further examined through temperature-programmed desorption (TPD) and point of zero charge (PZC) measurements to assess the acid–base characteristics and surface charge behavior of the material. Adsorption and photocatalytic performance were systematically evaluated in both single and binary systems. Dark adsorption experiments showed a better affinity of the α-Fe2O3/ZnFe2O4 heterosystem towards MG dye in both cases. Under natural sunlight irradiation in the individual system, the photocatalytic activity of the nanoparticles was significantly higher for MG (81.67% removal) compared to CV (41.70%). Kinetics analysis revealed that the photodegradation of both dyes followed a pseudo-first-order model. In binary systems, competitive adsorption effects strongly influenced the degradation behavior, with MG showing preferential adsorption and higher degradation rates. Moreover, the MG discoloration kinetics followed a second-order model, while CV kinetics transitioned from second- to zero-order with increased initial concentration.
1. Introduction
Photocatalysis is Advanced Oxidation Process (AOP) widely employed to tackle environmental challenges. It is considered an effective method for degrading organic pollutants [1,2]. In a typical photocatalytic AOP, reactive oxygen species (ROS), such as hydroxyl radicals (HO•), superoxide radicals (•O2−), or holes (h+), are generated and play a crucial role in breaking down contaminants into water, carbon dioxide, and environmentally friendly residues [3,4]. This treatment process is an attractive alternative for pollutant elimination, offering several advantages over other methods, including complete pollutant mineralization, operational simplicity, absence of harmful by-products, cost-effectiveness, functionality under ambient pressure and temperature, and the capability to reduce pollutant concentrations to ppm and ppb levels [5]. Heterogeneous photocatalysis has emerged as a highly effective treatment technology for removing organic dyes, which pose significant risks to environmental sustainability and human health [6,7]. This process relies on photocatalytic systems, where a semiconductor acts as the active site for reactions occurring on its surface [8]. Titanium dioxide (TiO2) was the first material identified as a powerful photocatalyst for wastewater treatment [9,10]. Subsequently, extensive research has led to the development of advanced semiconductors, including metal oxides, spinel ferrites, and graphene oxide [11]. These materials demonstrate exceptional efficiency and enhanced activity in the photocatalytic degradation of dyes [12]. In particular, magnetic nanoparticles based on spinel ferrite have garnered considerable attention due to their exceptional structural, magnetic, optical, and electrical properties [13,14,15]. Among them, hematite (α-Fe2O3) stands as a widely studied photocatalyst. Its abundance, non-toxicity, chemical stability in aqueous media, and favorable bandgap (~2.1 eV) allowing absorption of a significant portion of the visible spectrum make it an attractive candidate for solar-driven applications [7,16]. Hematite α-Fe2O3 has demonstrated photocatalytic activity for the degradation of various dyes under visible, and even natural sunlight [17,18]. However, its widespread application is hampered by intrinsic limitations, most notably a short hole diffusion length and a rapid recombination of photogenerated electron–hole pairs, which often result in modest quantum efficiency [7,19]. Similarly, zinc ferrite (ZnFe2O4), another important magnetic spinel, has emerged as a promising visible-light-active photocatalyst [18,20,21]. Nevertheless, its photocatalytic performance is often constrained by limited electrical conductivity, narrow spectral response, and fast charge carrier recombination [22]. To overcome these individual limitations and create superior photocatalytic systems, the construction of heterojunctions between semiconductors has proven to be a highly effective strategy [16,20,22,23]. By coupling materials with matched band structures, a built-in electric field at their interface can significantly enhance the separation and migration of photogenerated electrons and holes, thereby suppressing recombination and boosting photocatalytic activity [7,20,23]. In this context, α-Fe2O3/ZnFe2O4 heterojunction represents a particularly promising system by combining the complementary properties of both ferrites. Although the α-Fe2O3/ZnFe2O4 heterojunction has attracted some attention, its photocatalytic applications remain limited and highly specific [23]. In fact, to date, only a few studies have been reported. Han et al. [24] employed the heterostructure for CO2 photoreduction, while Li et al. [20] investigated this heterojunction for the degradation of Rhodamine B under artificial visible light irradiation.
In our previous work [16], we demonstrated the effectiveness of α-Fe2O3/ZnFe2O4 heterojunction (with α-Fe2O3 as the major phase) for the solar-driven photodegradation of naphthalene. Building upon these findings, the present study aims to further evaluate the robustness and versatility of α-Fe2O3/ZnFe2O4 for the photodegradation of cationic dyes under natural sunlight, including complex binary systems. For this purpose, methyl green (MG) and crystal violet (CV) were selected as representative model pollutants. These dyes, belonging to the triphenylmethane family, are widely used in various industries and are particularly concerning due to their harmful nature, environmental persistence, and associated health risks, leading to detrimental effects on aquatic ecosystems [25,26].
The photocatalytic degradation of crystal violet has been widely investigated using different catalytic systems. Numerous studies have reported its degradation employing various iron-based materials under different irradiation conditions. For instance, Bayahia reported the degradation of CV using ZnFe2O4 nanoparticles [27] under sunlight, while in another study, α-Fe2O3 was used in nanoparticles prepared by the sol–gel autocombustion method under UV light [28]. Similarly, Sifat [29] studied the CV photodegradation under UV and sunlight using various catalysts such as Fe2O3, TiO2, ZnO, ZrO2, Copper oxides and Nb2O5. Saravan et al. [30] reported the degradation of CV using cobalt oxide nanoparticles under UV light. In contrast, while methyl green degradation has also been documented, the body of literature is less extensive. Akika et al. [31] investigated the use of NiAl2O4 and NiAl2O4/kaolin nanoparticles (NPs) for the degradation of MG dye under sunlight and Hadjltaief et al. [32] demonstrated its degradation using a ZnO–TiO2/clay composite under UVA irradiation. Iqbal et al. [26] reported photocatalytic degradation of MG dye using CuSe/GO under sunlight.
However, these studies predominantly focus on single-pollutant (mono-solute) systems, which does not reflect the complexity of real industrial wastewater containing dye mixtures. Critically, the behavior of pollutants in such mixtures remains relatively underexplored. The interactions between different dyes such as competitive adsorption and reactive site blocking can drastically alter the degradation kinetics and efficiency compared to single-dye solutions. Few studies have systematically addressed these challenges. Ong et al. [33] investigated the photocatalytic degradation of Basic Blue 3 (BB3) and Reactive Orange 16 (RO16) in binary dye systems using immobilized TiO2 catalysts supported on glass substrates, under both ultraviolet and solar light irradiation. Sharma and Khare [34] reported the degradation of both Rhodamine B (RhB) and Methylene Blue (MB) in their binary dye solution under visible light irradiation, employing two different catalysts: hierarchical nanostructures of bismuth sulfide (Bi2S3) and commercial titanium dioxide (TiO2, Degussa P25). Ariyanti et al. [35] conducted a comprehensive study on the photo-assisted degradation of Rhodamine B and Methyl Orange dyes in a binary mixture, employing TiO2 as a photocatalyst under simulated solar irradiation.
To the best of our knowledge, this study represents the first report on the use of the Fe2O3/ZnFe2O4 heterojunction for the simultaneous photocatalytic degradation of Methylene Green (MG) and crystal violet (CV) in a competitive binary aqueous system under natural sunlight. Comprehensive characterization techniques were employed to investigate the structural, morphological, optical, and physicochemical properties of the synthesized material. Furthermore, adsorption studies of MG and CV in single systems, as well as MG/CV in binary systems, were performed using kinetic and isotherm models to elucidate the interaction mechanisms between the dyes and the photocatalyst. Finally, the photocatalytic degradation experiments were systematically conducted under sunlight irradiation to evaluate the material’s performance.
2. Results and Discussion
2.1. Characterization of Material
2.1.1. Structural Properties (XRD)
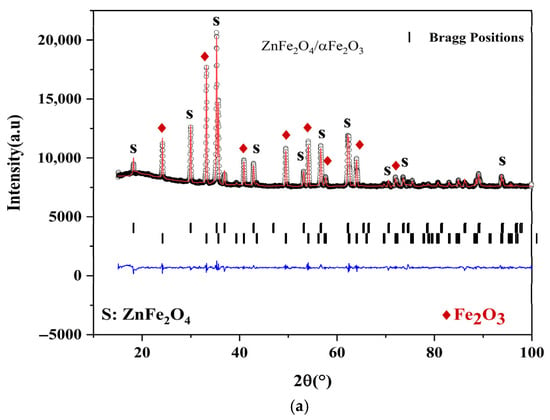
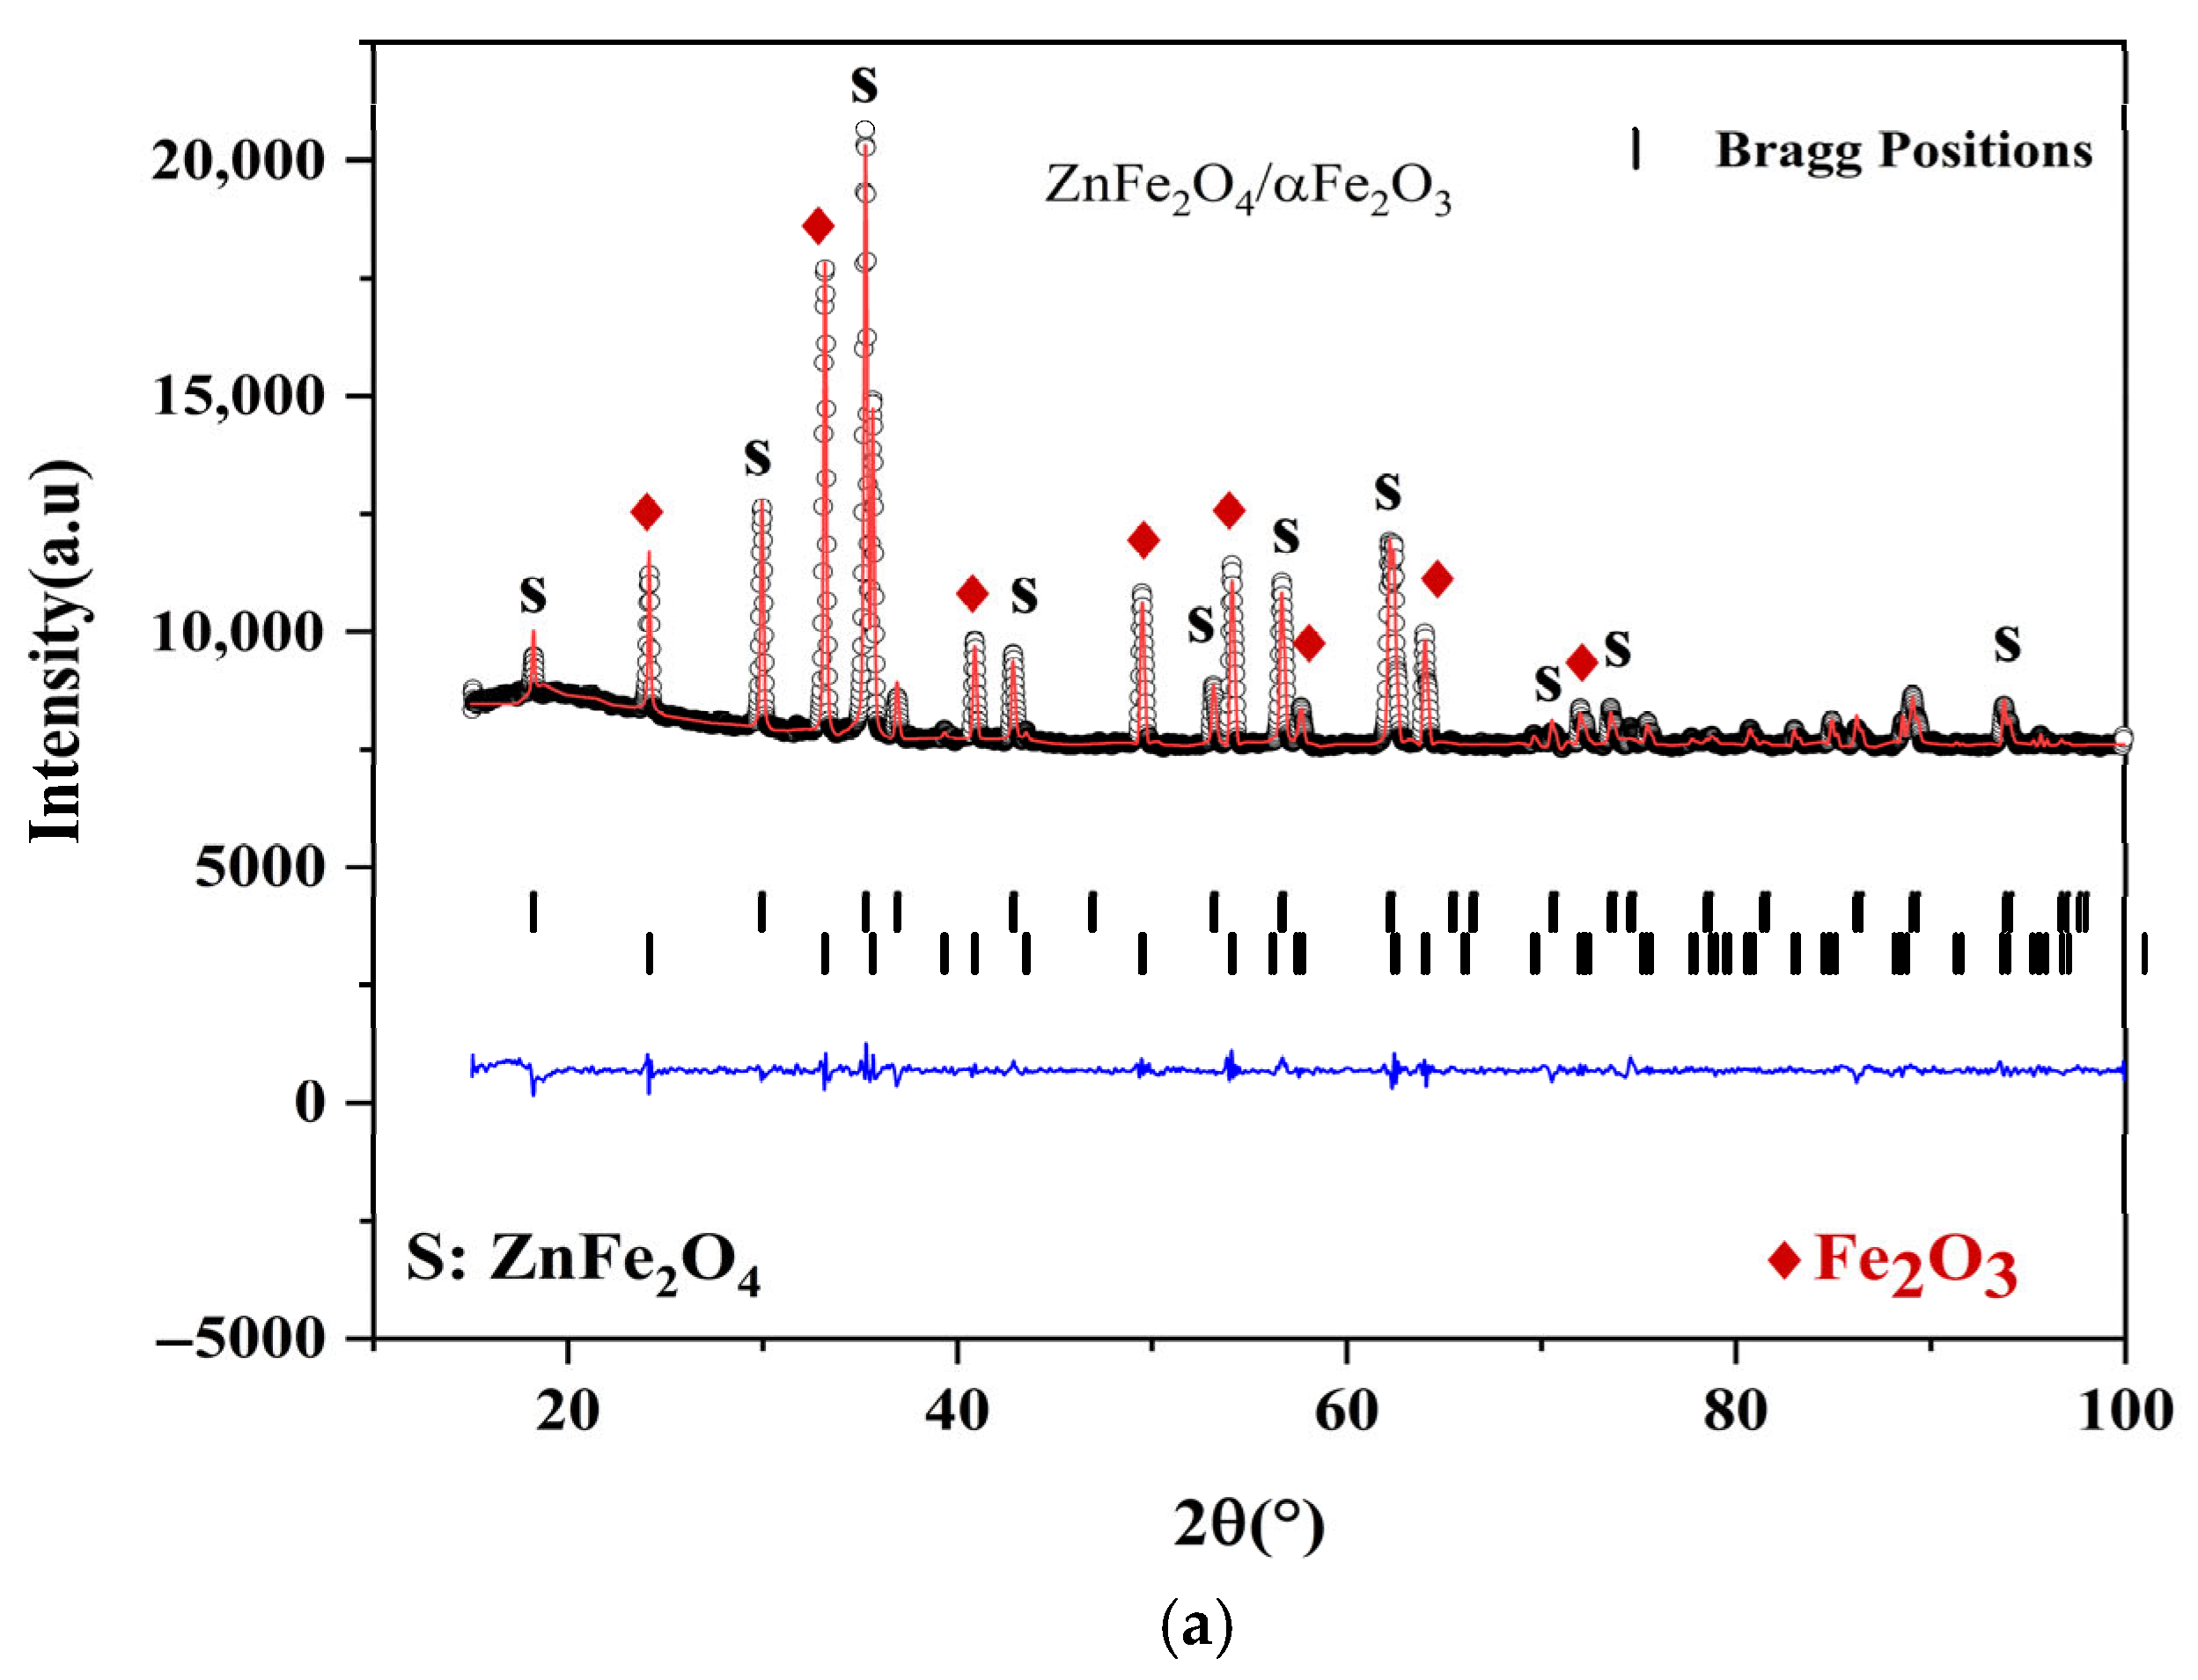
The phase composition of as-prepared material was analyzed by X-ray diffraction XRD and the corresponding diffraction pattern is shown in Figure 1a. The XRD analysis confirms the successful synthesis of the α-Fe2O3/ZnFe2O4. Typical peaks at 2θ= 24.15°, 33.16°, 35.68°, 40.86°, 49.74°, 54.07°, 57.60°, 64.01° and 71.98° can be assigned to rhombohedral hematite α-Fe2O3 structure (ICDD Card N° 01-086-2368), which represents the major phase (wt% = 76.74%).
Figure 1.
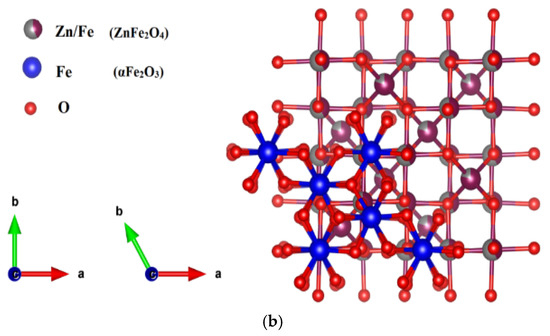
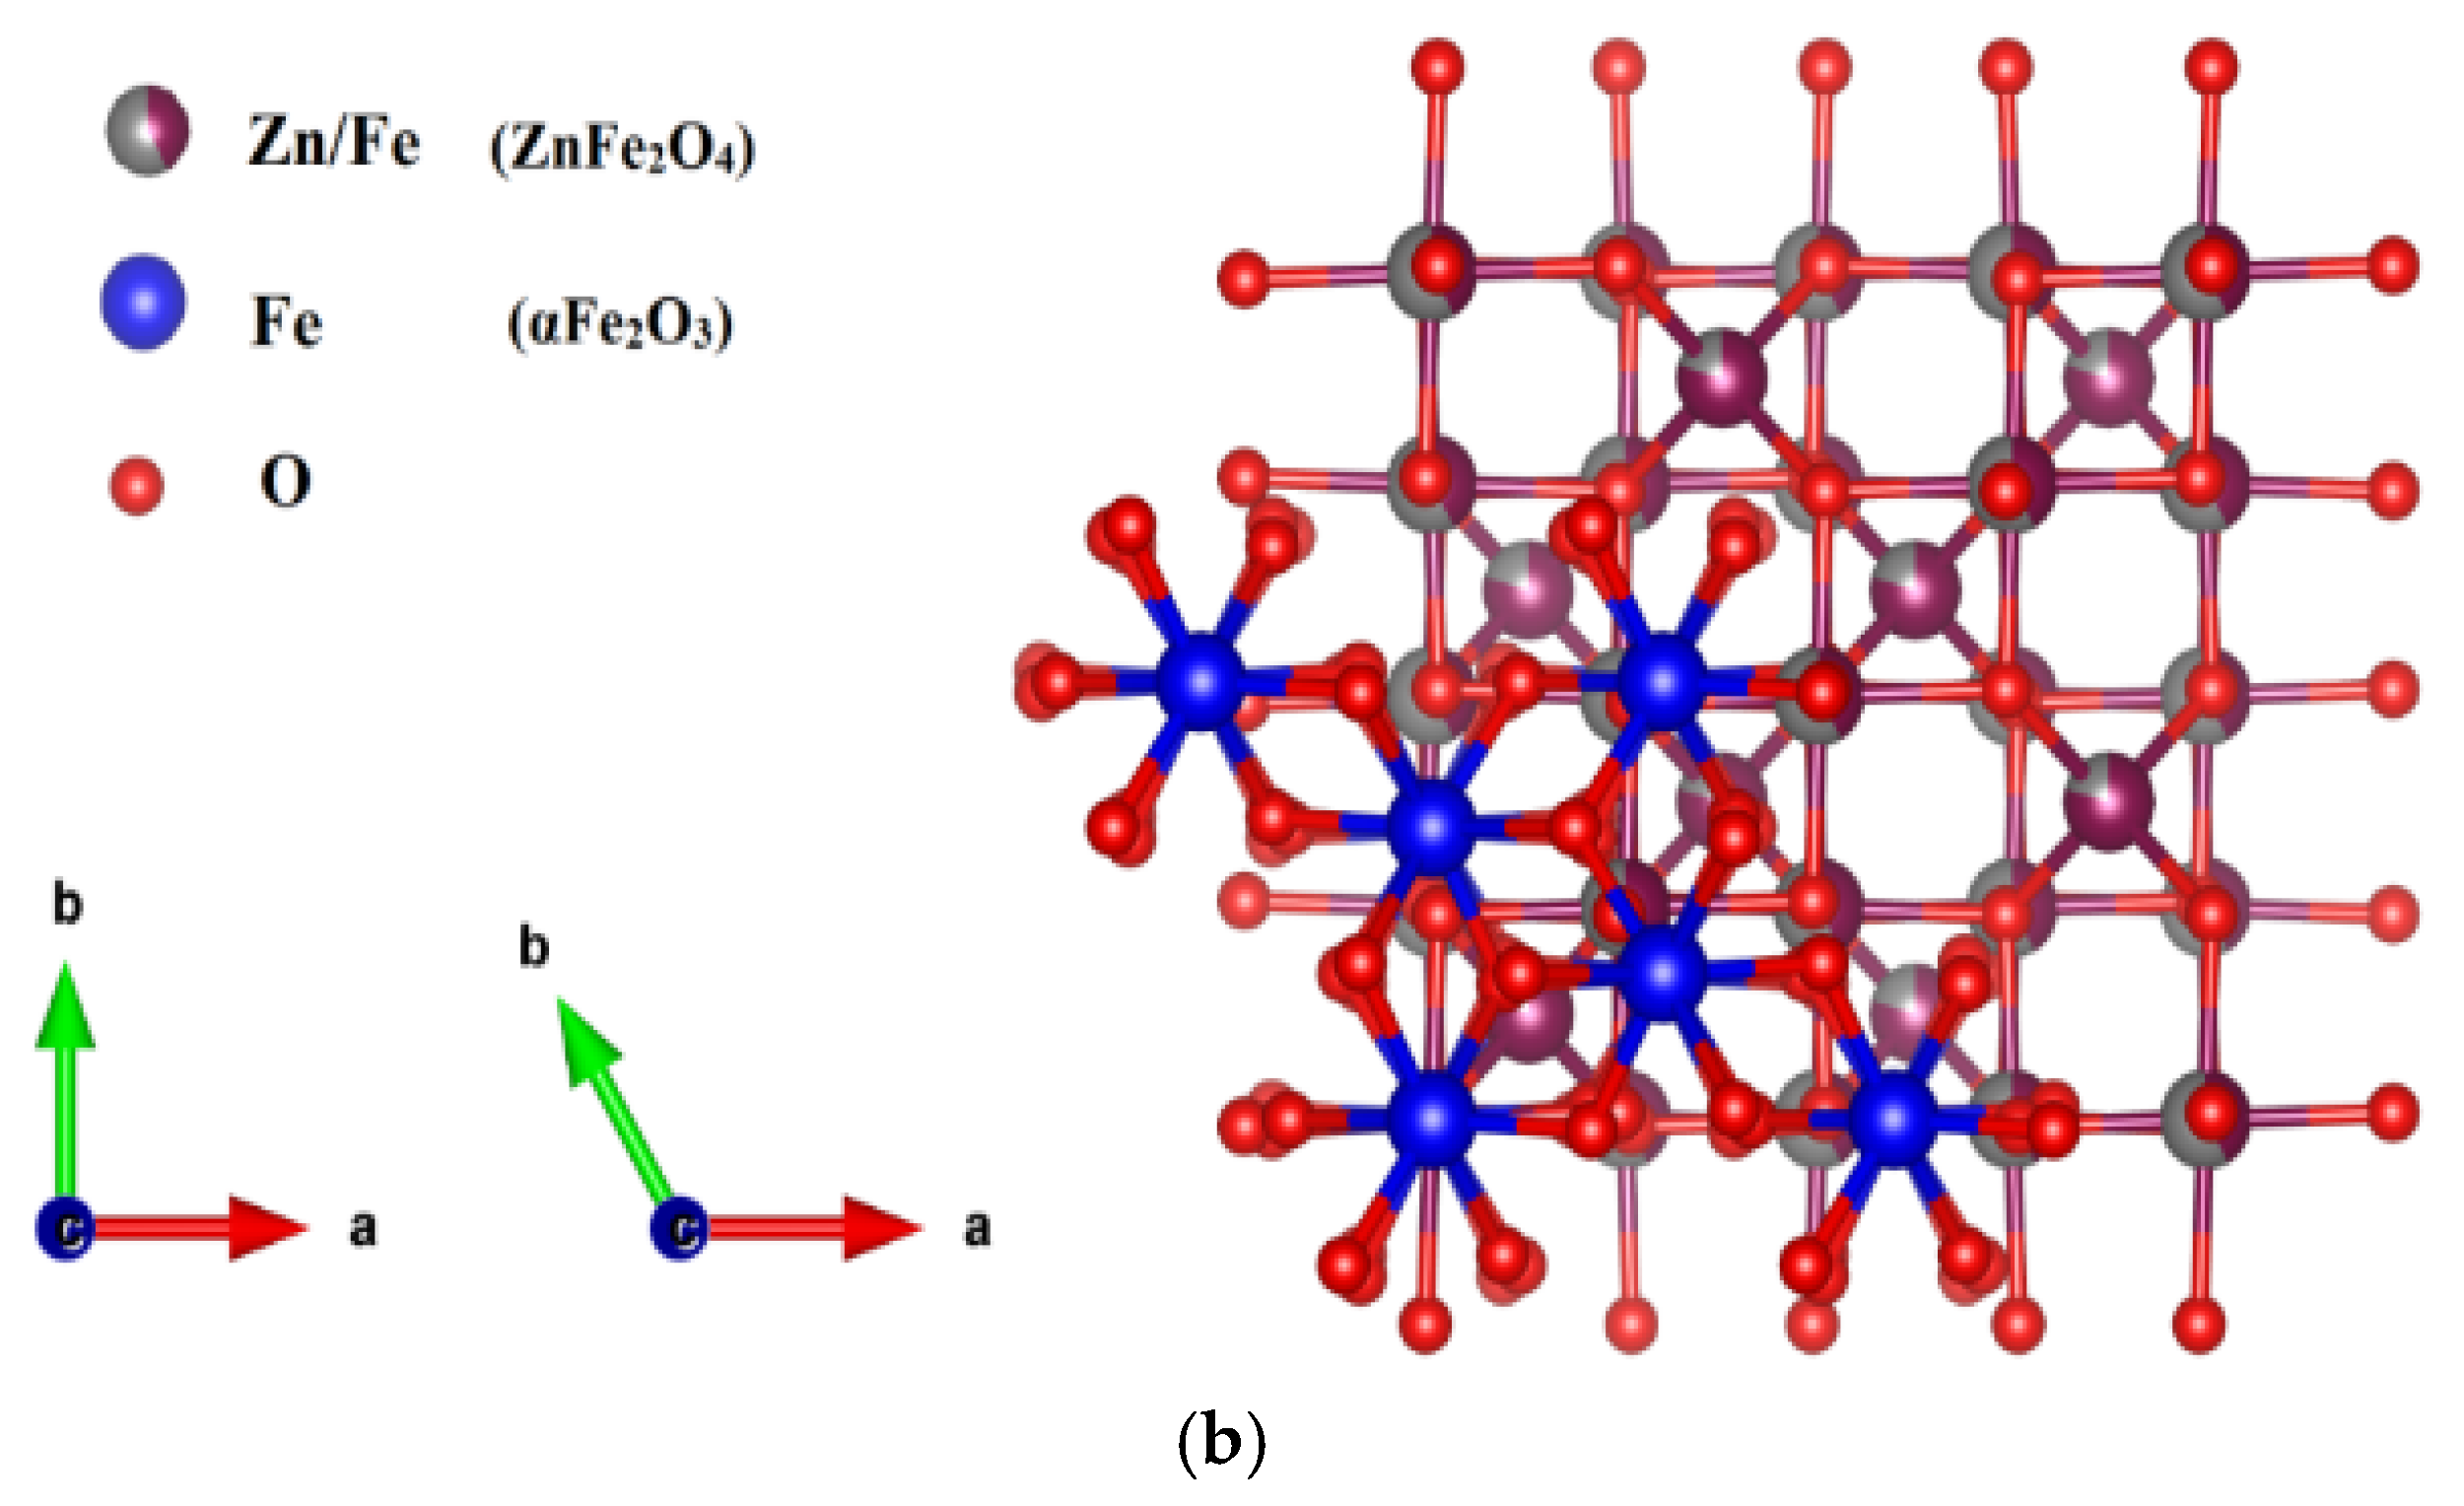
(a) Rietveld refinement of room-temperature XRD pattern of the as-prepared α-Fe2O3/ZnFe2O4 catalyst. The observed data, calculated data, deviation, and Bragg positions are indicated by a black dot, red line, blue line, and black bar, respectively. Peaks marked with S correspond to the spinel ZnFe2O4 phase ICDD Card No. 01-082-1049), while the remaining reflections are indexed to the rhombohedral α-Fe2O3 phase ICDD Card No. 01-086-2368). (b) Crystal structure representation of the α-Fe2O3/ZnFe2O4 showing the atomic arrangement of Zn, Fe, and O atoms.
Additionally, the diffraction peaks corresponding to the ZnFe2O4 spinel phase are observed at 2θ = 18.20°, 29.94°, 35.27°, 36.89°, 42.86°, 56.67°, 62.22°, 70.57°, 73.59°, and 89.04°, which correspond to the (111), (220), (311), (222), (400), (422), (511), (440), (620), (533), and (731) planes, respectively. These peaks are indexed to a cubic structure with 8.441A lattice parameters and an Fd-3m space group, consistent with the standard ICDD Card N° 01-082-1049.
The phase weight percentages were determined by Rietveld refinement of the XRD data, using refined scale factors and unit-cell parameters.
The crystallite size was found to be 66.49 nm for α-Fe2O3 phase and 50.37 nm for ZnFe2O4 phase respectively. Figure 1b presents schematic crystallographic representations of the rhombohedral α-Fe2O3 and cubic ZnFe2O4 structures generated using VESTA software from standard CIF data. This illustration is provided solely for visualization of the atomic arrangements of the identified phases and does not imply any interfacial structural coherence or epitaxial relationship.
2.1.2. SEM-EDS Analysis
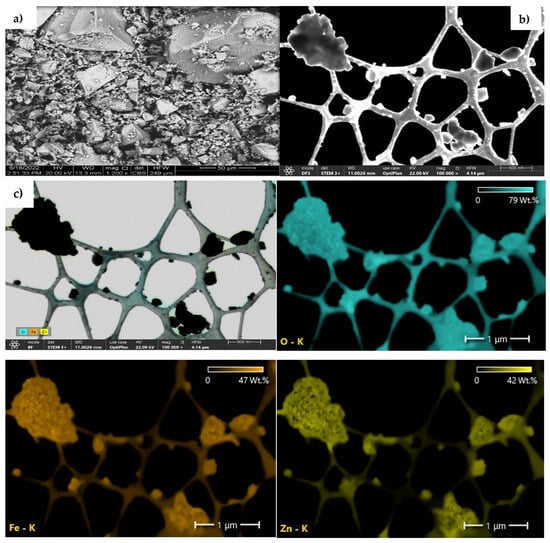
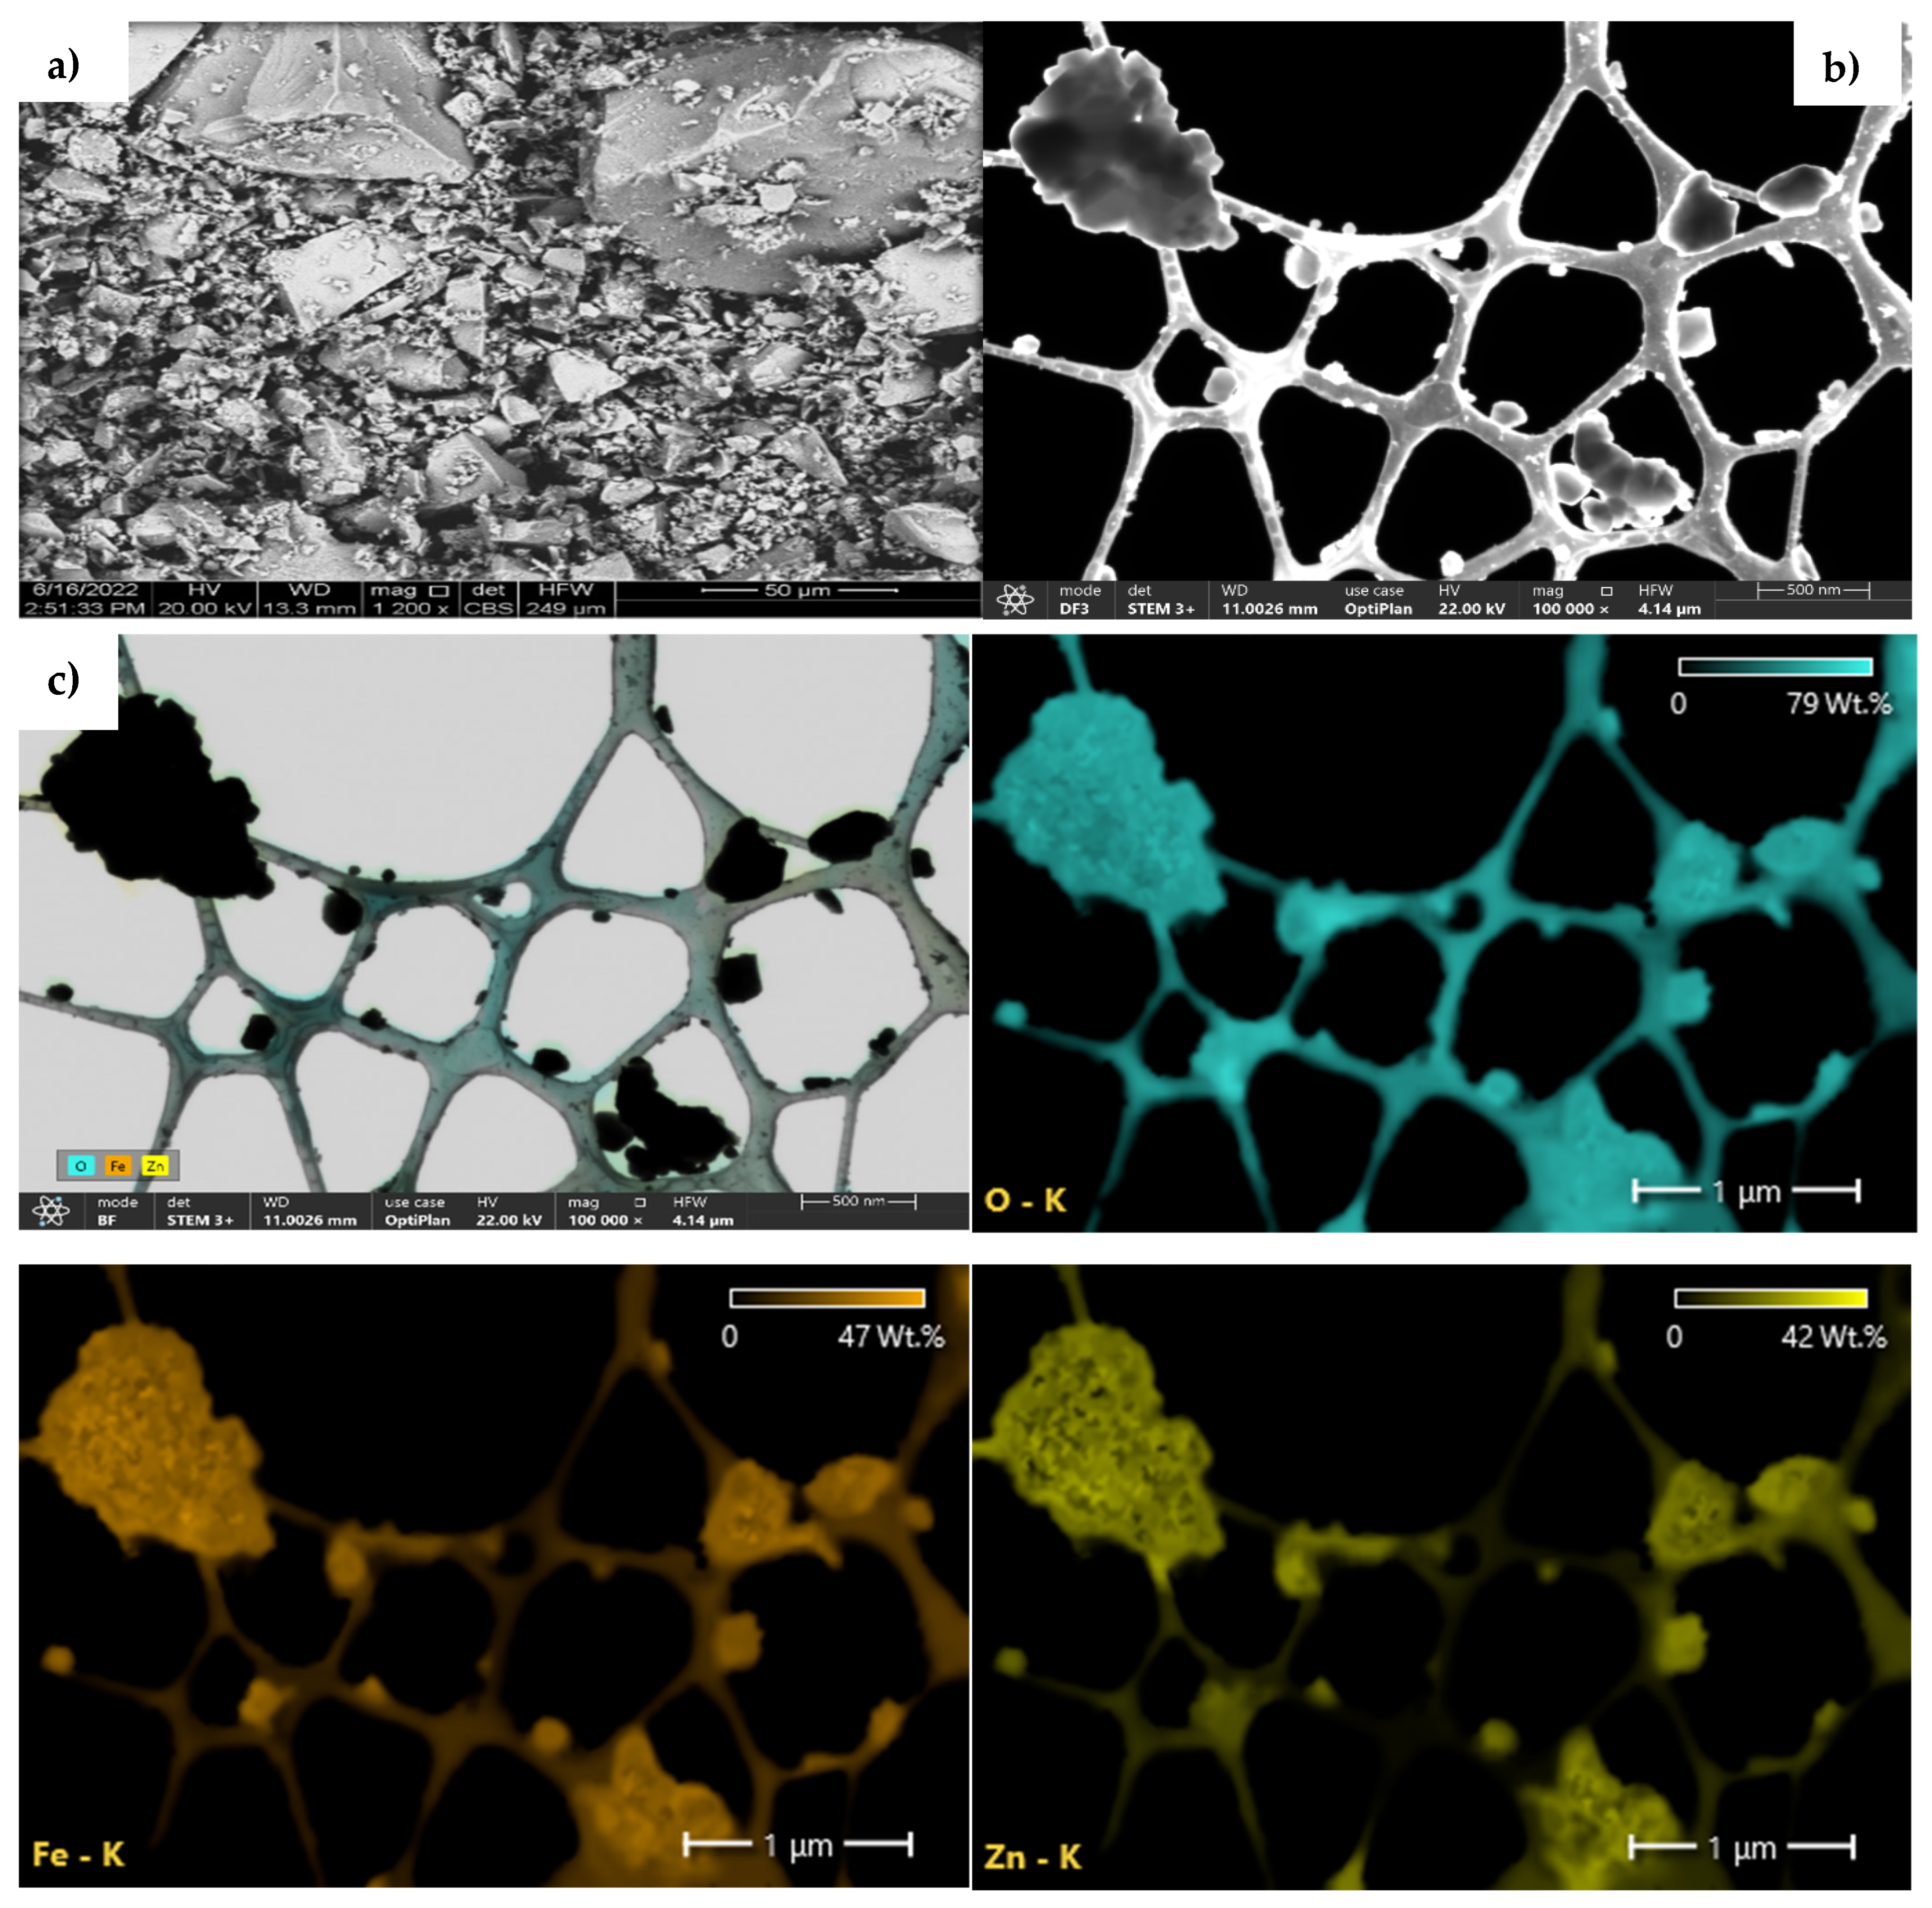
The morphology and elemental composition of the α-Fe2O3/ZnFe2O4 catalyst were thoroughly investigated using Scanning Electron Microscopy (SEM) and Energy-Dispersive X-ray (EDX) spectroscopy, as presented in Figure 2.
Figure 2.
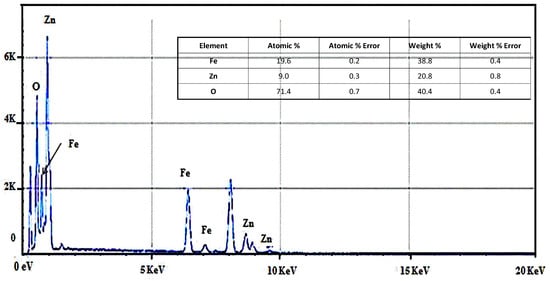
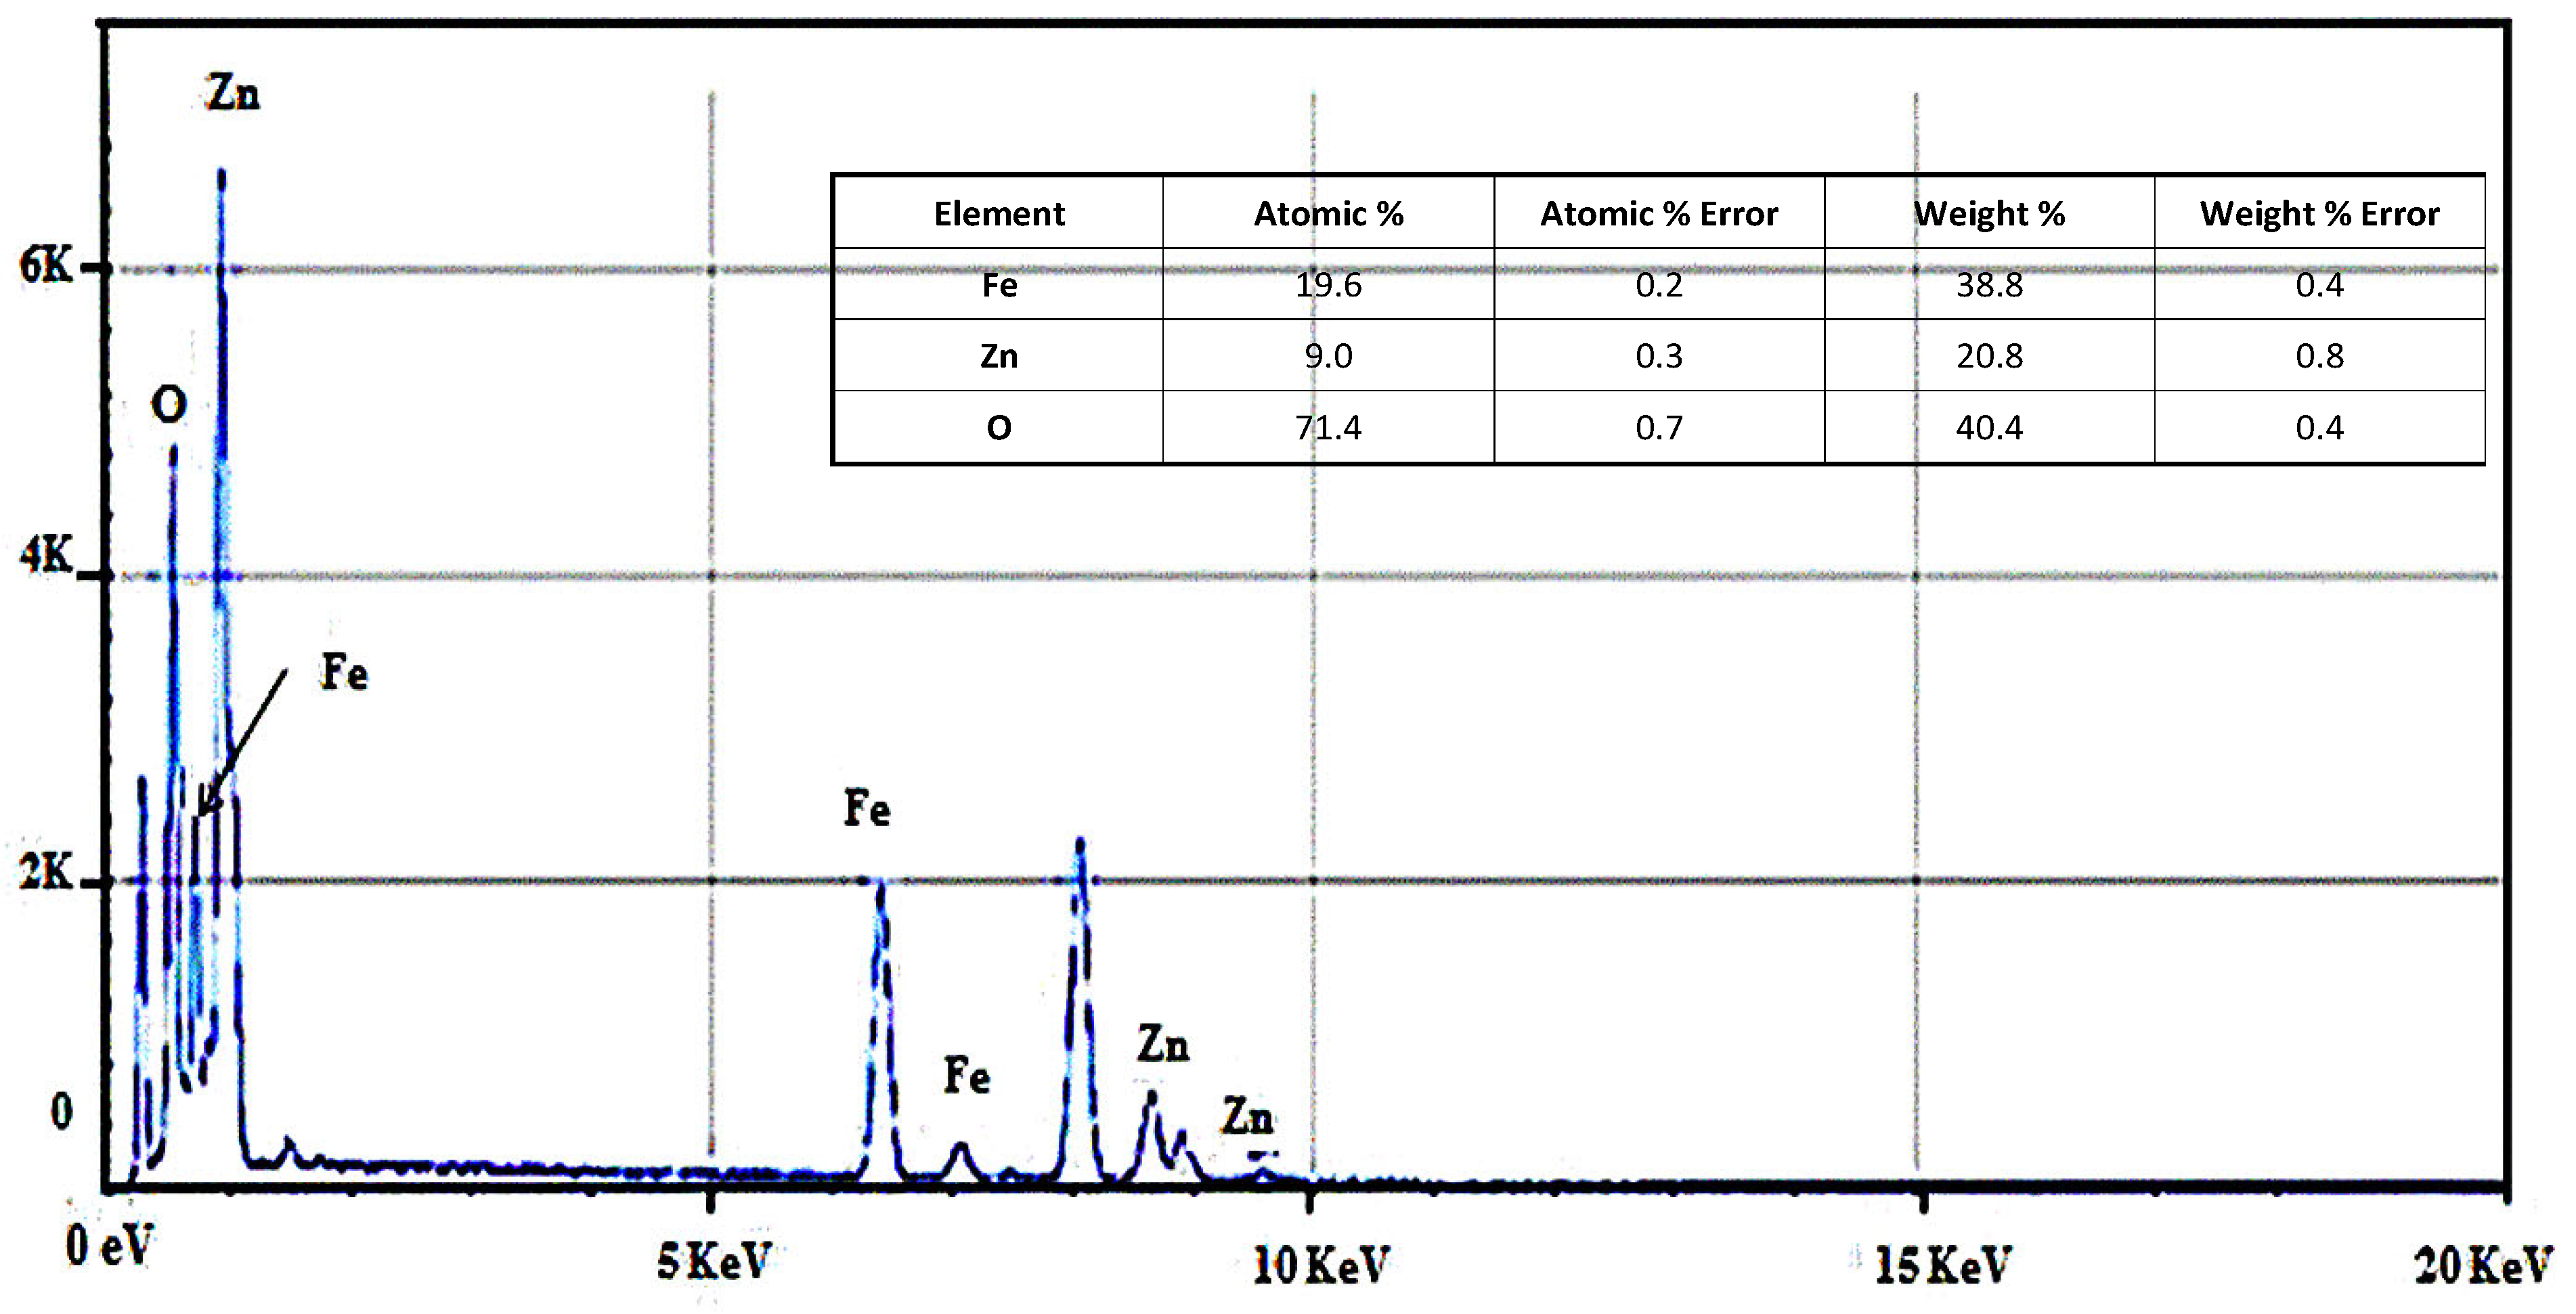
(a,b) SEM and FE-SEM images, (c) SEM-EDS elemental mapping and quantitative elemental composition of α-Fe2O3/ZnFe2O4.
As established in our previous study [7], hematite typically consists of well-connected fine particles that agglomerate into dense clusters of varying sizes. This characteristic is clearly observed in the present case (Figure 2a), where SEM images reveal a heterogeneous morphology characterized by irregular aggregates. This microstructure suggests the coexistence of two distinct phases within the heterosystem and indicates that significant aggregation occurred during synthesis, likely due to magnetic dipole–dipole interactions between nanoparticles.
High-magnification FE-SEM imaging (Figure 2b) shows a network of interconnected nanoparticles forming an open framework with visible interparticle voids. The observed texture exhibits features that can be described as multi-scale organization, arising from primary nanoparticles assembling into larger aggregates. However, it can be noted that the specific surface area reported for similar systems remains relatively low (e.g., 4.5 m2·g−1 in ref. [16]), indicating that the apparent porosity observed by SEM mainly corresponds to interparticle voids rather than to a highly developed intrinsic mesoporous structure.
EDX analyses performed on regions 1–4 (Figure S1) confirm that the distinct agglomerates correspond to the spinel ZnFe2O4 phase. The elemental mapping (Figure 2c), derived from the FE-SEM image, shows the presence of Fe, Zn, and O distributed throughout the analyzed region. The α-Fe2O3 phase forms a continuous matrix, within and onto which ZnFe2O4 particles are dispersed, suggesting intimate interfacial contact between the two phases.
Special care was taken in interpreting the EDS spectra, considering the possible contribution of the supporting grid and the presence of a low-energy peak in the spectrum. The compositional conclusions were therefore drawn from consistent mapping results and multiple analyzed regions to minimize potential artifacts.
Overall, the combined SEM and EDX analyses support the formation of an α-Fe2O3/ZnFe2O4 heterostructure with interconnected nanoparticle assemblies and effective phase contact, which is expected to favor interfacial charge transfer in photocatalytic applications.
2.1.3. PZC and Acid–Basic Properties
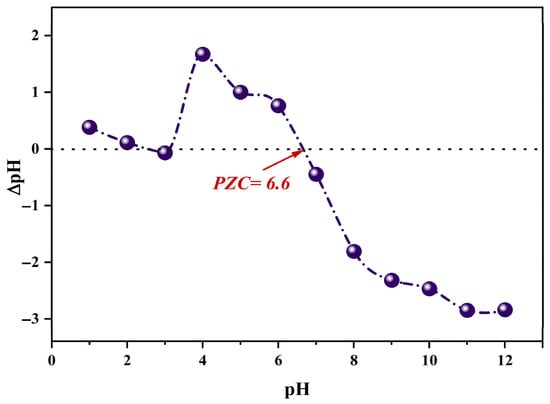
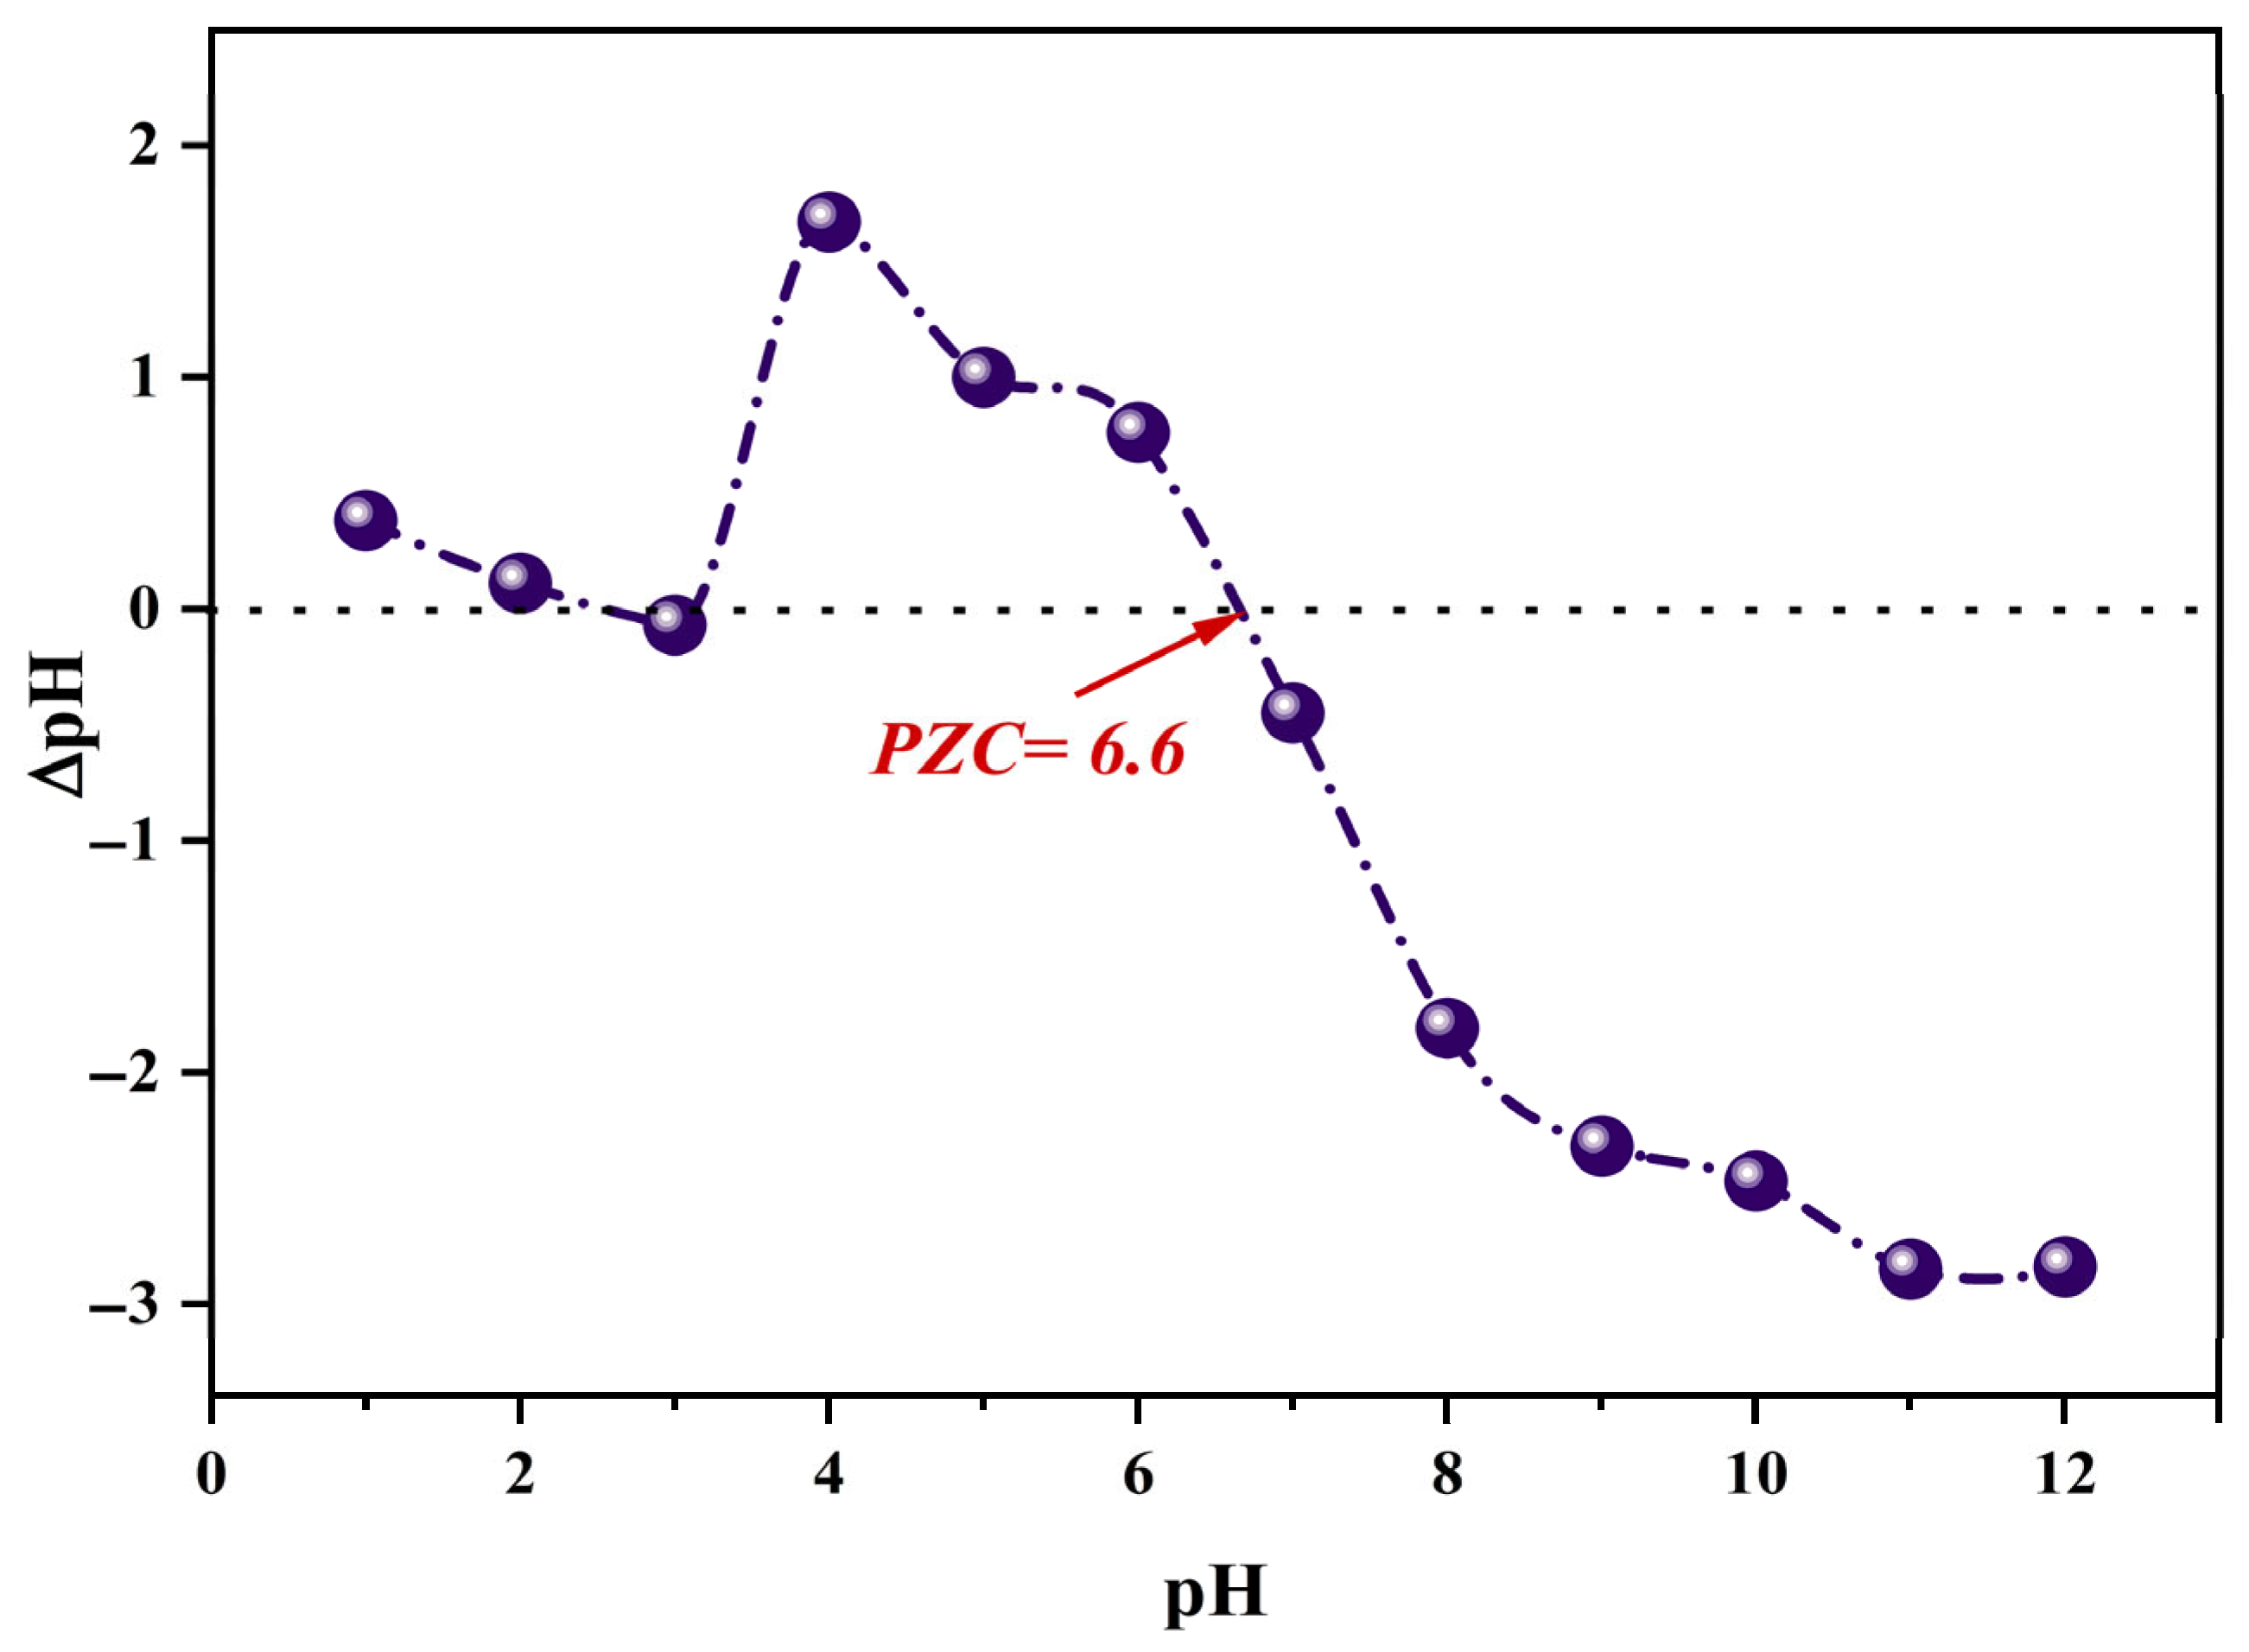
The point of zero charge (PZC) method was carried out to determine the net surface charge of the α-Fe2O3/ZnFe2O4 nanoparticles. The plot of Δ(pH) vs. initial pH for ferrite solid is depicted in Figure 3. The PZC value was found to be approximately 6.6. Above this value (pH > PZC), the surface of the α-Fe2O3/ZnFe2O4 nanoparticles becomes negatively charged. Consequently, cationic dyes such as MG and CV are more likely to adsorb at pH levels higher than 6.6, due to electrostatic attraction between the catalyst surface and the adsorbate molecules. Conversely, at pH values below 6.6 (pH < PZC), the surface charge of the nanoparticles becomes positive, which would be less favorable for such interaction.
Figure 3.
PZC plot of ZnFe2O4/α-Fe2O3 catalyst.
The surface acid–base properties of the as-prepared α-Fe2O3/ZnFe2O4 heterojunction were determined by applying CO2-TPD and NH3-TPD analysis. The CO2-TPD analysis (Table 1) revealed a total basic site concentration of 0.0077 mmol/g, with desorption maxima indicating the presence of basic sites of varying strength. In contrast, the NH3-TPD analysis showed no measurable desorption, confirming the absence of detectable Lewis acid sites. These results demonstrate that the heterojunction possesses a predominantly basic character with a low density of specific basic sites, a finding consistent with its point of zero charge (PZC = 6.6). This basic character is further contextualized by comparison with the parent material. Pristine hematite (α-Fe2O3) is reported to exhibit CO2 desorption at high temperatures, indicative of moderate-strength basic sites [36,37,38]. In contrast, the heterojunction displays a modified CO2-TPD profile. The observed shift in desorption temperature and the total basic site concentration (0.0077 mmol/g) suggest that the formation of the heterojunction alters the surface basicity. This modification is attributed to the integration of ZnFe2O4, which changes the local electronic environment and the nature of surface oxygen species, leading to a distinct distribution of Lewis basic sites compared to the individual oxides.
Table 1.
Total basic and acid sites concentrations determined through CO2-TPD and NH3-TPD measurements at α-Fe2O3/ZnFe2O4 surface.
2.1.4. Optical and Photoelectrochemical Properties
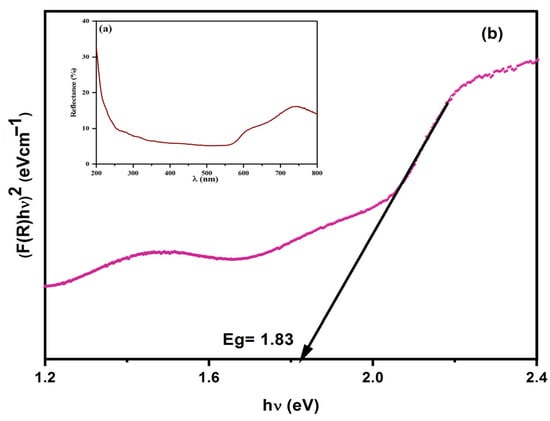
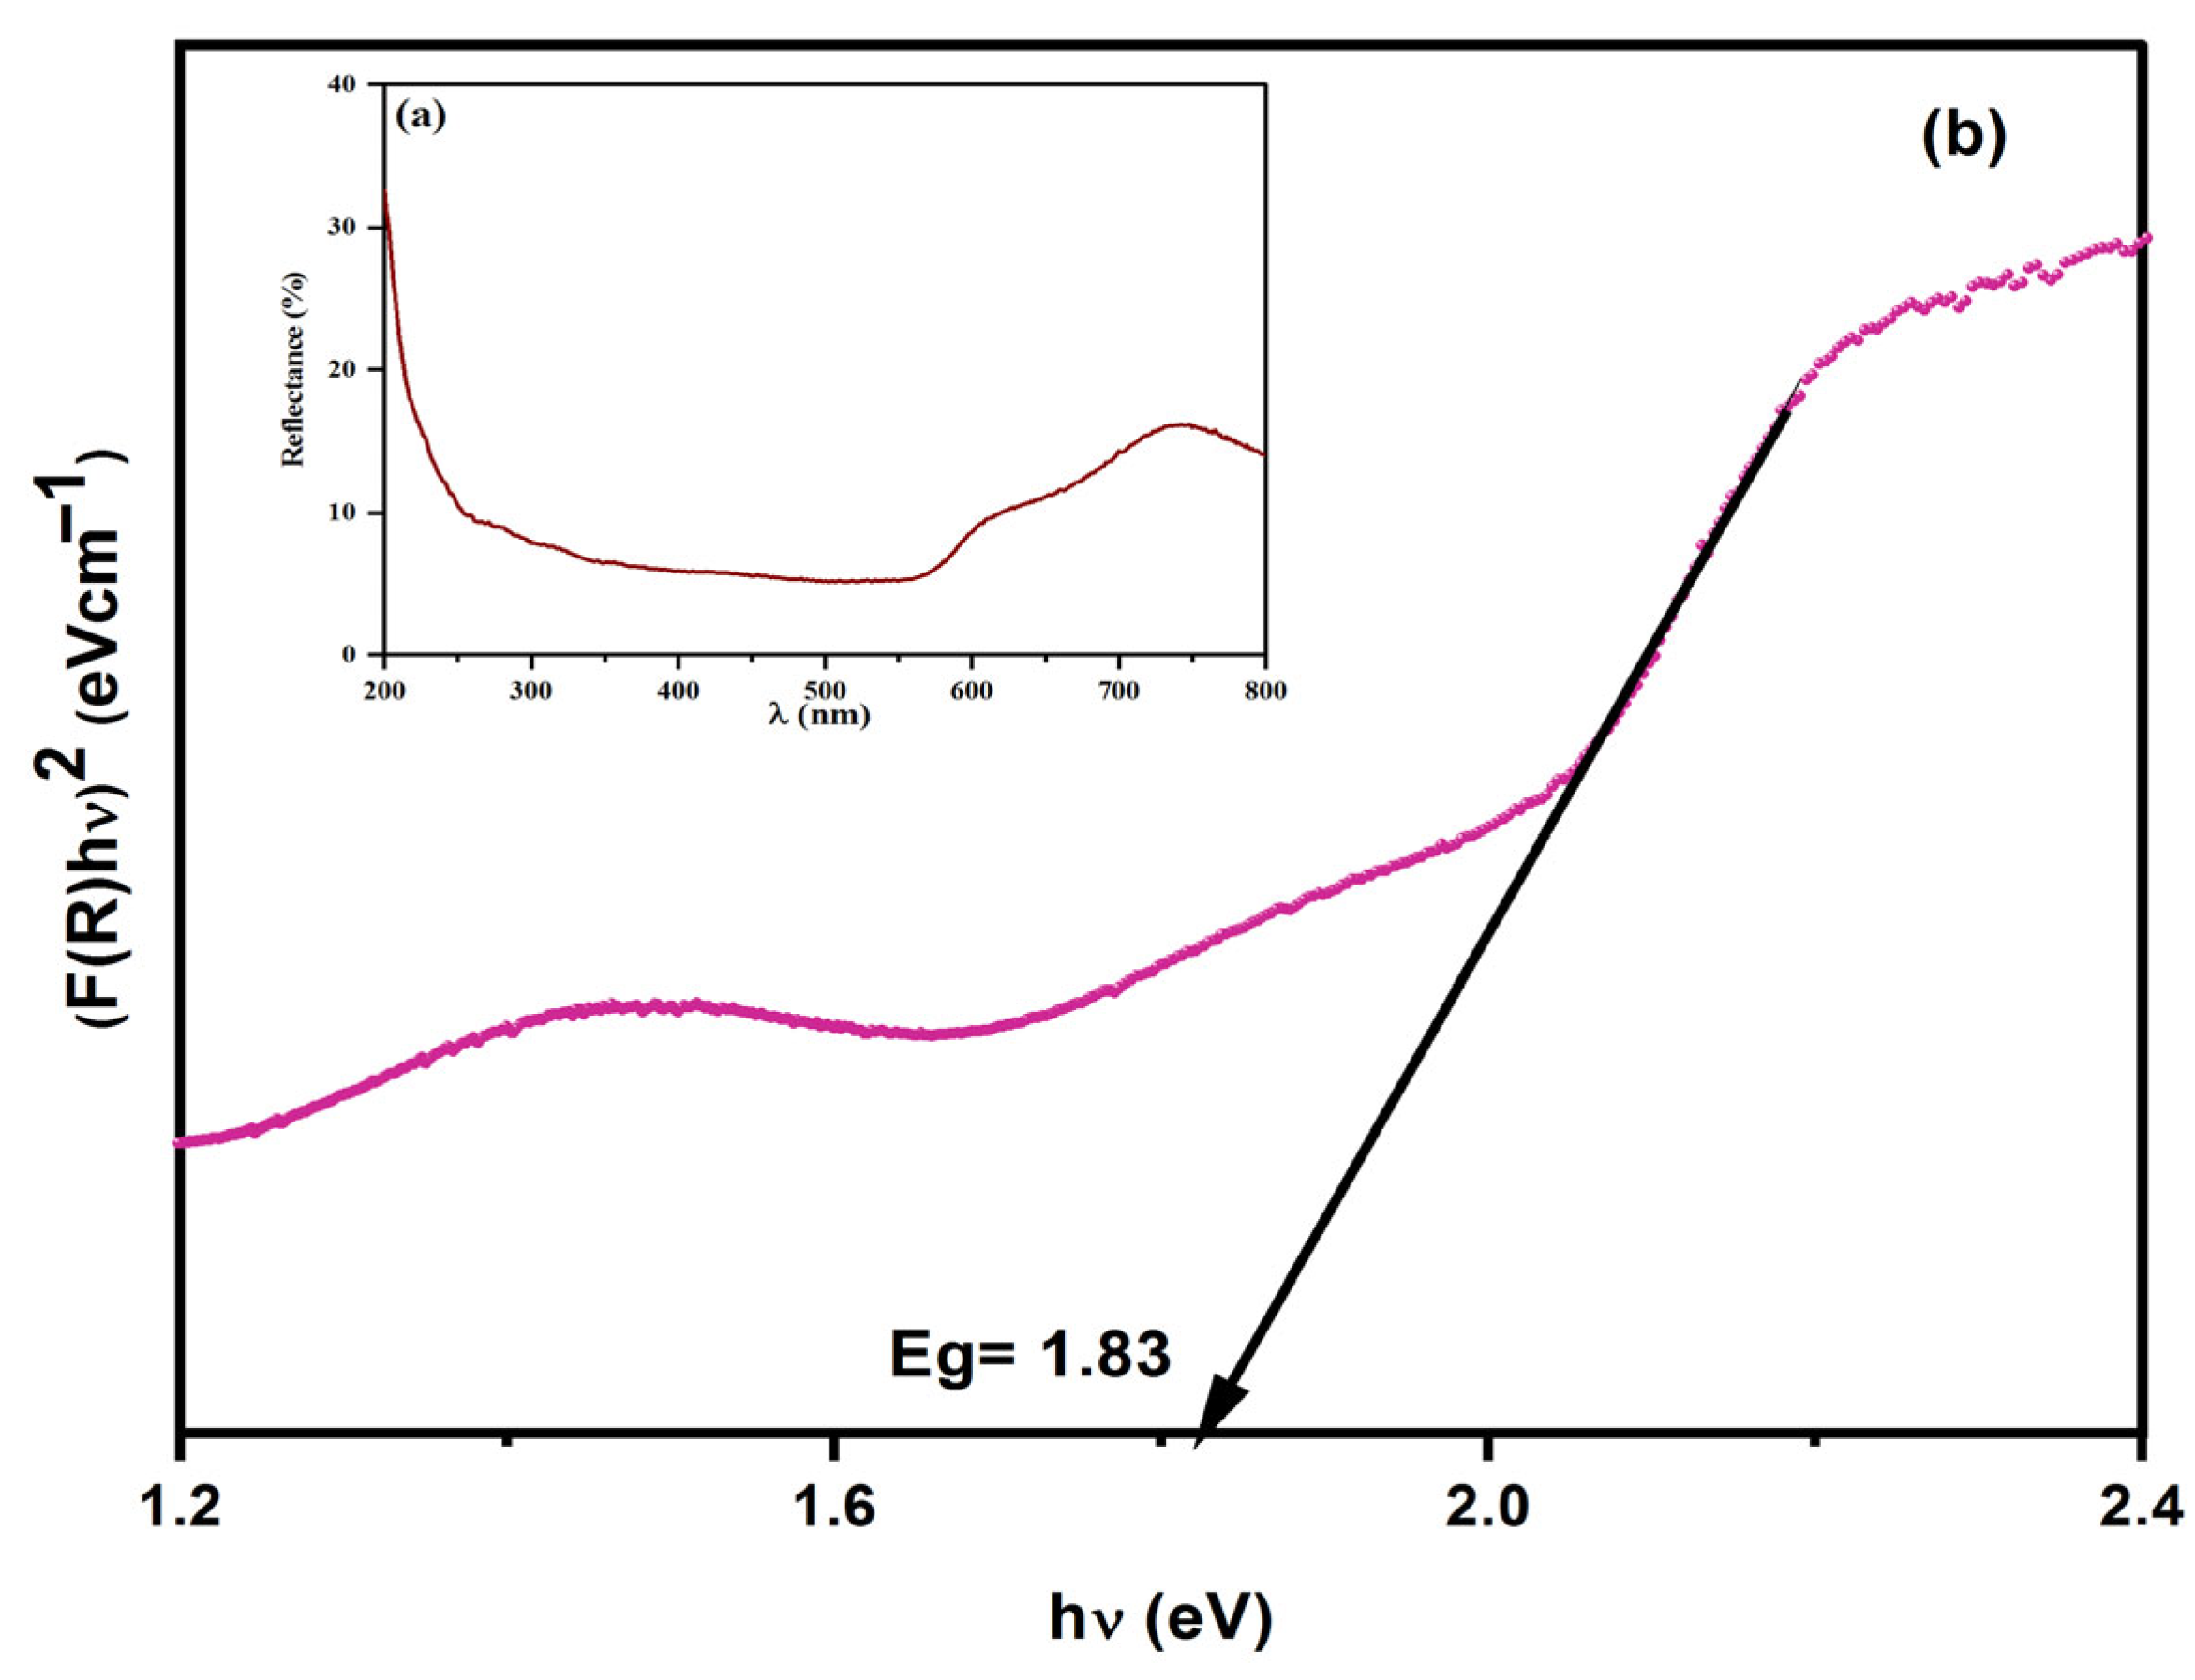
The optical properties of the α-Fe2O3/ZnFe2O4 sample were probed by UV–visible diffuse reflectance spectroscopy, as shown in Figure 4a,b. The Tauc plot analysis (Figure 4b) yielded an estimated optical bandgap of 1.83 eV for the heterosystem. This value is lower than the major phase, pristine α-Fe2O3 (2.1 eV), a well-established value corroborated by our previous work and consistent with the extensive literature for bulk hematite [28,39,40]. Concurrently, the heterosystem’s bandgap falls within the typical range reported for ZnFe2O4 (1.77–2.5), whose exact value is sensitive to the synthesis method.
Figure 4.
(a) UV-DRS and (b) Tauc plot of α-Fe2O3/ZnFe2O4 catalyst.
The specific value of 1.83 eV is a direct signature of the successful formation of the heterojunction and the strong electronic coupling at the α-Fe2O3/ZnFe2O4 interface, which creates a new electronic structure and, hence, contributes to the improved generation and separation of photogenerated charge carriers.
2.2. Adsorption Activity
2.2.1. pH Effect
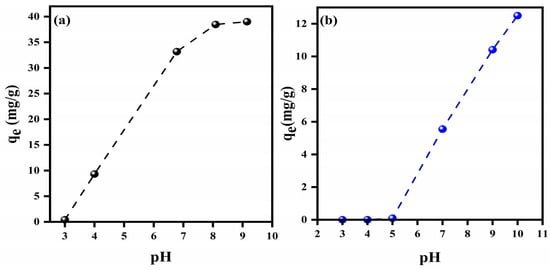
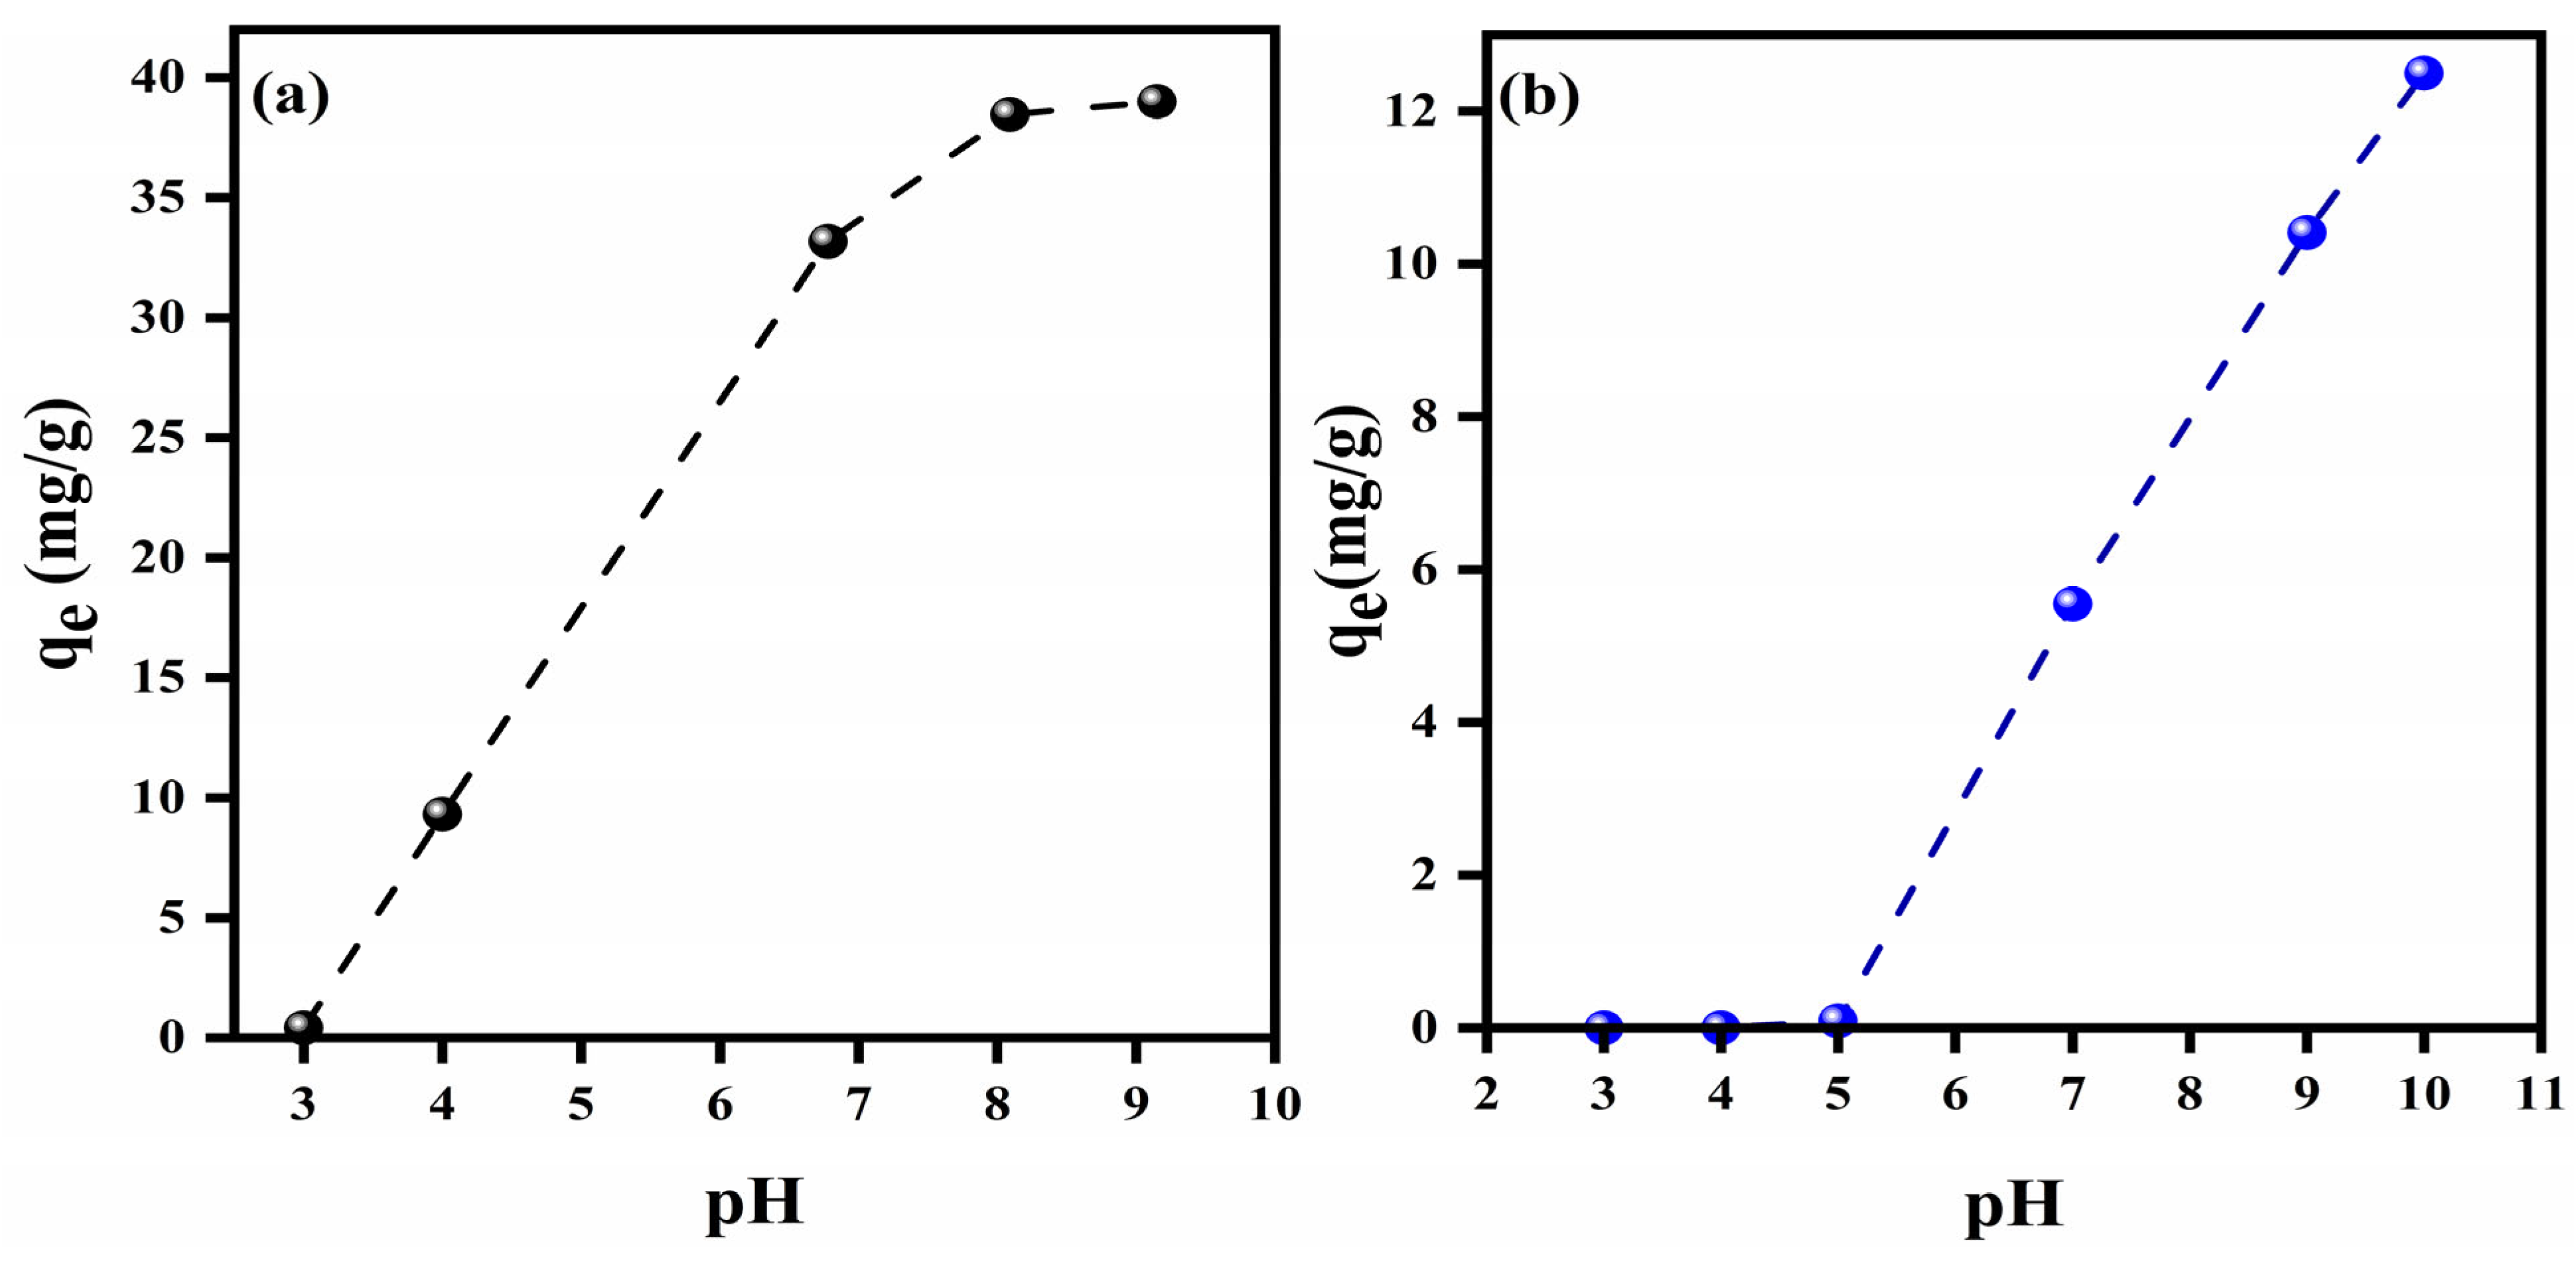
The pH of the system is a critical factor in the adsorption process due to its influence on both the adsorbent and the adsorbate [41]. The effect of the initial solution pH on adsorption capacity at equilibrium was investigated across a pH range of 3 to 10. As shown in Figure 5a, the adsorption capacity of MG increased significantly from 0.42 mg/g to 39 mg/g, with adsorption efficiency improving from 1.05% to 97.5% as the pH increased from 3.0 to 9.0. In contrast, the adsorption capacity of CV, as shown in Figure 5b, remained stable in the pH range of 3.0 to 5.0, then increased from 0.092 mg/g to 12.5 mg/g, with adsorption efficiency rising from 0.46% to 62.5% as the pH increased from 5.0 to 10.0. These results are consistent with the PZC (point of zero charge) and the acid–base properties of the α-Fe2O3/ZnFe2O4 catalyst. Based on these findings, the kinetic study was conducted at free pH for MG and at pH 10 for CV. The selection of these specific pH values was to ensure a sufficient and effective driving force for each dye. For MG, the natural pH (6.8) provides strong adsorption while avoiding the excessive surface coverage that occurs at highly basic pH, which can hinder light penetration and catalyst activation. For CV, pH 10 was chosen to maximize its adsorption affinity which is lower than that of MG.
Figure 5.
Effect of pH initial on the adsorption capacity of (a) MG and (b) CV onto α-Fe2O3/ZnFe2O4 catalyst [CMG = 40 mg/L (a), CCV = 20 mg/L (b), (T = 20 °C, rs/l = 1 g/L)].
2.2.2. Kinetic Study in Single System
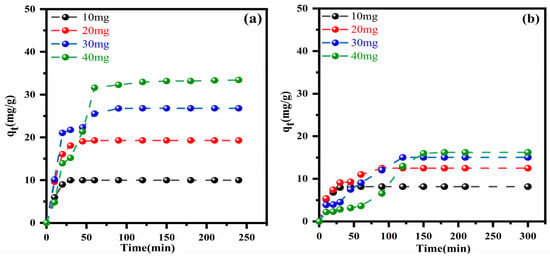
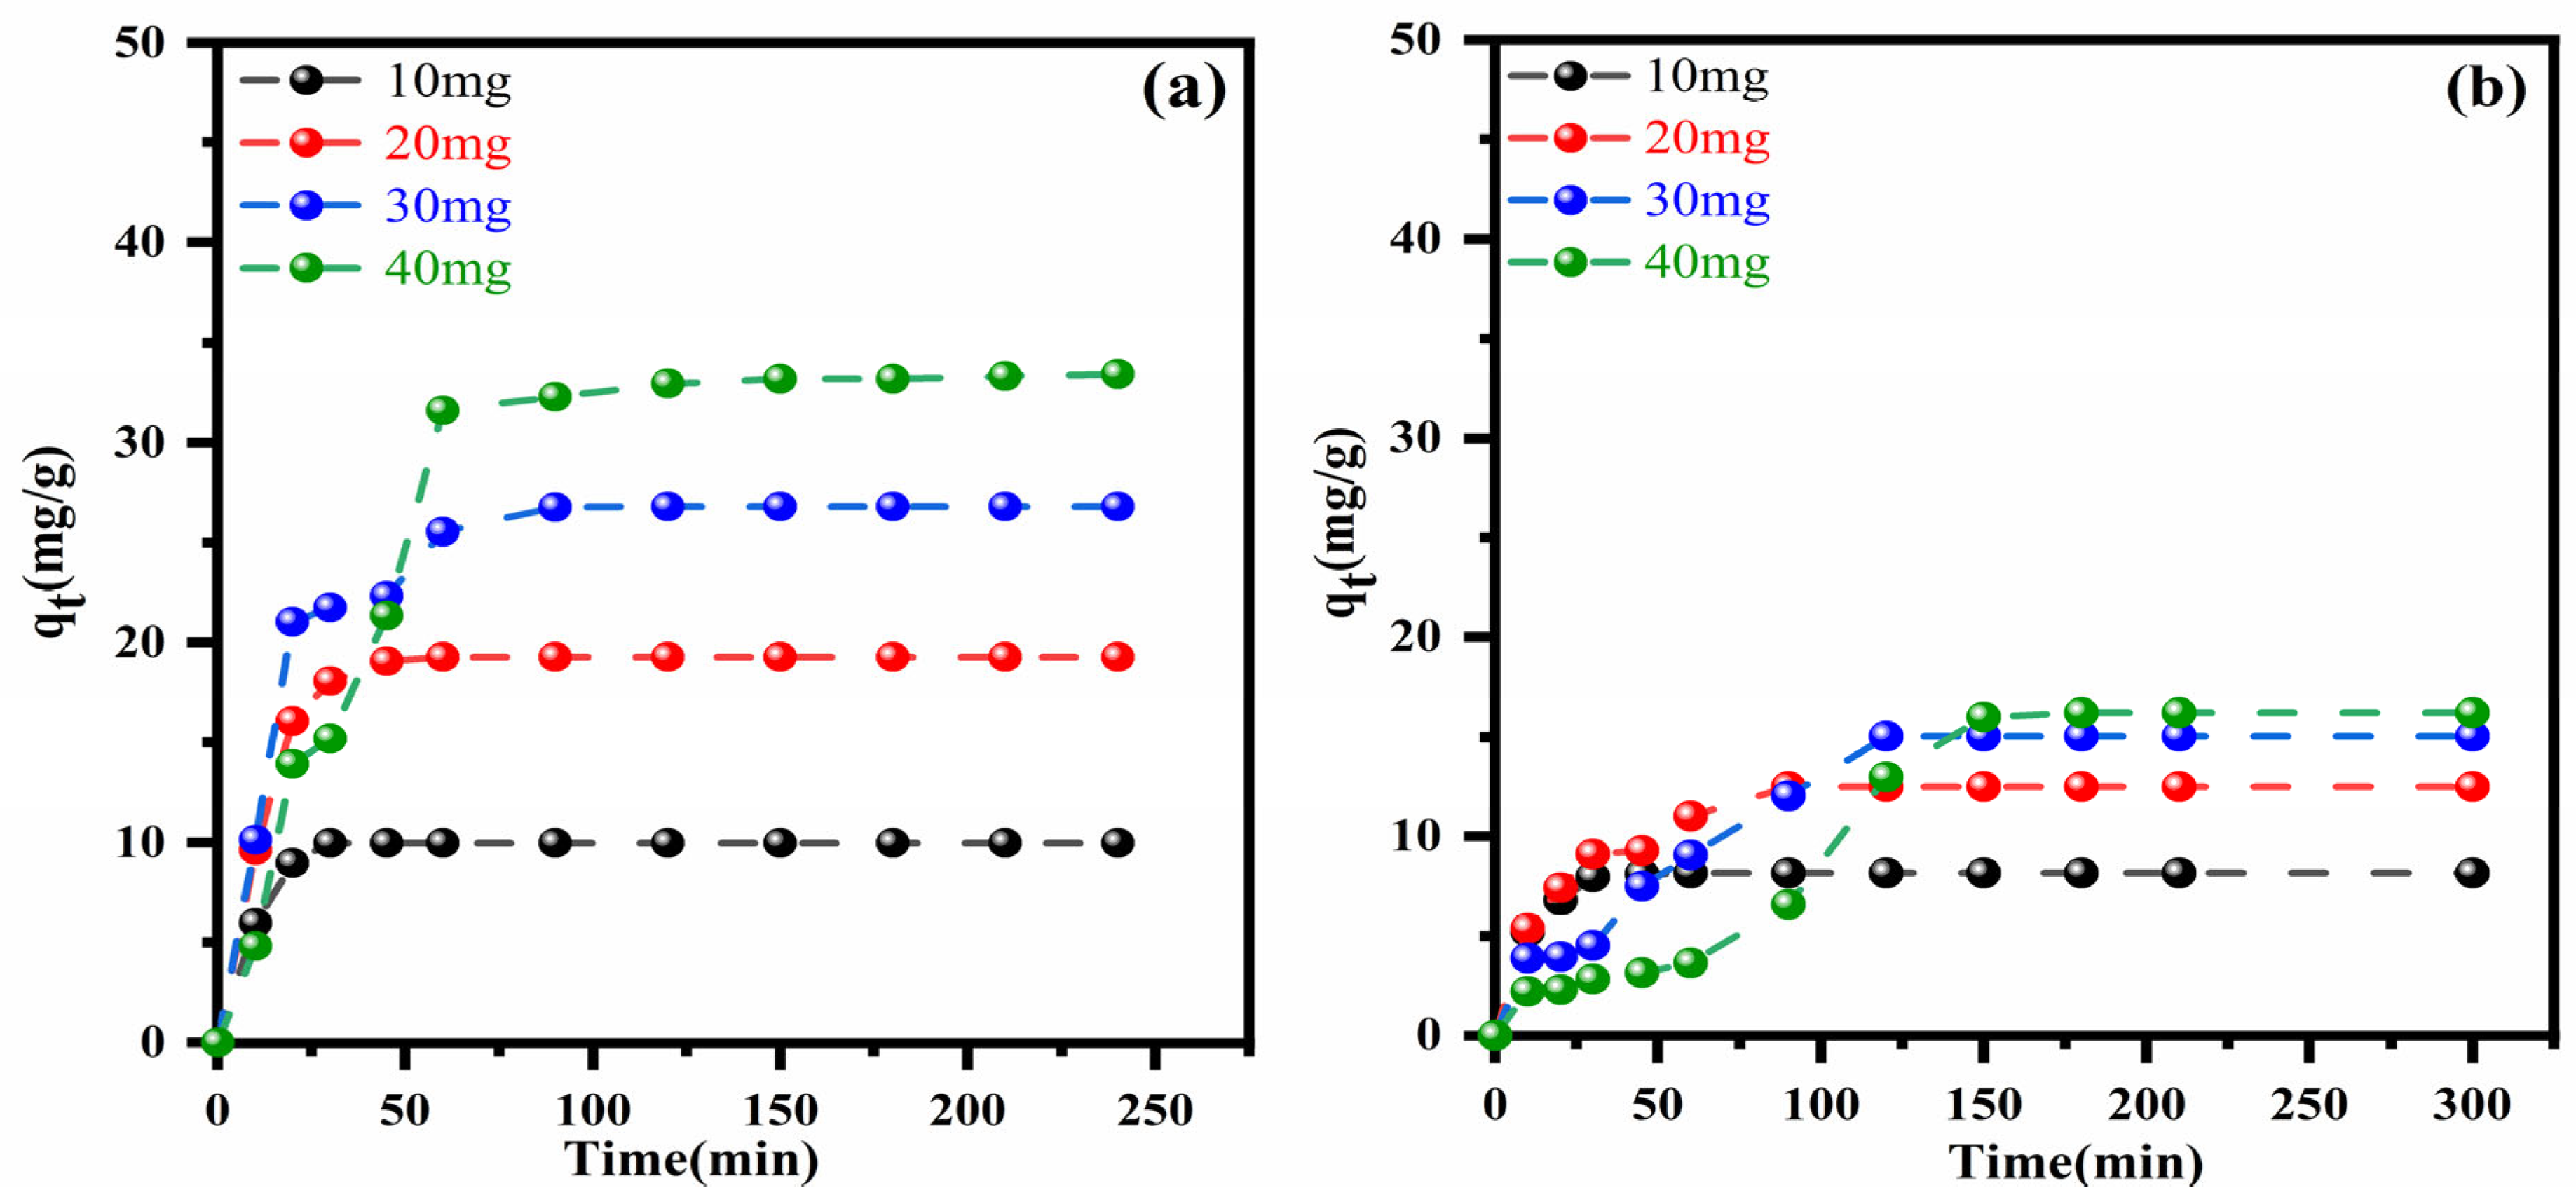
Adsorption tests were conducted using initial concentrations of 10, 20, 30, and 40 mg/L for MG and CV dyes separately. Figure 6 illustrates the variation for dye adsorbed (qt) over time for both MG and CV. The results indicate that the adsorption capacity of MG dye was both faster and higher than that of CV dye until equilibrium was reached. Furthermore, equilibrium times, adsorption capacities and adsorption efficiencies were found to depend on the initial dye concentrations. For MG, the equilibrium adsorption capacity rose from 9.97 mg/g to 33.4 mg/g, corresponding to adsorption efficiencies of 99.9% and 83.5% for initial concentrations of 10 mg/L and 40 mg/L, respectively. Likewise, for CV, the equilibrium adsorption capacity increased from 8.17 mg/g to 16.21 mg/g, with adsorption efficiencies of 81.7% and 40.55% for the same initial concentrations, respectively. These results clearly demonstrated a stronger adsorption affinity of α-Fe2O3/ZnFe2O4 catalyst for MG. This preferential affinity is attributed to a synergy of two factors: (1) a stronger non-specific electrostatic interaction due to the permanent dicationic charge (+2) conferred by the ethyl-dimethyl ammonium group (–N+(C2H5)(CH3)2) of MG, compared to the monocationic CV (+1); (2) a more effective specific chemical interaction with the surface Lewis basic sites (0.0077 mmol/g), as identified by CO2-TPD analysis. The molecular structure of MG likely facilitates superior coordination and surface complexation with these electron-donor sites.
Figure 6.
Adsorption kinetic of (a) MG (rs/l = 1 g/L, pH = 6.78, T = 20 ± 1 °C) and (b) CV (rs/l = 1 g/L, pH = 10, T = 20 ± 1 °C) onto α-Fe2O3/ZnFe2O4 catalyst.
2.2.3. Kinetic Study in Binary System
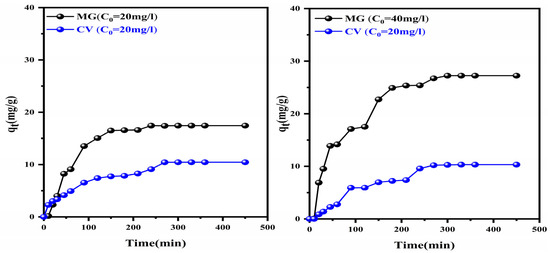
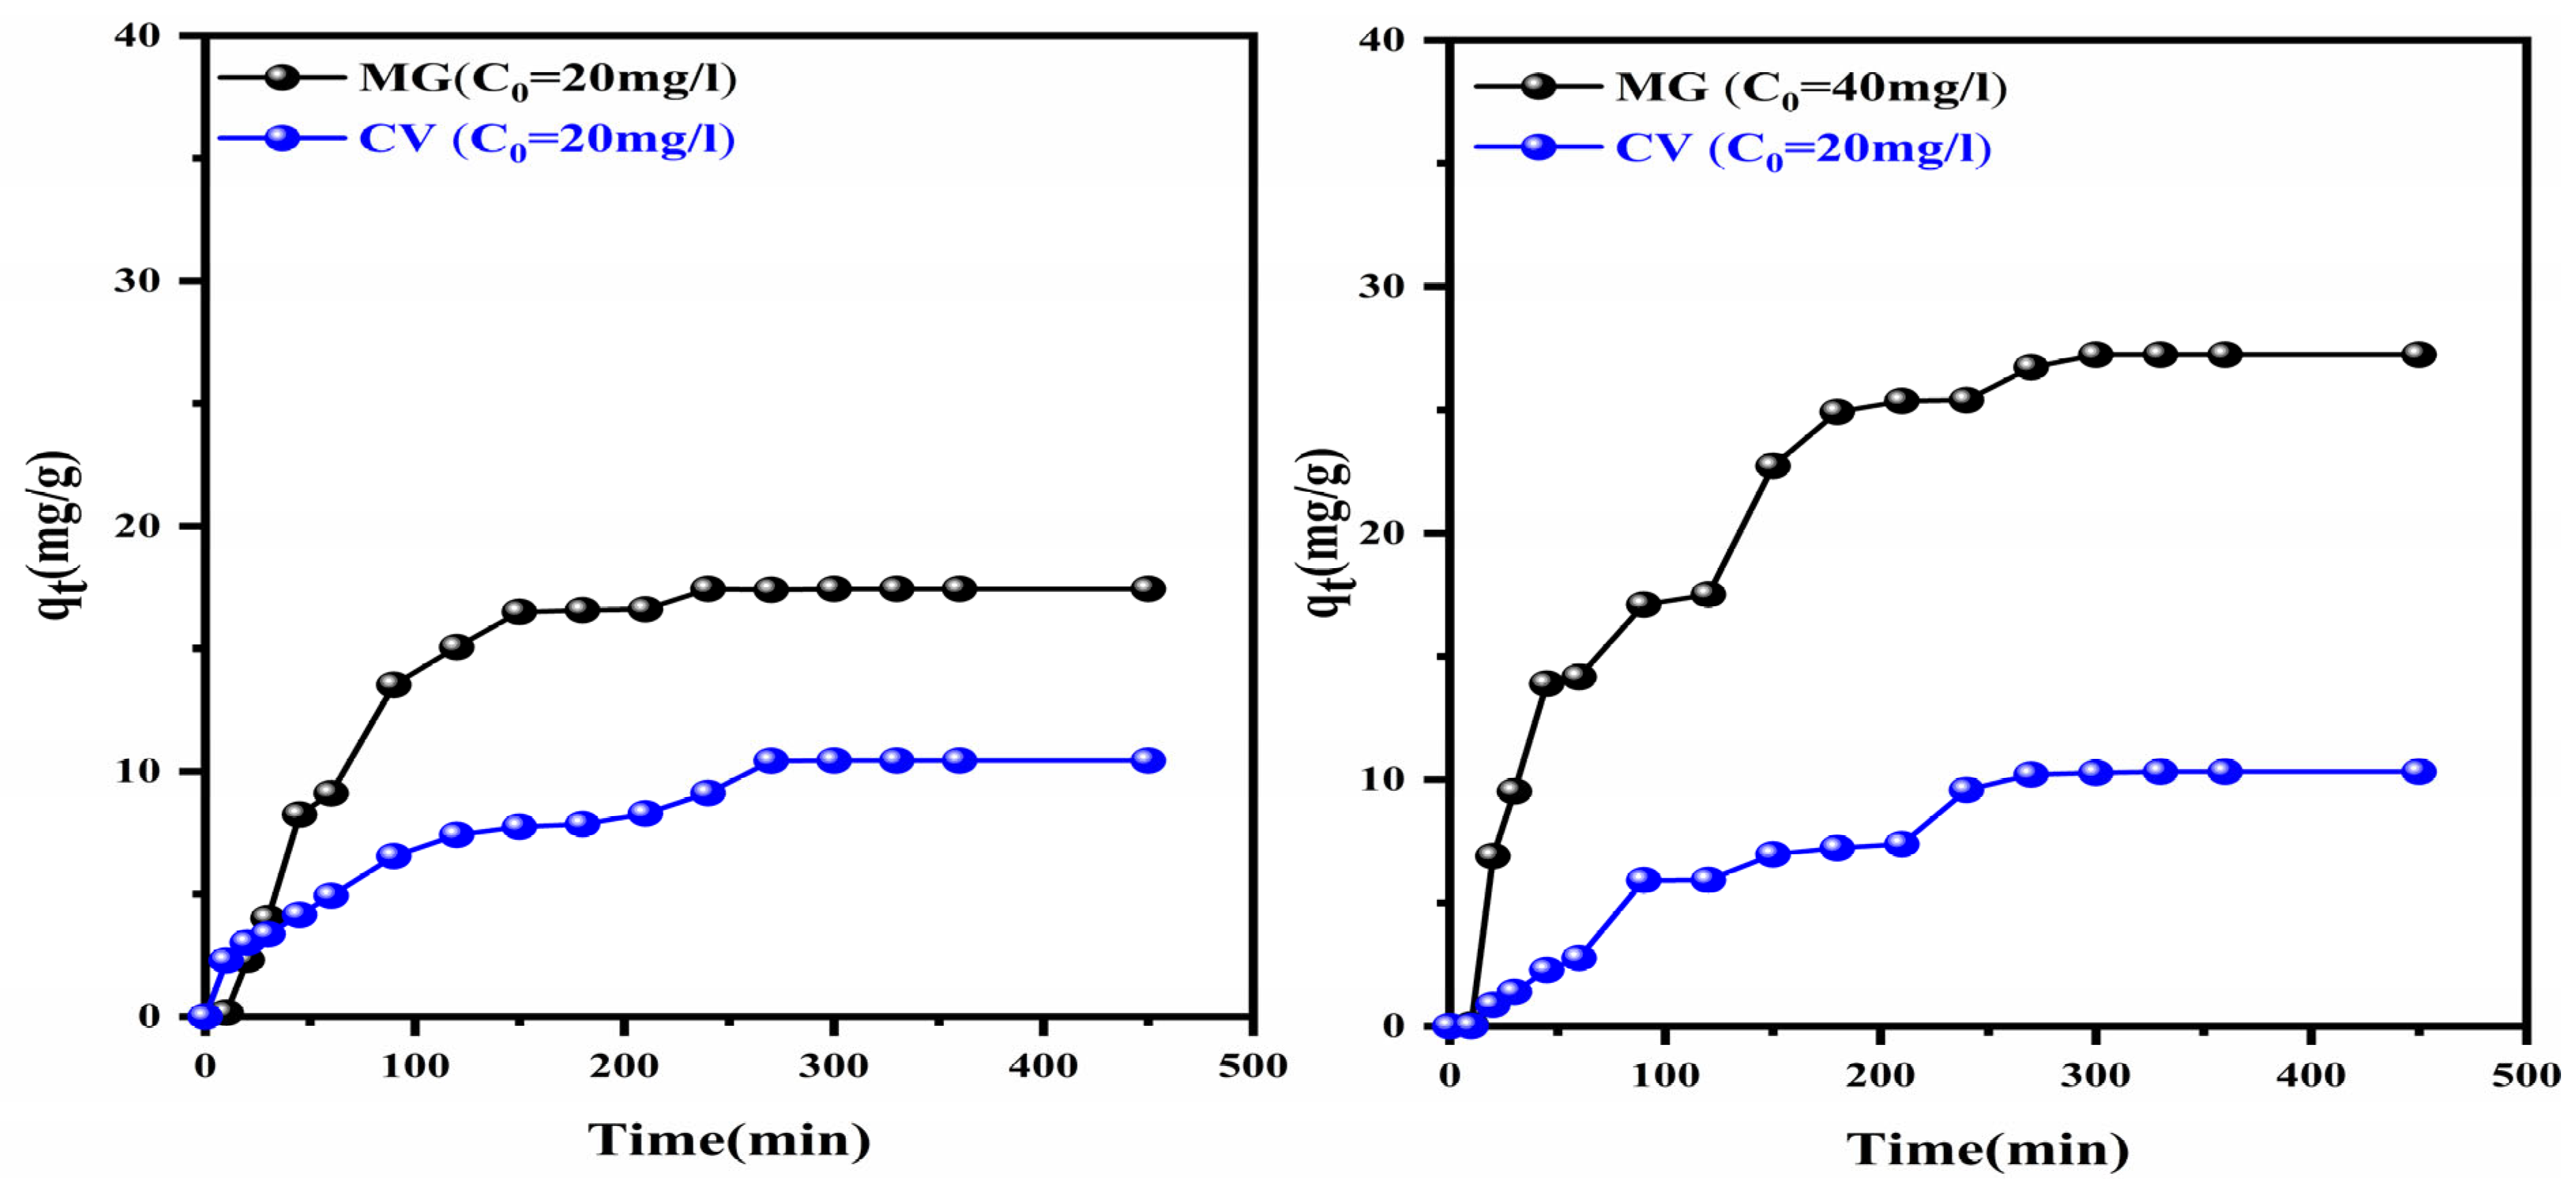
The adsorption kinetics of the dyes were further investigated in binary mixtures to evaluate competitive effects. Two scenarios were studied: an equimolar mixture (CMG and CV = 20 mg/L) and a non-equimolar mixture with excess MG (CMG and CCV = 40 and 20 mg/L) (Figure 7). The results show that the competitive environment influences the adsorption profile. In fact, the equilibrium times were extended to 240–270 min compared to that of the single-dye systems, indicating the mutual competition for active sites which slows down until equilibrium is reached. Furthermore, the adsorption efficiency depends on the initial dye concentration. The quantities adsorbed evolve more slowly until reaching equilibrium times with and a less efficient adsorption. The adsorption capacities at equilibrium increased from 17.44 mg/g to 26.73 mg/g for MG, with adsorption rate efficiencies of 87.2% and 68.1% at equilibrium times of 240 min and 270 min, respectively. However, the adsorption capacity at equilibrium remained approximately constant for CV at ~10 mg/g, with an adsorption rate efficiency of 51%, regardless of the mixture configuration, at an equilibrium time of 240 min.
Figure 7.
Adsorption kinetic of MG/CV mixture onto α-Fe2O3/ZnFe2O4 catalyst: [rS/L = 1, T = 22 ± 1 °C].
These results provide direct experimental evidence for competitive adsorption governed by the relative affinities of the dyes. The superior adsorption affinity of MG allows it to dominantly occupy the available adsorption sites.
2.2.4. Isotherm Study
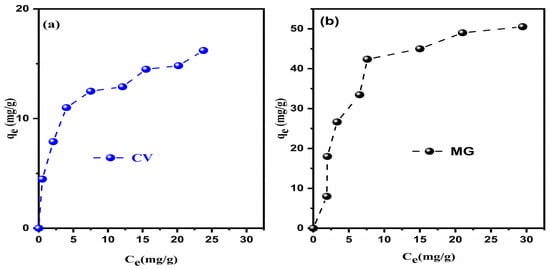
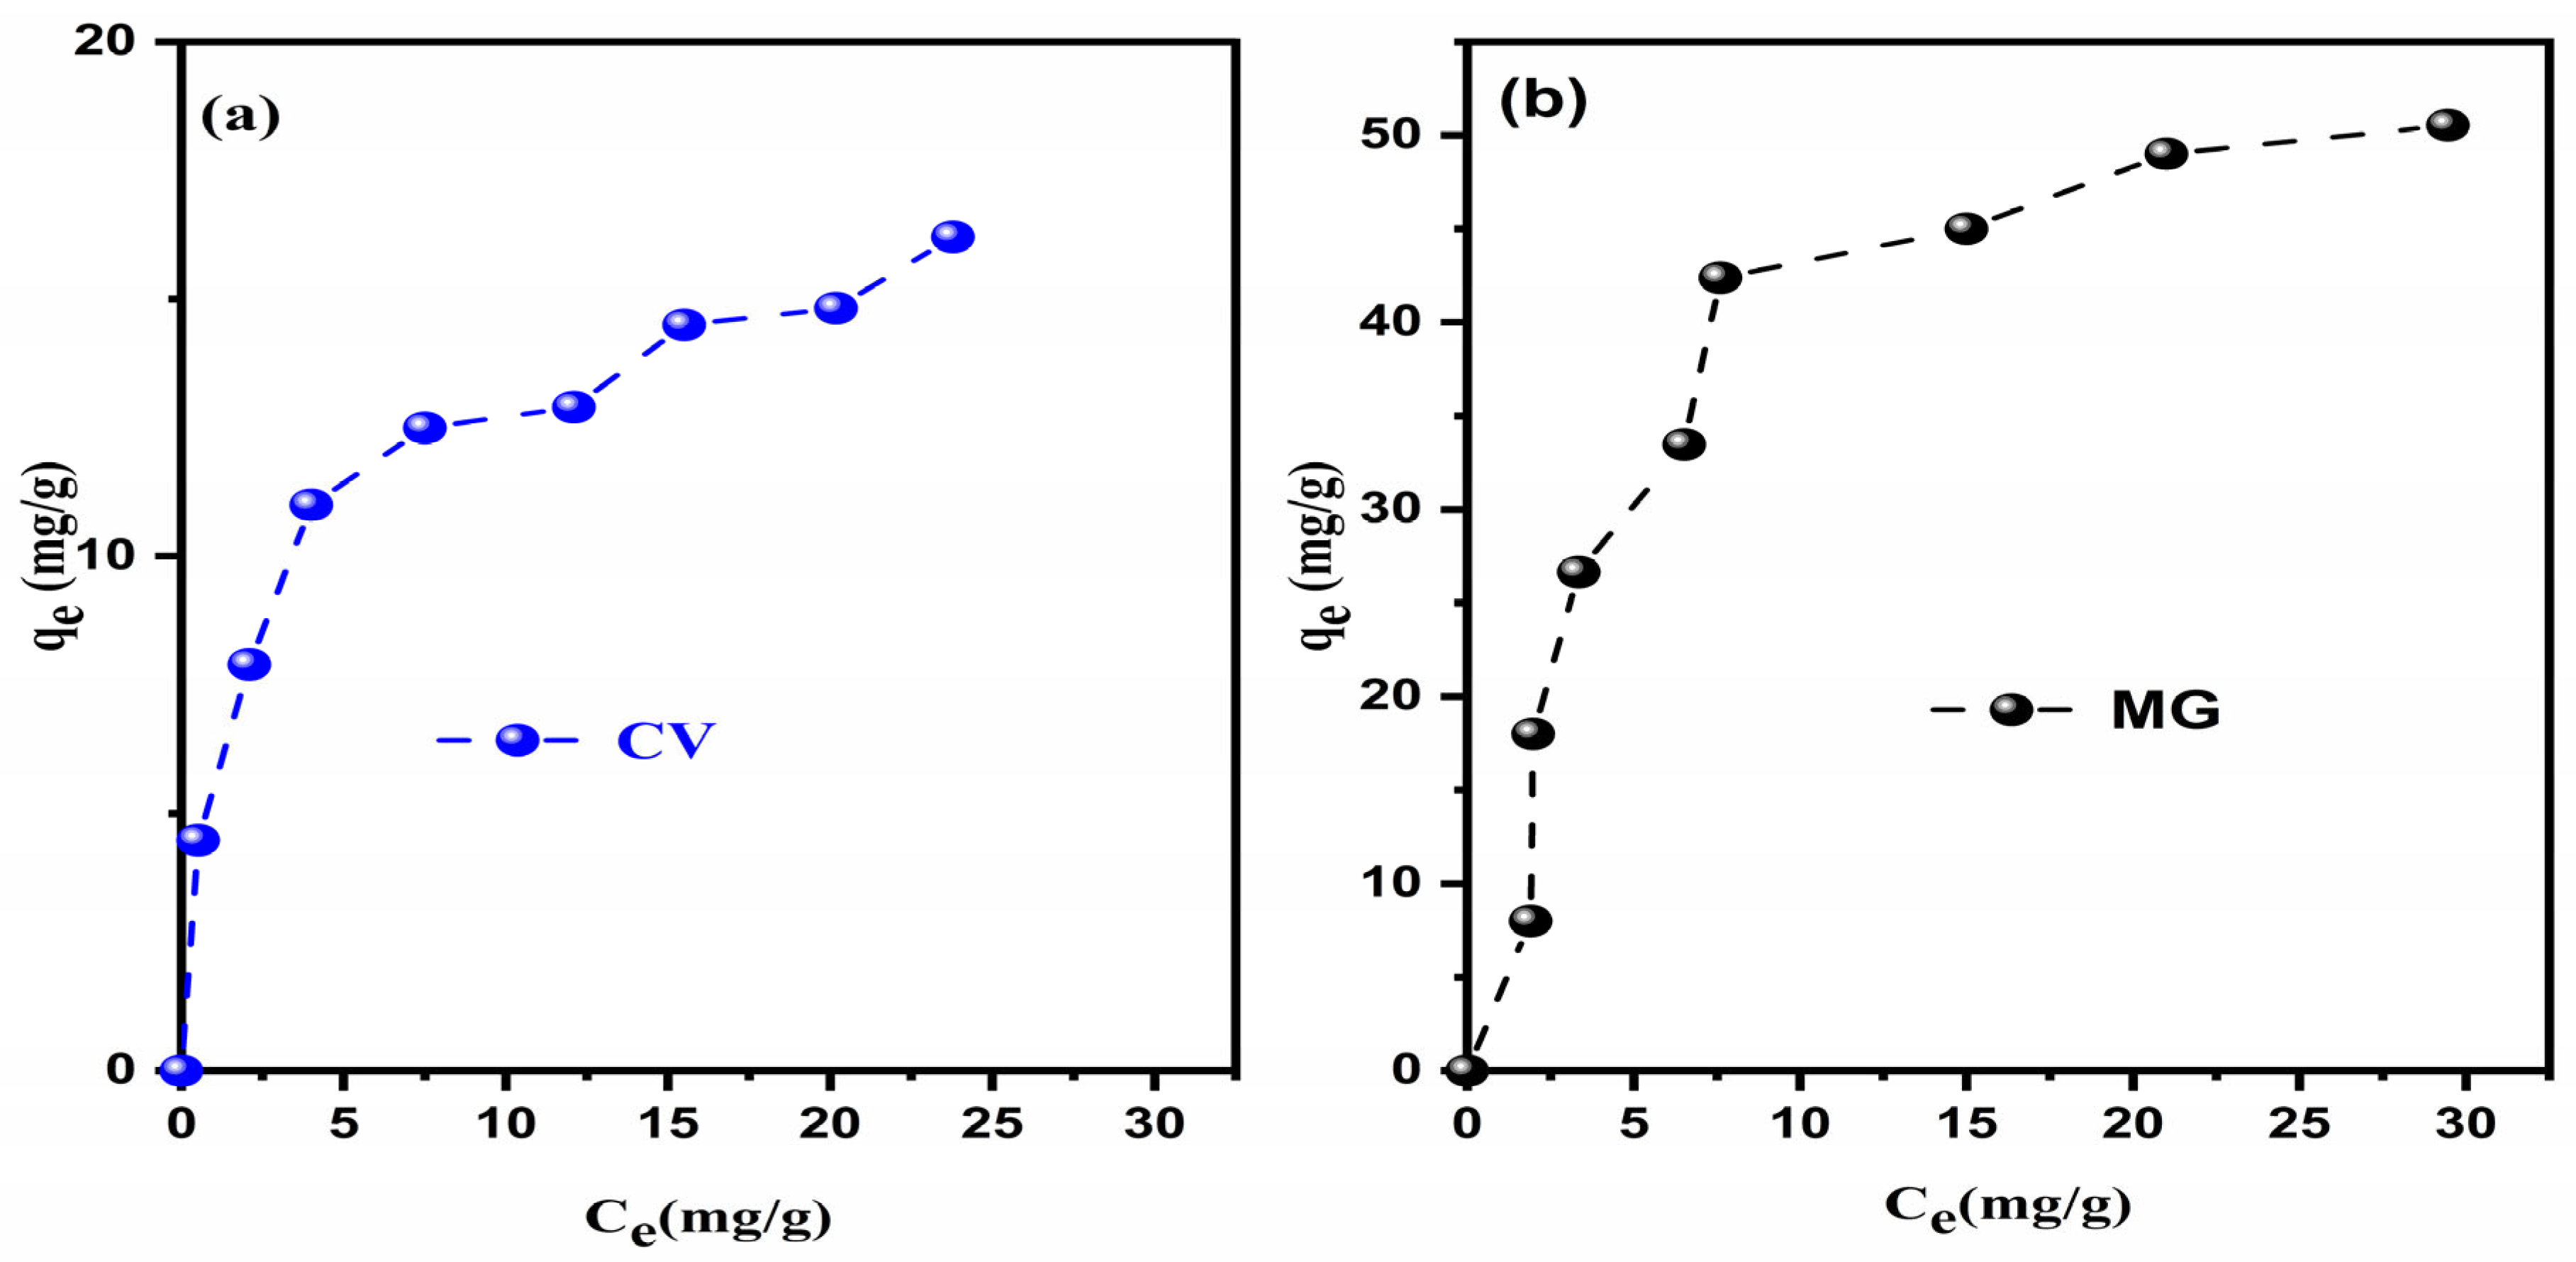
Linear forms of Langmuir and Freundlich isotherms models [42,43,44] were used to determine the most suitable model for describing the adsorption of MG and CV onto α-Fe2O3/ZnFe2O4 in separate solutions at 21 °C (Figure 8). Table 2 summarizes the corresponding isotherm equations and their correlation coefficients (R2). Based on the R2 values, the Langmuir II linear isotherm model was identified as the most appropriate to describe experimental data. This indicates that the adsorption of the dyes occurs in a monolayer on the catalyst surface. However, the Langmuir parameters suggest distinct adsorption mechanisms for the two dyes. For MG, the high qm (maximum adsorption capacity) and KL values suggest a hybrid process combining high-capacity electrostatic attraction of the dication to the negative charge of the catalyst surface with specific coordination to surface Lewis basic sites. Conversely, CV adsorption is consistent with a predominantly single-mode electrostatic-driven process, with minimal contribution from specific chemisorption.
Figure 8.
Adsorption isotherm of (a) CV and (b) MG dyes: [rs/l = 1 g/L, T = 21 °C, pHCv = 10 ± 0.3, pHMG = 6.67 ± 0.5, ts = 180 min].
Table 2.
Isotherm models and correlation coefficients (R2) for adsorption of MG onto α Fe2O3/ZnFe2O4 catalyst.
Where qm and KL are the maximum amount adsorbed capacity (mg·g−1) and Langmuir constant related to adsorption bonding energy respectively, qe is adsorbed amount at equilibrium (mg·g−1), Ce is the concentration equilibrium (mg/L), and Kf and n are Freundlich Constant related to the sorption capacity and constant related to the adsorption intensity, respectively.
2.3. Photocatalytic Degradation Activity
The photocatalytic performance of α-Fe2O3/ZnFe2O4 was evaluated through the photodegradation of MG and CV dyes individually and in mixture under a natural solar irradiation.
2.3.1. Photodegradation in Single System
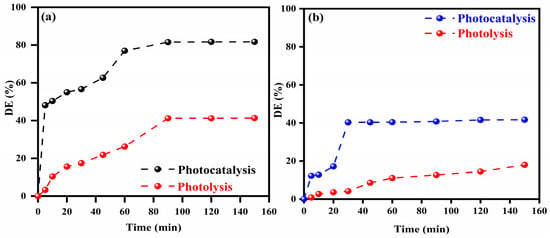
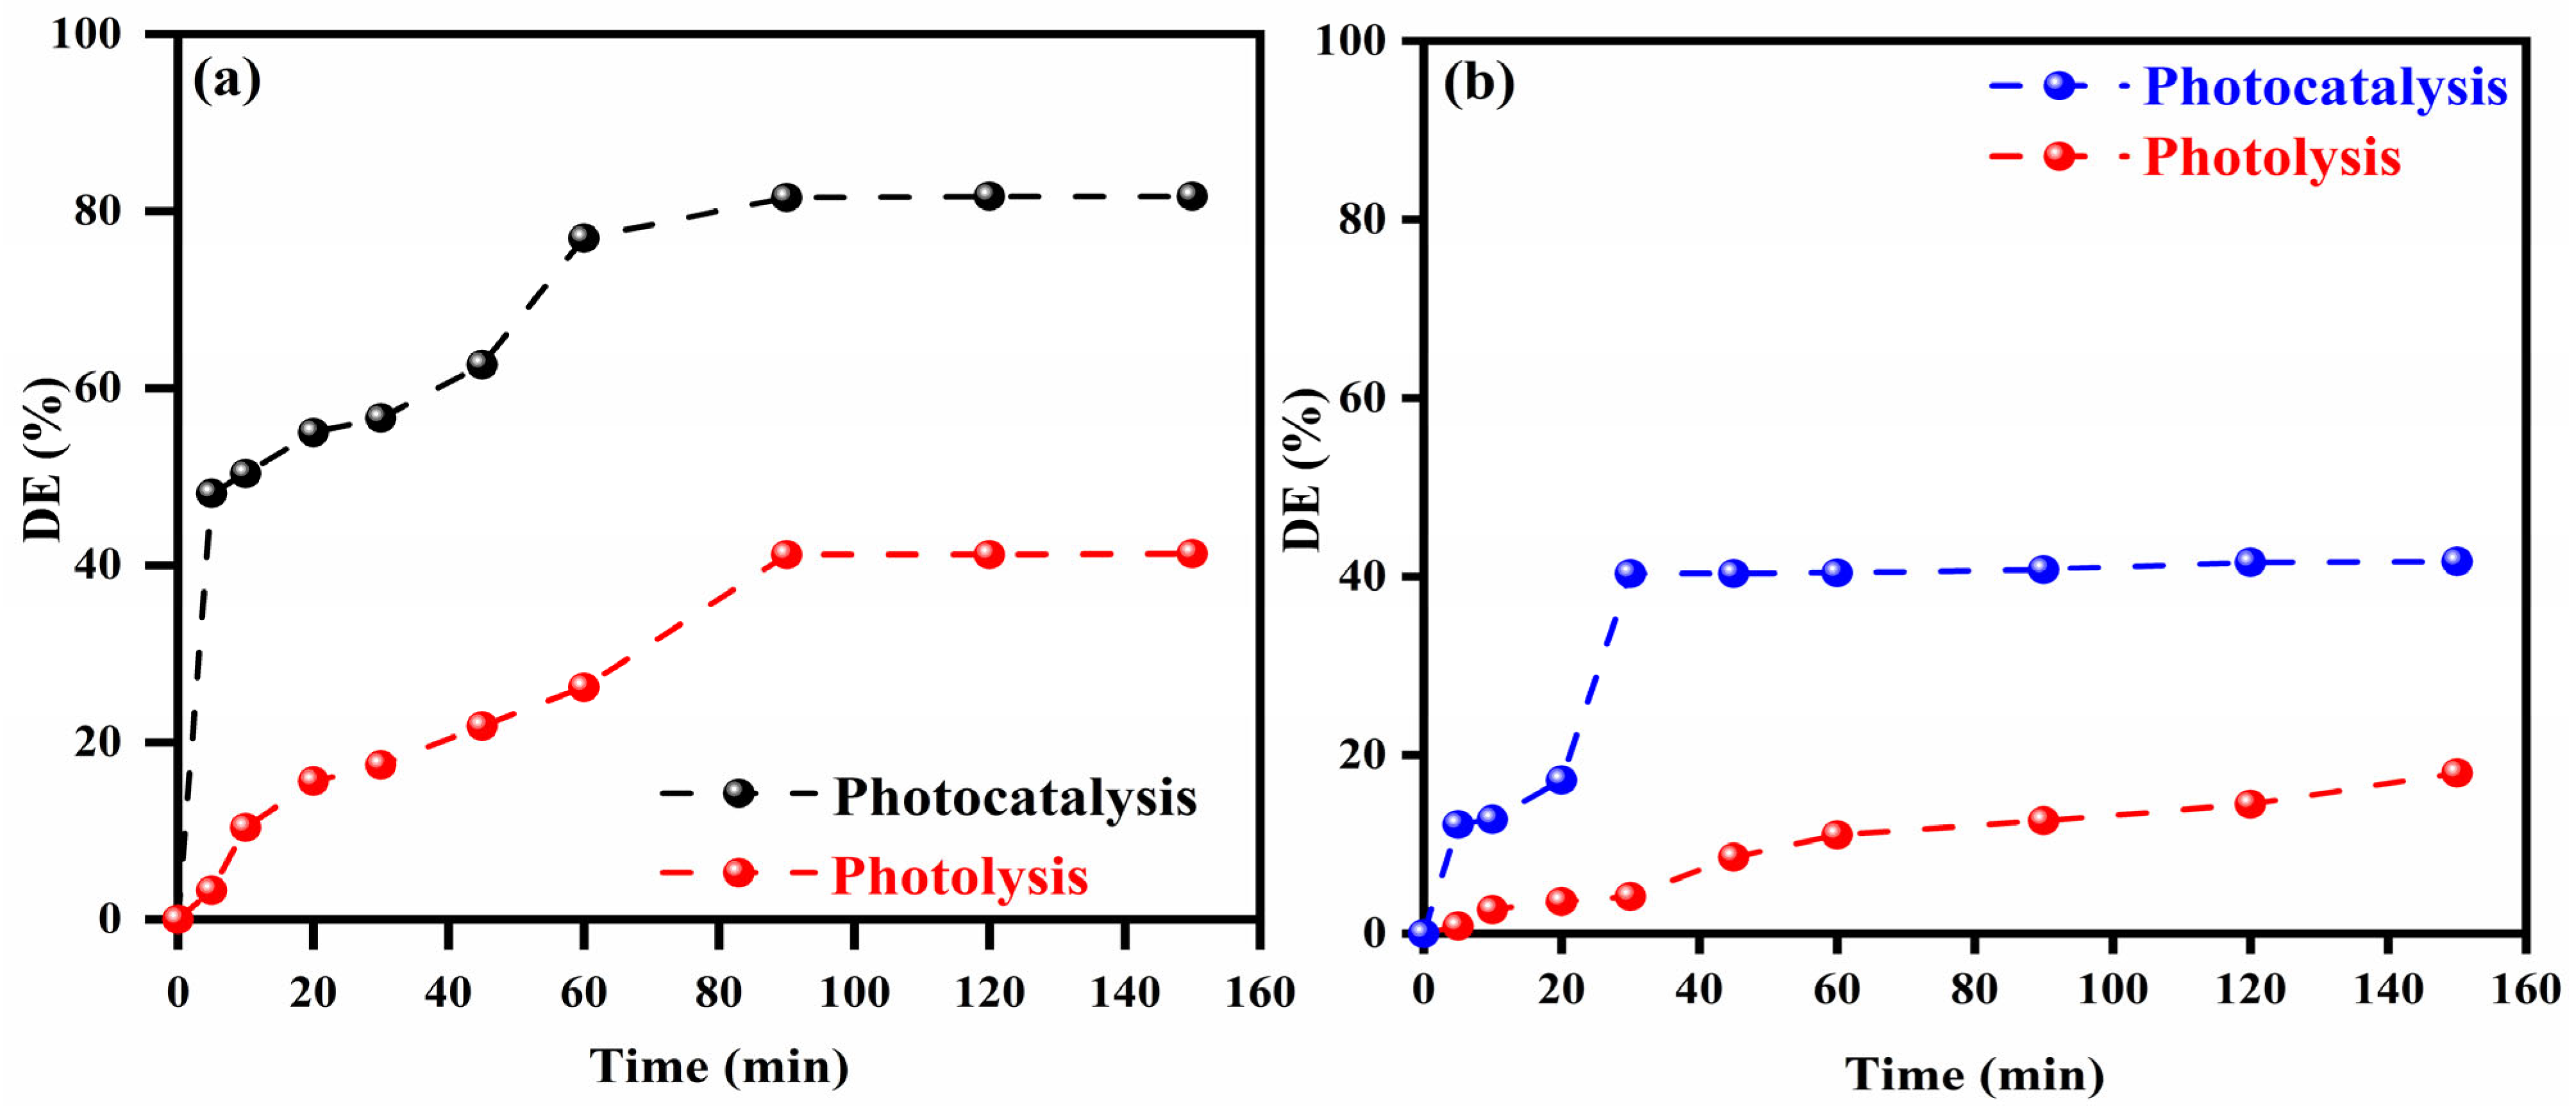
The photocatalytic degradation of dyes in single system was initially performed in the absence and the presence of catalyst (photolysis and photocatalysis process,). 40 and 20 mg/L of MG and CV, respectively, were exposed to sunlight for 150 min in the presence of α-Fe2O3/ZnFe2O4 with a solid–liquid ratio of 1 g/L for photocatalysis. Figure 9a,b display the degradation efficiency curves. The results reveal a significant difference in degradation rates between photolysis and photocatalysis for both dyes. In the absence of the photocatalyst, the direct degradation of MG and CV yielded removal rates of 41% and 18%, respectively, over the reaction period. However, the addition of α-Fe2O3/ZnFe2O4 powder to the dye solutions enhanced degradation efficiency. Within 60 min, the elimination rates increased to 76.9% and 40.8% for MG and CV, respectively. After 90 min of irradiation, the degradation percentages stabilized at 81.67% for MG and 41.70% for CV. These results underscore the critical role of adsorption affinity. In fact, the high efficiency degradation of MG is a direct consequence of its strong efficiency adsorption, which ensures a high surface concentration readily available for reaction with photogenerated species.
Figure 9.
Evolution of degradation efficiency of (a) MG and (b) CV dyes during the photocatalytic process in the presence of α-Fe2O3/ZnFe2O4 catalyst [r = 1 g/L, T = 25 °C, pHMG = 6.78, and pHCV = 10].
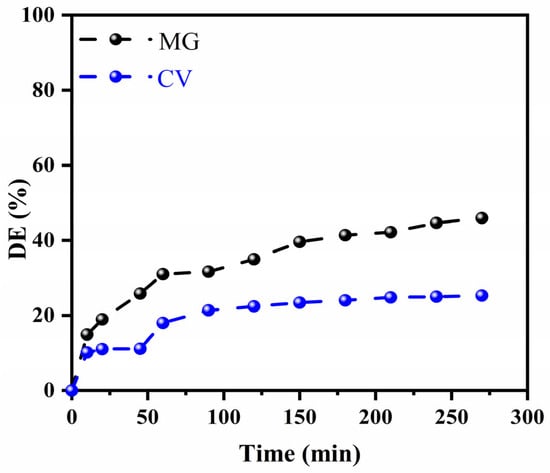
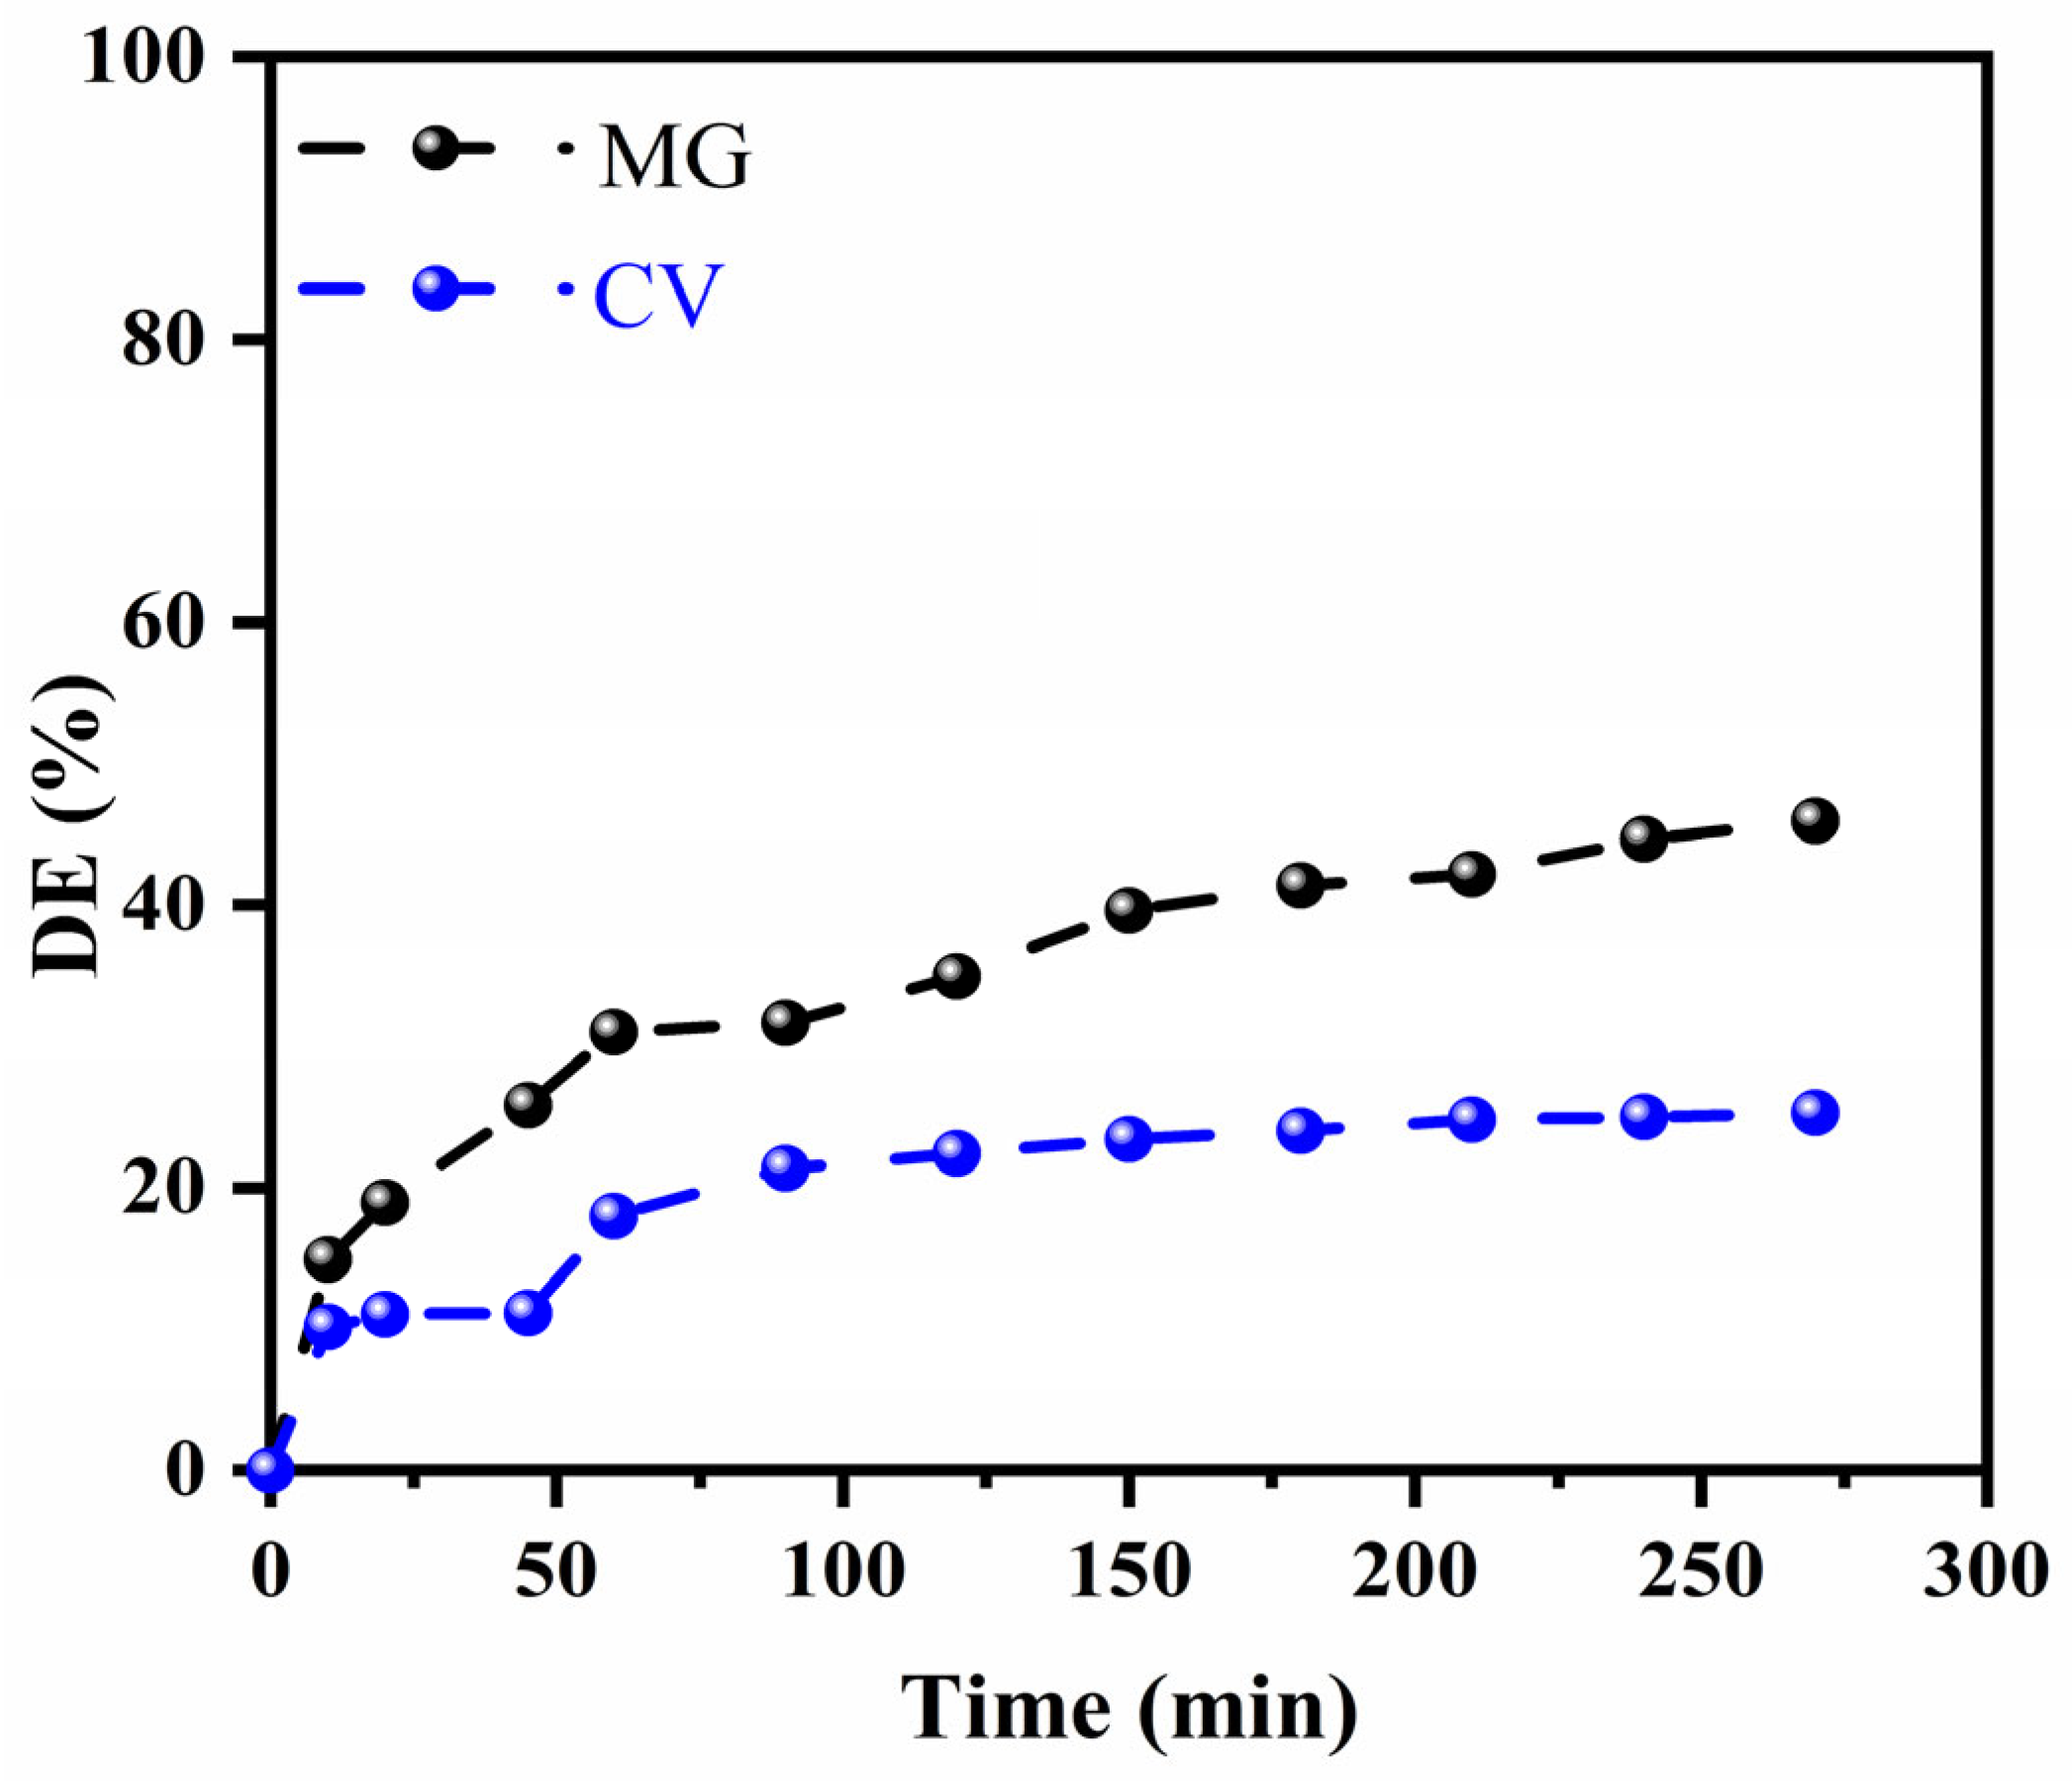
To deepen understanding, MG and CV dyes were photodegraded under the same experimental conditions using α-Fe2O3, which was synthesized via a co-precipitation method in our previous work [7]. The obtained results show that the degradation efficiencies were 32% for MG and 21.7% for CV after 90 min of reaction (Figure 10). These findings highlight the critical role of the ZnFe2O4 spinel in the heterocatalyst and demonstrate the superior photocatalytic performance of the α-Fe2O3/ZnFe2O4 semiconductor compared to α-Fe2O3 alone. Comparison of the results demonstrates that photocatalysis under solar irradiation using the heterosystem catalyst is highly effective for removing the studied pollutants, especially MG dye, achieving removal efficiencies exceeding 81%. The excellent efficiency of the prepared catalyst is attributed to its enhanced ability to generate a higher quantity of hydroxyl radicals, its ideal bandgap for visible light activation (1.8 eV), and particularly the minimization of hole-electron recombination through the heterojunction between α-Fe2O3 and ZnFe2O4. Furthermore, XPS analysis of the α-Fe2O3/ZnFe2O4 catalyst was performed in our earlier work [16]. The results confirmed that the surface is composed of Fe, O and Zn, and the deconvolution of O1s spectrum revealed the presence of surface hydroxyl groups (OH−). These groups can actively participate in the photocatalytic degradation process by enhancing pollutant adsorption and can facilitate the generation of highly reactive species, such as hydroxyl radicals (HO•) and superoxide radicals (•O2−), through reactions with photogenerated charge carriers, adsorbed oxygen, and water molecules.
Figure 10.
Evolution of degradation efficiency of MG and CV dye in the presence of hematite α-Fe2O3 [CMG = 40mg/L, CCV = 20mg/L, pHMG =6.78, and pHCV = 10, rs/l = 1 g/L and T = 25 °C].
To contextualize the performance of the α-Fe2O3/ZnFe2O4 heterojunction, Table 3 provides a comparative overview of reported photocatalytic efficiencies for MG and CV degradation using various catalysts under different light sources.
Table 3.
Summary of photocatalytic degradation studies of CV and MG dyes.
2.3.2. Photodegradation in Binary System
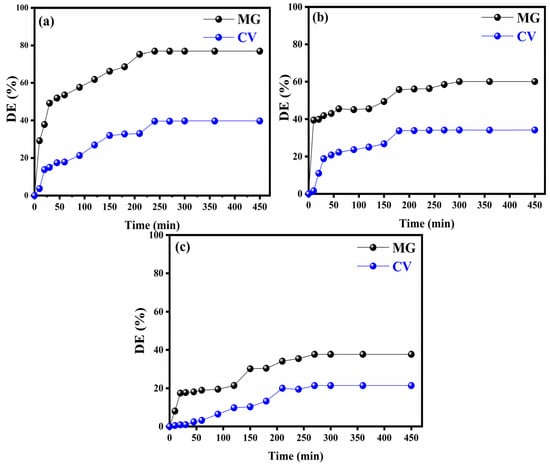
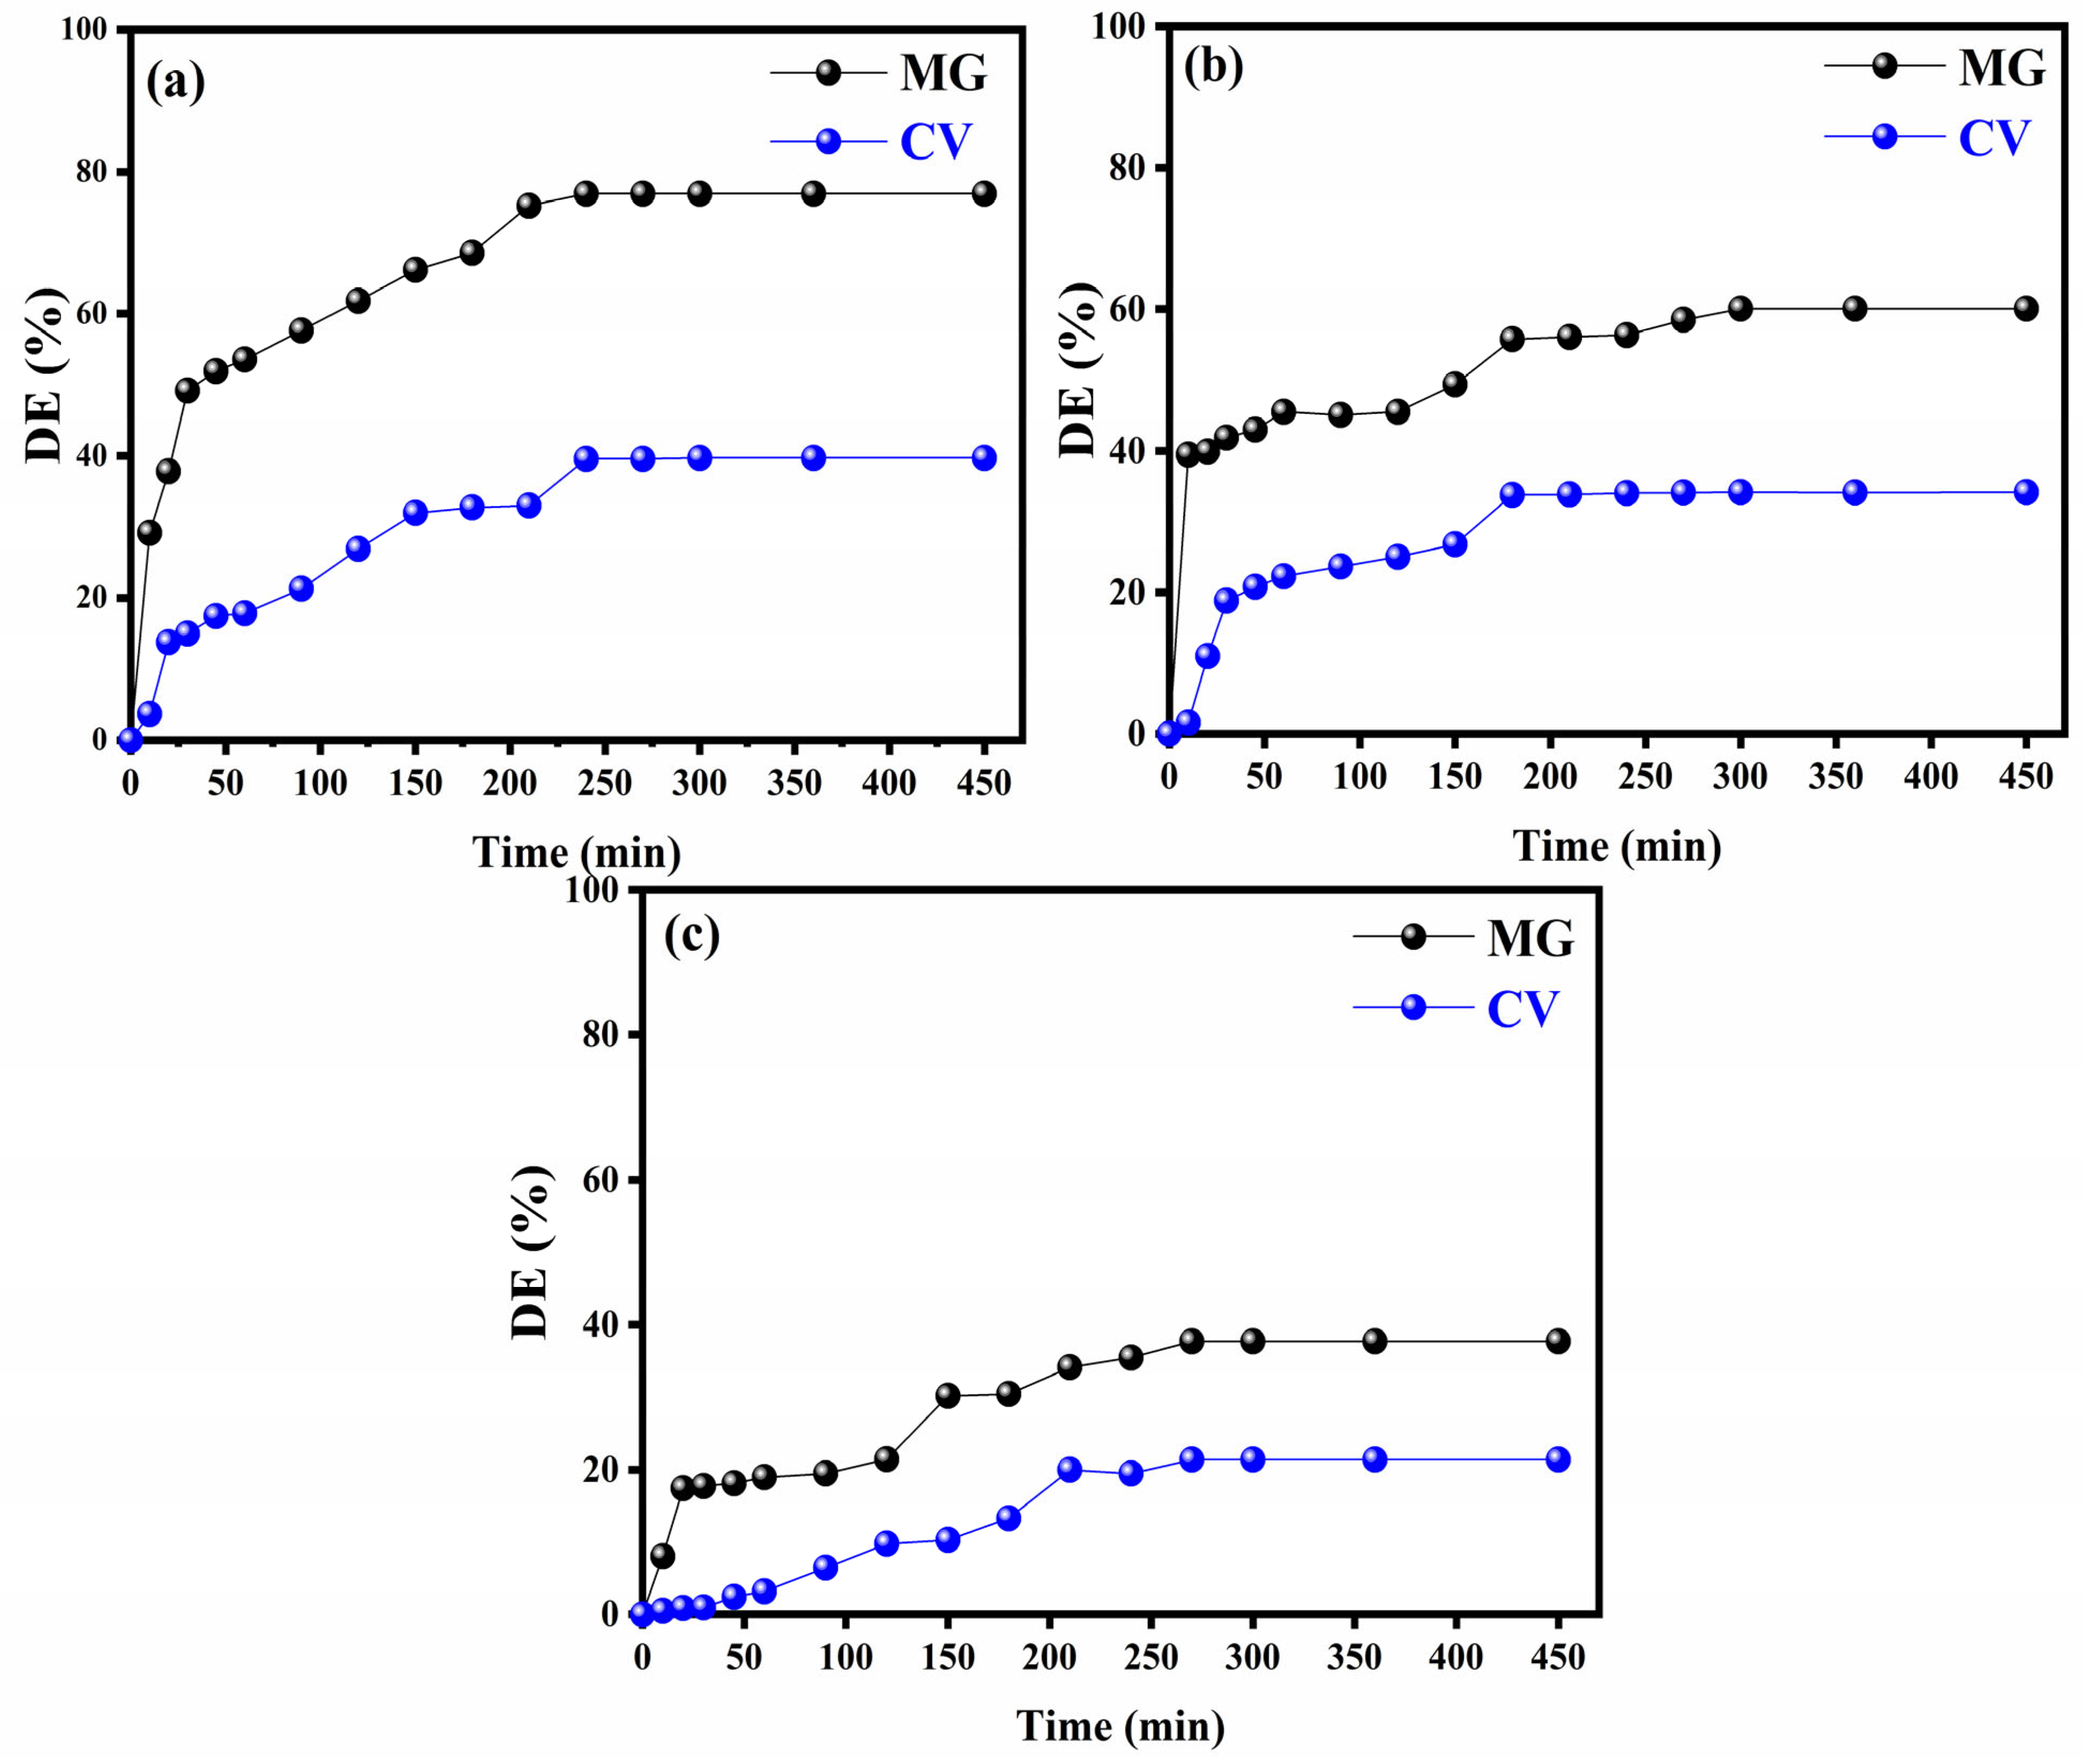
The photocatalytic efficiencies of the as-synthesized α-Fe2O3/ZnFe2O4 heterosystem were evaluated for the solar removal of mixed dyes by varying their initial concentrations, while keeping other variables constant (natural pH, rs/L = 1 g/L, T = 25 °C). Figure 11a–c illustrate the degradation rates of dyes in a binary system under sunlight irradiation.
Figure 11.
Evolution of degradation efficiency of MG and CV dyes with variation in initial concentration: (a) C0(MG) = 20 mg/L and C0(CV) = 10 mg/L, (b) C0(MG,CV) = 20 mg/L, and (c) C0(MG) = 40 mg/L and C0(CV) = 20 mg/L in the presence of α-Fe2O3/ZnFe2O4 catalyst, r = 1 g/L and T = 25 °C.
The results reveal a competitive adsorption dynamic that dictates the photocatalytic outcome. In the mixture with MG at 20 mg/L and CV at = 10 mg/L, the heterojunction exhibited a high and selective efficiency, achieving 76.95% removal for MG while that of CV was limited to 39.7%. This performance underscores the catalyst’s effectiveness even in complex matrix and confirms the dominant role of MG’s superior adsorption affinity. In the equimolar mixture (CMG = 20 mg/L, CCV = 20 mg/L), the degradation of MG remained significantly higher (60.1%) than that of CV (34.1%). These results demonstrates that MG, with its superior adsorption affinity, preferentially occupies the active sites on the catalyst surface, thereby inhibiting the adsorption and subsequent degradation of CV. When the concentration of MG was doubled to 40 mg/L, a sever inhibition effect was observed for both dyes, with a final removal dropping to 37.72% and 21.35% for MG and CV respectively. This decline in degradation efficiency with increasing dye concentration can be attributed to two factors: first, higher concentrations reduce the ability of photons to penetrate the dye solution, and second, the catalyst’s activity is hindered due to excessive dye adsorption on its surface [45].
Moreover, these results provide compelling evidence that the adsorption step is the rate-determining factor in the photocatalytic process on the α-Fe2O3/ZnFe2O4 heterojunction. Consequently, future work should evaluate the long-term stability and reusability of the α-Fe2O3/ZnFe2O4 photocatalyst and validate its performance in real wastewater systems. Optimization of operating parameters and identification of degradation by-products are required to ensure efficiency and environmental safety.
2.3.3. Kinetics Studies
The kinetics of photocatalytic degradation of MG and CV dyes in both single and binary systems are based on findings reported in the literature. In heterogeneous photocatalysis, the process is often described by the Langmuir–Hinshelwood (L-H) model, where the reaction rate is governed by the surface coverage of the adsorbate [46]. Therefore, the experimental data were empirically fitted to the integrated forms of zero-, -first, and second-order laws, which represent useful simplifications of the L-H model under different concentration regimes.
The following Equation (1) represents the rate of photodegradation:
where kapp is the apparent rate constant (min−1) and n is the order of reaction.
V = −dCt/dt = kapp·Ctn
The data were adjusted to zero-, first-, and second-order (Equations (2), (3) and (4) respectively) by the integration of Equation (1):
C0 − Ct = k0·t
ln (C0/Ct) = k1·t
(1/Ct) − (1/C0) = k2·t
The plots of (C0 − Ct), ln(C0/Ct), and (1/Ct – 1/C0) versus time (t) were utilized to determine the rate constant and correlation coefficient R2 for the three different studied models.
The calculated constants k0, k1, k2 and R2 in both single and binary systems are summarized in Table 4 and Table 5. According to the observed results, all photodegradation reactions studied in single system fit well with the first-order model. This implies that the degradation rate is directly proportional to the dye concentration, meaning that as the concentration decreases over time, the degradation rate also decreases. The significantly higher first-order rate constant for MG (k1 = 0.0217 min−1) compared to CV (k1 = 0.00976 min−1) is a kinetic corroboration of its superior adsorption affinity, leading to a higher surface concentration available for reaction. Moreover, the predominance of first-order kinetics suggests that the photodegradation mechanism is primarily governed by the availability of reactive species, such as hydroxyl radicals (HO•), rather than by direct catalyst saturation.
Table 4.
Rate constant (k) and correlation coefficient (R2) values for photocatalytic reaction in single system.
Table 5.
Rate constant (k) and correlation coefficient (R2) values for photocatalytic reaction in binary system.
Conversely, the kinetics of removal reactions in the mixture vary with the operating conditions. For MG pollutant, the photocatalytic degradation process is described by a second-order model at all studied concentrations, and correlation coefficients R2 are close to 1. This second-order dependence indicates that the rate-limiting step involves a biomolecular interaction which, in a competitive binary system, is consistent with the mutual competition between MG and CV molecules for the same finite set of adsorption sites on the catalyst. In contrast, the kinetic order for CV shifted from second to zero as the dye’s initial concentration increased. This transition is highly revealing: at low concentrations and for equimolar mixture, CV degradation is limited by its adsorption (second-order behavior). At higher concentrations, the active sites become saturated (primally by more competitive MG), making the surface coverage of CV constant and independent of its bulk concentration; hence, the zero-order kinetics is determined by the catalyst’s fixed turnover capacity. Additionally, a decrease in the apparent degradation rate constants (k) for MG is observed with increasing initial concentration. This can be attributed to reduced photon participation as the solution color becomes more intense, resulting in lower activation of the α-Fe2O3/ZnFe2O4 catalyst [47].
3. Materials and Methods
3.1. Synthesis and Characterization of Material
The α-Fe2O3/ZnFe2O4 catalyst was prepared using a co-precipitation approach as described in our previous work [16]. In brief, zinc and iron precursors were co-precipitated by adjusting the solution pH to 10 with NH4OH, followed by filtration, drying and subsequently calcined in stepwise manner at 300, 600 and finally 900 °C.
Powder X-ray diffraction (XRD) pattern of synthesized α-Fe2O3/ZnFe2O4 was obtained using X-Ray powder diffraction technique with Shimadzu XRD-7000 Diffractometer (Kyoto, Japan) and Cu Kα radiation (1.54 Å, 40 kV/40 mA) in the range of 2θ from 10° to 90° with a stepwise of 0.02° and a scan speed of 2°/min. The crystallite size (D) of prepared α-Fe2O3/ZnFe2O4 NPs was calculated using the following Scherrer’s formula:
where D is the crystallite size (nm), λ is the X-Ray wavelength of Cu(Kα) = 0.154 nm, β is s the angular line width at half maximum intensity (FWHM) and θ is the Bragg angle.
To investigate the morphology and elemental composition of the samples, Scanning Electron Microscopy (SEM) analyses were carried out using a Thermo Scientific Quattro scanning electron microscope (Waltham, MA, USA). In addition, high-resolution surface morphology was examined by Field Emission Scanning Electron Microscopy (FESEM) using a Thermo Scientific Apreo 2 S microscope (Waltham, MA, USA) equipped with a STEM detector and an Energy-Dispersive X-ray spectroscopy (EDS) system. STEM images and EDS elemental mapping were acquired at an accelerating voltage of 22 kV. Elemental distribution maps were generated from the integrated X-ray counts of the corresponding elements. Prior to analysis, the samples were dispersed in ethanol, deposited onto STEM grids, and dried at room temperature.
The diffuse reflectance (DR) UV–Vis spectra were performed with a Thermo Evolution 300 UV-Vis spectrophotometer (Waltham, MA, USA) equipped with a praying mantis device. The bandgap energy was calculated using Tauc relation (Equation (6)).
F(R)hυ = A(hυ − Eg)2
The bandgap energy (Eg) for prepared photocatalyst was measured by the extrapolation of the linear portion of the graph between the modified Kubelka–Munk function [F(R)hυ]1/2 versus photon energy (hν), where
F(R) = [(1 − R)2/2R]
The CO2-TPD and NH3-TPD measurements were performed in an AutoChem II 2920 station from Micromeritics (Norcross, GA, USA) to determine the total acidity and basicity of sample. The point of zero charge PZC was evaluated by the method described by Lopez-Ramon et al. [48,49]. A fixed mass of the catalyst was added to 50 mL of 0.1 M potassium nitrate solutions (KNO3) at various pH (from 1 to 12), stirred at 500 rpm for 24 h at 22 °C and then filtered. After measuring the final pH of the solutions, the PZC was obtained from the curve (pHfinal − pHinitial) vs. pHinitial.
3.2. Adsorption Test
The adsorption tests were performed in batch systems in the dark. Firstly, for single system, a fixed mass of α-Fe2O3/ZnFe2O4 catalyst (solid–liquid ratio = 1 g/L) was introduced separately into determined volumes of MG and CV solutions with different initial concentrations under temperature and pH conditions of T = 20 °C and pH = 6.7 ± 0.5 and 10 ± 0.5 respectively for MG and CV. Then, for MG/CV mixture, a mass of catalyst (solid–liquid ratio = 1 g/L) was introduced into mixture solutions of CV/MG at various initial concentration ratios, maintaining the temperature at 20 ± 1 °C. The initial pH of these mixtures ranged from 7.5 to 8.2. The solutions were kept in darkness and continuously stirred at 350 rmp. After solid–liquid separation using a Millipore filters (Burlington, MA, USA, porosity 45 µm), the samples were analyzed to estimate the residual concentration of the CV/MG dye using UV–visible spectrophotometry (UVILINE 9600 spectrophotometer, AQUALABO, Champigny-sur-Marne, France) at a wavelength of 581 nm for CV and 631 nm for MG, respectively.
The amounts of the adsorbed dyes (q) are calculated using Equation (1):
where qt is the adsorption capacity (mg/g); C0 and Ct represent the initial and residual dye concentrations (mg/L), respectively; V represents the solution volume (L), while m denotes the mass of the catalyst (g).
At 21 °C, the adsorption isotherm study was performed for MG and VC in single system.
3.3. Photocatalytic Test
The photocatalytic efficiency of prepared α-Fe2O3/ZnFe2O4 catalyst was evaluated in a reactor for the photodegradation reaction of single methyl green (MG) and crystal violet (CV) dyes and their binary mixture systems. The photoreactor consisted of a transparent glass container (600 mL), equipped with a thermometer for manual temperature control, all placed on a magnetic stirrer and maintained under constant and continuous stirring (350 rmp). The natural solar was used as light source for performing the photocatalytic removal experiments and a Lux Meter measured the average solar light intensity at noon as 630 W/m2. All experiments were carried out in thermostatic bath and reactions were studied at room temperature and fixed pH and an average temperature of 25 °C. For the single photocatalytic system, a volume of dyes (MG, CV) were individually mixed with α-Fe2O3/ZnFe2O4 powder, while in the binary system, a quantity of catalyst was dispersed in a mixture of MG and CV. Prior photocatalysis, the reactions were kept in the dark to ensure the adsorption/desorption equilibrium between the dyes and the α-Fe2O3/ZnFe2O4 material. Then, the dye solutions were illuminated by solar irradiation and the sample was taken out regularly, collected, centrifuged and analyzed with UV-Vis spectrophotometer to determine the absorbance. The degradation efficiency was calculated using the following equation:
where C0 is the initial concentration of dye, and Ct is the concentration at the regular interval.
4. Conclusions
In summary, this study demonstrated the successful application of α-Fe2O3/ZnFe2O4 heterojunction for the photocatalytic removal of methyl green (MG) and crystal violet dyes in both single and binary systems under natural sunlight. The adsorption behavior, identified as the key governing step, was first elucidated. The results showed that maximum adsorption capacity was achieved in a basic medium, with MG dye exhibiting a higher affinity than CV, either alone or in binary mixtures. This affinity was attributed to a synergy between stronger electrostatic interaction and specific coordination with Lewis basic sites. The equilibrium adsorption process was effectively described by the Langmuir model confirming monolayer coverage.
Consequently, the α-Fe2O3/ZnFe2O4 photocatalyst showed a strong photocatalytic activity for the degradation of MG and CV dyes. The removal efficiencies were determined to be 81.67% and 42% for MG and CV, respectively, when degraded separately. However, in the binary mixture, the degradation performance is influenced by the initial dye concentration and competitive adsorption effect. Overall, the results highlight the higher affinity and superior photocatalytic efficiency of the α-Fe2O3/ZnFe2O4 catalyst for MG dye, confirming its potential as a promising photocatalyst for treatment of complex-dye-contaminated wastewater.
Supplementary Materials
The following supporting information can be downloaded at: https://www.mdpi.com/article/10.3390/catal16030253/s1, Figure S1: Quantitative elemental composition α-Fe2O3/ZnFe2O4 (Zone 1, 2, 3 and 4) catalyst obtained by EDX analysis.
Author Contributions
Conceptualization, K.R. and F.Z.A.; Data curation, D.B.; Formal analysis, I.A., S.L., A.G. and I.K.; Funding acquisition, H.O. and M.S.O.; Investigation, D.B., F.Z.A., H.F. and A.A.; Methodology, K.R., F.Z.A. and M.B.; Project administration, H.O. and M.S.O.; Resources, H.F.; Software, M.B.; Supervision, K.R. and H.T.; Validation, K.R., F.Z.A. and H.T.; Visualization, D.B.; Writing—original draft, K.R., D.B. and A.G.; Writing—review and editing, K.R. and D.B. All authors have read and agreed to the published version of the manuscript.
Funding
This research was supported by the Ongoing Research Funding Program (ORF-2026-710), King Saud University, Riyadh, Saudi Arabia.
Data Availability Statement
The data that support the findings of this study are available from the corresponding author upon reasonable request.
Acknowledgments
The authors gratefully acknowledge the support of the Ongoing Research Funding Program (ORF-2026-710), King Saud University, Riyadh, Saudi Arabia. The authors also wish to express their gratitude to Yousra Zaich and Asmaa Lourghi from the Department of Process Engineering, Jijel University, Algeria.
Conflicts of Interest
The authors declare that they have no conflict of interest of any type.
References
- Zaruma-Arias, P.E.; Núñez-Núñez, C.M.; González-Burciaga, L.A.; Proal-Nájera, J.B. Solar Heterogenous Photocatalytic Degradation of Methylthionine Chloride on a Flat Plate Reactor: Effect of pH and H2O2 Addition. Catalysts 2022, 12, 132. [Google Scholar] [CrossRef] [Scilit]
- Thongam, D.D.; Chaturvedi, H. Advances in nanomaterials for heterogeneous photocatalysis. Nano Express 2021, 2, 012005. [Google Scholar] [CrossRef] [Scilit]
- Gouasmia, A.; Zouaoui, E.; Mekkaoui, A.A.; Haddad, A.; Bousba, D. Highly efficient photocatalytic degradation of malachite green dye over copper oxide and copper cobaltite photocatalysts under solar or microwave irradiation. Inorg. Chem. Commun. 2022, 145, 110066. [Google Scholar] [CrossRef] [Scilit]
- Radović Vučić, M.D.; Mitrović, J.Z.; Kostić, M.M.; Velinov, N.D.; Najdanović, S.M.; Bojić, D.V.; Bojić, A.L. Heterogeneous photocatalytic degradation of anthraquinone dye Reactive Blue 19: Optimization, comparison between processes and identification of intermediate products. Water SA 2020, 46, 291–299. [Google Scholar] [CrossRef] [Scilit]
- Khan, I.; Saeed, K.; Ali, N.; Khan, I.; Zhang, B.; Sadiq, M. Heterogeneous photodegradation of industrial dyes: An insight to different mechanisms and rate affecting parameters. J. Environ. Chem. Eng. 2020, 8, 104364. [Google Scholar] [CrossRef] [Scilit]
- Padmanabhan, N.T.; Gayathri, K.; Thomas, R.M.; John, H. ZnO/Mo2TiC2 MXene nanohybrids for enhanced solar-driven photocatalytic degradation of tetracycline and organic pollutants in contaminated water. Energy Environ. Sustain. 2025, 1, 100042. [Google Scholar] [CrossRef] [Scilit]
- Rouibah, K.; Akika, F.Z.; Rouibah, C.; Boudermine, H.-R.; Douafer, S.; Boukerche, S.; Boukerche, G.; Benamira, M. Solar photocatalytic degradation of Methyl green on CuFe2O4/α Fe2O3 heterojunction. Inorg. Chem. Commun. 2023, 148, 110361. [Google Scholar] [CrossRef] [Scilit]
- Bai, Y.Y.; Lu, Y.; Liu, J.K. An efficient photocatalyst for degradation of various organic dyes: Ag@Ag2MoO4–AgBr composite. J. Hazard. Mater. 2016, 307, 26–35. [Google Scholar] [CrossRef] [Scilit] [PubMed]
- Al-Rasheed, R.A. Water treatment by heterogeneous photocatalysis an overview. In Proceedings of the 4th SWCC Acquired Experience Symposium, Jeddah, Saudi Arabia, 24–26 April 2005. [Google Scholar]
- Tomar, R.; Abdala, A.A.; Chaudhary, R.G.; Singh, N.B. Photocatalytic degradation of dyes by nanomaterials. Mater. Today: Proc. 2020, 29, 967–973. [Google Scholar] [CrossRef] [Scilit]
- Ghemit, K.; Akika, F.Z.; Rouibah, K.; Benamira, M.; Bousba, D.; Gouasmia, A.; Djermoune, A.; Oueslati, A.; Avramova, I. Photocatalytic activity of the new NiAl2O4/CeO2 heterojunction for the elimination of Rose Bengal under solar irradiation. Inorg. Chem. Commun. 2025, 176, 114185. [Google Scholar] [CrossRef] [Scilit]
- Li, S.; Shan, S.; Chen, S.; Li, H.; Li, Z.; Liang, Y.; Fei, J.; Xie, L.; Li, J. Photocatalytic degradation of hazardous organic pollutants in water by Fe-MOFs and their composites: A review. J. Environ. Chem. Eng. 2021, 9, 105967. [Google Scholar] [CrossRef] [Scilit]
- Amiri, M.; Eskandari, K.; Salavati-Niasari, M. Magnetically retrievable ferrite nanoparticles in the catalysis application. Adv. Colloid Interface Sci. 2019, 271, 101982. [Google Scholar] [CrossRef] [Scilit] [PubMed]
- Naseri, M.G.; Saion, E.B.; Hashim, M.; Shaari, A.H.; Ahangar, H.A. Synthesis and characterization of zinc ferrite nanoparticles by a thermal treatment method. Solid State Commun. 2011, 151, 1031–1035. [Google Scholar] [CrossRef] [Scilit]
- Valenzuela, R. Novel Applications of Ferrites. Phys. Res. Int. 2012, 2012, 591839. [Google Scholar] [CrossRef] [Scilit]
- Rouibah, K.; Ferkous, H.; Akika, F.Z.; Boublia, A.; Bousba, D.; Gouasmia, A.; Belal, I.; Halim, K.A.; Albrahim, M.; Benguerba, Y. Adsorption and solar photocatalytic degradation of naphthalene by α-Fe2O3/ZnFe2O4 nanoparticles: Experimental and DFT insights. J. Phys. Chem. Solids 2025, 207, 112848. [Google Scholar] [CrossRef] [Scilit]
- Taghavi Fardood, S.; Moradnia, F.; Moradi, S.; Forootan, R.; Yekke Zare, F.; Heidari, M. Eco-friendly synthesis and characterization of α-Fe2O3 nanoparticles and study of their photocatalytic activity for degradation of Congo red dye. Nanochemistry Res. 2019, 4, 140–147. [Google Scholar] [CrossRef] [Scilit]
- El-Salamony, R.A.; Aboutaleb, W.A.; Dhmees, A.S. Photodegradation of Amido Black 10b Dye Under Visible Light Using Ni and Zn Ferrite Catalysts Prepared by a Simple Modified Sol–Gel Method. Arab. J. Sci. Eng. 2023, 48, 7661–7672. [Google Scholar] [CrossRef] [Scilit]
- Daramola, I.O.; Ojemaye, M.O.; Okoh, A.I.; Okoh, O.O. α-Fe2O3 co-precipitation synthesis: Evaluating the role of hydrogen peroxide as oxidizing agent in the photocatalytic degradation of atrazine. Discov. Chem. 2025, 2, 193. [Google Scholar] [CrossRef] [Scilit]
- Li, J.; Liu, Z.; Zhu, Z. Magnetically Separable ZnFe2O4, Fe2O3/ZnFe2O4 and ZnO/ZnFe2O4 Hollow Nanospheres with Enhanced Visible Photocatalytic Properties. RSC Adv. 2014, 4, 51302–51308. [Google Scholar] [CrossRef] [Scilit]
- Roumaih Kh Ismail, S.M.; Labib Sh Helal, A. Structural, magnetic, and optical properties of ZnFe2O4/RO (RO = CdO, NiO, Ga2O3, SnO2, and TiO2) nanocomposites. J. Mater. Sci. 2023, 58, 7948–7967. [Google Scholar] [CrossRef] [Scilit]
- Reddy, I.N.; Lebaka, V.R.; Chinni, S.V.; Gobinath, R.; Shim, J.; Bai, C. Applied Potential Effect on ZnFe2O4-Fe2O3 Heterostructure for Generation of Photocurrents under Irradiation. Crystals 2022, 12, 1726. [Google Scholar] [CrossRef] [Scilit]
- Dhal, J.P.; Mishra, B.G.; Hota, G. Hydrothermal synthesis and enhanced photocatalytic activity of ternary Fe2O3/ZnFe2O4/ZnO nanocomposite through cascade electron transfer. RSC Adv. 2015, 5, 58072–58083. [Google Scholar] [CrossRef] [Scilit]
- Han, H.; Han, T.; Luo, Y.; Jia, Y. Well-designed α-Fe2O3/ZnFe2O4 heterojunction for photocatalytic CO2 reduction to fuels. Mater. Lett. 2023, 352, 135181. [Google Scholar] [CrossRef] [Scilit]
- Ahmad, W.; Khan, A.; Ali, N.; Khan, S.; Uddin, S.; Malik, S.; Ali, N.; Khan, H.; Khan, H.; Bilal, M. Photocatalytic degradation of crystal violet dye under sunlight by chitosan-encapsulated ternary metal selenide microspheres. Environ. Sci. Pollut. Res. 2021, 28, 8074–8087. [Google Scholar] [CrossRef] [Scilit]
- Iqbal, M.; Bhatti, H.N.; Younis, S.; Rehmat, S.; Alwadai, N.; Almuqrin, A.H.; Iqbal, M. Graphene oxide nanocomposite with CuSe and photocatalytic removal of methyl green dye under visible light irradiation. Diam. Relat. Mater. 2021, 113, 108254. [Google Scholar] [CrossRef] [Scilit]
- Bayahia, H. High activity of ZnFe2O4 nanoparticles for photodegradation of crystal violet dye solution in the presence of sunlight. J. Taibah Univ. Sci. 2022, 16, 988–1004. [Google Scholar] [CrossRef] [Scilit]
- Uttam Pandit, V.R.; Parshuram Jadhav, G.K.; Sakharam Jawale, V.M.; Dubepatil, R.; Gurao, R.; Late, D.J. Synthesis and characterization of micro-/nano-α-Fe2 O3 for photocatalytic dye degradation. RSC Adv. 2024, 14, 29099–29105. [Google Scholar] [CrossRef] [Scilit] [PubMed]
- Sifat, M.; Shin, E.; Schevon, A.; Ramos, H.; Pophali, A.; Jung, H.-J.; Halada, G.; Meng, Y.; Olynik, N.; Sprouster, D.J.; et al. Photocatalytic Degradation of Crystal Violet (CV) Dye over Metal Oxide (MOx) Catalysts. Catalysts 2024, 14, 377. [Google Scholar] [CrossRef] [Scilit]
- Saravan, R.S.; Muthukumaran, M.; Mubashera, S.M.; Abinaya, M.; Prasath, P.V.; Parthiban, R.; Mohammad, F.; Oh, W.C.; Sagadevan, S. Evaluation of the photocatalytic efficiency of cobalt oxide nanoparticles towards the degradation of crystal violet and methylene violet dyes. Optik 2020, 207, 164428. [Google Scholar] [CrossRef] [Scilit]
- Akika, F.Z.; Rouibah, K.; Benamira, M.; Avramova, I. Elaboration of the new heterostructure of NiAl2O4/kaolin and its photocatalytic activity towards methyl green under solar light irradiation. Inorg. Chem. Commun. 2023, 154, 110878. [Google Scholar] [CrossRef] [Scilit]
- Bel Hadjltaief, H.; Ben Zina, M.; Galvez, M.E.; Da Costa, P. Photocatalytic degradation of methyl green dye in aqueous solution over natural clay-supported ZnO–TiO2 catalysts. J. Photochem. Photobiol. A Chem. 2016, 315, 25–33. [Google Scholar] [CrossRef] [Scilit]
- Teng Ong, S.; Kheng Lee, C.; Zainal, Z.; Sin Keng, P.; Tiong Ha, S. Photocatalytic degradation of basic and reactive dyes in both single and binary systems using immobilized TiO2. Malays. J. Fundam. Appl. Sci. 2014, 5. [Google Scholar] [CrossRef] [Scilit]
- Sharma, S.; Khare, N. Hierarchical Bi2S3 nanoflowers: A novel photocatalyst for enhanced photocatalytic degradation of binary mixture of Rhodamine B and Methylene blue dyes and degradation of mixture of p-nitrophenol and p-chlorophenol. Adv. Powder Technol. 2018, 29, 3336–3347. [Google Scholar] [CrossRef] [Scilit]
- Ariyanti, D.; Maillot, M.; Gao, W. Photo-assisted degradation of dyes in a binary system using TiO2 under simulated solar radiation. J. Environ. Chem. Eng. 2018, 6, 539–548. [Google Scholar] [CrossRef] [Scilit]
- Elavarasan, M.; Yang, W.; Velmurugan, S.; Chen, J.-N.; Chang, Y.-T.; Yang, T.C.-K.; Yokoi, T. In-situ infrared investigation of m-TiO2/α-Fe2O3 photocatalysts and tracing of intermediates in photocatalytic hydrogenation of CO2 to methanol. J. CO2 Util. 2022, 56, 101864. [Google Scholar] [CrossRef] [Scilit]
- Bakratsa, A.; Zacharopoulou, V.; Karagiannakis, G.; Zaspalis, V.; Kastrinaki, G. Synthesis and Characterization of Iron-Based Catalysts for Carbon Dioxide Valorization. Appl. Sci. 2024, 14, 4959. [Google Scholar] [CrossRef] [Scilit]
- Hakim, A.; Marliza, T.S.; Abu Tahari, M.N.; Yusop, M.R.; Mohamed Hisham, M.W.; Yarmo, M.A. Development of α-Fe2O3 as Adsorbent and its Effect on CO2 Capture. MSF 2016, 840, 421–426. [Google Scholar] [CrossRef] [Scilit]
- Ullah, R. Semiconductor ZnFe2O4 as Efficient Photocatalyst for the Degradation of Organic Dyes: An Update. J. Chem. Rev. 2023, 5, 466–476. [Google Scholar] [CrossRef]
- Rachna Rani, M.; Shanker, U. Enhanced photocatalytic degradation of chrysene by Fe2O3@ZnHCF nanocubes. Chem. Eng. J. 2018, 348, 754–764. [Google Scholar] [CrossRef] [Scilit]
- Naushad Mu Alqadami, A.A.; AlOthman, Z.A.; Alsohaimi, I.H.; Algamdi, M.S.; Aldawsari, A.M. Adsorption kinetics, isotherm and reusability studies for the removal of cationic dye from aqueous medium using arginine modified activated carbon. J. Mol. Liq. 2019, 293, 111442. [Google Scholar] [CrossRef] [Scilit]
- Issam, B.; Souad, B.; Wahiba, M.; Chafia, S.; Mouna, C.; Malfi, N.; Dalila, B.; Amel, Z. Crystal Violet Removal from Aqueous Solution Using Urtica Dioica Leaves Powder as A Low-Cost Natural Adsorbent: Isotherm, Kinetics and Thermodynamics Studies. Chem. Afr. 2024, 7, 915–928. [Google Scholar] [CrossRef] [Scilit]
- Senthil Kumar, P.; Ramalingam, S.; Senthamarai, C.; Niranjanaa, M.; Vijayalakshmi, P.; Sivanesan, S. Adsorption of dye from aqueous solution by cashew nut shell: Studies on equilibrium isotherm, kinetics and thermodynamics of interactions. Desalination 2010, 261, 52–60. [Google Scholar] [CrossRef] [Scilit]
- Farouq, R.; Yousef, N.S. Equilibrium and Kinetics Studies of adsorption of Copper (II) Ions on Natural Biosorbent. Int. J. Chem. Eng. Appl. 2015, 6, 319–324. [Google Scholar] [CrossRef] [Scilit]
- Akerdi, A.G.; Bahrami, S.H.; Pajootan, E. Modeling and optimization of Photocatalytic Decolorization of binary dye solution using graphite electrode modified with Graphene oxide and TiO2. J. Environ. Health Sci. Eng. 2020, 18, 51–62. [Google Scholar] [CrossRef] [Scilit] [PubMed]
- Sun, P.; Zhang, J.; Liu, W.; Wang, Q.; Cao, W. Modification to L-H Kinetics Model and Its Application in the Investigation on Photodegradation of Gaseous Benzene by Nitrogen-Doped TiO2. Catalysts 2018, 8, 326. [Google Scholar] [CrossRef] [Scilit]
- Benhabiles, O.; Chekir, N.; Tassalit, D.; Mahidine, S.; Merzouk, N.K. Degradation Solaire d’un Polluant Pharmaceutique sur un Support Photocatalytique. Int. J. Sci. Res. 2015, 3, 107–113. [Google Scholar]
- Rouibah, K.; Ferkous, H.; Abdessalam-Hassan, M.; Mossab, B.L.; Boublia, A.; Pierlot, C.; Abdennouri, A.; Avramova, I.; Alam, M.; Benguerba, Y.; et al. Exploring the Efficiency of Algerian Kaolinite Clay in the Adsorption of Cr(III) from Aqueous Solutions: Experimental and Computational Insights. Molecules 2024, 29, 2135. [Google Scholar] [CrossRef] [Scilit] [PubMed]
- Álvarez-Merino, M.A.; Fontecha-Cámara, M.A.; López-Ramón, M.V.; Moreno-Castilla, C. Temperature dependence of the point of zero charge of oxidized and non-oxidized activated carbons. Carbon 2008, 46, 778–787. [Google Scholar] [CrossRef] [Scilit]

Disclaimer/Publisher’s Note: The statements, opinions and data contained in all publications are solely those of the individual author(s) and contributor(s) and not of MDPI and/or the editor(s). MDPI and/or the editor(s) disclaim responsibility for any injury to people or property resulting from any ideas, methods, instructions or products referred to in the content. |
© 2026 by the authors. Licensee MDPI, Basel, Switzerland. This article is an open access article distributed under the terms and conditions of the Creative Commons Attribution (CC BY) license.