


Abstract
This work introduces a green and scalable hydrothermal route for converting humins—an abundant waste stream from terrestrial and marine biomass—into small-sized, highly homogeneous and bright blue-emitting carbon quantum dots (CQDs). The obtained CQDs were subsequently integrated with commercial Degussa titanium dioxide (P-TiO2) and NaOH-modified TiO2 (M-TiO2) to form CQD@TiO2 heterostructures. TEM, SEM, BET, and XRD analyses show that M-TiO2 evolves into a nanoparticle–nanotube hybrid architecture with a dramatically increased surface area (up to 203 m2/g), hierarchical mesoporosity, and an enhanced anatase–rutile heterojunction density. These features create an efficient scaffold for CQD anchoring and play a decisive role in improving charge separation and photocatalytic performance. The intrinsic bandgaps of P-TiO2 (3.10 eV) and M-TiO2 (2.91 eV) remained essentially unchanged upon CQD incorporation, indicating that the enhanced visible-light response arises from CQD photosensitization and interfacial charge-transfer processes rather than bandgap narrowing. The CQD@TiO2 nanocomposites exhibited markedly improved photocatalytic activity under visible light. In comparison with our previously reported humins-derived CQD/ZnO photocatalysts, the CQD@TiO2 heterostructures display significantly faster kinetics, achieving 93–98% methylene blue degradation within only 60 min. Preliminary diclofenac degradation tests further demonstrates their applicability toward persistent pharmaceutical pollutants.
1. Introduction
Photocatalysis has emerged as a promising strategy with which to address growing environmental and energy challenges, offering the potential for complete mineralization of persistent organic contaminants under mild conditions [1,2,3,4,5]. Consequently, considerable efforts have been devoted to developing photocatalytic materials capable of extending light absorption from the ultraviolet (UV) to the visible region [3,4,6]. Among these materials, titanium dioxide (TiO2) remains one of the most widely investigated photocatalysts due to its strong oxidative power, long-term photostability, low toxicity, and commercial availability [1,2,7]. However, its wide bandgap (3.0–3.2 eV) and the rapid recombination of photogenerated charge carriers significantly limit its efficiency under visible-light irradiation [8,9].
To overcome these limitations, TiO2 has been coupled with various carbon-based materials to enhance visible-light absorption and facilitate charge separation. Accordingly, carbon nanotubes, fullerenes, and graphene have been explored as photosensitizers [10], but their tendency to aggregate in conventional solvents restricts their applicability [11]. In contrast, carbon quantum dots (CQDs), a class of quasi-spherical carbon nanomaterials (2–10 nm), combine excellent water dispersibility with tunable optical properties [12]. Their broad visible-light absorption, up-conversion photoluminescence, and outstanding electron transfer capabilities make them highly attractive for enhancing semiconductor photocatalysis [13,14]. CQD@TiO2 composites have already shown promising activity in various photocatalytic processes [15,16], particularly when CQDs with particle sizes below 3 nm and high quantum yields are employed [17,18].
Despite these advantages, the synthesis of high-quality CQDs remains challenging. Conventional “top-down” and “bottom-up” methods often require expensive precursors, complex instrumentation, or multistep post-treatments, which increase production costs and hinder scalability [19,20,21,22,23,24]. Moreover, top-down approaches typically yield larger particles with poor photoluminescence and limited surface accessibility [17]. To avoid this inconvenience, alternative methods, such as chemical oxidation and laser ablation, have been proposed [20,25]. However, controlling the particle size and homogeneity remains difficult because of nonselective cutting and random reduction processes [26,27]. Therefore, developing green, low-cost, and efficient routes with which to produce small and homogeneous CQDs remains an important objective.
The choice of precursor is one of the most decisive factors in the synthesis of CQDs. While reaction parameters and synthesis routes govern the size, crystallinity, and surface states of CQDs, the chemical composition and origin of the precursor strongly determine the nucleation process, heteroatom doping, and surface functionalization. Precursors can be broadly classified into two main categories: biomass (e.g., terrestrial and marine biomass) and waste (e.g., paper waste, tobacco residues, and vegetable peel waste), each offering distinct advantages in terms of availability, sustainability, and the chemical features imparted to the resulting nanomaterials [28,29]. Humins, polyfuranic by-products formed during the acid-catalyzed dehydration of carbohydrates, represent an abundant and underutilized waste stream in biorefineries [30,31,32]. Their hybrid aromatic–aliphatic structure [33,34] makes them suitable candidates for conversion into functionalized carbon nanomaterials with catalytic and environmental applications [35,36,37,38]. Despite their high carbon content, chemical stability, and widespread availability, humins have not been explored as precursors for CQDs to date, with a single study—the CQD/ZnO system reported by our group [14]—representing the only example in the literature. Leveraging humins for CQD synthesis represents a novel and underexploited pathway for valorizing this low-value biorefinery side stream.
Herein, we report an environmentally friendly hydrothermal decomposition of humins to small-sized, highly homogeneous and bright blue-emitting CQDs. The as-prepared CQDs were subsequently integrated into different TiO2 matrices to fabricate CQD@TiO2 nanocomposites. Their photocatalytic efficiency was evaluated using methylene blue (MB) as a representative organic dye pollutant and diclofenac (DCF), a widely used non-steroidal anti-inflammatory drug, demonstrating the strong potential of these nanocomposites for wastewater treatment and environmental remediation applications. The superior photocatalytic activity was attributed to improved light harvesting, efficient charge separation, and reduced electron–hole recombination induced by the CQD photosensitizer.
2. Results and Discussion
2.1. Structural Characterization of CQDs
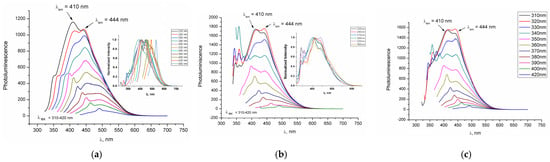
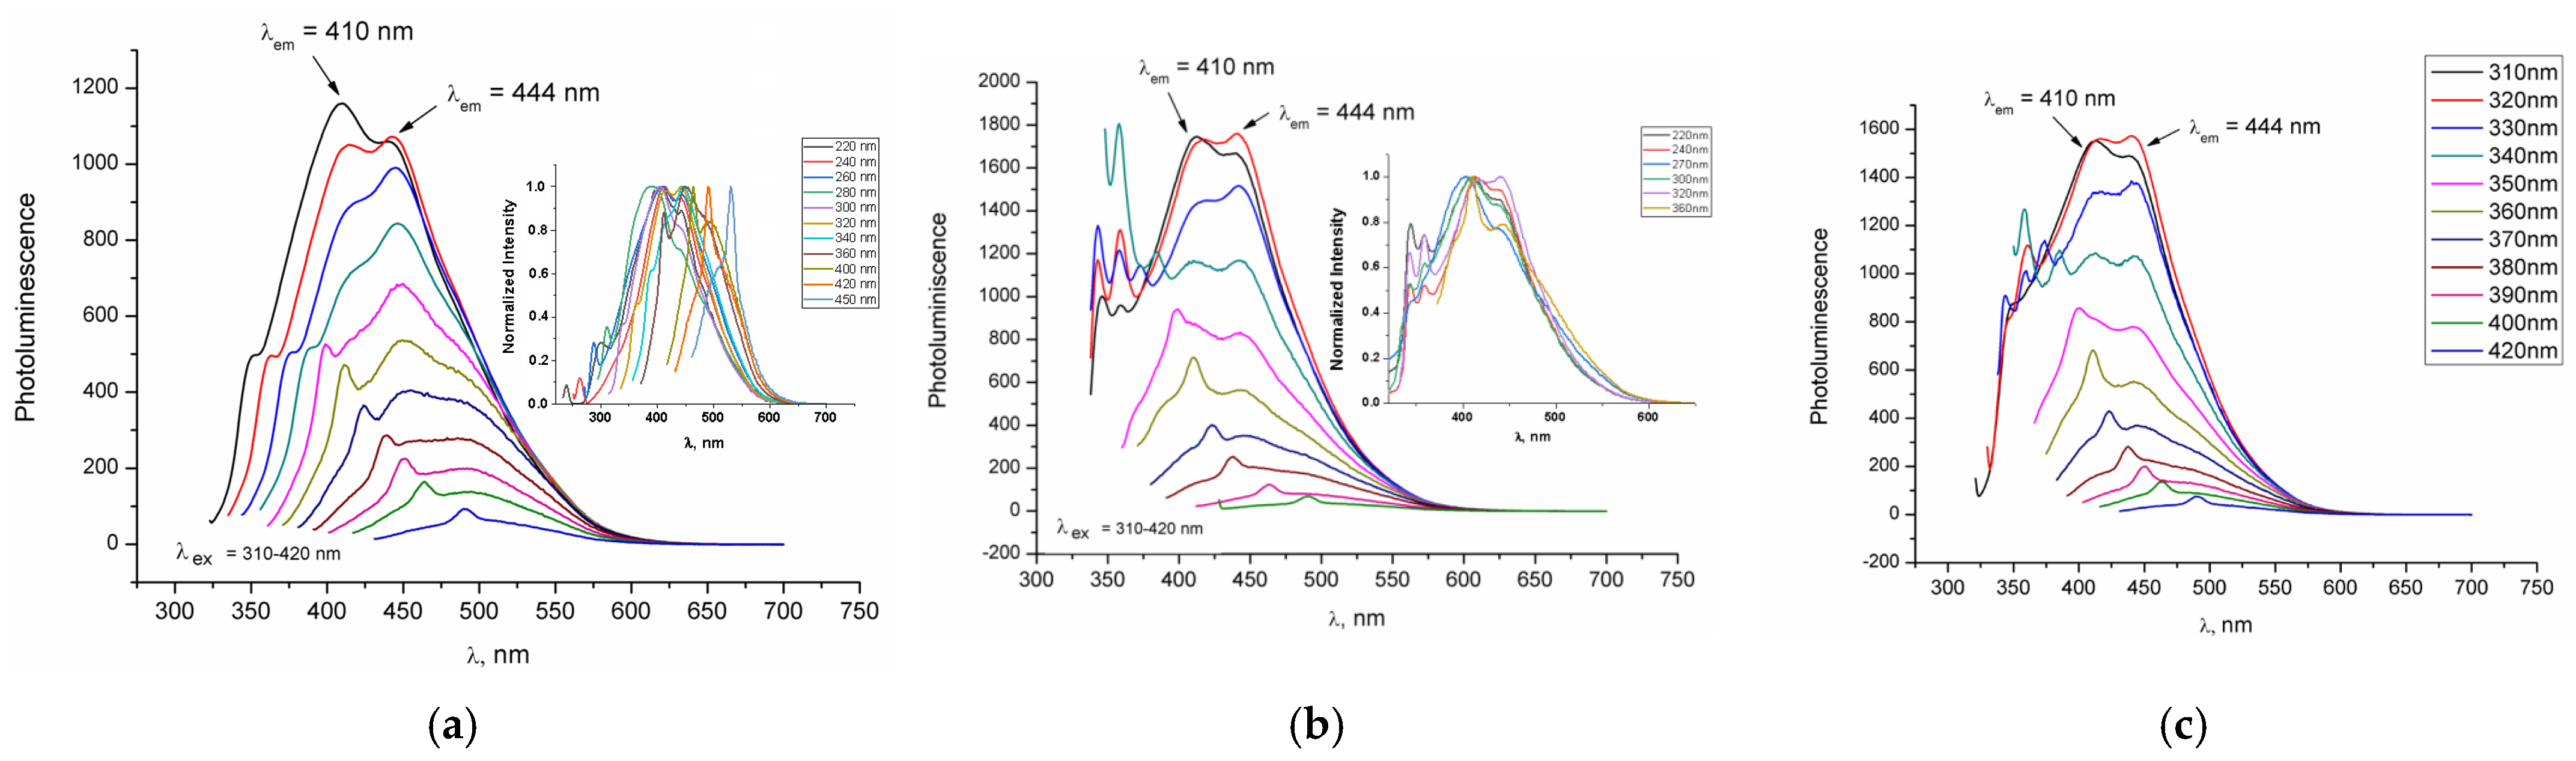
The synthesis of CQDs considered the factors that formed the basis for previously reported work [14], that is, hydrothermal temperature and reaction time, which are critical parameters governing the nucleation, growth, and photoluminescence (PL) properties of CQDs. In this study, the highest PL intensities were achieved under either high-temperature/short-time conditions (CQD200-4, Figure 1a) or low-temperature/extended-time conditions (CQD180-12, Figure 1b), underscoring the strong interplay between the reaction kinetics, particle size evolution, and surface passivation mechanisms. Nevertheless, the PL spectrum of CQD180-12 exhibits a complex and irregular profile characterized by several sharp violet emission bands below 400 nm, indicating the presence of multiple emitting centers. These features suggest contributions from molecular fluorophores and/or surface-associated impurity states, rather than intrinsic CQD emission. To elucidate the origin of these emissions, the sample was subjected to dichloromethane washing, yielding CQD180-12S. The corresponding PL spectrum (Figure 1c) reveals the suppression of sharp violet emissions from the PL spectrum of CQD180-12 sample (Figure 1b), confirming their assignment to the weakly bound organic species adsorbed on the CQD surface.
Figure 1.
(a) PL spectra of CQD200-4 sample; (b) PL spectra of CQD180-12 sample; and (c) PL spectra of CQD180-12S sample with λex of 310-420 nm. Inset: PL spectra with normalized intensity.
Importantly, the remaining emission consisted of a broad and intense blue band, whose intensity exceeded that observed for CQD200-4 (Figure 1a). This emission is characteristic of surface state-dominated luminescence associated with oxygen-containing functional groups, which is in full agreement with the XPS results (Figure 2 and Table 1). These findings demonstrate that post-synthetic purification effectively enhances the intrinsic PL response of CQDs by eliminating extrinsic fluorophores, thereby yielding structurally and optoelectronically uniform nanodots with superior emission characteristics. All CQDs exhibited two main emission centers: an indigo blue band at approximately 410 nm and a blue band at 444 nm, accompanied by weaker violet features below 400 nm.
Figure 2.
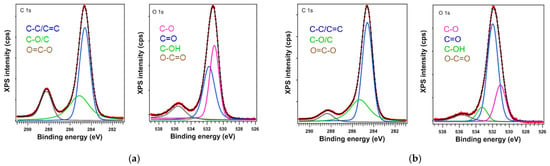
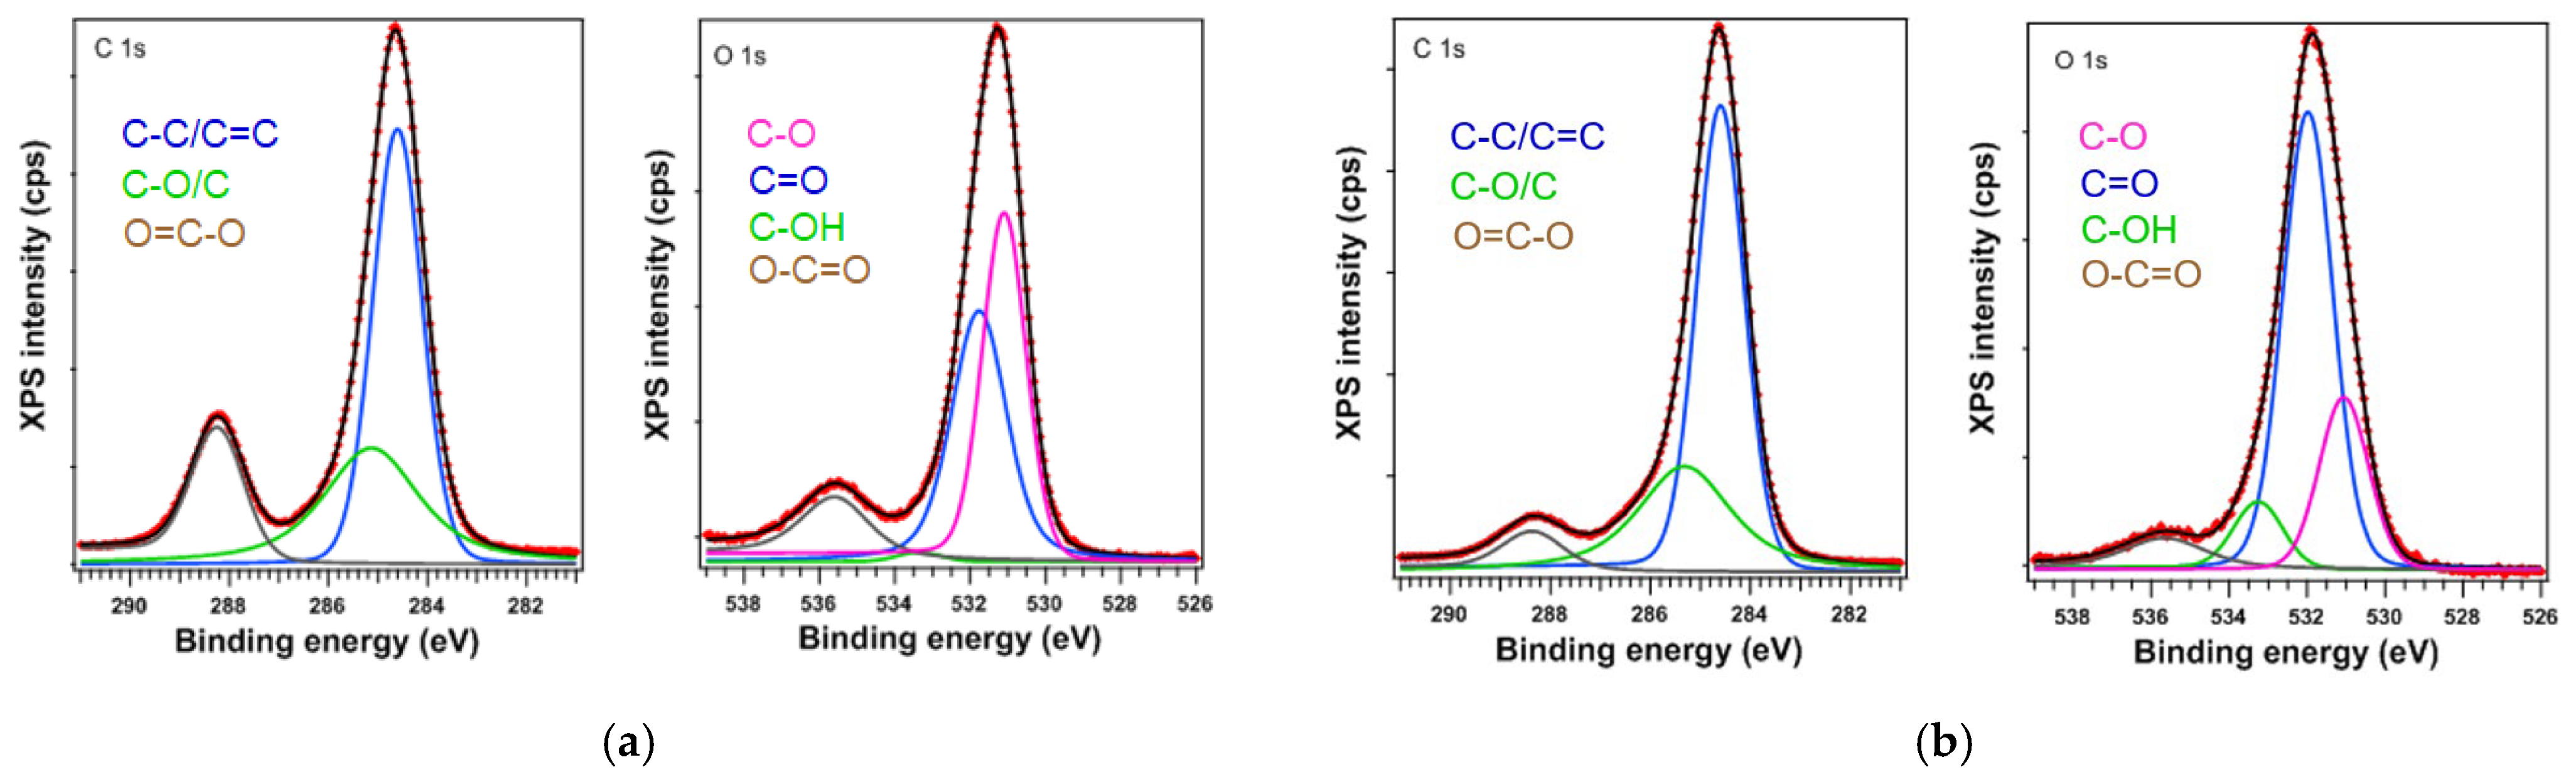
(a) high-resolution XPS of C1s and O1s levels for CQD200-4 sample; and (b) high-resolution XPS of C1s and O1s levels for CQD180-12S sample. Note: the background signal is represented by the black dashed line with red markers.
Table 1.
The atomic composition and nature of elements determined by XPS spectra deconvolution.
The relative intensity of the 410 nm band decreased with increasing excitation wavelength, whereas the 444 nm band became more prominent, indicating distinct emissive origins. For excitation wavelengths below 360 nm, both emission centers remained essentially excitation-independent (Figure 1a,b, insets). However, when the excitation wavelength was increased from 360 to 450 nm, a pronounced redshift was observed, with the emission of CQD200-4 shifting from 445 to 530 nm (Figure 1a), which was also observed in the case of CQD180-12
The co-existence of excitation-independent and excitation-dependent PL behavior reflects the dual nature of CQDs. The excitation-independent emission is characteristic of small and homogeneous sp2-carbon domains, where π-π* transition dominates [39]. In contrast, the excitation-dependent redshift arises from larger nanoclusters enriched with polar surface groups (C=O or C-OH), which introduce sub-bandgap emissive states and facilitate rapid relaxation to lower energy levels [40,41].
The XPS analysis (Figure 2) correlates well with the observed PL behavior, consistently supporting the identified trends. In particular, CQD200-4 was characterized by a higher overall content of oxygen-containing species (28.85%), with a significantly increased contribution of carboxylate functionalities (12.4% O–C=O at 535.6 eV) (Figure 2a and Table 1). These carboxyl surface groups can act as non-radiative recombination centers at the edges of CQDs, thus accounting for the lower PL intensity [42]. In contrast, CQD180-12S exhibited a surface chemistry dominated by epoxy and ether functionalities (18.83% oxygen-containing species), accompanied by a reduced contribution of carboxylate groups (8.21%; Figure 2b and Table 1). Furthermore, the presence of surface hydroxyl groups contributes to the long-term colloidal stability of CQDs, enabling stable aqueous dispersions over several months, in agreement with previous reports [43].
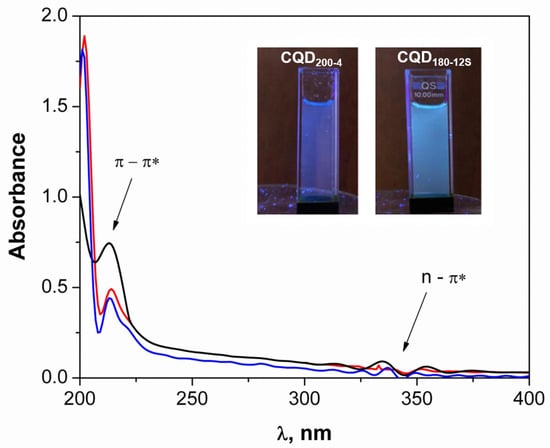
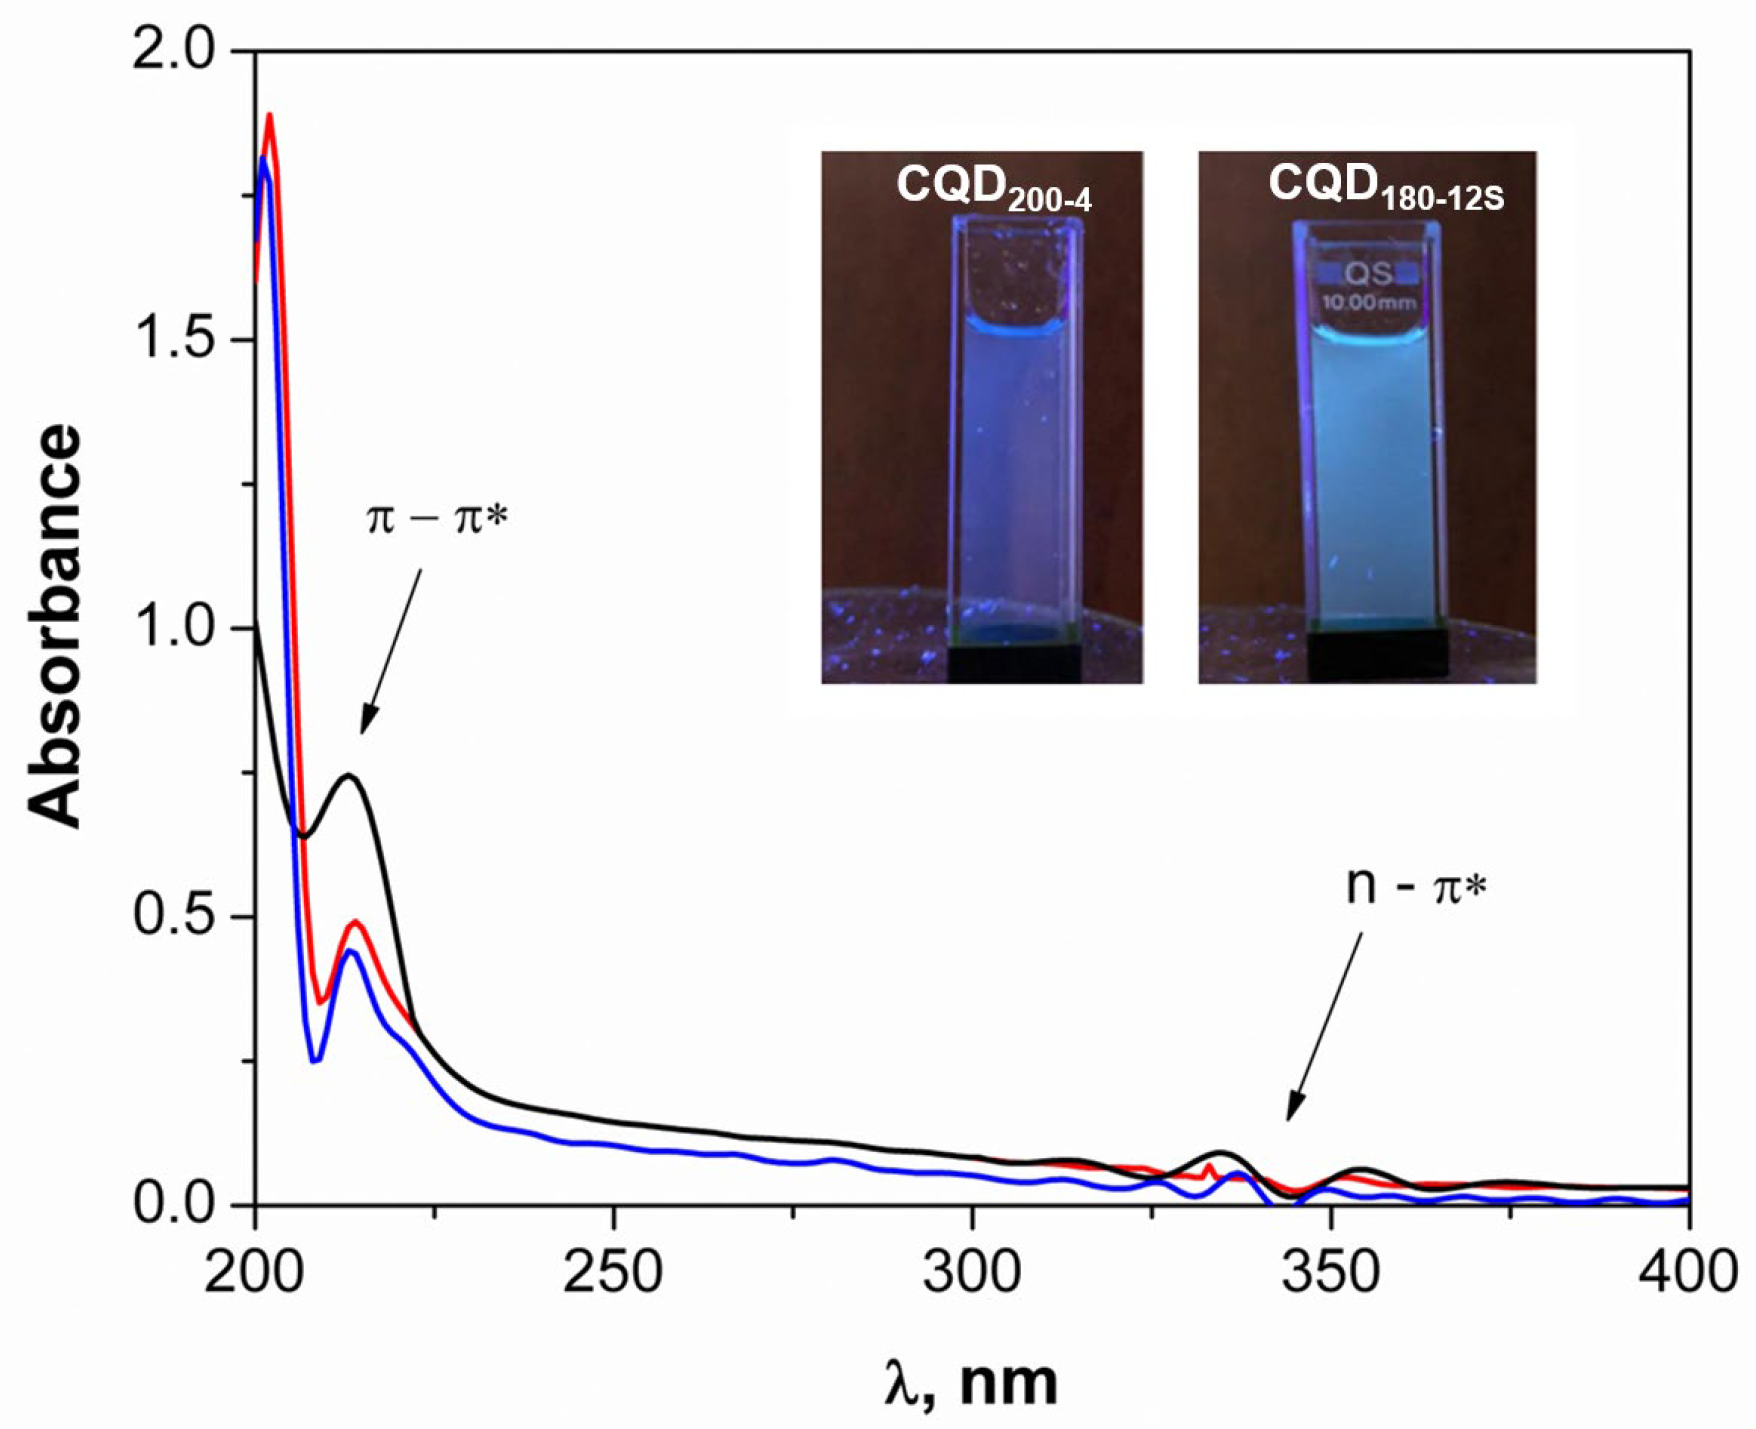
All UV–Vis spectra (Figure 3) show strong UV absorption with π − π* transitions of aromatic C=C bonds in sp2 hybrid domains at shorter wavelengths (220 nm) and n − π* transition of C=O/C-OH groups in sp3 hybrid region at longer wavelengths (335 and 355 nm), in agreement with previous CQDs [14] and GQDs [44]. Under 365 nm illumination, the CQDs emitted blue fluorescence, confirming redshifted PL emission (Figure 3, inset).
Figure 3.
UV–Vis spectra (D) for CQD200-4 (black), CQD180-12 (blue) and CQD180-12S (red) (Inset: images of the CQD200-4 and CQD180-12S solutions collected under UV light at 365 nm).
The quantum yield (QYs, λex = 366 nm) trend was consistent with the UV–Vis and XPS results. As a consequence of the reduced concentration of -COOH attached to the edges of sp2-conjugated π-domains, the quantum yields (λex = 366 nm) of CQDs synthesized at lower temperatures but longer reaction times are higher: 21% (CQD180-12) ≅ 20% (CQD180-12S) > 15% (CQD200-4) [45]. The measured QY values are affected by the C-O/C-OH and O-C=O/COOH groups and, very interestingly, higher in comparison to most of those reported for biomass-derived CQDs without functional group modulation (<10%) [39,45,46].
2.2. Characterization of CQD@TiO2 Nanocomposites
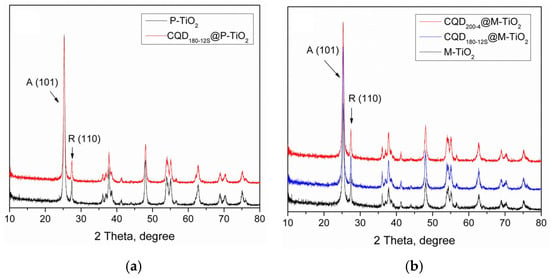
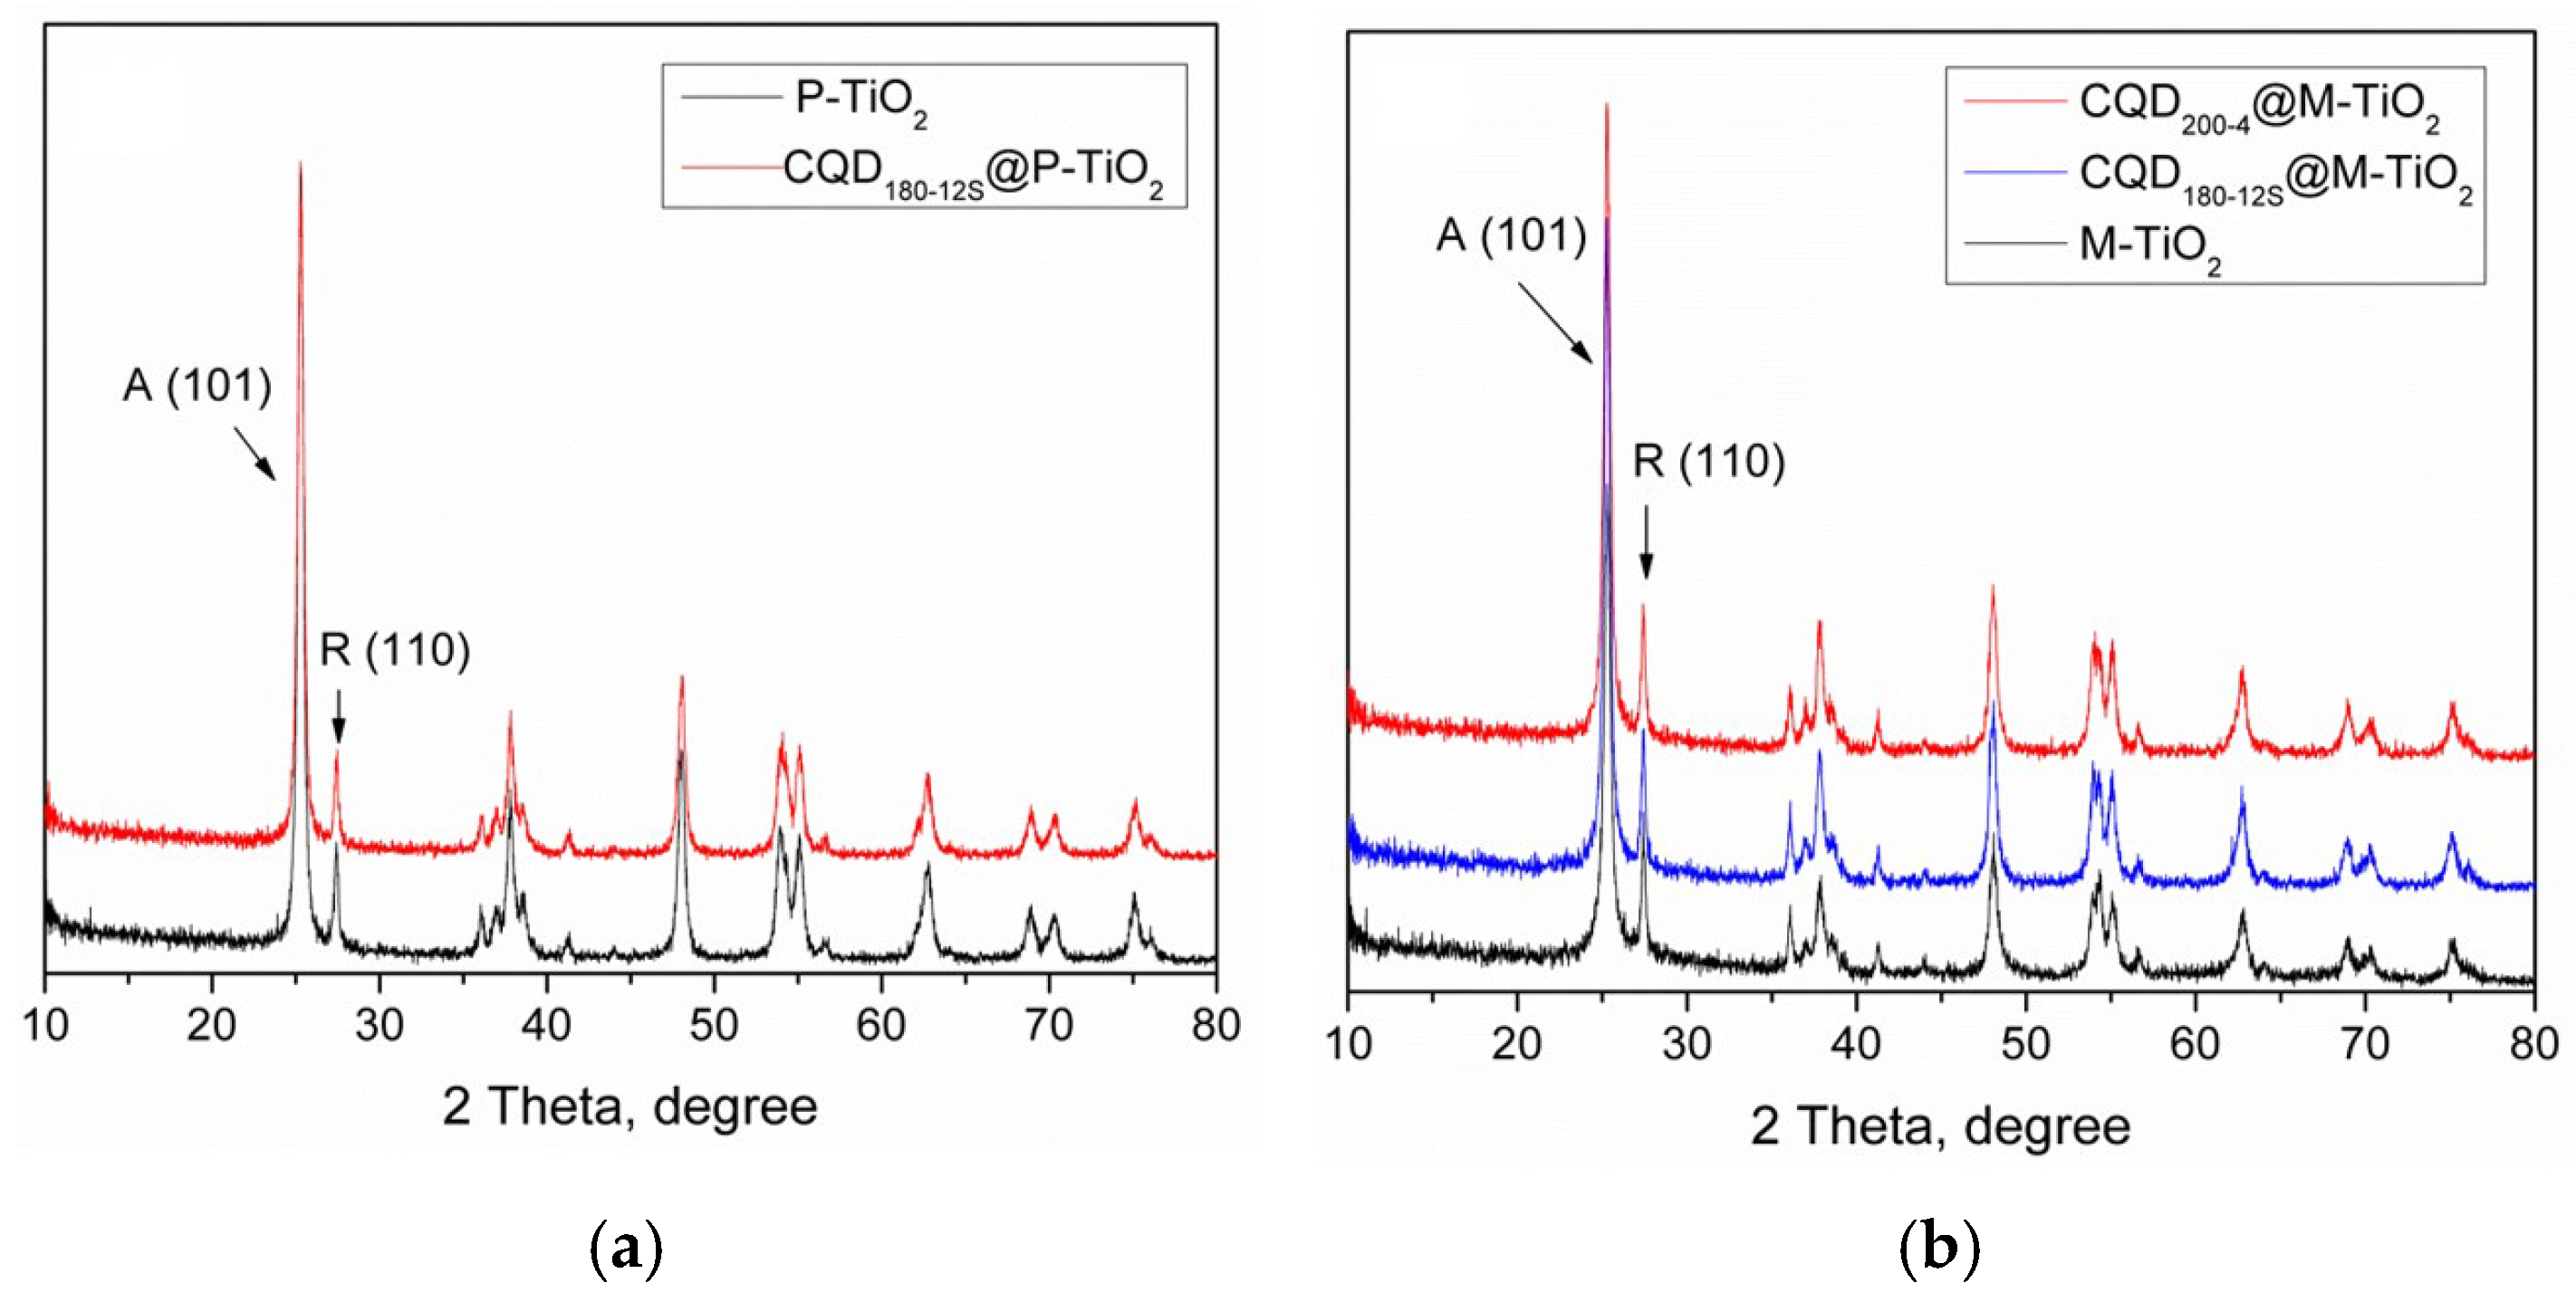
The XRD patterns of P-TiO2, M-TiO2 and CQDs@TiO2 nanocomposites are presented in Figure 4. As expected, the diffraction lines at 25.3°, 37.8°, 48.1°, 54.0°, and 62.7° correspond to the (101), (004), (200), (105), and (204) planes of anatase TiO2 (JCPDS 21-1272) [47], while the reflections at 27.4°, 35.9°, 54.9°, and 68.8° are characteristic of the (110), (101), (211), and (301) planes of rutile TiO2 (JCPDS 21-1276) [48]. No diffraction lines associated with the brookite TiO2 phase (29.8° and 44.4°; JCPDS 74-1940) were detected [49], confirming that only the anatase and rutile phases were present.
Figure 4.
(a) XRD patterns of CQD180-12S @P-TiO2 sample and corresponding P-TiO2 carrier; and (b) XRD patterns of CQD200-4 @M-TiO2, CQD180-12S @M-TiO2 and corresponding M-TiO2 carrier.
The reflections at 25.30° (anatase (101)) and 27.40° (rutile (110)), highlighted by arrows in Figure 4, were used to estimate the anatase/rutile ratios (Equation (1)) [50]. For P-TiO2, the composition was 84.5% anatase and 15.5% rutile, consistent with the well-known P25 (Degussa) formulation. After hydrothermal treatment in concentrated NaOH, followed by acid washing and calcination, the resulting M-TiO2 showed a clear increase in rutile content, reaching 28% rutile and 72% anatase. This shift reflects the partial transformation of anatase into rutile during alkaline treatment.
The XRD patterns of the CQDs@TiO2 nanocomposites (Figure 4) closely matched those of their respective TiO2 supports, with no detectable peak shifts or new reflections. This indicates that the deposition of CQDs does not alter the crystalline structure of TiO2 and that the CQDs are not incorporated into the TiO2 lattice but instead remain on the surface [51]. The absence of diffraction lines attributable to CQDs is expected, given their low loading, poor crystallinity, ultrasmall size, and high dispersion, which is consistent with previous reports [39].
The crystallite sizes, estimated using the Debye–Scherrer equation (Equation (2)), fall within a narrow range of 18.3–20.0 nm, confirming that both M-TiO2 and P-TiO2, as well as their CQD@TiO2 counterparts, consist of nanocrystalline particles (Table 2).
Table 2.
Anatase–rutile phase composition and crystallite sizes of the CQD@TiO2 samples.
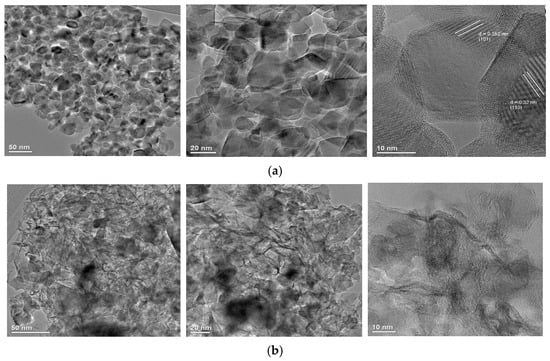
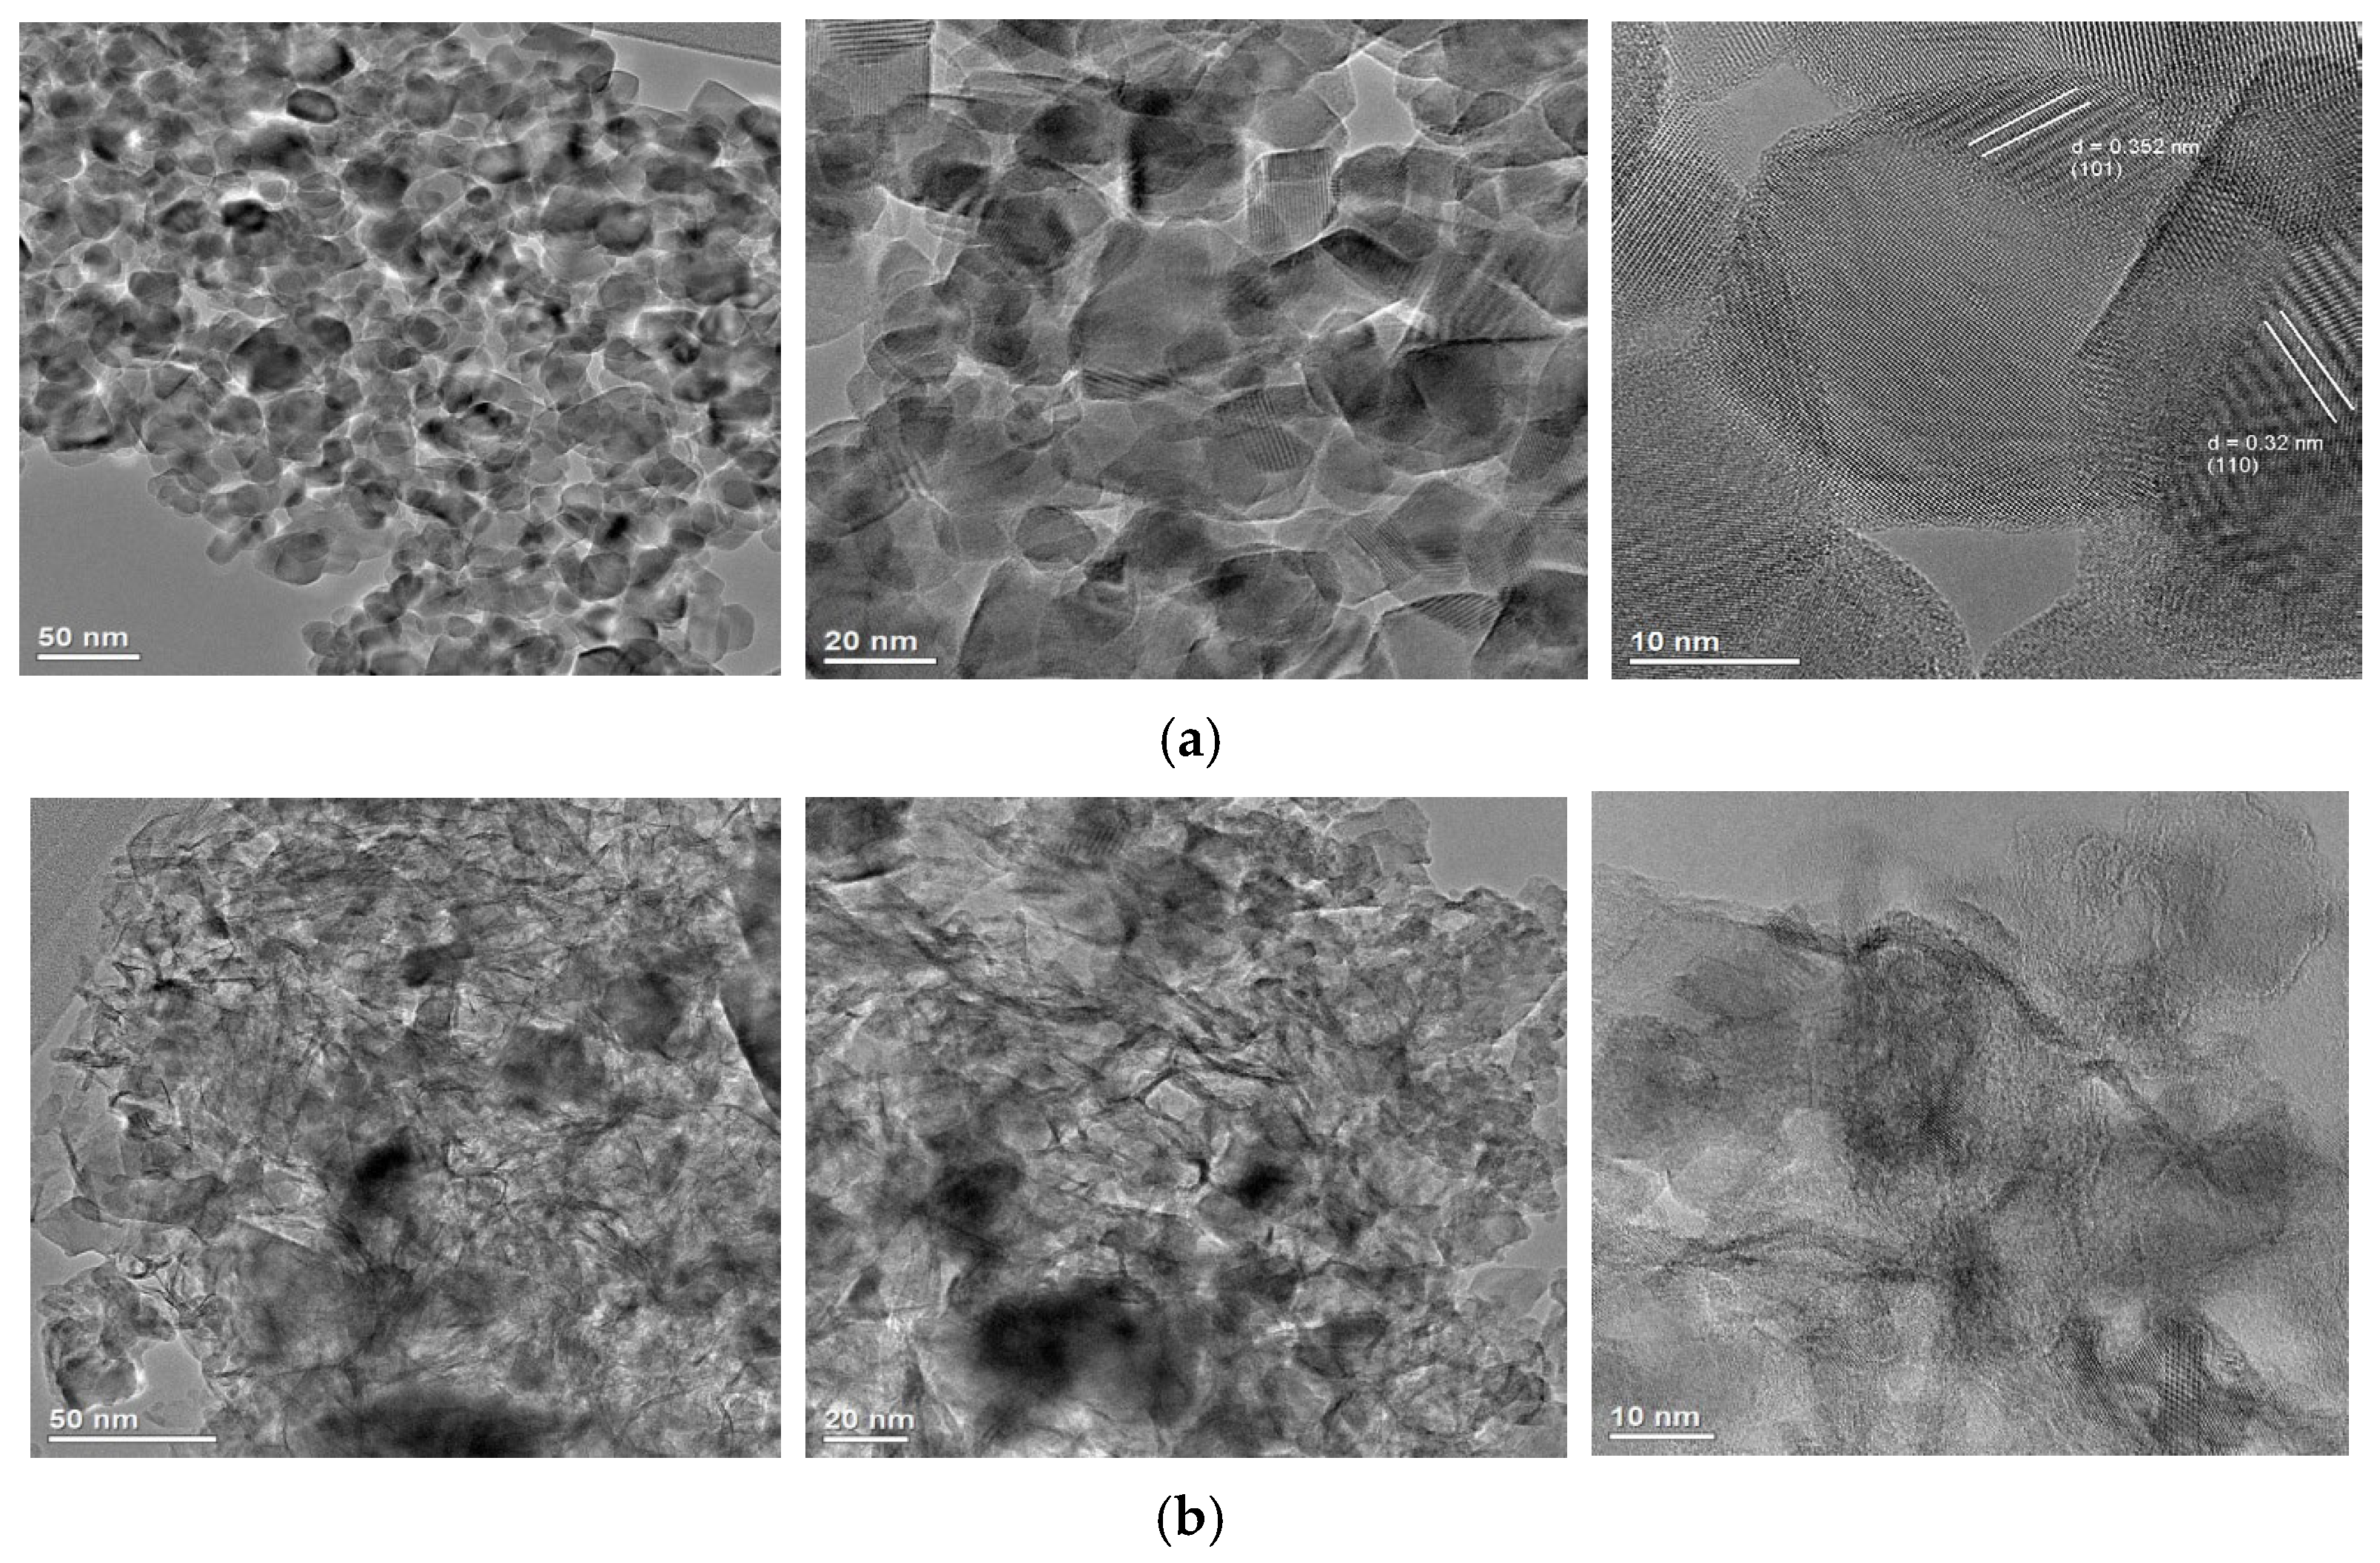
Nevertheless, HR-TEM analysis revealed clear structural differences between the two TiO2 supports (Figure 5).
Figure 5.
(a) HR-TEM images of the P-TiO2 sample at three different magnifications; and (b) HR-TEM images of the M-TiO2 sample at three different magnifications.
The P-TiO2 sample (Figure 5a) comprised well-defined nanoparticles exhibiting lattice fringes corresponding to the anatase (101) and rutile (110) planes. These crystallographic features unequivocally confirm that the anatase and rutile phases coexist as distinct crystalline domains while remaining in close spatial proximity, resulting in mixed-phase agglomerates. Such intimate interfacial contact between anatase and rutile is known to promote the formation of heterojunctions at the phase boundaries. These interfacial junctions play a crucial role in modulating charge carrier dynamics by facilitating directional electron transfer and suppressing electron–hole recombination, thereby significantly influencing the charge separation efficiency and overall photocatalytic performance of the material [52]. A markedly different morphology was observed for the M-TiO2 sample (Figure 5b). After hydrothermal treatment in concentrated NaOH, followed by acid washing and calcination at 450 °C, the material evolved into nanoparticle/nanotube hybrid structures, confirming the well-known tendency of anatase to preferentially form titanate-derived nanotubular structures, due to its longer c-axis and lower surface energy compared to rutile [53].
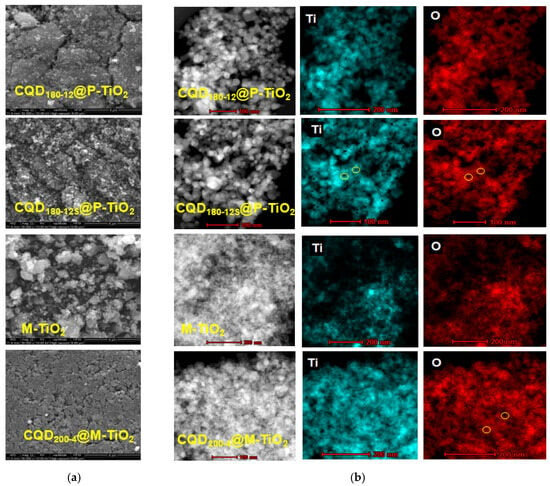
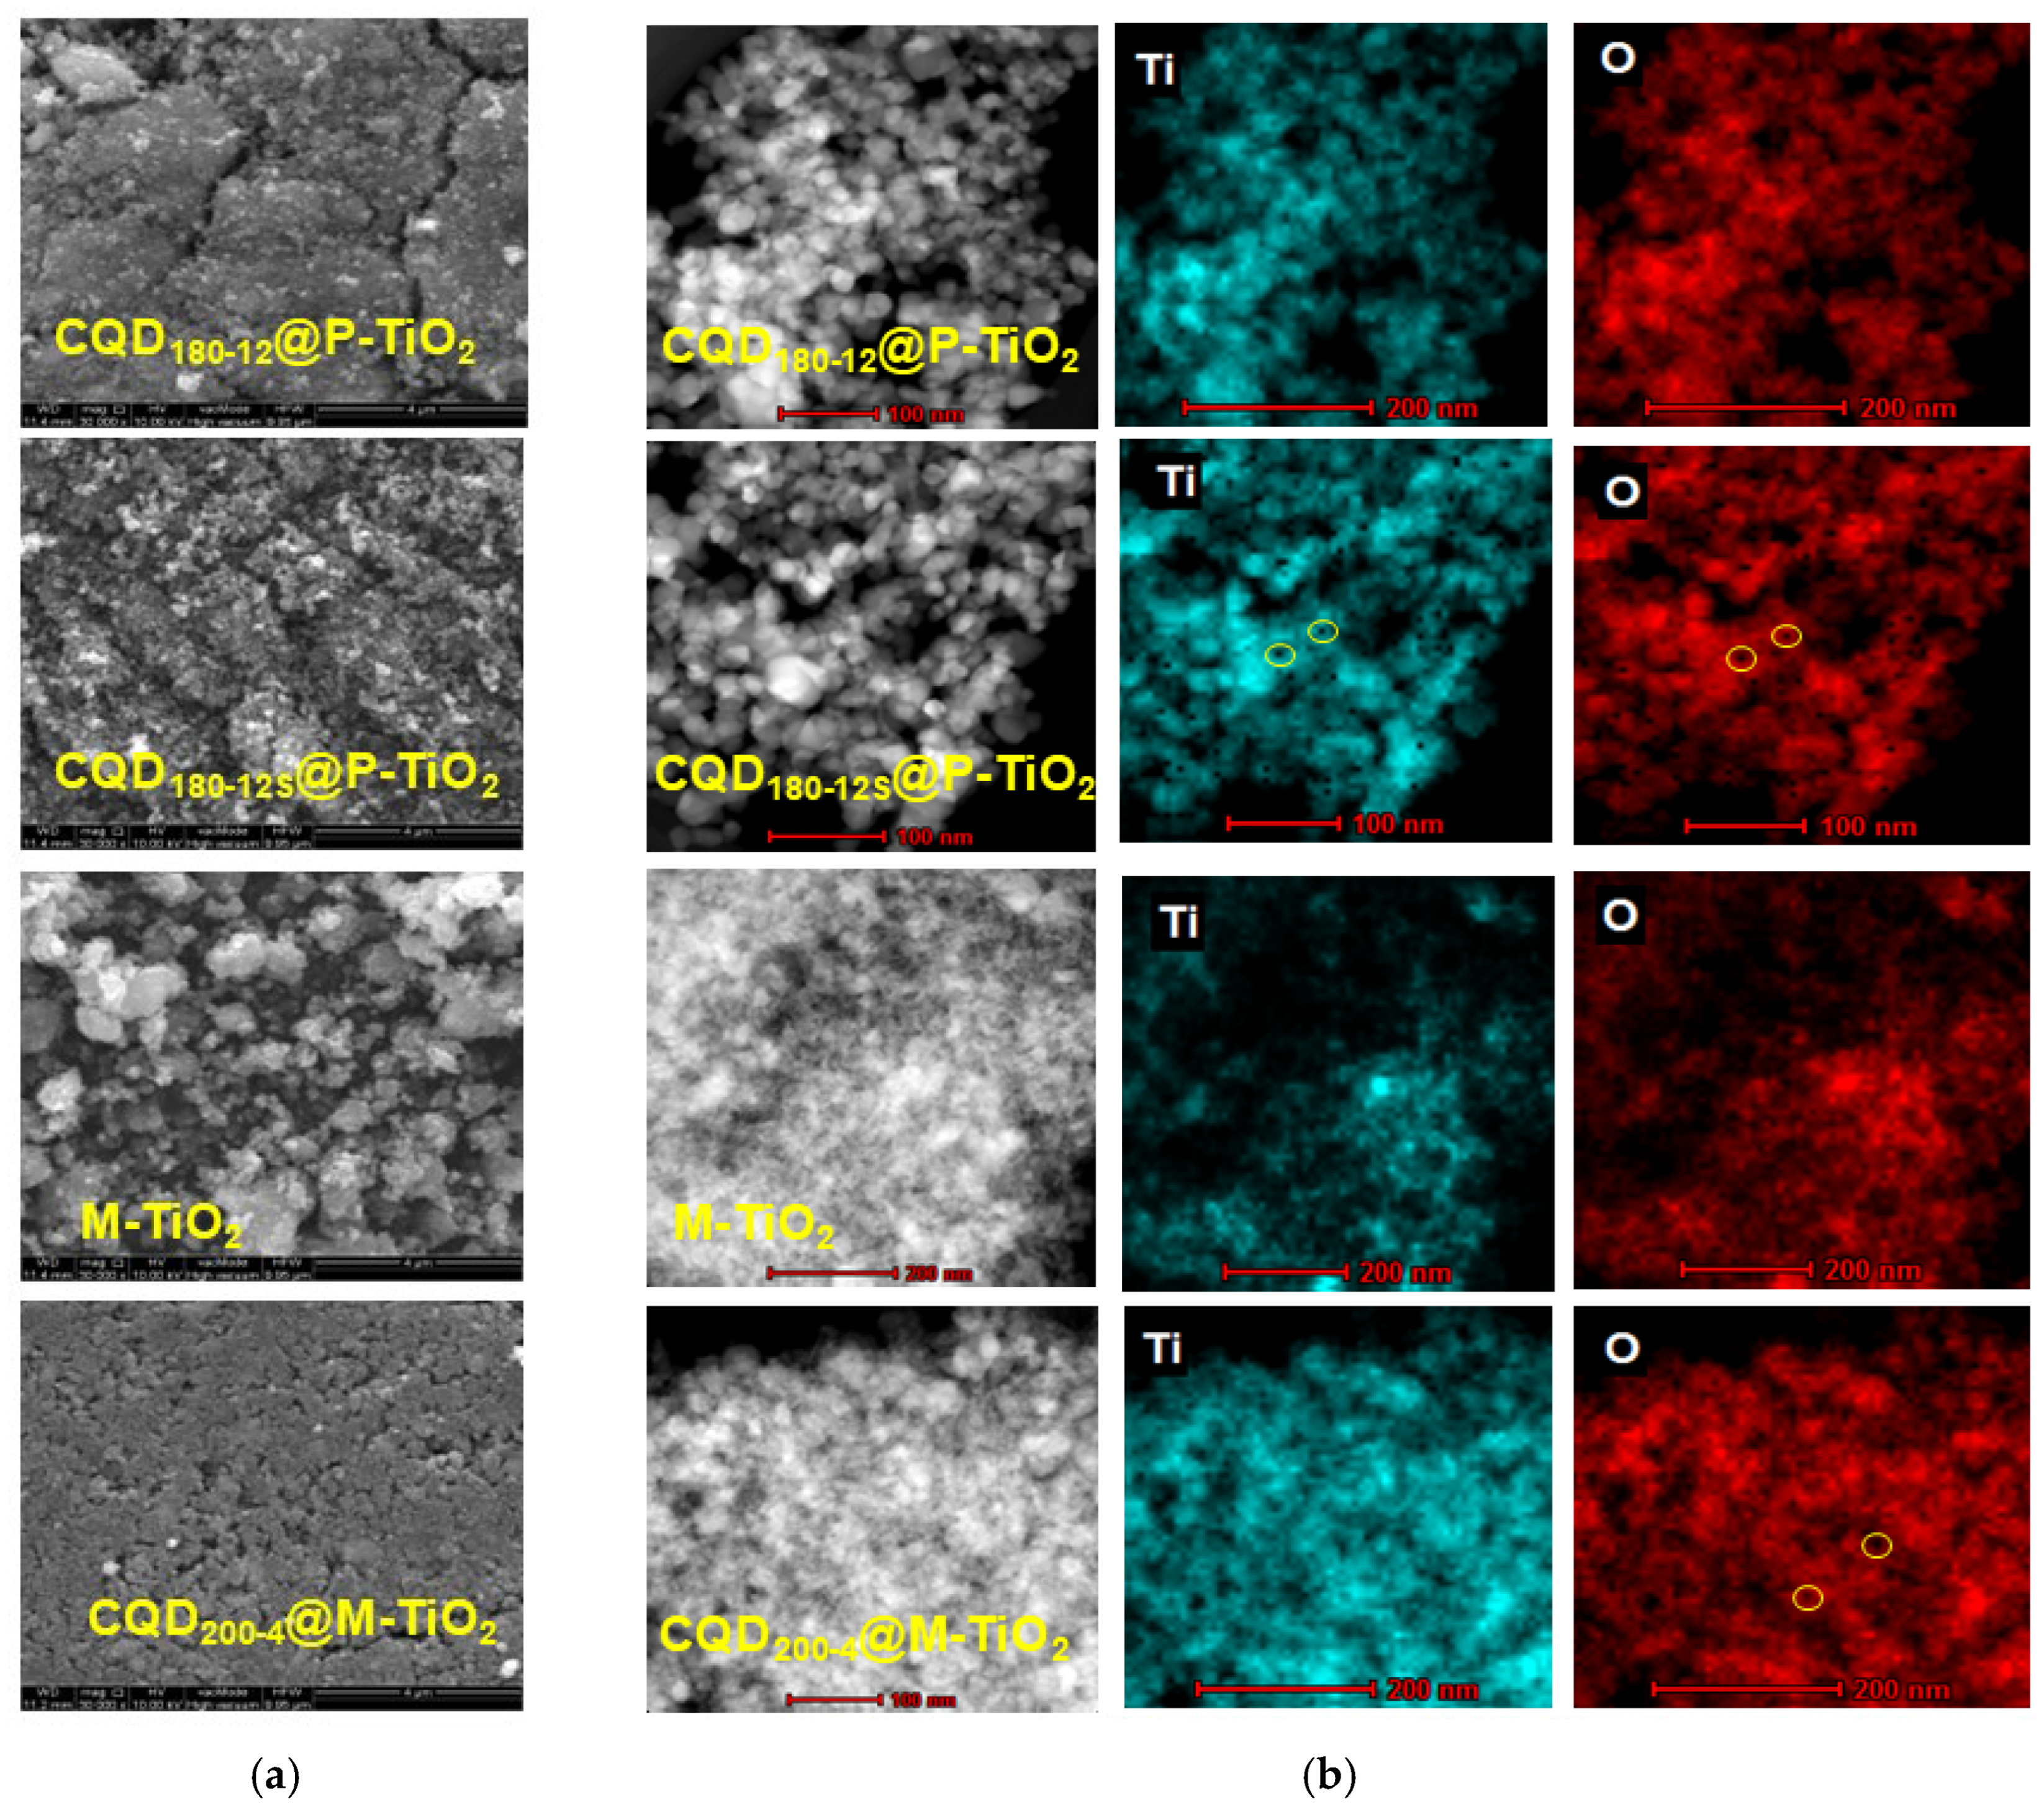
At larger-length scales, SEM (Figure 6a) shows that these nanoscale building blocks assemble into micron-sized spherical aggregates with well-defined crystalline surfaces in all samples. Additionally, it can be seen that the particles agglomerate to form a rough, porous texture. The morphologies of the CQD-modified samples were further examined using STEM-EDS (Figure 6b).
Figure 6.
(a) SEM images of CQDT-t@P-TiO2 and CQDT-t@M-TiO2 samples; and (b) STEM-EDS elemental mapping images of CQDT-t@P-TiO2 and CQDT-t@M-TiO2 samples. Note: The circled areas highlight the CQDs.
For the P-TiO2-based composites, the images show numerous nanoparticles with diameters in the range of 27–30 nm, consistent with the TEM (Figure 5) and XRD (Figure 4, Table 2) observations. In contrast, M-TiO2-based composites display a three-dimensional fibrous network, in which the nanotubes are interconnected and bundled, forming porous frameworks rather than isolated structures, with nanoparticles adhered to the surface of the nanotubular framework. Importantly, in all CQD@TiO2 samples, individual CQDs were clearly visible on the TiO2 surface. Their spherical morphology and narrow size distribution confirmed the successful deposition of CQDs onto both TiO2 supports. The CQD sizes correlate well with the hydrothermal synthesis conditions: CQD180-12 and CQD180-12S samples predominantly exhibit 2 nm particles, while CQD200-4 shows a larger size of approximately 8 nm (Figure 6b). These observations are consistent with the PL results (Figure 1), which indicate that longer reaction times at lower temperatures favor the formation of smaller CQDs, whereas higher temperatures promote the growth of larger nanoclusters.
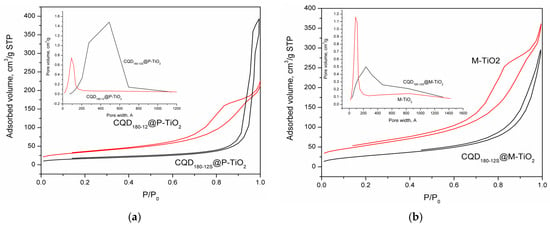
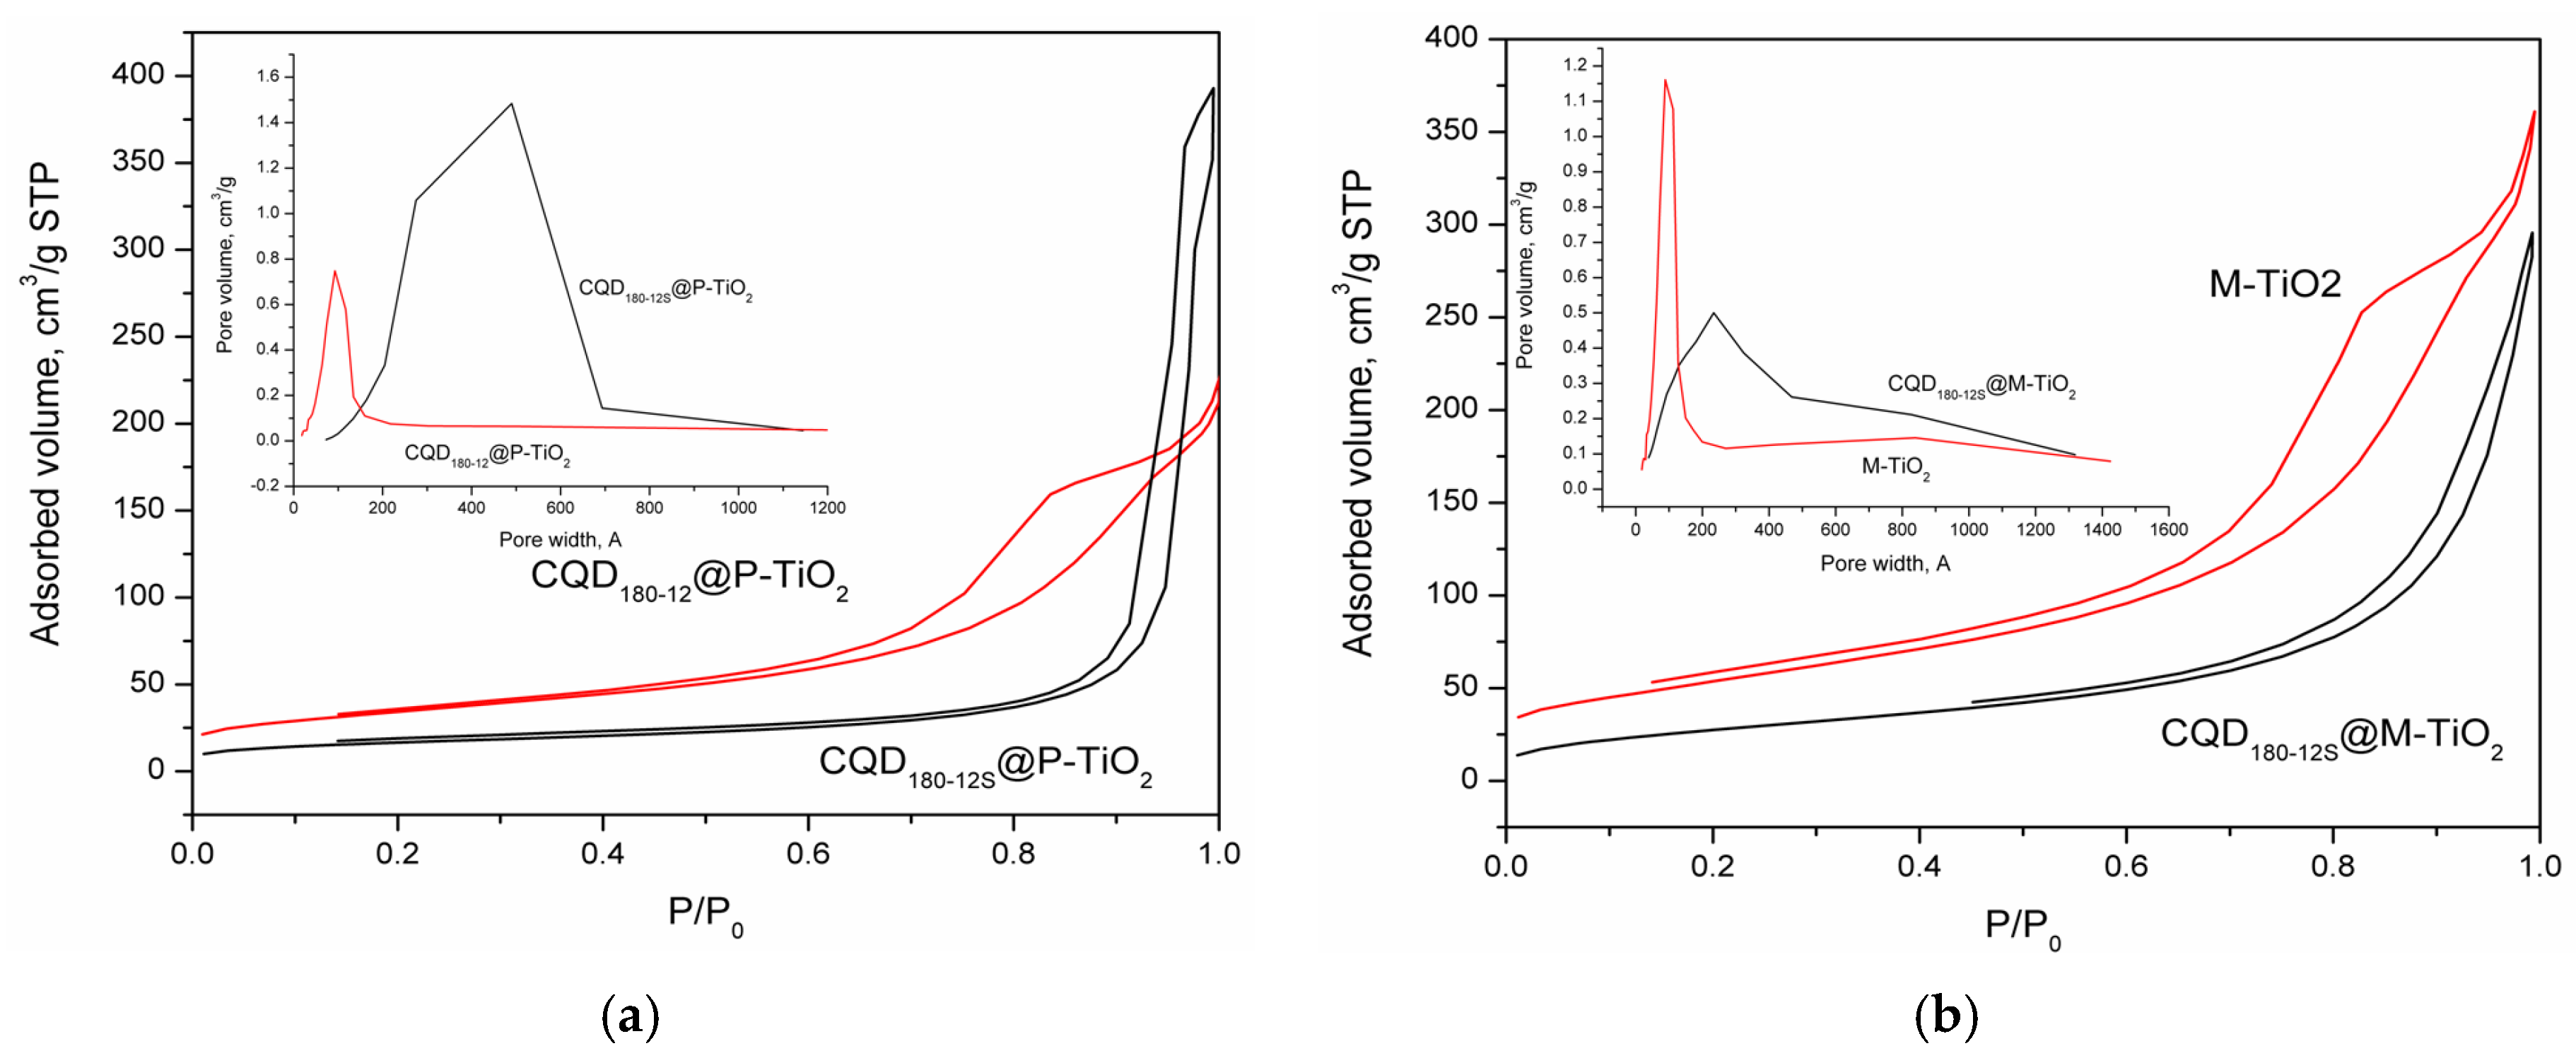
The increased intensity of the rutile reflections observed in the XRD pattern of M-TiO2 correlates with this structural reorganization, suggesting partial dissolution–recrystallization during the NaOH treatment (Figure 4b). Moreover, the tubular/fibrous structure was confirmed by the strong increase in the surface area of the M-TiO2 and CQD@M-TiO2 samples (Figure 7 and Table 3). All samples exhibited type IV isotherms with H3-type hysteresis loops, characteristic of mesoporous materials containing slit-shaped pores or aggregates of plate-like particles (Figure 7). The pronounced uptake of N2 at relative pressures between 0.5 and 1.0 confirms the presence of mesopores in the synthesized materials.
Figure 7.
(a) N2 adsorption–desorption isotherms at −196 °C for CQD@P-TiO2; and (b) N2 adsorption–desorption isotherms at −196 °C for CQD@M-TiO2 nanocomposite. Inset: the Barrett–Joyner–Halenda (BJH) pore distribution.
Table 3.
BET surface areas, pore volumes, and pore sizes of the CQD@TiO2 nanocomposites.
For CQD180-12S@P-TiO2, the hysteresis loop extended into the high-pressure region (0.8 < p/p0 < 1.0), indicating the presence of larger inter-particle voids formed between secondary aggregates [9]. The BJH analysis revealed a bimodal pore size distribution, with intra-aggregated pores centered at 27.1 nm and larger inter-aggregated pores at approximately 49 nm (Table 3). This dual porosity is consistent with the structural rearrangements induced by CQD deposition and the aggregation behavior of the P-TiO2 nanoparticles [54]. In contrast, the M-TiO2-based samples displayed pore size maxima at 9.1 nm and 23.3 nm, reflecting the presence of both nanotubular structures and nanoparticle-decorated fibrous networks. The shift toward larger mesopores in the CQD-modified M-TiO2 samples suggests that CQDs influence the packing and interconnection of the nanotube–nanoparticle framework. The BET surface areas further highlight the structural differences between these materials. Pristine P-TiO2 exhibited a surface area of 54 m2/g, which increased to 123 m2/g upon modification with CQD180-12 and to 59 m2/g for CQD180-12S@P-TiO2 (Table 3, entries 1–3).
These increases reflect both the contribution of CQDs and the changes in particle aggregation induced by their deposition. The hydrothermally treated M-TiO2 had a significantly higher surface area of 194 m2/g (Table 3, entry 4), which can be attributed to its nanoparticle/nanotube hybrid morphology (Figure 5b). After CQD loading, the surface area further increased to 203 m2/g (CQD180-12S@M-TiO2), indicating that the CQDs enhanced the surface roughness and created additional interfacial regions.
Overall, the observed increases in the surface area and pore volume can be attributed to two main factors: (a) structural modifications of M-TiO2, which generate a high surface-area heterophase network composed of anatase nanoparticles, rutile nanoparticles, and anatase nanotubes; and (b) anchoring of CQDs, which increases the surface roughness and introduces a secondary interface between CQDs and TiO2, contributing to additional porosity and improved textural properties. These enhanced textural characteristics are expected to play a beneficial role in photocatalytic applications by providing more accessible active sites and facilitating the adsorption and diffusion of organic molecules.
The successful incorporation of CQDs into the TiO2 framework was also supported by elemental analysis (Table 4) and FT-IR spectroscopy (Figure 8). The C and H contents derived from CQDs varied in the ranges of 1.1–4.2% and 0.3–1.3%, respectively (Table 4), indicating the successful loading of CQDs on the titania carriers and confirming the presence of carbonaceous domains on the surfaces of both M-TiO2 and P-TiO2 supports.
Table 4.
Eg values obtained from Tauc plots.
Figure 8.
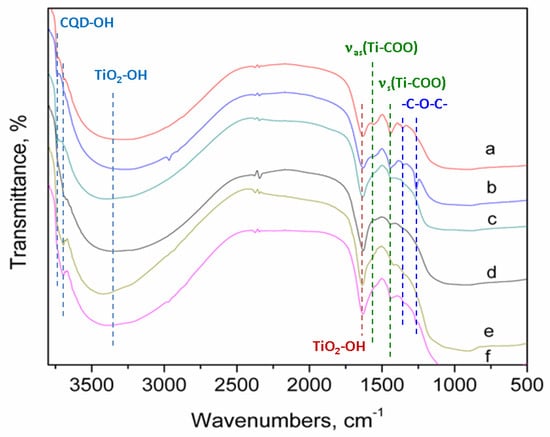
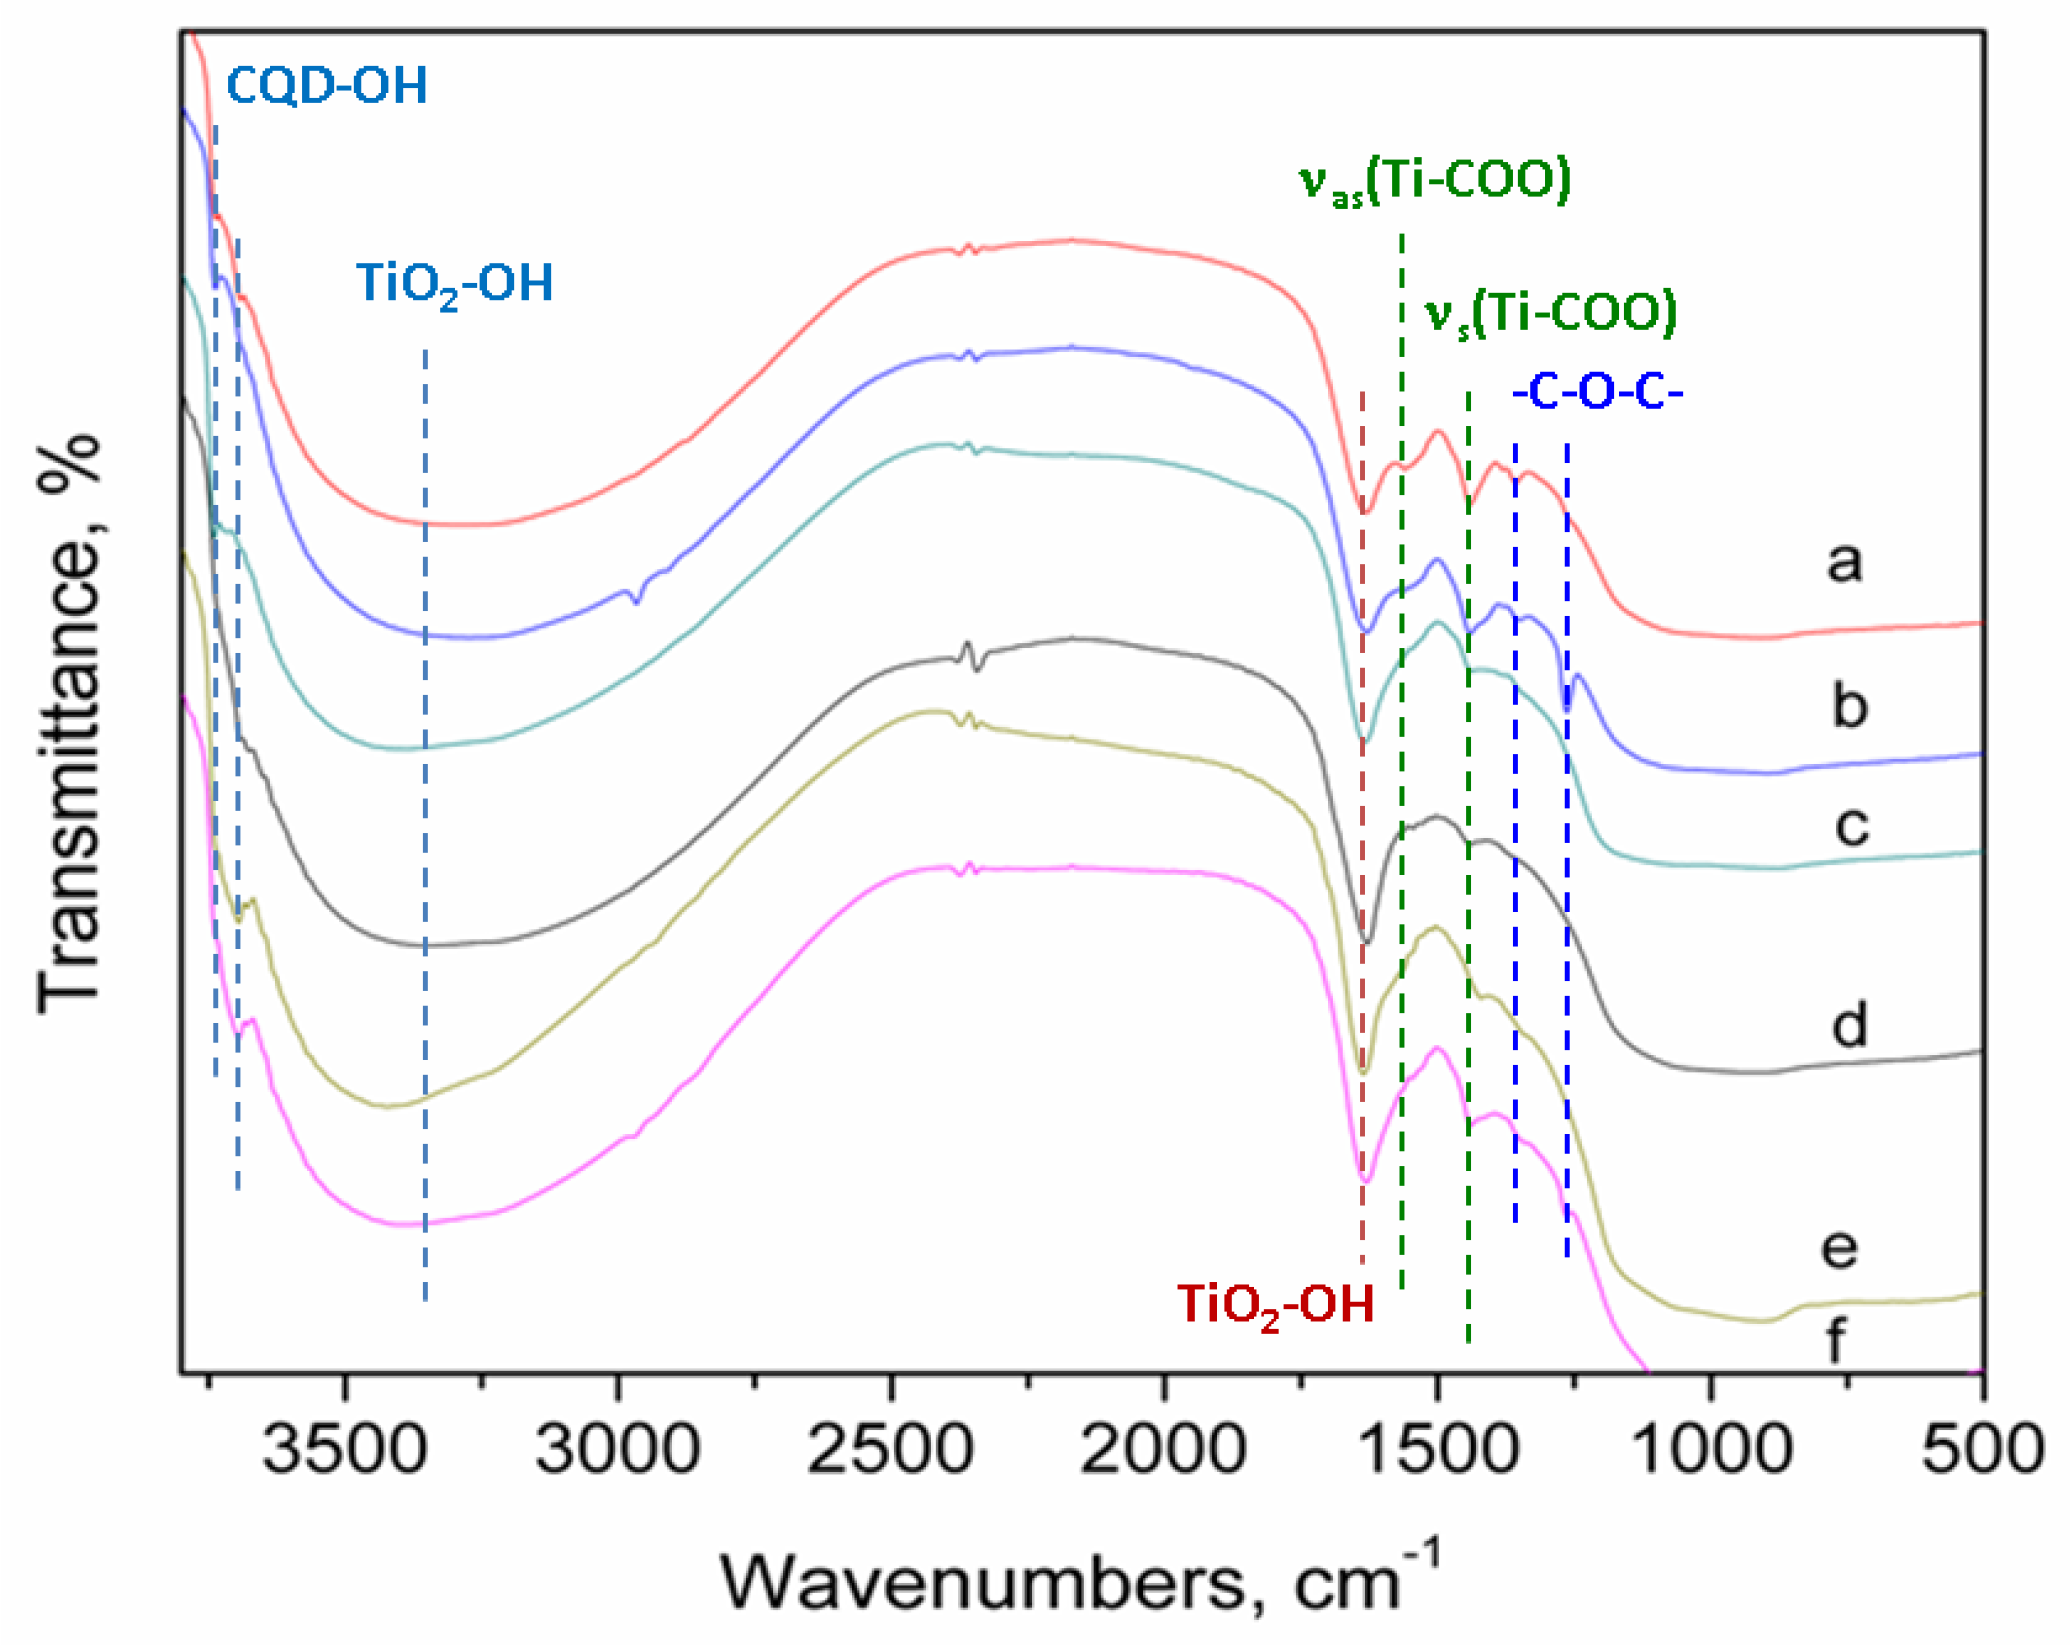
FT-IR spectra of the M-TiO2 and CQD@TiO2 nanocomposites: (a) CQD180-12S@M-TiO2; (b) CQD200-4@M-TiO2; (c) CQD180-4@M-TiO2; (d) M-TiO2; (e) CQD180-12@P-TiO2; and (f) CQD180-12S@P-TiO2.
FT-IR spectroscopy (Figure 8) provided direct evidence of chemical interactions at the CQD–TiO2 interface. In addition to the characteristic, broad Ti-OH stretching vibration at 3380 cm−1 [55] and its corresponding bending mode at 1635 cm−1, new bands at 3690 and 3740 cm−1 appeared after CQD deposition, consistent with the surface functionalities originating from the CQDs.
The chemical anchoring of the CQDs is further evidenced by a shoulder at cca 1715 cm−1, assigned to the C=O stretching of residual carbonyl or ester groups. The most significant spectral changes occurred in the 1560–1400 cm−1 region, where two new distinct bands represent the asymmetric and symmetric stretching modes of -COO-Ti ester linkages, formed through the esterification reaction between CQD carboxyl groups and surface Ti-OH groups [14,56]. This covalent coupling is corroborated by the sharp absorption band at 1060 cm−1, which is attributed to the C-O-C stretching vibrations within the ester or ether networks. Additional hydrogen bonding between the CQD hydroxyl groups and TiO2 further stabilized the interface. These findings demonstrate that CQDs are chemically anchored through a combination of covalent ester bonds, hydrogen bonding, and surface interactions, forming a stable heterojunction that promotes efficient charge transfer across the CQD–TiO2 interface.
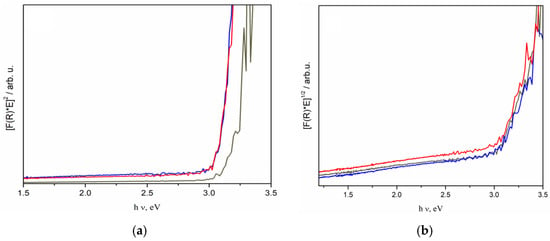
The optical bandgap energies of the TiO2-based materials were estimated using Tauc plots by assuming indirect electronic transitions (n = 2), which are characteristic of TiO2 [57]. The corresponding plots for the P-TiO2 and M-TiO2 series are shown in Figure 9 and the extracted bandgap values are summarized in Table 4.
Figure 9.
(a) plots of [F(R)*E]2 vs. hν for P-TiO2 (black), CQD180-12@P-TiO2 (blue) and CQD180-12S@P-TiO2 (red) samples; and (b) plots of [F(R)*E]2 vs. hν for M-TiO2 (black), CQD200-4@M-TiO2 (blue) and CQD180-12S@M-TiO2 (red) samples.
For the P-TiO2 series, pristine TiO2 exhibited a bandgap of 3.10 eV (Table 4, entry 1), which is slightly lower than that of pure anatase owing to the presence of 15.5% rutile, which shifts the absorption edge toward longer wavelengths [58]. In contrast, the pristine M-TiO2 sample exhibited a significantly reduced bandgap of 2.91 eV (Table 4, entry 4), attributed to its high surface area, oxygen-deficient sites, and heterophase junctions, which promote electron delocalization and shift the absorption edge into the visible region. The bandgaps of the CQD-modified P-TiO2 and M-TiO2 were not significantly altered within the experimental uncertainty (Table 4, entries 2, 3, 5 and 6).
2.3. Photocatalytic Degradation
2.3.1. Methylene Blue (MB) Degradation
Methylene blue (MB) is a model organic dye that is widely recognized for its high chemical stability and pronounced resistance to biodegradation. Owing to these characteristics, MB is commonly employed as a benchmark pollutant for assessing the photocatalytic degradation efficiency under visible-light irradiation. Its well-defined spectroscopic properties and degradation pathways make it particularly suitable for evaluating the performance of TiO2- and ZnO-based photocatalytic systems [39,59].
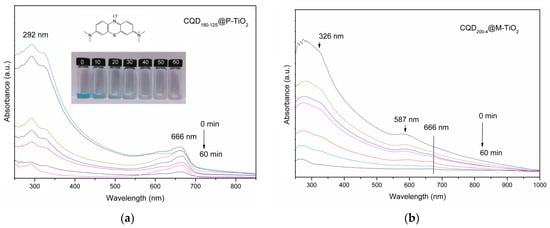
To obtain a first comparison between the photocatalytic behaviors of the synthesized materials, we selected two CQD-based nanocomposites with similar carbon content and comparable bandgap values but supported on different TiO2 phases: CQD180-12S@P-TiO2 and CQD200-4@M-TiO2. The UV–Vis spectra of MB degradation are shown in Figure 10. Structurally, MB contains an N-S heterocycle attached to a benzene ring, with the sulfhydryl group acting as the main chromophore (Figure 10a). Its discoloration typically proceeds through N-dealkylation, where the dimethylamino groups are progressively removed, leading to a hypsochromic shift of the absorption bands (Figure 10a).
Figure 10.
(a) UV–Vis spectra of MB degradation versus reaction time in the presence of CQD180-12S@P-TiO2 under Vis light irradiation; and (b) UV–Vis spectra of MB degradation versus reaction time in the presence of CQD200-4@M-TiO2 under Vis light irradiation.
Reports in the literature indicate that MB undergoes either stepwise N-demethylation followed by cleavage of the phenothiazine ring into H2O, CO2, and smaller organic and inorganic molecules [60] or through an initial adsorption of the C–S+=C moiety, followed by oxidative degradation [61]. Irrespective of the mechanism ·OH radicals, superoxide (O2·−) and hydroperoxyl radicals (HO2·) generated on the photocatalyst surface are involved.
The absorption peaks of MB at 666 nm, associated with the conjugated N-S heterocycle, decreased steadily during irradiation, indicating the progressive destruction of the chromophoric system. The band at 292 nm, characteristic of the phenothiazine ring, also diminished, confirming that the aromatic core was attacked by reactive oxygen species. The observed hypsochromic shifts in the visible region are consistent with N-demethylation of the dimethylamino groups, in agreement with previous studies [60,61]. Mixtures of N-demethylated intermediates typically produce broad absorption bands in the visible range, which were also observed in this study. Simultaneously, the gradual decrease in the 200–400 nm region indicates the oxidative opening of the phenothiazine ring.
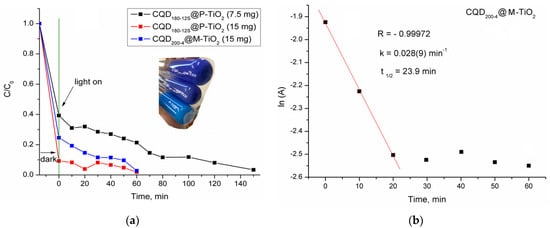
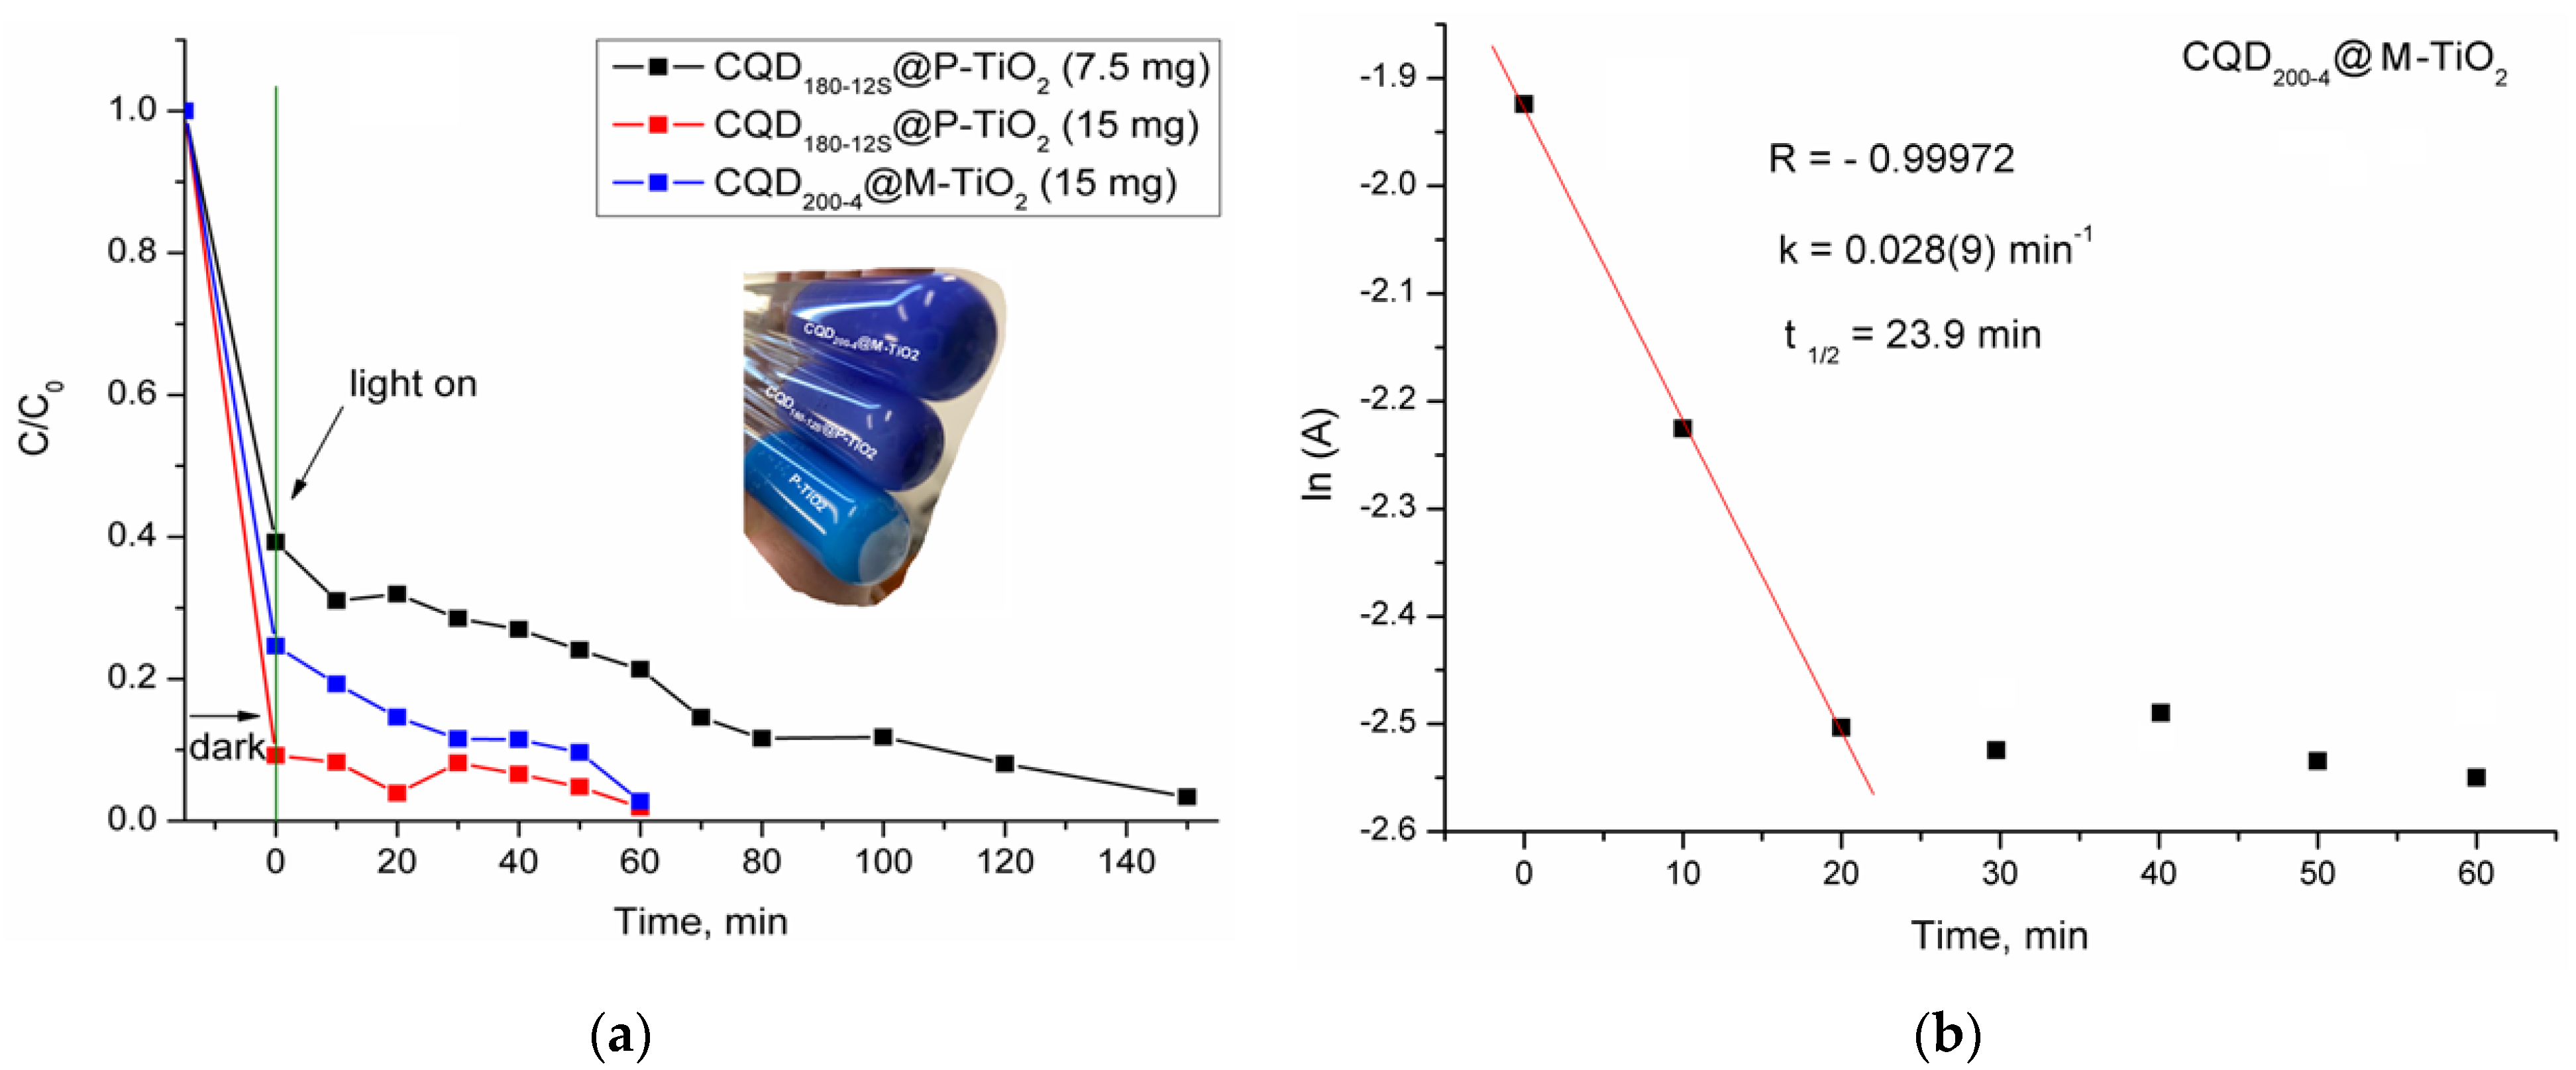
The adsorption behavior of the catalysts plays a significant role in the overall degradation process of the pollutants. While pristine P-TiO2 exhibited limited adsorption capacity, the presence of CQDs significantly enhanced MB uptake (Figure 11a). Modifying TiO2 with CQDs improved the photocatalytic efficiency in MB degradation (Figure 11a) without significantly altering the bandgap (Figure 9, Table 4). For CQD180-12S@P-TiO2, the MB adsorption reaches 60.7% with 7.5 mg of catalyst and increases to 90.65% for a doubled amount (Figure 11a). High dark adsorption (74.95%) was also observed for CQD200-4@M-TiO2 (15 mg).
Figure 11.
(a) adsorption and photocatalytic degradation profiles of MB (MB, 666 nm band) (inset: mixture of the catalyst and MB after the dark period and before the light period); (b) pseudo first-order kinetic linear fit for the CQD200-4@M-TiO2 sample. Note: Kinetic plotting in (b) initiates at t = 0 min using the residual absorbance value reached immediately after dark-equilibrium period, thereby isolating the true photocatalytic degradation rate from the initial adsorption uptake.
To accurately decouple the pure photocatalytic activity from these strong initial adsorption effects, the subsequent kinetic evaluations were systematically performed using the residual concentration established at the end of the dark-equilibration period as the true baseline (t = 0 min).
The linear dependency between ln(A) and t (time, min) in the MB degradation (Figure 11b) suggests that the degradation of the dimethylamino (N(CH3)2) and phenothiazine ring of MB in CQD-based systems obeyed the Langmuir–Hinshelwood first-order kinetic reaction equation in the low concentration range, that is, ln(A0/At) = k·t, where k is the apparent rate constant.
The degradation levels of the two main chromophoric moieties of MB—the dimethylamino group (λ = 666 nm) and the phenothiazine ring (λ = 292 nm)—are listed in Table 5. The obtained results indicate that the degradation enhancement is primarily related to the charge transfer dynamics; CQDs act as a charge separator and a visible-light sensitizer rather than shifting the bulk energy levels, consistent with previous reports [62].
Table 5.
The decomposition level of the N(CH3)2 and phenothiazine ring moieties as a function of the catalyst nature, catalyst amount, and illumination time.
The photocatalytic behavior of the two TiO2 supports can be rationalized based on their respective structural characteristics. P-TiO2 contains a mixture of anatase and rutile phases; the intimate contact between these phases is known to enhance photocatalytic activity by facilitating electron transfer from rutile to anatase, thereby suppressing charge recombination [63]. However, its relatively small surface area limits the number of available reactive sites [64].
In contrast, M-TiO2 comprised rutile nanoparticles and anatase nanoparticles/nanotubes, as confirmed by TEM (Figure 5b). This complex heterophase network provides a large number of interfacial junctions, which enhances charge separation and electron mobility. Moreover, the acid washing and subsequent calcination steps introduced oxygen vacancies, which further improved adsorption and charge transfer. The acidic functional groups on the CQDs also facilitated the chemisorption of the base dimethylamino groups of MB, contributing to the high adsorption capacity observed for the M-TiO2-based composites.
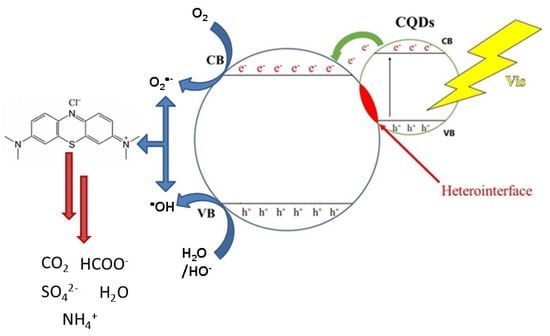
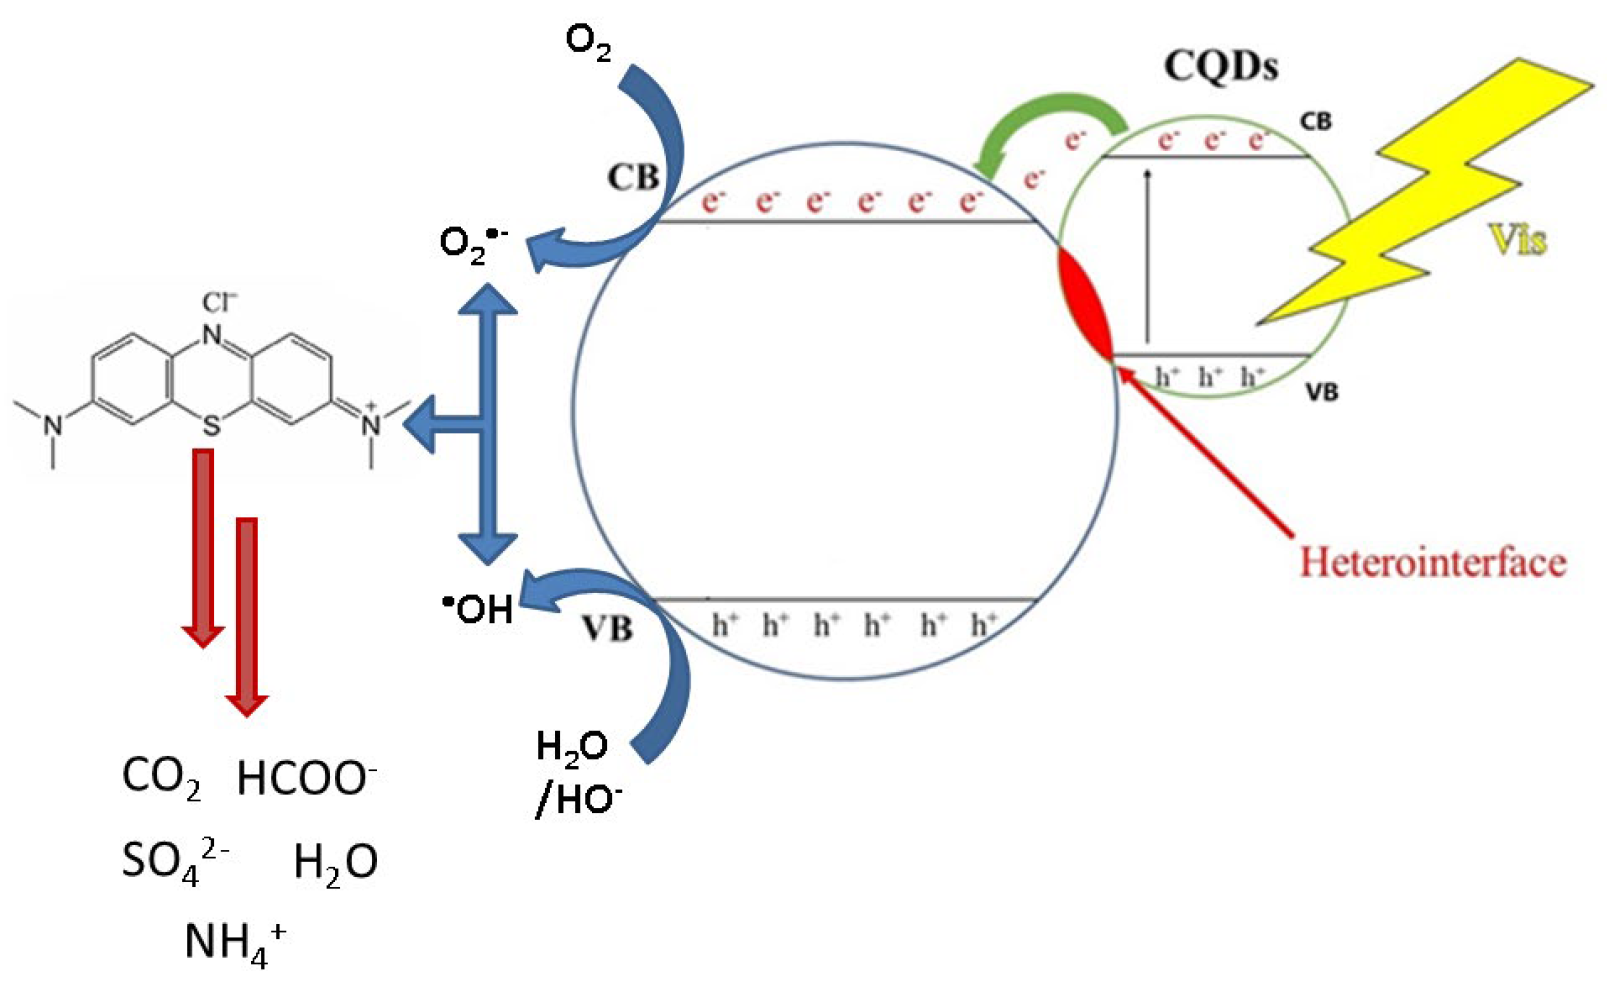
Based on the obtained results, and in line with reports in the literature [39,65], a plausible mechanism for MB degradation over CQD@TiO2 and under visible light is proposed (Figure 12): (a) photosensitization: CQDs act as photosensitizers and form Ti-O-C bonds at the interface, extending TiO2 absorption into the visible region and improving light utilization. Electrons reduce O2 to O2•−, and holes oxidize surface water to •OH radicals. The heterointerface accelerates electron–hole separation; (b) reactive oxygen species attack: •OH radicals initiate N-demethylation of MB, forming phenothiazine intermediates, which subsequently undergo ring opening to yield aniline, phenol, and other aromatic fragments; and (c) final mineralization: the intermediates are further oxidized to CO2, H2O, NH4+, HCOO−, and SO42−. The involvement of ·OH radicals is consistent with reports in the literature on TiO2-based photocatalysis [66].
Figure 12.
Proposed mechanism in the CQD@TiO2 heterostructure nanocomposites.
Overall, the CQD@TiO2 heterostructures combine enhanced adsorption, improved charge separation, and extended visible-light absorption, resulting in the efficient degradation of MB. It is worth noting that under the 445–465 nm blue-light illumination source, the potential contribution of MB self-sensitization can be excluded. As a blue chromophore, MB possesses a major absorption band at cca 664 nm but exhibits minimal absorption in the blue spectral window (445–465 nm). Therefore, the dye cannot undergo significant photoexcitation under these conditions. Instead, the incoming photons are exclusively harvested by the CQDs, which possess strong absorption in the blue-UV region, validating their role as the primary photosensitizers driving the interfacial charge transfer across the TiO2 network.
2.3.2. Diclofenac (DC) Degradation
Although DCF, a widely used non-steroidal anti-inflammatory drug and a representative emerging pharmaceutical contaminant, seems to be rapidly degraded by direct photolysis under environmental conditions [67,68], it remains one of the most frequently detected compounds at concentrations up to 1.2 μg L−1 [69]. Although no conclusive data are available on the possible environmental effects of diclofenac in surface waters, the acute effects of diclofenac would be improbable at the concentration levels present in the environment (approximately 1000 times lower than the effective concentrations). However, it has been demonstrated that, in combination with other pharmaceutically active compounds (PhACs) present in water samples, the toxic effect can be considerably increased, even at concentrations in which the substances alone showed either no effect at all, or only a very slight one [70].
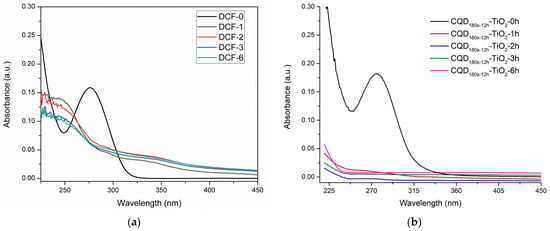
Ongoing experiments using CQD@TiO2 catalysts for DCF degradation under visible light have shown promising preliminary results (Figure 13), indicating that the materials developed in this study hold broader potential for the removal of persistent pharmaceutical contaminants. The degradation of DCF in the presence of CQD180-12S@M-TiO2 is shown in Figure 13b and compared with the degradation of DCF in the absence of the catalyst (Figure 13a).
Figure 13.
(a) UV–Vis spectra of DCF degradation versus reaction time in the absence of catalyst; and (b) UV–Vis spectra of DCF degradation versus reaction time in the presence of CQD180-12S@M-TiO2.
The mechanism of degradation of aqueous DCF by CQD@TiO2 is under investigation, as well as the influence of the type and load of catalyst, type of irradiation source, and hydrogen peroxide addition.
A relevant comparison of the data reported here can be made with our previously reported ZnO/CQDs nanocomposites [14], in which humins-derived CQDs were coupled with ZnO to achieve MB degradation through visible-light irradiation. A key distinction between the two systems lies in the reaction kinetics of MB degradation. While ZnO/CQDs required 180 min to reach around 98% MB removal, the CQD@TiO2 materials achieve 93–98% MB degradation within only 60 min under visible-light irradiation (Figure 11a). This represents a three-fold acceleration of the photocatalytic process, while maintaining comparable or superior degradation efficiency. The markedly faster kinetics observed for CQD@TiO2 arise from the synergistic interplay between CQD photosensitization, anatase–rutile heterojunctions, nanotubular TiO2 architectures, and the significantly higher surface area and porosity of M-TiO2.
In the ZnO/CQDs composites, the enhanced activity was attributed to electronic interactions between CQDs and ZnO; however, the ZnO support remained limited by its wide bandgap (3.37 eV), low surface area (7–18 m2/g), and structural instability under irradiation [14]. In contrast, the CQD@M-TiO2 heterostructures benefit from anatase–rutile heterojunctions, which facilitate directional electron flow, nanotubular TiO2 domains, which increase surface accessibility (194–203 m2/g), and reduced diffusion limitations and highly dispersed CQDs, which act as efficient photosensitizers. Importantly, the intrinsic bandgaps of TiO2 remained unchanged upon CQD incorporation, confirming that the enhanced visible-light response arises from interfacial charge-transfer processes rather than bandgap narrowing.
Beyond MB degradation, the CQD@TiO2 composites also demonstrate promising activity toward diclofenac (DCF), a persistent pharmaceutical pollutant. This expanded applicability underscores the versatility of TiO2-based CQD systems and their potential for real wastewater treatment scenarios. By comparison, the ZnO/CQDs study focused exclusively on MB, without extending the evaluation to more complex or persistent contaminants.
Overall, while both systems demonstrate the value of humins-derived CQDs as sustainable photosensitizers, the CQD@TiO2 heterostructures represent a significant advancement over the previously reported ZnO/CQDs composites. The combination of faster reaction kinetics, superior structural architecture, enhanced charge-transfer pathways, and broader pollutant applicability positions the TiO2-based materials as a more efficient and versatile photocatalytic platform. Although direct optoelectronic investigations of charge carrier lifetimes (such as transient photocurrent response or photoluminescence quenching measurements) were not conducted, the enhanced charge separation efficiency within the hybrid system is strongly supported by the chemical and kinetic evidence. The formation of interfacial Ti-COO–covalent linkages provides a direct pathway for rapid electron injection from the photoexcited CQDs to the TiO2 framework, effectively delaying charge recombination and driving the superior visible-light photocatalytic degradation rates. Moreover, while O2·−, OH and h+ are anticipated to drive the MB degradation based on studies in the literature, their exact quantitative contributions remain to be experimentally validated. Detailed radical scavenging tests (using specific quenchers such as tert-butanol, p-benzoquinone, and EDTA) and EPR spin-trapping analyses are planned as a crucial next step in this research topic.
Importantly, the utilization of humins-derived CQDs highlights the potential of valorizing terrestrial and marine biomass-derived wastes into high-value functional nanomaterials, significantly expanding the scalability and environmental relevance of the proposed materials. This approach also aligns with principles of sustainable materials chemistry, opening new avenues for the development of efficient, low-cost, and environmentally benign photocatalysts for wastewater treatment and related applications.
3. Materials and Methods
3.1. Synthesis of CQDs@TiO2 Nanocomposites
Synthesis of humins: Humins were synthesized following a previously reported hydrothermal protocol [37]. An aqueous solution containing 36.0 g D-glucose and 0.6 mL concentrated H2SO4 (96%) in 200 mL water was transferred into a Teflon-lined autoclave and heated at 180 °C for 7 h. The resulting solid was collected by filtration, washed with distilled water (300 mL), dried at 80 °C for 12 h, ground, and purified by Soxhlet extraction. Synthesis of Carbon Quantum Dots (CQDs): CQDs were prepared via the hydrothermal decomposition of humins. Typically, 20 mg of humins was dispersed in 20 mL of deionized water, followed by the addition of 0.1 mL of glacial acetic acid. The suspension was transferred into an autoclave and heated at 180 °C for 12 h and 200 °C for 4 h under vigorous stirring. After cooling, the mixture was centrifuged at 8000 rpm for 40 min and the supernatant was filtered through a 0.22 μm polyvinylidene difluoride (PVDF) membrane (Stericup Durapore). The obtained CQDs were denoted CQDT-h, where T is the synthesis temperature and h is the reaction time. An additional purification step was applied to CQD180-12 following a previously reported protocol [71]. Accordingly, the resulting brown hydrothermal solution was washed with dichloromethane to remove the adsorbed organic species (acetic acid and low molecular-weight humin fragments), centrifuged at 8000 rpm for 40 min, filtered (0.22 μm), and concentrated under vacuum at 80 °C for 2 h. The obtained CQDs were denoted as CQD180-12S. Preparation of TiO2 supports: Two TiO2 materials were used as supports: (1) P-TiO2: commercial P-25 (Degussa), containing ca. 85% anatase and 15% rutile; and (2) M-TiO2: NaOH-modified TiO2 synthesized from P-25 via a hydrothermal method. To prepare M-TiO2, 0.3 g P-TiO2 was stirred in 30 mL NaOH solution (10 mol/L) for 1 h at room temperature. The mixture was then transferred into a 40 mL autoclave and heated at 120 °C for 24 h under stirring. After cooling, the solid was separated by centrifugation, washed with 1 mol/L HCl solution (pH = 1), and then with distilled water (pH = 7). The sample was dried for 4 h and calcined at 450 °C for 2 h. Synthesis of CQDs@TiO2 nanocomposites: CQDs@TiO2 composites were synthesized hydrothermally, following a previously reported methodology [15]. In a typical procedure, 0.4 g TiO2 (P-TiO2 or M-TiO2) was mixed with 2 mL CQD solution (CQD200-4, CQD180-12, and CQD180-12S) and dispersed in 20 mL distilled water and 6 mL ethanol. The suspension was stirred for 4 h at room temperature, transferred into a glass-lined autoclave, and heated at 140 °C for 4 h. The resulting solids were washed three times with water, collected by centrifugation at 6100 rpm for 15 min, and dried under vacuum at 60 °C for 6 h. The obtained composites were denoted as CQD200-4@P-TiO2, CQD180-12@P-TiO2, CQD180-12S@P-TiO2, CQD200-4@M-TiO2, CQD180-12@M-TiO2, and CQD180-12S@M-TiO2.
3.2. Characterization Techniques
X-Ray diffraction (XRD): XRD patterns were recorded at room temperature on a Shimadzu XRD-7000 diffractometer (Kyoto, Japan) using Cu Kα monochromatic radiation (λ = 1.5406 Å, 40 kV, 40 mA) at a scan rate of 0.1° × min−1, over 5–80° (2θ). The anatase/rutile ratios were calculated using a previously reported method [72]:
where IR and IA represent the line intensities of the (101) and (110) reflections for anatase and rutile, respectively, and 1.265 represents the anatase-to-rutile quality factor ratio.
The crystallite sizes were estimated from the anatase (101) reflection using the Debye–Scherrer equation [73]:
where d is the crystallite size, nm; k = 0.94; λ is the wavelength of the X-ray (1.54178 Å); θ is the half-diffraction angle, in radians, and β is the full width at half-maximum (FWHM), in radians, for the 2θ value (25.3°).
X-Ray photoelectron spectroscopy (XPS): XPS measurements were performed on a Kratos AXIS Ultra DLD instrument (Kratos Analytical, Manchester, UK) using monochromatic Al Kα radiation (1486.74 eV, 144 W). The base pressure was at least 1 × 10⁻⁸ mbar. Spectra were fitted with Voigt functions and inelastic backgrounds [74,75]. Binding energies were calibrated to a C1s standard value of 284.6 eV (measured at the beginning of XPS spectra). Atomic compositions were calculated using Wagner sensitivity factors [76].
Infrared spectroscopy: ATR-FTIR spectra were recorded on a PerkinElmer Spectrum Two spectrometer (Shelton, CT, USA) (4 cm−1 resolution, 400–4000 cm−1, 32 scans). DRIFT spectra were collected on a Bruker Tensor-II spectrometer (Billerica, MA, USA) (4 cm−1 resolution, 600–4000 cm−1, 400 scans).
Photoluminescence (PL) and quantum yield (QY): PL spectra were obtained using a JASCO FP-8200 spectrofluorometer (Tokyo, Japan). equipped with a 150 W Xe lamp. Quantum yields (QYs) were calculated using fluorescein (QY = 86%) as the reference [77], ensuring an UV absorbance below 0.02 to avoid the inner-filter effect.
The QY was calculated by the following equation:
where subscripts r and s denote the reference (fluorescein) and evaluated sample. QYs is the quantum yield of the sample, E is the integrated PL intensity, A is the absorbance, and η is the refractive index of the solvent.
Fluorescein (QY = 86%) was dissolved in 0.1 M NaOH (η = 1.33) and the C-dots were dissolved in water (η = 1.33). The QY was measured at an excitation wavelength of 366 nm.
UV–Vis spectroscopy: UV–Vis spectra were recorded on a JASCO V-350 spectrophotometer (Tokyo, Japan). Bandgap energies were estimated using Tauc plots derived from Kubelka–Munk-transformed reflectance data [78]:
where α is the absorption coefficient; h is the Planck’ constant; ν is the inverse of the λ wavelength; and n is the coefficient corresponding to the transition mode (direct transition allowed n = ½; indirect transition allowed n = 2):
The Kubelka–Munk transformation is applied by converting the reflectance into an absorption coefficient, according to the equation:
From the linear extrapolation of the Tauc plots, followed by the determination of the intersection points with the abscissa, the energy values of the bandgap (Eg) are obtained.
Textural properties: N2 adsorption–desorption isotherms at −196 °C were measured using a Micromeritics ASAP 2020 Surface Area and Porosity Analyzer (Norcross, GA, USA) to determine BET surface area, pore volume, and pore diameter distribution.
Elemental analysis: Elemental composition was determined using a EUROVECTOR EuroEA 3000 analyzer (Pavia, Italy).
Thermogravimetric analysis: TG-DTA measurements were performed on a Shimadzu instrument (Kyoto, Japan) using Pt crucibles, heating from room temperature till 850 °C at 10 °C min−1, under 50 mL·min−1 nitrogen flow.
Electron microscopy (TEM/SEM/STEM-EDS): TEM analyses were conducted on a FEI Titan G2 60–300 kV microscope (FEI Company, Hillsboro, OR, USA) equipped with field emission gun (FEG), monochromator, three condenser-lenses system, the objective lens system, image correction (CS—corrector), and HAADF detector. The SEM Scanning Electron Microscope (FEI Quanta 250 FEG, FEI Company, USA) equipped with an EDS system was applied for the analysis of the morphology and composition of the studied catalysts. STEM-EDS mapping was performed using an EDAX Si(Li) detector at 300 kV, collecting point-by-point EDS spectra for elemental distribution.
3.3. Photocatalytic Activity Tests
Photocatalytic experiments were carried out under visible-light irradiation in an LZC-4b photoreactor (Luzchem, Ottawa, ON, Canada) provided with blue LED lamps (112 W, 445–465 nm) and an exhaust/ventilation system. Reactions were performed in quartz cylinders at a fixed lamp–sample distance of 20 cm. In a typical experiment, 7.5–20 mg catalyst was added to 10 mL MB solution (10–30 mg/L, pH 6.0). Suspensions were stirred in the dark for 15 min to reach the adsorption–desorption equilibrium, then irradiated. Aliquots (2.5 mL) were withdrawn every 10 min, filtered (0.22 μm hydrophilic GV membrane, Millipore, Darmstadt, Germany), diluted with 2.5 mL water, and analyzed by UV–Vis spectroscopy (SPECORD 250-222P108, Jena, Germany). Preliminary experiments with 10–20 mg catalyst and 10 mL diclofenac (DCF) solution (10–15 mg/L, pH 6.0) were also made. MB degradation was monitored at 666 nm, and DFC at 275 nm. Control experiments were also performed with pristine P-TiO2 and M-TiO2.
Calibration curves were prepared from stock solutions (30 mg/L MB or DFC) diluted to 5–25 mg/L. The stock solution was used to prepare the other five different MB concentrations (i.e., 5, 10, 15, 20 and 25 mg/L). For each concentration the UV–Vis spectrum was registered and the corresponding absorbance value for the 665 nm band was used to build the calibration curve [14]. Pollutant conversion was calculated as:
where C0 is the initial concentration and C is the concentration at time t.
Author Contributions
Conceptualization, S.M.C.; methodology, N.C.G., P.O. and M.T.; validation, N.C.G., P.O., A.N., J.G. and B.C.; formal analysis, S.M.C., V.I.P. and T.N.-P.; investigation, N.C.G., P.O., A.N., T.N.-P. and B.C.; resources, V.I.P., T.N.-P. and J.G.; data curation, B.C. and A.N.; writing—original draft preparation, S.M.C.; writing—review and editing, V.I.P.; visualization, N.C.G., P.O., J.G. and B.C.; supervision, S.M.C.; project administration, S.M.C.; funding acquisition, M.T. and S.M.C. All authors have read and agreed to the published version of the manuscript.
Funding
This work was funded by the Education, Scholarship, Apprenticeships and Youth Entrepreneurship Programmer-EEA Grants 2014-2021, Project No. 18-Cop-0041 and the Romanian Ministry Research and Digitalization, Grant PNRR-III-C9-2022-I5-18, ResPonSE—Project, No. 760010/2022.
Data Availability Statement
The original contributions presented in this study are included in the article. Further inquiries can be directed to the corresponding author.
Acknowledgments
The authors kindly acknowledge Giuseppe Stoian for initiating the diclofenac degradation tests.
Conflicts of Interest
The authors declare no conflicts of interest.
References
- Hoffmann, M.R.; Martin, S.T.; Choi, W.; Bahnemann, D.W. Environmental Applications of Semiconductor Photocatalysis. Chem. Rev. 1995, 95, 69–96. [Google Scholar] [CrossRef] [Scilit]
- Fox, M.A.; Dulay, M.T. Heterogeneous Photocatalysis. Chem. Rev. 1993, 93, 341–357. [Google Scholar] [CrossRef] [Scilit]
- Dai, G.; Yu, J.; Liu, G. Synthesis and Enhanced Visible-Light Photoelectrocatalytic Activity of p-n Junction BiOI/TiO2 Nanotube Arrays. J. Phys. Chem. C 2011, 115, 7339–7346. [Google Scholar] [CrossRef] [Scilit]
- Xiang, Q.; Yu, J.; Jaroniec, M. Graphene-Based Semiconductor Photocatalysts. Chem. Soc. Rev. 2012, 41, 782–796. [Google Scholar] [CrossRef] [Scilit] [PubMed]
- Xiang, Q.; Yu, J.; Jaroniec, M. Synergetic Effect of MoS2 and Graphene as Cocatalysts for Enhanced Photocatalytic H2 Production Activity of TiO2 Nanoparticles. J. Am. Chem. Soc. 2012, 134, 6575–6578. [Google Scholar] [CrossRef] [Scilit] [PubMed]
- Nah, Y.C.; Paramasivam, I.; Schmuki, P. Doped TiO2 and TiO2 Nanotubes: Synthesis and Applications. ChemPhysChem 2010, 11, 2698–2713. [Google Scholar] [CrossRef] [Scilit] [PubMed]
- Gaya, U.I.; Abdullah, A.H. Heterogeneous Photocatalytic Degradation of Organic Contaminants over Titanium Dioxide: A Review of Fundamentals, Progress and Problems. J. Photochem. Photobiol. C 2008, 9, 1–12. [Google Scholar] [CrossRef] [Scilit]
- Chen, X.; Mao, S.S. Titanium Dioxide Nanomaterials: Synthesis, Properties, Modifications, and Applications. Chem. Rev. 2007, 107, 2891–2959. [Google Scholar] [CrossRef] [Scilit] [PubMed]
- Li, X.; Yu, J.; Jaroniec, M. Hierarchical Photocatalysts. Chem. Soc. Rev. 2016, 45, 2603–2636. [Google Scholar] [CrossRef] [Scilit] [PubMed]
- Murgolo, S.; Petronella, F.; Ciannarella, R.; Comparelli, R.; Agostiano, A.; Curri, M.; Mascolo, G. UV and Solar-Based Photocatalytic Degradation of Organic Pollutants by Nano-Sized TiO2 Grown on Carbon Nanotubes. Catal. Today 2015, 240, 114–124. [Google Scholar] [CrossRef] [Scilit]
- Zhang, Z.; Zhang, J.; Chen, N.; Qu, L. Graphene Quantum Dots: An Emerging Material for Energy-Related Applications and Beyond. Energy Environ. Sci. 2012, 5, 8869–8890. [Google Scholar] [CrossRef] [Scilit]
- Lim, S.Y.; Shen, W.; Gao, Z. Carbon Quantum Dots and Their Applications. Chem. Soc. Rev. 2015, 44, 362–381. [Google Scholar] [CrossRef] [Scilit] [PubMed]
- Wang, X.; Cao, L.; Lu, F.; Meziani, M.; Li, H.; Qi, G.; Zhou, B.; Harruff, B.A.; Kermarrec, F.; Sun, Y.P. Photoinduced electron transfers with carbon dots. Chem. Commun. 2009, 45, 3774–3776. [Google Scholar] [CrossRef] [Scilit] [PubMed]
- Toma, E.E.; Stoian, G.; Cojocaru, B.; Parvulescu, V.I.; Coman, S.M. ZnO/CQDs Nanocomposites for Visible Light Photodegradation of Organic Pollutants. Catalysts 2022, 12, 952. [Google Scholar] [CrossRef] [Scilit]
- Yu, H.; Zhao, Y.; Zhou, C.; Shang, L.; Peng, Y.; Cao, Y.; Wu, L.-Z.; Tung, C.-H.; Zhang, T. Carbon Quantum Dots/TiO2 Composites for Efficient Photocatalytic Hydrogen Evolution. J. Mater. Chem. A 2014, 2, 3344–3351. [Google Scholar] [CrossRef] [Scilit]
- Tian, J.; Leng, Y.; Zhao, Z.; Xia, Y.; Sang, Y.; Hao, P.; Zhan, J.; Li, M.; Liu, H. Carbon Quantum Dots/Hydrogenated TiO2 Nanobelt Heterostructures and Their Broad Spectrum Photocatalytic Properties. Nano Energy 2015, 11, 419–427. [Google Scholar] [CrossRef] [Scilit]
- Liu, J.; Zhu, W.; Yu, S.; Yan, X. Three-Dimensional Carbogenic Dots/TiO2 Nanoheterojunctions with Enhanced Visible Light-Driven Photocatalytic Activity. Carbon 2014, 79, 369–379. [Google Scholar] [CrossRef] [Scilit]
- Wang, Y.; Hu, A. Carbon Quantum Dots: Synthesis, Properties and Applications. J. Mater. Chem. C 2014, 2, 6921–6939. [Google Scholar] [CrossRef] [Scilit]
- Martindale, B.C.M.; Hutton, G.A.M.; Caputo, C.A.; Reisner, E. Solar Hydrogen Production Using Carbon Quantum Dots and a Molecular Nickel Catalyst. J. Am. Chem. Soc. 2015, 137, 6018–6025. [Google Scholar] [CrossRef] [Scilit] [PubMed]
- Nguyen, V.; Si, J.; Yan, L.; Hou, X. Direct Demonstration of Photoluminescence Originated from Surface Functional Groups in Carbon Nanodots. Carbon 2016, 108, 268–273. [Google Scholar] [CrossRef] [Scilit]
- Sharma, S.; Umar, A.; Sood, S.; Mehta, S.K.; Kansal, S.K. Photoluminescent C-Dots: Recent Developments in Synthesis, Physicochemical Properties and Applications. J. Alloys Compd. 2018, 748, 818–853. [Google Scholar] [CrossRef] [Scilit]
- Zhao, S.; Song, X.; Chai, X.; Zhao, P.; He, H.; Liu, Z. Green Production of Fluorescent Carbon Quantum Dots Based on Pine Wood and Their Application in Fe3+ Detection. J. Clean. Prod. 2020, 263, 121561. [Google Scholar] [CrossRef] [Scilit]
- Mahat, N.A.; Shamsudin, S.A. Transformation of Oil Palm Biomass to Optical Carbon Quantum Dots by Carbonisation-Activation and Low-Temperature Hydrothermal Processes. Diam. Relat. Mater. 2020, 102, 107660. [Google Scholar] [CrossRef] [Scilit]
- Saputra, A.M.A.; Piliang, A.F.R.; Goei, R.; Hts, R.R.; Gea, S. Synthesis, Properties, and Utilization of Carbon Quantum Dots as Photocatalysts on Degradation of Organic Dyes: A Mini Review. Catal. Commun. 2024, 187, 106914. [Google Scholar] [CrossRef] [Scilit]
- Li, H.; He, X.; Liu, Y.; Yu, H.; Kang, Z.; Lee, S.-T. Synthesis of Fluorescent Carbon Nanoparticles Directly from Active Carbon via One-Step Ultrasonic Treatment. Mater. Res. Bull. 2011, 46, 147–151. [Google Scholar] [CrossRef] [Scilit]
- Peng, J.; Gao, W.; Gupta, B.K.; Liu, Z.; Romero-Aburto, R.; Ge, L.; Song, L.; Alemany, L.B.; Zhan, X.; Gao, G. Graphene Quantum Dots Derived from Carbon Fibers. Nano Lett. 2012, 12, 844–849. [Google Scholar] [CrossRef] [Scilit] [PubMed]
- Umrao, S.; Jang, M.-H.; Oh, J.-H.; Kim, G.; Sahoo, S.; Cho, Y.-H.; Srivastva, A.; Oh, I.-K. Microwave Bottom-Up Route for Size-Tunable and Switchable Photoluminescent Graphene Quantum Dots Using Acetylacetone. Carbon 2015, 81, 514–524. [Google Scholar] [CrossRef] [Scilit]
- Qin, L.; Ishizaki, T.; Takeuchi, N.; Takahashi, K.; Kim, K.H.; Li, O.L. Green Sulfonation of Carbon Catalysts via Gas–Liquid Interfacial Plasma for Cellulose Hydrolysis. ACS Sustain Chem. Eng. 2020, 8, 5837–5846. [Google Scholar] [CrossRef] [Scilit]
- Khamsa, E.B.; Kordoghli, S.; Fryda, L.; Smiti, N.; Zagrouba, F.; Kane, A.; Fadhillah, F.; Ali, F.A.; Assadi, A.A.; Amrane, A.; et al. Carbon Quantum Dots from Waste and Biomass for Water Treatment: A Review on Nanomaterials AI-Enhanced Synthesis and Characterization. J. Environ. Chem. Eng. 2026, 14, 122899. [Google Scholar] [CrossRef] [Scilit]
- Weingarten, R.; Cho, J.; Xing, R.; Conner, W.C., Jr.; Huber, G.W. Kinetics and Reaction Engineering of Levulinic Acid Production from Aqueous Glucose Solutions. ChemSusChem 2012, 5, 1280–1290. [Google Scholar] [CrossRef] [Scilit] [PubMed]
- Patil, S.K.; Heltzel, J.; Lund, C.R. Comparison of Structural Features of Humins Formed Catalytically from Glucose, Fructose, and 5-Hydroxymethylfurfuraldehyde. Energy Fuels 2012, 26, 5281–5293. [Google Scholar] [CrossRef] [Scilit]
- Candu, N.; El Fergani, M.; Verziu, M.; Cojocaru, B.; Jurca, B.; Apostol, N.; Teodorescu, C.; Parvulescu, V.I.; Coman, S.M. Efficient Glucose Dehydration to HMF onto Nb-BEA Catalysts. Catal. Today 2019, 325, 109–116. [Google Scholar] [CrossRef] [Scilit]
- Higgins, L.J.R.; Brown, A.P.; Harrington, J.P.; Ross, A.B.; Kaulich, B.; Mishra, B. Evidence for a Core-Shell Structure of Hydrothermal Carbon. Carbon 2020, 161, 423–431. [Google Scholar] [CrossRef] [Scilit]
- van Zandvoort, I.; Koers, E.J.; Weingarth, M.; Bruijnincx, P.C.A.; Baldus, M.; Weckhuysen, B.M. Structural Characterization of 13C-Enriched Humins and Alkali-Treated 13C Humins by 2D Solid-State NMR. Green Chem. 2015, 17, 4383–4392. [Google Scholar] [CrossRef] [Scilit]
- Suganuma, S.; Nakajima, K.; Kitano, M.; Yamaguchi, D.; Kato, H.; Hayashi, S.; Hara, M. Hydrolysis of Cellulose by Amorphous Carbon Bearing SO3H, COOH, and OH Groups. J. Am. Chem. Soc. 2008, 130, 12787–12793. [Google Scholar] [CrossRef] [Scilit] [PubMed]
- Filiciotto, L.; Balu, A.M.; Romero, A.A.; Rodríguez-Castellón, E.; van der Waal, J.C.; Luque, R. Benign-by-Design Preparation of Humin-Based Iron Oxide Catalytic Nanocomposites. Green Chem. 2017, 19, 4423–4434. [Google Scholar] [CrossRef] [Scilit]
- El Fergani, M.; Candu, N.; Tudorache, M.; Bucur, C.; Djelal, N.; Granger, P.; Coman, S.M. From Useless Humins By-Product to Nb@Graphite-Like Carbon Catalysts Highly Efficient in HMF Synthesis. Appl. Catal. A Gen. 2021, 618, 118130. [Google Scholar] [CrossRef] [Scilit]
- Hayes, D.J.; Fitzpatrick, S.; Hayes, M.H.B.; Ross, J.R.H. The Biofine Process-Production of Levulinic Acid, Furfural, and Formic Acid from Lignocellulosic Feedstocks. In Biorefineries-Industrial Processes and Products; WILEY-VCH Verlag GmbH & Co. KGaA: Hoboken, NJ, USA, 2005; pp. 139–164. [Google Scholar]
- Wu, P.; Wu, X.; Li, W.; Liu, Y.; Chen, Z.; Liu, S. Ultra-Small Amorphous Carbon Dots: Preparation, Photoluminescence Properties, and Their Application as TiO2 Photosensitizers. J. Mater. Sci. 2019, 54, 5280–5293. [Google Scholar] [CrossRef] [Scilit]
- Song, Y.; Zhu, S.; Xiang, S.; Zhao, X.; Zhang, J.; Zhang, H.; Fu, Y.; Yang, B. Investigation into the Fluorescence Quenching Behaviors and Applications of Carbon Dots. Nanoscale 2014, 6, 4676–4682. [Google Scholar] [CrossRef] [Scilit] [PubMed]
- Khan, S.; Gupta, A.; Verma, N.C.; Nandi, C.K. Time-Resolved Emission Reveals Ensemble of Emissive States as the Origin of Multicolor Fluorescence in Carbon Dots. Nano Lett. 2015, 15, 8300–8305. [Google Scholar] [CrossRef] [Scilit] [PubMed]
- Zhu, S.; Song, Y.; Zhao, X.; Shao, J.; Zhang, J.; Yang, B. The Photoluminescence Mechanism in Carbon Dots (Graphene Quantum Dots, Carbon Nanodots, and Polymer Dots): Current State and Future Perspective. Nano Res. 2015, 8, 355–381. [Google Scholar] [CrossRef] [Scilit]
- Ishak, N.; Galář, P.; Mekkat, R.; Grandcolas, M.; Šoóš, M. Fine-Tuning Photoluminescence and Photocatalysis: Exploring the Effects of Carbon Quantum Dots Synthesis and Purification on g-C3N4. Colloids Surf. A 2025, 706, 135789. [Google Scholar] [CrossRef] [Scilit]
- Wen, X.; Yu, P.; Toh, Y.-R.; Ma, X.; Tang, J. On the Upconversion Fluorescence in Carbon Nanodots and Graphene Quantum Dots. Chem. Commun. 2014, 50, 4703–4706. [Google Scholar] [CrossRef] [Scilit] [PubMed]
- Tang, J.; Zhang, J.; Zhang, Y.; Xiao, Y.; Shi, Y.; Chen, Y.; Ding, L.; Xu, W. Influence of Group Modification at the Edges of Carbon Quantum Dots on Fluorescent Emission. Nanoscale Res. Lett. 2019, 14, 241. [Google Scholar] [CrossRef] [Scilit] [PubMed]
- Qin, F.; Ren, L. From Biomass to Wealth: Biomass-Derived Carbon Dots for Green Synthesis, Photoluminescence Mechanisms, and Multifunctional Applications. Green Chem. Eng. 2025. [Google Scholar] [CrossRef] [Scilit]
- Zhang, Y.; Tang, Z.-R.; Fu, X.; Xu, Y.-J. TiO2-Graphene Nanocomposites for Gas-Phase Photocatalytic Degradation of Volatile Aromatic Pollutant: Is TiO2-Graphene Truly Different from Other TiO2-Carbon Composite Materials? ACS Nano 2010, 4, 7303–7314. [Google Scholar] [CrossRef] [Scilit] [PubMed]
- Tang, H.; Chang, S.; Jiang, L.; Tang, G.; Liang, W. Novel Spindle-Shaped Nanoporous TiO2 Coupled with Graphitic g-C3N4 Nanosheets with Enhanced Visible-Light Photocatalytic Activity. Ceram. Int. 2016, 42, 18443–18452. [Google Scholar] [CrossRef] [Scilit]
- Yang, D.; Zhao, J.; Liu, H.; Zheng, Z.; Adebajo, M.O.; Wang, H.; Liu, X.; Zhang, H.; Zhao, J.C.; Bell, J. Enhancing Photoactivity of TiO2(B)/Anatase Core-Shell Nanofibers by Selectively Doping Cerium Ions into the TiO2(B) Core. Chem. Eur. J. 2013, 19, 5113–5119. [Google Scholar] [CrossRef] [Scilit] [PubMed]
- Jing, L.; Xin, B.; Yuan, F.; Xue, L.; Wang, B.; Fu, H. Effects of Surface Oxygen Vacancies on Photophysical and Photochemical Processes of Zn-Doped TiO2 Nanoparticles and Their Relationships. J. Phys. Chem. B 2006, 110, 17860–17865. [Google Scholar] [CrossRef] [Scilit] [PubMed]
- Lü, X.; Yang, W.; Quan, Z.; Lin, T.; Bai, L.; Wang, L.; Huang, F.; Zhao, Y. Enhanced Electron Transport in Nb-Doped TiO2 Nanoparticles via Pressure-Induced Phase Transitions. J. Am. Chem. Soc. 2014, 136, 419–426. [Google Scholar] [CrossRef] [Scilit] [PubMed]
- An, X.; Hu, C.; Liu, H.; Qu, J. Hierarchical Nanotubular Anatase/Rutile/TiO2(B) Heterophase Junction with Oxygen Vacancies for Enhanced Photocatalytic H2 Production. Langmuir 2018, 34, 1883–1889. [Google Scholar] [CrossRef] [Scilit] [PubMed]
- Seo, D.-S.; Lee, J.-K.; Kim, H. Preparation of Nanotube-Shaped TiO2 Powder. J. Cryst. Growth 2001, 229, 428–432. [Google Scholar] [CrossRef] [Scilit]
- Kumar, K.N.P.; Kumar, J.; Keizer, K. Effect of Peptization on Densification and Phase-Transformation Behavior of Sol–Gel-Derived Nanostructured Titania. J. Am. Ceram. Soc. 1994, 77, 1396–1400. [Google Scholar] [CrossRef] [Scilit]
- Miao, R.; Luo, Z.; Zhong, W.; Chen, S.-Y.; Jiang, T.; Dutta, B.; Nasr, Y.; Zhang, Y.; Suib, S.L. Mesoporous TiO2 Modified with Carbon Quantum Dots as a High-Performance Visible-Light Photocatalyst. Appl. Catal. B Environ. 2016, 189, 26–38. [Google Scholar] [CrossRef] [Scilit]
- Yu, B.Y.; Kwak, S.-Y. Carbon Quantum Dots Embedded with Mesoporous Hematite Nanospheres as Efficient Visible-Light-Active Photocatalysts. J. Mater. Chem. 2012, 22, 8345–8353. [Google Scholar] [CrossRef] [Scilit]
- Zhang, J.; Zhou, P.; Liu, J.; Yu, J. New Understanding of the Difference of Photocatalytic Activity among Anatase, Rutile and Brookite TiO2. Phys. Chem. Chem. Phys. 2014, 16, 20382–20386. [Google Scholar] [CrossRef] [Scilit] [PubMed]
- Makuła, P.; Pacia, M.; Macyk, W. How to Correctly Determine the Band Gap Energy of Modified Semiconductor Photocatalysts Based on UV-Vis Spectra. J. Phys. Chem. Lett. 2018, 9, 6814–6817. [Google Scholar] [CrossRef] [Scilit] [PubMed]
- Kerkez-Kuyumcu, Ö.; Kibar, E.; Dayıoğlu, K.; Gedik, F.; Akın, A.N.; Özkara-Aydınoğlu, Ş. A Comparative Study for Removal of Different Dyes over M/TiO2 (M = Cu, Ni, Co, Fe, Mn and Cr) Photocatalysts under Visible-Light Irradiation. J. Photochem. Photobiol. A Chem. 2015, 311, 176–185. [Google Scholar] [CrossRef] [Scilit]
- Zulmajdi, S.; Ajak, N.; Hobley, J.; Duraman, N.; Harunsani, M.; Yasin, H.; Nur, M.; Usman, A. Kinetics of Photocatalytic Degradation of Methylene Blue in Aqueous Dispersions of TiO2 Nanoparticles under UV-LED Irradiation. Am. J. Nanomater. 2017, 5, 1–6. [Google Scholar]
- Houas, A.; Lachheb, H.; Ksibi, M.; Elaloui, E.; Guillard, C.; Herrmann, J.-M. Photocatalytic Degradation Pathway of Methylene Blue in Water. Appl. Catal. B Environ. 2001, 31, 145–157. [Google Scholar] [CrossRef] [Scilit]
- Mozdbar, A.; Nouralishahi, A.; Fatemi, S.; Talatori, F.S. The Impact of Carbon Quantum Dots (CQDs) on the Photocatalytic Activity of TiO2 under UV and Visible Light. J. Water Process Eng. 2023, 51, 103465. [Google Scholar] [CrossRef] [Scilit]
- Yao, Y.; Li, G.; Ciston, S.; Lueptow, R.M.; Gray, K.A. Photoreactive TiO2/Carbon Nanotube Composites: Synthesis and Reactivity. Environ. Sci. Technol. 2008, 42, 4952–4957. [Google Scholar] [CrossRef] [Scilit] [PubMed]
- Yu, J.C.; Lin, J.; Lo, D.; Lam, S. Influence of Thermal Treatment on the Adsorption of Oxygen and Photocatalytic Activity of TiO2. Langmuir 2000, 16, 7304–7308. [Google Scholar] [CrossRef] [Scilit]
- Yu, J.; Zhang, C.; Yang, Y.; Yi, G.; Fan, R.; Li, L.; Xing, B.; Liu, Q.; Jia, J.; Huang, G. Lignite-Derived Carbon Quantum Dot/TiO2 Heterostructure Nanocomposites: Photoinduced Charge Transfer Properties and Enhanced Visible-Light Photocatalytic Activity. New J. Chem. 2019, 43, 18355–18368. [Google Scholar] [CrossRef] [Scilit]
- Haider, Z.; Imran, M.; Muhmood, T. Photoelectrochemical Production of Peroxydisulfate (PDS), a Clean Oxidant: Recent Development and Challenges. Int. J. Mol. Sci. 2026, 27, 3066. [Google Scholar] [CrossRef] [Scilit] [PubMed]
- Tixier, C.; Singer, H.P.; Oellers, S.; Müller, S.R. Occurrence and Fate of Carbamazepine, Clofibric Acid, Diclofenac, Ibuprofen, Ketoprofen, and Naproxen in Surface Waters. Environ. Sci. Technol. 2003, 37, 1061–1068. [Google Scholar] [CrossRef] [Scilit] [PubMed]
- Agüera, A.; Pérez Estrada, L.; Ferrer, I.; Thurman, E.; Malato, S.; Fernández-Alba, A. Application of Time-of-Flight Mass Spectrometry to the Analysis of Phototransformation Products of Diclofenac in Water under Natural Sunlight. J. Mass Spectrom. 2005, 40, 908–915. [Google Scholar] [CrossRef] [Scilit] [PubMed]
- Stumpf, M.; Ternes, T.A.; Wilken, R.-D.; Rodrigues, S.V.; Baumann, W. Polar Drug Residues in Sewage and Natural Waters in the State of Rio de Janeiro, Brazil. Sci. Total Environ. 1999, 225, 135–141. [Google Scholar] [CrossRef] [Scilit] [PubMed]
- Cleuvers, M. Mixture Toxicity of the Anti-Inflammatory Drugs Diclofenac, Ibuprofen, Naproxen, and Acetylsalicylic Acid. Ecotoxicol. Environ. Saf. 2004, 59, 309–315. [Google Scholar] [CrossRef] [Scilit] [PubMed]
- Prasannan, A.; Imae, T. One-Pot Synthesis of Fluorescent Carbon Dots from Orange Waste Peels. Ind. Eng. Chem. Res. 2013, 52, 15673–15678. [Google Scholar] [CrossRef] [Scilit]
- Spurr, R.A.; Myers, H. Quantitative Analysis of Anatase-Rutile Mixtures with an X-Ray Diffractometer. Anal. Chem. 1957, 29, 760–762. [Google Scholar] [CrossRef] [Scilit]
- Zhang, Q.; Gao, L.; Guo, J. Effects of Calcination on the Photocatalytic Properties of Nanosized TiO2 Powders Prepared by TiCl4 Hydrolysis. Appl. Catal. B Environ. 2000, 26, 207–215. [Google Scholar] [CrossRef] [Scilit]
- Teodorescu, C.M.; Esteva, J.M.; Karnatak, R.C.; El Afif, A. An Approximation of the Voigt I Profile for the Fitting of Experimental X-Ray Absorption Data. Nucl. Instrum. Methods Phys. Res. A 1994, 345, 141–147. [Google Scholar] [CrossRef] [Scilit]
- Mardare, D.; Luca, D.; Teodorescu, C.M.; Macovei, D. On the Hydrophilicity of Nitrogen-Doped TiO2 Thin Films. Surf. Sci. 2007, 601, 4515–4520. [Google Scholar] [CrossRef] [Scilit]
- Wagner, C.D.; Davis, L.E.; Zeller, M.V.; Taylor, J.A.; Raymond, R.H.; Gale, L.H. Empirical Atomic Sensitivity Factors for Quantitative Analysis by Electron Spectroscopy for Chemical Analysis. Surf. Interface Anal. 1981, 3, 211–225. [Google Scholar] [CrossRef] [Scilit]
- Galanin, M.D.; Kutyonkov, A.A.; Smorchkov, V.N.; Timofeev, Y.P.; Chizhikova, Z.A. Measurement of Photoluminescence Quantum Yield of Dye Solutions by the Vavilov and Integrating-Sphere Methods. Opt. Spectrosc. 1982, 53, 405–409. [Google Scholar]
- Yu, J.C.; Ho, W.; Jiang, Z.; Zhang, L. Effects of F-Doping on the Photocatalytic Activity and Microstructures of Nanocrystalline TiO2 Powders. Chem. Mater. 2002, 14, 3808–3816. [Google Scholar] [CrossRef] [Scilit]

Disclaimer/Publisher’s Note: The statements, opinions and data contained in all publications are solely those of the individual author(s) and contributor(s) and not of MDPI and/or the editor(s). MDPI and/or the editor(s) disclaim responsibility for any injury to people or property resulting from any ideas, methods, instructions or products referred to in the content. |
© 2026 by the authors. Licensee MDPI, Basel, Switzerland. This article is an open access article distributed under the terms and conditions of the Creative Commons Attribution (CC BY) license.