1. Introduction
The effluent from sewage treatment plants refers to treated water discharged after secondary biological treatment in urban sewage treatment plants. It is characterized by large-scale production, significant water quality fluctuations, low pollutant concentrations, and poor biodegradability [
1]. With the continuous deterioration of global surface water environmental problems [
2], the treatment of sewage treatment plant effluent has attracted increasing attention from all sectors of society.
In recent years, although the water quality of sewage treatment plant effluent has improved to some extent, there are still some sewage treatment plants whose discharged wastewater fails to meet the “Discharge Standard of Pollutants for Municipal Wastewater Treatment Plant” (GB 18918-2002) [
3]. Moreover, according to water quality standards, even if the effluent from sewage treatment plants meets the corresponding discharge standards, the pollutant content in it is still much higher than the limits specified in the “Environmental Quality Standards for Surface Water” (GB 3838-2002) [
4]. As shown in
Table 1,taking ammonia–nitrogen (NH
4⁺–N) and total phosphorus (TP) as examples, in the effluent that meets the Class I—A standard of the “Discharge Standard of Pollutants for Municipal Wastewater Treatment Plant”, the ammonia–nitrogen concentration is 2.5 times that of the Class V standard for surface water, and the total phosphorus concentration is 1.25 times that of the Class V standard for surface water.
The excessive input of high-concentration nitrogen and phosphorus pollutants into surface water bodies such as rivers and lakes [
5] can cause significant changes in the microbial community structure of the aquatic ecosystem, manifested as the proliferation of heterotrophic microbial communities and the inhibitory growth and decline of autotrophic microorganisms [
6]. This niche replacement phenomenon may trigger the eutrophication process, leading to secondary ecological disasters such as the depletion of dissolved oxygen in water bodies and the abnormal proliferation of algae [
7], thus seriously threatening the stability and environmental carrying capacity of the aquatic ecosystem.
In the field of sewage nitrogen removal, ceramsite filter media are widely used as functional biological carriers due to their advantages such as porous structure, high specific surface area, and surface electrochemical properties [
8]. Compared with traditional filter media, the unique physical and chemical properties of ceramsite not only have economic advantages and the availability of raw materials, but ceramsite’s surface microporous structure also provides an ideal micro-niche for ammonia-oxidizing bacteria (AOB), nitrite-oxidizing bacteria (NOB), and denitrifying microorganisms [
9]. The directional enrichment effect of this biofilm system can significantly promote the cascade transformation of nitrogen-containing pollutants: organic nitrogen is mineralized into NH
4⁺ through ammonification, converted into NO
3− through nitrification, and finally denitrified to produce N
2 in an anoxic micro-environment [
10]. The systematic enhancement of this metabolic pathway enables ceramsite filter media to show significant advantages in ammonia–nitrogen removal efficiency and process stability, providing an important solution for the development of sustainable water pollution control technologies.
In the field of sewage phosphorus removal, ceramsite materials exhibit unique adsorption performance advantages in controlling phosphorus pollution in water bodies due to their remarkable high specific surface area and multi-level pore topological structure [
11]. Research indicates that its adsorption mechanism mainly involves a synergistic process of physical adsorption (pore interception effect) and chemical adsorption (coordination of surface hydroxyl sites) [
12]. The abundant mesoporous (2–50 nm) and macroporous (>50 nm) structures on the surface of ceramsite optimize the transport pathways of phosphorus species (such as H
2PO
4− and HPO
42−) through molecular diffusion kinetics [
13], while micropores (<2 nm) enhance the density of adsorption sites through the spatial confinement effect [
14]. The simultaneous chemical adsorption is manifested as the Lewis acid–base interaction between metal oxides (such as Fe–O and Al–O) on the ceramsite surface and phosphate ions, including interfacial reaction pathways such as ligand exchange, ionic bonding, and complex precipitation [
15].
In addition, structural parameters such as the pore size gradient distribution and pore connectivity of ceramsite can significantly affect the equilibrium capacity (qe) and kinetic constant (k
1) of phosphorus adsorption. The goodness-of-fit (R
2 > 0.99) of the pseudo-second-order kinetic model confirms that this process is controlled by chemical adsorption [
16]. Notably, ceramsite can still maintain an initial adsorption efficiency of over 85% after multiple adsorption–desorption cycles. This excellent regeneration performance stems from its thermodynamically stable crystal phase structure and the reversible regeneration characteristics of surface active sites, providing a theoretical basis for constructing a long-term technical system for phosphorus pollution remediation.
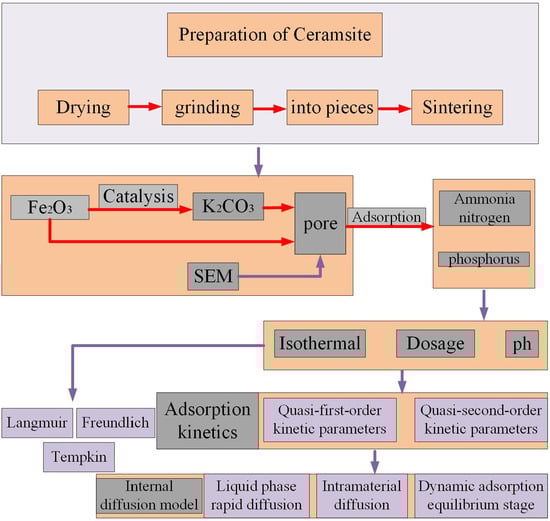
This paper proposes using sludge and shale as the main materials; mixing them with components such as K
2CO
3, biomass, and Fe
2O
3; and preparing porous lightweight ceramsite through Fe
2O
3-catalyzed sintering. With the ceramsite as the adsorbent, adsorption experiments were carried out on wastewater containing ammonia–nitrogen [
17] and phosphorus [
18]. The adsorption performance was evaluated, and the adsorption mechanism was analyzed. This study provides theoretical basis and technical support for the preparation of sludge-based porous ceramsite and its application in the field of wastewater treatment.
2. Experimental Design Scheme
2.1. Experimental Procedure
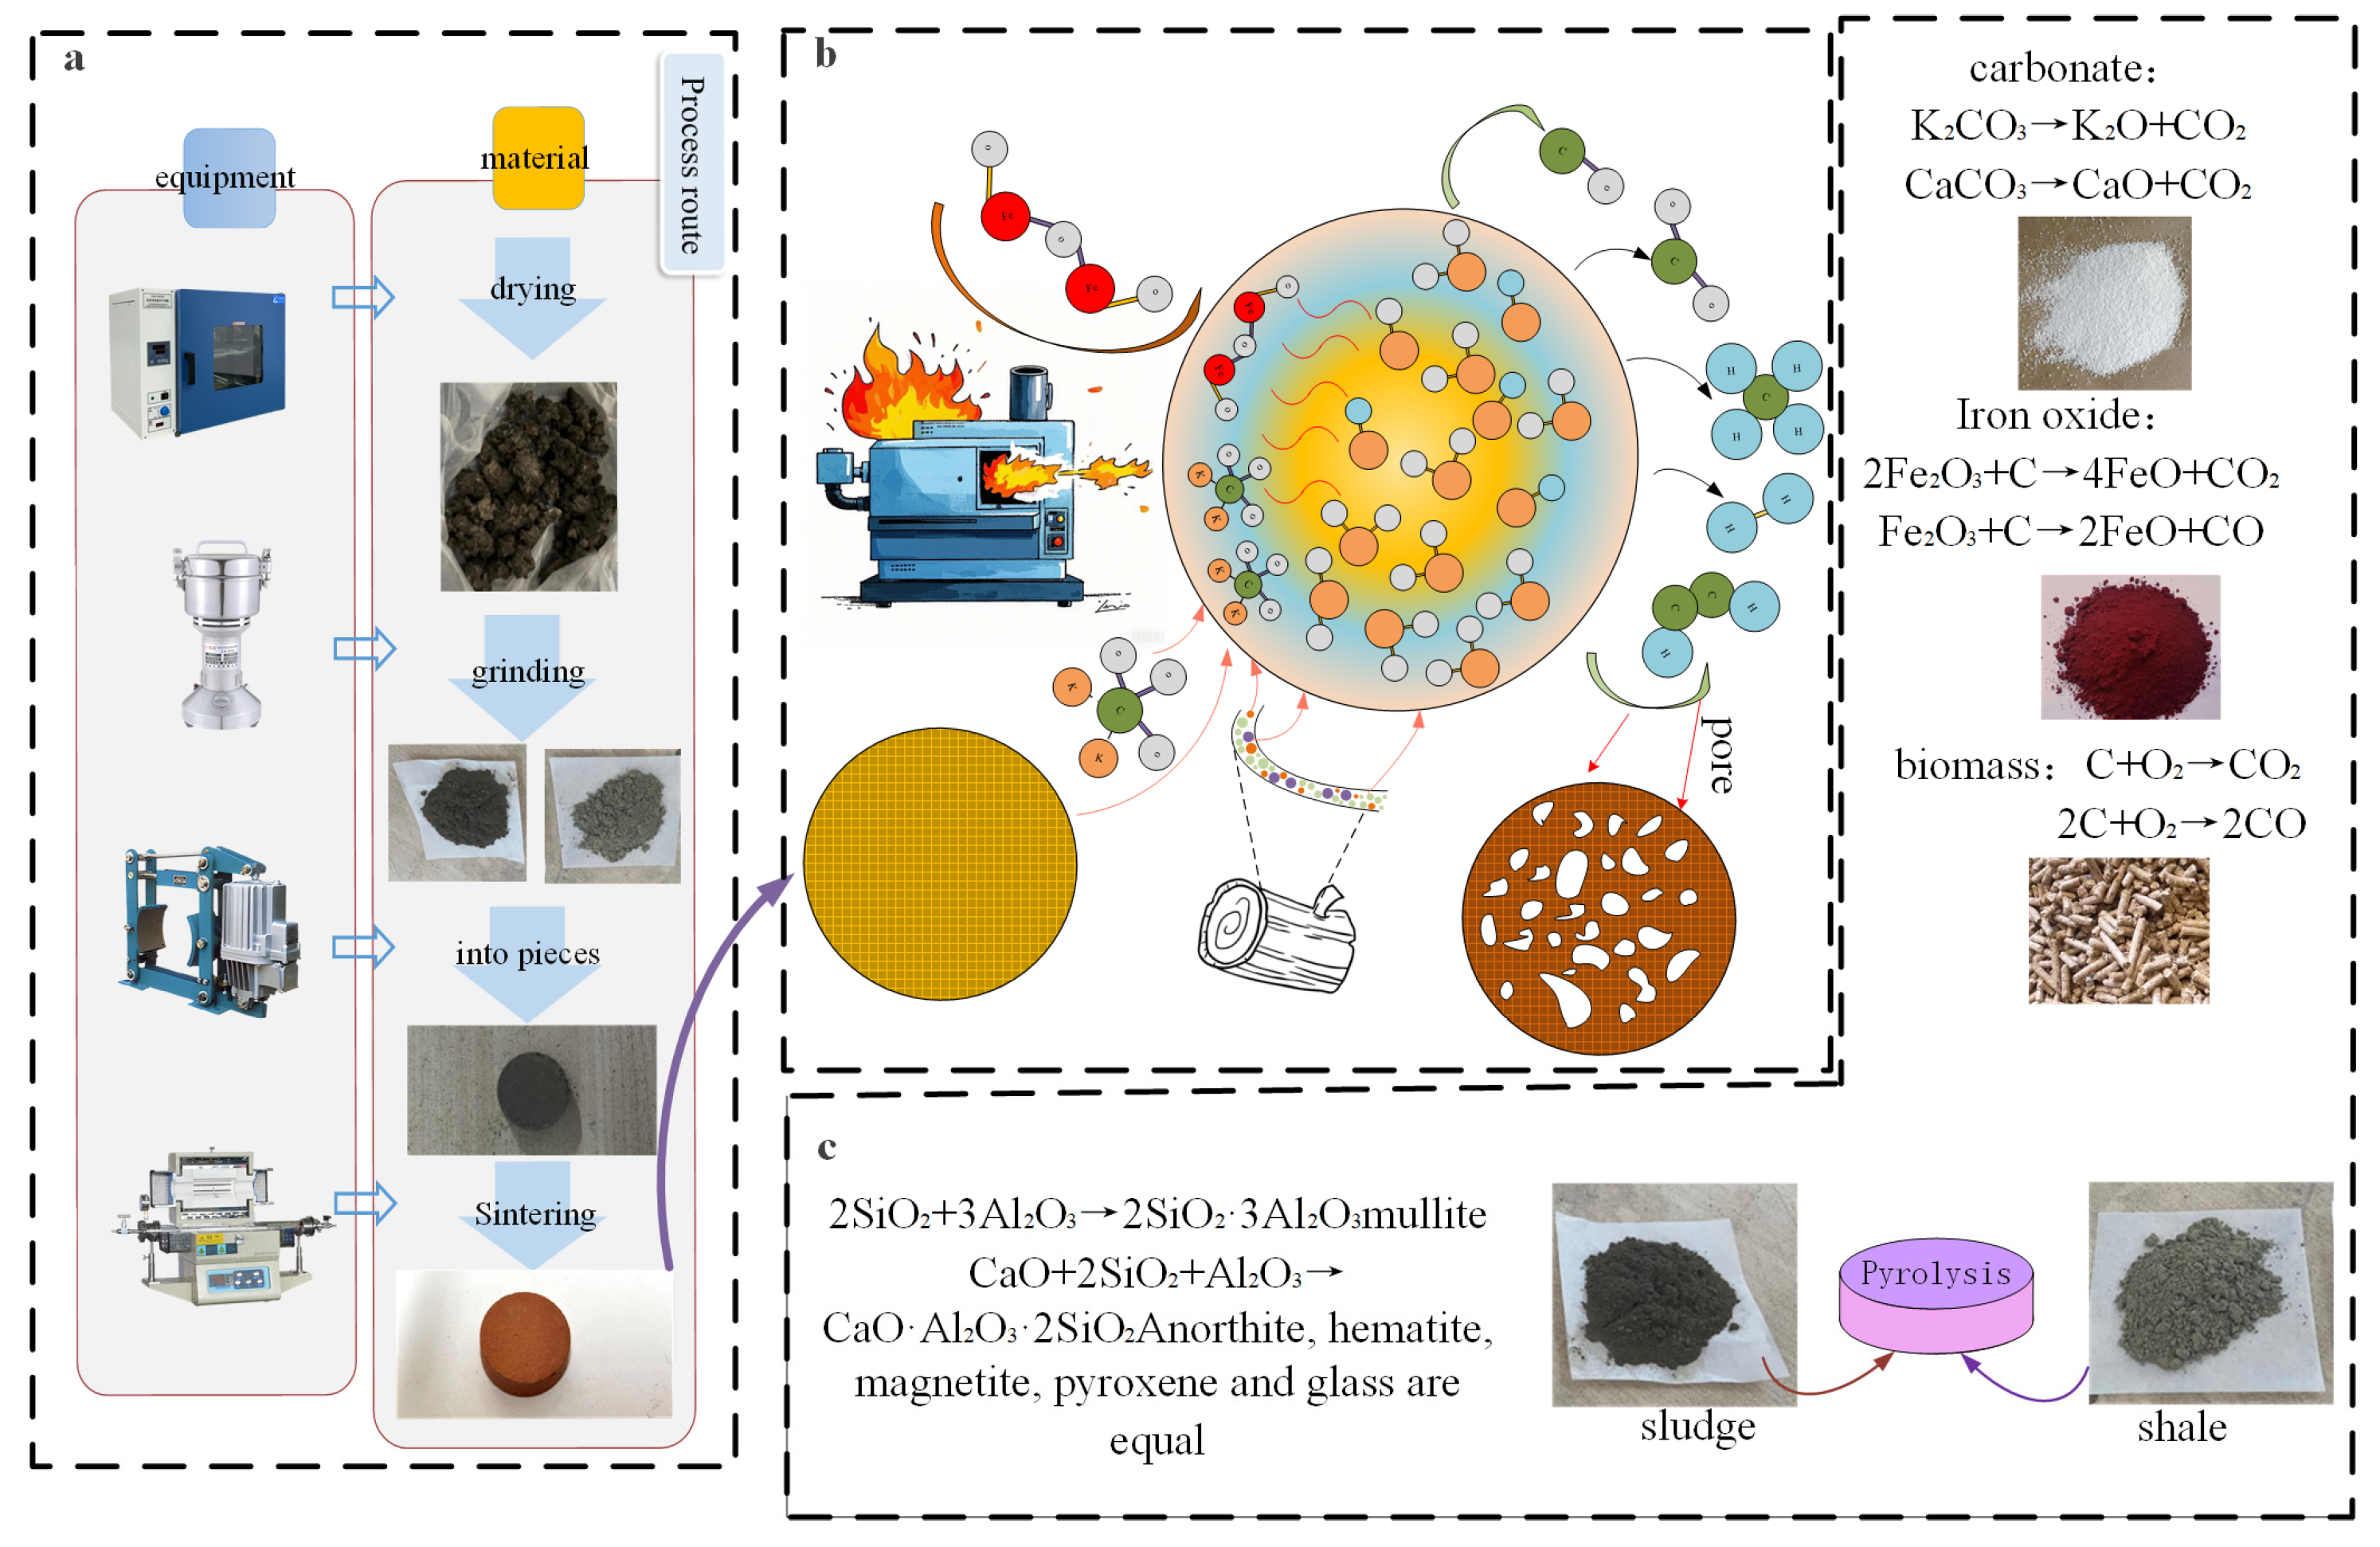
After the sludge is dried, it is thoroughly mixed with crushed shale. Meanwhile, components for pore-forming [
19], gas-generating [
20], and fluxing [
21], such as biomass, K
2CO
3, and Fe
2O
3, are added. After tableting, the mixture goes through drying [
22], pre-heating [
23], roasting [
24], and cooling processes to produce ceramsite [
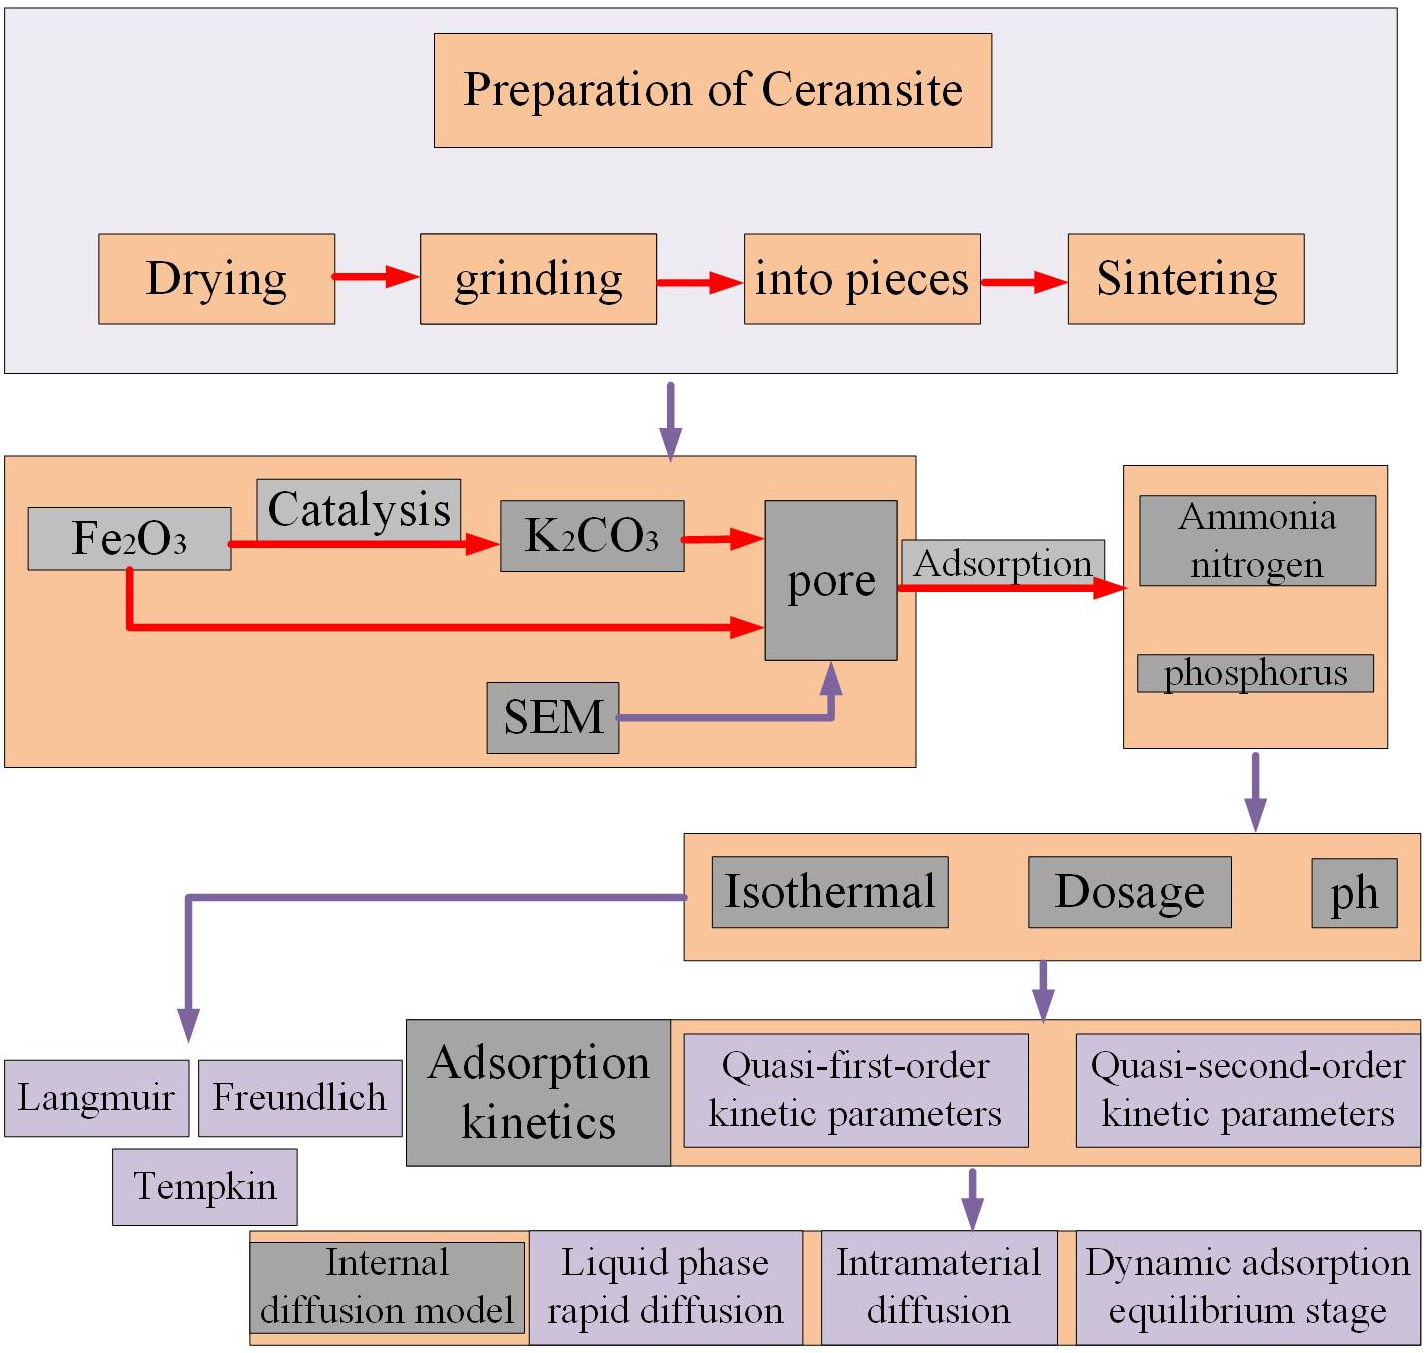
25]. The process flow is shown in
Figure 1a.
Figure 1b is a diagram illustrating the mechanism of the ceramsite sintering process. It shows that additives like biomass, K
2CO
3, and Fe
2O
3 enable ceramsite [
26] to form well-developed pores through a series of chemical reactions during the sintering process. Subsequently, the well-developed pore structure allows the ceramsite to further adsorb ammonia–nitrogen and phosphorus in water. In the adsorption experiment, the determination of the ammonia–nitrogen content refers to the “Salicylic Acid Spectrophotometric Method” (HJ536-2009) [
27], and the determination of the total phosphorus content refers to the “Ammonium Molybdate Spectrophotometric Method” (GB11893-83) [
28].
2.2. Fe2O3 Catalytic
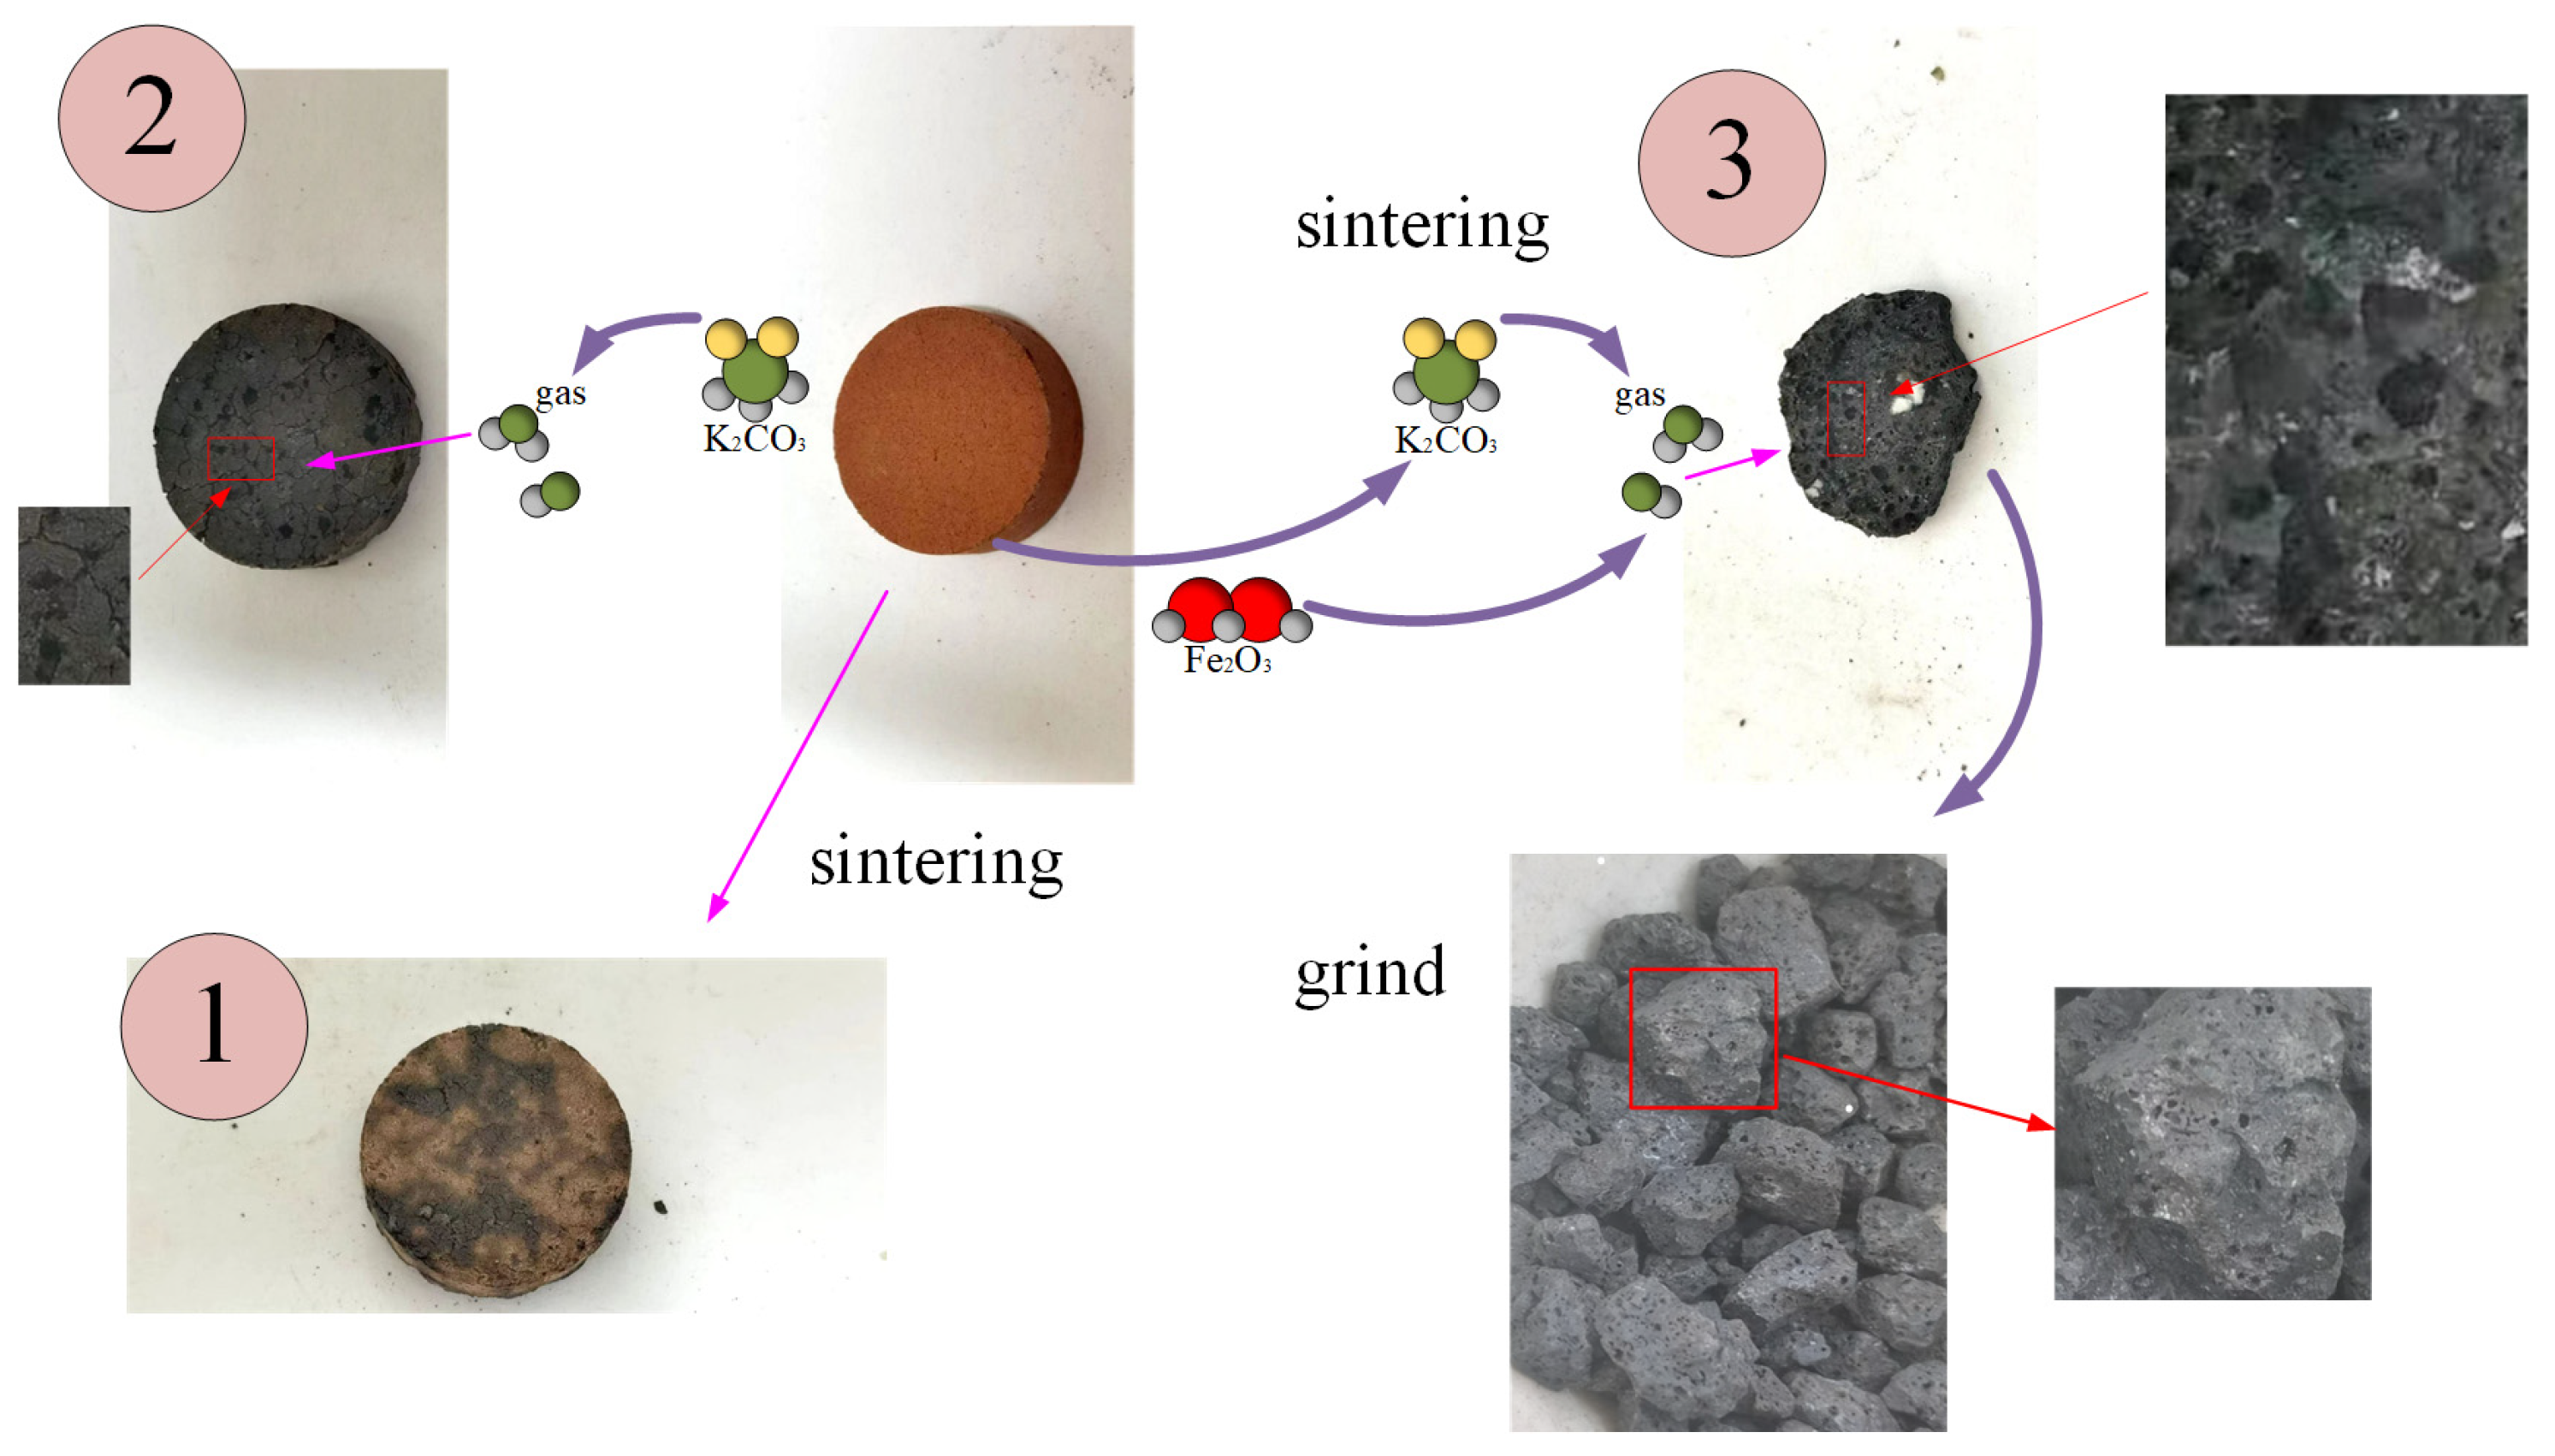
As shown in
Figure 2, (1) there is no additive or (2) only K
2CO
3 (3) is added at the same time K
2CO
3, Fe
2O
3 after firing in three ways.
It can be clearly seen from the above figure that when there are no additives, the surface of the fired ceramsite shows no change other than a color alteration, and there is no pore structure. When only K2CO3 is added, a certain pore structure begins to appear, but the pore size is large and the number is small. When both K2CO3 and Fe2O3 are added, a well-developed and dense pore structure emerges, with fine, continuous pores in large quantities. This indicates that the catalytic induction effect of Fe2O3 is significant.
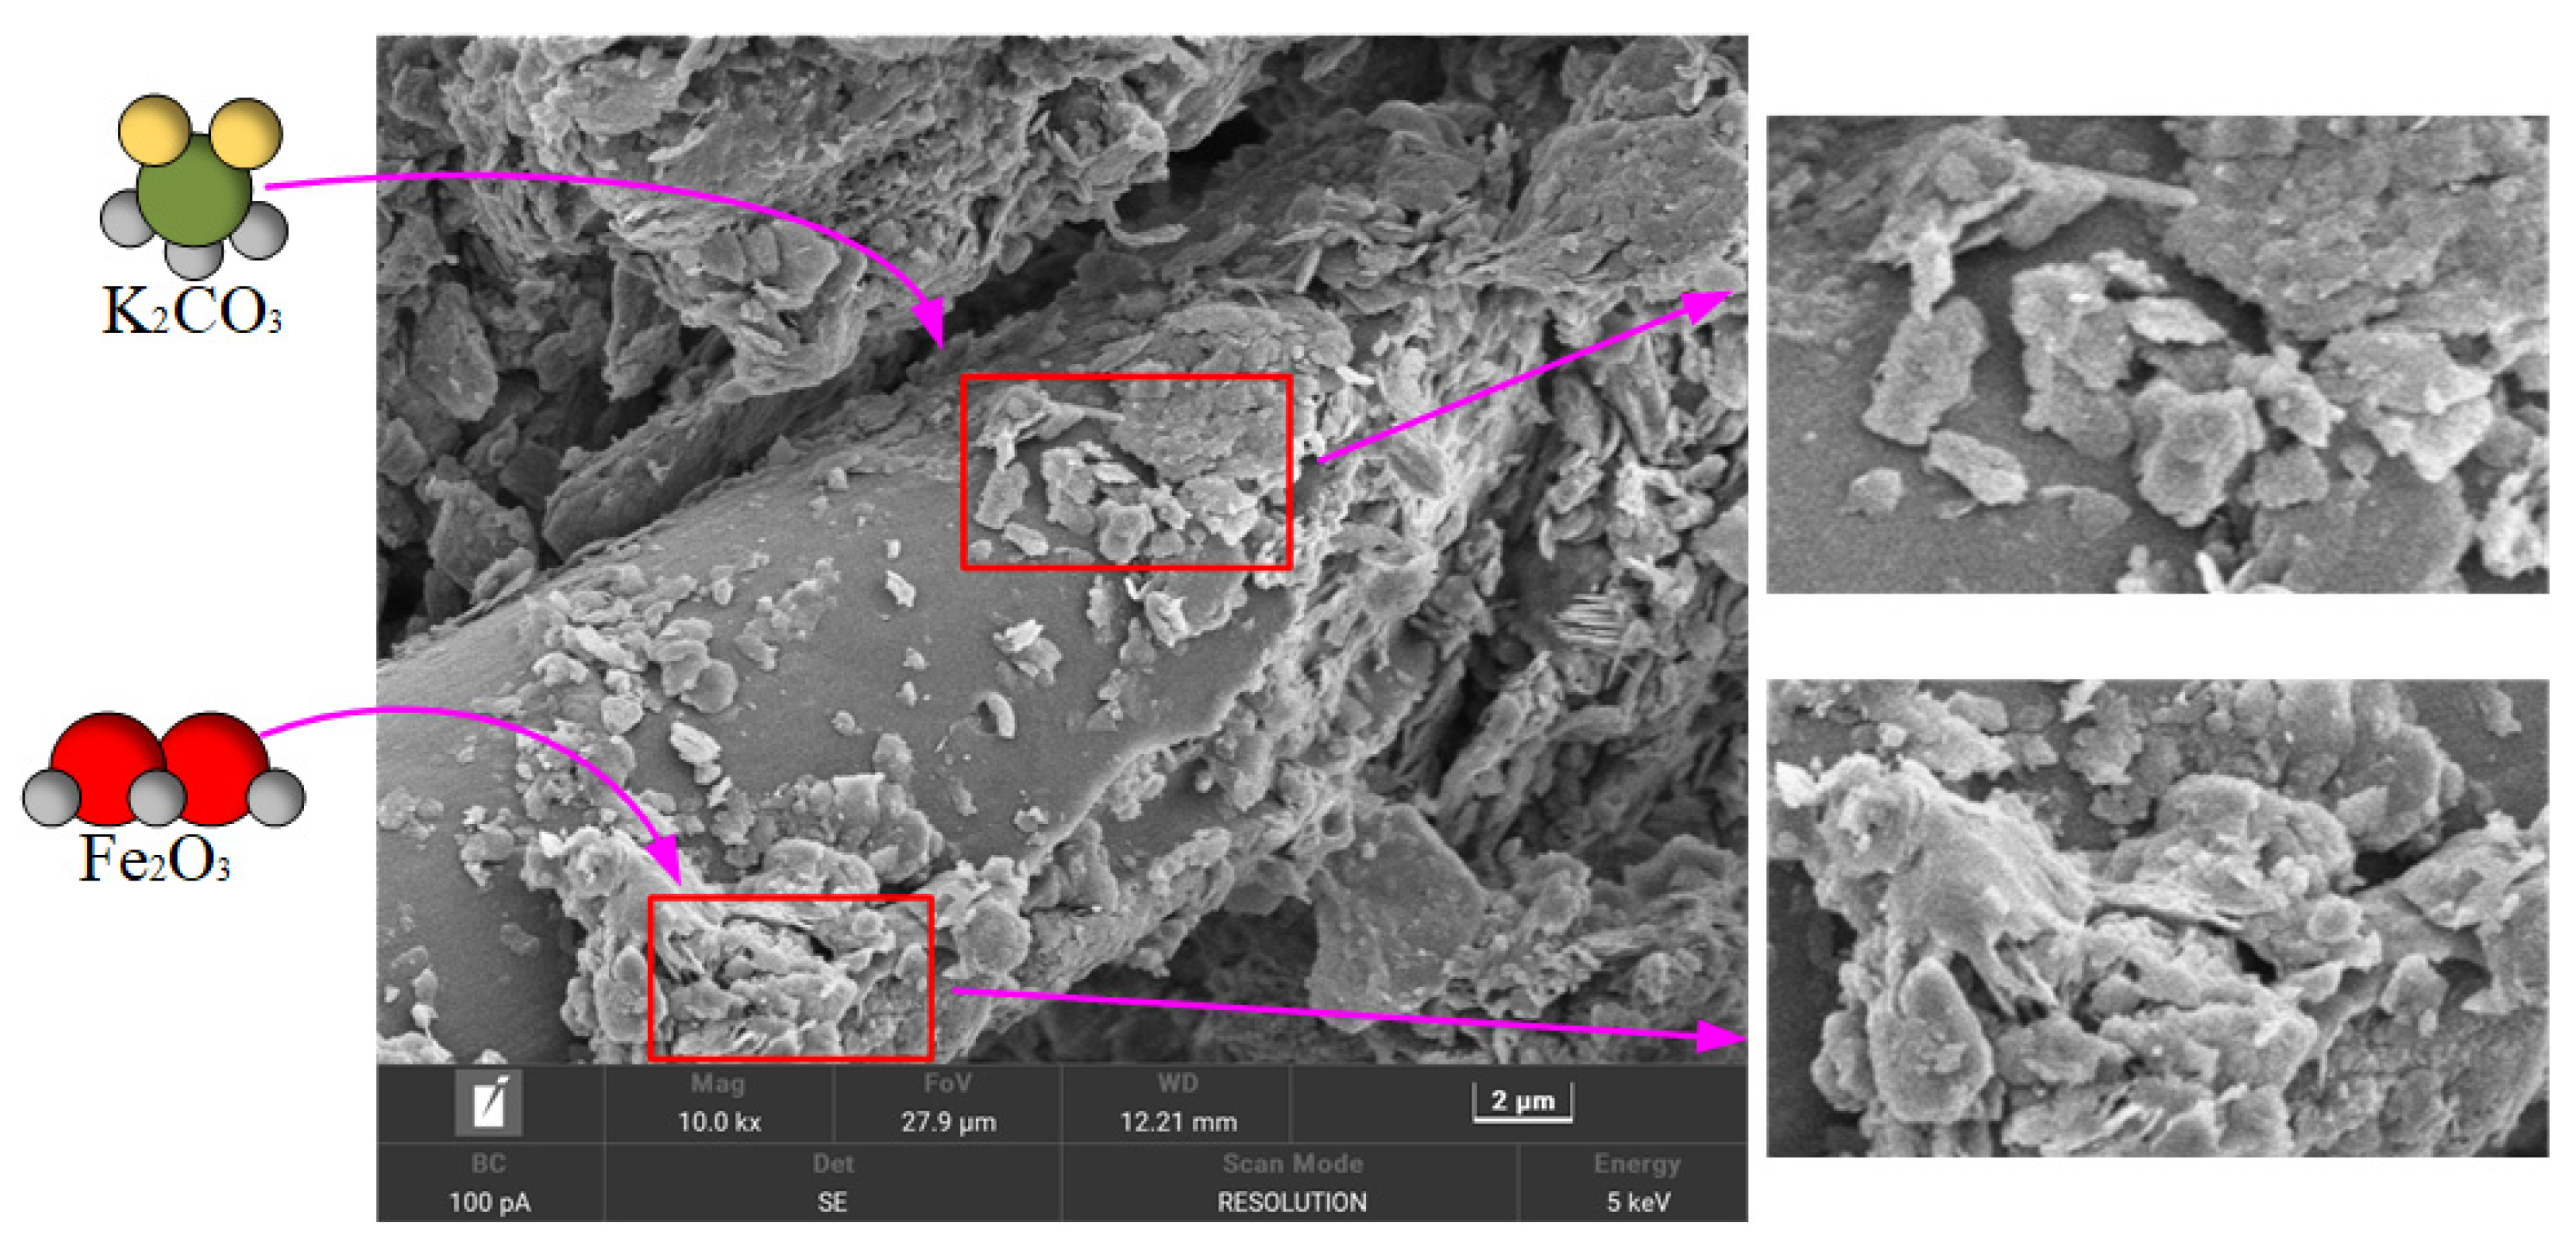
The SEM of the ceramic surface before sintering is shown in
Figure 3 below.
According to the scanning electron microscope (SEM) analysis, the surface of the unsintered ceramsite precursor exhibits a continuous and dense matrix structure, and no obvious macroscopic pores or through channels are observed (apparent porosity < 1%). High-resolution images show that the matrix surface is covered with a large number of micron-sized K2CO3 crystals and nano–micron dual-scale Fe2O3 attachments. K2CO3 exists in the forms of rhombohedral single crystals (0.5–3 μm) and aggregates (up to 15 μm), and the cleavage planes on its surface are clearly visible. Fe2O3 presents two distribution patterns: nanoparticles of 50–200 nm cover approximately 37% of the surface area in a discrete island-like structure, and at the same time, a continuous film with a thickness of 200–500 nm is formed in the depressions of the matrix. This special microstructure provides a spatial regulation basis for pore formation by K2CO3 decomposition and the catalytic induction of anisotropic pore evolution by Fe2O3 during the subsequent sintering process.
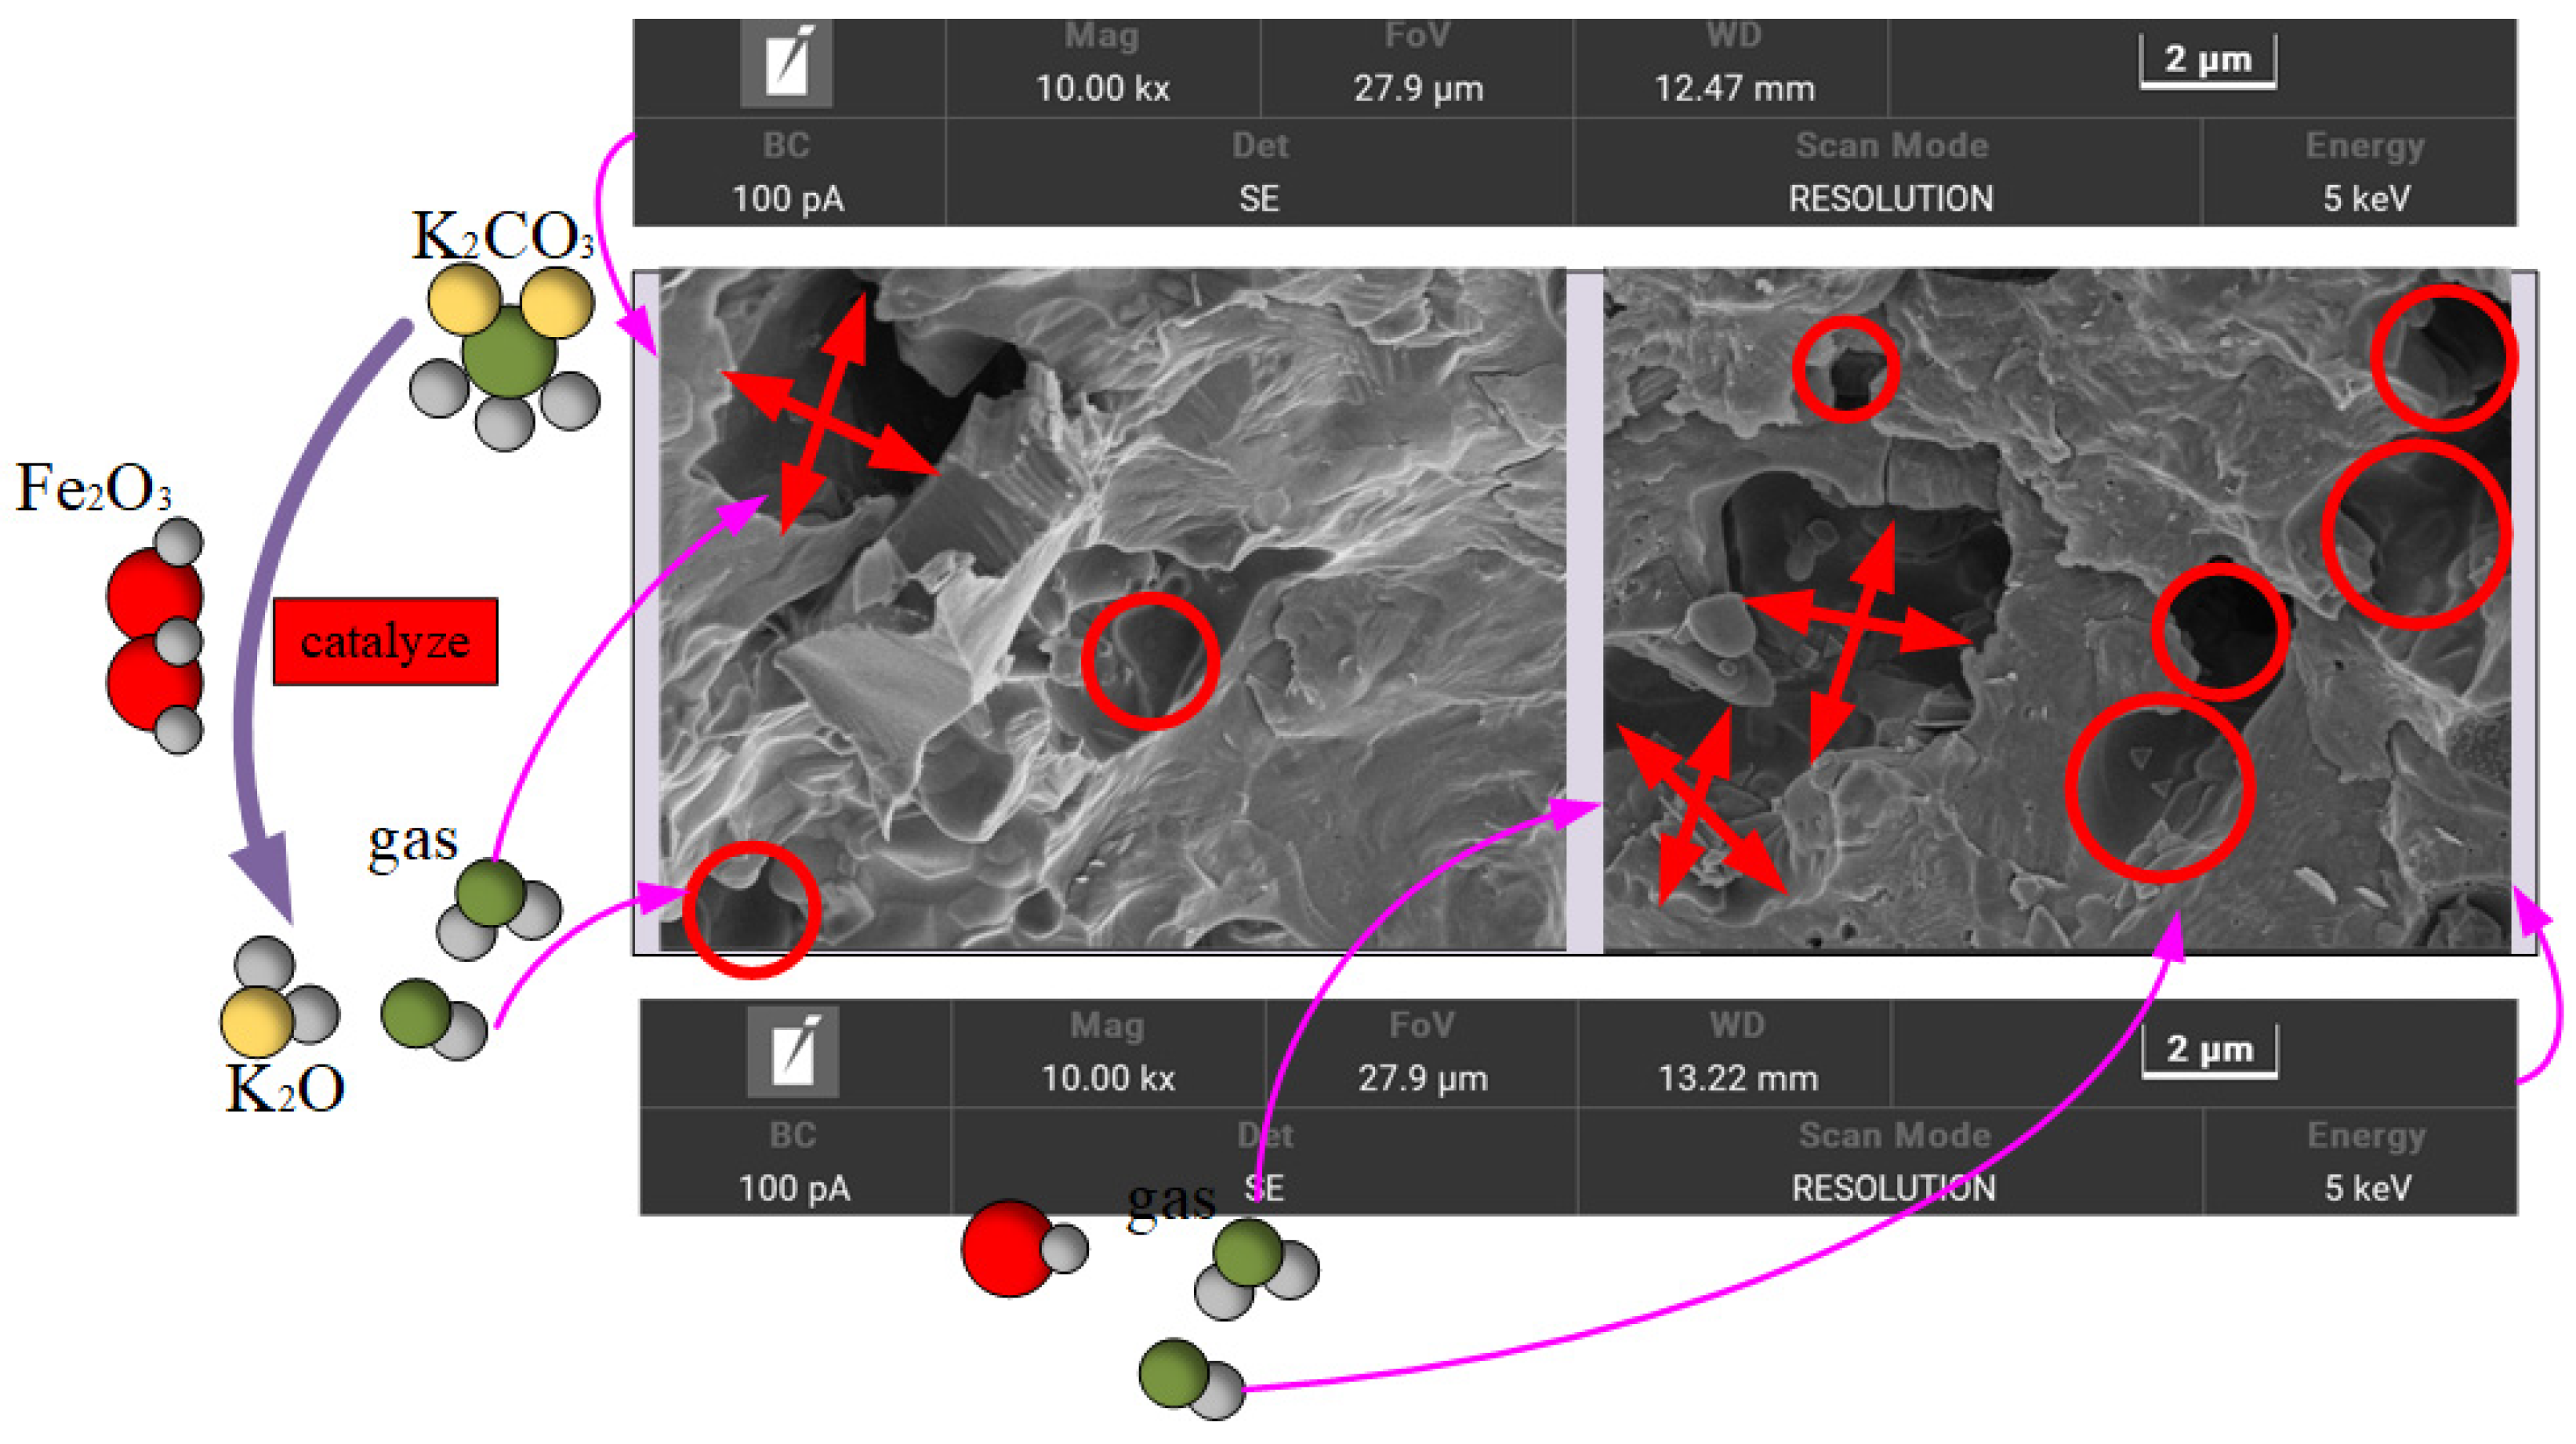
The SEM of the sintered ceramic surface is shown in
Figure 4 below. The microstructure of the sintered composite ceramsite was characterized by scanning electron microscopy (SEM). The results showed that a highly developed pore structure was formed on the surface and inside of the ceramsite, with uniform pore distribution and multi-level through-hole characteristics (pore size ranging from approximately 0.5 to 10 μm). Energy-dispersive X-ray spectroscopy (EDS) analysis combined with the study of the thermodynamic mechanism indicated that the formation of this special structure mainly originated from the synergistic decomposition of K
2CO
3 and Fe
2O
3 during the sintering process. In the medium-temperature sintering stage at 500–800 °C, Fe
2O
3, acting as a catalyst, significantly reduced the decomposition activation energy of K
2CO
3, prompting its step-by-step pyrolysis. First, K
2CO
3 was adsorbed and dissociated into K
2O at the active sites on the surface of Fe
2O
3, while a large amount of CO and CO
2 gases were released. These instantaneously generated reducing gases rapidly expanded and escaped from the molten matrix, forming a primary pore network mainly composed of circular holes.
As the temperature rises above 900 °C, the system enters the high-temperature reaction stage. Fe2O3 itself begins to undergo reductive decomposition. Through the valence-state transformation of Fe3⁺→Fe2⁺, FeO is generated, accompanied by the release of secondary CO/CO2 gases. At this time, the viscosity of the matrix decreases, and the gas diffusion coefficient increases. The newly generated gas flow creates long and narrow tunnel-like pores during the process of penetrating the melt. These pores cross-link with the circular pores formed in the previous stage, resulting in a three-dimensional interconnected complex pore-channel structure.
2.3. Adsorption Experiment Steps
- (1)
The influence of the dosage of ceramsite on the adsorption effect
Prepare solutions with concentrations of 5 mg/L NH4Cl and 0.5 mg/L KH2PO4, respectively, and adjust the pH value to 7. The dosage of ceramsite is 2.1–9.6 g/L, with a gradient of 2.1 g/L. Place 100 mL of simulated wastewater into a stoppered conical flask with a volume of 250 mL. It was placed and adsorbed in a constant temperature water bath shaker at 25 °C and 120 r/min for 24 h. Take a small amount of the supernatant and filter it through a filter membrane. Determine the concentrations of residual nitrogen and phosphorus in the filtrate, and calculate the equilibrium adsorption capacity and removal rate.
- (2)
The influence of pH on the adsorption effect
Prepare a NH4Cl solution with a concentration of 5 mg/L and the dosage of ceramsite is 3 g/L. The configuration concentration is 0.5 mg/L. For the KH2PO4 solution, the dosage of ceramsite is 8 g/L. Adjust the pH values, respectively, to 3 to 11, with a gradient of 1. The rest steps are consistent with Experiment (1).
- (3)
Adsorption kinetics experiment
Prepare an NH4Cl solution with a concentration of 5 mg/L, the dosage of ceramsite is 3 g/L, and adjust the pH value to 8. Prepare a KH2PO4 solution with a concentration of 0.5 mg/L, add 3 g/L of ceramsite, and adjust the pH value to 7. Perform static adsorption for 0.5, 1, 2, 3, 6, 9, 12, 18, 24, 30 and 36 h. The remaining steps are consistent with Experiment (1).
- (4)
Isothermal adsorption experiment
Prepare NH4Cl solutions with concentrations of 2, 5, 8, 12, 16, and 20 mg/L and ceramsite with a dosage of 3 g/L. Adjust the pH value to 8. Prepare KH2PO4 solutions with concentrations of 0.2, 0.5, 0.8, 1.2, 1.6, and 2.0 mg/L and ceramsite with a dosage of 3 g/L, and adjust the pH value to 7. In constant-temperature water baths with temperatures of 15, 25 and 35 °C, stand and adsorb the solutions in an oscillator for 24 h. The remaining steps are consistent with Experiment (1).
All the above experiments were conducted twice. The subsequent experimental data used were all the average values of the experiments with a value of 2.
3. Evaluation of Adsorption Performance of Ceramides on Wastewater Containing Ammonia–Nitrogen
3.1. Dynamic Analysis Theory
- (1)
Theoretical analysis of quasi-first-order and quasi-second-order dynamics
Quasi-first-order and quasi-second-order kinetic models are used to describe the variation law of adsorption capacity with time during the adsorption process [
29].
Quasi-first-order kinetics assumes that the adsorption rate is controlled by physical diffusion processes, such as the migration of adsorbate from the main body of the solution to the surface of the adsorbent.
Quasi-second-order kinetics emphasizes that the adsorption process is dominated by chemical actions, such as chemical bonding or electron exchange between the adsorbate and the active sites on the surface of the adsorbent.
- (2)
Identification and analysis of liquid-phase diffusion, intra-particle diffusion, and dynamic equilibrium stages [
30].
The adsorption process usually goes through three stages, and its theoretical analysis needs to combine kinetics and diffusion mechanisms:
Liquid-phase rapid diffusion stage: At this stage, the adsorbate rapidly migrates from the main body of the solution to the outer surface of the adsorbent, with a short time consumption and a rapid increase in adsorption capacity. The experiment is manifested as the initial steep part of the adsorption capacity–time curve.
Intra-particle diffusion stage: The adsorbate migrates from the surface of the adsorbent to the internal pores or active sites, and the rate is affected by the pore structure, pore size distribution, and chemical affinity.
Dynamic adsorption equilibrium stage: When the adsorption rate is equal to the desorption rate, the adsorption capacity tends to stabilize.
3.2. Influence of Dosage of Ceramisite on Adsorption Effect
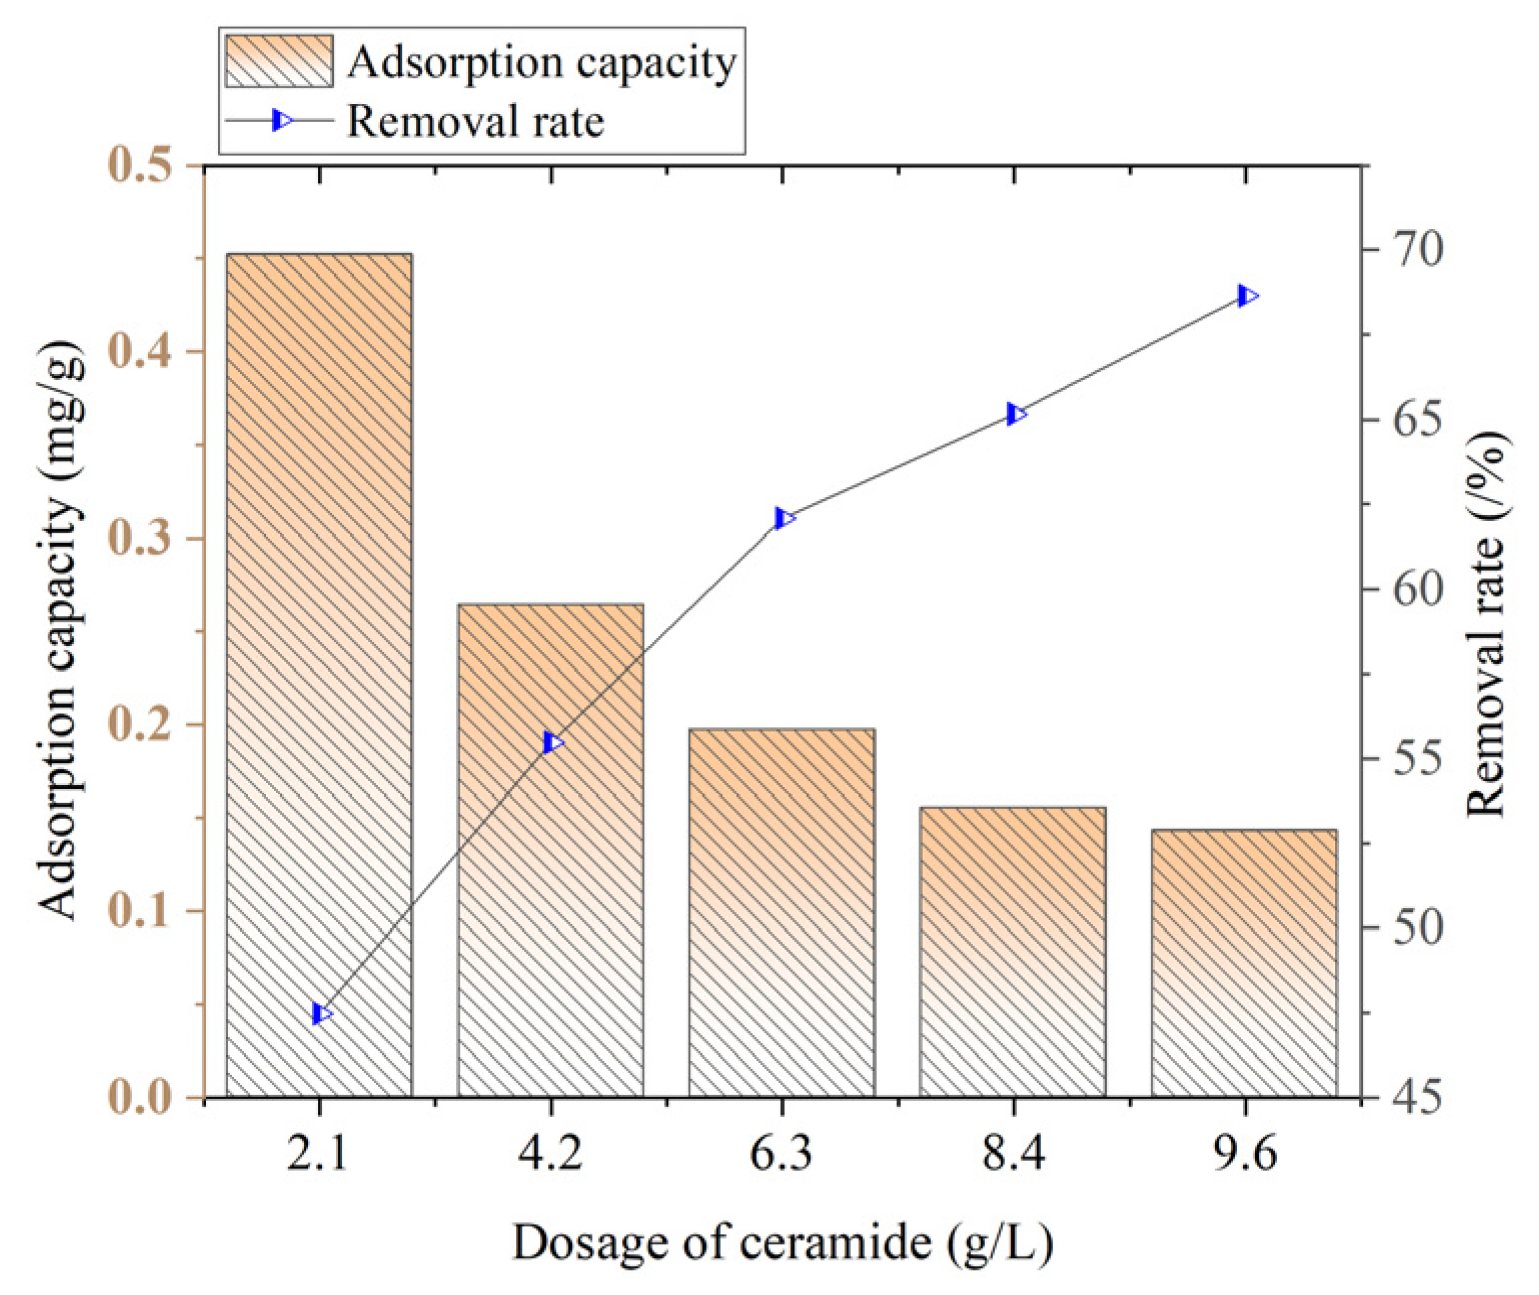
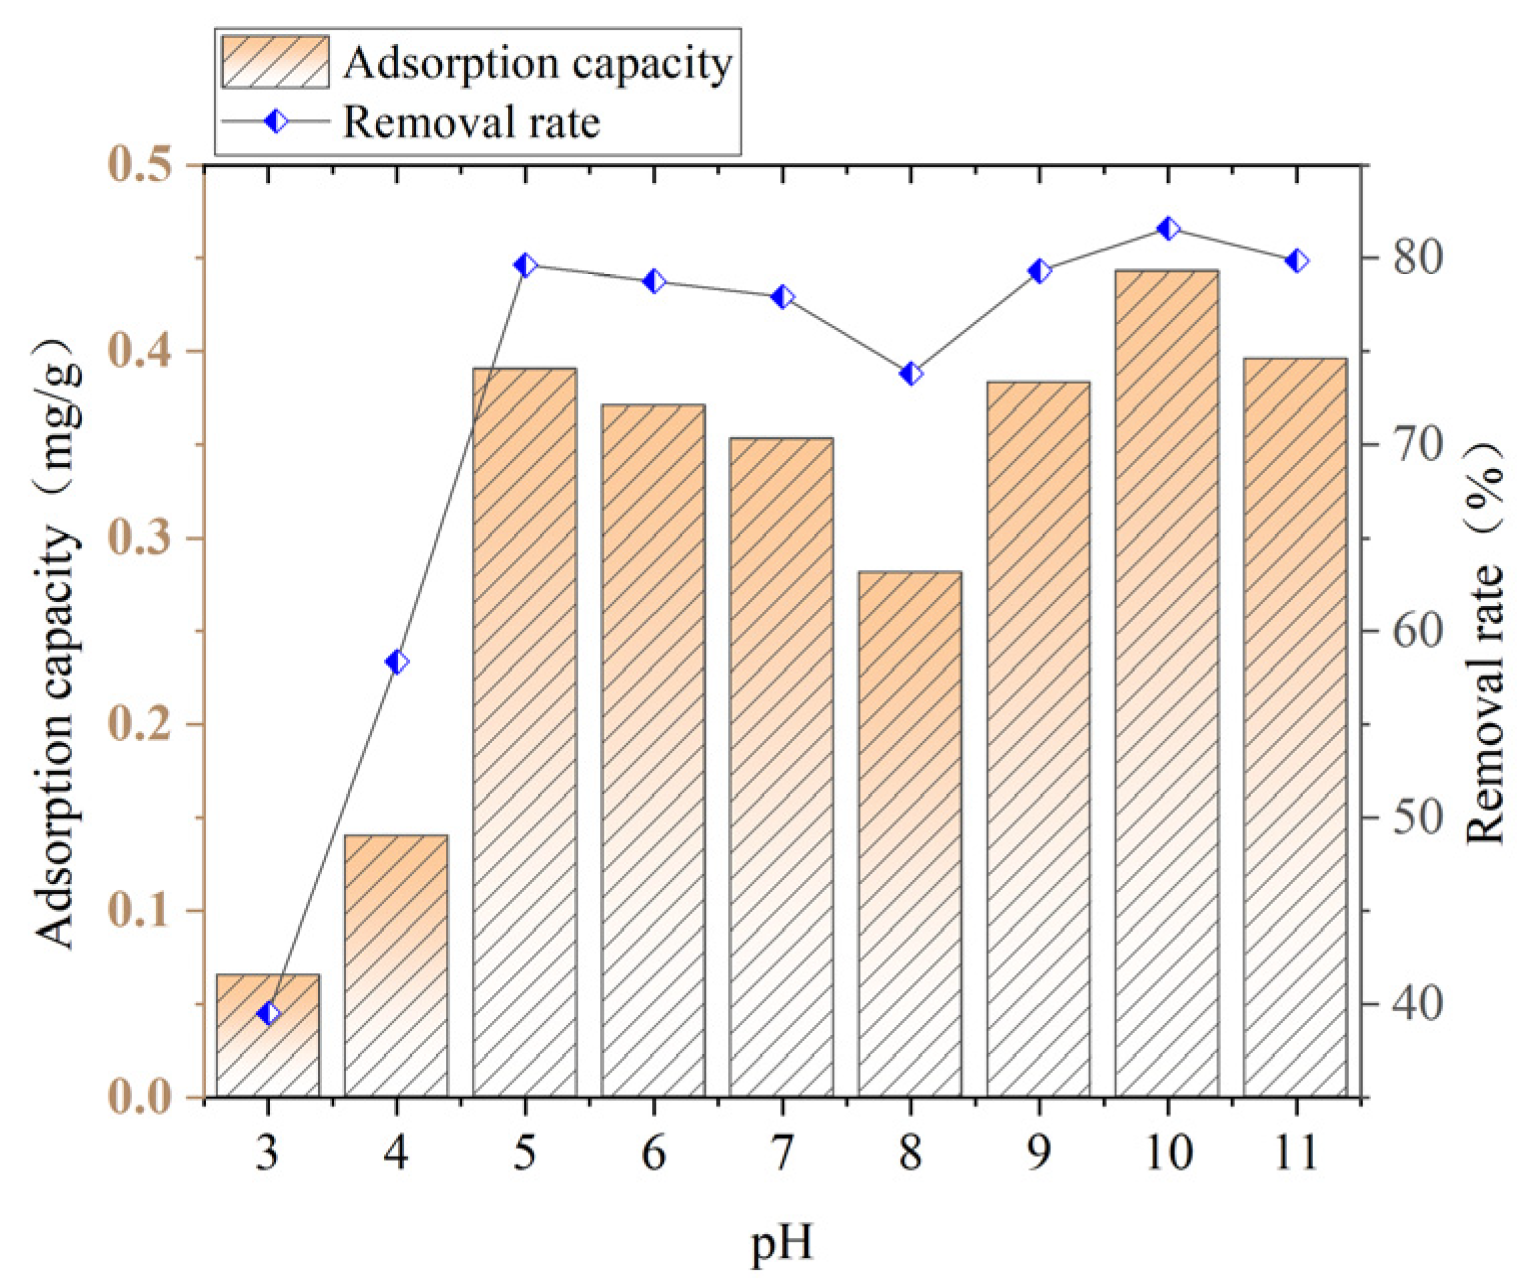
The effects of the dosage and pH of ceramide on the effect of ammonia–nitrogen are shown in
Figure 5.
It can be seen from
Figure 5 that as the dosage increases, the ammonia–nitrogen adsorption capacity shows a downward trend. When the ceramsite dosage is 2.1 g/L, the adsorption capacity reaches its maximum, which is 0.4521 mg/g. When the dosage is 9.6 g/L, the adsorption capacity is the lowest, only 0.1430 mg/g. As the ceramsite dosage increases, the ammonia–nitrogen removal rate generally shows an upward trend. When the ceramsite dosage is 2.1 g/L, the removal rate is only 47.47%. When the ceramsite dosage is 9.6 g/L, the removal rate reaches the highest level, which is 68.66%.
When the dosage is 2.1 g/L, the adsorption capacity reaches its maximum, but the overall removal effect of ceramsite on ammonia–nitrogen is poor. When the dosage is 9.6 g/L, the removal effect is the best, but the adsorption capacity is extremely low. When the ceramsite dosage is 6.3 g/L, the removal rate is 62.07% and the adsorption capacity is 0.1970 mg/g. At this time, the removal rate is not much different from the highest removal rate when the dosage is 9.6 g/L, and the adsorption capacity is significantly higher. Therefore, considering both the removal effect and economy, a ceramsite dosage of 6.3 g/L is selected.
3.3. Influence of pH on Adsorption Effect
As shown in
Figure 6, with the increase in the pH value, the adsorption capacity and removal rate of ammonia–nitrogen by ceramsite generally show a trend of first rising, then rapidly falling, then rising again, and finally falling. When the pH is 3, the adsorption effect of ceramsite on ammonia–nitrogen is poor, with the adsorption capacity being only 0.0653 mg/g and the removal rate being only 39.505%. When the pH increases from 3 to 5, the adsorption effect of ceramsite on ammonia–nitrogen gradually strengthens. The adsorption capacity rises to 0.3903 mg/g, and the removal rate rises to 79.60%. Then, it decreases. When the pH is 8, it reaches the lowest point, with the adsorption capacity dropping to 0.2814 mg/g and the removal rate dropping to 73.78%. After the pH is greater than 8, it continues to rise and reaches the highest point at pH 10. The adsorption capacity rises to 0.4429 mg/g, and the removal rate rises to 81.58%.
The main reason for this phenomenon is that the change in pH value can alter the concentrations of H⁺ and OH− in the water and the existing forms of ammonia–nitrogen, thus affecting the removal effect of ceramsite on ammonia–nitrogen.
3.4. Adsorption Kinetics Analysis
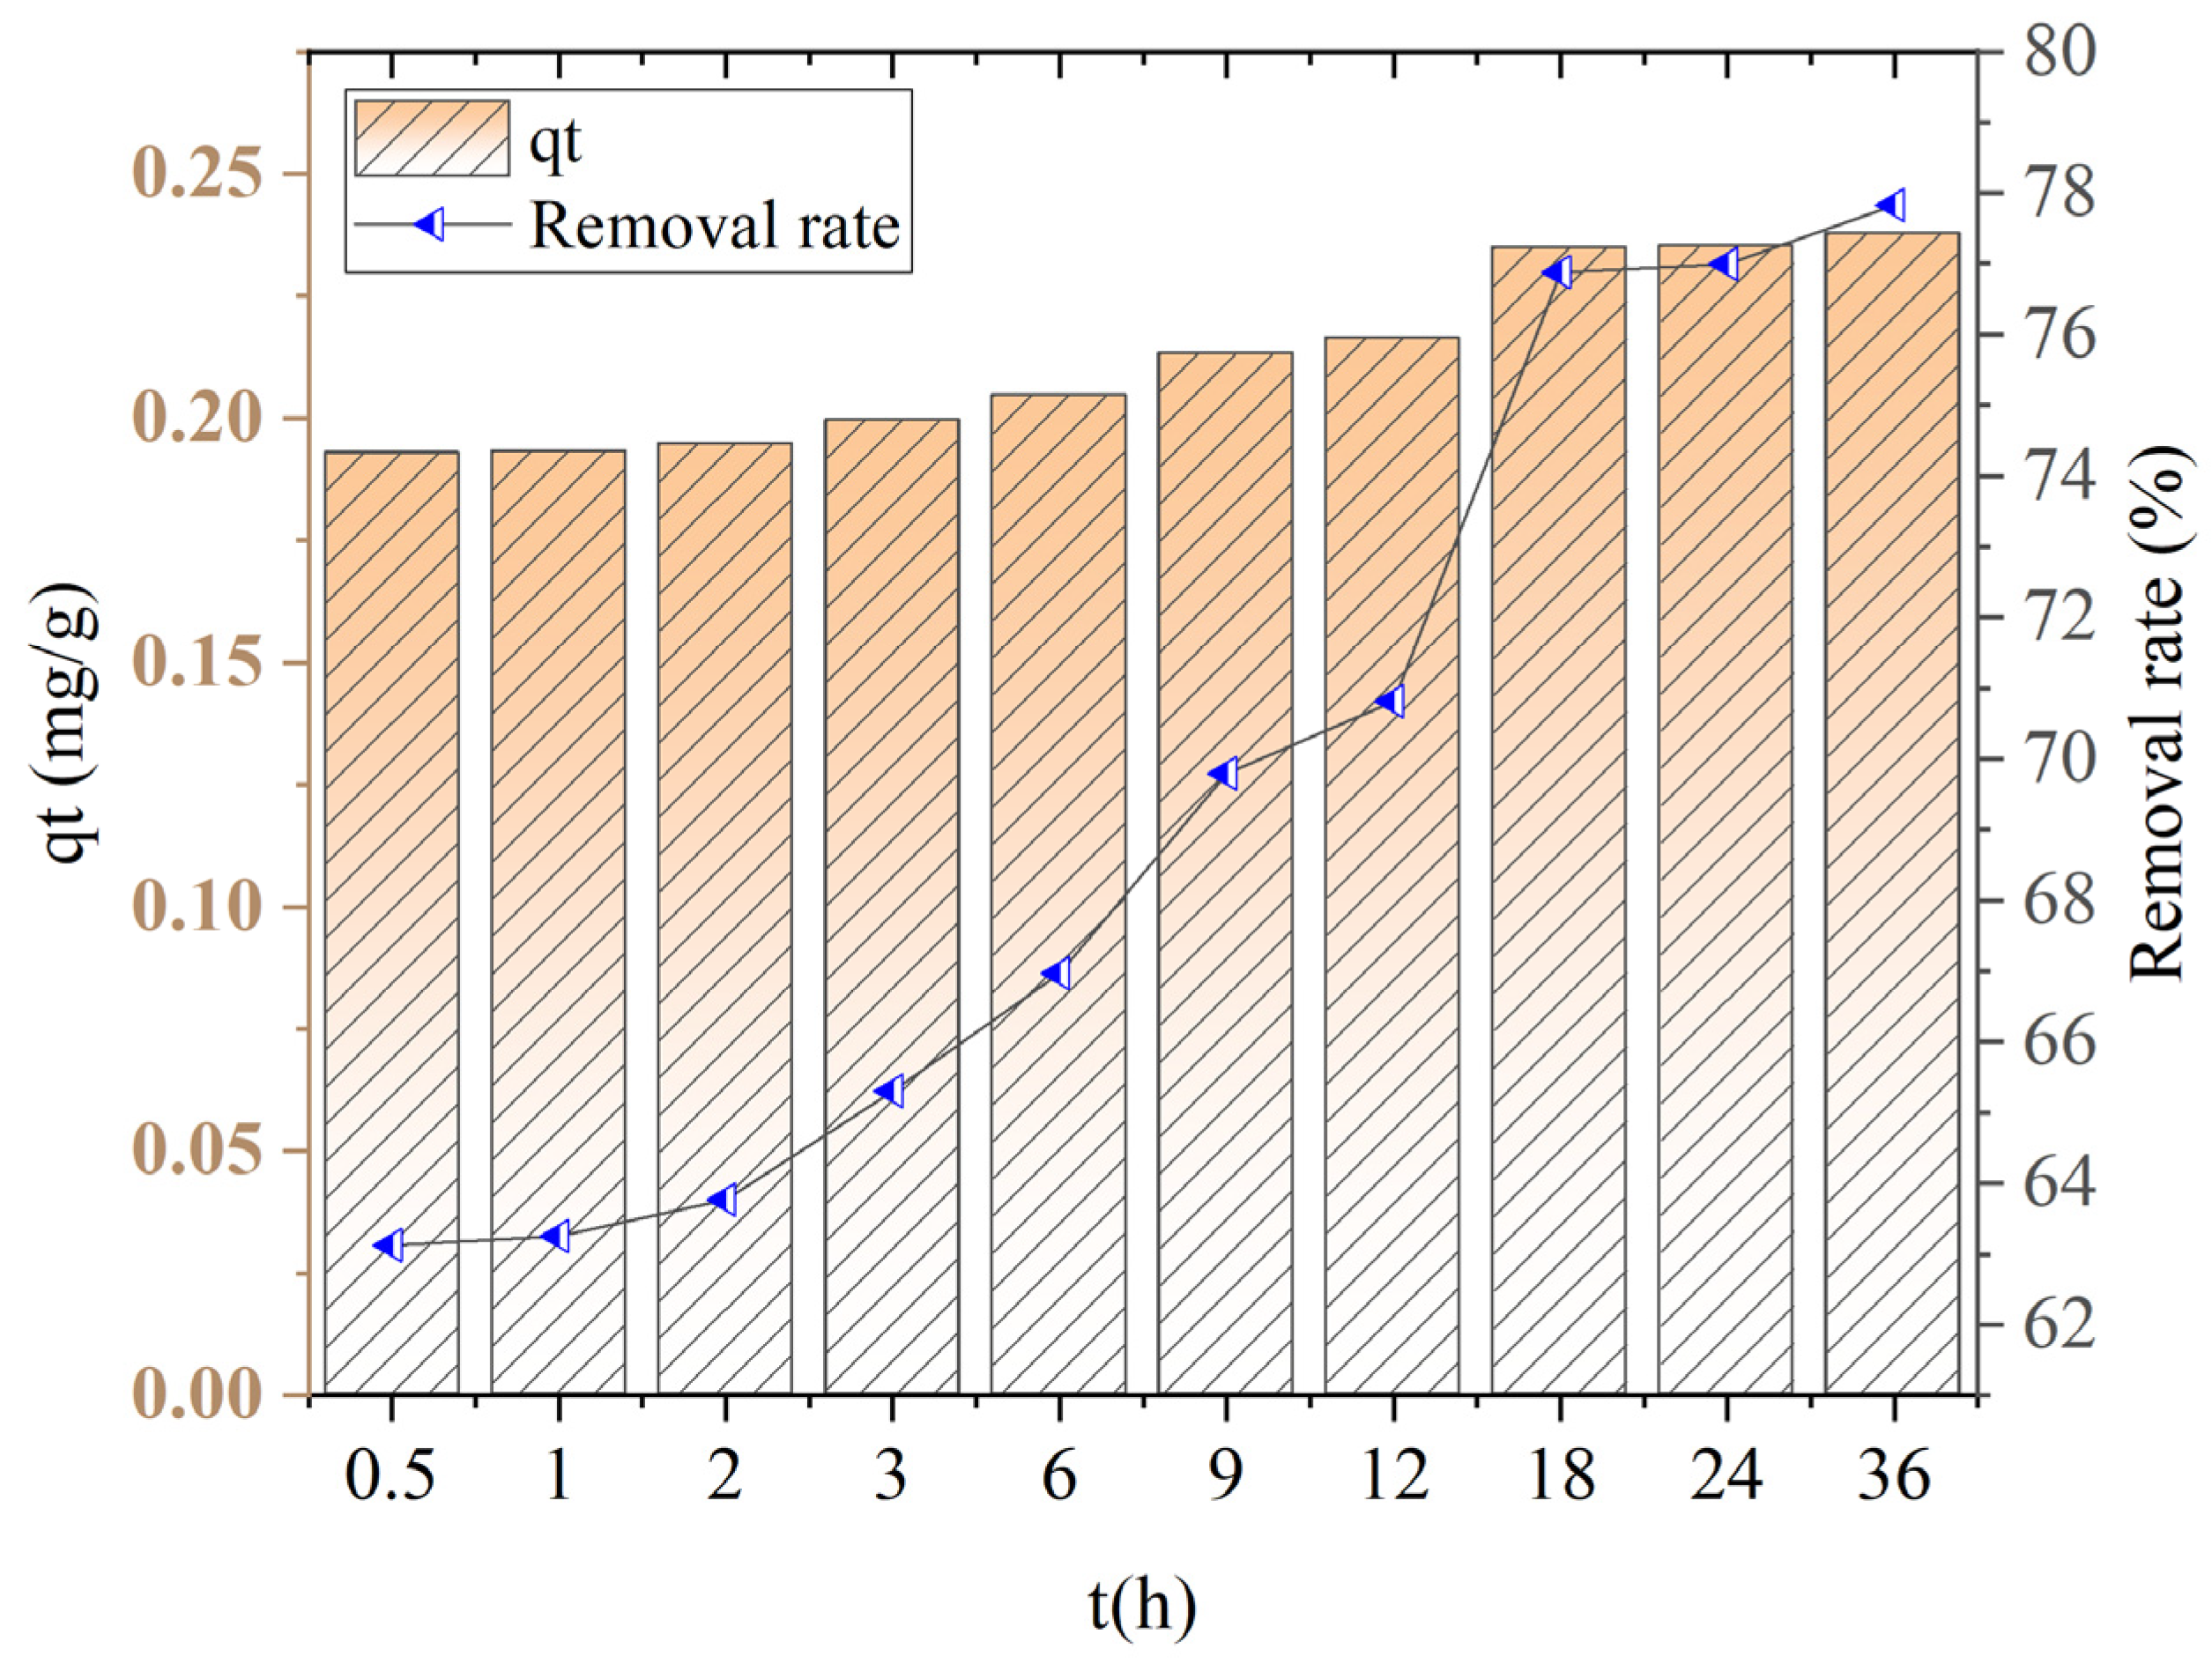
The adsorption kinetics curve of ceramite is shown in
Figure 7.
Within the first 18 h, the adsorption capacity of ceramsite for ammonia–nitrogen shows a significant increasing trend, rising from 0.1929 mg/g to 0.2349 mg/g. From 18 h to 36 h, there is almost no obvious change in the adsorption capacity, indicating that the adsorption reaction has reached an equilibrium state.
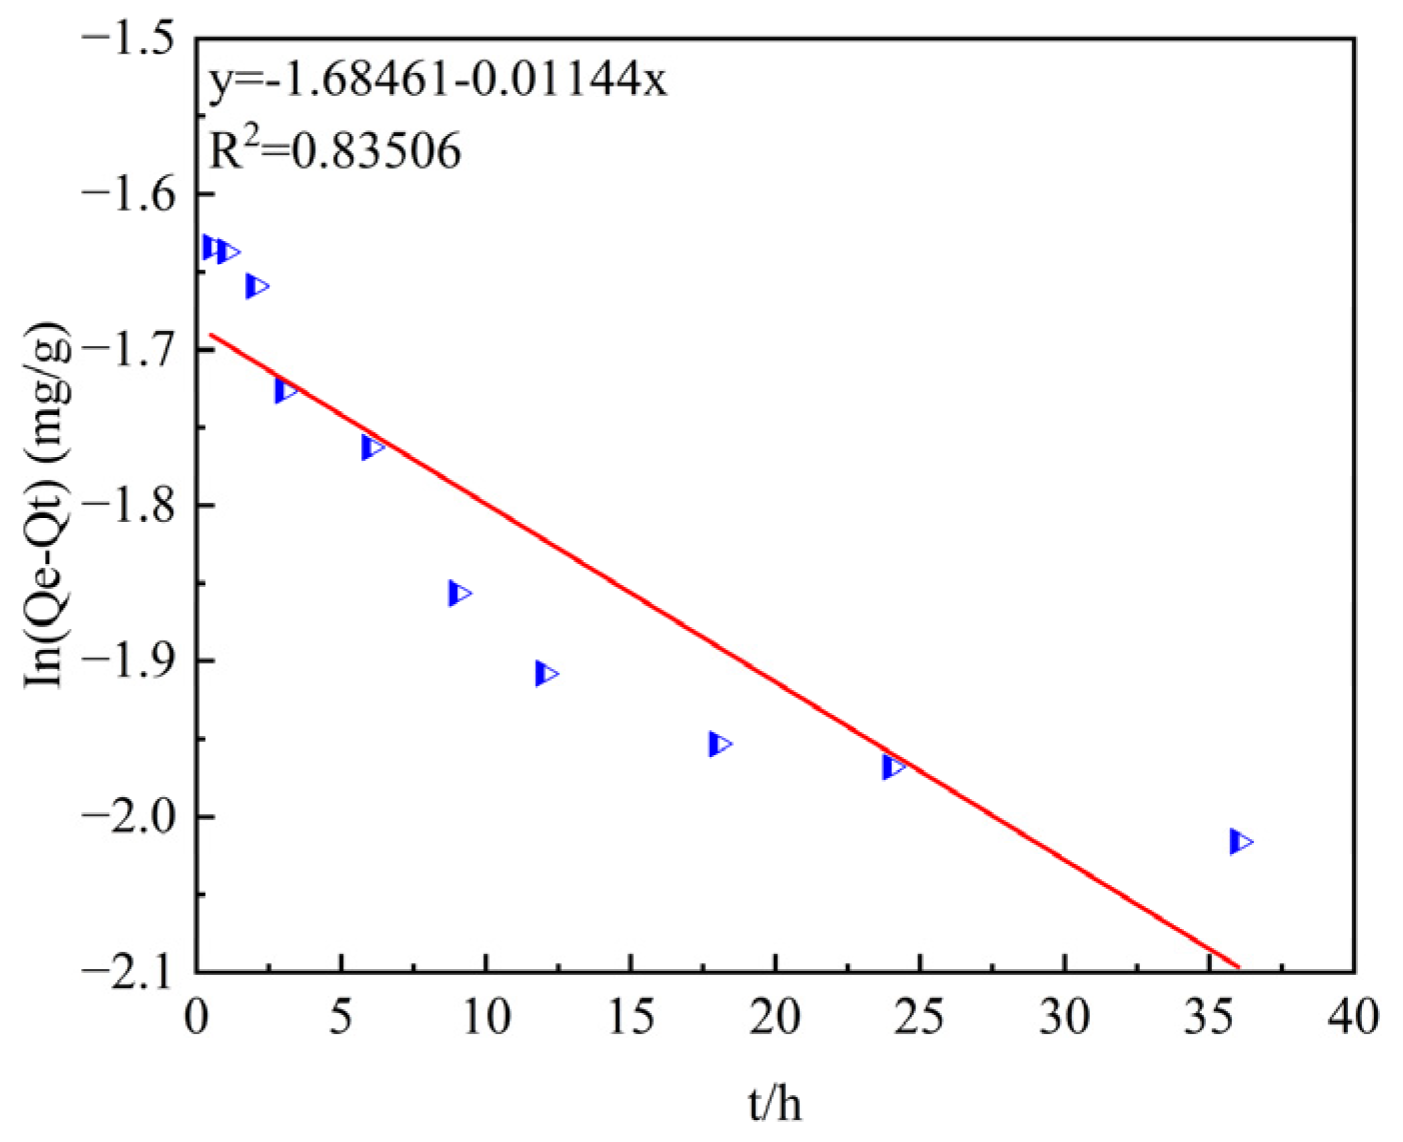
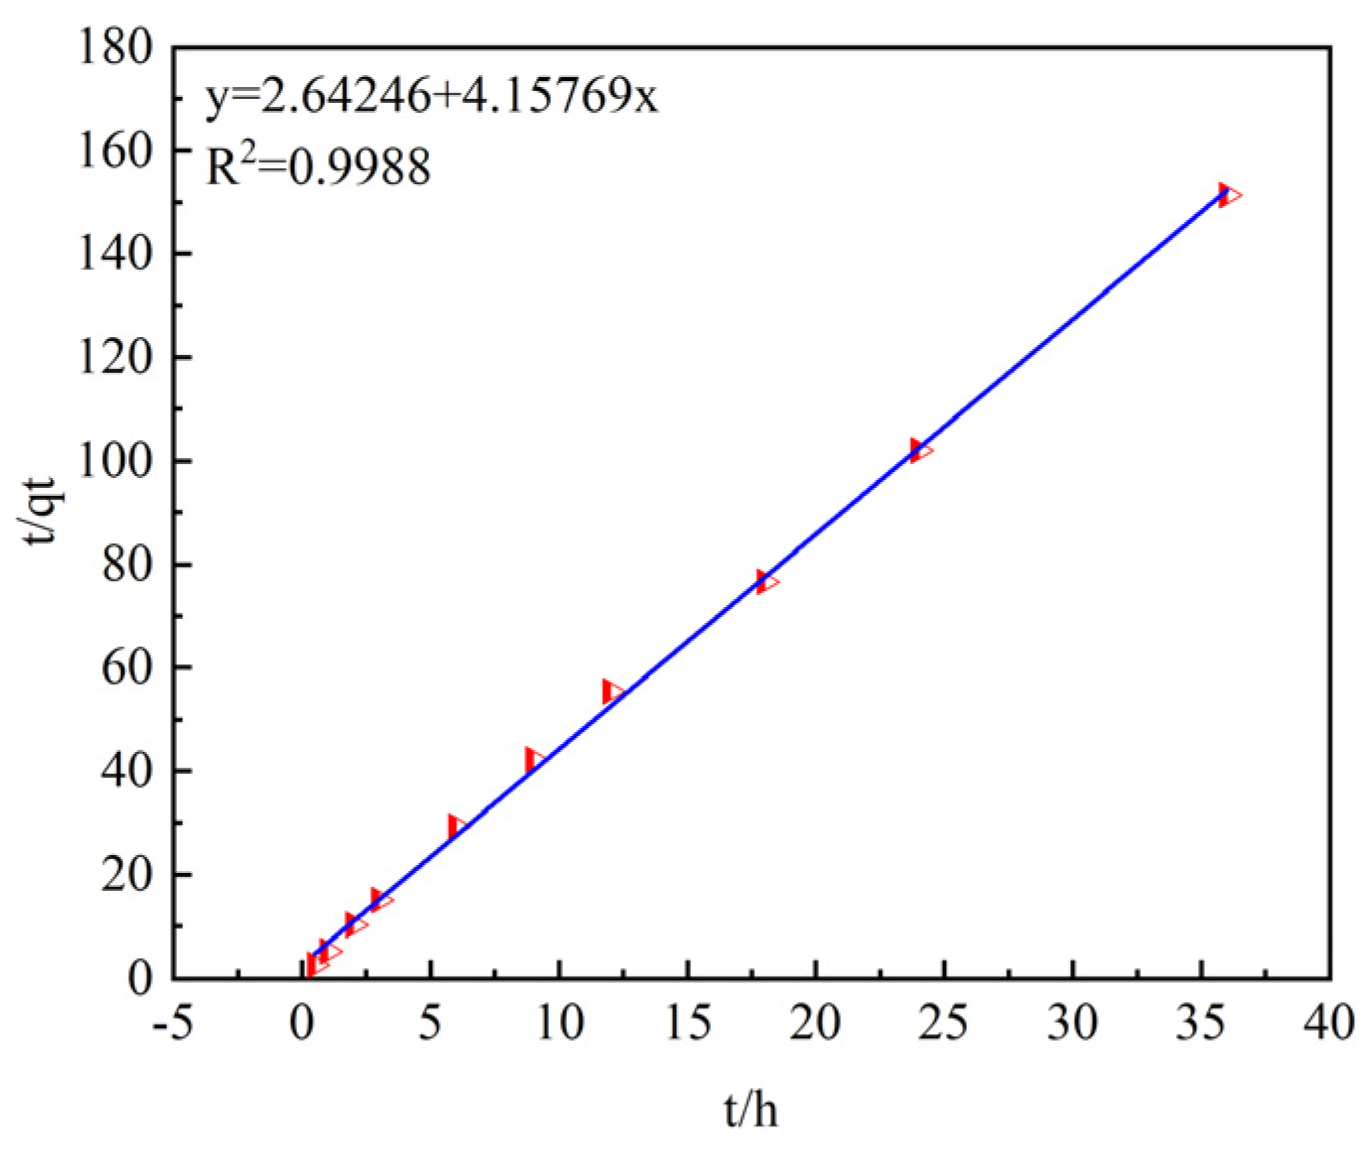
The quasi-first- and quasi-second-order kinetic models are shown in
Figure 8 and
Figure 9.
The data of the adsorption process were fitted using the pseudo-first-order and pseudo-second-order kinetic models, as shown in
Table 2.
The coefficients of determination, R2, after fitting with the pseudo-first-order and pseudo- second-order kinetic models are 0.83506 and 0.9988, respectively, indicating that the pseudo-second-order kinetic model has a higher goodness of fit.
In addition, by comparing the theoretical adsorption capacities qe of the pseudo-first-order and pseudo-second-order kinetic models (0.1855 mg/g and 0.2405 mg/g) with the experimentally measured equilibrium adsorption capacity qe (0.2378 mg/g), it is found that the theoretical adsorption capacity of the pseudo-second-order kinetic model is closer to the measured result.
Therefore, the pseudo-second-order kinetic model is more suitable for describing the adsorption process of ammonia–nitrogen by ceramsite, and the reaction process is mainly controlled by chemical adsorption.
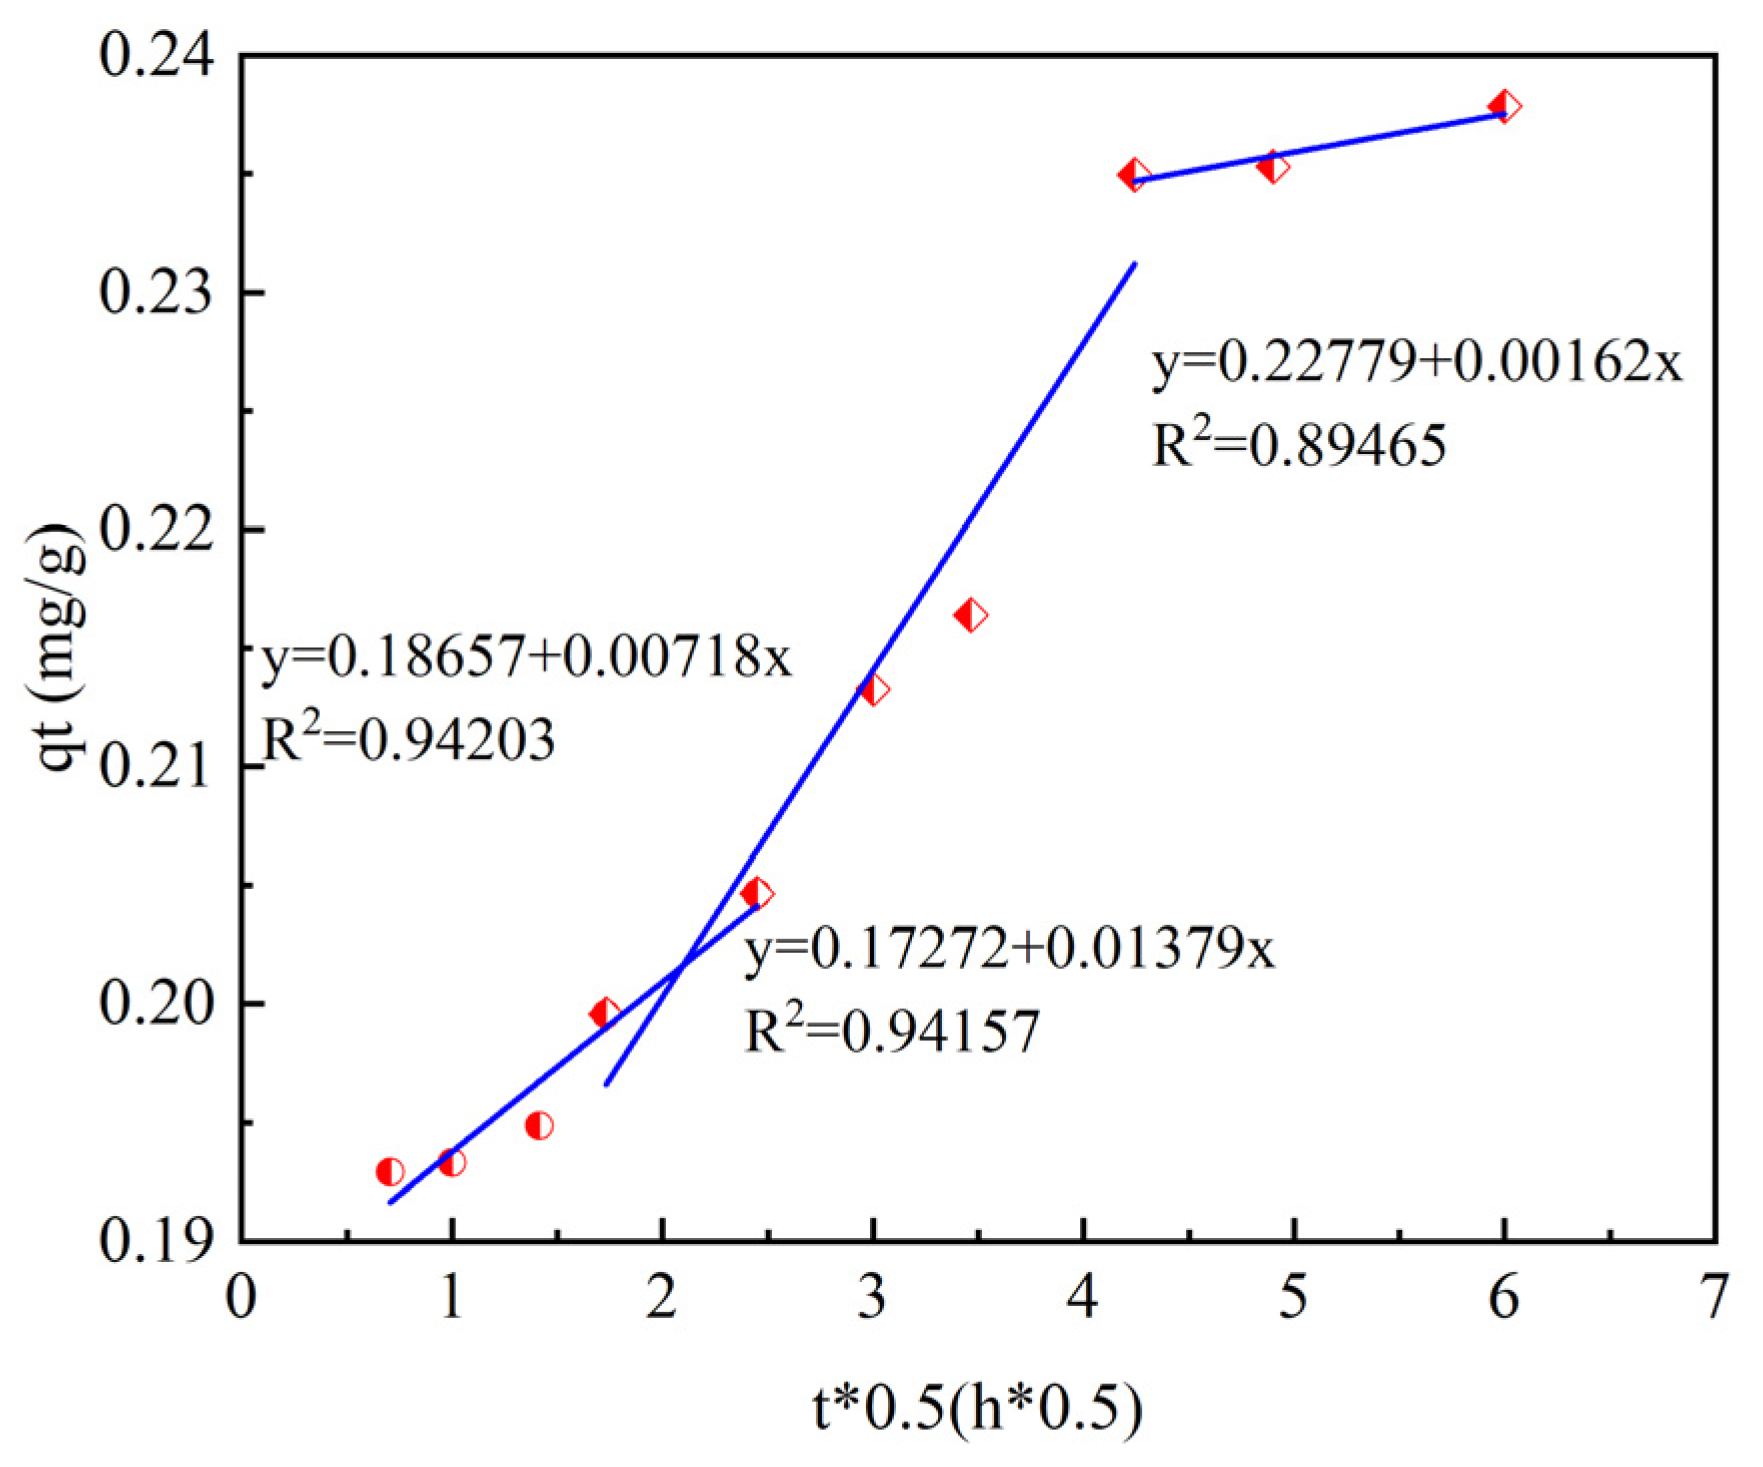
The intra-particle diffusion model for ammonia–nitrogen adsorption is shown in
Figure 10.
In this study, the intraparticle diffusion model was used to fit the experimental data, and the specific data are shown in
Table 3. According to the fitting results of the intraparticle diffusion model, the process of ammonia–nitrogen adsorption by ceramsite can be divided into three stages.
The first stage is the rapid diffusion in the liquid phase. Ammonia–nitrogen rapidly diffuses from the solution to the outer surface of the ceramsite. The mass-transfer resistance in this process is relatively small, so the adsorption capacity increases significantly. The second stage is the intraparticle diffusion, where ammonia–nitrogen slowly diffuses from the outer surface of the ceramsite into the internal pores. The third stage is the dynamic adsorption equilibrium stage. At this time, the adsorption of ammonia–nitrogen by ceramsite is approaching saturation, and there is no obvious change in the adsorption capacity over time.
From the fitting parameters, it can be seen that the coefficients of determination of the first and second stages are relatively high at R2 = 0.9415 and R2 = 0.9420, indicating that the reaction process is mainly controlled by liquid-phase diffusion and intraparticle diffusion. The fitting lines of the three stages do not pass through the origin, which means that the reaction process is also controlled by other mechanisms.
3.5. Isothermal Adsorption Experiment
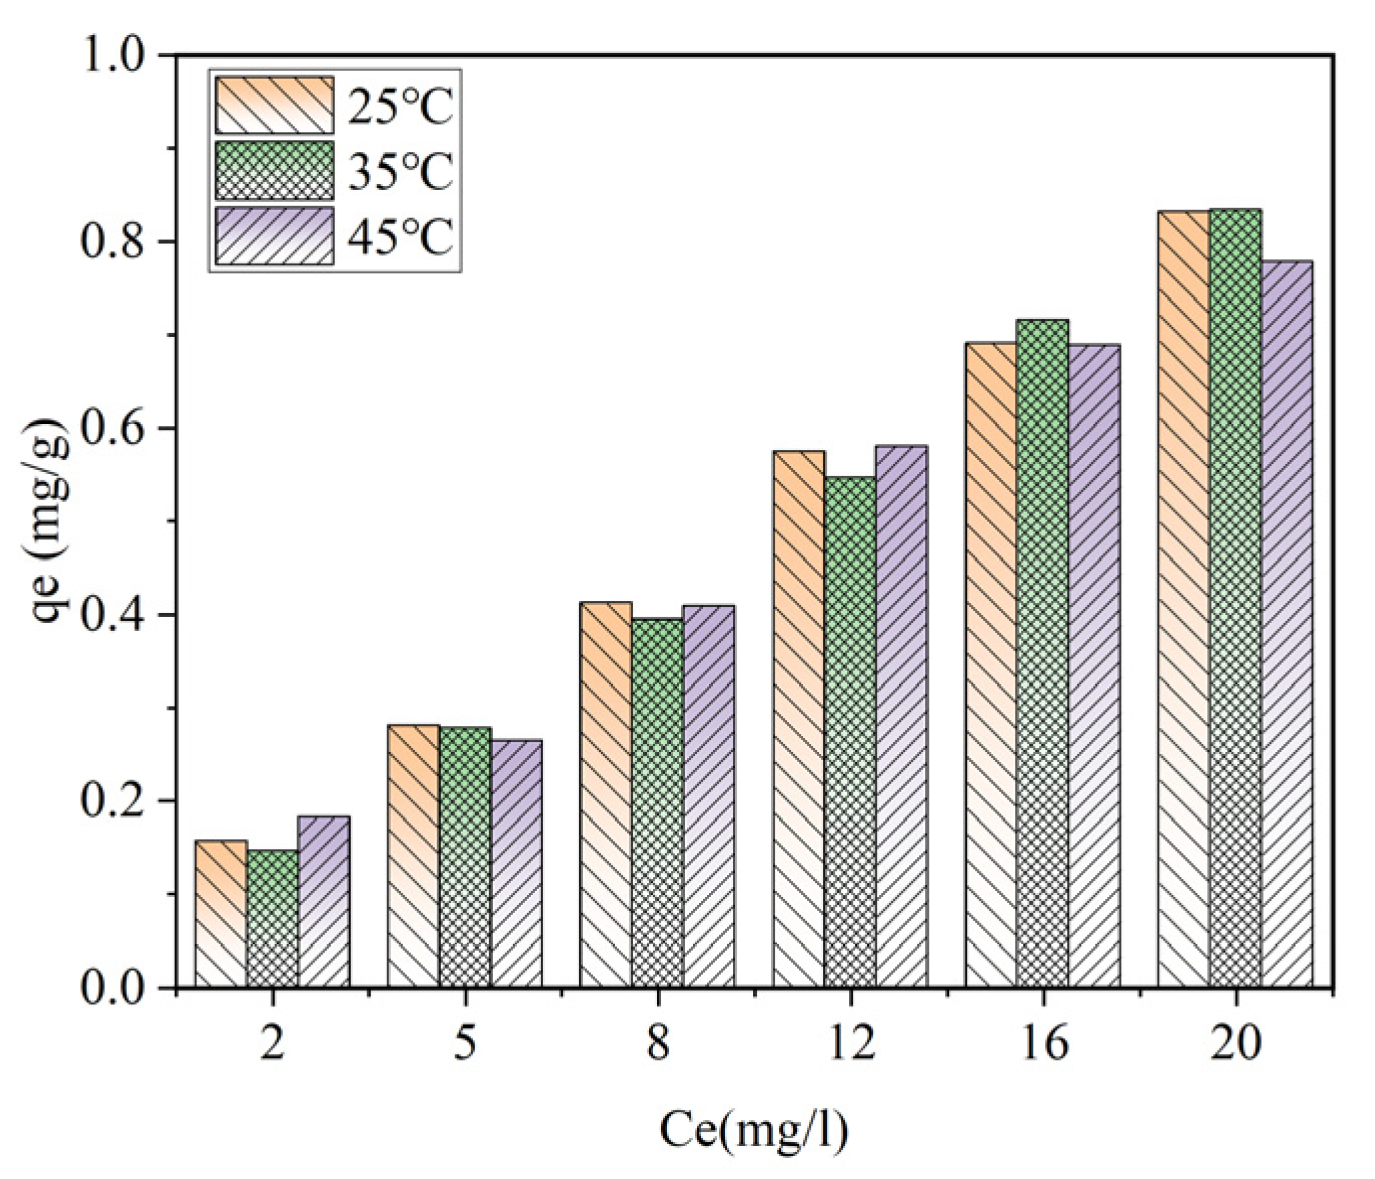
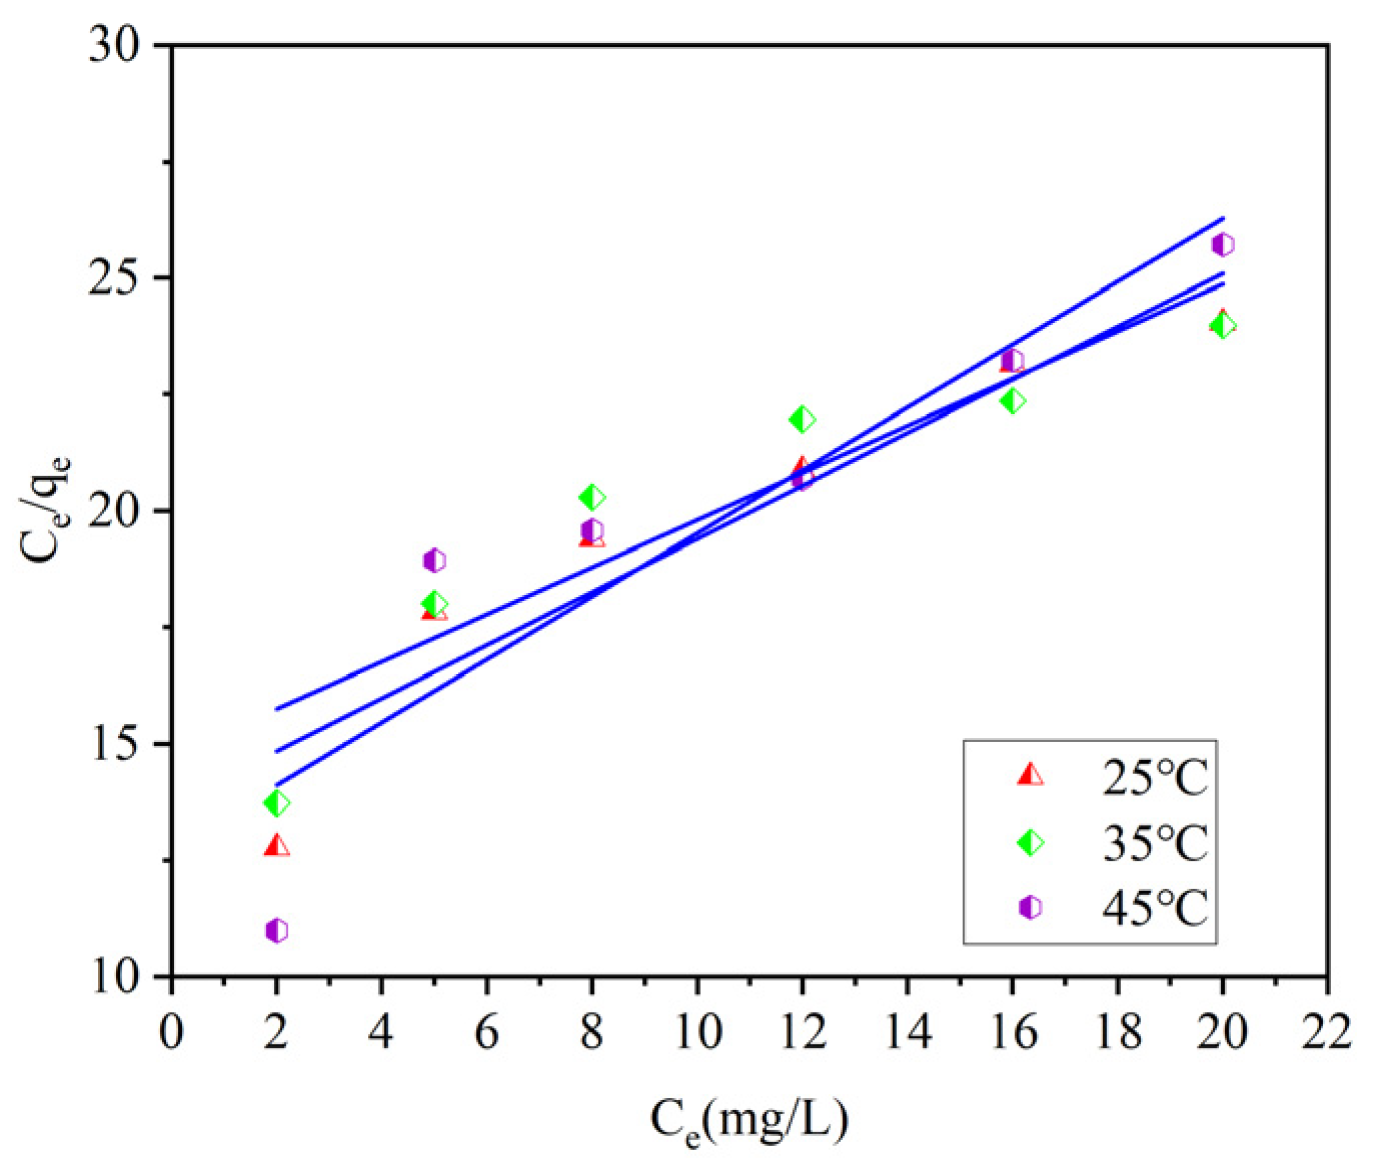
The isothermal adsorption curve and Langmuir fitting line for ammonia–nitrogen of ceramics are shown in
Figure 11 and
Figure 12.
As shown in
Figure 11,when the ceramsite dosage is 10 g/L, the adsorption capacity of ceramsite for ammonia–nitrogen shows an upward trend with the increase in the equilibrium concentration at temperatures of 25 °C, 35 °C, and 45 °C, respectively. Under the condition of a certain equilibrium ammonia–nitrogen concentration, the adsorption capacity gradually increases with the rise in temperature. As shown in
Figure 12, when the ceramsite dosage is fixed, appropriately increasing the initial ammonia–nitrogen concentration and reaction temperature is beneficial to increasing the adsorption capacity of ceramsite for ammonia–nitrogen.
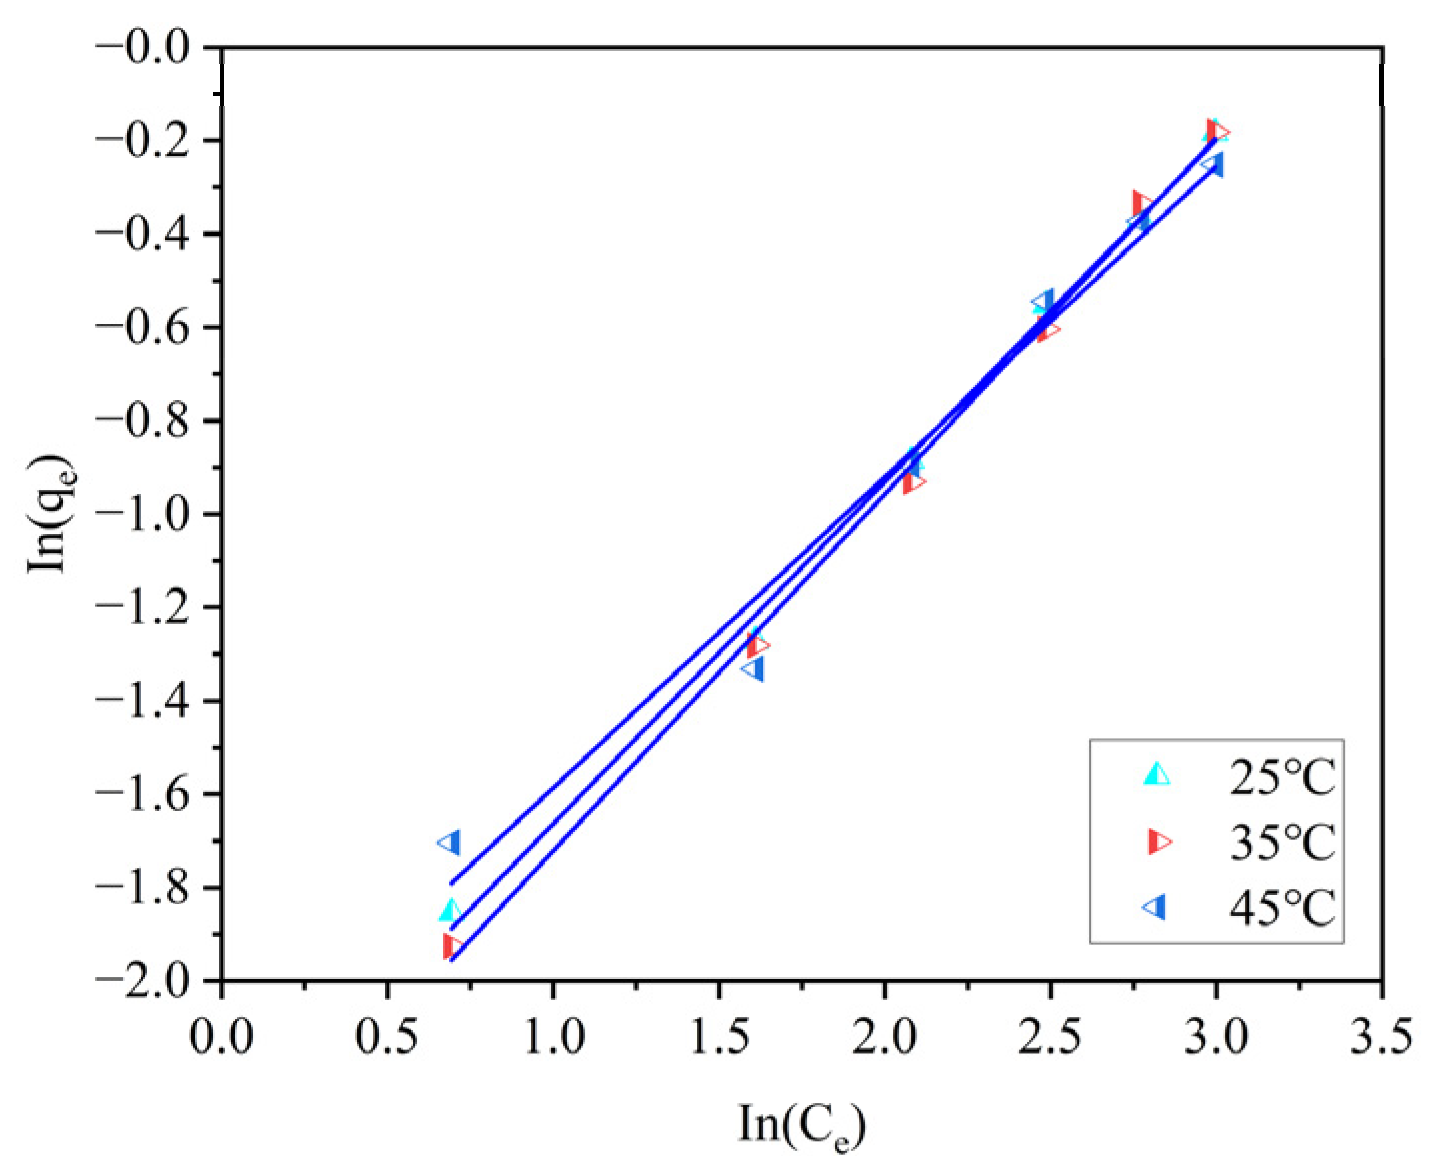
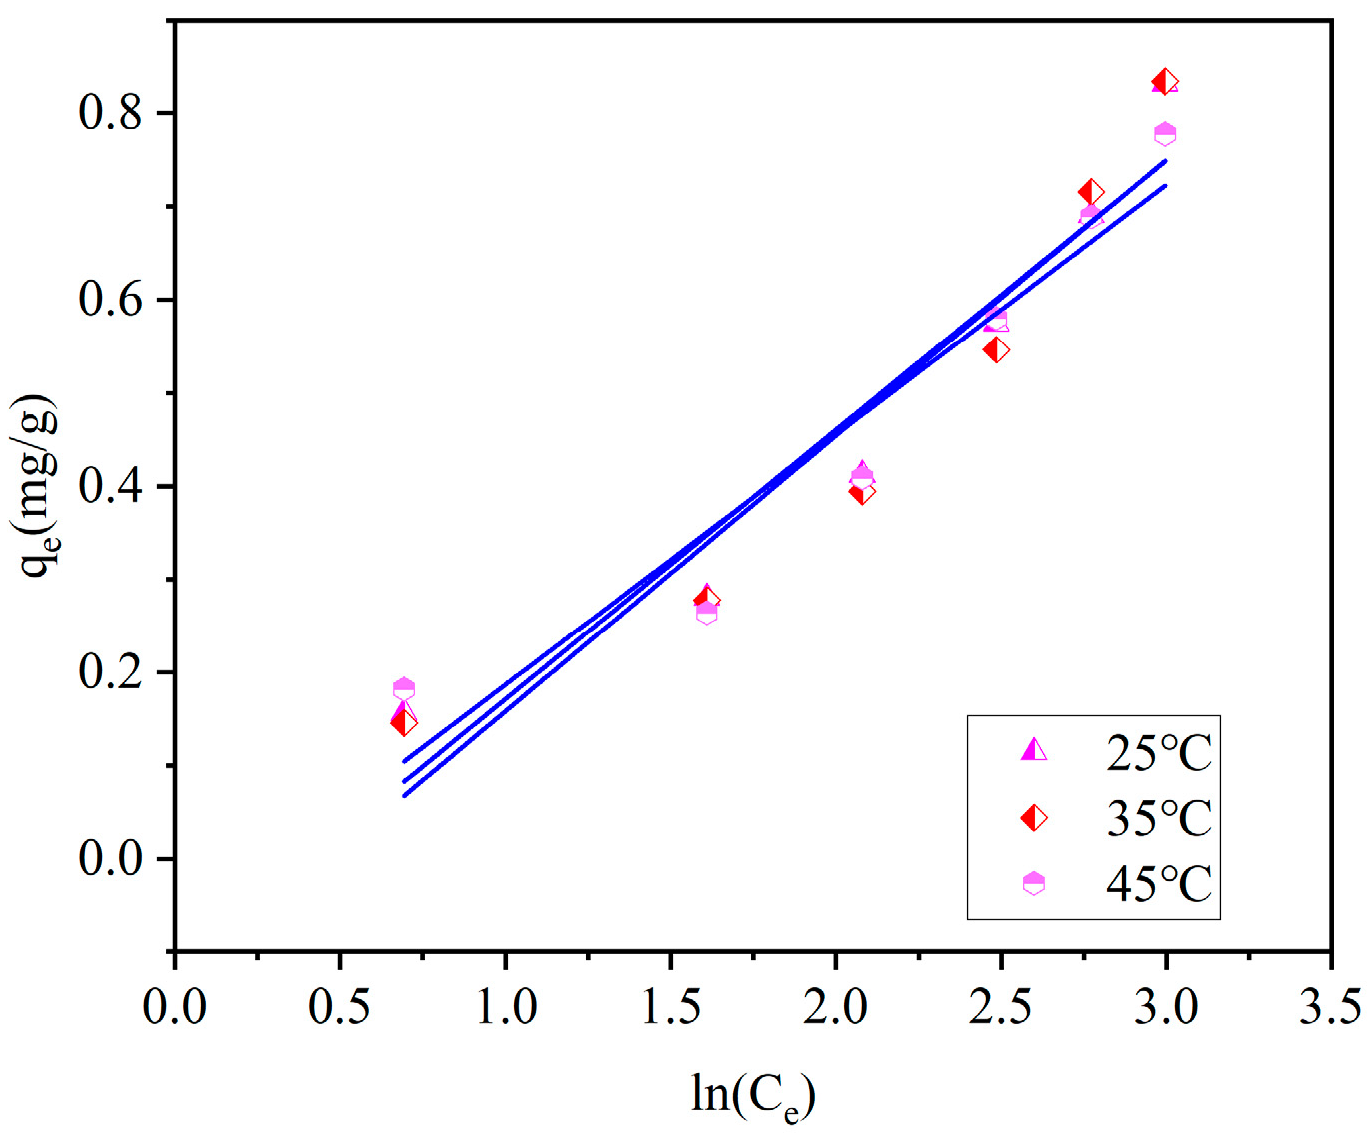
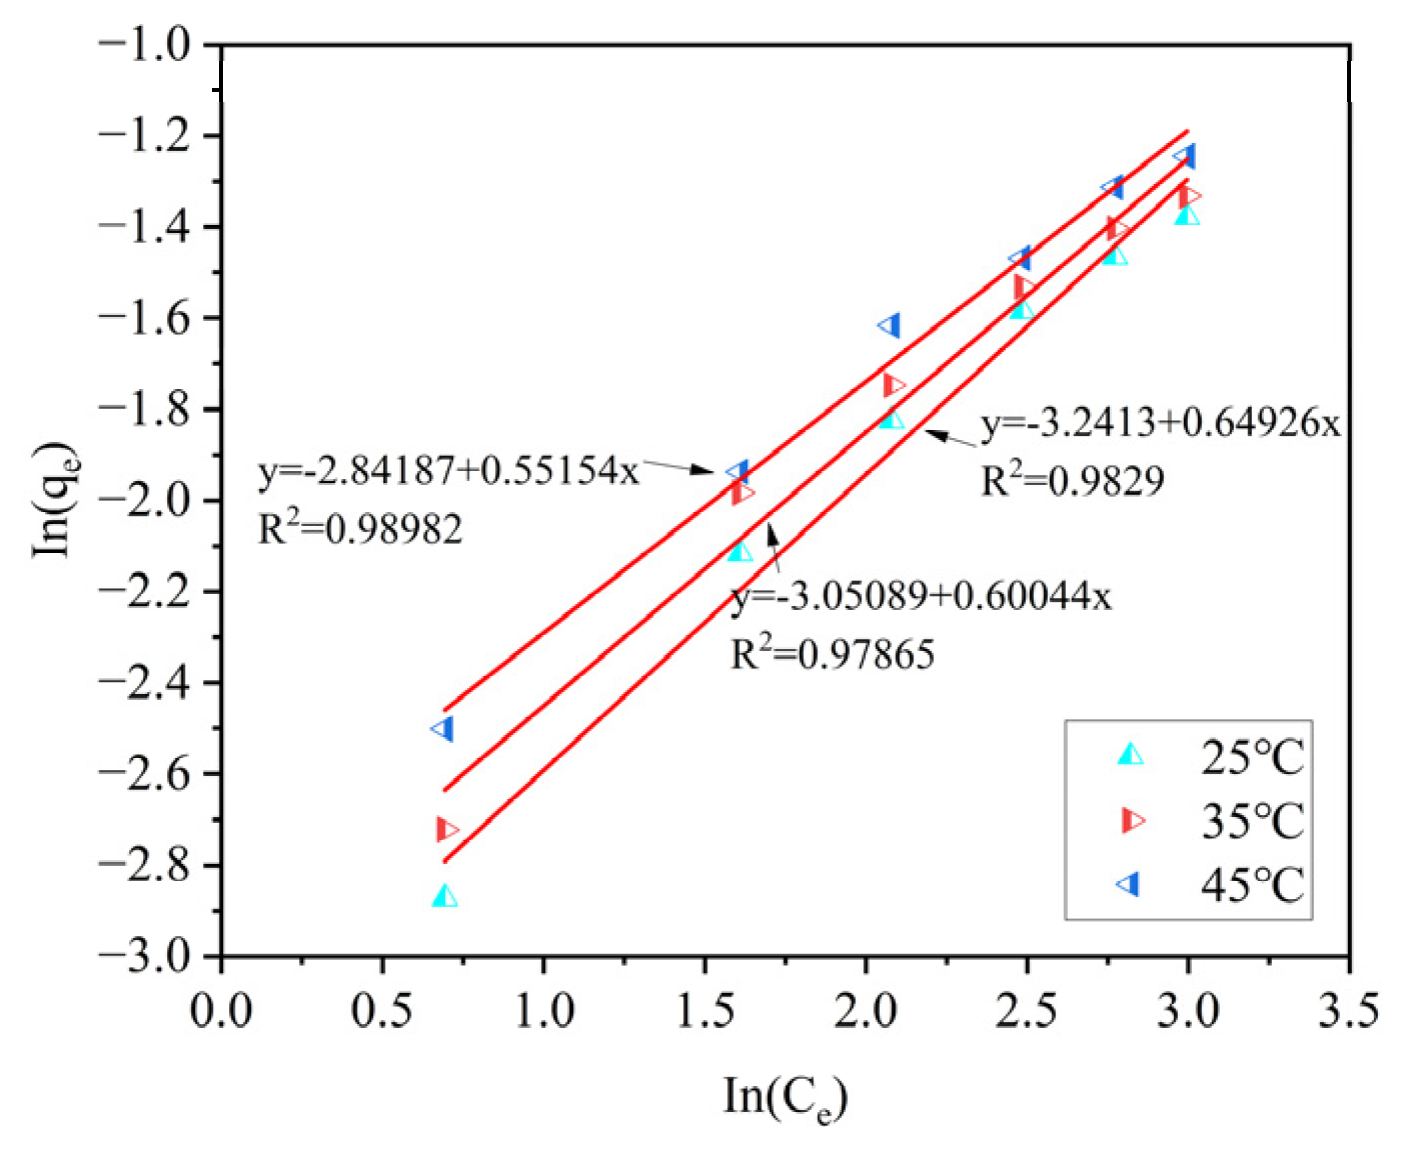
The Freundlich and Tempkin fitting lines of the ceramics for ammonia–nitrogen are shown in
Figure 13 and
Figure 14.
Three isothermal adsorption models were used to fit the data. By comparing the coefficients of determination R
2, it can be known that the Langmuir model and the Tempkin model can effectively describe the adsorption process of ammonia–nitrogen by ceramsite. Among them, compared with the other two models, the Langmuir model has the highest coefficients of determination, R
2, after fitting under different temperature conditions (R
2 = 0.9973–0.9786). This indicates that the adsorption process of ammonia–nitrogen by ceramsite is a uniform monolayer surface adsorption. The specific fitting parameters of the isothermal adsorption models are shown in
Table 4.
4. Adsorption Performance of Ceramite on Wastewater Containing Phosphorus
4.1. Influence of Dosage of Ceramisite on Adsorption Effect
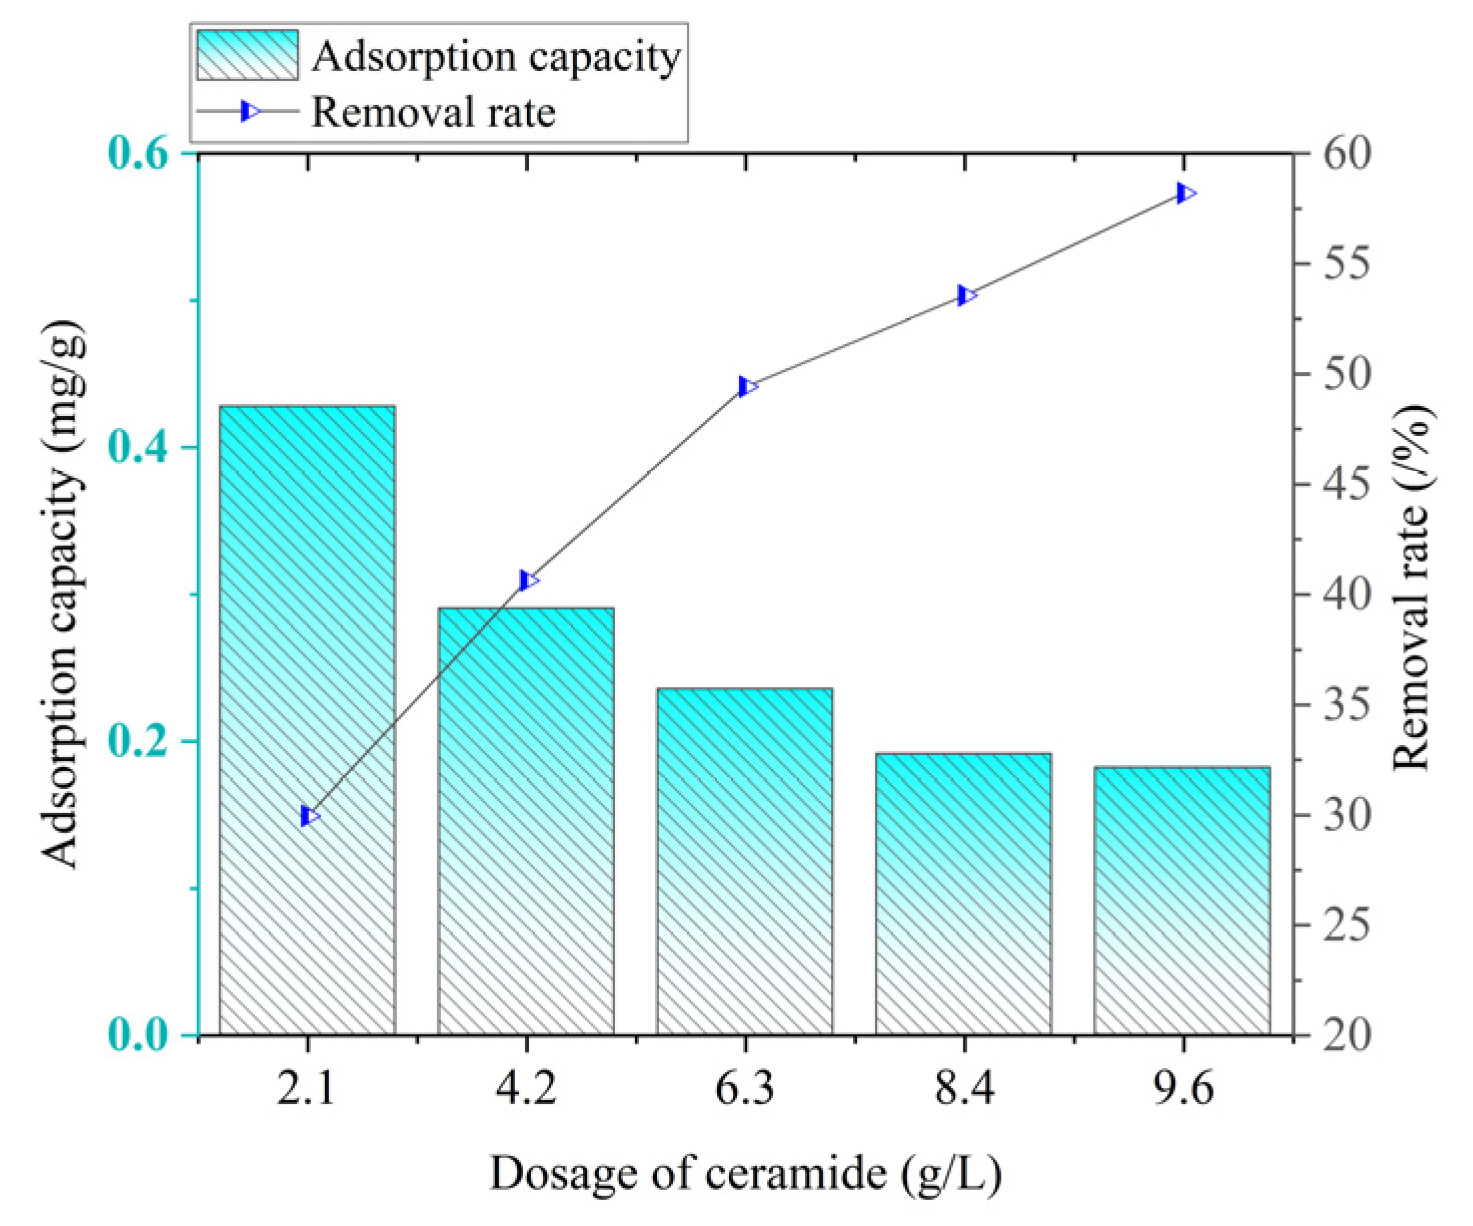
As can be seen from
Figure 15, the phosphorus adsorption capacity shows a downward trend with the increase in the ceramsite dosage. When the ceramsite dosage is 2.1 g/L, the adsorption capacity reaches the maximum value of 0.4280 mg/g. When the dosage is 9.6 g/L, the adsorption capacity is the lowest, only 0.1819 mg/g.
With the increase in the ceramsite dosage, the phosphorus removal rate generally shows an upward trend. When the ceramsite dosage is 2.1 g/L, the removal rate is only 29.9606%. When the dosage is 9.6 g/L, the removal rate reaches the highest value of 58.2170%.
In the process of phosphorus treatment, the dosage of ceramsite has a significant impact on its adsorption capacity and removal efficiency. When the dosage of ceramsite is 2.1 g/L, the adsorption capacity reaches the maximum, but its overall removal effect on phosphorus is not satisfactory. When the dosage is increased to 9.6 g/L, the best removal effect can be achieved, but the adsorption capacity is extremely low at this time. When the ceramsite dosage is 6.3 g/L, the removal rate reaches 49.43%, and the adsorption capacity is 0.2353 mg/g. It is worth noting that this removal rate is not significantly different from the highest removal rate when the dosage is 9.6 g/L, and at the same time, the adsorption capacity is significantly improved. Based on the above results, considering both the removal effect and economic benefits comprehensively, it is more appropriate to choose a ceramsite dosage of 6.3 g/L.
4.2. Influence of pH on Adsorption Effect
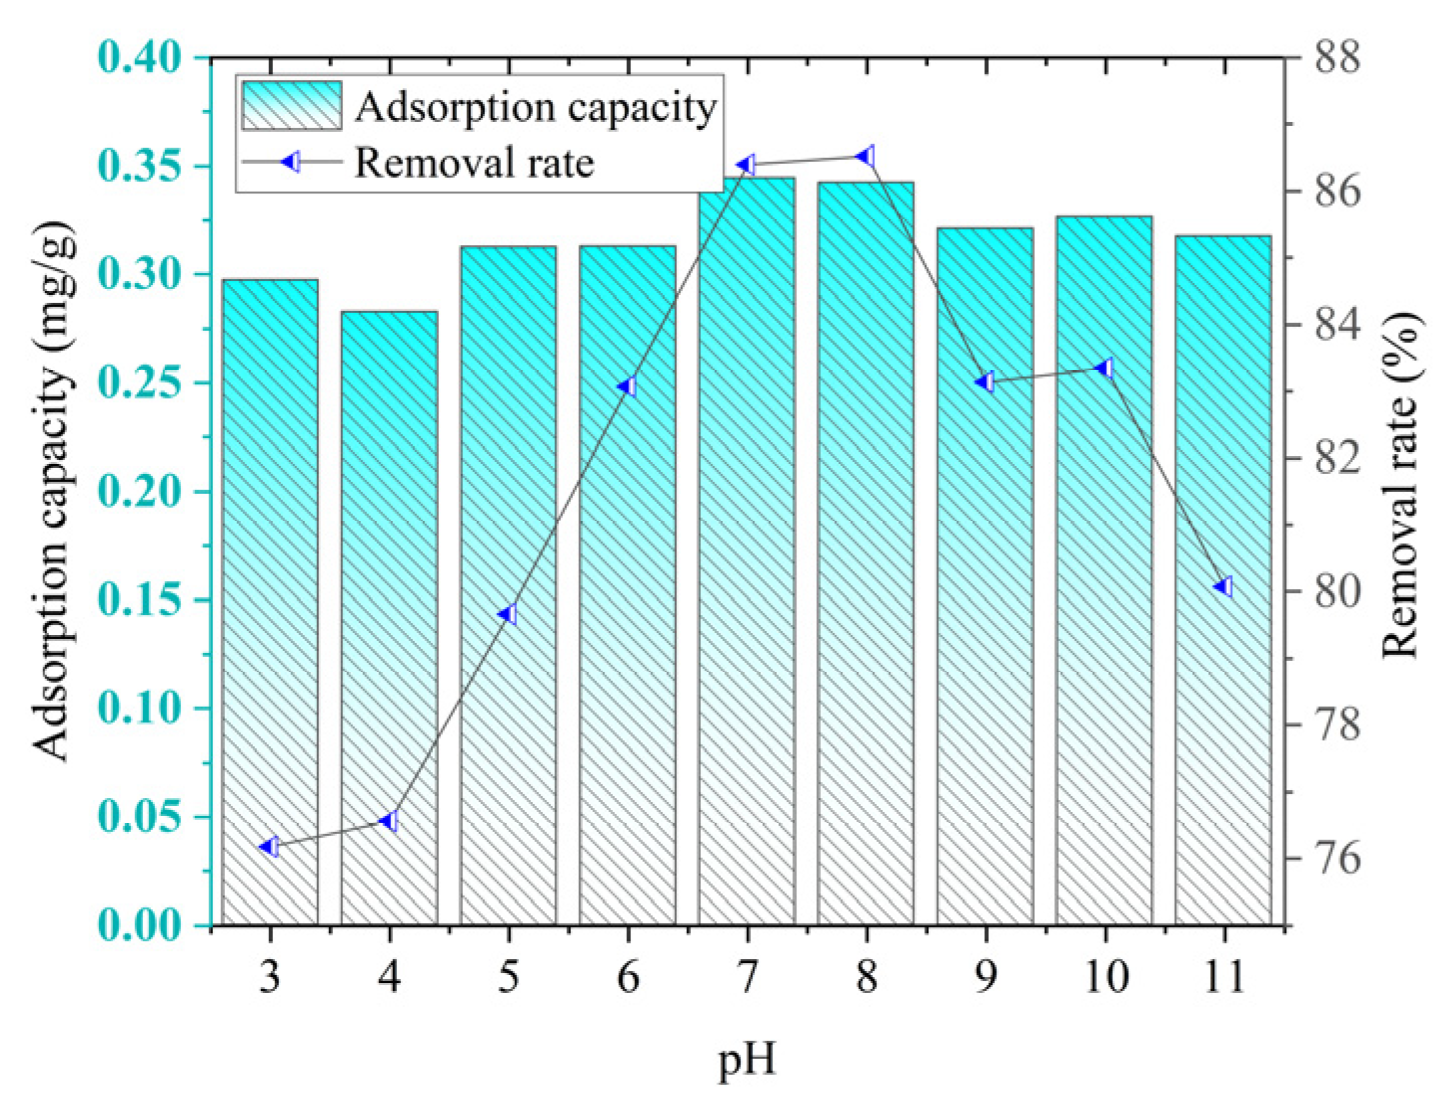
As can be seen from
Figure 16, with the increase in the pH value, the adsorption capacity and removal rate of phosphorus by ceramsite generally show a trend of first increasing and then rapidly decreasing. When the pH increases from 3 to 7, the adsorption effect of ceramsite on phosphorus gradually strengthens. The adsorption capacity increases from 0.2973 mg/g to 0.3446 mg/g, and the removal rate rises from 76.17% to 86.40%. When the pH increases from 7 to 11, the adsorption effect gradually weakens. The adsorption capacity decreases from 0.3446 mg/g to 0.3177 mg/g, and the removal rate drops from 86.40% to 80.06%.
Under acidic conditions, there may be more other cations (such as H⁺) in the solution. These cations will compete with phosphate ions for the adsorption sites on the surface of the ceramsite, thus improving the adsorption effect. As the pH value increases, phosphorus mainly exists in the form of PO43−, which may form insoluble phosphate precipitates with other cations (such as Ca2⁺, Mg2⁺, etc.) in the solution, leading to a decrease in the adsorption capacity and removal rate of phosphorus by ceramsite.
4.3. Adsorption Kinetics Analysis
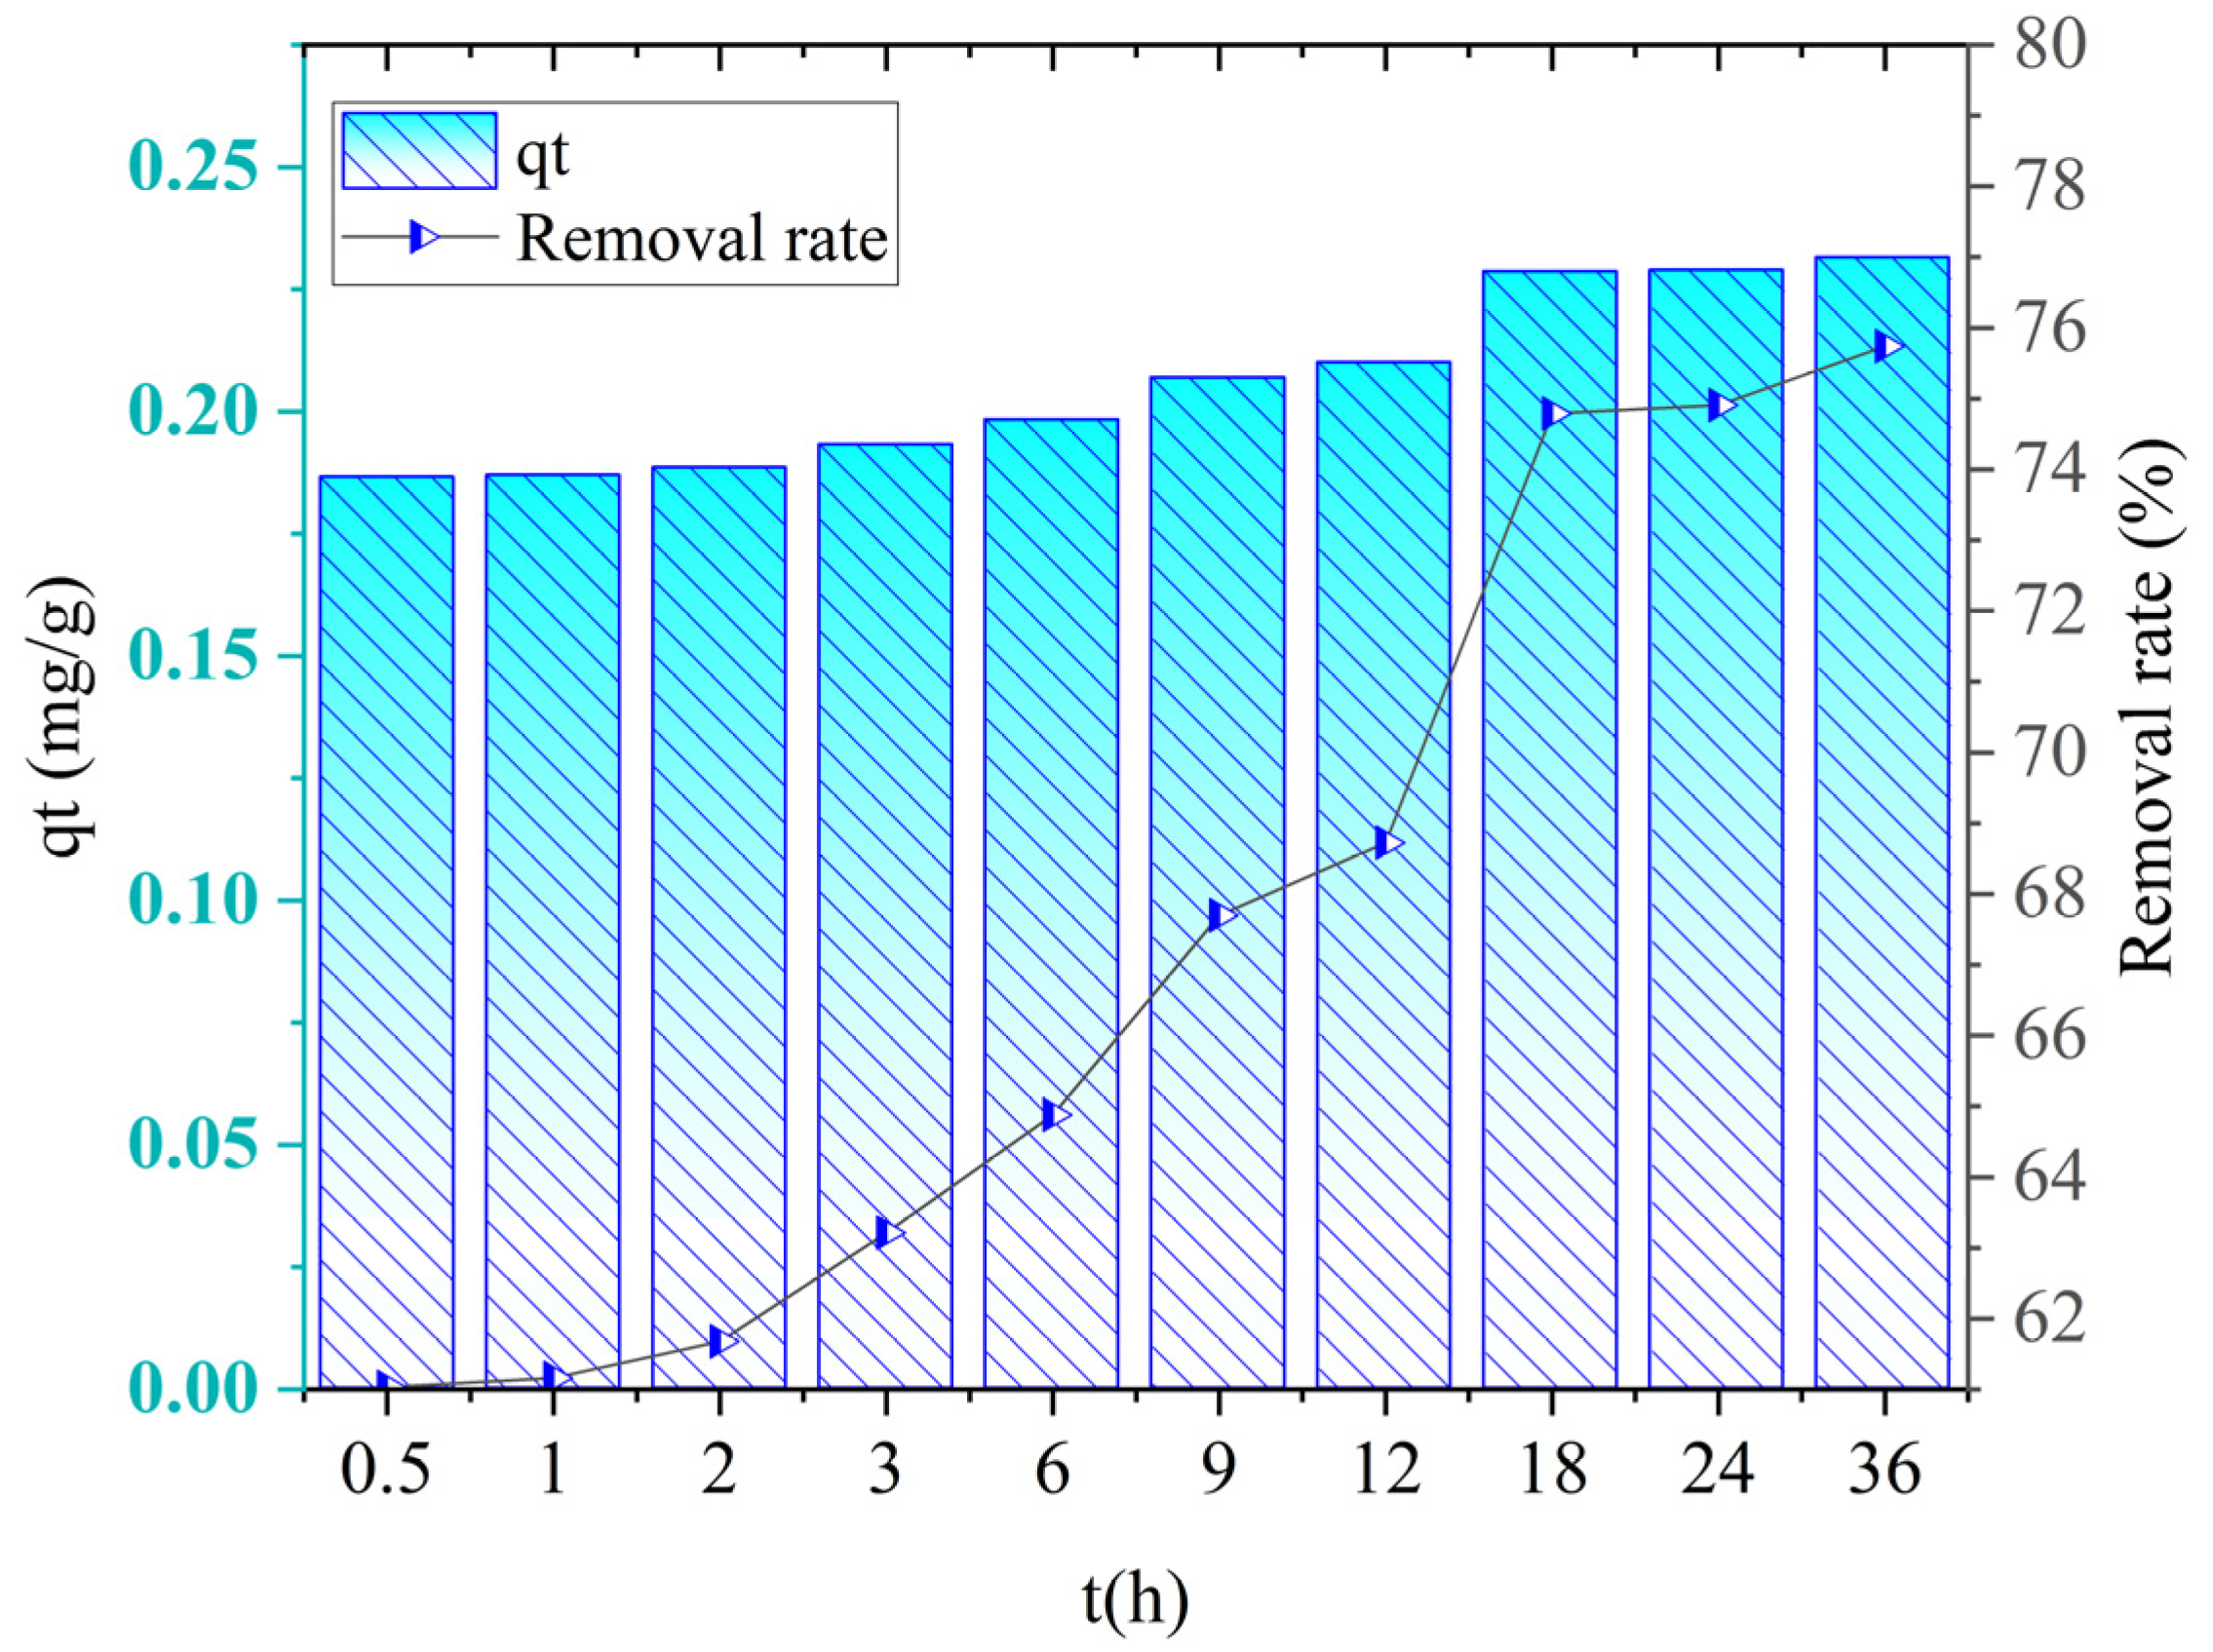
The adsorption kinetics curve of ceramite is shown in
Figure 17.
In the first 18 h, the phosphorus adsorption capacity of ceramide increased significantly, and the adsorption capacity increased from 0.1865 mg/g to 0.2100 mg/g. From 18 h to 36 h, the adsorption capacity was almost unchanged, and the adsorption reaction reached an equilibrium state.
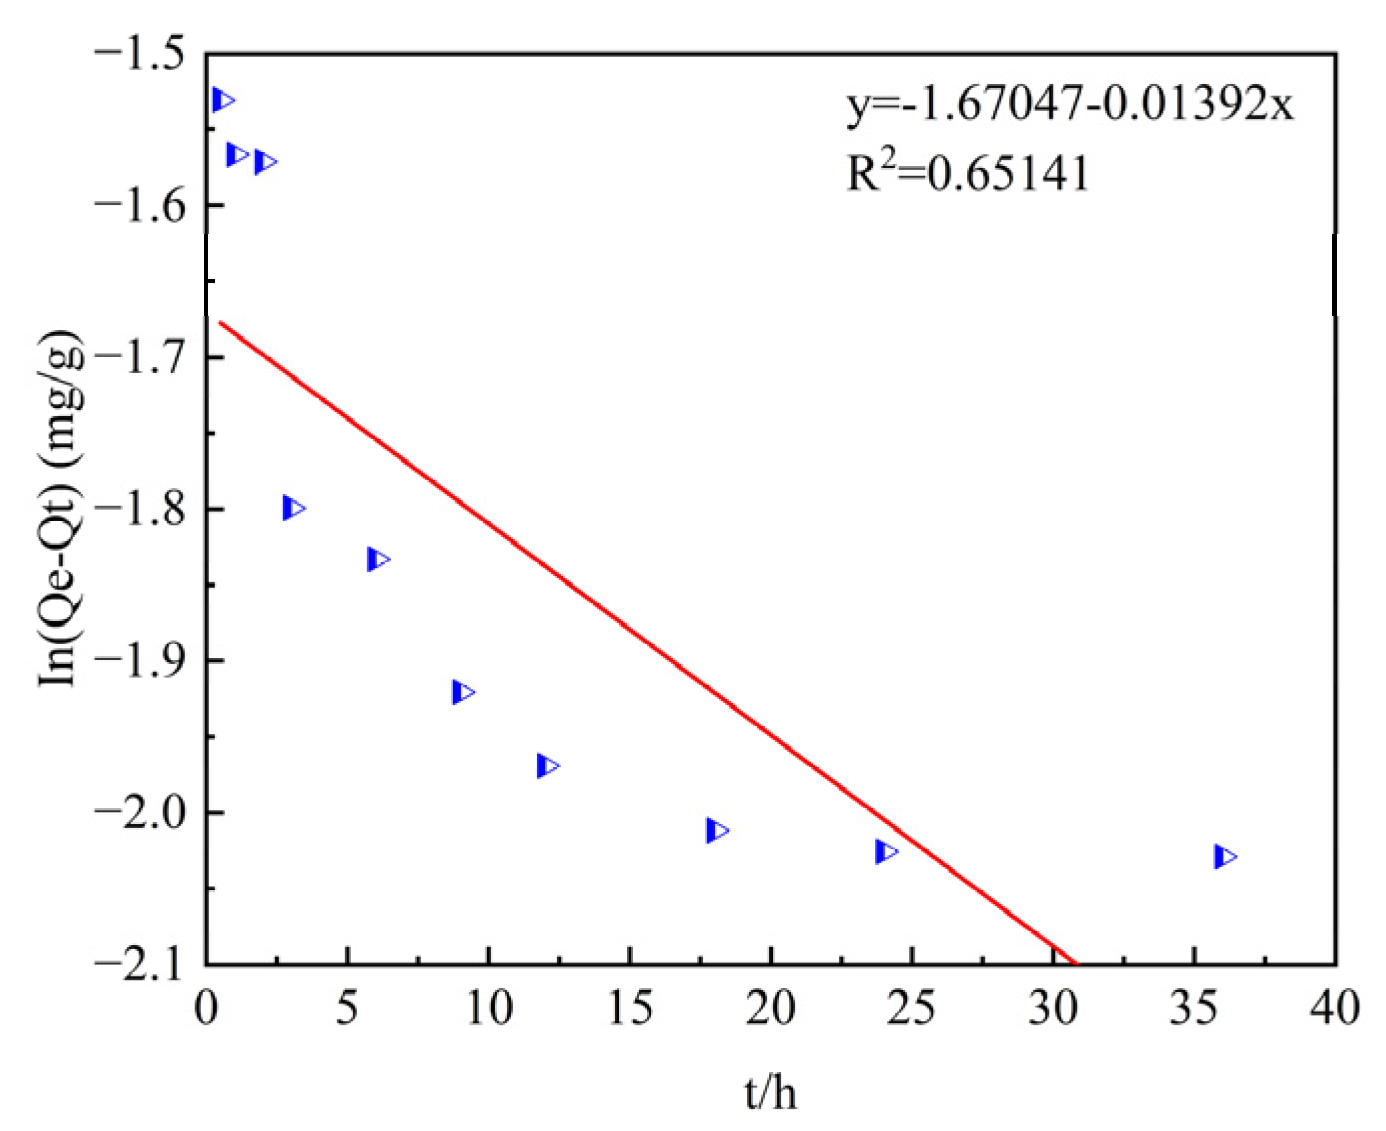
The quasi-first- and quasi-second-order kinetic models are shown in
Figure 18 and
Figure 19.
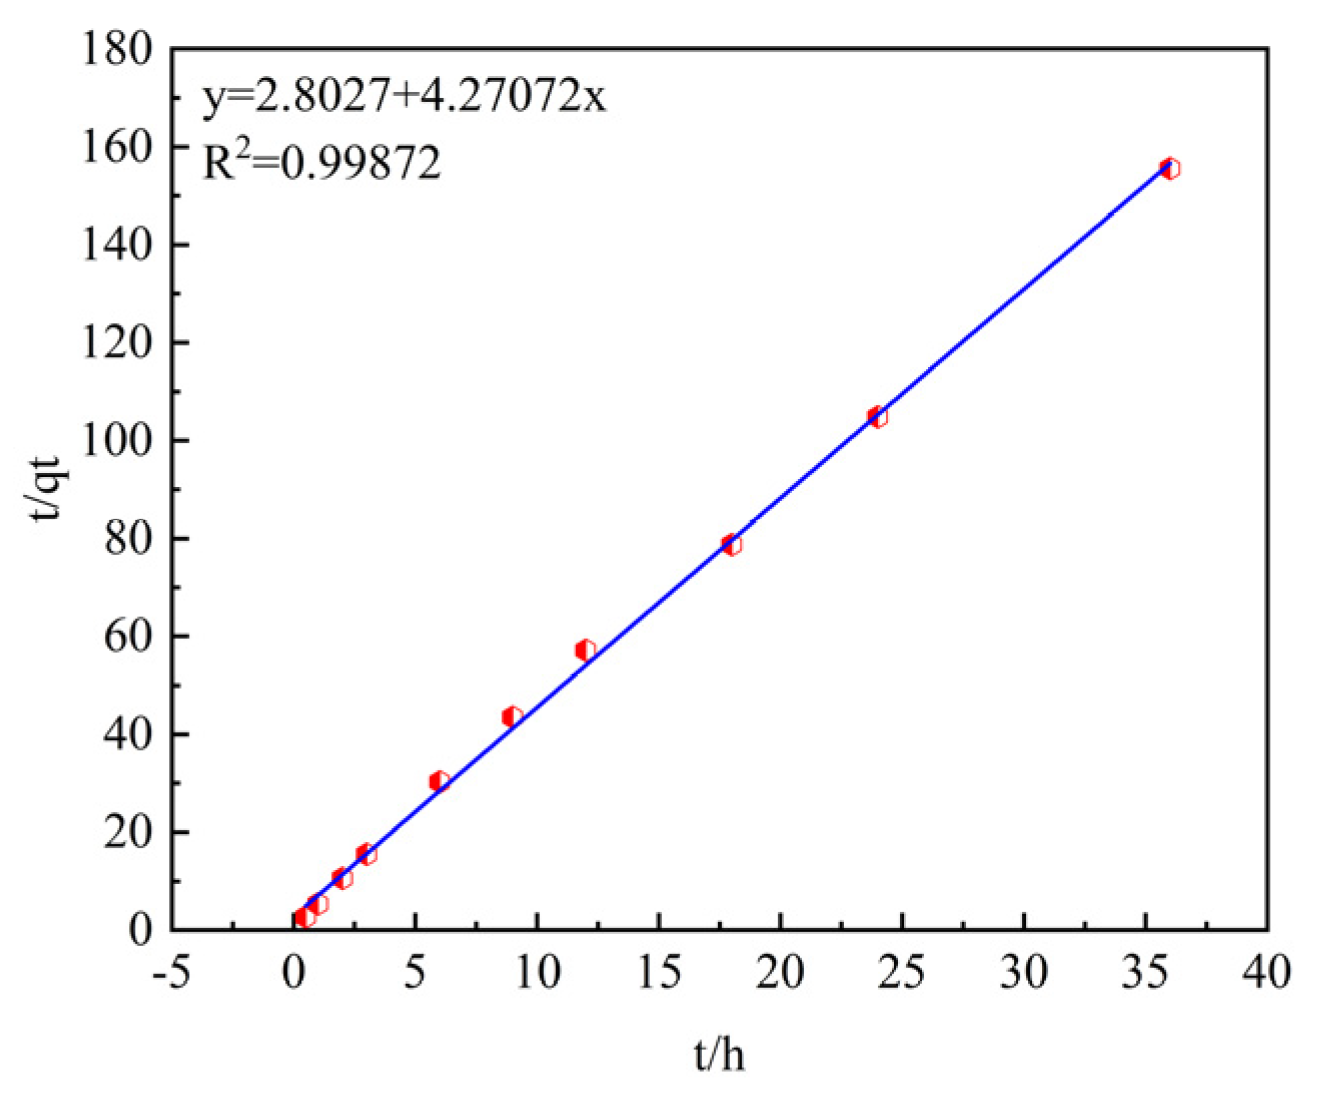
Table 5 shows the fitting of the adsorption process data using the pseudo-first-order and pseudo-second-order kinetic models. The coefficients of determination R2 after fitting the pseudo-first-order and pseudo-second-order kinetic models are 0.6514 and 0.9987, respectively, and the pseudo-second-order kinetic model has a higher goodness of fit. In addition, by comparing the theoretical adsorption capacities q
e of the pseudo-first-order and pseudo-second-order kinetic models (0.1881 mg/g and 0.2341 mg/g) with the experimentally measured equilibrium adsorption capacity q
e (0.23145 mg/g), it is found that the theoretical adsorption capacity of the pseudo-second-order kinetic model is closer to the measured result.
Therefore, the pseudo-second-order kinetic model is more suitable for describing the adsorption process of phosphorus by ceramsite, and the reaction process is mainly controlled by chemical adsorption.
See
Figure 20 for the intramaterial diffusion model of phosphorus adsorption.
As shown in
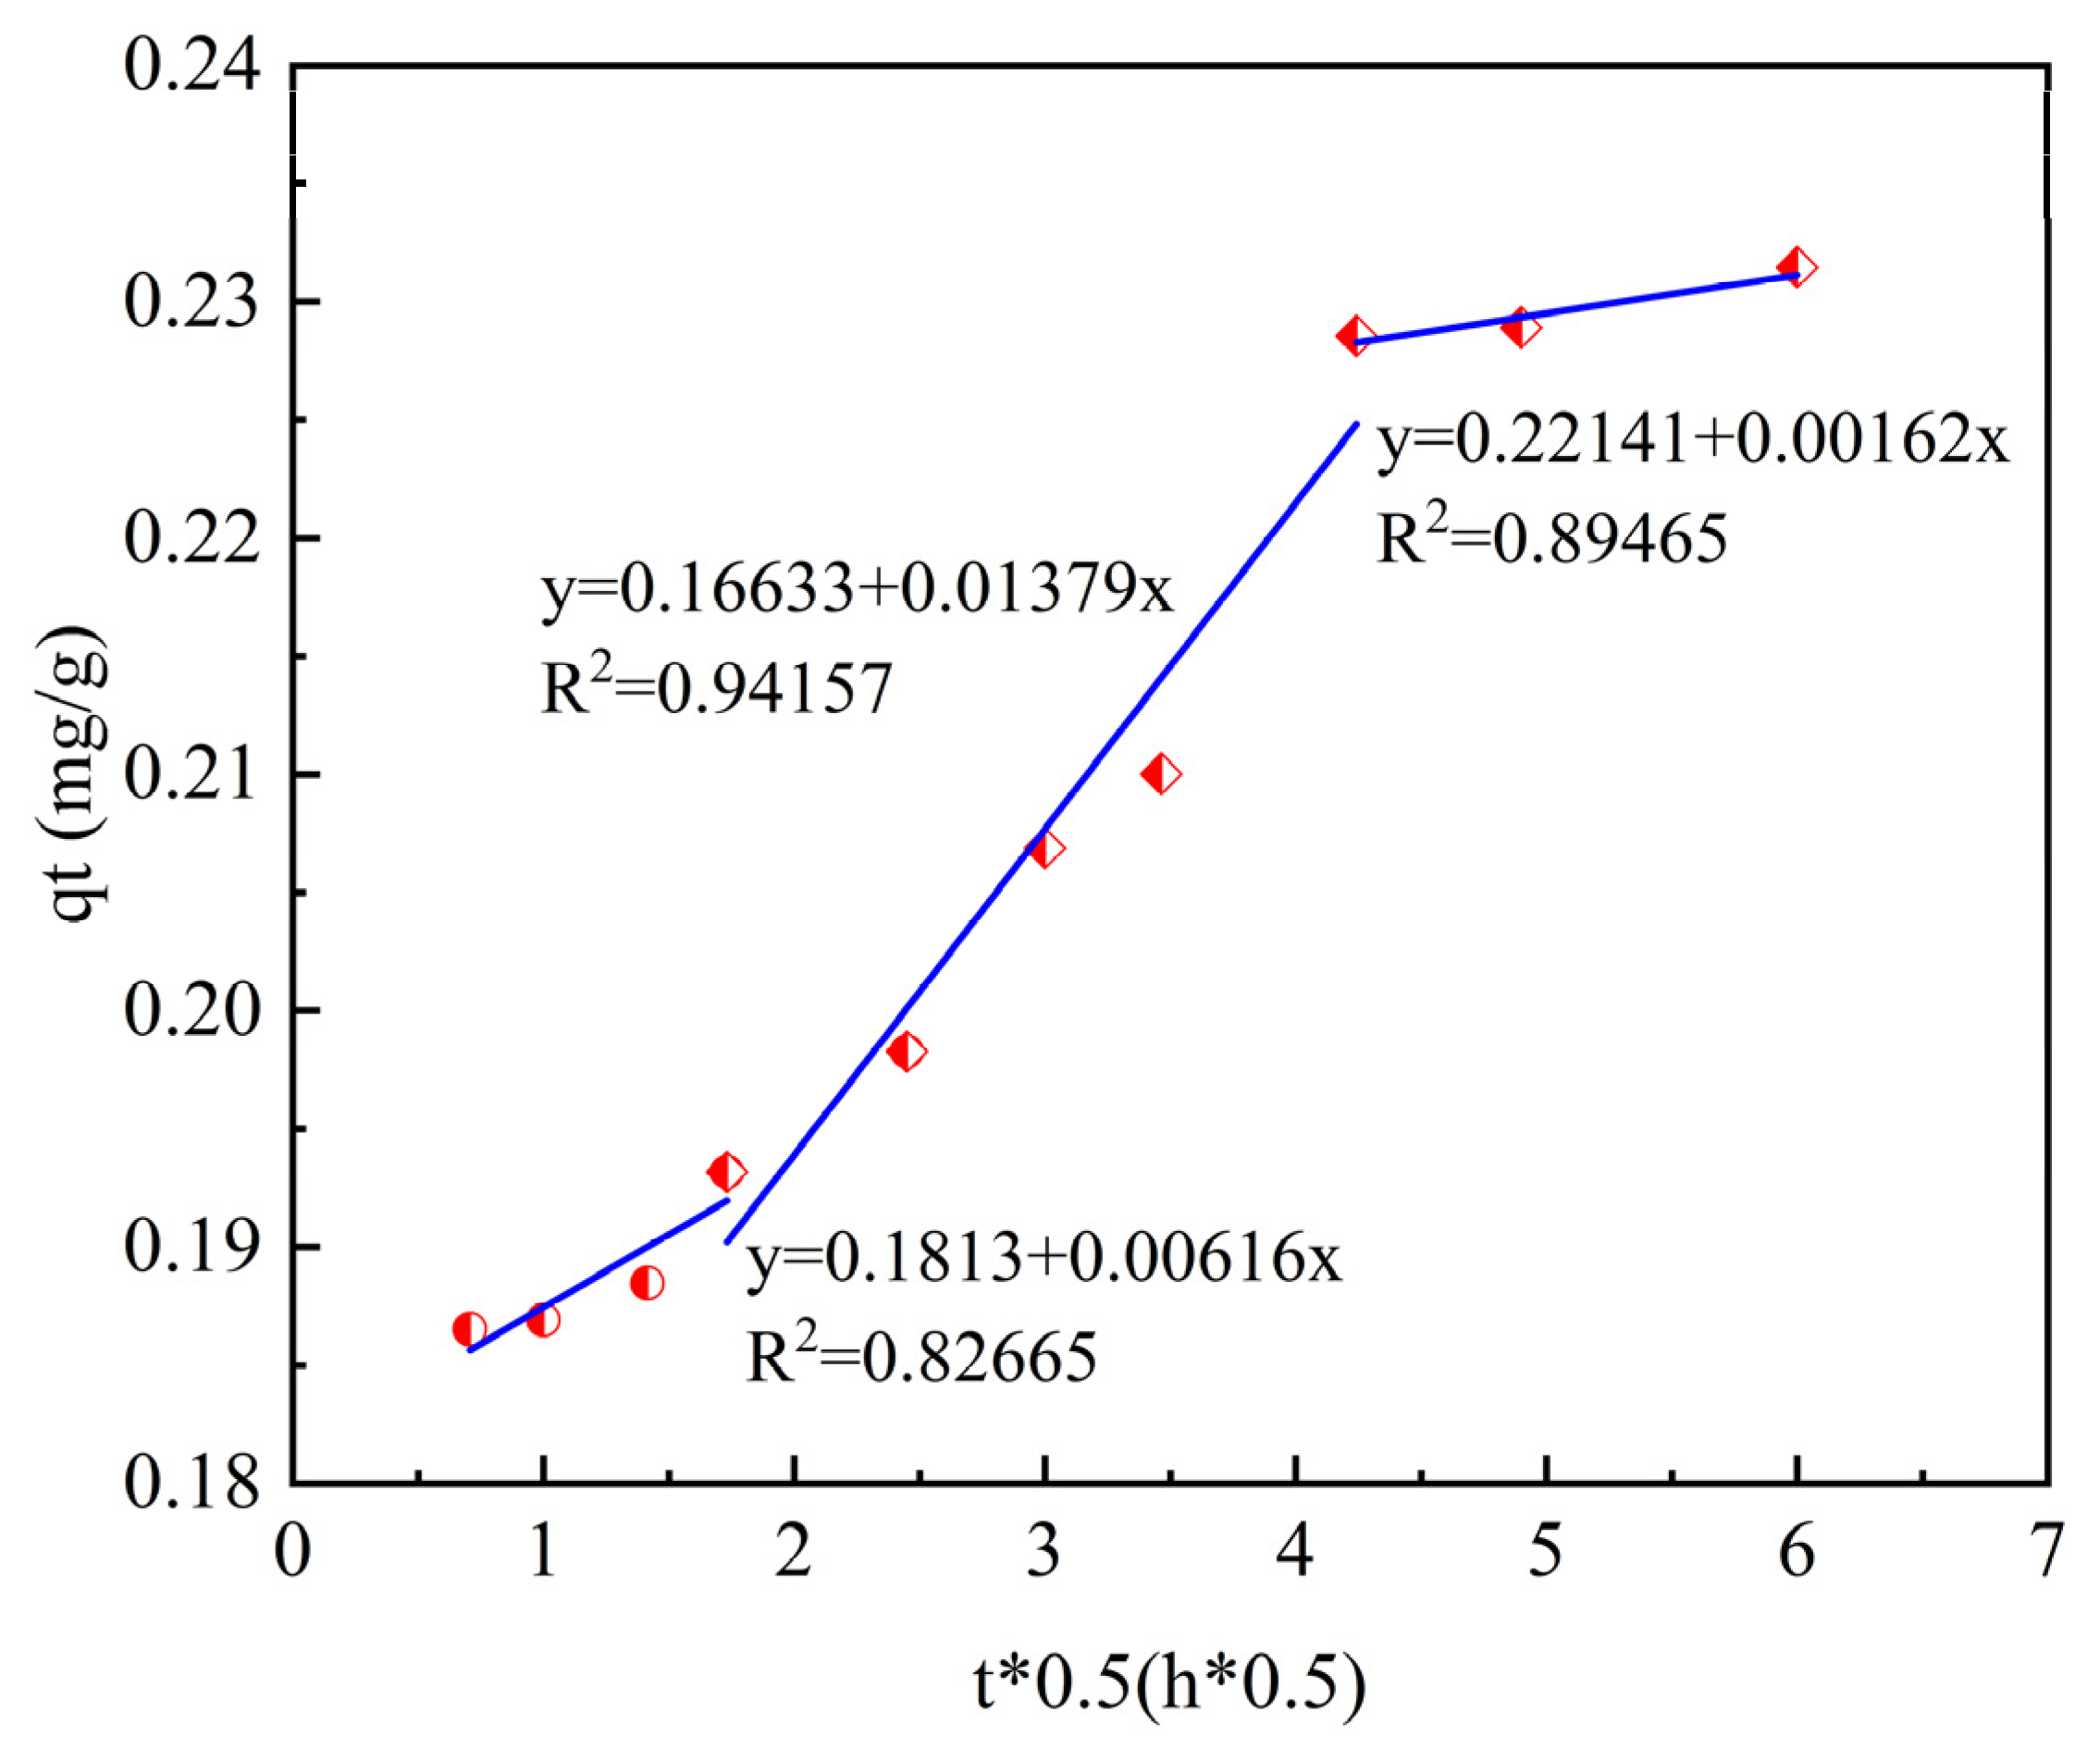
Table 6, in this study, the intraparticle diffusion model was used to fit the experimental data. The specific data are shown in the table. According to the fitting results of the intraparticle diffusion model, the process of phosphorus adsorption by ceramsite can be divided into three stages.
The first stage is the rapid diffusion in the liquid phase. Phosphorus rapidly diffuses from the solution to the outer surface of the ceramsite. The mass-transfer resistance in this process is relatively small, so the adsorption capacity increases significantly. The second stage is intraparticle diffusion, where phosphorus slowly diffuses from the outer surface of the ceramsite into the internal pores. The third stage is the dynamic adsorption equilibrium stage. At this time, the adsorption of phosphorus by ceramsite is close to saturation, and the adsorption capacity does not change significantly with the extension of time.
From the fitting parameters, it can be seen that the coefficient of determination of the second-stage fitting is relatively high (R2 = 0.9415), indicating that the reaction process is mainly controlled by intraparticle diffusion.
4.4. Isothermal Adsorption Experiment
The isothermal adsorption curve and Langmuir fitting line for phosphorus in ceramics are shown in
Figure 21 and
Figure 22.
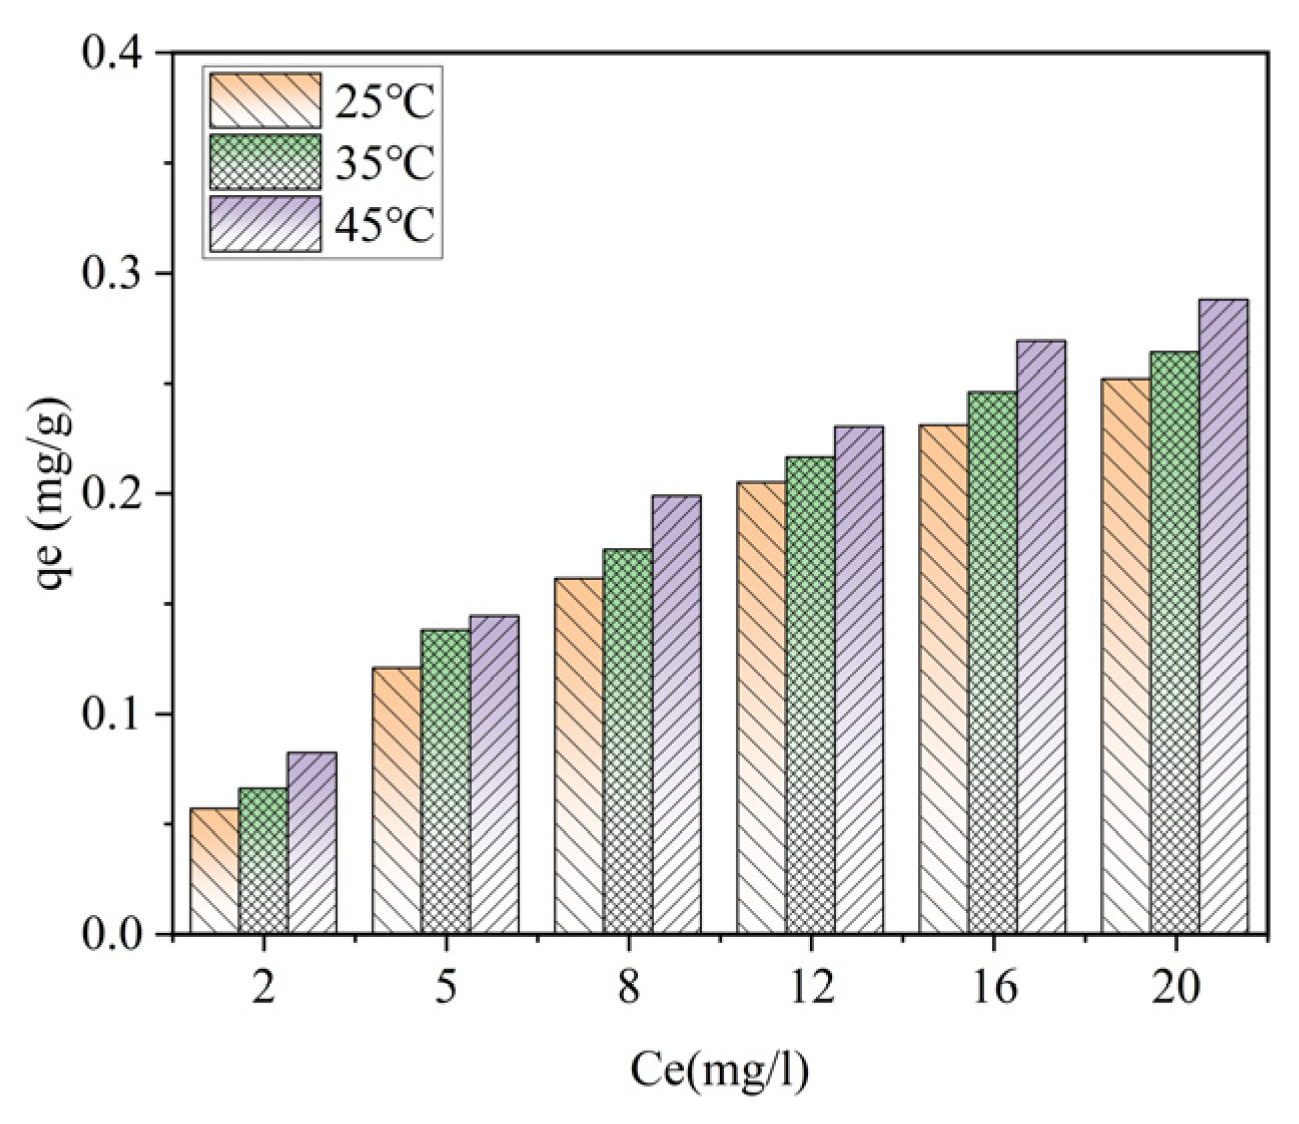
When the ceramsite dosage is 10 g/L, at temperatures of 25 °C, 35 °C, and 45 °C, the adsorption capacity of phosphorus by ceramsite shows an upward trend with the increase in the equilibrium concentration. Under the condition of a certain equilibrium phosphorus concentration, the adsorption capacity gradually increases with the rise in temperature. Therefore, when the ceramsite dosage is fixed, appropriately increasing the initial phosphorus concentration and the reaction temperature is beneficial to increasing the adsorption capacity of phosphorus by ceramsite.
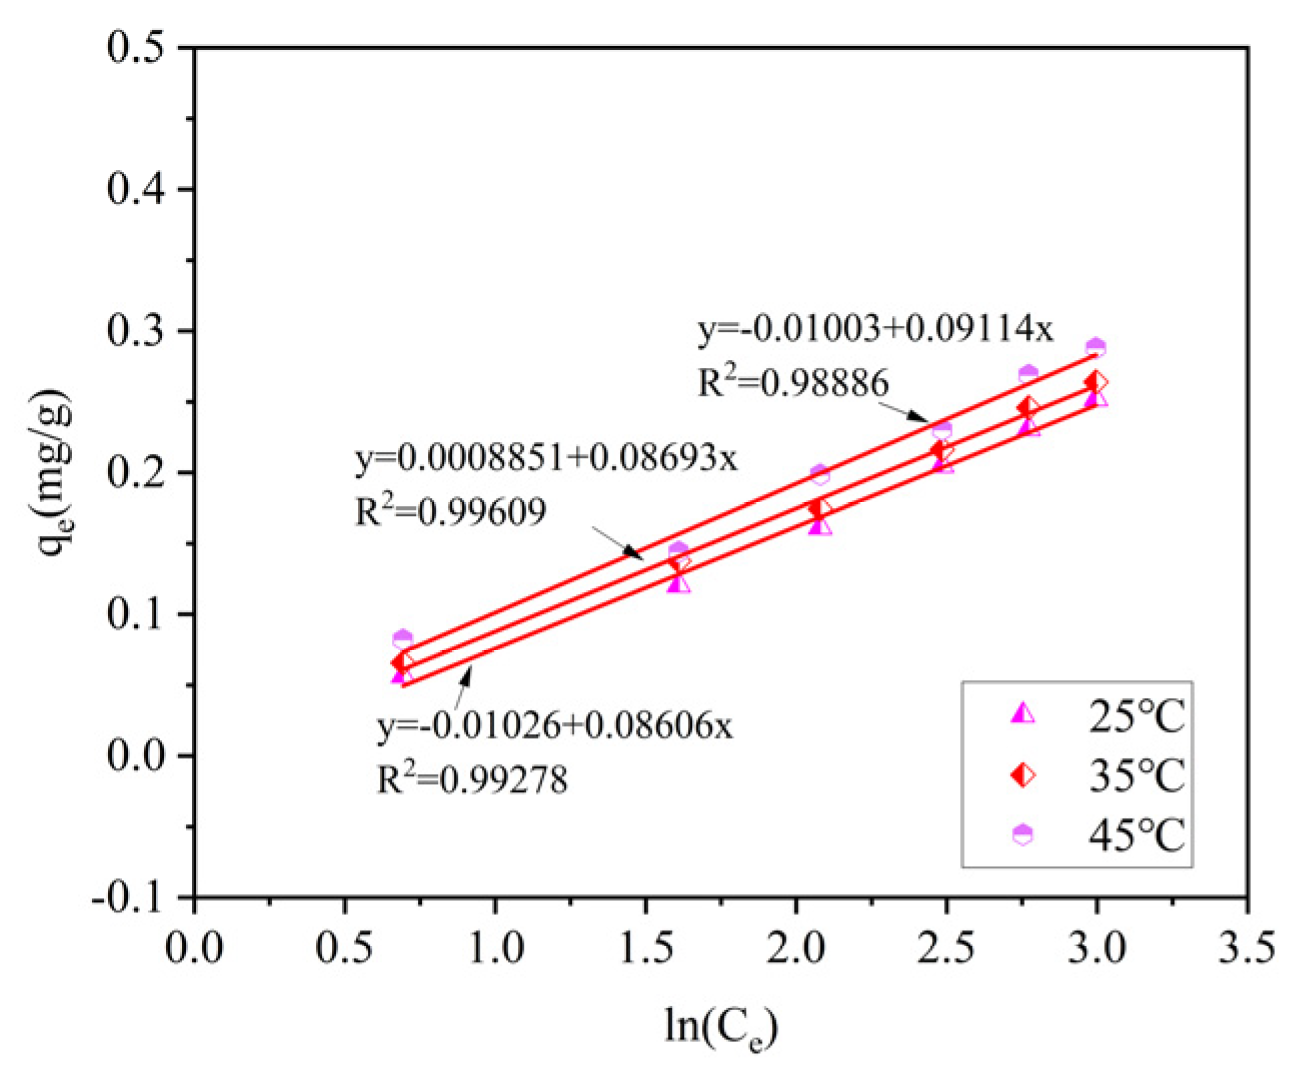
The Freundlich and Tempkin fitting lines for phosphorus of ceramite are shown in
Figure 23 and
Figure 24.
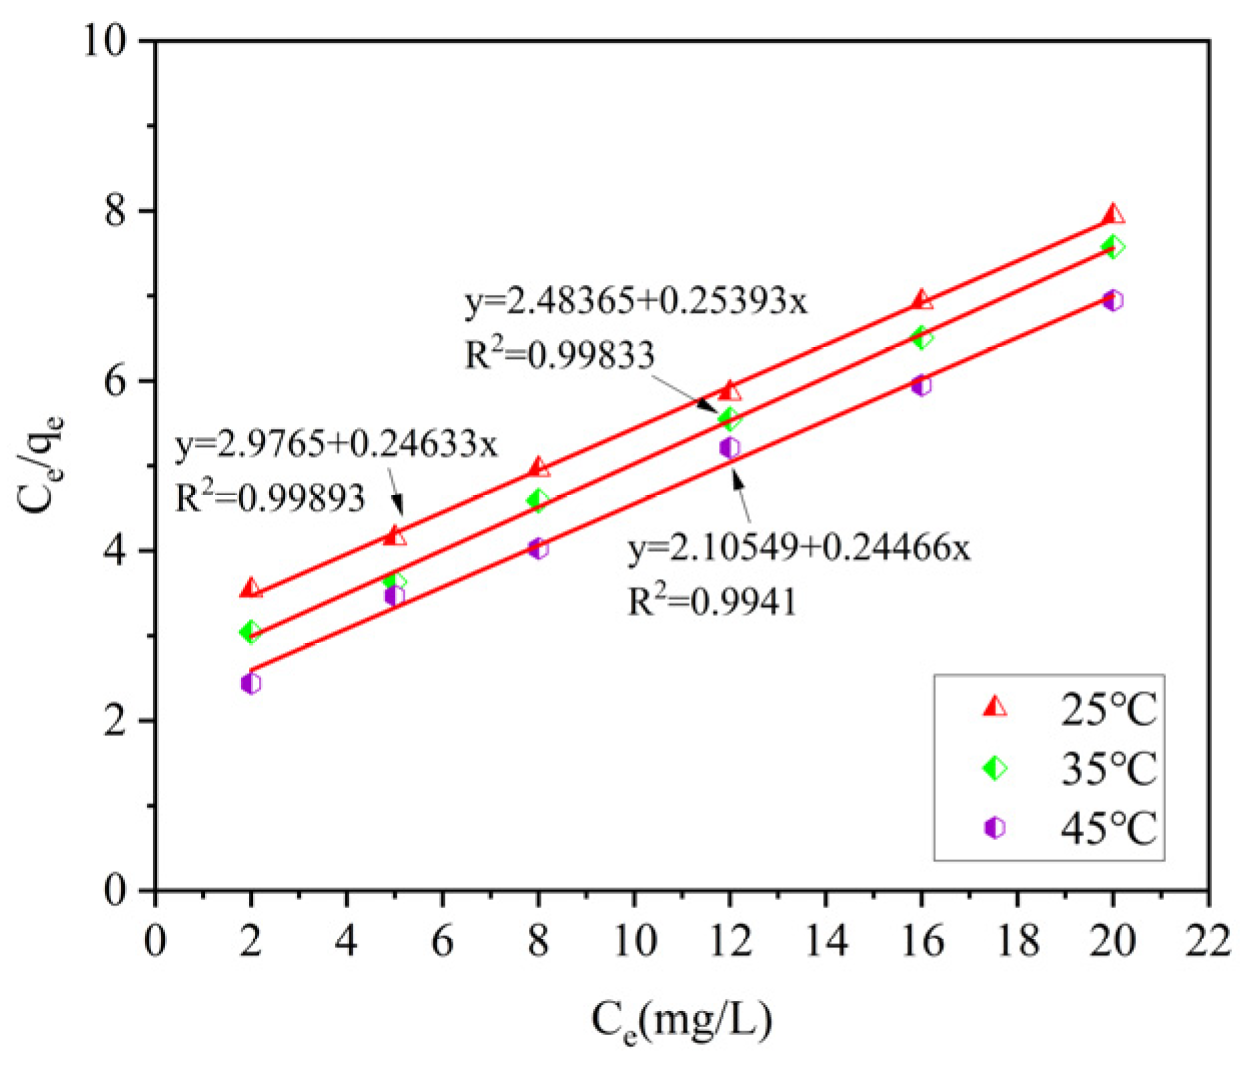
Three isothermal adsorption models were used to fit the data. By comparing the coefficients of determination R
2, it can be seen that the Langmuir model and the Tempkin model can effectively describe the adsorption process of phosphorus by ceramsite. Among them, compared with the other two models, the Langmuir model has the highest R
2 values (ranging from 0.9983 to 0.9941) after fitting under different temperature conditions. This indicates that the adsorption process of phosphorus by ceramsite is a monolayer and uniform surface adsorption. The specific fitting parameters of the isothermal adsorption models are shown in
Table 7.
4.5. Adsorption Comparison of Different Materials
The optimal conditions, materials, and detailed parameters for the comparison of the adsorption performance of different materials are shown in
Table 8.
5. Conclusions
1. Fe2O3 catalyzes the pyrolysis of K2CO3 step by step to release CO/CO2 gas, forming a three-dimensional interconnected circular pore and tunnel pore composite structure. At the same time, it releases secondary gas by itself, significantly increasing the porosity of the material.
2. With the increase in dosage (2.1→9.6 g/L), the adsorption capacities of ammonia–nitrogen and phosphorus decreased from 0.4521 mg/g and 0.4280 mg/g to 0.1430 mg/g and 0.1819 mg/g, respectively. However, the removal rates increased from 47.47% and 29.96% to 68.66% and 58.22%, respectively, indicating that although a high dosage reduced the unit adsorption capacity, the overall removal efficiency improved.
3. Ammonia–nitrogen has the best adsorption effect at pH = 10 (0.4429 mg/g, with a removal rate of 81.58%), while phosphorus shows the best performance under neutral conditions (pH = 7) (0.3446 mg/g, with a removal rate of 86.40%). Both strong acid and strong alkali environments weaken the adsorption performance.
4. The pseudo-second-order kinetics and Langmuir isothermal adsorption models precisely fit the adsorption process, respectively, confirming that chemical adsorption is dominant and is monolayer adsorption, providing a theoretical basis for material modification.