


Abstract
This paper introduces a transformative forward-sensing paradigm for existing telecommunication optical fiber networks that leverages ultra-short pulse laser locking to extract high-precision arrival time of a pulse train, coherent detection, and multi-dimensional signal analysis to detect and characterize physical disturbances, and propose a framework for localization of physical disturbances of interest. Unlike conventional backscatter-based distributed acoustic sensing (DAS) systems, which suffer from signal-to-noise ratio limitations and spatial resolution trade-offs, our approach employs a primary-secondary mode-locked laser (MLL) configuration with femtosecond-level pulse synchronization to capture phase and polarization perturbations along the entire fiber path. The core innovation lies in formulating the error signal from the phase-locked loop as a multi-dimensional data cube comprising fast-time (intra-pulse dynamics), slow-time (inter-pulse evolution), and polarization dimensions. We hypothesize that physical events such as acoustic vibrations, mechanical intrusions, or environmental changes imprint unique space-time signatures within this cube, which can be extracted via machine learning techniques. Preliminary experiments using controlled acoustic excitations demonstrate clear separability between disturbed and undisturbed states in principal component analysis (PCA) and kernel PCA reduced spaces. The proposed methodology bridges high-precision photonics and data-driven sensing at no extra hardware costs, with promising applications in critical infrastructure security, environmental monitoring, and smart sensing networks.
1. Introduction
Optical fiber sensing has undergone a remarkable evolution over the past several decades, transitioning from simple intensity-based monitoring systems to sophisticated coherent phase-sensitive architectures capable of detecting minute environmental changes [1]. Distributed acoustic sensing (DAS), which primarily relies on Rayleigh backscattering within the fiber, has found widespread application in pipeline monitoring, perimeter security, and seismic detection due to its ability to provide continuous, real-time measurements over long distances [2]. However, DAS systems are fundamentally constrained by some inherent limitations. For example, the weak nature of backscattered signals results in poor signal-to-noise ratios (SNR), especially over extended ranges, while spatial resolution and sensing range are inversely related, forcing difficult engineering trade-offs. Additionally, DAS systems require dedicated resource allocation for the sensing capabilities.
In contrast, forward sensing where the optical signal is detected after propagating through the entire fiber length—offers a compelling alternative. By analyzing the transmitted signal rather than backscattered reflections, forward sensing systems benefit from significantly higher SNR, as the signal power is not attenuated by the round-trip loss inherent in backscatter methods. Moreover, forward sensing enables the use of coherent detection techniques, which can extract both amplitude and phase information with exceptional sensitivity. Recent advances in ultra-short pulse laser technology and precise optical locking schemes have opened new frontiers in high-precision metrology, time-resolved spectroscopy, and optical communications [3]. Yet, the application of these technologies to distributed forward sensing remains largely unexplored, representing a significant opportunity for innovation.
This paper proposes a novel forward-sensing architecture that synergistically combines several advanced technologies: a primary-secondary mode-locked laser (MLL) system with femtosecond-level pulse synchronization; coherent mixing and phase kick detection (PKD) to extract error signals that are exquisitely sensitive to physical perturbations; and a multi-dimensional data cube representation of these error signals across time and polarization domains. The core hypothesis underpinning this work is that any physical disturbance whether acoustic, mechanical, thermal, or otherwise imparts a unique space-time signature within the data cube. This signature arises from the disturbances’ impact on the optical phase, polarization state, and temporal profile of the propagating pulses. Crucially, we propose that these signatures can be detected and characterized using machine learning (ML) techniques, and that, in principle, they could be exploited for event localization. In this initial work we focus on demonstrating separability between disturbed and undisturbed conditions in reduced-dimensional spaces; full classification and localization are left to future experimental campaigns. In this article, we propose a mathematical framework with experiments for localization based on chromatic dispersion and polarization mode coupling whereas exhaustive experimental validation is left for future work. This represents a paradigm shift from traditional model-driven sensing approaches to a data-driven methodology that can adapt to new event types and environmental conditions through learning. This method, demonstrated on CyberRidge’s infrastructure, has the added advantage that it does not require additional dedicated sensing hardware or fibers beyond the existing MLL locking systems and telecom link, unlike conventional DAS solutions that typically rely on specialized backscatter interrogation units.
The proposed O-CommSense architecture is novel in several respects compared to the existing distributed fiber sensing techniques. Firstly, instead of designing a dedicated sensing interferometer or analysing Rayleigh backscatter, we repurpose the error signal from a phase-locked primary-secondary MLL system traditionally treated as a quantity to be minimized, as the primary sensing observable. Secondly, we introduce a multi-dimensional data-cube representation of this error signal across fast-time, slow-time (indexed by dither periods), and polarization dimensions, enabling rich space–time–polarization signatures to be captured without additional sensing hardware. Thirdly, by operating in the pulse-arrival-time regime with a high repetition-rate mode-locked laser, the architecture inherits an unambiguous measurement range of several orders of magnitude larger than that of optical carrier-phase sensing while retaining comparable timing precision. Together, these features extend the CommSense idea from radio frequency (RF) communication channels to optical fiber links, creating a dual-use platform for both high-precision optical timing and environmental sensing.
2. Background and Related Work
2.1. Distributed Fiber Sensing: State of the Art
Distributed fiber sensing techniques have matured significantly since their inception, for instance optical Time-Domain Reflectometry (OTDR) and its phase-sensitive variant (-OTDR) are the most widely deployed methods for distributed acoustic and vibration sensing [4]. These techniques operate by launching optical pulses into the fiber and analyzing the backscattered light as a function of time, which corresponds to distance along the fiber. While effective, they suffer from fundamental trade-offs: spatial resolution is limited by the pulse width, sensing range is constrained by fiber attenuation and backscatter efficiency, and SNR decreases with distance. Optical Frequency-Domain Reflectometry (OFDR) offers higher spatial resolution however over shorter ranges, typically limited to a few hundred meters [5]. Both methods are inherently backward-looking, analyzing only the reflected signal component.
Forward-sensing approaches, in contrast, analyze the transmitted signal after it has traversed the fiber. Interferometric sensors, such as Mach-Zehnder and Sagnac interferometers, are highly sensitive to phase changes but are typically configured as point sensors or quasi-distributed arrays rather than truly continuous distributed sensors [6]. Polarimetric sensors monitor changes in the state of polarization (SOP) induced by external perturbations but face challenges in distinguishing multiple simultaneous disturbances. Our proposed system seeks to overcome these limitations by combining the sensitivity of interferometric detection with the distributed nature of forward propagation, enabled by ultra-short pulse timing and multi-dimensional analysis.
A comparison with optical carrier phase sensing is particularly relevant because both techniques estimate optical path-length variations from an interferometric observable, yet they rely on fundamentally different timing references. Carrier-phase sensing uses the optical carrier itself as the metrological ruler, whereas the proposed approach extracts timing information from the arrival time of a pulse train referenced to its repetition period. Optical carrier phase sensing with narrow-linewidth lasers (e.g., kHz-class external-cavity or integrated tunable lasers) enables extremely high displacement sensitivity by tracking phase fluctuations of the optical field, as widely employed in heterodyne and homodyne interferometric metrology and coherent optical sensing systems [5,7]. For a 1550 nm carrier, phase noise well below one radian integrated over the measurement bandwidth corresponds to an equivalent timing uncertainty in the attosecond-to-femtosecond regime via carrier-frequency scaling.
In contrast, pulse-arrival-time (PAT) sensing is based on estimating the temporal position of optical pulses. Using a 2.5 GHz MLL source (Menhir Photonics, Dübendorf, Switzerland), corresponding to a 400 ps repetition period, state-of-the-art timing distribution experiments have demonstrated residual timing instability on the order of 100 attoseconds under stabilized operation [8], yielding an equivalent timing uncertainty comparable to that achievable in coherent phase-based sensing when expressed on a unified time-domain metric.
Despite similar equivalent timing uncertainty, the two approaches differ fundamentally in their ambiguity structure. Carrier-phase measurements exhibit a periodic ambiguity that wraps every optical wavelength (≈ 1.55 m), requiring phase unwrapping or continuous phase tracking for large excursions. In the proposed pulse-arrival-time approach, an analogous ambiguity arises when the differential delay exceeds one pulse repetition period (400 ps for a 2.5 GHz system), corresponding to a free-space distance of approximately 12 cm. This provides an unambiguous measurement range nearly five orders of magnitude larger than that of optical carrier phase sensing, while maintaining comparable sub-femtosecond equivalent timing precision under stabilized conditions.
Notably, the proposed sensing technique inherently bridges these two regimes. Since pulse arrival time is extracted interferometrically, both intensity-based timing information and coherent phase information are simultaneously accessible within the same measurement framework. Consequently, the method can be interpreted as a unified phase-tracking process operating on different time-frequency scales, where optical carrier phase wraps at 2, whereas pulse-arrival-time measurements wrap at one repetition period.
2.2. Ultra-Short Pulse Lasers: Capabilities and Applications
Mode-locked lasers generate trains of optical pulses with durations ranging from picoseconds to femtoseconds. These pulses exhibit exceptionally high peak powers and broad optical spectra, making them powerful tools for nonlinear optics, precision metrology, and time-resolved measurements [9]. In the context of sensing, ultra-short pulses offer several advantages: their broad bandwidth supports high time-domain resolution through optical time-domain techniques; their high peak power enhances nonlinear effects that can be exploited for sensing; and their precise periodic nature enables accurate timing measurements. Applications of MLLs in sensing include optical coherence tomography (OCT) for biomedical imaging, frequency comb spectroscopy for gas detection, and LiDAR for ranging [10]. However, the use of MLLs in distributed fiber sensing, particularly in a forward-sensing configuration, has been largely unexplored until now.
2.3. Machine Learning in Optical Sensing
The integration of machine learning with optical sensing has gained significant momentum in recent years. In distributed acoustic sensing, deep learning models such as convolutional neural networks (CNNs) and recurrent neural networks (RNNs) have been employed for event classification, noise suppression, and anomaly detection [11]. These approaches typically treat the sensing problem as a pattern recognition task, where labeled datasets of known events are used to train classifiers. However, most existing work focuses on post-processing backscatter data from conventional DAS systems. The combination of ML with multi-dimensional forward-sensing data cubes represents a novel research direction that leverages both the rich information content of forward signals and the pattern recognition capabilities of modern ML algorithms [12].
In the present work, our use of machine learning is deliberately limited to unsupervised dimensionality reduction for exploratory analysis. Specifically, we employ principal component analysis (PCA) and kernel PCA (kPCA) to project high-dimensional data cubes onto low-dimensional spaces in which separability between conditions can be visually assessed. We do not train or evaluate supervised classifiers, and we therefore refrain from reporting detection accuracy or false-alarm statistics. Comprehensive ML-based event classification with labeled datasets and quantitative performance metrics is reserved for future studies.
2.4. Optical Locking and Coherent Detection
Optical phase-locked loops (OPLLs) and coherent detection are well-established in optical communications and precision metrology. OPLLs enable the synchronization of two lasers with extremely high precision, achieving phase errors of less than one degree and timing jitter in the femtosecond range [13]. In coherent optical communications, these techniques are used to recover phase-modulated data with high sensitivity. Our system extends these concepts to sensing by utilizing the error signal from a coherent mixer—typically used for phase locking as the primary sensing observable. When the fiber path experiences a physical disturbance, it alters the phase relationship between the primary and secondary lasers, which in turn modifies the error signal. This approach transforms a standard phase-locking system into a sensitive distributed sensor, creating a dual-use technology that can simultaneously provide laser synchronization and environmental sensing.
The above methodology has been explored by one of the authors in RF communication based sensing. The technology, termed communication-sensing (CommSense) offers similar advantages of providing limited sensing capabilities by modelling events of interest as identifiable signatures in the channel RF characteristics [14,15,16,17].
3. System Architecture
3.1. Primary-Secondary MLL Configuration: Principles and Implementation
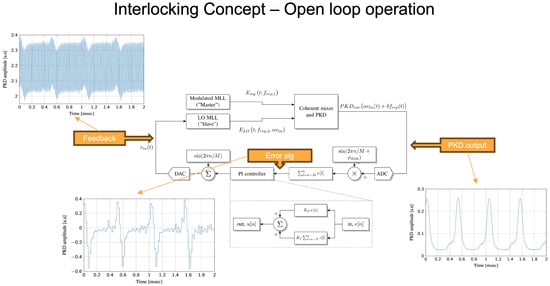
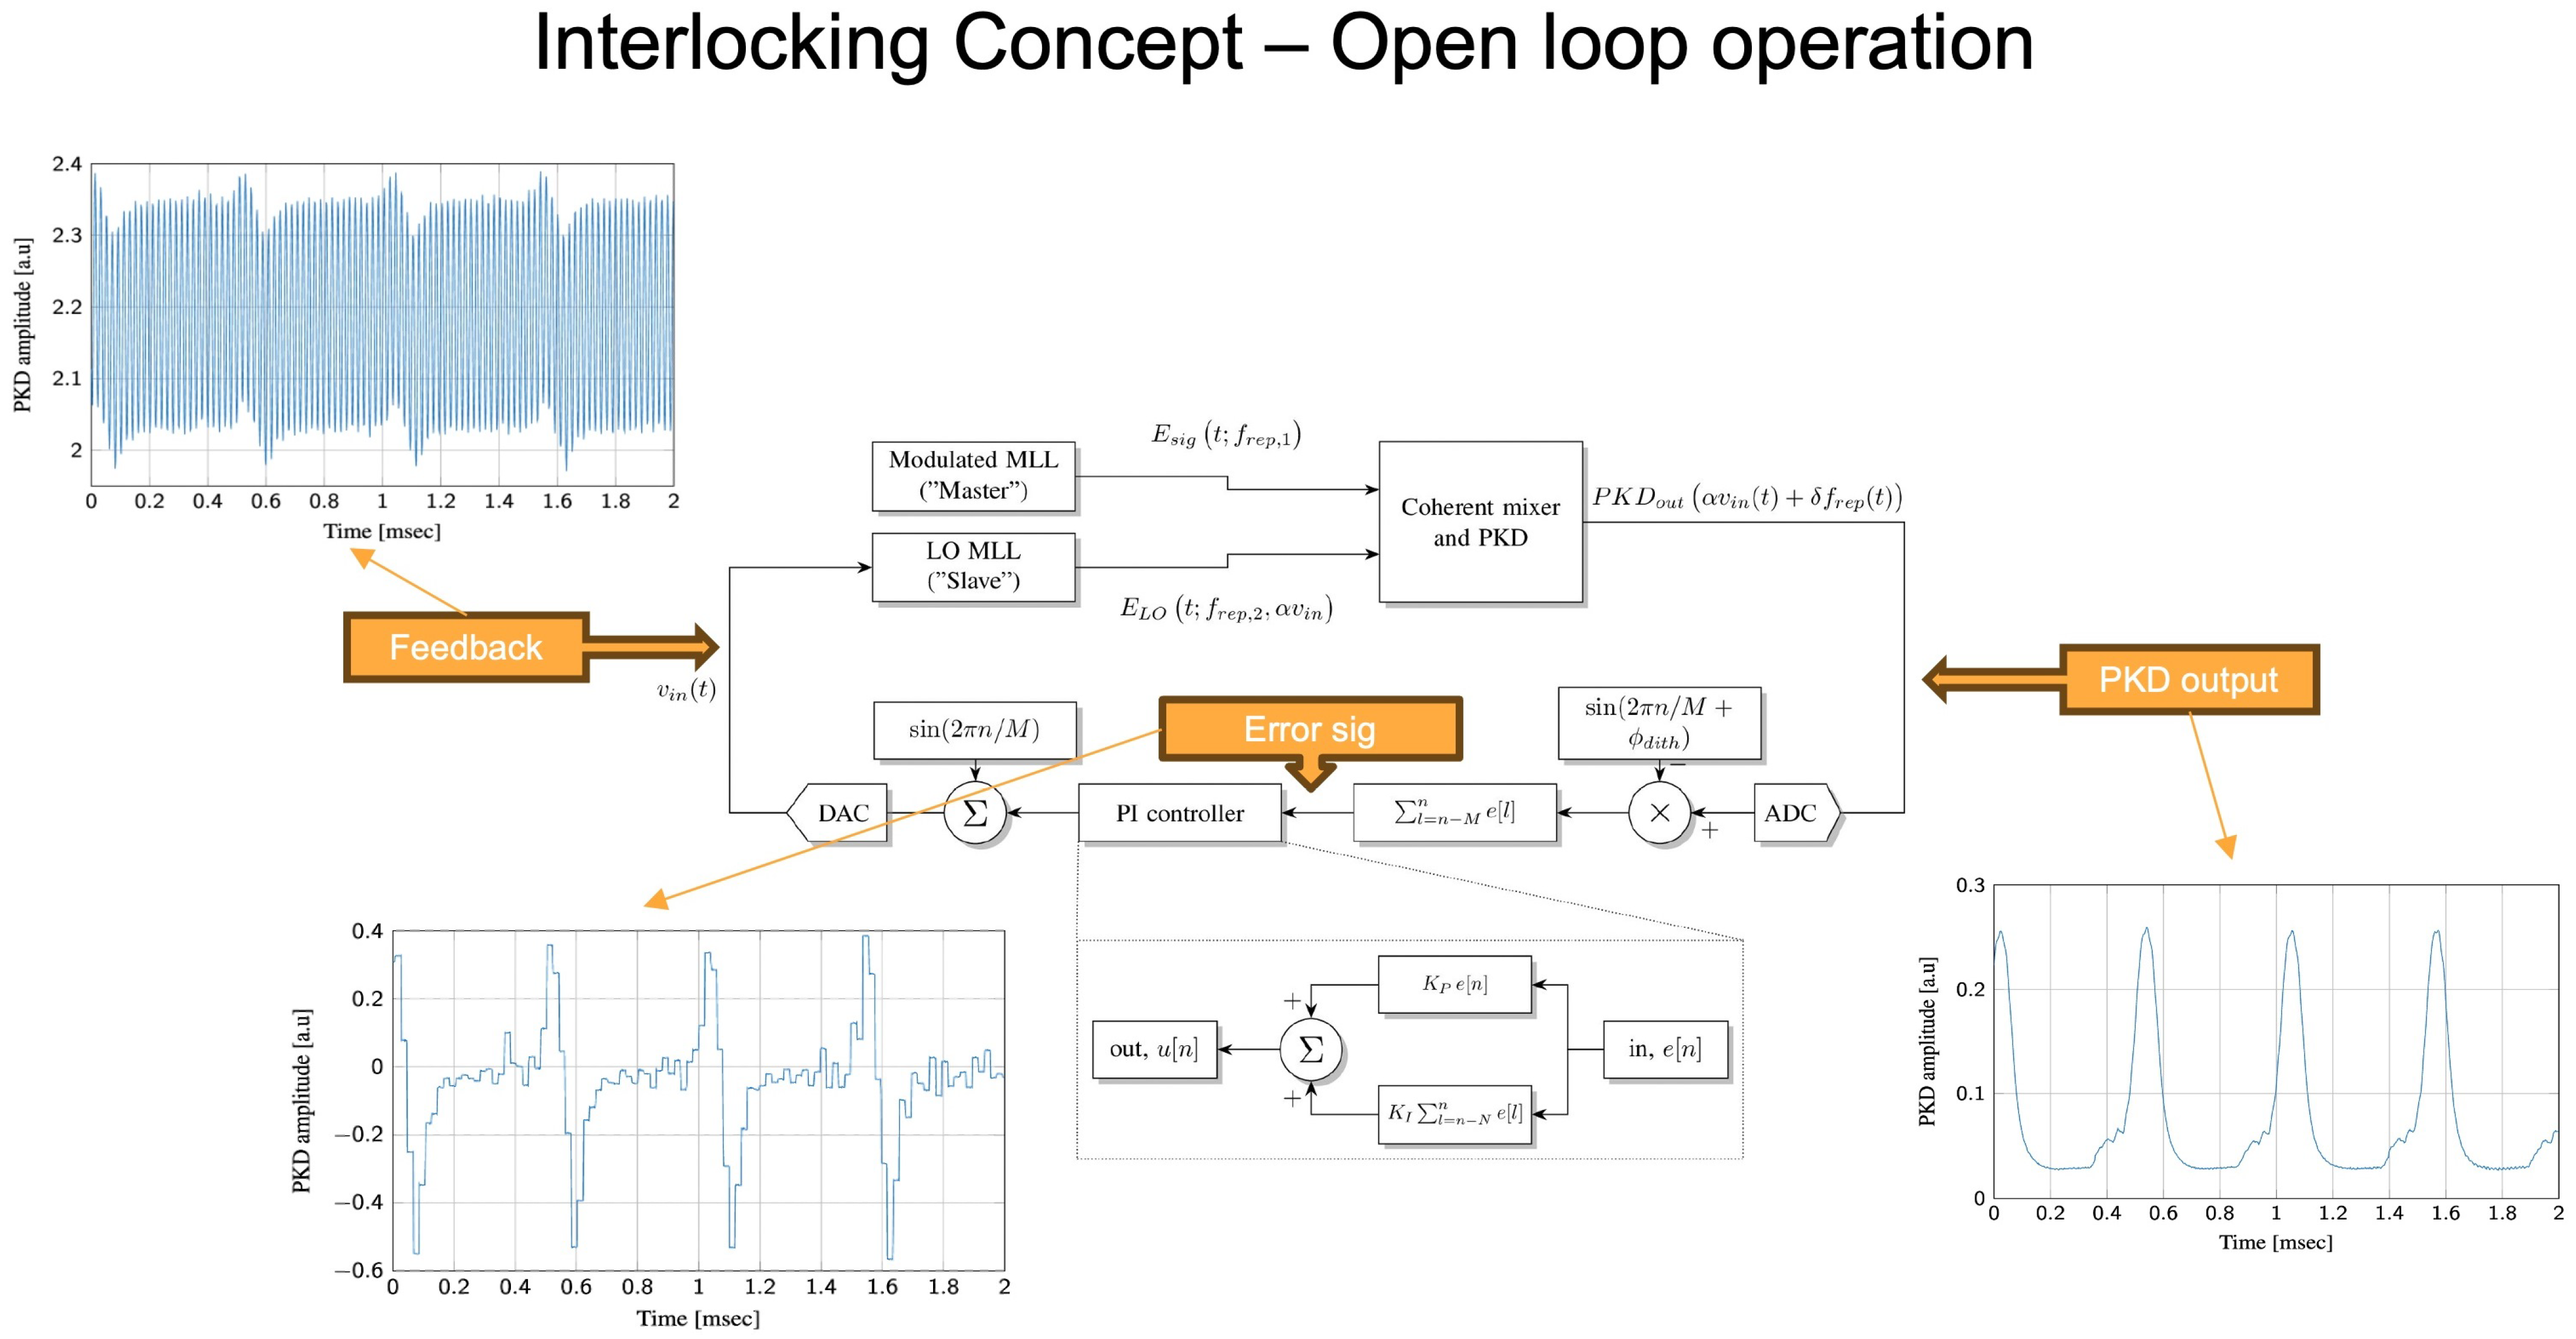
At the heart of our sensing system is a pair of MLLs operating in a primary-secondary configuration, as illustrated in Figure 1. The primary MLL generates a train of ultra-short optical pulses with a repetition rate typically in the range of 10–100 MHz. A key innovation in our approach is the intentional modulation of the primary laser with a 50 kHz dither signal applied to its cavity length or pumping current. This dither introduces a controlled, periodic perturbation to the pulse timing, creating a known reference modulation that aids in signal extraction and noise rejection. The secondary MLL is designed to lock its pulse timing to that of the primary laser with femtosecond precision. This locking is achieved through a feedback control loop that adjusts the secondary laser’s cavity length based on the phase difference between the two pulse trains.
Figure 1.
Comprehensive block diagram of the MLL locking scheme and sensing path. The primary MLL is modulated with a 50 kHz dither signal to introduce controlled timing perturbations. The secondary MLL is locked to the primary via a feedback loop comprising a coherent mixer, phase kick detector (PKD), and proportional-integral (PI) controller. The error signal, which contains information about physical disturbances along the fiber, is digitized and processed to form the multi-dimensional data cube. Key components include polarization controllers, optical isolators, and a variable optical attenuator (VOA) for power management.
The locking mechanism operates as follows: light from both lasers is combined in a coherent mixer, which generates an interference pattern whose phase depends on the relative timing between the pulses. A phase kick detector (PKD) converts this phase information into an electrical error signal. This error signal is then fed into a proportional-integral (PI) controller, which generates a correction voltage that adjusts the secondary laser’s cavity length via a piezoelectric transducer or thermal element. Under locked conditions, the error signal ideally approaches zero, indicating perfect synchronization. However, any physical disturbance along the optical path—such as acoustic vibrations, temperature changes, or mechanical strain—alters the propagation characteristics of the light from the primary laser before it reaches the coherent mixer. This changes the phase relationship between the two pulse trains, causing the error signal to deviate from zero. Crucially, this deviation contains encoded information about the nature, location, and magnitude of the disturbance.
3.2. Coherent Mixer and Phase Kick Detector: Sensing Front-End
The coherent mixer is typically implemented using a 90-degree optical hybrid combined with balanced photodetectors. This configuration provides both in-phase (I) and quadrature (Q) components of the interference signal, enabling complete complex field recovery. The PKD extracts the phase error by comparing the I and Q signals with reference values corresponding to the locked state. In our implementation, the PKD output is sampled at 15 MS/s using either an external oscilloscope or an internal analog-to-digital converter (ADC) within the CyberRidge controller. The transition to internal ADC acquisition represents a significant advancement, as it reduces noise, improves synchronization between data channels, and enables real-time signal processing within the control system.
3.3. Data Acquisition and Storage Architecture
Data acquisition is a critical aspect of system design, where our initial experiments utilized a high-speed digital storage oscilloscope to capture the PKD output. However, this approach introduced several real-time limitations, including limited buffer depth, asynchronous sampling relative to the laser repetition rate, and difficulty in correlating data with system state variables. Thus, the current system employs a custom FPGA-based acquisition module integrated directly into the CyberRidge controller. This module samples the PKD output at 15 MS/s with 16-bit resolution and streams the data to onboard DDR memory. Simultaneously, it captures auxiliary signals such as polarization state, dither modulation waveform, and environmental sensor readings. All data is packaged into Hierarchical Data Format version 5 (HDF5) files, which provide a structured, self-describing format that includes both raw samples and comprehensive metadata. This architecture supports the generation of the multi-dimensional data cubes essential for subsequent machine learning analysis.
It can be noted here that such locking mechanisms are found in various optical instruments. Hence, our sensing methodology can be incorporated in any system with such locking mechanisms in place.
4. Methodology: Data Cube Formation and Machine Learning Pipeline
4.1. Data Cube: A Multi-Dimensional Representation of Disturbance Signatures
The data collected for further processing is represented as a data cube a three-dimensional array that captures the error signal evolution across multiple domains. Formally, we define the data cube , where:
- N represents the slow-time dimension, corresponding to the index over successive dither cycles/pulse trains as they propagate through the fiber, (typically indexed by pulse number).
- M represents the fast-time dimension, corresponding to samples within one 50 kHz dither period (300 samples at 15 MS/s), capturing intra-period dynamics including the imposed dither and any faster disturbances each pulse period (governed by the 15 MS/s sampling rate).
- P represents the polarization dimension, with for dual-polarization detection (horizontal and vertical polarization states).
Mathematically, each element of the data cube is given by:
where is the error signal for polarization state p, is the time of the n-th pulse arrival at the coherent mixer, and ns is the sampling interval corresponding to 15 MS/s.
The physical interpretation of this structure is crucial since the fast-time dimension captures the intra-period dynamics within a single 50 kHz dither cycle, including the imposed dither modulation and any faster disturbances that occur within that cycle. The slow-time dimension captures the evolution of these dynamics across successive dither periods, tracing the inter-pulse behaviour over many repetition periods. The polarization dimension provides diversity in the sensing modality, as different disturbances affect the two polarization states differently due to fiber birefringence. This multi-dimensional representation, with sufficient characterisation, can act as a signature for events of interest.
In this preliminary study, our primary objective is to determine whether error-signal data cubes corresponding to different conditions occupy distinct regions in an appropriately chosen reduced-dimensional representation. Rather than deploying full machine-learning classifiers, we therefore employ principal component analysis (PCA) and kernel PCA (kPCA) purely as unsupervised dimensionality reduction tools. PCA and kPCA compress the data, decorrelate features, and reveal underlying structure in a small number of components, enabling visual inspection of cluster formation. This allows us to test the hypothesis that physical disturbances imprint distinguishable signatures in the error signal without committing to a particular classification architecture.
For this, we used both PCA and kPCA since these methods are popular in exploratory data analysis research. PCA and kPCA not only compresses the data, they also makes the data uncorrelated thereby compressing information content in the data.
4.2. Clustering and Event Detection in Reduced Spaces
Once the data has been projected onto a low-dimensional subspace via PCA or kPCA, we apply clustering algorithms to identify groups of similar data points that may correspond to distinct disturbance events. For our preliminary analysis, we use simple visualization of the first two principal components to assess separability between different experimental conditions (e.g., with and without acoustic excitation). More formally, we can apply clustering algorithms such as k-means or DBSCAN to automatically identify clusters without prior labeling.
The fundamental hypothesis guiding this approach is that different types of physical disturbances will produce error signal signatures that occupy distinct regions in the reduced-dimensional space. For example, acoustic vibrations at a specific frequency may produce a signature that lies along a particular direction in PCA space, while mechanical tapping may produce a signature along a different direction. By analyzing the distribution of data points in this space, we can not only detect the presence of disturbances but also begin to classify them according to their characteristic signatures.
5. Experimental Setup and Preliminary Results
5.1. Laboratory Configuration and Fiber Testbed
The experimental validation was conducted using a laboratory testbed designed to emulate realistic field conditions while maintaining precise control over disturbance parameters. The fiber under test consists of four concatenated 20 km spools of standard single-mode fiber (SMF-28), totaling 80 km of optical path. These spools are mounted on optical shelves with bare fiber sections exposed at the junctions between spools (every 20 km). These exposed sections allow for localized application of controlled disturbances at known positions along the fiber, which is essential for validating localization algorithms. The entire setup is housed in a temperature-controlled environment to minimize baseline drift due to thermal fluctuations.
5.2. Disturbance Generation Mechanisms
To evaluate the system’s sensitivity to different types of physical events, we implemented three distinct disturbance mechanisms:
- 1.
- Acoustic Excitation: A 5 W computer speaker is positioned adjacent to a 1 m section of bare fiber. The fiber is taped to the speaker membrane to ensure efficient coupling of acoustic vibrations. We generated two types of acoustic signals: (a) classical music (Beethoven’s Symphony No. 5) to represent broadband, structured acoustic energy; and (b) Finnish heavy metal music to represent high-intensity, complex harmonic content. These contrasting signals allow us to test the system’s ability to discriminate between different acoustic profiles.
- 2.
- Mechanical Perturbation: A manual polarization controller (often called “Mickey Mouse ears” due to its appearance) is attached to a 1 m fiber section. By rotating the controller’s paddles, we induce controlled bending and stress in the fiber, mimicking the effects of physical manipulation or tampering attempts. This type of disturbance primarily affects the polarization state of the light rather than its phase, testing the system’s sensitivity to polarization changes.
- 3.
- Localized Tapping: To simulate intrusion attempts on buried fiber, we developed a solenoid-based tapping mechanism that applies brief mechanical impulses to the fiber at precise intervals. The solenoid is driven by a programmable microcontroller that controls the timing, duration, and force of the taps. This disturbance type tests the system’s ability to detect transient events with rapid onset times.
5.3. Data Collection Protocol
For the preliminary results presented in this paper, we focused on acoustic excitation experiments where the data was collected under two conditions: (1) baseline (no acoustic excitation), and (2) with classical music playing through the speaker. For each condition, we recorded approximately 10 million samples at 15 MS/s, corresponding to roughly 0.67 s of data. This time span is sufficient to capture several hundred 50 kHz dither periods and to demonstrate clear separability between baseline and disturbed conditions, but it does not probe the behaviour of the system over longer durations such as minutes or hours. The data was saved in HDF5 format with the following structure:
- /error_signal: Raw PKD output samples
- /polarization: Polarization state indicators (0 for horizontal, 1 for vertical)
- /timestamp: Sample timestamps relative to experiment start
- /metadata: Experimental parameters (dither frequency, laser power, temperature, etc.)
Two datasets were analyzed: locked_PKD.h5 (baseline) and locked_PKD_dual_pol_6_ with_music.h5 (with acoustic excitation). From each dataset, we extracted 100,000 consecutive samples for analysis—a contiguous subset chosen to balance computational requirements with an initial indication of statistical separability. The remaining samples (up to 10M per condition) were not analyzed in this preliminary study, and a more exhaustive evaluation using multiple independent windows is left for future work.
5.4. Data Preprocessing and Feature Extraction
The raw error signal exhibits a strong periodic component at 50 kHz corresponding to the dither modulation. With a sampling rate of 15 MS/s, each dither period contains exactly 300 samples (). We leveraged this periodicity to structure the data. The 100,000 samples from each dataset were reshaped into a matrix of dimensions , where each row represents one dither period and each column represents a sample within that period. This reshaping effectively separates the fast-time dimension (samples within a period) from the slow-time dimension (sequential periods).
Thus, in the notation of Section 4.1, the resulting dual-polarization data cube has dimensions (dither periods), (samples per period), and (polarization channels). After we repeated this process for each polarization channel and concatenated the resulting matrices along a third dimension, this created the data cube .
5.5. Results
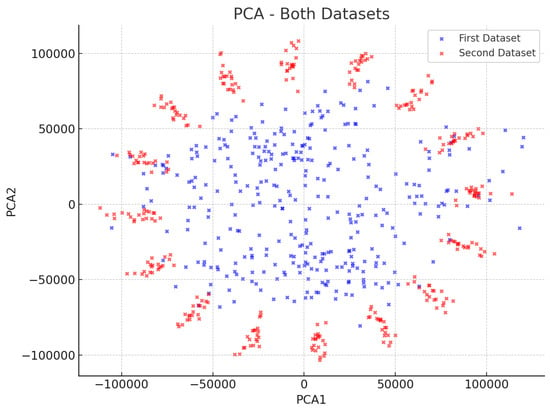
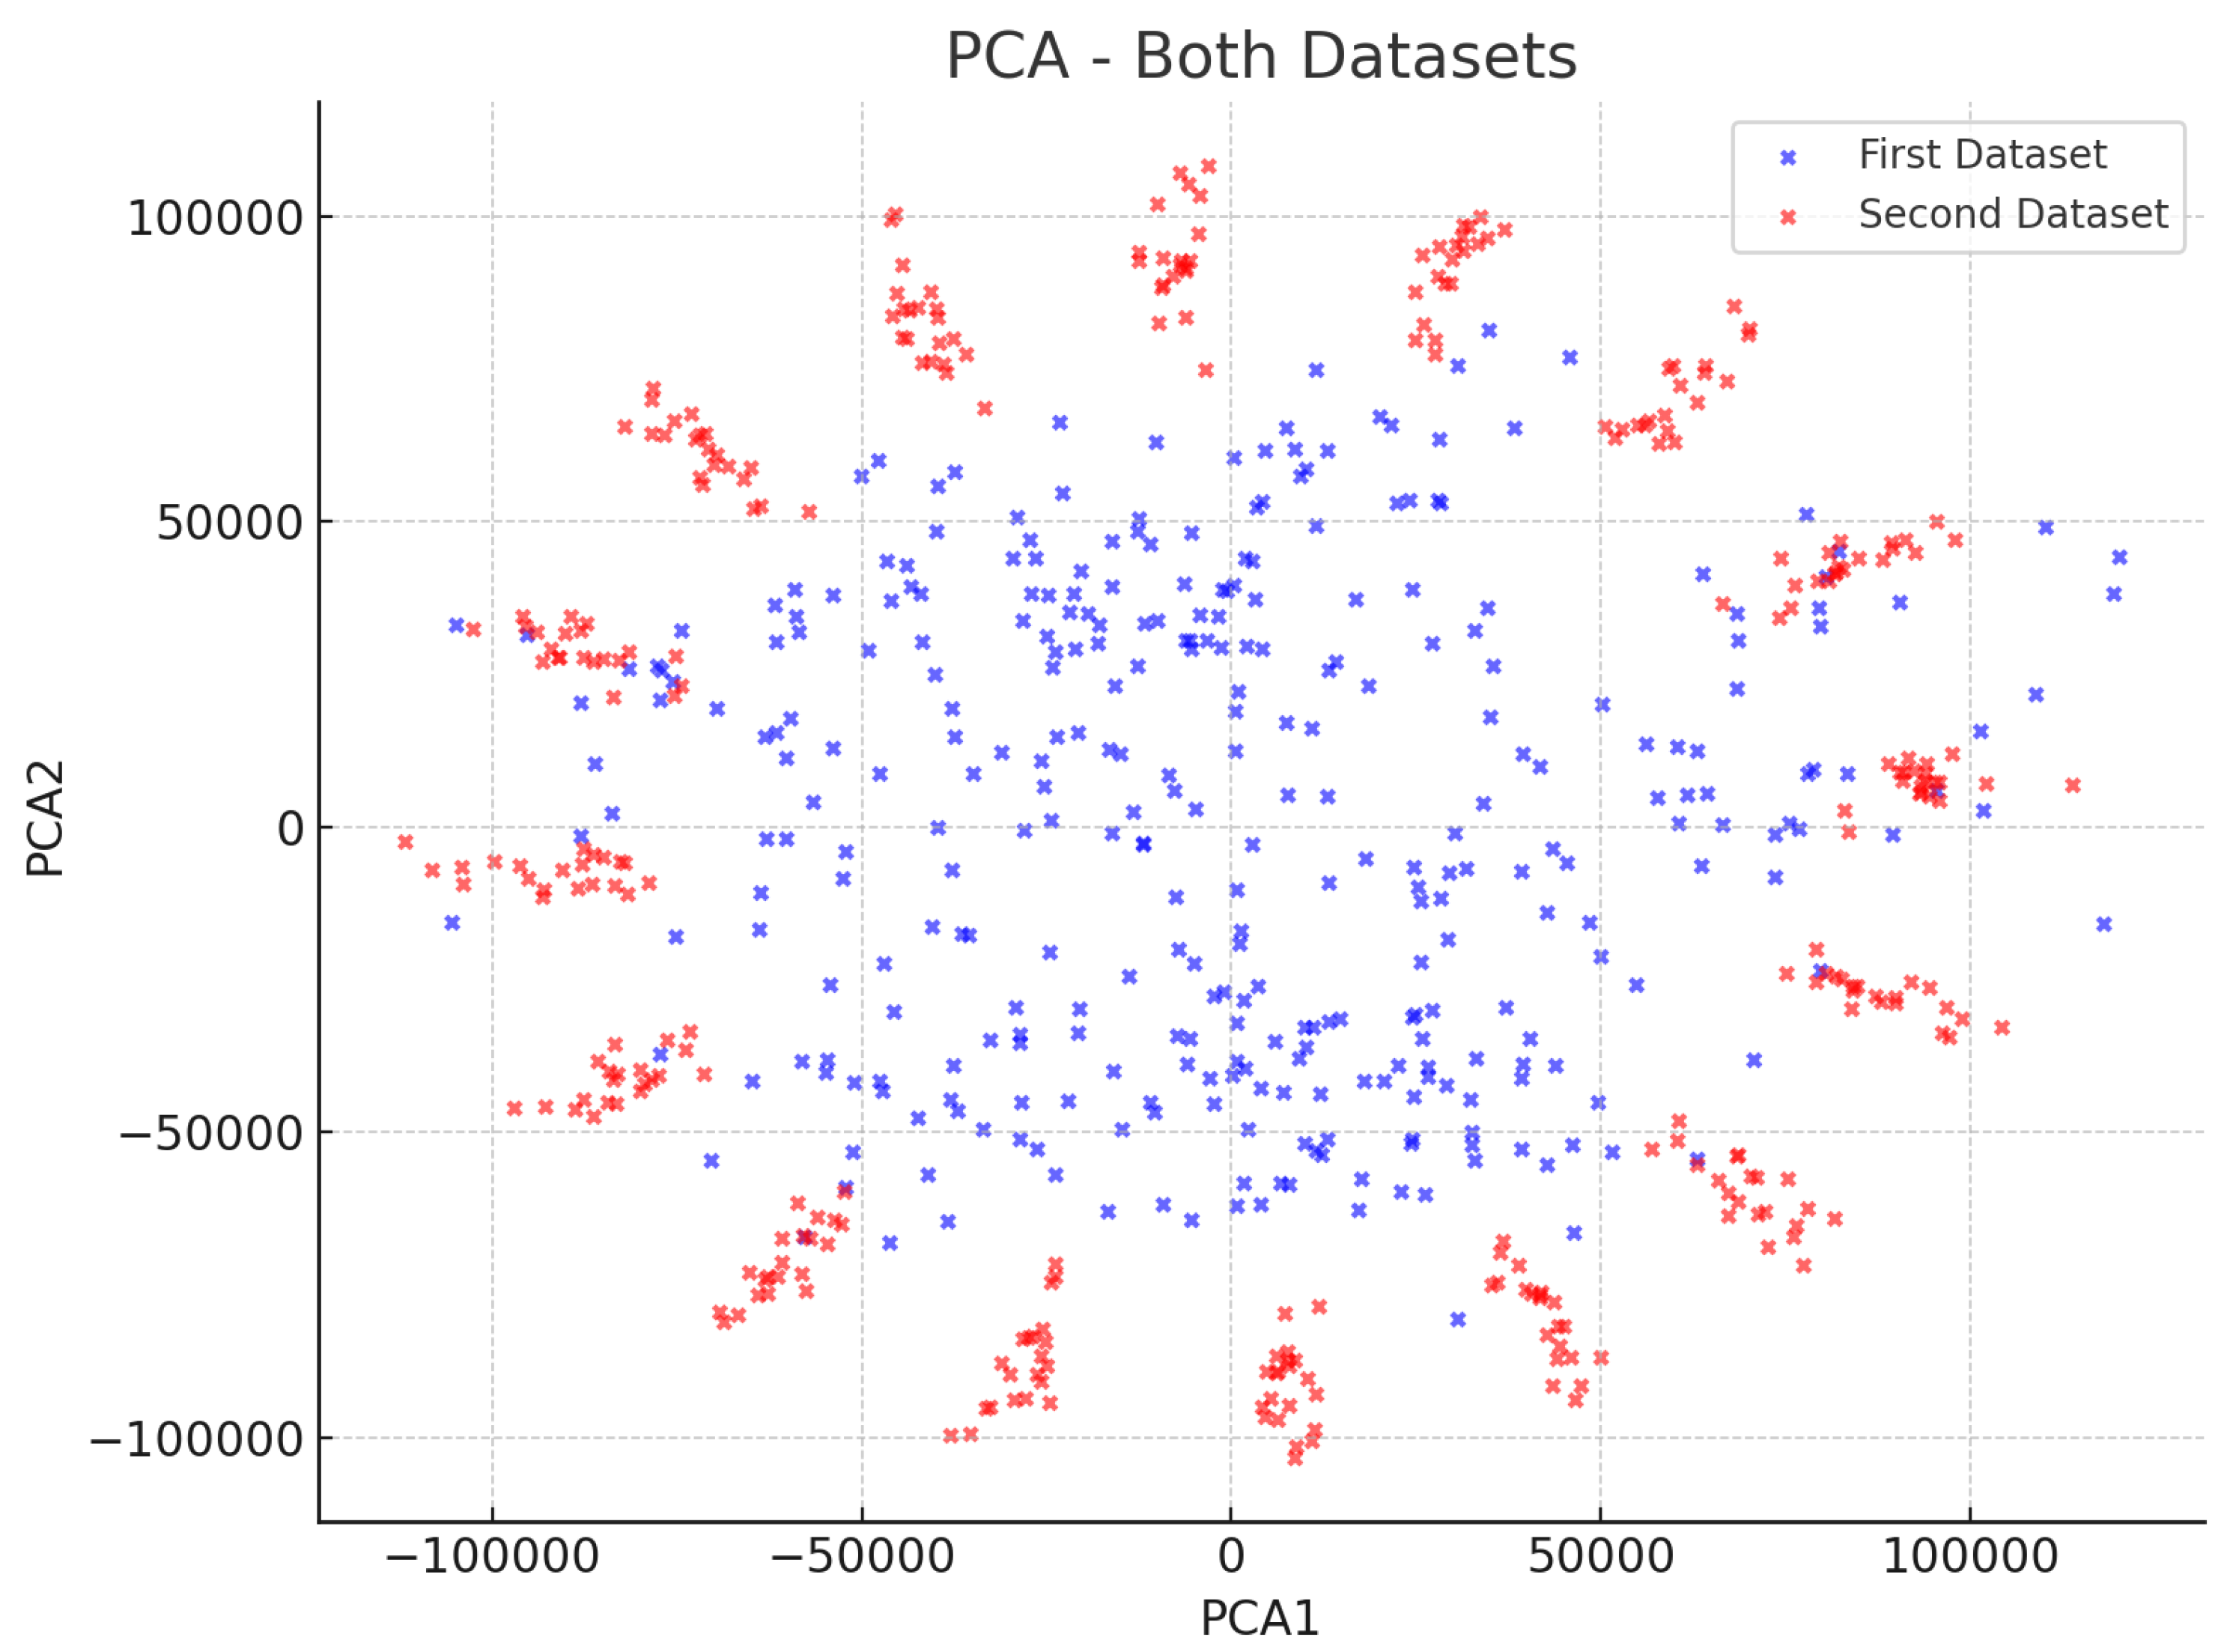
Figure 2 shows the projection of both datasets onto the first two principal components obtained through linear PCA. The baseline data (blue points) forms a relatively compact cluster near the origin, while the music-excited data (red points) is more dispersed and shifted along the first principal component axis. This clear separation demonstrates that the acoustic excitation produces a detectable signature in the error signal that is distinct from the baseline noise floor.
Figure 2.
Linear PCA projection showing clear separation between baseline (blue) and music-excited (red) conditions. The first principal component (PC1) appears to capture most of the variance introduced by the acoustic disturbance.
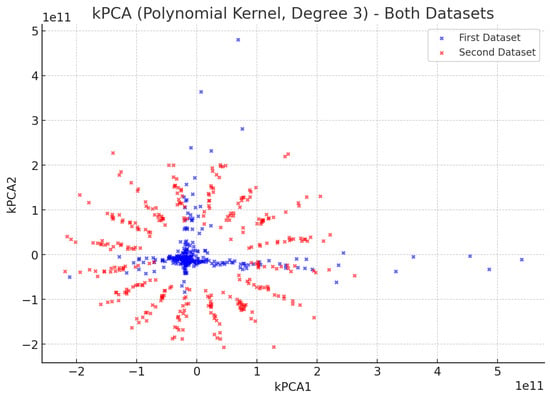
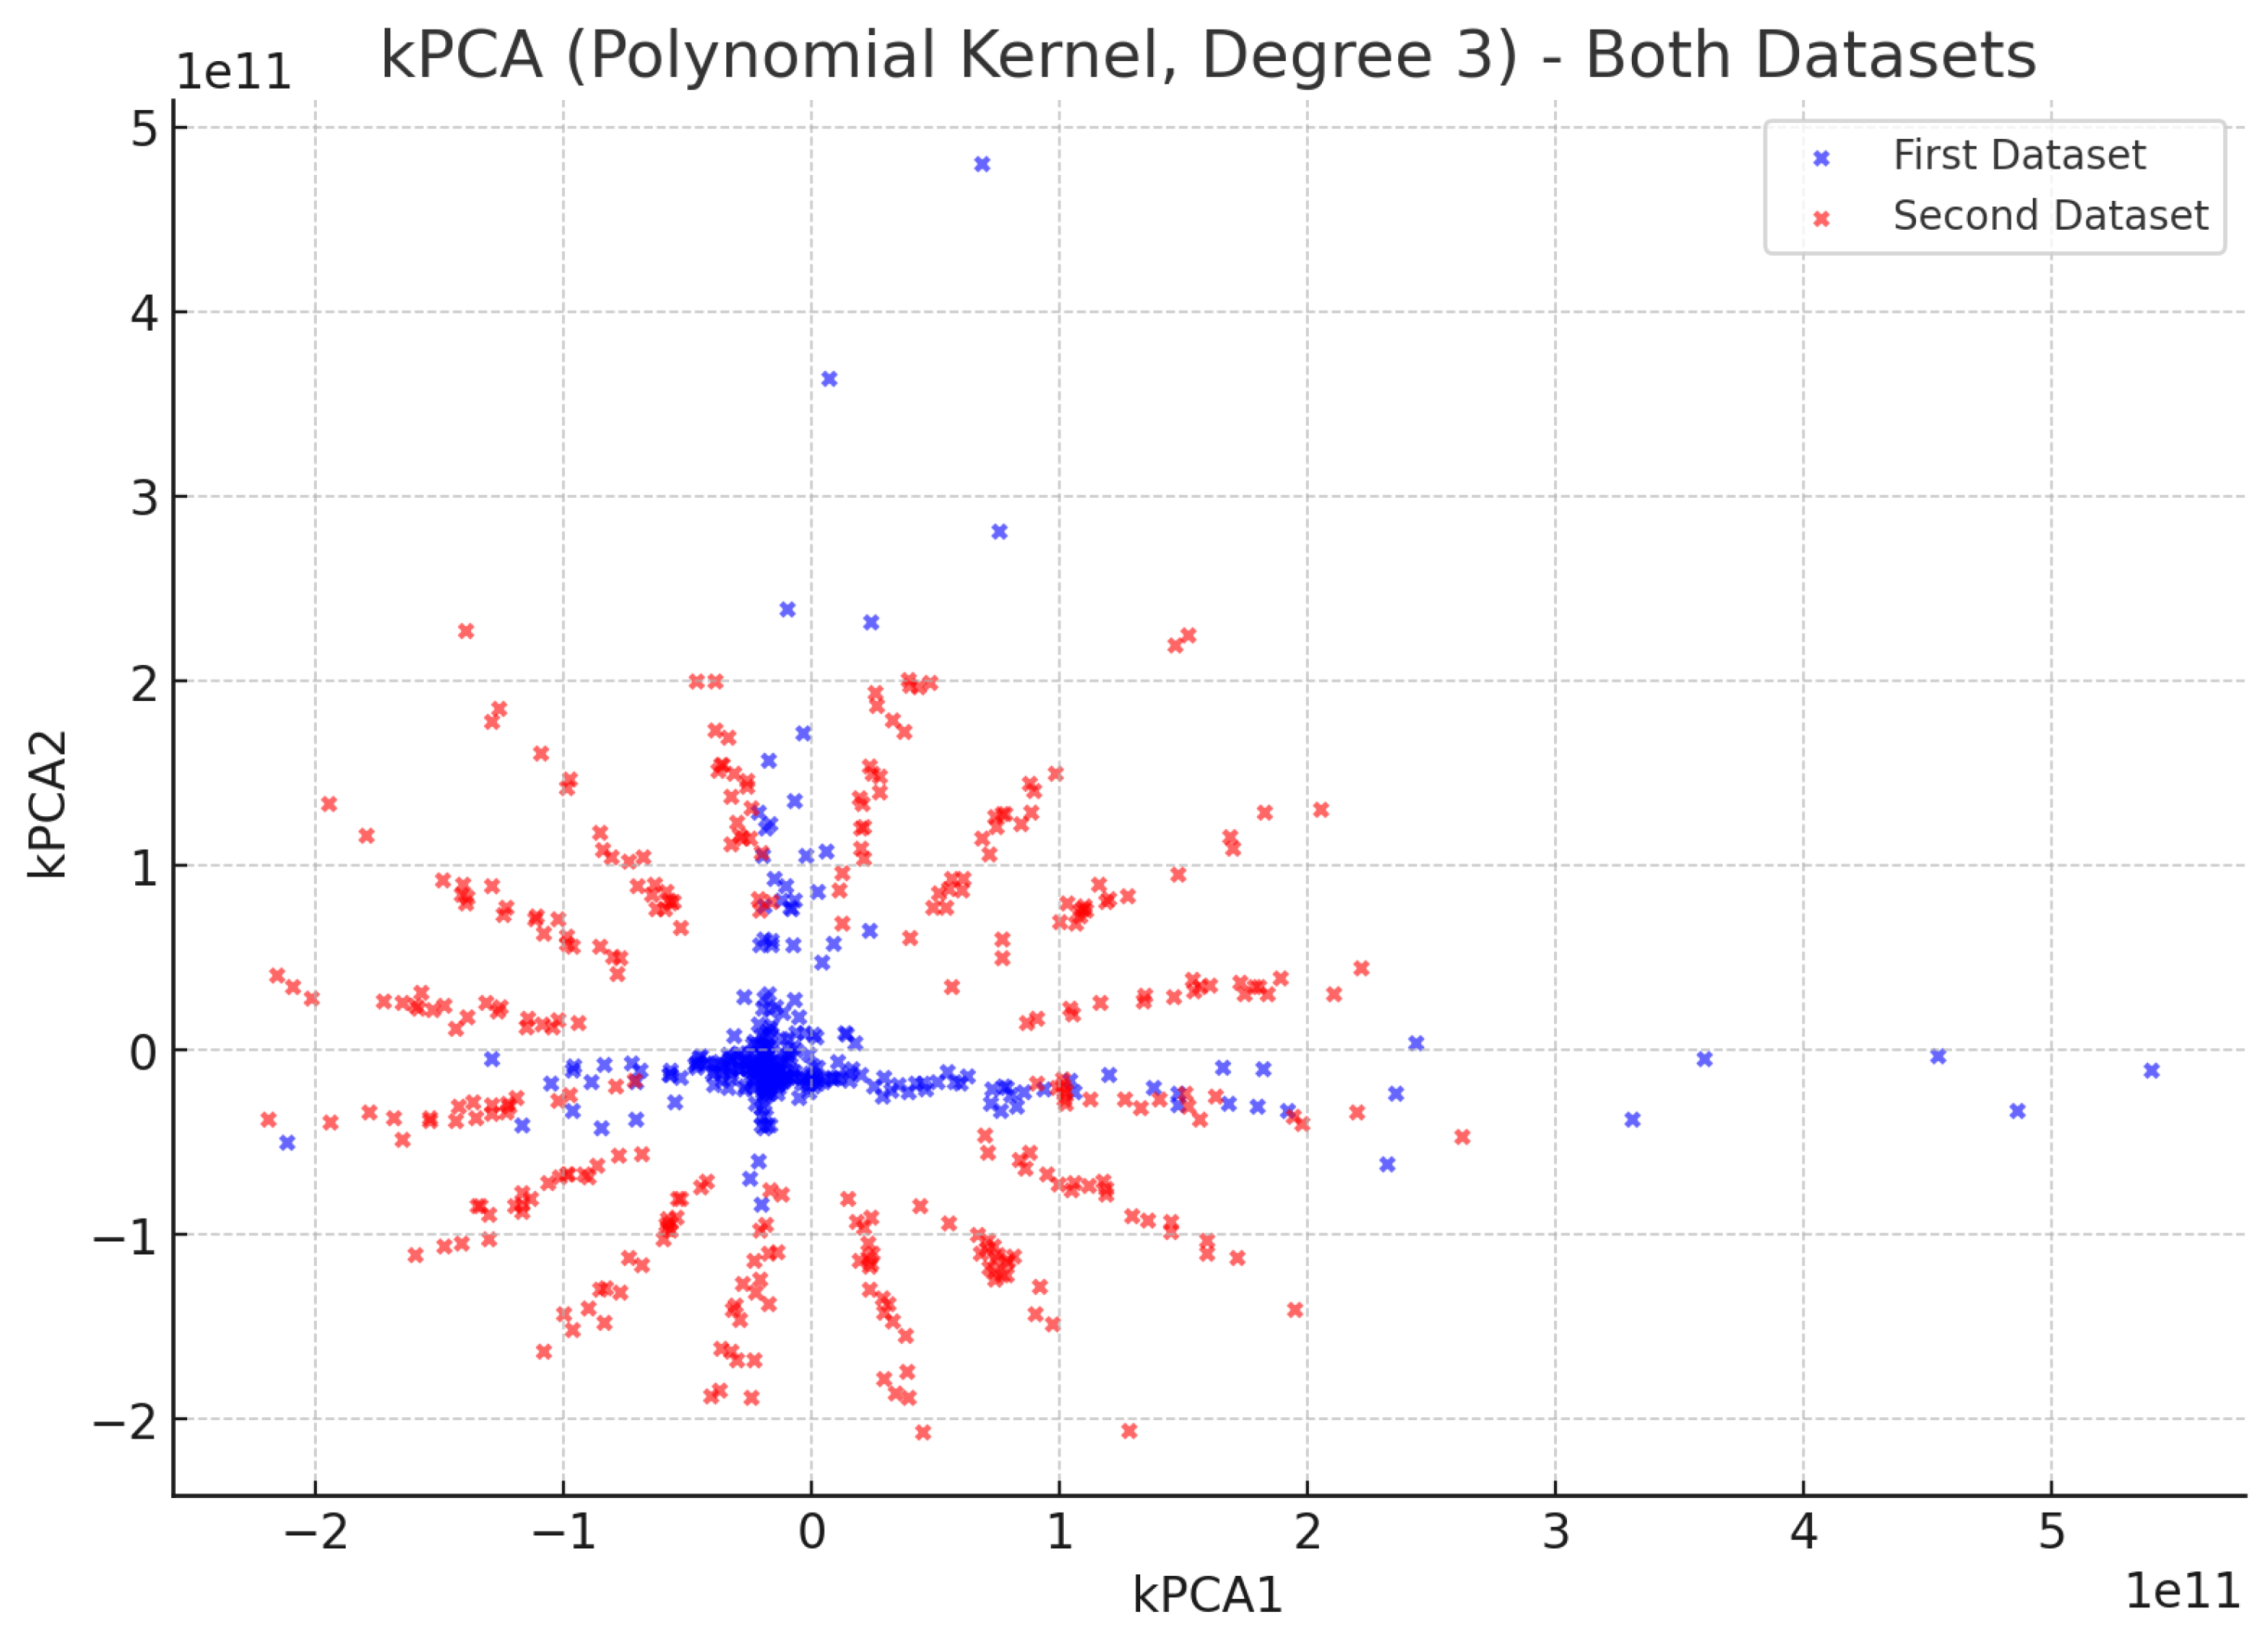
Figure 3 shows the results of kernel PCA with a polynomial kernel of degree 3. The nonlinear transformation reveals additional structure: the music-excited data forms several distinct subclusters rather than a single dispersed cloud. We hypothesize that these subclusters may correspond to different musical passages or beat patterns within the classical music piece, but we emphasize that this interpretation is preliminary. For example, the cluster near (kPC1 = 0.5, kPC2 = 0.2) could be associated with a loud crescendo, while (kPC1 = −0.3, kPC2 = −0.4) could reflect a quieter passage. Without controlled experiments using simple sinusoidal excitations at known frequencies, it is not yet possible to establish a one-to-one mapping between musical structure and subcluster position, however this gives vital insights on viability of the proposed solution. The observed finer structure should therefore be regarded as suggestive evidence that kPCA can reveal additional disturbance characteristics beyond mere presence/absence, rather than a definitive classification.
Figure 3.
Kernel PCA projection using a polynomial kernel of degree 3. The nonlinear transformation reveals additional structure not captured by linear PCA, with the music-excited data forming multiple distinct subclusters that may correspond to different musical passages or beat patterns.
We emphasize that in this work PCA and kPCA are used solely for exploratory visualization and dimensionality reduction. While the observed separation and subcluster structure indicate that simple decision boundaries in the reduced space could distinguish baseline and disturbed conditions, we do not claim to have implemented or validated such classifiers here. A complete machine-learning pipeline, including supervised training, cross-validation, and receiver-operating-characteristic analysis, is beyond the scope of this initial proof-of-concept study.
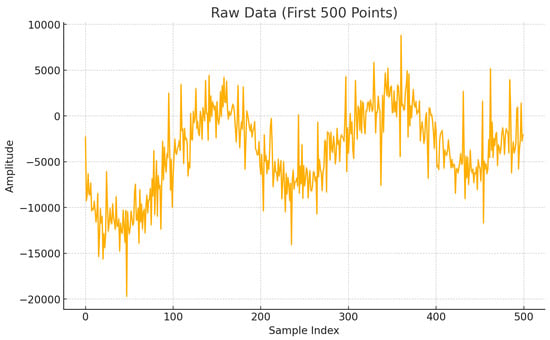
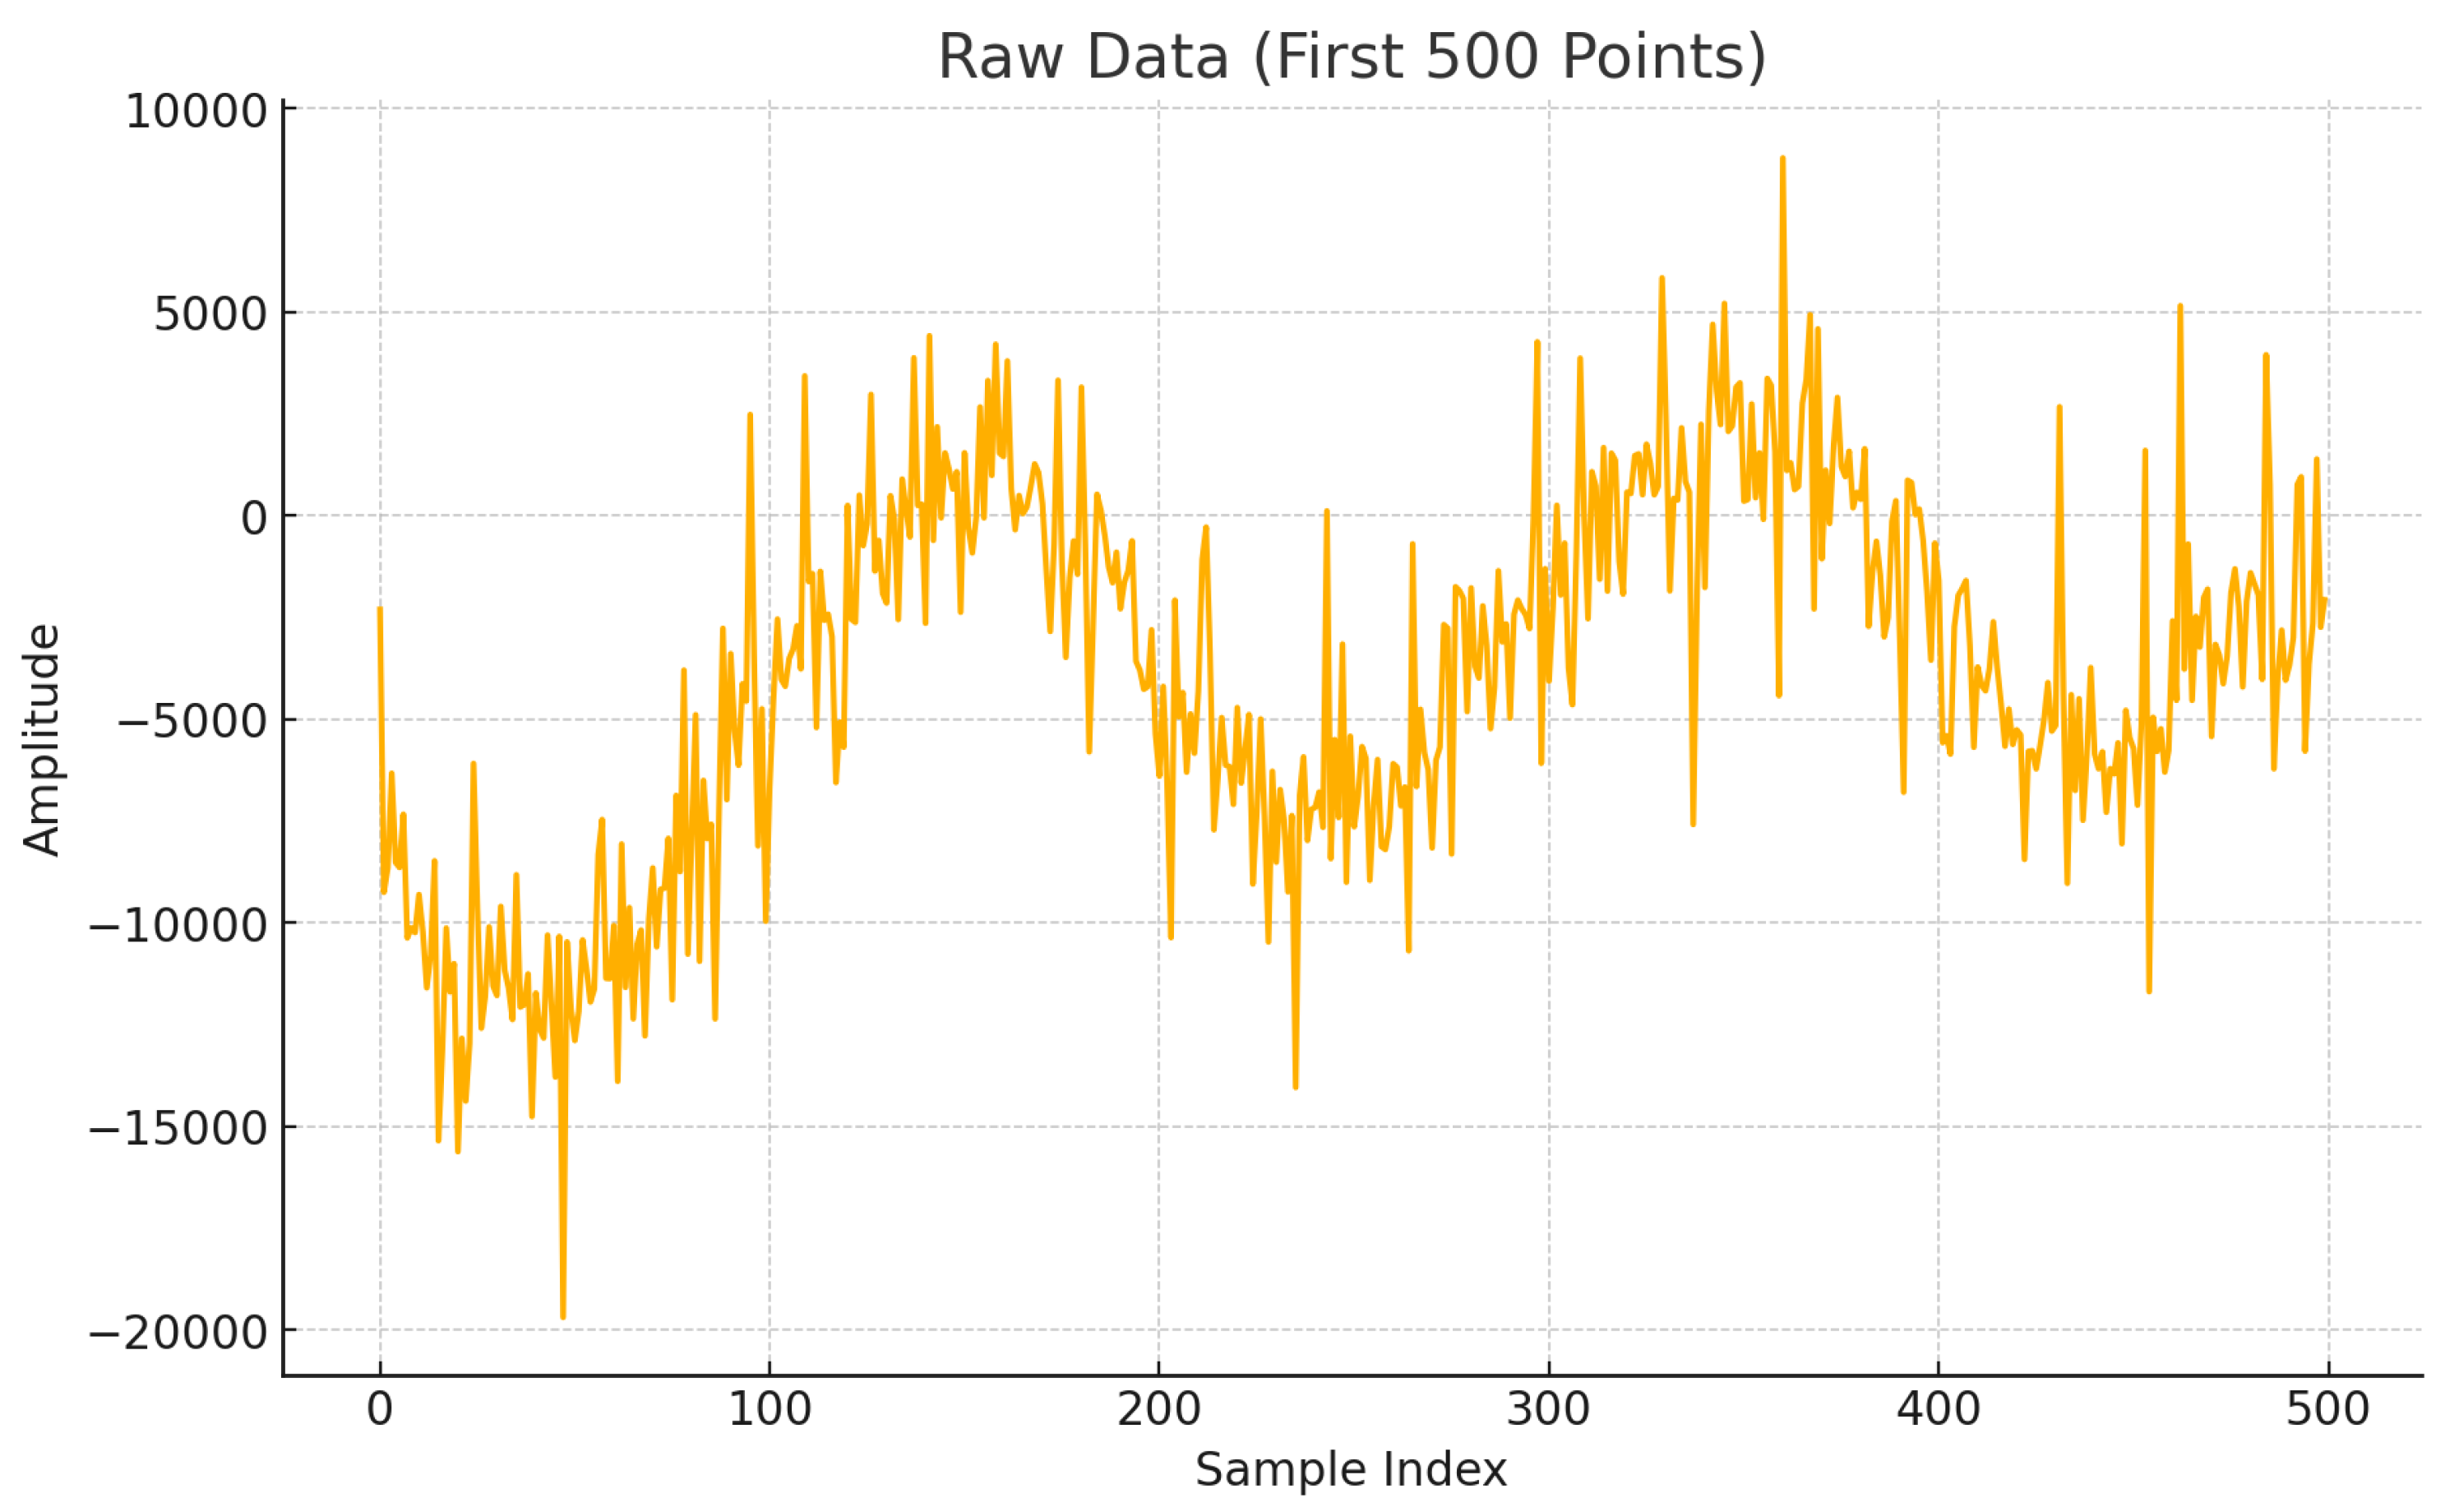
Figure 4 shows a segment of the raw error signal for the music-excited condition. The 50 kHz dither modulation is clearly visible as the dominant periodic component. Superimposed on this are lower-frequency modulations that correspond to the acoustic excitation. Visual inspection suggests that the acoustic modulations have a complex, quasi-periodic structure that reflects the musical content—a hypothesis that will be tested in the future work through time-frequency analysis and correlation with the audio signal.
Figure 4.
Raw error signal (first 500 samples, approximately 33 s) for the music-excited condition. The dominant 50 kHz dither modulation (period = 20 s) is clearly visible as the regular oscillation. Superimposed amplitude variations at lower frequencies (approximately 1 kHz) correspond to the acoustic excitation from the music. The complex envelope suggests that multiple frequency components are present, reflecting the rich harmonic content of the classical music piece.
5.6. Interpretation and Limitations
The clear separability between baseline and disturbed conditions in both PCA and kPCA spaces provides strong initial validation of our core hypothesis: physical disturbances do indeed produce detectable signatures in the error signal from the MLL locking system. However, several important limitations and questions remain:
First, the 50 kHz dither periodicity, while useful for data structuring, may not be optimal for all disturbance types. Some disturbances may have characteristic frequencies close to 50 kHz or its harmonics, leading to aliasing or masking effects. Future experiments will explore different dither frequencies and waveforms to optimize sensitivity across a broad frequency range.
Second, the current analysis uses only a small subset of the available data (100 k samples out of 10 M) taken as a single contiguous block. This choice simplifies computation but necessarily introduces temporal correlation between successive dither periods due to the 50 kHz modulation and the finite response of the locking control loop. As a result, the individual rows of the data cube cannot be considered fully independent realizations of the disturbance. While the observed separation between baseline and disturbed conditions in PCA/kPCA space is encouraging, a more comprehensive analysis employing multiple non-overlapping windows, explicit modeling of temporal correlation, and full statistical characterization of detection probability versus false-alarm rate will be required to rigorously establish robustness. We regard this as an important direction for future work rather than a completed contribution of the present study. In addition, the present datasets span only sub-second intervals. While the laboratory fiber and the stabilized mode-locked laser configuration suggest that the baseline statistics should remain approximately stationary over longer timescales, this has not yet been empirically verified. A rigorous assessment of temporal stationarity, including slow environmental drifts and potential changes in disturbance statistics over minutes to hours, will require extended measurements and is therefore designated as future work.
Third, the clustering observed in kPCA space, while intriguing, requires further investigation, and we plan to conduct experiments with precisely controlled sinusoidal acoustic signals at known frequencies to establish a ground truth mapping between disturbance characteristics and position in the reduced space.
Despite these limitations, the preliminary results are highly promising and justify continued development of this sensing approach.
6. Discussion and Future Work
6.1. Interpretation of Preliminary Results in Context
The clear separation between baseline and disturbed conditions in PCA/kPCA space (Figure 2 and Figure 3) validates the fundamental premise of our approach that the error signal from a phase-locked MLL system contains detectable signatures of physical disturbances. However, several aspects require deeper interpretation. This structuring also implies that adjacent rows in the data cube share common dither and control-loop dynamics, which naturally induce temporal correlation across slow-time indices. The present results should therefore be interpreted as demonstrating consistent signatures within a correlated sequence rather than fully independent samples; a detailed treatment of temporal correlation and long-term statistics is deferred to future work. While this structuring was convenient for initial analysis, it may not be optimal for all disturbance types. Future work will explore alternative data representations that better separate dither effects from disturbance signatures, such as synchronous averaging to remove the dither component or adaptive filtering techniques.
The multiple subclusters observed in the kPCA projection (Figure 3) are particularly intriguing and suggest that different musical passages may produce distinct signatures. At this stage, however, this remains a hypothesis. Confirmation will require controlled experiments with precisely defined acoustic inputs, as outlined in Section 6.2. Until such studies are completed, we interpret the subcluster structure as an indication of the richness of the reduced-space representation rather than as proof of fine-grained event classification. This raises the possibility of not just detecting disturbances, but classifying them into fine-grained categories (e.g., distinguishing between different types of machinery based on their acoustic signatures).
6.2. Proposed Future Experiments
To advance from proof-of-concept to a validated sensing technology, we propose the following experimental campaigns.
- 1.
- Localization validation: Apply controlled disturbances at precisely known positions (every 20 km along the 80 km fiber) and evaluate the accuracy of our localization algorithms. This will establish baseline performance metrics and identify limiting factors.
- 2.
- Multi-event discrimination: Apply two or more simultaneous disturbances at different locations and with different characteristics (e.g., acoustic at 20 km, mechanical at 60 km). Test the system’s ability to detect, classify, and localize all events correctly.
- 3.
- Field trial: Deploy the system on an existing underground fiber link (with appropriate permissions). Conduct controlled disturbance tests using vehicle passes, excavation equipment, and other realistic scenarios. Compare performance with conventional DAS systems installed on adjacent fibers.
- 4.
- Long-term stability test: Operate the system continuously for 30+ days to assess baseline drift, false alarm rates, and maintenance requirements. This is critical for understanding practical deployment considerations. This experiment is also intended to quantify temporal stationarity of the sensing performance over practical deployment timescales.
7. Conclusions
This paper has presented a novel forward-sensing architecture that combines ultra-short pulse laser locking, coherent detection, and multi-dimensional signal analysis for detecting physical events of interest. The core innovation lies in treating the error signal from a phase-locked MLL system not as a noise source to be minimized, but as a rich information source encoding environmental disturbances. By structuring this error signal into a data cube spanning fast-time, slow-time, and polarization dimensions, we create a comprehensive representation of disturbance signatures that can be analyzed using machine learning techniques.
Our preliminary experiments demonstrate clear separability between baseline and acoustically disturbed conditions in both linear and kernel PCA spaces, validating the fundamental hypothesis that physical disturbances produce detectable signatures. We have proposed a mathematical framework for event localization that leverages chromatic dispersion and polarization mode coupling, opening a pathway toward practical distributed sensing with both detection and localization capabilities. At present this framework remains theoretical with limited validation using lab-based experiments. Thorough experimental validation of localization performance will require controlled multi-location disturbances as outlined in Section 6.2.
The potential applications of this technology are broad and impactful like critical infrastructure protection (pipelines, power grids, communication networks), environmental monitoring (seismic activity, landslide detection), and smart city applications (traffic monitoring, structural health monitoring). The proposed solution is more suitable for detection of an event of interest rather than to pose as a generic instrument. A key practical advantage is that it leverages existing fiber optic infrastructure and repurposes the error signal from a MLL locking system, so that no additional dedicated sensing fibers or separate DAS hardware need be installed. This can reduce incremental deployment cost relative to conventional DAS, although the requirement for a stabilized mode-locked laser and coherent receiver remains.
In addition, we acknoledge that the proposed localization framework based on chromatic dispersion and polarization mode coupling remains theoretical with limited experimental validation and requires controlled multi-location testing in future work. In future work we would also evaluate non-overlapping windows across the full dataset to account for temporal correlation instead of relying on a single contiguous 100 k subset out of 10 million.
Future work will focus on validating the localization framework, optimizing the system for edge deployment, and conducting field trials in partnership with infrastructure operators. The collaboration between academia and industry exemplified in this work provides a model for translating innovative photonics concepts into practical sensing solutions with real-world impact.
Author Contributions
Conceptualization, A.K.M. and E.W.; methodology, A.K.M. and E.W.; software, A.K.M. and V.B.; validation, A.K.M. and E.W.; formal analysis, A.K.M.; investigation, A.K.M. and E.W.; resources, E.W.; data curation, A.K.M. and E.W.; writing—original draft preparation, A.K.M.; writing—review and editing, A.K.M., V.B. and E.W. All authors have read and agreed to the published version of the manuscript.
Funding
The work was partially funded through project SPARC from the Government of India which funded the times of Amit Mishra spent in IIT Indore. The work was also in part supported by the University of Hradec Králové through the UHK Prestige Internal Grant Scheme for the preparation and submission of ERC and Horizon Europe proposals, under the project Secure and Resilient Industrial IoT Networks for Next-Generation Smart Manufacturing.
Data Availability Statement
The data collected was by industry-partnership and was propriotory data. Hence, we can not release it in public.
Acknowledgments
The authors gratefully acknowledge the support of the embedded systems team at CyberRidge for running the experiments for this work.
Conflicts of Interest
Amit Kumar Mishra is currently employed by RC Fornax. RC Fornax had no involvement in this study. Eyal Wohlgemuth is a co-founder of CyberRidge. CyberRidge provided experimental infrastructure, equipment, and technical support for conducting the experiments and collecting data, as described in the manuscript. CyberRidge did not direct the study design, data analysis, interpretation of the results, manuscript preparation, or the decision to submit the manuscript for publication. The authors declare no other conflicts of interest.
References
- Zhong, Z.; Liu, K.; Xue, H.; Jun, L. Review of fiber-optic distributed acoustic sensing technology. Instrumentation 2019, 6, 4. [Google Scholar]
- Hill, D. Distributed acoustic sensing (DAS): Theory and applications. In Proceedings of the Frontiers in Optics, San Jose, CA, USA, 18–22 October 2015; p. FTh4E-1. [Google Scholar]
- Nolte, S.; Schrempel, F.; Dausinger, F. Ultrashort pulse laser technology. Springer Ser. Opt. Sci. 2016, 195, 1. [Google Scholar] [CrossRef] [Scilit]
- Dakin, J.P. Optical Fibre Sensors Principles And Applications. Fibre Opt. 83 1983, 374, 172–182. [Google Scholar] [CrossRef] [Scilit]
- Wang, Z.; Li, J.; Fan, M.; Zhang, L.; Peng, F.; Wu, H.; Zeng, J.; Zhou, Y.; Rao, Y. Phase-sensitive optical time-domain reflectometry with Brillouin amplification. Opt. Lett. 2014, 39, 4313–4316. [Google Scholar] [CrossRef] [Scilit] [PubMed]
- Bao, X.; Chen, L. Recent progress in distributed fiber optic sensors. Sensors 2012, 12, 8601–8639. [Google Scholar] [CrossRef] [Scilit] [PubMed]
- Soriano-Amat, M.; Martins, H.F.; Durán, V.; Martín-López, S.; González-Herráez, M.; Fernández-Ruiz, M.R. Time-expanded phase-sensitive optical time-domain reflectometry. Light. Sci. Appl. 2021, 10, 51. [Google Scholar] [CrossRef] [Scilit] [PubMed]
- Lesko, D.M.B.; Lind, A.J.; Hoghooghi, N.; Kowligy, A.; Timmers, H.; Sekhar, P.; Rudin, B.; Emaury, F.; Rieker, G.B.; Diddams, S.A. Fully phase-stabilized 1 GHz turnkey frequency comb at 1.56 µm. OSA Contin. 2020, 3, 2070–2077. [Google Scholar] [CrossRef] [Scilit] [PubMed]
- Dudley, J.M.; Taylor, J.R. Supercontinuum Generation in Optical Fibers; Cambridge University Press: Cambridge, UK, 2010. [Google Scholar]
- Fu, W.; Wright, L.G.; Sidorenko, P.; Backus, S.; Wise, F.W. Several new directions for ultrafast fiber lasers. Opt. Express 2018, 26, 9432–9463. [Google Scholar] [CrossRef] [Scilit] [PubMed]
- Tejedor, J.; Macias-Guarasa, J.; Martins, H.F.; Pastor-Graells, J.; Corredera, P.; Martin-Lopez, S. Machine learning methods for pipeline surveillance systems based on distributed acoustic sensing: A review. Appl. Sci. 2017, 7, 841. [Google Scholar] [CrossRef] [Scilit]
- Cuevas, A.R.; Fontana, M.; Rodriguez-Cobo, L.; Lomer, M.; López-Higuera, J.M. Machine learning for turning optical fiber specklegram sensor into a spatially-resolved sensing system. Proof of concept. J. Light. Technol. 2018, 36, 3733–3738. [Google Scholar] [CrossRef] [Scilit]
- Udem, T.; Holzwarth, R.; Hänsch, T.W. Optical frequency metrology. Nature 2002, 416, 233–237. [Google Scholar] [CrossRef] [Scilit] [PubMed]
- Mishra, A.K. CommSense: Radar system using existing communication infrastructure to sense the environment. In Proceedings of the 2015 25th International Conference Radioelektronika (RADIOELEKTRONIKA), Pardubice, Czech Republic, 21–22 April 2015; pp. 276–279. [Google Scholar]
- Bhatta, A.; Mishra, A.K. GSM-based commsense system to measure and estimate environmental changes. IEEE Aerosp. Electron. Syst. Mag. 2017, 32, 54–67. [Google Scholar] [CrossRef] [Scilit]
- Sardar, S.; Mishra, A.K.; Khan, M.Z.A. LTE commsense for object detection in indoor environments. IEEE Aerosp. Electron. Syst. Mag. 2018, 33, 46–59. [Google Scholar] [CrossRef] [Scilit]
- Jana, S.; Mishra, A.K.; Khan, M.Z.A. Opportunistic Drone Detection Using CommSense. IEEE Trans. Instrum. Meas. 2025, 74, 5501715. [Google Scholar] [CrossRef] [Scilit]
Disclaimer/Publisher’s Note: The statements, opinions and data contained in all publications are solely those of the individual author(s) and contributor(s) and not of MDPI and/or the editor(s). MDPI and/or the editor(s) disclaim responsibility for any injury to people or property resulting from any ideas, methods, instructions or products referred to in the content. |
© 2026 by the authors. Licensee MDPI, Basel, Switzerland. This article is an open access article distributed under the terms and conditions of the Creative Commons Attribution (CC BY) license.