


Simple Summary
Small eye melanomas can be difficult to distinguish from harmless pigmented spots in the back of the eye, called choroidal nevi. Because the risk of cancer spread increases as melanomas grow, early and accurate identification is important, but unnecessary referrals and treatment should also be avoided. Tools that support non-expert clinicians in deciding which lesions need specialist evaluation are therefore increasingly important. In this study, we compared two such tools: the MOLES scoring system, which is manually applied using several eye imaging methods, and MelAInoma, an artificial intelligence system that analyzes a single color photograph of the eye. We examined how closely the two methods agree and how well each is associated with expert diagnosis of melanoma. Both tools were useful, but they captured partly different information. MelAInoma showed a slightly stronger association with diagnosis despite using less imaging data, suggesting a potential role as a complementary aid for lesion triage.
Abstract
Background: Early identification of small choroidal melanomas is important, as metastatic risk increases with tumor size. However, distinguishing small melanomas from benign choroidal nevi is challenging and may lead to unnecessary referrals and overtreatment. Both the MOLES scoring system and the deep learning algorithm MelAInoma have been developed to support assessment of pigmented choroidal lesions in non-expert settings. This study aims to compare the association between MOLES and MelAInoma scores and to assess their relative association with expert melanoma versus nevus diagnosis. Methods: In this retrospective cohort study, 86 patients with small pigmented choroidal lesions (29 melanomas and 57 nevi) diagnosed at a national ocular oncology referral center were included. MOLES scores were assigned by ocular oncologists based on multimodal examination, whereas MelAInoma scores were generated solely from color fundus photographs. Associations between scores were assessed using linear regression and the Jonckheere–Terpstra test. Univariable and multivariable binary logistic regression was used to evaluate associations with melanoma diagnosis. Results: MelAInoma scores increased monotonically with higher MOLES categories (p = 0.0001). Linear regression showed a statistically significant association between MOLES and MelAInoma scores, but with substantial dispersion (R2 = 0.16). In univariable logistic regression, both MOLES and MelAInoma scores were associated with increased odds of melanoma diagnosis. MelAInoma showed a stronger association with diagnosis than MOLES (R2 = 0.38 vs. 0.27). In multivariable analysis including both scores, each remained independently associated with melanoma diagnosis. Conclusions: Both MOLES and MelAInoma are effective for differentiating small choroidal melanomas from nevi. Although the scores are statistically associated, they capture partly distinct information. MelAInoma demonstrates slightly stronger association with melanoma diagnosis and provides fully reproducible output, supporting its role as a complementary aid in lesion triage.
1. Introduction
The risk of metastasis in uveal melanoma is strongly correlated with tumor size [1,2,3]. Accurate identification of melanomas when they are as small as possible could therefore be one of the most effective ways to improve survival in this aggressive disease [4,5,6], with 10-year metastasis rates ranging from 6 to 51% for tumors 0–1 mm versus >10 mm in thickness, respectively [1]. However, small choroidal melanomas may be difficult to distinguish from benign pigmented choroidal lesions, which are common in the general population and affect more than 5% of individuals of Caucasian descent [7,8,9]. Efforts to detect and treat choroidal melanomas at an early stage may therefore result in overdiagnosis and treatment of harmless lesions with potentially severe consequences for visual function [10,11,12]. At the same time, delayed referral or misclassification of early melanoma as a benign lesion can postpone treatment in patients who do require prompt specialist care [13,14].
In Sweden, opticians frequently use optical coherence tomography (OCT) and fundus photography in routine practice [15]. OCT is a noninvasive cross-sectional imaging technique of the retina and choroid that can help detect lesion-associated findings such as subretinal fluid [16,17]. Together with widespread screening for diabetic retinopathy and frequent examinations or treatment for age-related macular degeneration (AMD) or cataract, this has led to detection of an increasing number of incidental pigmented choroidal lesions [18]. As a consequence, a growing number of patients are referred to ocular oncologists, including many false-positive cases. This may pose a challenge, as ocular oncology is a highly specialized field with limited resources, and excessive referrals may delay assessment of patients who truly require intervention.
To support triage of pigmented choroidal lesions, we have developed a deep learning algorithm, MelAInoma, which estimates the probability that a lesion represents a melanoma based on fundus photographs [19]. The intended use is decision support for clinicians who assess pigmented choroidal lesions with varying frequency and expertise, including opticians, optometrists, general ophthalmologists, and subspecialized ocular oncologists. By providing a reproducible photo-based risk estimate, such support may help reassure patients with benign lesions, facilitate accurate detection and referral of the smaller subset of melanomas, and reduce unnecessary referrals and associated resource use in the healthcare system. In prior evaluations, including testing on independent cohorts with an external test set, MelAInoma achieved higher diagnostic accuracy than ocular oncologists, consultant ophthalmologists, and resident ophthalmologists when classifying fundus images, using multimodal expert assessment as reference [19]. When applied by opticians and optometrists, MelAInoma quadrupled the odds of correctly referring a melanoma, reduced false-positive referrals tenfold, and provided net clinical benefit compared with unaided triage [15].
In contrast, the MOLES system is a well-established, manually applied scoring system designed to support non-expert monitoring of pigmented choroidal lesions and referral decisions [20,21]. MOLES is widely used by opticians and ophthalmologists, and was developed to provide a structured assessment based on five features associated with choroidal melanoma (Mushroom shape, Orange pigment, Large size, Enlarging tumor, and Subretinal fluid), each scored as absent, borderline, or present, and to translate this into risk categories with corresponding management recommendations [20,21]. By assessing and grading five visual risk factors for growth, lesions are classified as common nevus, low-risk nevus, high-risk nevus, or probable melanoma [21]. Several studies have evaluated MOLES in ocular nevus clinics and tertiary referral cohorts, generally reporting high sensitivity for identifying lesions requiring specialist assessment [20,21,22,23,24]. Unlike MelAInoma, MOLES relies on examiner recognition of clinical and imaging features and may therefore be influenced by observer experience and available imaging modalities. Here, MOLES was scored by subspecialized ocular oncologists to benchmark the manual system against experienced graders, reducing the risk that any difference versus MelAInoma could be attributed to limited familiarity with MOLES among non-expert users; we have evaluated MOLES performance in optician/optometrist triage separately [15].
In the present study, we compare MOLES scores assigned by ocular oncologists with MelAInoma scores generated from fundus photographs. Our aims are to examine whether MOLES and MelAInoma scores correlate and to assess which of the two is more strongly associated with expert classification of choroidal melanoma versus choroidal nevus.
2. Materials and Methods
2.1. Patients and Lesions
This study included a cohort of 86 patients with one pigmented choroidal lesion each, diagnosed as either small choroidal melanoma or choroidal nevus at St. Erik Eye Hospital, Stockholm, Sweden. This study was approved by the Swedish Ethical Review Authority (reference 2025-05054-01) and adhered to the tenets of the declaration of Helsinki. None of the included lesions underwent biopsy or histopathologic confirmation; diagnoses were based on clinical multimodal assessment by subspecialized ocular oncologists.
Inclusion criteria were as follows:
- Age >18 years at the time of examination.
- Fundus photograph obtained after 1 January 2010, corresponding to a period when medical records were fully digitalized, facilitating reliable assessment of follow-up.
- Diagnosis of either choroidal melanoma (International Classification of Diseases, 10th Revision [ICD-10] code C69.3) or choroidal nevus (ICD-10 code D31.3).
- Diagnosis established by a subspecialized ocular oncologist.
- For lesions classified as nevi at the time of photography, a minimum of 5 years of follow-up without reclassification as melanoma was required. Lesions that were diagnosed as melanoma at a later time point (e.g., due to documented growth) were classified as melanomas in the present study. This criterion was applied to facilitate detection of early signs of malignancy at a stage when small melanomas are difficult to distinguish from nevi.
Exclusion criteria were:
- Fundus photographs of insufficient quality, where factors such as poor focus, motion artifacts, over- or underexposure, or reflections prevented reliable assessment of lesion extent or the presence of features such as orange pigment or drusen. Minor image imperfections that did not impede assessment (e.g., focal blur or limited overexposure) were not sufficient for exclusion.
- Photographs in which less than half of the lesion was visible, acknowledging the limitation in accurately estimating the extent of the non-visible portion.
- Lesions obscured by retinal detachment, vitreous hemorrhage, or similar conditions.
The included lesions were imaged using either a standard-field fundus camera (45° field of view; Canon Medical Systems Europe B.V., Amstelveen, The Netherlands; n = 55) or an ultra-widefield camera (pseudocolor images covering 200°; Optos Inc., Dunfermline, Scotland; n = 31). This cohort has been described in detail previously, including the multimodal diagnostic workup used by ocular oncologists, as it was employed as a test cohort during the development and validation of the MelAInoma algorithm [19]. The cohort was not used for development or training of the MelAInoma deep learning model.
2.2. MOLES
MOLES is a clinical scoring system based on five features: Mushroom shape, Orange pigment, Large size, Enlarging tumor, and Subretinal fluid. Each feature is assigned a score of 0, 1, or 2, reflecting absence, borderline presence, or definite presence [20,21]. Mushroom shape is highly suggestive of choroidal melanoma and is included to ensure referral even in absence of other suspicious features. Orange pigment has been identified as an important risk factor for growth of melanocytic lesions, despite occurring in other choroidal conditions [25,26]. Large size is included because most choroidal nevi are small; in population-based studies, the mean largest basal diameter is approximately 1.25 mm, only a minority exceed 5.5 mm, and increased thickness is associated with a higher risk of future growth [27]. Although choroidal nevi may enlarge slowly over an extended period, more rapid growth is suggestive of malignant transformation [28]. Subretinal fluid is also included, as it has consistently been associated with lesion growth. Based on the total score, lesions are categorized as common nevus (score 0), low-risk nevus (score 1), high-risk nevus (score 2), or probable melanoma (score > 2) [21]. In this study, all MOLES scores were assigned by ocular oncologists at St. Erik Eye Hospital, with access to multimodal imaging for each lesion to assess the presence of risk factors, such as OCT for detection of subretinal fluid and autofluorescence for identification of orange pigment. In contrast, MelAInoma scores were based solely on analysis of color fundus photographs of the lesion.
2.3. Statistical Analyses
Associations between MOLES score and MelAInoma score were evaluated using linear regression. As MOLES score is an ordinal variable and MelAInoma score is continuous, an ordered trend was additionally assessed using the Jonckheere–Terpstra test, which does not assume normality. To evaluate the association between each score and diagnostic outcome, binary logistic regression was performed with true diagnosis (melanoma vs. nevus) as the dependent variable. Odds ratios (ORs) with 95% confidence intervals (CI) were reported. MelAInoma score and MOLES score were also entered simultaneously as predictors in a multivariable logistic regression model. No interaction terms or variable transformations were included. Model fit was assessed using the Akaike Information Criterion corrected for small sample size (AIC) and by evaluation of calibration with the Hosmer–Lemeshow test. MelAInoma scores were generated by loading fundus photographs into the MelAInoma software (v0.1; Eyedentity AB, Stockholm, Sweden), which outputs a probability between 0 and 1 that the lesion represents a melanoma. All statistical tests were two-sided, except the Jonckheere–Terpstra test, which was prespecified as one-sided to test for an increasing trend of MelAInoma scores with higher MOLES categories; a significance level of p < 0.05 was used. Data management and statistical analyses were performed using R v4.4.3 (R Foundation for Statistical Computing, Vienna, Austria) and GraphPad Prism v10.6.1 (GraphPad Software, San Diego, CA, USA).
3. Results
3.1. Descriptive Statistics
The study included 86 patients with 86 pigmented choroidal lesions, of whom 48 (56%) were female. Of the 86 lesions, 57 (66%) were diagnosed as nevi and 29 (34%) as melanomas. Compared with nevi, melanomas had a greater mean thickness (2.8 vs. 1.6 mm, Welch’s two-sample t-test p < 0.001) and larger mean LBD (6.6 vs. 4.4 mm, p < 0.001). Further cohort characteristics are summarized in Table 1.
Table 1.
Characteristics of included patients and lesions.
3.2. Distribution of MelAInoma Scores Across MOLES Scores
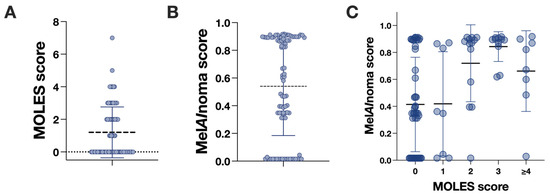
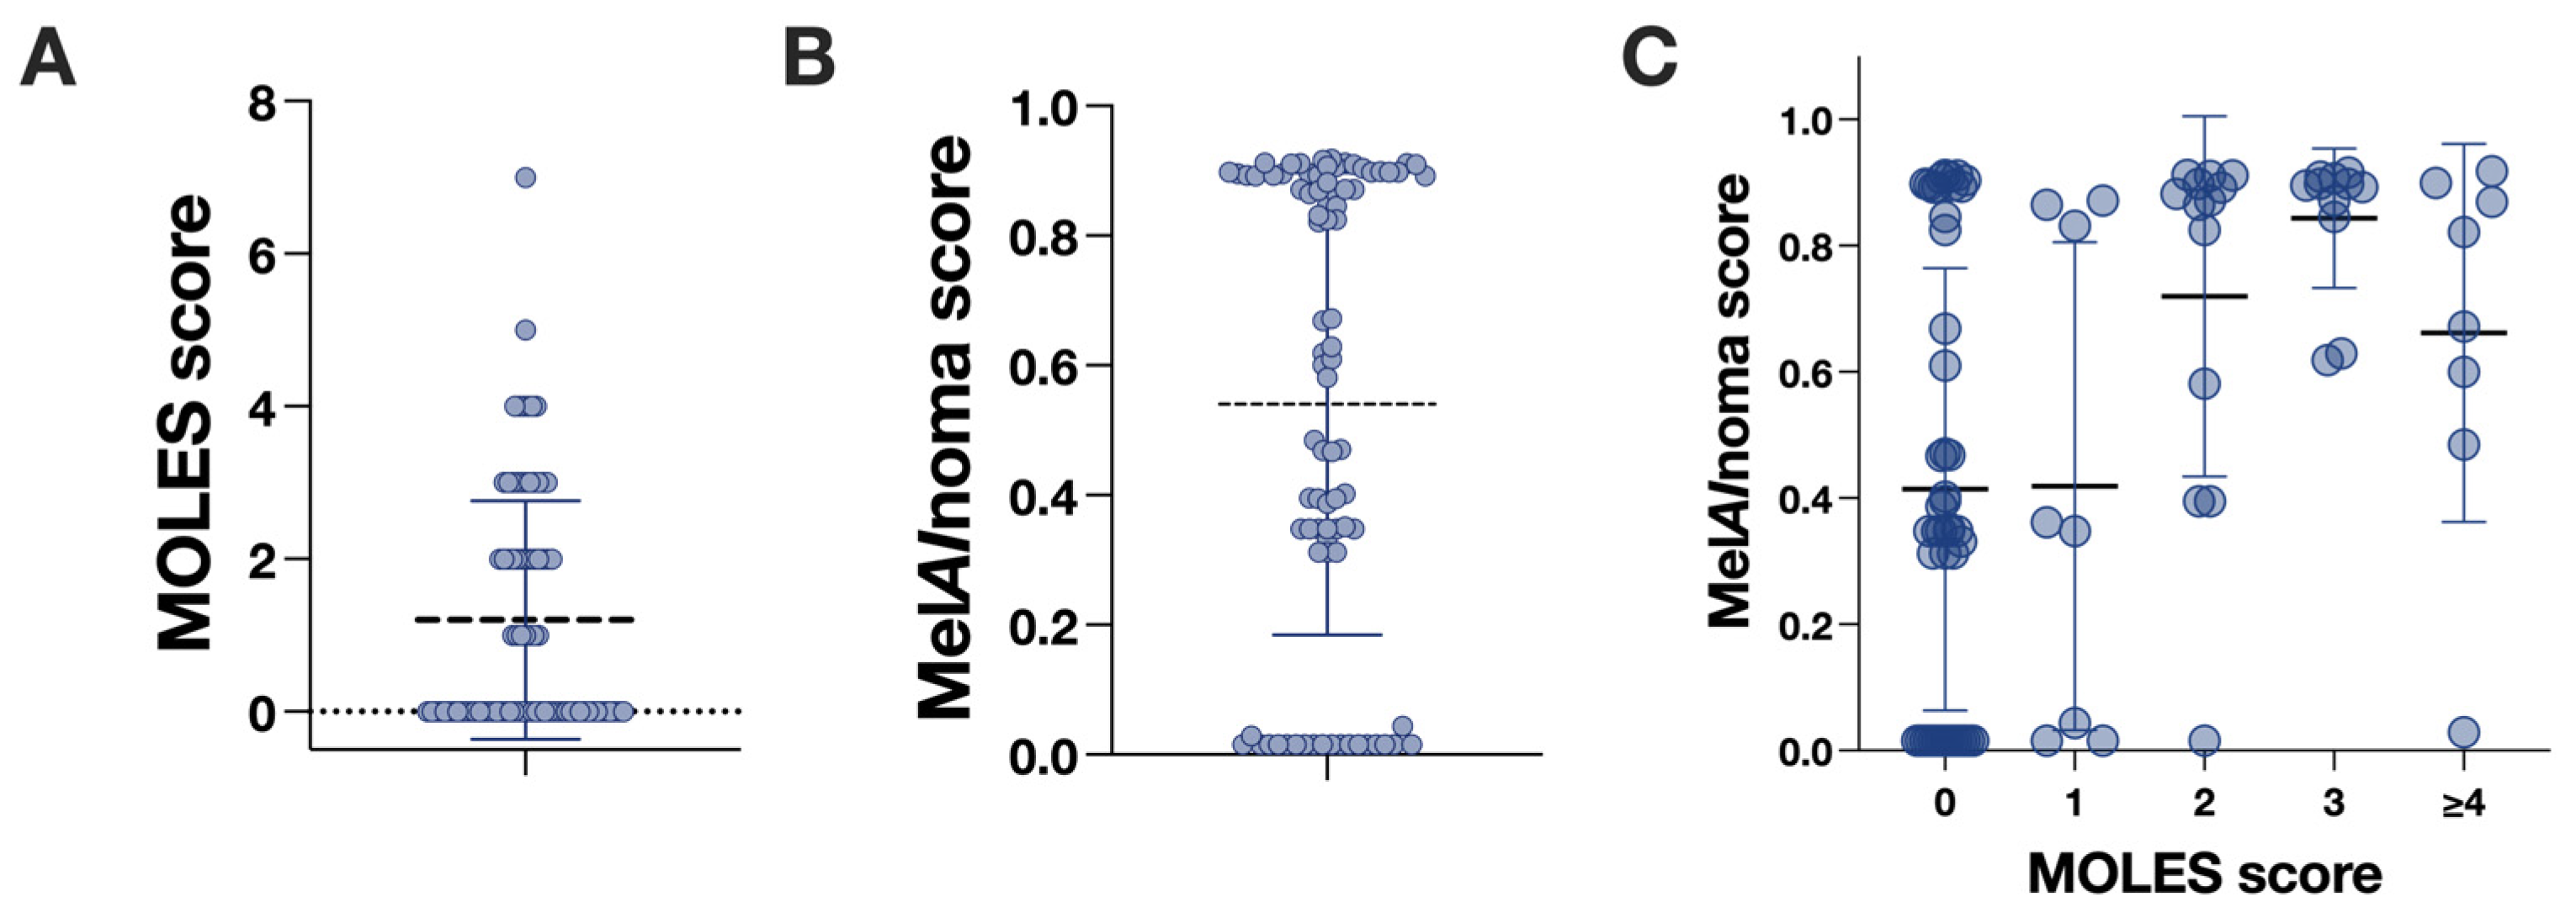
MelAInoma scores increased monotonically with increasing MOLES categories. The distribution of lesions by MOLES score was as follows: MOLES 0 (n = 46), MOLES 1 (n = 8), MOLES 2 (n = 13), MOLES 3 (n = 11), and MOLES ≥ 4 (n = 8). Using the Jonckheere–Terpstra test to evaluate an ordered trend, there was strong evidence for increasing MelAInoma scores with higher MOLES categories (JT = 1620, p = 0.0001, one-sided test for increasing trend). This association persisted despite substantial ties in MelAInoma score values and unequal group sizes, indicating a consistent monotonic relationship between MOLES score and AI-based risk estimation (Figure 1). In addition, a rank-based one-way ANOVA (Kruskal–Wallis test) showed differences in MelAInoma score distributions across MOLES categories (p = 0.0008).
Figure 1.
Distribution of MOLES and MelAInoma scores. Each point represents one lesion. (A) Distribution of MOLES scores across the included lesions, shown with horizontal jitter to reduce overlap. The horizontal line indicates the mean, and whiskers indicate the standard deviation (SD). (B) Distribution of MelAInoma scores across the included lesions. (C) Distribution of MelAInoma scores stratified by MOLES score (0, 1, 2, 3, and ≥4). Horizontal lines indicate the mean, and error bars indicate one SD.
3.3. Linear Regression
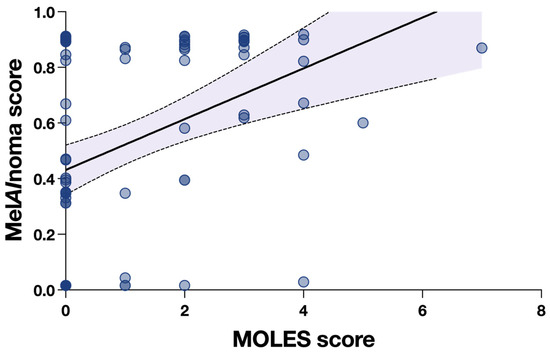
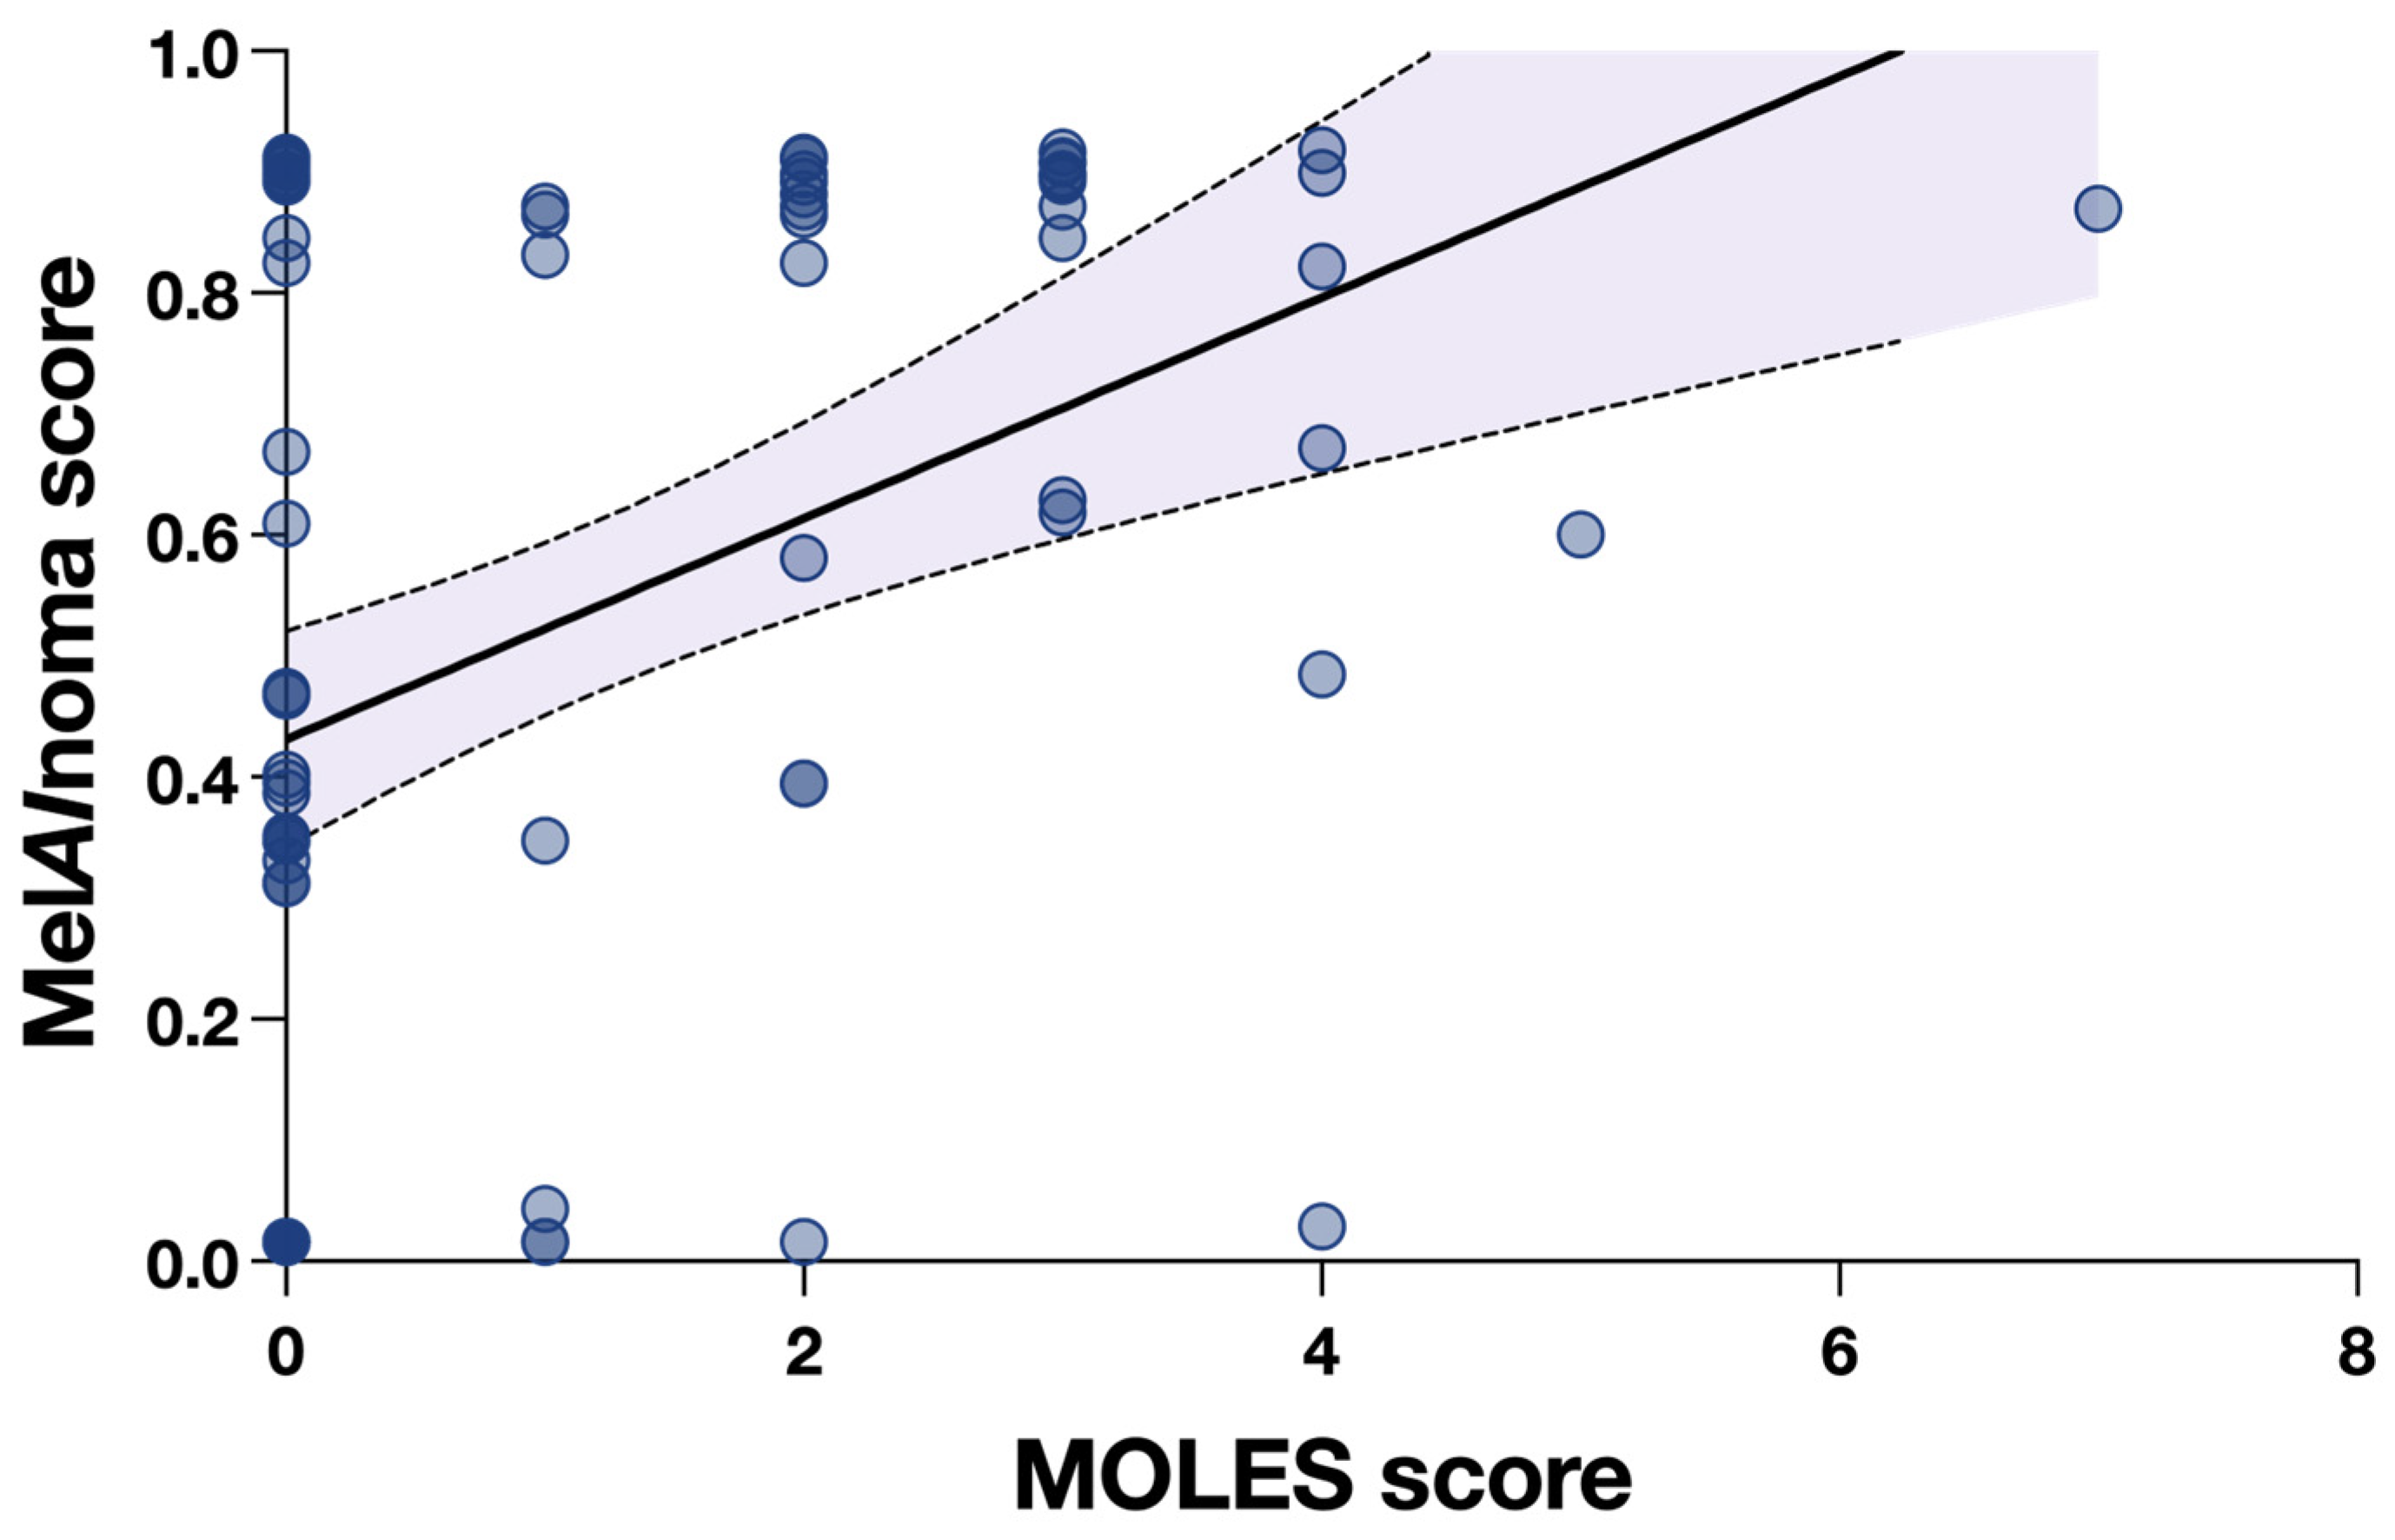
In linear regression analysis, increasing MOLES score was associated with higher MelAInoma score (slope 0.09 per MOLES unit, 95% CI 0.05 to 0.14, p < 0.0001). However, the association showed considerable dispersion, with MOLES score explaining only 16% of the variability in MelAInoma score (R2 = 0.16, Figure 2).
Figure 2.
Association between MOLES score and MelAInoma score. Scatter plot showing MelAInoma score as a function of MOLES score. The solid line represents the fitted linear regression (slope 0.09 per MOLES unit; p < 0.0001), and the shaded area indicates the 95% confidence interval (CI).
3.4. Binary Logistic Regression for MOLES
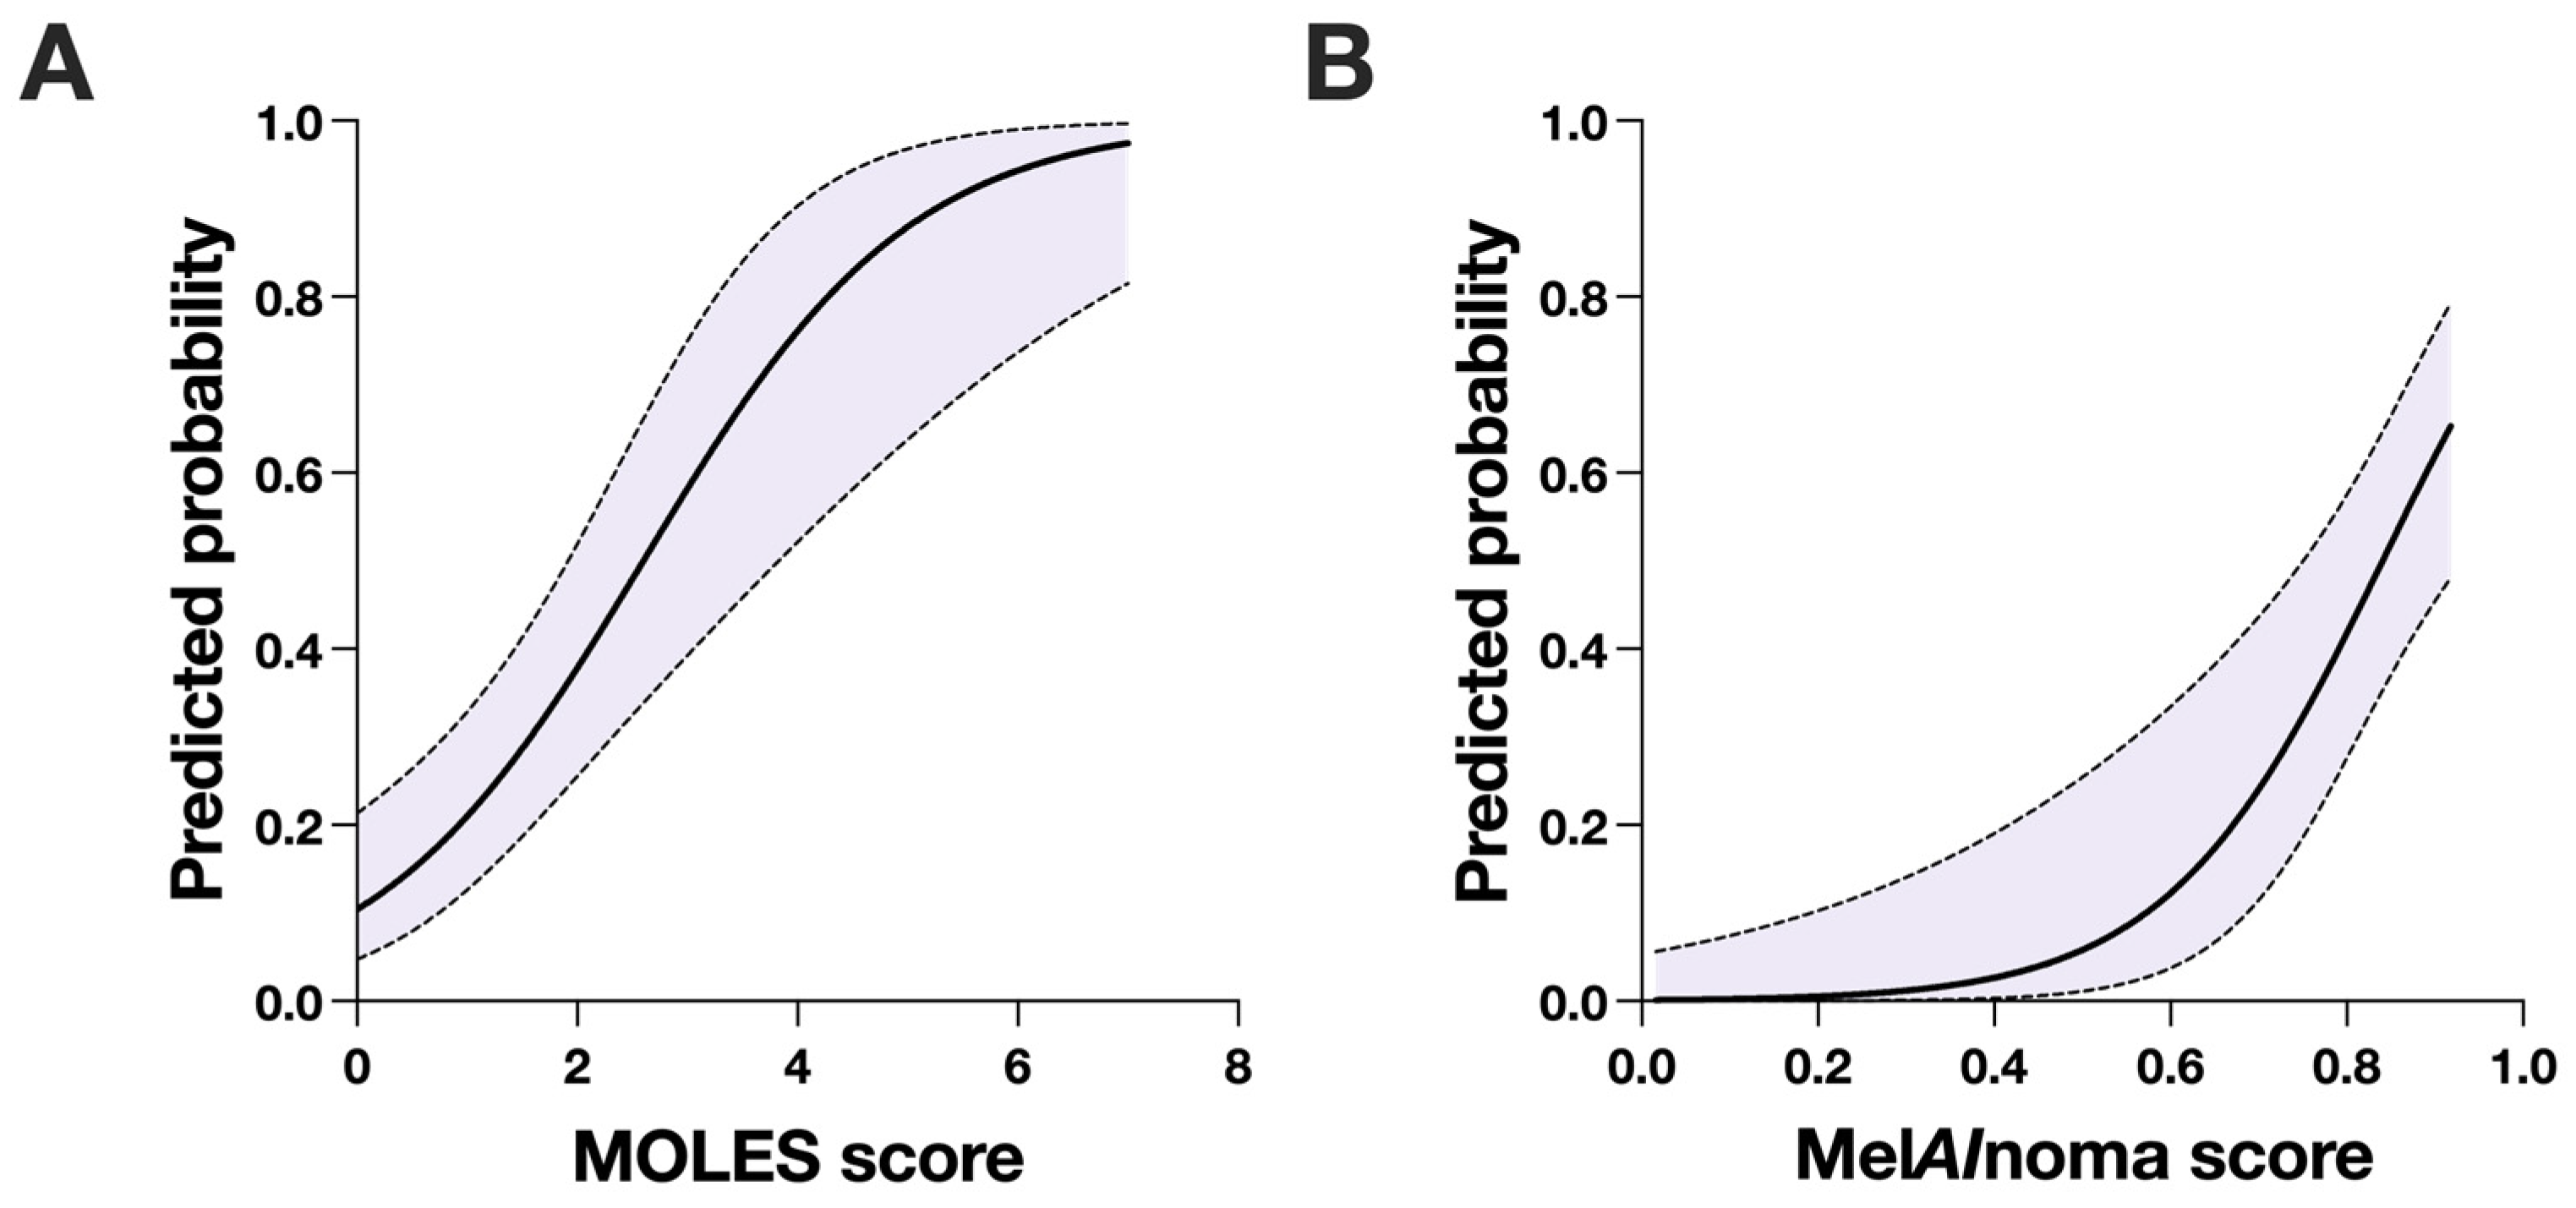
In binary logistic regression with MOLES score as the sole predictor, higher MOLES score was associated with increased odds of melanoma diagnosis (Figure 3A). Each one-unit increase in MOLES score was associated with a more than twofold increase in the odds of melanoma (OR 2.29, 95% CI 1.59 to 3.50, p < 0.0001, Table 2). Model fit was acceptable, with a Tjur’s R2 of 0.27.
Figure 3.
Binary logistic regression models. (A) Predicted probability of melanoma as a function of MOLES score from a binary logistic regression model. (B) Predicted probability of melanoma as a function of MelAInoma score from a binary logistic regression model. In both panels, the solid line represents the fitted model, and the shaded area indicates the 95% confidence interval (CI).
Table 2.
Univariable binary logistic regression for MOLES score and melanoma diagnosis.
3.5. Binary Logistic Regression for MelAInoma
In binary logistic regression using MelAInoma score as the sole predictor, higher MelAInoma score was associated with increased odds of melanoma diagnosis (Figure 3B). When scaled per 0.1-unit increase, the odds of melanoma increased by a factor of 2.27 (OR 2.27 per 0.1 increase, 95% CI 1.57 to 4.23, p < 0.0001, Table 3). Compared to the MOLES model, this model explained a larger proportion of outcome variability (Tjur’s R2 = 0.38).
Table 3.
Univariable binary logistic regression for MelAInoma score and melanoma diagnosis.
3.6. Multivariable Binary Logistic Regression
In multivariable binary logistic regression including both MOLES score and MelAInoma score, both predictors remained associated with melanoma diagnosis. After adjustment for MOLES score, each 0.1-unit increase in MelAInoma score was associated with a 2.82-fold increase in the odds of melanoma (OR 2.82, 95% CI 1.62 to 6.85, p < 0.0001, Table 4). MOLES score also remained associated with melanoma diagnosis after adjustment for MelAInoma score (OR 2.24 per one-unit increase, 95% CI 1.40 to 4.02, p = 0.002). The combined model showed substantially improved the fit compared with the intercept-only model (AIC 55.3 vs. 103.2), and there was no evidence of poor calibration based on the Hosmer–Lemeshow test (p = 0.86).
Table 4.
Multivariable binary logistic regression for melanoma diagnosis.
3.7. Bootstrap Internal Validation of the Multivariable Prediction Model
Model stability and potential optimism were assessed using bootstrap internal validation (2000 resamples) of the multivariable logistic regression model including MOLES score and MelAInoma score as predictors, with melanoma diagnosis as the outcome. In the complete-case dataset (n = 86), the apparent discrimination of the model was high (AUC 0.93). The estimated optimism in AUC was small (0.006), yielding an optimism-corrected AUC of 0.92. Tjur’s R2 decreased from 0.52 to 0.50 after optimism correction, while the Brier score increased from 0.10 to 0.11. The optimism-corrected calibration slope was 0.89, indicating modest overfitting but overall stable model performance.
3.8. Sensitivity Analysis by Imaging Modality
To determine if the AI algorithm’s performance remained stable across different clinical presentations and imaging hardware, a subgroup analysis was performed. Lesions were categorized based on whether they were captured with standard-field or ultra-widefield systems. It should be noted that while MelAInoma scores were derived solely from these color photographs, MOLES scores were established by ocular oncologists with access to multimodal imaging (e.g., OCT and autofluorescence). In the standard-field subgroup, MelAInoma achieved an AUC of 0.87 (95% CI 0.78–0.96) compared to 0.80 (95% CI 0.67–0.93) for MOLES with no statistically detectable difference between the methods (p = 0.42, DeLong test). Similarly, in the ultra-widefield subgroup, MelAInoma achieved an AUC of 0.87 (95% CI 0.72–1.00) compared to 0.79 (95% CI 0.61–0.97) for MOLES (p = 0.48). These findings indicate that MelAInoma maintains a high and stable diagnostic accuracy across different clinical subgroups, even when compared to an expert scoring system supported by multimodal data.
4. Discussion
In this study, we demonstrate that both the MOLES system and the MelAInoma algorithm were associated with melanoma diagnosis in a cohort of small pigmented choroidal lesions. The two systems demonstrated a statistically significant association, and higher values of either score were linked to higher odds of melanoma. This is clinically relevant, as both approaches are primarily intended for use by non-expert opticians, optometrists, and ophthalmologists in settings where early triage of suspicious lesions is increasing demand [29,30].
Despite this overall concordance, there were notable differences between the two systems. Although the association between MOLES and MelAInoma scores was statistically significant, linear regression displayed substantial dispersion, with MOLES explaining only a limited proportion of the variability in MelAInoma score. This suggests that, while related, the two systems capture overlapping but not identical information. In univariable binary logistic regression, MelAInoma showed slightly stronger associations with melanoma diagnosis than MOLES. This difference may partly reflect the distributional properties of the two scores: MOLES values were heavily clustered at low scores, whereas MelAInoma scores were more continuously distributed across lesions, allowing for greater separation in estimated odds across the range of values.
In multivariable logistic regression, both MOLES and MelAInoma scores remained associated with melanoma diagnosis after adjustment for one another, indicating that each score contributed information beyond the other. Clinically, the low shared variance between the scores (R2 = 0.16) means that MOLES and MelAInoma will often assign different risk levels to the same lesion and therefore should not be considered interchangeable. This discordance is expected because MOLES is a feature-based ordinal score derived from multimodal assessment (including OCT and autofluorescence), whereas MelAInoma is a continuous probability derived from a single color photograph. Although the statistical evidence was slightly stronger for MelAInoma, the results do not suggest that one system renders the other obsolete; rather, they indicate that the two approaches capture overlapping but partly distinct aspects of lesion assessment and may provide complementary information in clinical triage.
The slightly higher explanatory power observed for MelAInoma in univariable models is unlikely to be solely a statistical consequence of scale differences between a continuous probability output and an ordinal score. Discrimination analyses showed similar AUC estimates across imaging subgroups without statistically detectable differences between methods. Moreover, in the multivariable model, both scores remained independently associated with melanoma diagnosis, indicating that the association of MelAInoma was not merely a reflection of statistical scaling but represented additional information not captured by MOLES.
A notable finding of this study is that MelAInoma achieved numerically higher AUC estimates than MOLES despite being based solely on a single color fundus photograph, whereas MOLES scoring was supported by multimodal imaging, including OCT and autofluorescence. Although these differences were not statistically detectable, the point estimates suggest that the deep learning model captures diagnostic features from standard photography that are at least comparable to those identified by experts using additional imaging modalities. In primary care or optometric settings where OCT and autofluorescence are often unavailable, the ability to provide a reproducible risk estimate from a single photograph may therefore represent a practical advantage [31,32].
An additional practical distinction between the systems is that MelAInoma provides fully reproducible output, yielding the same score each time a given image is analyzed, independent of the user. In contrast, MOLES scoring is subject to human interpretation. In the present study, all MOLES scores were assigned by experienced ocular oncologists, effectively establishing a performance ceiling for the manual scoring system. Because previous research has shown that MOLES performance can vary significantly based on observer expertise, it is probable that the diagnostic gap between the two systems would be even more pronounced in the primary care settings for which they are intended, where the AI’s consistency would remain stable while manual scoring accuracy might decline [15,19]. Non-expert performance was not evaluated in this cohort because the aim of the present study was to compare the intrinsic associations of the two scoring systems under standardized, expert-applied conditions. Evaluation of MOLES and MelAInoma in their intended non-expert user groups has been addressed separately in prior work, where referral thresholds and real-world trade-offs were analyzed [15].
In terms of real-world referral thresholds, we previously evaluated explicit cutoffs for both MOLES and MelAInoma in an optometrist triage setting using multimodal ocular oncologist assessment as reference [15]. Using the current Swedish Optometry Association guidance of referring lesions with MOLES score ≥ 1, MOLES achieved very high sensitivity (98%) but low specificity (17%) for melanoma classification (overall accuracy 33%). Raising the referral threshold to MOLES ≥ 3 (corresponding to “probable melanoma”) reduced sensitivity to 75% while increasing specificity to 53% (overall accuracy 57%). In the same study, MelAInoma was assessed using a prespecified probability cutoff (0.63) and showed a sensitivity of 80% and specificity of 90% (overall accuracy 88%). Taken together, these data suggest that lower MOLES thresholds prioritize sensitivity at the cost of substantial over-referral, whereas a prespecified MelAInoma cutoff can provide higher specificity while maintaining sensitivity in a clinically relevant range. In practice, the optimal cutoff should be selected based on the intended use case (screening vs. referral triage) and acceptable trade-offs between missed melanomas and false-positive referrals.
Another conceptual difference is that MelAInoma does not explicitly base its classification on predefined clinical risk factors for growth. Although such factors are well established and clinically useful, they do not necessarily reflect underlying tumor biology, including genetic and cytogenetic alterations known to be associated with prognosis [33,34,35,36]. Whether image-based AI systems such as MelAInoma capture information related to these biological features remains an open question. In future work, we will evaluate how MelAInoma scores relate to genetic and cytogenetic markers, such as monosomy 3 and BAP1 mutation status, and investigate whether image-derived features capture aspects of tumor biology beyond established clinical risk factors [35,37].
Strengths and Limitations
This study has several limitations. First, it was conducted at a single national ocular oncology referral center, which may limit generalizability to other clinical settings, referral patterns, and patient populations. Although images were acquired using both standard-field and ultra-widefield cameras, the Swedish referral context and patient mix may not be representative of other populations [38,39]. Second, none of the included lesions underwent histopathologic confirmation, and the reference standard was therefore based on expert clinical diagnosis using multimodal assessment. Third, the use of two different fundus photography systems may have introduced variability in image properties that could influence algorithm-derived scores, although prior validation showed stable MelAInoma performance across standard-field and ultra-widefield imaging modalities [19]. Fourth, genetic and cytogenetic data were not available, precluding analysis of associations with established molecular prognostic factors. Fifth, both diagnoses and MOLES scores were established by subspecialized ocular oncologists. Results may therefore differ if diagnoses and scoring were performed by non-experts, a scenario that would likely disadvantage MOLES more than MelAInoma. Furthermore, MOLES scoring and the reference diagnosis were produced within the same subspecialty environment. The MOLES features largely overlap with the clinical and imaging features ocular oncologists routinely use when distinguishing small melanomas from nevi. This creates a risk of shared-feature incorporation, in which a predictor is correlated with the outcome partly because the predictor’s components are also used (explicitly or implicitly) in forming the reference classification. If anything, this would be expected to further strengthen the observed association between MOLES and diagnosis and thereby favor MOLES over MelAInoma, which was generated independently from color fundus photographs alone. The fact that MOLES and MelAInoma showed only modest shared variance (R2 = 0.16) and that MelAInoma remained associated with diagnosis after adjustment for MOLES suggests that the two methods capture overlapping but non-identical information. Importantly, risk factors for growth of choroidal nevi are not necessarily true risk factors for malignant transformation, but these concepts can become conflated when the same parameters are used both to define melanoma and to predict its biology, as has been discussed previously [34,40]. Sixth, the Hosmer–Lemeshow test has limited power in small samples, and calibration results should therefore be interpreted with caution [41]. Seventh, the distribution of MOLES categories was imbalanced, with relatively few lesions in certain groups, which may reduce statistical stability and widen confidence intervals for category-specific estimates. Eighth, there was an asymmetry in the data available to each system; while MOLES scoring was supported by multimodal imaging, MelAInoma was restricted to color fundus photography. Consequently, this study could not evaluate whether the addition of OCT or autofluorescence data would further enhance the algorithm’s performance. Furthermore, while the current results demonstrate the AI’s efficacy as a standalone triage tool, its integration with other clinical data remains a subject for future investigation.
The study also has several strengths. The cohort was independent of the datasets used to develop and train the MelAInoma algorithm. Diagnoses were established using multimodal expert assessment, including ultrasonography, OCT, biomicroscopy, and fundus imaging. In addition, classification of lesions as nevi required at least five years of follow-up without reclassification as melanoma, increasing confidence in the correctness of the ground truth diagnoses.
5. Conclusions
Both MOLES and MelAInoma were associated with expert melanoma diagnosis and demonstrated good discrimination in this cohort. However, statistical association does not by itself establish clinical utility, which depends on referral thresholds, decision context, and acceptable trade-offs between sensitivity and specificity. Within these constraints, the findings support their potential role in lesion triage. Clinically, a fully reproducible, photo-based system that performs comparably to expert MOLES scoring supported by multimodal imaging may be meaningful for lesion triage, particularly in settings where multimodal imaging or subspecialist expertise is unavailable. Taken together, these results support the potential role of MelAInoma as a complementary aid in the assessment and triage of pigmented choroidal lesions. Future studies should include external validation in independent multicenter cohorts and prospective evaluations in real-world triage settings to confirm generalizability and assess clinical impact.
Author Contributions
Conceptualization, G.S. and M.H.; methodology, G.S. and M.H.; software, G.S. and M.H.; validation, K.S., H.C.A. and M.H.; formal analysis, G.S.; investigation, G.S. and M.H.; resources, G.S.; data curation, G.S.; writing—original draft preparation, G.S.; writing—review and editing, K.S., H.C.A., and M.H.; visualization, G.S.; supervision, G.S.; project administration, G.S.; funding acquisition, G.S. All authors have read and agreed to the published version of the manuscript.
Funding
This research was funded by Karolinska Institutet, grant number 2023-02622.
Institutional Review Board Statement
The study was conducted in accordance with the Declaration of Helsinki and approved by the Swedish Ethical Review Authority (reference 2025-05054-01, date of approval 3 September 2025).
Informed Consent Statement
Patient consent was waived as this was a retrospective study that does not affect the treatment or follow-up of the patients. Further, all patient data and images had been previously collected and no new clinical data collection was performed, and no biological tissues were analyzed.
Data Availability Statement
Due to the sensitive nature of the clinical data, including images utilized in this study, the authors are unable to share these materials in compliance with Swedish law. The confidentiality and privacy regulations governing patient information strictly prohibit the distribution of such data.
Acknowledgments
During the preparation of this manuscript, the authors used ChatGPT (v5.2) for the purpose of improving grammar and language. The authors have reviewed and edited the output and take full responsibility for the content of this publication.
Conflicts of Interest
Mats Holmström and Gustav Stålhammar are founders of Eyedentity AB and hold equity in the company, which develops the MelAInoma software evaluated in this study. The remaining authors declare that the research was conducted in the absence of any commercial or financial relationships that could be construed as a potential conflict of interest.
Abbreviations
The following abbreviations are used in this manuscript:
| AI | Artificial intelligence |
| AIC | Akaike information criterion |
| AJCC | American Joint Committee on Cancer |
| AMD | Age-related macular degeneration |
| AUC | Area under the curve |
| CI | Confidence interval |
| MOLES | Mushroom shape, Orange pigment, Large size, Enlarging tumor, and Subretinal fluid |
| OCT | Optical Coherence Tomography |
| OR | Odds ratio |
| LBD | Largest basal tumor diameter |
| SD | Standard deviation |
References
- Shields, C.L.; Furuta, M.; Thangappan, A.; Nagori, S.; Mashayekhi, A.; Lally, D.R.; Kelly, C.C.; Rudich, D.S.; Nagori, A.V.; Wakade, O.A.; et al. Metastasis of Uveal Melanoma Millimeter-by-Millimeter in 8033 Consecutive Eyes. Arch. Ophthalmol. 2009, 127, 989–998. [Google Scholar] [CrossRef] [Scilit] [PubMed]
- Stalhammar, G.; Coupland, S.E.; Ewens, K.G.; Ganguly, A.; Heimann, H.; Shields, C.L.; Damato, B. Improved Staging of Ciliary Body and Choroidal Melanomas Based on Estimation of Tumor Volume and Competing Risk Analyses. Ophthalmology 2023, 131, 478–491. [Google Scholar] [CrossRef] [Scilit] [PubMed]
- Kujala, E.; Damato, B.; Coupland, S.E.; Desjardins, L.; Bechrakis, N.E.; Grange, J.D.; Kivela, T. Staging of ciliary body and choroidal melanomas based on anatomic extent. J. Clin. Oncol. 2013, 31, 2825–2831. [Google Scholar] [CrossRef] [Scilit] [PubMed]
- Hussain, R.N.; Coupland, S.E.; Kalirai, H.; Taktak, A.F.G.; Eleuteri, A.; Damato, B.E.; Groenewald, C.; Heimann, H. Small High-Risk Uveal Melanomas Have a Lower Mortality Rate. Cancers 2021, 13, 2267. [Google Scholar] [CrossRef] [Scilit]
- Damato, B.E.; Heimann, H.; Kalirai, H.; Coupland, S.E. Age, survival predictors, and metastatic death in patients with choroidal melanoma: Tentative evidence of a therapeutic effect on survival. JAMA Ophthalmol. 2014, 132, 605–613. [Google Scholar] [CrossRef] [Scilit]
- Gonzalez, N.C.; Villegas, V.M.; Gold, A.S.; Latiff, A.; Murray, T.G. Early Treatment in Patients With Small and Medium-Small Class 2 Gene Expression Profiling Uveal Melanoma to Reduce Mortality. J. VitreoRetin. Dis. 2025, 9, 474–478. [Google Scholar] [CrossRef] [Scilit]
- Sumich, P.; Mitchell, P.; Wang, J.J. Choroidal nevi in a white population: The Blue Mountains Eye Study. Arch. Ophthalmol. 1998, 116, 645–650. [Google Scholar] [CrossRef] [Scilit]
- Greenstein, M.B.; Myers, C.E.; Meuer, S.M.; Klein, B.E.; Cotch, M.F.; Wong, T.Y.; Klein, R. Prevalence and characteristics of choroidal nevi: The multi-ethnic study of atherosclerosis. Ophthalmology 2011, 118, 2468–2473. [Google Scholar] [CrossRef] [Scilit]
- Jouhi, S.; Jager, M.J.; de Geus, S.J.R.; Desjardins, L.; Eide, N.A.; Grange, J.D.; Kiilgaard, J.F.; Seregard, S.; Midena, E.; Parrozzani, R.; et al. The Small Fatal Choroidal Melanoma Study. A Survey by the European Ophthalmic Oncology Group. Am. J. Ophthalmol. 2019, 202, 100–108. [Google Scholar] [CrossRef] [Scilit]
- Prieto-Dominguez, L.; Garcia-Alvarez, C.; Munoz-Moreno, M.F.; Diezhandino, P.; Miguel-Perez, D.; Saornil, M.A. Long Term Follow-Up Observation in Small Choroidal Melanocytic Tumors. Cancers 2024, 16, 2627. [Google Scholar] [CrossRef] [Scilit]
- Zemba, M.; Dumitrescu, O.M.; Gheorghe, A.G.; Radu, M.; Ionescu, M.A.; Vatafu, A.; Dinu, V. Ocular Complications of Radiotherapy in Uveal Melanoma. Cancers 2023, 15, 333. [Google Scholar] [CrossRef] [Scilit] [PubMed]
- Damato, B. Ocular treatment of choroidal melanoma in relation to the prevention of metastatic death—A personal view. Prog. Retin. Eye Res. 2018, 66, 187–199. [Google Scholar] [CrossRef] [Scilit] [PubMed]
- Stalhammar, G. Delays between Uveal Melanoma Diagnosis and Treatment Increase the Risk of Metastatic Death. Ophthalmology 2024, 131, 1094–1104. [Google Scholar] [CrossRef] [Scilit] [PubMed]
- Moghadam, A.; Gill, V.T.; Sabazade, S.; Hagstrom, A.; Stalhammar, G. Independent validation of time to treatment as a prognostic factor in uveal melanoma. BMC Cancer 2026, 26, 302. [Google Scholar] [CrossRef] [Scilit]
- Sabazade, S.; Lumia Michalski, M.A.; Wittskog, S.; Holmstrom, M.; Nilsson, M.; Stalhammar, G. Challenges for Opticians in Evaluating Small Pigmented Choroidal Lesions: Potential Support From the MelAInoma Deep Learning Algorithm. Transl. Vis. Sci. Technol. 2025, 14, 29. [Google Scholar] [CrossRef] [Scilit]
- Dalvin, L.A.; Shields, C.L.; Ancona-Lezama, D.A.; Yu, M.D.; Di Nicola, M.; Williams, B.K., Jr.; Lucio-Alvarez, J.A.; Ang, S.M.; Maloney, S.M.; Welch, R.J.; et al. Combination of multimodal imaging features predictive of choroidal nevus transformation into melanoma. Br. J. Ophthalmol. 2019, 103, 1441–1447. [Google Scholar] [CrossRef] [Scilit]
- Obuchowska, I.; Konopinska, J. Importance of Optical Coherence Tomography and Optical Coherence Tomography Angiography in the Imaging and Differentiation of Choroidal Melanoma: A Review. Cancers 2022, 14, 3354. [Google Scholar] [CrossRef] [Scilit]
- Ly, A.; Nivison-Smith, L.; Hennessy, M.; Kalloniatis, M. The advantages of intermediate-tier, inter-optometric referral of low risk pigmented lesions. Ophthalmic Physiol. Opt. 2017, 37, 661–668. [Google Scholar] [CrossRef] [Scilit]
- Sabazade, S.; Lumia Michalski, M.; Bartoszek, J.; Fili, M.; Holmström, M.; Stålhammar, G. Development and Validation of a Deep Learning Algorithm for Differentiation of Choroidal Nevi from Small Melanoma in Fundus Photographs. Ophthalmol. Sci. 2024, 4, 100613. [Google Scholar] [CrossRef] [Scilit]
- Al Harby, L.; Sagoo, M.S.; O’Day, R.; Hay, G.; Arora, A.K.; Keane, P.A.; Cohen, V.M.L.; Damato, B. Distinguishing Choroidal Nevi from Melanomas Using the MOLES Algorithm: Evaluation in an Ocular Nevus Clinic. Ocul. Oncol. Pathol. 2021, 7, 294–302. [Google Scholar] [CrossRef] [Scilit]
- Roelofs, K.A.; O’Day, R.; Harby, L.A.; Arora, A.K.; Cohen, V.M.L.; Sagoo, M.S.; Damato, B. The MOLES System for Planning Management of Melanocytic Choroidal Tumors: Is It Safe? Cancers 2020, 12, 1311. [Google Scholar] [CrossRef] [Scilit]
- Jahnke, D.; Grohmann, C.; Fuisting, B.; Skevas, C.; Spitzer, M.S.; Birtel, J. Performance of the MOLES and TFSOM-DIM scores in classifying choroidal nevi and melanoma. Sci. Rep. 2024, 14, 28534. [Google Scholar] [CrossRef] [Scilit] [PubMed]
- Damato, B.E. Can the MOLES acronym and scoring system improve the management of patients with melanocytic choroidal tumours? Eye 2023, 37, 830–836. [Google Scholar] [CrossRef] [Scilit] [PubMed]
- Flanagan, J.P.; O’Day, R.F.; Roelofs, K.A.; McGuinness, M.B.; van Wijngaarden, P.; Damato, B.E. The MOLES system to guide the management of melanocytic choroidal tumours: Can optometrists apply it? Clin. Exp. Optom. 2023, 106, 271–275. [Google Scholar] [CrossRef] [Scilit] [PubMed]
- Shields, C.L.; Shields, J.A.; Kiratli, H.; De Potter, P.; Cater, J.R. Risk factors for growth and metastasis of small choroidal melanocytic lesions. Trans. Am. Ophthalmol. Soc. 1995, 93, 259–275, discussion 275–259. [Google Scholar] [CrossRef] [Scilit]
- Shields, C.L.; Furuta, M.; Berman, E.L.; Zahler, J.D.; Hoberman, D.M.; Dinh, D.H.; Mashayekhi, A.; Shields, J.A. Choroidal nevus transformation into melanoma: Analysis of 2514 consecutive cases. Arch. Ophthalmol. 2009, 127, 981–987. [Google Scholar] [CrossRef] [Scilit]
- Shields, C.L.; Cater, J.; Shields, J.A.; Singh, A.D.; Santos, M.C.; Carvalho, C. Combination of clinical factors predictive of growth of small choroidal melanocytic tumors. Arch. Ophthalmol. 2000, 118, 360–364. [Google Scholar] [CrossRef] [Scilit]
- Stalhammar, G.; Hagstrom, A.; Ermedahl Conradi, M.; Williams, P.A. Choroidal nevi and melanoma doubling times and implications for delays in treatment: A systematic review and meta-analysis. Surv. Ophthalmol. 2025, 70, 38–46. [Google Scholar] [CrossRef] [Scilit]
- Conway, R.M.; Trang, T.M.T.; Tang, E.J.; Challinor, K.L.; Jalbert, I.; Madigan, M.C. Survey of Australian primary eyecare management of choroidal nevus patients. Optom. Vis. Sci. 2025, 102, 452–457. [Google Scholar] [CrossRef] [Scilit]
- DeSimone, J.D.; Dockery, P.W.; Kreinces, J.B.; Soares, R.R.; Shields, C.L. Survey of ophthalmic imaging use to assess risk of progression of choroidal nevus to melanoma. Eye 2023, 37, 953–958. [Google Scholar] [CrossRef] [Scilit]
- Suri, H.; Lentz, P.C.; Leske, D.A.; Mousavi, M.; D’Souza, H.S.; Qureshi, M.B.; Iezzi, R.; Varatharajah, Y.; Dalvin, L.A. Development of a deep learning model to classify choroidal melanoma risk factors based on color fundus photographs. AJO Int. 2025, 2, 100167. [Google Scholar] [CrossRef] [Scilit] [PubMed]
- Roelofs, K.A.; O’Day, R.; Al Harby, L.; Hay, G.; Arora, A.K.; Cohen, V.M.L.; Sagoo, M.S.; Damato, B.E. Detecting Progression of Melanocytic Choroidal Tumors by Sequential Imaging: Is Ultrasonography Necessary? Cancers 2020, 12, 1856. [Google Scholar] [CrossRef] [Scilit] [PubMed]
- Stalhammar, G.; Kalirai, H.; Coupland, S.E.; Grisanti, S.; Sonntag, S.R.; Tura, A.; Eleuteri, A.; Hussain, R.N.; Heimann, H.; Coude Adam, H. Metastatic potential of small posterior uveal melanomas. Acta Ophthalmol. 2025, 104, e191–e203. [Google Scholar] [CrossRef] [Scilit] [PubMed]
- Stalhammar, G. A Word of Caution regarding Risk Factors for Malignant Transformation of Choroidal Nevi. Ocul. Oncol. Pathol. 2021, 7, 376–380. [Google Scholar] [CrossRef] [Scilit]
- Prescher, G.; Bornfeld, N.; Hirche, H.; Horsthemke, B.; Jockel, K.H.; Becher, R. Prognostic implications of monosomy 3 in uveal melanoma. Lancet 1996, 347, 1222–1225. [Google Scholar] [CrossRef] [Scilit]
- Robertson, A.G.; Shih, J.; Yau, C.; Gibb, E.A.; Oba, J.; Mungall, K.L.; Hess, J.M.; Uzunangelov, V.; Walter, V.; Danilova, L.; et al. Integrative Analysis Identifies Four Molecular and Clinical Subsets in Uveal Melanoma. Cancer Cell 2017, 32, 204–220.e15. [Google Scholar] [CrossRef] [Scilit]
- Harbour, J.W.; Onken, M.D.; Roberson, E.D.; Duan, S.; Cao, L.; Worley, L.A.; Council, M.L.; Matatall, K.A.; Helms, C.; Bowcock, A.M. Frequent mutation of BAP1 in metastasizing uveal melanomas. Science 2010, 330, 1410–1413. [Google Scholar] [CrossRef] [Scilit]
- Wu, M.; Yavuzyigitoglu, S.; Brosens, E.; Ramdas, W.D.; Kilic, E. Rotterdam Ocular Melanoma Study Group. Worldwide Incidence of Ocular Melanoma and Correlation With Pigmentation-Related Risk Factors. Invest. Ophthalmol. Vis. Sci. 2023, 64, 45. [Google Scholar] [CrossRef] [Scilit]
- Hu, D.N.; Yu, G.P.; McCormick, S.A.; Schneider, S.; Finger, P.T. Population-based incidence of uveal melanoma in various races and ethnic groups. Am. J. Ophthalmol. 2005, 140, 612.e1–612.e8. [Google Scholar] [CrossRef] [Scilit]
- DeSimone, J.D.; Shields, C.N.; Kalafatis, N.E.; Marous, M.R.; Marous, C.L.; Shields, J.A.; Shields, C.L. Understanding choroidal nevus risk factors for transformation into melanoma. Clin. Dermatol. 2024, 42, 38–45. [Google Scholar] [CrossRef] [Scilit]
- Kramer, A.A.; Zimmerman, J.E. Assessing the calibration of mortality benchmarks in critical care: The Hosmer-Lemeshow test revisited. Crit. Care Med. 2007, 35, 2052–2056. [Google Scholar] [CrossRef] [Scilit]

Disclaimer/Publisher’s Note: The statements, opinions and data contained in all publications are solely those of the individual author(s) and contributor(s) and not of MDPI and/or the editor(s). MDPI and/or the editor(s) disclaim responsibility for any injury to people or property resulting from any ideas, methods, instructions or products referred to in the content. |
© 2026 by the authors. Licensee MDPI, Basel, Switzerland. This article is an open access article distributed under the terms and conditions of the Creative Commons Attribution (CC BY) license.