


Simple Summary
Breast cancer is considered as the most common malignancy among females, and its treatment takes many forms and types. Neoadjuvant chemotherapy (NACT), which is the treatment precedes the surgical intervention, became the preferred treatment approach for some subtypes of breast tumors. However, some patients exhibit good response to the neoadjuvant treatment, while others do not. Therefore, the proactive prediction of patients’ response to NACT is a necessity to reduce the exposure to unnecessary doses of treatment, treatment costs, and side effects. Many researchers proposed prediction models to predict patients’ response to NACT either at early stage of treatment or prior to the initiation of the first cycle. They used various radiomics, pathological, and clinical predictors and markers. This review discusses some of the researches conducted the last decade based on statistical, machine learning, or deep learning approaches.
Abstract
Breast cancer retains its position as the most prevalent form of malignancy among females on a global scale. The careful selection of appropriate treatment for each patient holds paramount importance in effectively managing breast cancer. Neoadjuvant chemotherapy (NACT) plays a pivotal role in the comprehensive treatment of this disease. Administering chemotherapy before surgery, NACT becomes a powerful tool in reducing tumor size, potentially enabling fewer invasive surgical procedures and even rendering initially inoperable tumors amenable to surgery. However, a significant challenge lies in the varying responses exhibited by different patients towards NACT. To address this challenge, researchers have focused on developing prediction models that can identify those who would benefit from NACT and those who would not. Such models have the potential to reduce treatment costs and contribute to a more efficient and accurate management of breast cancer. Therefore, this review has two objectives: first, to identify the most effective radiomic markers correlated with NACT response, and second, to explore whether integrating radiomic markers extracted from radiological images with pathological markers can enhance the predictive accuracy of NACT response. This review will delve into addressing these research questions and also shed light on the emerging research direction of leveraging artificial intelligence techniques for predicting NACT response, thereby shaping the future landscape of breast cancer treatment.
1. Introduction
Breast cancer stands as the most prevalent malignancy among females globally, comprising 11.7% of all cancer incidences worldwide, with 2.3 million new cases and 685,000 fatalities recorded in 2020. It ranks as the fifth leading cause of cancer-related deaths on a global scale [1,2]. In the United States, projections for 2023 indicate an estimated 300,590 new cases, resulting in 43,700 deaths across both genders [3]. Among females, breast cancer contributes to 31% of all cancer instances, foreseeing 297,790 new cases and 43,170 deaths in the US during 2023 [3]. The significance of early breast cancer detection cannot be overstated, holding the potential to substantially lower mortality and morbidity rates, enhance prospects of cure and survival, and facilitate accessible and cost-effective treatment options [4].
There are two primary treatment options for breast cancer: local therapy, which comprises surgery and radiation therapy; and systemic treatment, which includes chemotherapy, endocrine (hormone) therapy, and targeted therapy [5,6]. The selection of the appropriate treatment for each patient depends on various factors, such as age, menopausal status, tumor subtype, and stage, as well as the patient’s overall health and preferences [5,7]. Moreover, systemic therapy traditionally follows surgery in the adjuvant setting, while in the neoadjuvant setting, it precedes surgery [8,9]. Neoadjuvant chemotherapy (NACT) can, in some cases, reduce tumor size, downstage the disease, minimize the extent of local surgery, and increase the likelihood of breast-conserving surgery (lumpectomy) over mastectomy [10,11]. Currently, it is considered the gold standard treatment for locally advanced breast cancer (LABC), which refers to an aggressive stage of breast cancer where the tumor size exceeds 5cm and may involve the skin or chest wall [12,13,14].
Additionally, NACT became the preferred treatment approach for HER2-positive (HER2+) and triple-negative breast cancers (TNBC), even in very early breast cancer (breast mass more than 1.5 cm), according to the American Society of Clinical Oncology (ASCO) and National Comprehensive Cancer Network (NCCN) guidelines [15,16,17,18]. In the case of HER2+ tumors, the neoadjuvant regimen often comprises the HER2-targeted therapy drugs (such as trastuzumab and pertuzumab) in addition to chemotherapy (e.g., anthracycline- or taxane-based therapies). In contrast, immunotherapy drugs (e.g., pembrolizumab) may be included in the neoadjuvant treatment of TNBC tumors [18,19]. Incorporation of these new drugs yields a paradigm shift in the management of these molecular types of breast cancer and increases the pathological complete response after neoadjuvant therapy. Neoadjuvant therapy (NAT) also has a crucial role in the guidance of the adjuvant treatment by evaluating the sensitivity of the tumor to therapy [20,21]. Moreover, the tumor response to NAT can be considered a significant prognostic factor for the likelihood of recurrence [21,22]. Given the numerous advantages of NACT treatment, this review will primarily focus on exploring its aspects.
The response to NACT can be classified into four categories: pathological Complete Response (pCR), pathological Partial Response (pPR), Progressive Disease (PD), and Stable Disease with No Response (SDNR) [10,23]. Several grading systems are used to evaluate pathological response, and the definition of pCR varies depending on these systems. For instance, while some systems assess the breast only, others consider both the breast and the Lymph Nodes (LNs). These grading systems encompass the Sinn Score, Sataloff, Miller-Payne grading system, Residual Cancer Burden (RCB), and AJCC ypTNM (8th Edition), among other systems discussed in a review by See et al. [23]. The neoadjuvant treatment setting often utilizes the same chemotherapeutic drugs as the adjuvant treatment setting, potentially resulting in comparable long-term and short-term side effects. These effects may include leukemia, infertility, osteoporosis, cardiomyopathy/heart diseases, fatigue, risk of infection, neuropathy, vomiting, nausea, cognitive impairment, and hair loss [24,25]. Therefore, the early prediction of patient responses aids in determining suitable treatment regimens, thereby reducing unnecessary toxicities, costs, and side effects related to NACT treatment. As a result, significant interest exists in developing predictive methods that utilize clinical, radiomic, pathological, and molecular markers [26]. The motivation for this review article stems from the unmet need for these prediction models. It is worth noting that some researchers such as O’Donnell et al. [27], Pesapane et al. [28], and Liang et al. [29] conducted systematic reviews and meta-analyses to compare the accuracies of the predictive models based on MRI images.
Recently, Artificial Intelligence (AI) and its sub-fields, namely machine learning (ML) and Deep Learning (DL), have assumed an increasingly pivotal role in predicting patients’ responses to treatment, while also optimizing personalized or precision medicine—a paradigm that intricately considers the individuality of each patient. This trend is underpinned by promising outcomes in detecting, diagnosing, and prognosing various cancers. Figure 1 delineates the fundamental constituents of a typical AI-driven treatment response prediction system. This system leverages medical images procured through diverse imaging modalities, encompassing both anatomical and functional perspectives, as its primary model inputs, followed by an intricate radiomics feature extraction procedure. Moreover, the prediction model can be supplemented with clinical markers (e.g., CA 125 and CA15-3), pathological indicators (such as estrogen receptor (ER), progesterone receptor (PR), Ki67 index, and HER2 expression), and treatment alternatives. The ultimate culmination of these inputs is the prediction of the patient’s response to NACT treatment, encompassing potential outcomes like pCR, pPR, PD, or SDNR.
Figure 1.
The main components of a typical AI-driven treatment response prediction system.
This review discusses studies published from 2010 to 2023 that utilized ML models, DL models, or statistical methods to predict responses in breast cancer patients who underwent NACT. Some researchers predicted Recurrence-Free Survival (RFS), Event-Free Survival (EFS), Disease-Specific Survival (DSS), or Progression-Free Survival (PFS), in addition to predicting the response to NACT. It is important to note that this review exclusively focuses on the outcomes of predicting patients’ responses to NACT. Studies that constructed their models based on conventional mammography and Contrast-Enhanced Spectral Mammography (CESM) images are detailed in Section 2, with their results, findings, markers, and patient numbers summarized in Table 1. Ultrasound-based studies are outlined in Section 3 and summarized in Table 2. Research-based on Positron Emission Tomography/Computed Tomography (PET/CT), Dynamic Contrast-Enhanced Magnetic Resonance Imaging (DCE-MRI), and Multi-modal imaging are addressed in Section 4, Section 5 and Section 6, respectively, with summaries presented in Tables 3–5. Throughout this paper, abbreviations such as ACC, AUC, SEN, SPE, PPV, and NPV denote accuracy, area under the curve, sensitivity, specificity, positive predictive value, and negative predictive value, respectively, in all tables.
2. Mammography and Contrast-Enhanced Spectral Mammography
Mammography serves as the standard imaging modality for the screening and detection of breast tumors. This low-dose X-ray imaging technique is commonly employed to identify masses, asymmetries, micro-calcifications, and architectural distortions with an accuracy ranging between 85% and 90% [30,31,32]. The two primary mammogram views are the mediolateral oblique (MLO) and craniocaudal (CC) views, supplemented by additional views like actual lateral, magnification, and point compression views, which are used for further assessment of abnormalities [33,34]. Notably, a limited number of studies (as indicated in Table 1) have employed mammography or contrast-enhanced spectral mammography to predict patients’ responses to NACT.
Recent AI studies predict early response to NACT using baseline mammogram images, showcased by Shin et al. [35] and Skarping et al. [36]. Shin et al. [35] developed a multi-scale patch-net resizing CC and MLO images to three scales (1792 × 1792, 1356 × 1356, 896 × 896) for a three-level image pyramid. They extracted features using ResNet-34 with a 3 × 3 kernel, and the classifier included a sigmoid activation followed by a fully connected layer. Kernel size affected performance: Area Under the Curves (AUCs) were (kernel 3) and (kernel 7); multi-scale outperformed single-scale (AUC = vs. AUC < ). Moreover, Skarping et al. [36] introduced a tumor detection model that distinguishes between pCR and non-pCR. The network features dual pathways based on ResNet-18. One processes tumor image patches, while the other handles contralateral cancer-free patches. Extracted features are concatenated and fed through fully connected layers to a soft-max layer. The model achieved notable metrics: AUC of , sensitivity of , and specificity of . However, the study’s limitations include a heterogeneous cohort in terms of tumor subtype and NACT period.
Contrast-Enhanced Spectral Mammography (CESM) is a dual-energy technique where low-energy and high-energy images, obtained after iodinated contrast administration, are subtracted to create diagnostic subtraction images [37,38]. It serves as an MRI alternative, especially for patients with contraindications like severe claustrophobia or MRI-incompatible implants (pacemakers, defibrillators, neurostimulators, cochlear implants) [39,40]. CESM shows comparable diagnostic accuracy and sensitivity to MRI in various studies [40,41,42], finding applications in breast cancer screening, diagnosis, tumor staging, monitoring, and predicting NACT response [37,38,43].
In addition to employing AI methodologies for predicting NACT responses, Xing et al. [44] utilized statistical approaches to forecast patient responses to NACT. Specifically, they employed a t-test statistical method to assess the significance of the reduction percentage of the CESM gray value (ΔCGV) in CC and MLO views for early response prediction. Their findings indicated that gray values of pCR were notably lower compared to non-pCR instances, revealing a significant discrepancy in ΔCGV between the two response categories after the second treatment cycle. Within the pCR group, ΔCGV was observed to be higher than in the non-pCR group, with a p-value of less than 0.001 and t-values of 5.430 and 3.942 for CC and MLO views, respectively. Moreover, the CC view exhibited an AUC of 0.776, a sensitivity of 75%, and a specificity of 72.15% at a cut-off value exceeding 26.41. However, it is noteworthy that relying solely on a single factor, namely the gray value, could be considered a significant limitation of their study.
In a separate study, Wang et al. [45] developed a radiomics nomogram that incorporates the radiomics score along with three features: Background Parenchymal Enhancement (BPE), Human Epidermal Growth Factor Receptor-2 status (HER-2 status), and Ki-67 index. This nomogram aims to predict the effectiveness of NACT in cancer treatment, utilizing multivariate logistic regression analysis. The study yielded an impressive AUC of 0.81. Their findings clearly highlight the radiomics model’s heightened discriminative power when compared to the pathological model. Notably, the radiomics model achieved AUCs of and in the validation set, outperforming the pathological model in both instances. Additionally, Mao et al. [46] employed multiple ML algorithms to examine the efficacy of radiomics features derived from both the tumor and its neighboring areas, encompassing intratumoral and peritumoral regions. They derived five distinct radiomics signatures from these regions: intratumoral, 5 mm peritumoral, 10 mm peritumoral, intratumoral + 5 mm peritumoral, and intratumoral + 10 mm peritumoral. Their analysis culminated in the finding that the radiomics features extracted from the intratumoral + 5 mm peritumoral region exhibited superior predictive performance, as evaluated by the Least Absolute Shrinkage and Selection Operator (LASSO) regression, with an AUC of , sensitivity of , and specificity of .
It is worth noting that the studies conducted by Wang and Mao [45,46] exhibited certain limitations, given their nature as single-institutional retrospective investigations reliant on relatively modest sample sizes. Such constraints undermine the broad applicability of their findings. Furthermore, the utilization of manual (as seen in [45]) and semi-automated (as observed in [46]) ROI segmentation introduces the potential for inter- and intra-observer discrepancies. Table 1 provides a comprehensive overview of these studies, encompassing mammography and CESM, detailing the research objectives, patient count, markers or predictors, outcomes, and significant discoveries.
Table 1.
Conventional Mammography & Contrast Enhanced Spectral Mammography (CESM).
3. Ultrasound
Ultrasound modality relies on detecting the reflected echoes of transmitted high-frequency sound waves [47]. Several researchers have utilized ultrasound-acquired images and data to predict patients’ response to NACT at an early stage, leveraging its accessibility and affordability. Moreover, its suitability for repeated scans during treatment is attributed to its independence from contrast agents and long scanning times [48,49,50]. Table 2 provides a summary of studies utilizing B-mode images, quantitative ultrasound parameters, and other ultrasound-based modalities for the early prediction of patients’ response to NACT. It is evident from Table 2 that the most frequently employed imaging markers in the literature to predict the NACT response encompass the spectral slope (SS), spectral intercept or 0-MHz intercept (SI), mid-band fit (MBF), average scatterer diameter (ASD), average acoustic concentration (AAC), attenuation coefficient estimate (ACE), and spacing among scatterers (SAS) [51,52]. Below, we will emphasize the most relevant factors for predicting NACT by utilizing markers extracted from ultrasound images.
Tadayyon et al. [52] utilized quantitative ultrasound (QUS) parameters derived from baseline images, as well as images captured after one week, four weeks, and eight weeks of NACT, to distinguish between responders and non-responders. Employing the k-nearest neighbor (KNN) approach, they assessed the potential of US parameters in discerning these response groups. Their investigation revealed that the most favorable outcomes were achieved through a combination of MBF, SS, and SAS, yielding accuracies ranging from to across different post-treatment time points. Additionally, they observed enhanced predictive accuracies, ranging from to , when baseline QUS parameters were amalgamated. Notably, despite conducting a prospective study, limitations were evident due to a relatively small sample size and an imbalanced dataset, consisting of 42 responders and 16 non-responders. To counteract this imbalance, they implemented random sampling with replacement.
Sadeghi-Naini et al. [48], Sannachi et al. [53], DiCenzo et al. [54], and Dasgupta et al. [55] incorporated US parameters with textural features extracted from each parametric map as non-invasive predictors of NACT response. Sadeghi-Naini et al. [48] employed Linear Discriminant Analysis (LDA) to investigate the efficacy of MBF, spectral slope, and 0-MHz intercept in predicting treatment response. They discovered that the optimal separability between the response groups was achieved by combining textural and spectral features extracted from MBF and 0-MHz intercept parametric images acquired after one week of treatment, yielding sensitivity and specificity of and an AUC of 1.
Furthermore, Sannachi et al. [53] and DiCenzo et al. [54] conducted textural analyses of SS, SI, MBF, ASD, AAC, ACE, and SAS parametric maps, employing three classifiers: k-Nearest Neighbor (KNN), Support vector Machine (SVM), and LDA. Sannachi et al. [53] investigated the predictive capabilities of spectral and textural features in relation to treatment response at one week, four weeks, and eight weeks. Their findings demonstrated that SVM outperformed KNN and LDA, achieving AUCs of 0.71, 0.87, and 0.92 at weeks 1, 4, and 8, respectively.
In contrast, DiCenzo et al. [54] conducted a multicenter study utilizing pre-treatment spectral and textural features. Their results indicated superior prediction performance by KNN with an accuracy of , sensitivity of , specificity of , and an AUC of . The optimal features were AAC-homogeneity, SI-energy, and SAS-energy. Other classifiers exhibited inferior performance: SVM attained an accuracy of and an AUC of , while FLD demonstrated an accuracy of and an AUC of .
In a prospective study conducted by Dasgupta et al. [55], five quantitative US parametric maps, twenty texture maps, and eighty higher-order texture derivatives were generated to discriminate between responders and non-responders. The authors employed three ML algorithms, namely FLD, SVM, and KNN. Notably, KNN exhibited exceptional performance, surpassing the other algorithms with an accuracy of , sensitivity of , specificity of , and an AUC of . In contrast, the AUCs of FLD and SVM did not exceed , and their accuracies remained below . The authors concluded that utilizing US texture-derivative features resulted in superior predictive performance compared to using textural features alone.
On the other hand, certain studies have integrated radiomics features with pathological features, which can be considered invasive predictors. Tadayyon et al. [56], Sannachi et al. [57], and Tadayyon et al. [58] incorporated US parameters and textural features with specific pathological features, namely estrogen receptor (ER), progesterone receptor (PR), and human epidermal growth factor receptor 2 (HER2). In 2017, Tadayyon et al. [56] conducted a prospective study and employed FLD, KNN, and SVM classifiers to analyze the predictive performance of pathological features and US parameters acquired prior to treatment from both the tumor core and its margins (at thicknesses of 3, 5, and 10 mm). The KNN classifier exhibited the highest performance with an accuracy of , a sensitivity of , a specificity of , and an AUC of when utilizing radiomics features for the tumor core and 5mm margins. However, the incorporation of pathological features with radiomics led to a decline in performance, as the accuracy and AUC decreased to and , respectively.
Furthermore, Sannachi et al. [57] categorized patients’ responses into three groups: complete responders, partial responders, and non-responders. They employed SVM to distinguish between these groups based on pathological and radiomics features extracted at 1, 4, and 8 weeks after the initiation of NACT. Their conclusion highlighted that the combination of pathological features with mean US parameters and texture features yielded the most robust prediction results, achieving accuracies of at week 1, at week 4, and at week 8. Conversely, the accuracies achieved using either pathological features or radiomics features alone did not surpass across all time points. Their findings underscored the need for a more extensive dataset encompassing an ample number of patients for each tumor subtype to facilitate more precise cross-validation.
In 2019, Tadayyon et al. [58] compared the prediction performances of the KNN classifier and the artificial neural network (ANN) classifier during the pretreatment stage. This analysis was based on features extracted from both the tumor and its margins (within a 5 mm perimeter around the tumor). The study encompassed both 2-class classification (categorizing responders and non-responders) and 3-class classification (identifying complete, partial, and non-responders). The results unveiled the superior performance of the ANN classifier across all experiments. In the context of binary classification, the ANN achieved an average accuracy of and an AUC of , while the KNN demonstrated an accuracy of and an AUC of . Furthermore, the study highlighted that pathological features played a pivotal role in the 3-class classification, whereas such significance was absent in the binary classification scenario.
Some studies utilized ultrasound-based techniques, including compression or strain elastography, as well as shear-wave elastography (SWE), for the purpose of monitoring and predicting NACT response. Both of these modalities evaluate the mechanical characteristics of tissues, particularly their stiffness and elasticity. Compression elastography involves assessing tissue deformation or strain following the application of static compression through a manual maneuver using an ultrasound transducer. In contrast, shear-wave elastography (SWE) quantifies the velocity of shear waves within the tissue, which are induced by focused acoustic radiation force [14,59,60]. Fernandes and colleagues [14] employed compression elastography to calculate relative changes in strain ratio (SR) of tumors throughout the treatment course. The strain ratio (SR) exhibited a noteworthy distinction between the two response groups following 2 weeks of NACT (p-value < ). They utilized two classifiers, KNN and Naive Bayes, for response prediction. The accuracy rates achieved by KNN at 1, 4, 8 weeks, and the preoperative scans, were , , , and , respectively. Notably, the Naive Bayes classifier outperformed its counterpart, attaining accuracies of , , , and across the four time points.
Additionally, Ma et al. [60] and Gu et al. [61] investigated the interplay between shear-wave elastography parameters and pathological features in predicting response. Ma et al. [60] introduced a multivariable linear regression model and demonstrated that the combination of the Ki-67 index with relative changes in SWE parameters (tumor stiffness) after the second cycle of NACT yielded effective predictive capability, surpassing the individual parameters. The AUCs for predicting non-responders using the Ki-67 index, the relative change of stiffness after the second cycle, and their combination were , , and , respectively. Similarly, Gu et al. [61] concluded that integrating Ki-67 with shear-wave parameters enhanced prediction performance at the mid-treatment stage, yielding an AUC of . Moreover, they identified mass characteristic frequency () as a novel predictor capable of determining the NACT endpoint for responders.
Several studies have employed DL techniques to predict treatment response, including Byra et al. [49,62], Xie et al. [63], Jiang et al. [50], Liu et al. [64], and Gu et al. [65]. In 2020, Byra et al. [62] introduced transfer learning using Siamese CNNs for pairwise image comparison between pre-treatment and post-first/second cycle images. With model fine-tuning, the AUC was for differentiating malignant and benign masses in US images, while without fine-tuning, the AUC reached . This led to the conclusion that the discriminatory features might not effectively predict response. In 2022, Byra et al. [49] proposed an RNN capable of processing both US images and raw RF data, using pre-trained CNNs as feature extractors. AUC was for response prediction from pre-treatment data using CNN pre-trained on US images and using RGB image-pre-trained CNN for data after the fourth cycle. Similarly, Xie et al. [63] constructed a dual-branch CNN where baseline and post-first cycle images were fed into separate branches, yielding better results than individual information use. Their model achieved notable metrics: sensitivity (), specificity (), and AUC (). For enhanced model generalization, further validation with multi-center data is recommended.
On the other hand, some researchers have incorporated invasive predictors into their DL models. Liu et al. [64], Gu et al. [65], and Jiang et al. [50] integrated pathological markers such as ER, PR, HER2, and Ki-67 into their models. Liu et al. [64] captured the dynamic changes of tumors before and after the first or second cycle using a Siamese network. The authors concluded that relying solely on pathological features did not yield satisfactory performance (with AUC not exceeding ). However, combining these features with dynamic change features resulted in impressive AUCs of and for the two external validation cohorts.
Furthermore, Gu et al. [65] developed a stepwise DL model to predict responses after the second and fourth cycles of NACT. They assessed the prediction performance of pathological features, radiomics features extracted by the DL model, and the combination of radiomics and pathological features at two time points (after the 2nd and 4th cycles). The results, as presented in Table 2, led to the conclusion that the proposed model effectively assists in early stepwise prediction. Nomograms have also been utilized in predicting NACT responses. Yang et al. [66] and Jiang et al. [50] developed nomograms for early assessment and prediction of treatment response. Yang et al. [66] combined pathological features with manually crafted radiomics features extracted from baseline images, images taken after the second cycle, and delta radiomics (the difference between pre- and post-treatment features). Their findings revealed that the nomogram, incorporating the Ki-67 index along with radiomics features from images captured before and after the second cycle, demonstrated the highest predictive accuracy, achieving an AUC of 0.866. In contrast, Jiang et al. [50] fused pathological features with radiomics features extracted through a DenseNet201-based CNN, in addition to manually crafted features from pre-treatment and post-treatment images. The resultant nomogram achieved an AUC of , an accuracy of , a sensitivity of , and a specificity of . Their study highlighted the efficacy of DL-based nomograms in effectively predicting pCR and offering significant insights for individualized therapy.
Table 2.
Ultrasound.
4. PET/CT
Positron Emission Tomography (PET) serves as a prevalent nuclear imaging method for evaluating the glycolytic metabolism of tumors [47,67]. This technique enables the characterization of primary tumors, determination of lymph node stages, and assessment of residual tumors following NACT [68,69]. Distinguishing malignant tumors from adjacent normal cells relies on the heightened glucose metabolism within abnormal tissues compared to normal ones [47,68]. Typically, PET scans are complemented by other imaging modalities like computed tomography (CT), magnetic resonance imaging (MRI), and mammography, subsequent to the introduction of a radioactive tracer such as 18F-fluorodeoxyglucose (18F-FDG), 18F-fluorothymidine (18F-FLT), 18F-Fluciclovine, and others [70,71]. 18F-fluorodeoxyglucose (18F-FDG) stands as the most commonly employed radioactive tracer in oncology [72,73]. Pertaining to PET parameters, the maximum standardized uptake value (SUVmax) signifies the highest concentration of the tracer (typically FDG) within the region of interest (ROI) or volume of interest (VOI) [74,75]. Due to potential noise-induced variability in SUVmax values, additional parameters like SUVpeak and SUVmean may be calculated. SUVmean reflects the average standardized uptake value of all voxels within the voxel of interest, while SUVpeak represents the parameter derived from averaging the standardized uptake values within a fixed-size, small volume of interest containing the region with the highest SUV [76,77,78].
Beyond these PET parameters, the metabolic tumor volume (MTV) denotes the total count of voxels in a VOI exhibiting uptake surpassing a specific SUV threshold, and the total lesion glycolysis (TLG) emerges as the product of MTV and SUVmean [76,79]. Despite the elevated costs and radiation exposure associated with PET scans, they hold promise in predicting treatment responses [47]. This section will delve into studies utilizing either FDG PET/CT or FLT PET/CT for the early prediction of NACT responses, and these studies will be summarized in Table 3. Furthermore, key factors will be underscored for predicting NACT outcomes by leveraging markers extracted from PET/CT images.
Buchbender et al. [80] and Andrade et al. [75] employed statistical methods, specifically the Mann–Whitney test, to predict patients’ responses. Their approach relied on assessing the relative change in the standardized uptake value (ΔSUV) between images acquired before treatment and those obtained after the second cycle. Additionally, they determined the optimal ΔSUV cut-off for distinguishing between pathological pCR and non-pCR cases, as well as responders and non-responders, utilizing receiver-operating curve (ROC) analysis. A statistically significant difference in ΔSUV between the two response groups was observed. Buchbender et al. [80] identified a ΔSUV of for pCR cases and for non-pCR cases, yielding a p-value of . Furthermore, the optimal ΔSUV threshold for discriminating pCR from non-pCR was determined to be , resulting in a sensitivity of , specificity of , and accuracy of . Similarly, differentiation of responders from non-responders was achieved using an optimal SUV threshold, yielding a sensitivity of , specificity of , and accuracy of , with an overall accuracy of .
In contrast, Andrade et al. [75] discovered a significantly higher SUV value for pCR cases in comparison to non-pCR cases , with a p-value of . They determined the optimal SUV threshold for distinguishing pCR from non-pCR to be , resulting in a sensitivity of , specificity of , and accuracy of . Moreover, their differentiation of responders from non-responders using an optimal SUV threshold yielded a sensitivity of , specificity of , and accuracy of with an overall accuracy of .
On the other hand, Koolen et al. [81] investigated changes in the maximum standardized uptake value (SUVmax) after 2–3 weeks and 6–8 weeks of treatment administration. They calculated SUVmax for the primary tumor, lymph nodes, a combination of both (using logistic regression), and the highest SUVmax (either primary tumor or lymph node). Their findings revealed that in HER2+ tumors, the AUC for predicting response using SUVmax after 3 weeks of NACT ranged from to (specifically, for the primary tumor, for axillary nodes, for the combined approach, and when using the region of the highest SUVmax). However, the AUCs derived from SUVmax after 8 weeks did not exceed across all regions. In contrast, the prediction of response in triple-negative breast cancer (TNBC) tumors proved to be more accurate. The AUCs achieved using SUVmax after 2 weeks of NACT ranged from to (specifically, for the primary tumor, for axillary nodes, for the combined approach, and when using the region of the highest SUVmax). Remarkably, the AUCs yielded from using SUVmax after 6 weeks exceeded .
Some researchers, such as Groheux et al. [82,83], Humbert et al. [84], and Luo et al. [85], have integrated pathological markers with PET/CT parameters to predict the response to NCAT. In 2013, Groheux et al. [82] utilized a t-test to examine the correlation between the response and SUVmax of the primary tumor and lymph nodes at baseline and after two cycles in HER2-positive patients. They found that neither the pathological markers nor the SUVmax at baseline significantly correlated with patients’ response; the associated p-values were greater than . However, non-pCR could be effectively predicted using SUVmax after the second cycle of NACT, achieving an accuracy of , a sensitivity of , and a specificity of with a cut-off value of less than . In 2014, Groheux et al. [83] investigated the predictive value of PET parameters and pathological markers in triple-negative tumor response prediction. They demonstrated that using a SUVmax threshold of in the primary tumor achieved an accuracy of , while a threshold of achieved an accuracy of , a sensitivity of , and a specificity of . Furthermore, they noted that pathological markers yielded lower prediction accuracy (with tumor grade achieving and T-stage achieving ).
On the other hand, Humbert et al. [84] and Luo et al. [85] combined pathological markers with radiomics and employed logistic regression to predict treatment response. Humbert et al. [84] explored the value of SUVmax after the first treatment cycle, in conjunction with various clinical and pathological markers (such as CA , ACE, CA-125 values, estrogen receptor, progesterone receptor, HER2 expression, Ki-67 index, androgen receptor, epidermal growth factor receptor (EGFR), Scarff-Bloom-Richardson (SBR) grade, and cytokeratin (CK) tumor expression). Their findings indicated that high SUVmax (p = ), elevated Ki-67 (p = ), and negative EGFR status (p = ) demonstrated significant associations with pCR. They achieved a predictive accuracy of for pCR cases using SUVmax, with a sensitivity of , specificity of , and an optimal SUVmax cut-off value of . Additionally, the authors identified that non-pCR cases could be predicted with an accuracy of by combining positive EGFR status and SUVmax less than .
Luo et al. [85], on the other hand, integrated Ki-67 (a proliferation marker) with SUVmax. They computed SUVmax values at baseline, after the second cycle, and after the fourth cycle of treatment. The AUC values for using Ki-67 alone, SUVmax after the second cycle, and SUVmax after the fourth cycle were , , and , respectively. Their analysis revealed that while Ki-67 alone did not significantly predict pCR, its combination with radiomics markers enhanced predictive power, achieving an AUC of , sensitivity of , and specificity of .
Cheng et al. [86], Antunovic et al. [87], and Li et al. [88] investigated the predictive potential of pathological markers and textural features for pCR prediction using PET/CT. Cheng and colleagues [86] explored changes in SUVmax, MTV, TLG, and textural features (outlined in Table 3) between pre- and post-second cycle images, alongside pathological markers. Significant differences in relative changes of SUVmax, entropy, and coarseness were observed between pCR and non-pCR cases in the HER2-negative group, yielding AUCs of 0.928, 0.808, and 0.8, respectively, (p-values < ). In the HER2-positive group, skewness and SUVmax moderately predicted pCR with AUCs of and , respectively, (p-values: and ). The authors concluded HER2 status strongly correlated with response, favoring pCR in HER2-positive tumors. Additionally, the textural analysis predicted pCR after two NACT cycles, while TLG and MTV lacked predictive efficiency.
Conversely, Antunovic et al. [87] and Li et al. [88] assessed pathological and radiomics markers’ predictive power for pCR before NACT initiation. Antunovic et al. [87] proposed four logistic regression models. Model (1) included age and tumor molecular subtype, achieving an AUC of . Discrimination improved slightly by adding SUVmax and TLG (AUC = ). Model (2) combined second-order (correlationGLCM) and higher-order (CoarsenessNGLDM, GLNUGLZLM) textural features with age and molecular subtype, yielding an AUC of . Models (3) and (4) employed different predictor thresholds ( and , respectively). Model (3) achieved an AUC of , featuring age, molecular subtype, correlation, and coarseness. Model (4) attained an AUC of , incorporating model (3) features along with ER, NACT type, Ki67, and GLNU. The authors concluded that augmenting with SUVmax, TLG, second-order, and higher-order radiomics features did not enhance response prediction performance.
Li et al. [88] employed a Random forest (RF) model for predicting treatment response by identifying PET/CT radiomics predictors. They extracted 2210 radiomic features including Run VarianceGLRLM, Zone varianceGLSZM, LGLREGLRLM, and Difference AverageGLCM. These radiomic features resulted in an AUC of , sensitivity of , specificity of , and accuracy of . Incorporating these features with age enhancements improved performance, yielding an AUC of , sensitivity of , specificity of , and accuracy of in the independent validation set. In contrast, the pathological model exhibited poor predictive performance, with an AUC of .
As previously mentioned, various tracers can be administered for the PET/CT scan. FLT has served as an indicator of proliferation [89], and a handful of studies have utilized FLT PET/CT scans to early predict responses to NACT. Crippa et al. [90] computed the SUVmax values in both the primary tumor and the predominant lymph node, along with their relative changes between baseline and post-first-cycle NACT images. They introduced a linear combination based on SUVmax in both the tumor and predominant lymph node, yielding an impressive AUC of and a p-value below . This combination effectively discriminated between patients with RCB indices of 0 & I (indicating near-complete response) and patients with RCB indices of II & III (representing moderate & extensive residual disease). The authors highlighted the potential utility of FLT PET/CT in predicting NACT response, stressing the importance of further validation in a larger population.
Table 3.
PET/CT.
5. DCE-MRI
Dynamic contrast-enhanced magnetic resonance imaging (DCE-MRI) typically necessitates the administration of a contrast agent (CA) for delivering functional (dynamic) insights into the tissues. It offers the ability to reveal details about tumor vascularity by non-invasively gauging fluctuations in contrast to agent uptake [91,92]. Additionally, DCE-MRI furnishes information about tumor morphology encompassing size, shape features, and textural heterogeneity. This imaging technique finds utility in screening high-risk women, diagnosing breast cancer, staging breast tumors, evaluating treatment efficacy, and predicting early response to NACT [91,93]. Table 4 presents a compilation of studies employing DCE-MRI data to forecast NACT response based on quantitative or semi-quantitative parameters.
NACT Prediction using DCE-MRI Radiomics: Several studies employed statistical methods, such as the t-test, Mann–Whitney test, or Kruskal–Wallis test, to assess the effectiveness of textural features in early response prediction based on pre-treatment DCE-MRI images. Ahmed et al. [94] and Teruel et al. [95] extracted 16 Gray-Level Co-occurrence Matrix (GLCM) texture features and examined their significance in distinguishing various response groups using statistical techniques. Ahmed et al. [94] observed that contrast and difference variance yielded p-values ranging from to , demonstrating a significant distinction between two response groups (partial responders & non-responders) using images captured at 1 and 2 minutes after contrast administration. Furthermore, they noted elevated contrast and difference variance values in the non-responders group, suggesting that tumors with heightened heterogeneity might exhibit reduced responses to chemotherapy.
In a similar vein, Teruel et al. [95] employed the same 16 GLCM features to differentiate between stable disease, partial response, and complete response. They identified that sum variance, entropy, and difference variance displayed statistical significance in distinguishing response groups at the 2-minute post-contrast mark, achieving p-values of , , and , respectively. Additionally, they compared textural features between stable disease and complete response groups, finding that 8 features achieved p-values below . The most noteworthy features were entropy, sum variance, and angular second moment. Using these features for predicting stable disease, ROC analysis produced AUCs of , , and , respectively.
Furthermore, sum variance, sum entropy, entropy, and difference variance exhibited significant differences between the pathological minimal residual disease group and the pathological non-responder group. Sum variance and sum entropy yielded AUCs of 0.689 and 0.686 for predicting non-responders. While Ahmed et al. [94] and Teruel et al. [95] employed the same 16 GLCM features, disparities in study design and response group definitions rendered their results incomparable. Nevertheless, they concurred that the optimal time point for response prediction was 2 min post-contrast, and these texture features could aid physicians in pre-treatment prediction of patient responses.
Machine learning algorithms have also been employed for predicting patients’ responses based on radiomics features, specifically GLCM or Gray-Level Run Length Matrix (GLRLM) features extracted from DCE-MRI images, as demonstrated by Giannini et al. [96], Fan et al. [97], and Cain et al. [98].
Giannini et al. [96] developed a Computer-Aided Diagnosis (CAD) system that automates tumor segmentation, extracts GLCM and GLRLM textural features from baseline images, and subsequently predicts pathological responses. They conducted predictions at both breast levels, including pCR and non-pCR cases, and breast and axillary levels encompassing pathologic complete response with or without residual metastatic lymph nodes (pCRN and non-pCRN, respectively). Logistic regression and Bayesian classifiers were employed for predicting pCR and pCRN. The logistic regression model achieved an AUC of 0.795 for pCR prediction (SEN: , SPE: ). In contrast, the same model achieved an AUC of for pCRN prediction (SEN: , SPE: ). Conversely, the Bayesian classifier yielded an accuracy, sensitivity, and specificity of , , and , respectively, for pCR prediction, and , , and , respectively, for pCRN prediction.
Fan et al. [97] employed an evolutionary algorithm to select optimal features from pre-treatment images, encompassing morphological, dynamic, textural (GLCM), first-order statistical, and background parenchymal (BPE) attributes. Their retrospective study encompassed two patient cohorts: the main group () and the reproducibility group (). Utilizing logistic regression, they predicted treatment response and conducted leave-one-out cross-validation (LOOCV) on the main cohort, yielding an AUC of , sensitivity of , and specificity of . Conversely, the reproducibility cohort exhibited an AUC of , sensitivity of , and specificity of . Moreover, validating the main cohort features on the reproducibility cohort produced an AUC of , while reproducibility cohort features on the main cohort resulted in an AUC of . BPE features were identified as performance-enhancing, with combined lesion and BPE features outperforming their individual counterparts.
Similarly, Cain et al. [98] introduced logistic regression and SVM models for predicting pCR to NAT. Encompassing 529 radiomics features, these models incorporated tumor and surrounding tissue attributes, with 12 features selected via stepwise multilinear regression. Significant features included the tumor-based attribute “change_in_variance_of_uptake” and volumetric Fibroglandular Tissue (FGT) enhancement. Models were trained on all NAT recipients and subsequently applied to sub-populations: NACT recipients and (TN/HER2+) NAT recipients. AUC values for (TN/HER2+) patients were and using logistic regression and SVM, respectively. Other sub-cohorts exhibited lower prediction performance, with AUCs below . The study underscored the potential of DCE-MRI images preceding NAT initiation in early pCR prediction, particularly for (triple negative/HER2+) patients undergoing NAT.
Eom et al. [99] employed statistical methods to assess the correlation between DCE-MRI and clinicopathological features with pCR. Their findings indicated that the tumor enhancement pattern (extracted from pre-NACT images) and the shrinkage pattern (extracted from post-NACT images) exhibited associations with pCR, with corresponding p-values of and . Furthermore, individuals achieving pCR were more inclined to display homogeneous enhancement and a concentric tumor shrinkage pattern compared to non-pCR patients, with odds ratios of and , respectively.
Further, Li et al. [100] investigated the correlation between pCR and four quantitative features mentioned in Table 4 through logistic regression analysis. Their analysis encompassed the entire patient cohort, revealing individual feature AUCs that did not surpass ; however, a fusion of these features resulted in an enhanced AUC of . Furthermore, the researchers categorized the data into four subgroups based on tumor subtype, classified by HR/HER2 status. The researchers concluded that the integration of the four features substantially enhanced the predictive capacity for pCR across all subtypes and the entire dataset.
Several studies have employed both DCE-MRI quantitative parameters (Ktrans, Kep, Ve, Vp, and i) and semi-quantitative parameters (such as wash-in, wash-out, peak enhancement, etc.) to predict treatment response. Li et al. [101], Tudorica et al. [102], and Drisis [103] utilized statistical methods for response prediction. In one study, Li et al. [101] assessed both quantitative and semi-quantitative DCE parameters to identify response predictors and distinguish between responders and non-responders. The semi-quantitative parameter, signal enhancement ratio washout volume, exhibited significant differences between the two response groups with an AUC of and a p-value of . Regarding quantitative parameters, Kep (estimated by three models: Tofts-Kety, extended Tofts-Kety model, and fast exchange regime model) achieved AUCs of , , and , respectively. The authors proposed Kep and signal enhancement ratio washout volume as potential response predictors, but emphasized the need for confirmation through further prospective studies.
In another study, Tudorica et al. [102] employed univariate logistic regression and C statistics to predict early pCR and non-pCR. They evaluated pharmacokinetic parameters using both the Tofts model (TM) and the Shutter speed model (SSM), along with the longest tumor diameter. The percentage change in Ktrans (TM), Ktrans (SSM), kep (TM), and i after one cycle of NACT yielded C values exceeding , indicating excellent predictive capability. Moreover, ve (TM) and ve (SSM), estimated after one cycle or at the midpoint, demonstrated C values between 0.8 and 0.9, indicating good predictive potential. However, the percentage changes in the longest diameter after one cycle and at the midpoint exhibited poor prediction with C values below .
Additionally, Drisis et al. [103] statistically assessed the predictive potential of maximum tumor diameter, Ktrans and Ve for early identification of responders and non-responders. The dataset was stratified into three subgroups based on tumor subtype. Using the pre-treatment scan, Ktrans achieved AUCs of () and () for the entire population and the triple-negative subgroup, respectively. Additionally, the baseline maximum diameter exhibited higher values in the non-response group and achieved an AUC of for the entire dataset. For the second scan after 2 or 3 NACT cycles, Ktrans achieved AUCs of , , and for the entire population, TN, and HER2+ groups, respectively.
On the other hand, Thibault et al. [104] extracted 1043 textural features from each of the 13 parametric maps. They employed a ridge regression model to predict RCB index values based on each map-feature pair (where RCB=0 indicates pCR, while any other RCB index indicates non-pCR). Their results revealed that distinguishing between pCR and non-pCR using the Ktrans (SM) map with RLM and the Gray-level non-uniformity feature achieved a sensitivity and specificity of (with an AUC of 1). Discrimination based on the Ve(SSM) map with Haralick and contrast features yielded a sensitivity of and specificity of . While validation on a larger cohort is necessary, these findings suggest that analyzing tumor heterogeneity through textural analysis of DCE parametric maps can aid in the early prediction of treatment response.
Furthermore, Lee’s group [105] assessed baseline perfusion parameters (Ktrans, Kep, and Ve) for both the tumor and contralateral breast’s background parenchyma (BPCL). They also performed 3D histogram analysis (including skewness, mean, kurtosis, 25th, 50th, and 75th percentiles) for each perfusion parameter using logistic regression. Although individual perfusion parameters exhibited limited predictive capacity for pCR, with AUCs ranging from 0.449 to 0.683, combining these parameters enhanced prediction performance. Notably, combining the skewness of tumor Ktrans and background parenchyma Ktrans yielded an AUC of 0.760 (p-value = ). The most robust prediction performance emerged from combining the skewness and 50th percentile of tumor Ve with Ve of BPCL, achieving an AUC of ().
Aside from employing statistical methods, researchers also employed ML algorithms for predicting treatment response based on images acquired either before treatment or after the first cycle of NACT. Ashraf et al. [106], Braman et al. [107], Caballo et al. [108], and Drukker et al. [109] conducted their studies using pre-treatment images, whereas Machireddy et al. [110] utilized images acquired after the initial cycle of NACT along with baseline images.
Ashraf et al. [106] employed logistic regression with leave-one-out cross-validation (LOOCV) to differentiate between pCR and non-pCR cases, based on pre-treatment images from 15 patients in the I-SPY-1 trial dataset. They incorporated morphological, kinetic features, and kinetic statistic features, comparing their outcomes with commonly used features. The proposed kinetic statistic features achieved an AUC of , while conventional features such as longest diameter, size-to-energy ratio (SER), maximum peak enhancement (MPE), and features derived from the characteristic kinetic curve achieved AUCs of , , , and , respectively. Their findings suggest that heterogeneity in kinetic statistics could enhance the predictive performance for treatment response using baseline images.
Furthermore, Machireddy and colleagues [110] employed a support vector machine (SVM) classifier to distinguish between pCR and non-pCR cases based on data acquired before and after the initial treatment cycle. They evaluated the predictive performance of GLCM, GLRLM, single-resolution, and multi-resolution fractal features from Ktrans, Kep, Ve, and i parametric maps. They observed that GLCM and GLRLM features tended to overfit the data, yielding markedly lower AUCs in the test set and higher AUCs in the training set. Moreover, they found that multi-resolution fractal features outperformed other features, achieving AUCs of , , , , and for Kep, i, Ve, Ktrans, and the concatenation of all parametric maps, respectively.
Conversely, Braman et al. [107] and Caballo et al. [108] utilized intratumoral and peritumoral features extracted from pre-treatment images to predict pCR and non-pCR cases. In their study, Braman et al. [107] included 117 patients (78 in the training set and 39 in the test set) and employed five different ML classifiers to distinguish pCR cases.
The optimal AUCs for SVM, LDA, Diagonal Linear Discriminant Analysis (DLDA), Naive Bayes (NB), and Quadratic Discriminant Analysis (QDA) were , , , , and , respectively. Furthermore, an additional experiment was conducted where patients were categorized into subgroups based on hormone receptor type: (HR+/HER2-) and (TN/HER2+). The AUCs of the classifiers are outlined in Table 4. In this second experiment, a 3-fold cross-validation approach was adopted due to the limited sample size in the two subgroups. The authors discovered that kinetic features displayed no significant disparity between the two response groups in all experiments. Intriguingly, peritumoral features, obtained from the region adjacent to the tumor, could be amalgamated with intratumoral features to enhance response prediction.
Conversely, Caballo et al. [108] devised logistic regression ML models to differentiate between pCR and non-pCR cases, utilizing baseline intra-tumoral and peri-tumoral features. The multivariate analysis achieved an AUC of when predicting pCR using the complete dataset. Additionally, upon stratifying the dataset according to tumor molecular subtype, the model demonstrated promising outcomes with AUCs of , , , and for luminal A, luminal B, HER2-enriched, and TN tumors, respectively. The study revealed that enhancement kinetics heterogeneity and time-dependent texture (4D texture) features held predictive value. Moreover, features extracted from both the tumor core and peritumoral region exhibited significance in predicting pCR, with predictive features from the tumor core contributing to and peritumoral features to of the prediction.
Furthermore, Drukker et al. [109] employed baseline radiomics features to predict pCR and lymph node status (LN status) following NACT in LN-positive patients. Linear discriminant analysis was employed to assess the classification performance of each feature individually, distinguishing between responders and non-responders. In contrast to most studies, they unveiled that features extracted from the primary tumor lacked meaningful predictive capability. Intriguingly, the features derived from LNs, especially statistics, demonstrated robust predictive performance, with an AUC of up to for pCR prediction and up to for LN status prediction following NACT.
In contrast to conducting a comprehensive investigation of the entire tumor for response prediction, certain researchers, such as Wu et al. [111] and El Adoui et al. [112], have adopted a strategy of partitioning the tumor into distinct subregions based on their respective response characteristics. Wu and colleagues [111] employed K-means clustering to segment the tumor into subregions using eigenmaps derived from principal component analysis (PCA). This process yielded three clusters or subregions within the tumor, identified by patterns of contrast agent washin and washout. Within each subregion, they extracted four Haralick texture features and leveraged the variations in these features between the baseline scan and the scan conducted after one treatment cycle to predict the tumor’s response. Their analysis encompassed textural features from enhancement maps, as well as eigenmaps both of the entire tumor and of individual subregions. Notably, their findings indicated that the most effective prediction performance was achieved by utilizing radiomics predictors derived from eigenmaps of distinct tumor subregions, resulting in an impressive AUC of , a sensitivity of , and a specificity of .
On a related note, El Adoui et al. [112] introduced a parametric response map (PRM) as a visual representation, employing a color map to delineate subregions of the tumor in accordance with their respective response types. This method involved a comparative analysis of tumor volumes and intensities before and after the initial NCAT cycle.
The classification of patients as positive responders under the PRM paradigm hinged on the percentage of positive responses exceeding that of negative responses, and vice versa for negative responders. Notably, their analysis demonstrated a correspondence between the proposed PRM approach and the ground truth, substantiated by p-values of for positive responses and for negative responses, as well as impressive AUC values of and , respectively, underscoring the effectiveness of their method.
El Adoui et al. [113] constructed a CNN model trained using baseline images and the images acquired after the initial NACT cycle, along with a fusion of these images to differentiate responders and non-responders to NACT. The experiments were replicated twice: once using images without tumor segmentation, and once using images with tumor segmentation by the U-Net DL architecture. When utilizing segmented tumor images, the AUC values were for baseline images, for images after the first cycle, and an improved for their combination. In contrast, the unsegmented tumor images demonstrated higher AUCs of , , and notably elevated performance of for baseline, post-first cycle, and combined images, respectively. They revealed that the utilization of unsegmented images outperformed segmented images, suggesting the potential utility of peritumoral areas in enhancing response prediction.
In a separate study, Khanna et al. [114] explored the role of transfer learning in response prediction. Their approach involved integrating pre-trained CNNs with ML techniques for prediction tasks. Feature extraction employed ResNet-18 and ResNet-50, while classification utilized ML methods like Decision Trees, Naïve Bayesian, KNN, and SVM. The dataset was divided using two strategies: 10-fold cross-validation and a hold-out validation, with a training to testing ratio. The authors highlighted the efficacy of integrating Fine KNN (with K = 1) and ResNet-18, employing Mann–Whitney U test for feature selection. This combination yielded outstanding predictive performance, achieving an AUC of 1, a sensitivity of , a specificity of , and an accuracy of when using the hold-out validation technique.
NACT Prediction using DCE-MRI Radiomics and Pathological Markers: Researchers also explored the combination of pathological markers and radiomics markers to predict response, either before neoadjuvant chemotherapy (pre-NACT) or at an early stage. Jimenez et al. [115] studied the role of integrating radiomics features extracted from pretreatment scans with a pathological marker which is tumor-infiltrating lymphocyte (TIL) in predicting pCR cases. They suggested that patients who achieved high levels of TIL (more than ) and a radiomics signature value < were considered to be pCR. Their model achieved an AUC of , an accuracy of , a sensitivity of , and a specificity of . They found that this combination of features outperformed using either radiomics features or pathological features alone.
Conversely, Golden et al. [116] performed textural analysis on kinetic maps extracted from pre and post-NACT scans. Also, morphological and pathological features were utilized. The logistic regression model’s AUC values for predicting pCR, residual lymph nodes (LNs), and residual tumor and lymph nodes, using pre-NACT radiomics features, were , , and , respectively. However, the use of pathological markers alone exhibited limited predictive power, with AUCs below for pCR and residual tumor and LNs. Conversely, it demonstrated moderate predictive power (AUC = ) for predicting residual LN metastases. Moreover, patterns of tumor response did not exhibit significant predictive power in any model (AUC < ).
Jahani’s group [117] extracted two distinct categories of features from the registered DCE scans, obtained before and after the initial cycle of NACT. The first category encompassed voxel-wise tumor deformation features, which elucidate alterations in tumor size, orientation, and shape (specifically, Jacobian (which is the ratio of the volume after the first cycle of NACT to the baseline volume), Anisotropic Deformation Index (ADI), and Slab-Rod Index (SRI)). The second category comprised voxel-wise changes in kinetic features (PE, WIS, WOS, and SER). These radiomics features achieved an AUC of 0.74 when employed in a logistic regression model to predict pCR. Additionally, an exploration into demographic and pathological markers’ potential for predicting pCR and RFS was conducted. The combination of age, race, hormone receptor status, and FTV resulted in an AUC of for predicting pCR and incorporating demographic, pathological, and voxel-wise features raised the AUC to . The authors proceeded to compare the predictive efficacy of voxel-wise features with that of aggregate features (representing mean or average value changes across the entire tumor). The aggregate features exhibited an AUC of 0.71, leading to the author’s conclusion that, for predicting pCR, voxel-wise features outperformed aggregate features.
Conversely, Sutton et al. [118] utilized a random forest classifier to evaluate and categorize pCR based on radiomics features extracted from both pre and post-NACT images, in conjunction with the tumor molecular subtype. Three models were constructed; the first model, utilizing solely radiomics features, yielded an AUC of , a sensitivity of , and a specificity of . Subsequent integration of the tumor molecular subtype with radiomics features marginally improved performance, resulting in an AUC of , a sensitivity of , and a specificity of . The third model, based on radiomics features excluding DCE-MRI intensity features, demonstrated similar performance to the first model (AUC: , SEN: , SPE: ), underscoring the value of textural and edge-based radiomics analysis in pCR classification.
In a separate study, Fan and colleagues [119] scrutinized tumor heterogeneity changes via morphological, first-order statistical, and textural analysis of images obtained before and after two cycles of NACT. A Support Vector Machine (SVM) classifier was employed to predict responders and non-responders. The prediction performance of baseline images and the Jacobian map proved subpar, with AUCs of and , respectively. Conversely, using images from the second cycle of NACT yielded an AUC of . Furthermore, a model based on feature changes between images taken during and prior to treatment resulted in an AUC of . Notably, combining features from all aforementioned images with the molecular subtype produced the most robust prediction performance, boasting an AUC of , a sensitivity of , and a specificity of .
Hussain et al. [120] integrated molecular subtyping and the Ki-67 index with radiomics features, subsequently comparing the predictive capabilities of five ML classifiers (SVM, Naive Bayes, KNN, Decision Tree, and Ensemble RUSBoosted Tree) in determining pCR patients, utilizing data from the I-SPY-1 TRIAL dataset. Employing the Ensemble RUSBoosted Tree model, when considering solely the molecular subtype, they achieved an AUC of 0.82 alongside an accuracy of . Conducting a textural analysis on MRI images acquired at baseline, after the first cycle, and at mid-treatment resulted in AUCs of , , and , and corresponding accuracies of , , and , respectively. Notably, merging the textural analysis results from the two time points (before and after the first cycle) yielded an impressive AUC of (with accuracy at ). However, the integration of the molecular subtype further enhanced prediction performance, elevating the AUC to (with accuracy reaching ).
Parametric response maps have been utilized to investigate regions of increased and decreased intensity within tumors at an early stage of treatment, aiding in response prediction. This approach has been adopted by Cho et al. [121] and Drisis et al. [122]. In the study by Cho et al. [121], a t-test was employed to compare the predictive performance of traditional pharmacokinetic parameters (specifically Ktrans, Kep, and Ve) with PRM analysis. The PRM analysis involved a voxel-wise comparison between baseline images and those acquired after the first cycle of NACT. Voxels with increased intensity (>10%) were labeled as PRMSI+, while those with decreased signal intensity were labeled as PRMSI-. Contrary to the conclusions drawn by many studies, the authors found no significant difference between pCR and non-pCR groups in terms of pharmacokinetic (PK) parameters and tumor volume change. Cho and colleagues demonstrated that voxels with increased signal intensity (PRMSI+) achieved an AUC of , a sensitivity of , and a specificity of at a cut-off of . Additionally, they examined the potential of pathological markers using the Fisher exact test and observed no significant distinction between pCR and non-pCR groups.
Drisis et al. [122], on the other hand, generated parametric response maps (PRMs) through an affine registration method, involving the subtraction of images acquired at baseline (reference image) and after the start of NACT (transformed image). Regions where voxel values showed an increase of more than were classified as non-responding regions (PRMdce+) while responding regions (PRMdce-) exhibited a decrease of more than in their voxel values post-therapy initiation. Voxels not falling within these subregions were categorized as (PRMstable). The study explored the potential of both pathological markers and PRMs in predicting non-pCR. The authors determined that pathological markers and PRMs achieved AUCs of and 0.88, respectively. They also identified PRMdce+ and grade (II) tumors as significant factors for non-pCR prediction, yielding an AUC of with a p-value below .
Table 4.
DCE-MRI.
Deep Learning approaches have demonstrated promising potential in predicting responses based on imaging and pathological features. Comes et al. [123], a pre-trained Convolutional Neural Network (CNN) was employed to automatically extract low-level features from images obtained before and after the initial cycle of NACT, replacing the need for manual feature extraction. The study also investigated the predictive capability of pathological features. Subsequently, the most optimal features were selected and utilized to construct an SVM classifier. The model relying on pathological features achieved an accuracy of , a sensitivity of , and a specificity of . By incorporating pathological features with pre- and early-treatment radiomics features, an impressive AUC of was achieved, along with an accuracy of , a sensitivity of , and a specificity of on the independent test set.
In a study by Peng et al. [124], a comparison was made between DL and conventional ML approaches in predicting response based on baseline pathological, kinetic, and radiomics features. Conventional ML involved handcrafted radiomics feature extraction and LASSO regression for optimal feature selection, with LDA emerging as the most robust classifier among the five ML models tested. In contrast, the DL approach employed a ResNeXt50 CNN for radiomics feature extraction and a Multilayer Perceptron Neural Network (MLP) for constructing models based on pathological and kinetic features. AUC values for models utilizing radiomics, kinetics, or pathological features alone, whether through LDA or DL, did not exceed 0.752. A modest enhancement in prediction performance was observed upon combining these features. However, the DL approach, incorporating all features, notably outperformed other models with an AUC of 0.832 and an accuracy of 77.2%.
Another noteworthy contribution by Li et al. [125] involved the creation of a nomogram to predict pCR in TNBC patients. This nomogram integrated logistic regression to identify independent response predictors from a collection of pathological, clinical, and radiomics markers extracted from baseline images. Notably, the nomogram was built upon three key predictors: AR status, tumor volume, and time to peak (TTP). The predictive performance of the nomogram was impressive, achieving an AUC of 0.79 in the validation cohort. The study further highlighted that tumors exhibiting a TTP of 2 min, large volumes, and positive androgen receptor expression had a lower probability of achieving pCR.
6. NACT Prediction Using Multi-Modal Radiomics
Liang et al. [126] employed statistical methods, including the t-test and Mann–Whitney U test, to examine the efficacy of DCE-MRI parameters and ADC values acquired at baseline and after the second cycle for the early prediction of pCR. They observed that the pre-treatment parameters did not exhibit a significant difference between pCR and non-pCR, with the individual parameters’ AUCs not exceeding 0.6. Nevertheless, all parameters displayed robust predictive performance after the second NACT cycle, except Ve and washout. Furthermore, a combination of wash-in, TTP, and ADC yielded the highest AUC of 0.886, accompanied by a sensitivity of 87.5% and a specificity of 82.11%.
On another note, Li et al. [127] explored the potential of DCE and DWI parameters obtained before and after the initial NACT cycle, alongside the percentage change in values between the two scans, to predict the response. Through ROC curve analysis, they evaluated the predictive ability of each parameter and the derived parameter (Kep/ADC). The researchers uncovered that the (Kep/ADC) parameter, calculated after one NACT cycle, outperformed all other individual parameters, achieving an AUC of 0.88, a sensitivity of 92%, and a specificity of 78% at a threshold value of 3.32 mm−2 [127].
O’Flynn et al. [128] investigated the predictive ability of MRI parameters acquired before and after the second cycle of neoadjuvant chemotherapy (NACT), along with their percentage changes, to anticipate treatment response. The most significant predictors were determined using LDA. Their findings indicated that a decrease in the enhancement fraction and tumor volume signified a pCR. The enhancement fraction exhibited an AUC of 0.76, a sensitivity of 63.2%, and a specificity of 76.9% at a threshold of −7%. In comparison, the reduction in tumor volume (with a threshold of −71%) achieved an AUC, sensitivity, and specificity of 0.77, 71.4%, and 76.9%, respectively.
On the contrary, Zhao et al. [129] utilized multivariate logistic regression to explore independent predictors of pCR from radiomic features extracted from Diffusion-Weighted Imaging (DWI) and DCE-MRI scans conducted before and after the second NACT cycle. Significant pCR-independent predictors included the Apparent Diffusion Coefficient (ADC) values after 2 cycles and the percentage decrease in both the early enhanced ratio E90 and tumor size. The corresponding odds ratios (ORs) were calculated as 1.041 (p = 0.037), 0.927 (p = 0.004), and 0.948 (p = 0.011), respectively. Their prediction model yielded an impressive AUC of 0.944, a sensitivity of 100%, and a specificity of 86.7% in the validation cohort. A nomogram based on this model was subsequently established. The study also revealed that baseline MRI features, age, molecular subtype, and other pathological markers did not exhibit significant differences between the pCR and non-pCR groups.
Bian et al. [130] developed a nomogram to forecast both NACT sensitivity and pCR. They assessed the predictive capabilities of two logistic regression models based on radiomic features (as detailed in Table 5) extracted from a combination of DCE, T2WI, and DWI. Model (1) achieved AUC values of 0.56 and 0.64 for predicting NACT sensitivity and pCR, respectively. However, model (2) exhibited superior performance, achieving an AUC of 0.91, an accuracy of 81.8%, a sensitivity of 100%, and a specificity of 75% in predicting NACT sensitivity. Similarly, it achieved an AUC, accuracy, sensitivity, and specificity of 0.91, 88.9%, 88.2%, and 90.9%, respectively, in predicting pCR. The authors developed a nomogram that integrated radiomic features from both models, revealing comparable discriminative power between model (2) and the nomogram.
Some studies, such as Tahmassebi et al. [131] and Eun et al. [132], have assessed the effectiveness of radiomics features in predicting treatment response through the application of ML classifiers. In their study, Tahmassebi et al. [131] employed both qualitative and quantitative features extracted from multi-sequence MRI scans before and after the initial NACT cycle. The authors employed eight classifiers, namely LR, SVM, SGD (stochastic gradient descent), LDA, RF, DT, adaptive boosting (AdaBoost), and extreme gradient boosting (XGBoost), to predict DSS, RFS, and RCB—an indicator of whether patients achieved pCR. The results revealed XGBoost’s superior performance in terms of high accuracy and stability, with AUCs ranging from 0.8577 to 0.9430 for RCB prediction. Notably, response predictors included peritumoral edema (on T2WI), minimum ADC (on DWI), complete shrinkage pattern, changes in tumor size, and mean transit time (on DCE). Eun et al. [132] explored the potential of textural features extracted from pre- and mid-treatment images, as well as the differences between them, using contrast-enhanced T1-weighted, ADC mapping, DWI, and T2-weighted MRI. Employing seven ML classifiers, they determined that random forest surpassed other classifiers. Furthermore, mid-treatment scans demonstrated optimal prediction performance for T1 contrast-enhanced-weighted, DWI, and ADC mapping, yielding AUCs of 0.82, 0.73, and 0.69, respectively. In contrast, the difference between pre- and mid-treatment features excelled exclusively in the T2-weighted sequence, attaining an AUC of 0.67. Notably, pre-treatment feature AUCs across all sequences did not surpass 0.57.
Other researchers, including Liu et al. [133], Syed et al. [134], Chen et al. [135], Chen et al. [136], and Xiong et al. [137], explored the fusion of pathological markers with pretreatment multi-sequence MRI radiomics features to enhance the prediction of patient responses to NACT.
In a study conducted by Liu et al. [133], radiomics features were extracted from T2WI, DWI, T1+C sequences, and their combinations. Furthermore, the study assessed the predictive capacity of pathological markers. The proposed SVM models were validated across three independent cohorts (n = 99, 107, & 80). The radiomics features from individual MRI sequences yielded AUCs not exceeding 0.64 in any validation cohort. In contrast, the multi-sequence radiomics model achieved AUCs of 0.70, 0.68, and 0.79 across the respective validation cohorts. The integration of pathological markers (ER, PR, and HER2) with multi-parametric MRI radiomics enhanced performance, resulting in AUCs of 0.79, 0.71, and 0.80.
Similarly, Syed et al. [134] combined non-imaging features (pathological markers) with GLCM features to predict treatment response. However, radiomics features were extracted from DWI and DCE sequences at three distinct time points (pre-treatment, early treatment at 3 weeks, and mid-treatment at 12 weeks of NACT). Utilizing an XGBoost ML classifier with 5-fold cross-validation on publicly available data, the author’s predicted response. The mean AUCs of prediction models based on ADC, DWI, DCE, the combination of DWI and DCE, and all MRI features combined were 0.85, 0.871, 0.903, 0.916, and 0.933, respectively. Additionally, non-imaging features achieved an AUC of 0.919. The amalgamation of all MRI features with non-imaging attributes yielded optimal prediction performance, resulting in an AUC of 0.951, precision of 0.815, and recall of 0.926. The study concluded that XGBoost holds promise for early patient response prediction based on GLCM and pathological features.
Chen et al. [135] extracted a total of 984 radiomics features from pre-treatment DCE, T2WI, and DWI images. Among these, six features were selected—three from T2WI and three from DCE—to construct the radiomics signature using a random forest approach. The resulting radiomics signatures demonstrated notable performance metrics in the test set, including an AUC of 0.834, a sensitivity of 80%, and a specificity of 73.21%. The study also explored the relationship between pathological markers and pCR, revealing that ER and PR statuses could serve as independent predictors of pCR. Furthermore, a predictive nomogram was developed by incorporating ER, PR, and the radiomics signature, yielding an improved AUC of 0.879, a sensitivity of 83.57%, and a specificity of 82.19%. The combined use of DWI and T2WI, along with ER and PR status, exhibited strong predictive capabilities.
In a related work, Chen et al. [136] constructed a novel nomogram that integrated baseline radiomics features from DCE and ADC maps with pathological markers to distinguish between pCR (grade 5) and pPR (grades 1–4 on the Miller-Payne grading system). The authors employed logistic regression to establish prediction models based on ADC maps alone, DCE images alone, and a combination of ADC maps and DCE. The corresponding AUCs were measured at 0.639, 0.789, and 0.68, respectively. Additionally, an exploration of the predictive capacity of pathological markers resulted in an AUC of 0.793. Notably, the study concluded that the most effective predictive performance was achieved by combining ER and PR statuses with radiomics features from both ADC maps and DCE images. This combined approach outperformed the use of individual feature sets, achieving an AUC of 0.837, an accuracy of 0.893, a sensitivity of 0.714, and a specificity of 0.952.
Xiong et al. [137] assessed the role of T2WI, DCE, and DWI sequences in predicting the response of NACT-insensitive breast cancers prior to treatment (specifically, grade 1 & 2 cases in the Miller-Payne grading system). They constructed a prediction model that integrated four radiomics markers with two independent pathological factors (HER2 status and Ki-67 index), identified through multivariable logistic regression. This composite model achieved an AUC of 0.935 and an accuracy of 93.55%, surpassing both radiomics-only models (AUC: 0.83) and pathological marker-based models (AUC: 0.792) during validation. These findings suggest the efficacy of a nomogram based on radiomics extracted from pre-treatment multi-sequence MRI scans, along with HER2 status and Ki-67 index, in effectively predicting NACT-insensitive cases.
Joo et al. [138] developed a multimodal DL model for predicting pCR based on pre-treatment T2WI and DCE-T1WI subtraction images, along with clinico-pathological markers. They constructed two 3D ResNet-50-based CNNs to extract radiomics features from the entire bilateral MRI images. The AUCs for the models using T2WI images, DCE-T1WI subtraction images, and clinico-pathological markers were 0.663, 0.725, and 0.827, respectively. Combining T2W and DCE-T1W subtraction images produced an AUC of 0.745 and an accuracy of 73.6% (sensitivity: 48.6%, specificity: 85.3%). Furthermore, They found that the optimal prediction performance emerged from the integration of clinicopathological markers, T2W, and DCE-T1W subtraction images, yielding an AUC of 0.888, accuracy of 85%, sensitivity of 66.7%, and specificity of 93.2%.
Yoon et al. [139] utilized multiple logistic regression to assess the value of textural features extracted from baseline PET/CT and DWI scans in distinguishing responders from non-responders. The ranges of p-values for the selected texture features are presented in Table 5. They concluded that textural features hold predictive potential, offering insights into tumor heterogeneity.
On the other hand, Umutlu et al. [140] examined the potential of radiomics features to predict treatment response using baseline PET/MRI scans. Employing SVM with 5-fold cross-validation, they predicted pCR across the entire patient cohort and within two molecular subtype subgroups ((HR+/HER2-) and (TN/HER2+)). The combined application of all MRI sequences and PET yielded the most robust predictive performance for the entire cohort, resulting in an AUC of 0.8, an accuracy of 77.4%, a sensitivity of 81%, a specificity of 73.8%, a PPV of 75.6%, and NPV of 79.5%. Within the (HR+/HER2-) subgroup, the same imaging dataset achieved superior AUC and accuracy values (0.94 and 85.2%, respectively), accompanied by an 85.2% sensitivity and specificity. The authors’ conclusion emphasized the capacity of PET/MRI to offer an accurate radiomics analysis for early pCR prediction, particularly in HR+/HER2- patients.
A comparison was made by Choi and colleagues [141] between an Alexnet-based CNN model and conventional methods, to predict responders and non-responders to NACT based on PET/CT and DWI scans. The proposed CNN model demonstrated AUCs of 0.886, 0.98, 0.602, and 0.701, along with accuracies of 97%, 95%, 85%, and 88% for PET0, PET1, MRI0, and MRI1, respectively, (where 0 represents baseline scans and 1 represents scans after the first NACT cycle). Conversely, the AUCs of conventional parameters including SUV, TLG, MTV, and ADC remained below 0.7 in both baseline and follow-up scans, with accuracies falling short of 84%. Furthermore, improvements were observed in AUC values (0.805, 0.737, 0.758, and 0.752) for differences in these parameters between the two scans, denoted as SUVmax, MTV, TLG, and ADC.
Montemezzi et al. [142] integrated pathological and radiomics features obtained from pre-NACT PET/CT and DCE-MRI scans to predict pCR.They employed three classifiers (Random Forest, Support Vector Machine Regression (SVR), and Logistic Regression) in conjunction with leave-one-out and leave-two-out cross-validation techniques. The evaluation encompassed five feature groups (mentioned underneath Table 5). They found that the incorporation of both radiomics and pathological markers resulted in elevated AUC values of 0.96 and 0.98. The study demonstrated that the fusion of DCE-MRI and PET/CT radiomics with pathological markers led to enhanced predictive performance.
Table 5.
Multi-modal Imaging.
7. Discussion
This comprehensive review article has delved into the intricate challenge of the variable responses observed in NACT. The central thrust of this discourse lies in the exploration and development of predictive models capable of stratifying patients based on their probable response to NACT. A nuanced emphasis has been placed on the evolution of the predictive landscape, specifically the integration of radiomic and pathological markers. The objectives sought to uncover resilient radiomic markers that exhibit correlations with NACT response, while concurrently probing the potential amplification of predictive precision through the amalgamation of radiomic markers derived from radiological images and classical pathological markers.
The endeavor to unravel the complexities of NACT response prediction has invoked diverse avenues of research. Extensive investigations have been conducted, traversing the terrain of the tumor core and its margins (peritumoral regions), as evident in [58,98,107]. A pivotal narrative echoed by [46,108,113,120] accentuates the merits of encompassing a broader spatial context within feature extraction strategies.
Our review has shown that the predictive landscape of NACT responses has undergone considerable evolution, especially with the incorporation of both radiomic and pathological markers. Emphasis on the evolution of this landscape becomes apparent when noting that 96% of articles published in the last 15 years employ radiomic markers derived from radiological images. Furthermore, 92% of these articles have documented a statistically significant correlation between at least one radiomic feature and NACT response.
Diverse imaging modalities have been harnessed to navigate the objective of NACT outcomes prediction. Mammography,traditionally seen as the cornerstone of breast tumor detection, has undergone a transformative phase with artificial intelligence integrations. Various features have been extracted from mammogram images to predict the outcome of NACT. Shape features, textural features, and the percentage of gray value change between scans have been utilized as predictive indicators. Shin et al. [35] and Skarping et al. [36], for instance, have effectively used AI to derive insights from mammogram images, with Skarping et al. distinguishing between pCR and non-pCR, recording a specificity of 90% and sensitivity of 46%. Moreover, CESM, as demonstrated by Xing et al. [44], has struck a balanced performance with a specificity of 72.15% in the CC view and 75% sensitivity. The research landscape, marked by studies like those from Wang et al. [45] and Mao et al. [46], is hinting toward the increasing importance of radiomics, with sensitivities and specificities touching the ranges of 57.7% and 90.9% respectively.
A parallel trajectory unfolds in studies utilizing ultrasound, where QUS parameters (SS, SI, MBF, ASD, AAC, ACE, and SAS) have been scrutinized extensively, often integrated with textural analyses. The exploration of elastography variants, namely strain elastography and shear-wave elastography, has also unveiled pivotal features such as strain ratio, tumor stiffness, and elasticity. Noteworthy is the DL radiomics nomogram by Jiang et al. [50], which registers a sensitivity of , and a specificity of .
The scope broadens further, encapsulating PET/CT investigations, where SUVmax represents the maximum standardized uptake value change between baseline and follow-up scans. Augmenting this are MTV, TLG, SUVpeak, SUVmean, and an array of textural features, contributing collectively to the predictive tapestry. Research spearheaded by Buchbender et al. [80], Andrade et al. [75], and Groheux et al. [82,83] have established SUVmax’s promise, with sensitivities ranging from 75% to 85.7%. Moreover, merging SUVmax with textural features, as demonstrated by Cheng et al. [86], holds promise in enhancing predictive accuracy through a multi-faceted approach.
However, amidst all imaging modalities, DCE-MRI emerges as the undeniable frontrunner. Its omnipresence in the literature and the stellar results linked with it accentuate its unparalleled value. The domain of DCE-MRI has proven equally intricate, unfurling a plethora of features. These encompass quantitative parameters like Ktrans, Kep, Ve, Vp, and i. Semi-quantitative parameters like wash-in, wash-out, and peak enhancement intertwine with morphological, statistical, and textural features such as GLCM and GLRLM. Moreover, the convergence of DCE-MRI with DWI holds promise, prominently featuring ADC maps and values (maximum, minimum, and mean) as pivotal predictors. The versatility of DCE-MRI allows for the integration of data from digital breast tomosynthesis. Further, its adeptness in synthesizing molecular subtypes, clinical markers, and radiomic features, has a capability that appears challenging for other modalities to rival. For instance, Comes et al. [123]’s combined strategy (incorporating pathological features with radiomics features) achieved an impressive AUC of was achieved, along with an accuracy of , a sensitivity of , and a specificity of . Additionally, Hussain et al. [120] reached an AUC of 0.98 and an accuracy of , emphasizing the potential of DCE-MRI’s radiomics when integrated with the molecular subtype. Nevertheless, it’s imperative to emphasize that while DCE-MRI seems superior, the best modality or marker may still oscillate depending on the clinical scenario, resource allocation, and individualized patient parameters.
Shining brightly on the horizon is the concept of multi-modal imaging that truly provides insights into the potential of integrating predictive markers from various imaging modalities. As this approach beckons exploration, it potentially paves the way for even more refined and accurate predictions in the near future. Across the evaluated imaging modalities, certain markers stood out as robust indicators of treatment response. Notably, in MRI studies, texture features from contrast-enhanced T1-weighted images at mid-treatment consistently exhibited strong predictive power. Noteworthy PET parameters, such as TLG and SUVmax, also showed substantial promise in prognosticating pCR. Variables such as hormone receptor status (ER/PR), HER2 expression, and Ki-67 proliferation index were frequently linked to treatment outcomes. Integrating these factors with multi-modal imaging data, such as radiomics extracted from PET/CT or MRI, markedly improved predictive accuracy. Joo et al. [138], a prime example, showcased a multimodal DL model that combined clinicopathological information with pre-treatment MRI images, attaining a high specificity of 93.2%, an accuracy of 95% and an AUC of 0.89 for post-first-cycle PET images. Similarly, Umutlu et al. [140] leveraged multiparametric PET/MRI to predict pCR with promising results (average AUC = 0.93, 86.4% accuracy, 86.7% sensitivity, and 86% specificity). The fusion of pathological markers with radiomics features has demonstrated varying impacts on prediction models. In most cases, integrating pathological markers has led to improved prediction capabilities. However, exceptions like [45,46,56,64,65,82,116] highlight instances where pathological factors did not significantly correlate with response or failed to enhance model performance.
These clinical implications of accurate NACT response prediction are profound, offering the potential to revolutionize personalized treatment strategies and improve patient outcomes. By identifying patients who would benefit from NACT and sparing others from potentially ineffective treatment, predictive models align with the broader goals of precision medicine.
8. Limitations and Future Perspectives
Despite these promises of NACT response predictive models, there are clear limitations and challenges to be addressed. Differences and variations in therapeutic regimens, tumor molecular subtypes, scan timings, imaging protocols, and sample sizes have led to inconsistencies in the results across studies.
Notably, when the same predictors were employed, different studies yielded conflicting outcomes. For instance, SUVmax showed a correlation with pathological response in TNBC patients as indicated by Groheux et al. [83]. However, contrasting findings were presented by Luo et al. [85] and Groheux et al. [82], showing no significant correlation for LABC and HER2+ patients, respectively. Additionally, Koolen et al. [81] highlighted that SUVmax might be a significant predictor after two weeks of NACT for TNBC patients. Yet, this predictor was not found significant in a study for HER2+ patients by Groheux et al. [82].
Regarding PK parameters extracted from DCE-MRI at baseline scans, disagreements were observed across studies. While Drisis et al. [103] found Ktrans could differentiate responders from non-responders, Braman et al. [107] argued that PK parameters did not show any significant difference between pCR and non-pCR. Lee et al. [105] also asserted that individual perfusion parameters lacked high predictive capability. Tudorica et al. [102] and Li et al. [101] presented percentage changes in PK parameters after one NACT cycle as effective predictors, a finding that was contradicted by Cho et al. [121]. Additionally, the predictive performance evaluation results of the models trained by Fan et al. [97] on two independent patient sample groups showed some differences.
Apart from the aforementioned inconsistencies, another pertinent limitation is the largely retrospective nature of many studies, often encompassing only a small cohort of patients. These studies that might need further validation include those conducted by Sadeghi-Naini et al. [48], Tadayyon et al. [52,56], Antunovic et al. [87], Giannini et al. [96], Li et al. [101], and Crippa et al. [90]. The absence of a standardized protocol further complicates matters, with each study employing unique methodologies, features, CNN layers, and classifiers. The use of multiple software applications for radiomics feature extraction only adds to the lack of uniformity. Moreover, the high cost and complexity associated with AI applications in routine imaging require specialized software and personnel expertise.
From a forward-looking perspective, future research should aim to bridge the remaining gaps in the field. While our understanding of tumor biology deepens and AI technologies advance, the promise of informed NACT strategies to transform patient care becomes increasingly tangible. The domain is broad and rich, extending from the exploration of diverse imaging modalities to the integration of clinical and molecular data. This should be built upon a strong foundation of prospective clinical trials and expansive, balanced multi-institutional datasets. As the field evolves, advanced models can also be refined to contend with dataset limitations, yielding robust, validated, and clinically impactful predictive models.
It is crucial to prioritize the development of standardized protocols, including imaging techniques, feature extraction methodologies, and analysis frameworks. Harmonizing these protocols can reduce variations and facilitate more comparable and reproducible research outcomes. These initiatives can bolster the validity of study findings and enhance the generalizability of predictive models. Moreover, fostering collaborations across research institutions can lead to a broader consensus on predictors and their efficacies, potentially ironing out the inconsistencies that currently plague the field.
In addition to addressing inconsistencies, it’s also imperative to focus on the integration of AI technologies with traditional radiomic analyses. While the potential of AI in enhancing NACT prediction is immense, its adoption is currently hindered by several factors, including the complexities of AI software and a lack of familiarity among radiologists. Efforts should be made to demystify AI technologies and promote their wider acceptance and integration into clinical practice. Workshops, training programs, and interdisciplinary collaborations can bridge the knowledge gap and ensure that the full potential of AI-driven models is realized in the realm of breast cancer treatment. While the trajectory of breast cancer treatment is poised for transformation, the path forward requires concerted efforts to address present challenges. By resolving inconsistencies, standardizing protocols, and embracing AI advancements, we can aspire for a future where NACT response predictions are both reliable and integral to personalized breast cancer management.
9. Conclusions
Breast cancer remains a global challenge necessitating innovative treatments. Neoadjuvant chemotherapy (NACT) holds promise in improving outcomes by diminishing tumor sizes and facilitating less invasive surgeries. However, the diverse patient responses underscore the need for accurate predictive models. This review extensively examines NACT response prediction by integrating radiomic and pathological markers from various imaging modalities. Valuable radiomic features are identified, particularly when considering markers from both tumor core and peritumoral margins. While each imaging modality has its merits, DCE-MRI stands out when combined with pathological markers and clinical data, a sentiment echoed across various studies. Despite challenges like limited data, collaborative efforts can build robust AI models that aid evidence-based clinical decisions. Accurate NACT response prediction has profound clinical significance, optimizing outcomes and reducing unnecessary interventions. With the advancement of AI technologies and collaboration paving the way for personalized care, the synergy between radiomic and pathological markers and the potential of informed NACT strategies can revolutionize breast cancer treatment.
Author Contributions
Conceptualization, B.E., A.A., M.S., A.M., M.Z., R.A., K.A., M.A. and A.E.-B.; writing—original draft preparation, B.E., A.A., M.S. and A.E.-B.; writing—review and editing, B.E., A.A., M.S., A.M., M.Z., R.A., K.A., M.A., M.G., S.C., H.E.-D.M. and A.E.-B.; supervision, H.E.-D.M. and A.E.-B.; project administration, M.G., S.C., H.E.-D.M. and A.E.-B. All authors have read and agreed to the published version of the manuscript.
Funding
This research received no external funding.
Conflicts of Interest
The authors declare no conflict of interest.
Abbreviations
The following abbreviations are used in this manuscript:
| CESM | Contrast Enhanced Spectral Mammography |
| NACT | Neoadjuvant Chemotherapy |
| NAT | Neoadjuvant Therapy |
| pCR | pathological complete response |
| pPR | pathological partial response |
| ML | Machine Learning |
| DL | Deep Learning |
| AUC | Area Under Curve (ROC) |
| SEN | Sensitivity |
| SPE | Specifecity |
| HER-2 | Human Epidermal Growth Factor Receptor-2 |
| ER | Estrogen Receptor |
| PR | Progesterone Receptor |
| BPE | Background Parenchymal Enhancement |
| DCE-MRI | dynamic contrast-enhanced magnetic resonance imaging |
| FGT | Fibroglandular Tissue |
| TN | Triple Negative |
| NGTDM | Neighborhood Gray Tone Difference Matrix based features |
| GLCM | Gray Level Co-occurrence Matrix |
| GLRLM | Grey Level Run Length Matrix |
| GLSZM | Grey Level Size Zone Matrix |
References
- Sung, H.; Ferlay, J.; Siegel, R.L.; Laversanne, M.; Soerjomataram, I.; Jemal, A.; Bray, F. Global cancer statistics 2020: GLOBOCAN estimates of incidence and mortality worldwide for 36 cancers in 185 countries. CA Cancer J. Clin. 2021, 71, 209–249. [Google Scholar] [CrossRef] [Scilit] [PubMed]
- Cancer—who.int. Available online: https://www.who.int/news-room/fact-sheets/detail/cancer (accessed on 1 July 2023).
- Siegel, R.L.; Miller, K.D.; Wagle, N.S.; Jemal, A. Cancer statistics, 2023. CA Cancer J. Clin. 2023, 73, 17–48. [Google Scholar] [CrossRef] [Scilit] [PubMed]
- Vargas, H.I.; Anderson, B.O.; Chopra, R.; Lehman, C.D.; Ibarra, J.A.; Masood, S.; Vass, L. Diagnosis of breast cancer in countries with limited resources. Breast J. 2003, 9, S60–S66. [Google Scholar] [CrossRef] [Scilit] [PubMed]
- Nounou, M.I.; ElAmrawy, F.; Ahmed, N.; Abdelraouf, K.; Goda, S.; Syed-Sha-Qhattal, H. Breast cancer: Conventional diagnosis and treatment modalities and recent patents and technologies. Breast Cancer Basic Clin. Res. 2015, 9, 17–34. [Google Scholar] [CrossRef] [Scilit]
- Shien, T.; Iwata, H. Adjuvant and neoadjuvant therapy for breast cancer. Jpn. J. Clin. Oncol. 2020, 50, 225–229. [Google Scholar] [CrossRef] [Scilit]
- Waks, A.G.; Winer, E.P. Breast cancer treatment: A review. JAMA 2019, 321, 288–300. [Google Scholar] [CrossRef] [Scilit]
- Kerr, A.J.; Dodwell, D.; McGale, P.; Holt, F.; Duane, F.; Mannu, G.; Darby, S.C.; Taylor, C.W. Adjuvant and neoadjuvant breast cancer treatments: A systematic review of their effects on mortality. Cancer Treat. Rev. 2022, 105, 102375. [Google Scholar] [CrossRef] [Scilit]
- Korde, L.A.; Somerfield, M.R.; Carey, L.A.; Crews, J.R.; Denduluri, N.; Shelley Hwang, E.; Khan, S.A.; Loibl, S.; Morris, E.A.; Perez, A.; et al. Neoadjuvant Chemotherapy, Endocrine Therapy, and Targeted Therapy for Breast Cancer: ASCO Guideline. J. Clin. Oncol. 2021, 39, 1485–1505. [Google Scholar] [CrossRef] [Scilit]
- Mani, S.; Chen, Y.; Li, X.; Arlinghaus, L.; Chakravarthy, A.B.; Abramson, V.; Bhave, S.R.; Levy, M.A.; Xu, H.; Yankeelov, T.E. Research and applications: Machine learning for predicting the response of breast cancer to neoadjuvant chemotherapy. J. Am. Med. Inform. Assoc. JAMIA 2013, 20, 688. [Google Scholar] [CrossRef] [Scilit]
- Untch, M.; Konecny, G.E.; Paepke, S.; von Minckwitz, G. Current and future role of neoadjuvant therapy for breast cancer. Breast 2014, 23, 526–537. [Google Scholar] [CrossRef] [Scilit]
- Giordano, S.H. Update on Locally Advanced Breast Cancer. Oncologist 2003, 8, 521–530. [Google Scholar] [CrossRef] [Scilit] [PubMed]
- Taleghamar, H.; Jalalifar, S.A.; Czarnota, G.J.; Sadeghi-Naini, A. Deep learning of quantitative ultrasound multi-parametric images at pre-treatment to predict breast cancer response to chemotherapy. Sci. Rep. 2022, 12, 2244. [Google Scholar] [CrossRef] [Scilit]
- Fernandes, J.; Sannachi, L.; Tran, W.T.; Koven, A.; Watkins, E.; Hadizad, F.; Gandhi, S.; Wright, F.; Curpen, B.; El Kaffas, A.; et al. Monitoring breast cancer response to neoadjuvant chemotherapy using ultrasound strain elastography. Transl. Oncol. 2019, 12, 1177–1184. [Google Scholar] [CrossRef] [Scilit] [PubMed]
- Liu, X.; Liu, Z.; Li, C.; Song, X.; Wang, X.; Li, S.; Yu, Z. PR status is a more decisive factor in efficacy of adding pertuzumab into neoadjuvant therapy for HER2-positive and lymph node-positive breast cancer than ER status: A real-world retrospective study in China. World J. Surg. Oncol. 2023, 21, 296. [Google Scholar] [CrossRef] [Scilit] [PubMed]
- General Principles of Neoadjuvant Management of Breast Cancer- Neoadjuvant Treatment Options. Available online: https://www.uptodate.com/contents/general-principles-of-neoadjuvant-management-of-breast-cancer#H179173117 (accessed on 4 October 2023).
- New Guidelines Move beyond Chemotherapy for Patients with Triple-Negative Breast Cancer—targetedonc.com. Available online: https://www.targetedonc.com/view/new-guidelines-move-beyond-chemotherapy-for-patients-with-triple-negative-breast-cancer (accessed on 5 October 2023).
- Han, H.S.; Vikas, P.; Costa, R.L.; Jahan, N.; Taye, A.; Stringer-Reasor, E.M. Early-Stage Triple-Negative Breast Cancer Journey: Beginning, End, and Everything in Between. Am. Soc. Clin. Oncol. Educ. Book 2023, 43, e390464. [Google Scholar] [CrossRef] [Scilit]
- Neoadjuvant Therapies for Breast Cancer | Susan, G. Komen®—komen.org. Available online: https://www.komen.org/breast-cancer/treatment/type/neoadjuvant-therapy/#:~:text=Types%20of%20neoadjuvant%20chemotherapy%20regimens&text=Most%20are%20anthracycline%2Dbased%20or,)%20and%20pertuzumab%20(Perjeta) (accessed on 4 October 2023).
- Villacampa, G.; Matikas, A.; Oliveira, M.; Prat, A.; Pascual, T.; Papakonstantinou, A. Landscape of neoadjuvant therapy in HER2-positive breast cancer: A systematic review and network meta-analysis. Eur. J. Cancer 2023, 190, 112885. [Google Scholar] [CrossRef] [Scilit]
- General Principles of Neoadjuvant Management of Breast Cancer- Goals. Available online: https://www.uptodate.com/contents/general-principles-of-neoadjuvant-management-of-breast-cancer#H4049625435 (accessed on 27 September 2023).
- Xin, Y.; Shen, G.; Zheng, Y.; Guan, Y.; Huo, X.; Li, J.; Ren, D.; Zhao, F.; Liu, Z.; Li, Z.; et al. Immune checkpoint inhibitors plus neoadjuvant chemotherapy in early triple-negative breast cancer: A systematic review and meta-analysis. BMC Cancer 2021, 21, 1261. [Google Scholar] [CrossRef] [Scilit]
- See, S.H.C.; Siziopikou, K.P. Pathologic evaluation of specimens after neoadjuvant chemotherapy in breast cancer: Current recommendations and challenges. Pathol.-Res. Pract. 2022, 230, 153753. [Google Scholar] [CrossRef] [Scilit]
- Yao, L.; Jia, G.; Lu, L.; Ma, W. Breast cancer patients: Who would benefit from neoadjuvant chemotherapies? Curr. Oncol. 2022, 29, 4902–4913. [Google Scholar] [CrossRef] [Scilit]
- Nurgali, K.; Jagoe, R.T.; Abalo, R. Adverse effects of cancer chemotherapy: Anything new to improve tolerance and reduce sequelae? Front. Pharmacol. 2018, 9, 245. [Google Scholar] [CrossRef] [Scilit]
- Dodington, D.W.; Lagree, A.; Tabbarah, S.; Mohebpour, M.; Sadeghi-Naini, A.; Tran, W.T.; Lu, F.I. Analysis of tumor nuclear features using artificial intelligence to predict response to neoadjuvant chemotherapy in high-risk breast cancer patients. Breast Cancer Res. Treat. 2021, 186, 379–389. [Google Scholar] [CrossRef] [Scilit] [PubMed]
- O’Donnell, J.M.; Gasior, S.; Davey, M.; O’Malley, E.; Lowery, A.; McGarry, J.; O’Connell, A.; Kerin, M.; McCarthy, P. The accuracy of breast MRI radiomic methodologies in predicting pathological complete response to neoadjuvant chemotherapy: A systematic review and network meta-analysis. Eur. J. Radiol. 2022, 157, 110561. [Google Scholar] [CrossRef] [Scilit] [PubMed]
- Pesapane, F.; Agazzi, G.M.; Rotili, A.; Ferrari, F.; Cardillo, A.; Penco, S.; Dominelli, V.; D’Ecclesiis, O.; Vignati, S.; Raimondi, S.; et al. Prediction of the pathological response to neoadjuvant chemotherapy in breast cancer patients with MRI-radiomics: A systematic review and meta-analysis. Curr. Probl. Cancer 2022, 2022, 100883. [Google Scholar] [CrossRef] [Scilit] [PubMed]
- Liang, X.; Yu, X.; Gao, T. Machine learning with magnetic resonance imaging for prediction of response to neoadjuvant chemotherapy in breast cancer: A systematic review and meta-analysis. Eur. J. Radiol. 2022, 150, 110247. [Google Scholar] [CrossRef] [Scilit] [PubMed]
- Na, S.P.; Houserkovaa, D. The role of various modalities in breast imaging. Biomed Pap. Med. Fac. Univ. Palacky Olomouc Czech Repub 2007, 151, 209–218. [Google Scholar]
- Henry, N.L.; Shah, P.D.; Haider, I.; Freer, P.E.; Jagsi, R.; Sabel, M.S. Cancer of the breast. In Abeloff’s Clinical Oncology, 6th ed.; Elsevier: Philadelphia, PA, USA, 2020; pp. 1560–1603. [Google Scholar]
- Coleman, C. Early Detection and Screening for Breast Cancer. Semin. Oncol. Nurs. 2017, 33, 141–155. [Google Scholar] [CrossRef] [Scilit]
- Iranmakani, S.; Mortezazadeh, T.; Sajadian, F.; Ghaziani, M.F.; Ghafari, A.; Khezerloo, D.; Musa, A.E. A review of various modalities in breast imaging: Technical aspects and clinical outcomes. Egypt. J. Radiol. Nucl. Med. 2020, 51, 57. [Google Scholar] [CrossRef] [Scilit]
- Mammography Views. Available online: https://radiopaedia.org/articles/mammography-views. (accessed on 1 December 2021).
- Shin, H.K.; Kim, W.H.; Kim, H.J.; Kim, C.; Kim, J. Prediction of Pathological Complete Response to Neoadjuvant Chemotherapy Using Multi-scale Patch Learning with Mammography. In Proceedings of the International Workshop on Predictive Intelligence in Medicine, Strasbourg, France, 1 October 2021; Springer: Cham, Switzerland, 2021; pp. 192–200. [Google Scholar]
- Skarping, I.; Larsson, M.; Förnvik, D. Analysis of mammograms using artificial intelligence to predict response to neoadjuvant chemotherapy in breast cancer patients: Proof of concept. Eur. Radiol. 2021, 32, 3131–3141. [Google Scholar] [CrossRef] [Scilit]
- Bhimani, C.; Matta, D.; Roth, R.G.; Liao, L.; Tinney, E.; Brill, K.; Germaine, P. Contrast-enhanced spectral mammography: Technique, indications, and clinical applications. Acad. Radiol. 2017, 24, 84–88. [Google Scholar] [CrossRef] [Scilit]
- Patel, B.K.; Lobbes, M.B.; Lewin, J. Contrast Enhanced Spectral Mammography: A Review. Semin. Ultrasound CT MRI 2018, 39, 70–79. [Google Scholar] [CrossRef] [Scilit]
- Mann, R.M.; Balleyguier, C.; Baltzer, P.A.; Bick, U.; Colin, C.; Cornford, E.; Evans, A.; Fallenberg, E.; Forrai, G.; Fuchsjäger, M.H.; et al. Breast MRI: EUSOBI recommendations for women’s information. Eur. Radiol. 2015, 25, 3669–3678. [Google Scholar] [CrossRef] [Scilit]
- Richter, V.; Hatterman, V.; Preibsch, H.; Bahrs, S.D.; Hahn, M.; Nikolaou, K.; Wiesinger, B. Contrast-enhanced spectral mammography in patients with MRI contraindications. Acta Radiol. 2018, 59, 798–805. [Google Scholar] [CrossRef] [Scilit] [PubMed]
- Wang, Q.; Li, K.; Wang, L.; Zhang, J.; Zhou, Z.; Feng, Y. Preclinical study of diagnostic performances of contrast-enhanced spectral mammography versus MRI for breast diseases in China. Springerplus 2016, 5, 763. [Google Scholar] [CrossRef] [Scilit] [PubMed]
- Li, L.; Roth, R.; Germaine, P.; Ren, S.; Lee, M.; Hunter, K.; Tinney, E.; Liao, L. Contrast-enhanced spectral mammography (CESM) versus breast magnetic resonance imaging (MRI): A retrospective comparison in 66 breast lesions. Diagn. Interv. Imaging 2017, 98, 113–123. [Google Scholar] [CrossRef] [Scilit] [PubMed]
- Sorin, V.; Sklair-Levy, M. Dual-energy contrast-enhanced spectral mammography (CESM) for breast cancer screening. Quant. Imaging Med. Surg. 2019, 9, 1914. [Google Scholar] [CrossRef] [Scilit] [PubMed]
- Xing, D.; Mao, N.; Dong, J.; Ma, H.; Chen, Q.; Lv, Y. Quantitative analysis of contrast enhanced spectral mammography grey value for early prediction of pathological response of breast cancer to neoadjuvant chemotherapy. Sci. Rep. 2021, 11, 5892. [Google Scholar] [CrossRef] [Scilit]
- Wang, Z.; Lin, F.; Ma, H.; Shi, Y.; Dong, J.; Yang, P.; Zhang, K.; Guo, N.; Zhang, R.; Cui, J.; et al. Contrast-Enhanced spectral mammography-based radiomics nomogram for the prediction of neoadjuvant chemotherapy-insensitive breast cancers. Front. Oncol. 2021, 11, 84. [Google Scholar] [CrossRef] [Scilit] [PubMed]
- Mao, N.; Shi, Y.; Lian, C.; Wang, Z.; Zhang, K.; Xie, H.; Zhang, H.; Chen, Q.; Cheng, G.; Xu, C.; et al. Intratumoral and peritumoral radiomics for preoperative prediction of neoadjuvant chemotherapy effect in breast cancer based on contrast-enhanced spectral mammography. Eur. Radiol. 2022, 32, 3207–3219. [Google Scholar] [CrossRef] [Scilit]
- Sree, S.V.; Ng, E.Y.K.; Acharya, R.U.; Faust, O. WJCO. World 2011, 2, 171–178. [Google Scholar]
- Sadeghi-Naini, A.; Sannachi, L.; Pritchard, K.; Trudeau, M.; Gandhi, S.; Wright, F.C.; Zubovits, J.; Yaffe, M.J.; Kolios, M.C.; Czarnota, G.J. Early prediction of therapy responses and outcomes in breast cancer patients using quantitative ultrasound spectral texture. Oncotarget 2014, 5, 3497. [Google Scholar] [CrossRef] [Scilit]
- Byra, M.; Dobruch-Sobczak, K.; Piotrzkowska-Wroblewska, H.; Klimonda, Z.; Litniewski, J. Prediction of response to neoadjuvant chemotherapy in breast cancer with recurrent neural networks and raw ultrasound signals. Phys. Med. Biol. 2022, 67, 185007. [Google Scholar] [CrossRef] [Scilit] [PubMed]
- Jiang, M.; Li, C.L.; Luo, X.M.; Chuan, Z.R.; Lv, W.Z.; Li, X.; Cui, X.W.; Dietrich, C.F. Ultrasound-based deep learning radiomics in the assessment of pathological complete response to neoadjuvant chemotherapy in locally advanced breast cancer. Eur. J. Cancer 2021, 147, 95–105. [Google Scholar] [CrossRef] [Scilit]
- Tadayyon, H.; Sadeghi-Naini, A.; Czarnota, G.J. Noninvasive characterization of locally advanced breast cancer using textural analysis of quantitative ultrasound parametric images. Transl. Oncol. 2014, 7, 759–767. [Google Scholar] [CrossRef] [Scilit] [PubMed]
- Tadayyon, H.; Sannachi, L.; Gangeh, M.; Sadeghi-Naini, A.; Tran, W.; Trudeau, M.E.; Pritchard, K.; Ghandi, S.; Verma, S.; Czarnota, G.J. Quantitative ultrasound assessment of breast tumor response to chemotherapy using a multi-parameter approach. Oncotarget 2016, 7, 45094. [Google Scholar] [CrossRef] [Scilit]
- Sannachi, L.; Gangeh, M.; Tadayyon, H.; Gandhi, S.; Wright, F.C.; Slodkowska, E.; Curpen, B.; Sadeghi-Naini, A.; Tran, W.; Czarnota, G.J. Breast cancer treatment response monitoring using quantitative ultrasound and texture analysis: Comparative analysis of analytical models. Transl. Oncol. 2019, 12, 1271–1281. [Google Scholar] [CrossRef] [Scilit]
- DiCenzo, D.; Quiaoit, K.; Fatima, K.; Bhardwaj, D.; Sannachi, L.; Gangeh, M.; Sadeghi-Naini, A.; Dasgupta, A.; Kolios, M.C.; Trudeau, M.; et al. Quantitative ultrasound radiomics in predicting response to neoadjuvant chemotherapy in patients with locally advanced breast cancer: Results from multi-institutional study. Cancer Med. 2020, 9, 5798–5806. [Google Scholar] [CrossRef] [Scilit]
- Dasgupta, A.; Brade, S.; Sannachi, L.; Quiaoit, K.; Fatima, K.; DiCenzo, D.; Osapoetra, L.O.; Saifuddin, M.; Trudeau, M.; Gandhi, S.; et al. Quantitative ultrasound radiomics using texture derivatives in prediction of treatment response to neo-adjuvant chemotherapy for locally advanced breast cancer. Oncotarget 2020, 11, 3782. [Google Scholar] [CrossRef] [Scilit]
- Tadayyon, H.; Sannachi, L.; Gangeh, M.J.; Kim, C.; Ghandi, S.; Trudeau, M.; Pritchard, K.; Tran, W.T.; Slodkowska, E.; Sadeghi-Naini, A.; et al. A priori prediction of neoadjuvant chemotherapy response and survival in breast cancer patients using quantitative ultrasound. Sci. Rep. 2017, 7, 45733. [Google Scholar] [CrossRef] [Scilit]
- Sannachi, L.; Gangeh, M.; Tadayyon, H.; Sadeghi-Naini, A.; Gandhi, S.; Wright, F.C.; Slodkowska, E.; Curpen, B.; Tran, W.; Czarnota, G.J. Response monitoring of breast cancer patients receiving neoadjuvant chemotherapy using quantitative ultrasound, texture, and molecular features. PLoS ONE 2018, 13, e0189634. [Google Scholar] [CrossRef] [Scilit]
- Tadayyon, H.; Gangeh, M.; Sannachi, L.; Trudeau, M.; Pritchard, K.; Ghandi, S.; Eisen, A.; Look-Hong, N.; Holloway, C.; Wright, F.; et al. A priori prediction of breast tumour response to chemotherapy using quantitative ultrasound imaging and artificial neural networks. Oncotarget 2019, 10, 3910. [Google Scholar] [CrossRef] [Scilit]
- Prado-Costa, R.; Rebelo, J.; Monteiro-Barroso, J.; Preto, A.S. Ultrasound elastography: Compression elastography and shear-wave elastography in the assessment of tendon injury. Insights Imaging 2018, 9, 791–814. [Google Scholar] [CrossRef] [Scilit] [PubMed]
- Ma, Y.; Zhang, S.; Zang, L.; Li, J.; Li, J.; Kang, Y.; Ren, W. Combination of shear wave elastography and Ki-67 index as a novel predictive modality for the pathological response to neoadjuvant chemotherapy in patients with invasive breast cancer. Eur. J. Cancer 2016, 69, 86–101. [Google Scholar] [CrossRef] [Scilit] [PubMed]
- Gu, J.; Polley, E.C.; Denis, M.; Carter, J.M.; Pruthi, S.; Gregory, A.V.; Boughey, J.C.; Fazzio, R.T.; Fatemi, M.; Alizad, A. Early assessment of shear wave elastography parameters foresees the response to neoadjuvant chemotherapy in patients with invasive breast cancer. Breast Cancer Res. 2021, 23, 1–13. [Google Scholar] [CrossRef] [Scilit] [PubMed]
- Byra, M.; Dobruch-Sobczak, K.; Klimonda, Z.; Piotrzkowska-Wroblewska, H.; Litniewski, J. Early prediction of response to neoadjuvant chemotherapy in breast cancer sonography using Siamese convolutional neural networks. IEEE J. Biomed. Health Inform. 2020, 25, 797–805. [Google Scholar] [CrossRef] [Scilit]
- Xie, J.; Shi, H.; Du, C.; Song, X.; Wei, J.; Dong, Q.; Wan, C. Dual-branch convolutional neural network based on ultrasound imaging in the early prediction of neoadjuvant chemotherapy response in patients with locally advanced breast cancer. Front. Oncol. 2022, 12, 812463. [Google Scholar] [CrossRef] [Scilit]
- Liu, Y.; Wang, Y.; Wang, Y.; Xie, Y.; Cui, Y.; Feng, S.; Yao, M.; Qiu, B.; Shen, W.; Chen, D.; et al. Early prediction of treatment response to neoadjuvant chemotherapy based on longitudinal ultrasound images of HER2-positive breast cancer patients by Siamese multi-task network: A multicentre, retrospective cohort study. EClinicalMedicine 2022, 52, 101562. [Google Scholar] [CrossRef] [Scilit]
- Gu, J.; Tong, T.; He, C.; Xu, M.; Yang, X.; Tian, J.; Jiang, T.; Wang, K. Deep learning radiomics of ultrasonography can predict response to neoadjuvant chemotherapy in breast cancer at an early stage of treatment: A prospective study. Eur. Radiol. 2022, 32, 2099–2109. [Google Scholar] [CrossRef] [Scilit]
- Yang, M.; Liu, H.; Dai, Q.; Yao, L.; Zhang, S.; Wang, Z.; Li, J.; Duan, Q. Treatment Response Prediction Using Ultrasound-Based Pre-, Post-Early, and Delta Radiomics in Neoadjuvant Chemotherapy in Breast Cancer. Front. Oncol. 2022, 12, 748008. [Google Scholar] [CrossRef] [Scilit]
- Su, T.P.; Huang, J.S.; Chang, P.H.; Lui, K.W.; Hsieh, J.C.H.; Ng, S.H.; Chan, S.C. Prospective comparison of early interim 18F-FDG-PET with 18F-FLT-PET for predicting treatment response and survival in metastatic breast cancer. BMC Cancer 2021, 21, 908. [Google Scholar] [CrossRef] [Scilit]
- Lind, P.; Igerc, I.; Beyer, T.; Reinprecht, P.; Hausegger, K. Advantages and limitations of FDG PET in the follow-up of breast cancer. Eur. J. Nucl. Med. Mol. Imaging 2004, 31, S125–S134. [Google Scholar]
- Romeo, V.; Accardo, G.; Perillo, T.; Basso, L.; Garbino, N.; Nicolai, E.; Maurea, S.; Salvatore, M. Assessment and prediction of response to neoadjuvant chemotherapy in breast cancer: A comparison of imaging modalities and future perspectives. Cancers 2021, 13, 3521. [Google Scholar] [CrossRef] [Scilit] [PubMed]
- Ming, Y.; Wu, N.; Qian, T.; Li, X.; Wan, D.Q.; Li, C.; Li, Y.; Wu, Z.; Wang, X.; Liu, J.; et al. Progress and future trends in PET/CT and PET/MRI molecular imaging approaches for breast cancer. Front. Oncol. 2020, 10, 1301. [Google Scholar] [CrossRef] [Scilit] [PubMed]
- Bertagna, F.; Biasiotto, G.; Giubbini, R. The role of F-18-fluorothymidine PET in oncology. Clin. Transl. Imaging 2013, 1, 77–97. [Google Scholar] [CrossRef] [Scilit]
- Hicks, R.J. Beyond FDG: Novel PET tracers for cancer imaging. Cancer Imaging 2004, 4, 22. [Google Scholar] [CrossRef] [Scilit] [PubMed]
- Treglia, G.; Sadeghi, R.; Del Sole, A.; Giovanella, L. Diagnostic performance of PET/CT with tracers other than F-18-FDG in oncology: An evidence-based review. Clin. Transl. Oncol. 2014, 16, 770–775. [Google Scholar] [CrossRef] [Scilit] [PubMed]
- Kato, A.; Nakamoto, Y.; Ishimori, T.; Saga, T.; Togashi, K. Prognostic value of quantitative parameters of 18F-FDG PET/CT for patients with angiosarcoma. Am. J. Roentgenol. 2020, 214, 649–657. [Google Scholar] [CrossRef] [Scilit] [PubMed]
- Andrade, W.; Lima, E.; Osório, C.; do Socorro Maciel, M.; Baiocchi, G.; Bitencourt, A.; Fanelli, M.; Damascena, A.; Soares, F. Can FDG-PET/CT predict early response to neoadjuvant chemotherapy in breast cancer? Eur. J. Surg. Oncol. (EJSO) 2013, 39, 1358–1363. [Google Scholar] [CrossRef] [Scilit]
- Kendi, A.T.K.; Magliocca, K.R.; Corey, A.; Galt, J.R.; Switchenko, J.; Wadsworth, J.T.; El-Deiry, M.W.; Schuster, D.M.; Saba, N.F.; Hudgins, P.A. Is there a role for PET/CT parameters to characterize benign, malignant, and metastatic parotid tumors? AJR Am. J. Roentgenol. 2016, 207, 635. [Google Scholar] [CrossRef] [Scilit]
- Sher, A.; Lacoeuille, F.; Fosse, P.; Vervueren, L.; Cahouet-Vannier, A.; Dabli, D.; Bouchet, F.; Couturier, O. For avid glucose tumors, the SUV peak is the most reliable parameter for [18F] FDG-PET/CT quantification, regardless of acquisition time. EJNMMI Res. 2016, 6, 21. [Google Scholar] [CrossRef] [Scilit]
- Vanderhoek, M.; Perlman, S.B.; Jeraj, R. Impact of the definition of peak standardized uptake value on quantification of treatment response. J. Nucl. Med. 2012, 53, 4–11. [Google Scholar] [CrossRef] [Scilit]
- Steiger, S.; Arvanitakis, M.; Sick, B.; Weder, W.; Hillinger, S.; Burger, I.A. Analysis of prognostic values of various PET metrics in preoperative 18F-FDG PET for early-stage bronchial carcinoma for progression-free and overall survival: Significantly increased glycolysis is a predictive factor. J. Nucl. Med. 2017, 58, 1925–1930. [Google Scholar] [CrossRef] [Scilit] [PubMed]
- Buchbender, C.; Kuemmel, S.; Hoffmann, O.; Stahl, A.R.; Kimmig, R.; Otterbach, F.; Ladd, S.; Koeninger, A.; Forsting, M.; Bockisch, A.; et al. FDG-PET/CT for the early prediction of histopathological complete response to neoadjuvant chemotherapy in breast cancer patients: Initial results. Acta Radiol. 2012, 53, 628–636. [Google Scholar] [CrossRef] [Scilit] [PubMed]
- Koolen, B.B.; Pengel, K.E.; Wesseling, J.; Vogel, W.V.; Vrancken Peeters, M.J.T.; Vincent, A.D.; Gilhuijs, K.G.; Rodenhuis, S.; Rutgers, E.J.T.; Valdés Olmos, R.A. Sequential 18F-FDG PET/CT for early prediction of complete pathological response in breast and axilla during neoadjuvant chemotherapy. Eur. J. Nucl. Med. Mol. Imaging 2014, 41, 32–40. [Google Scholar] [CrossRef] [Scilit] [PubMed]
- Groheux, D.; Giacchetti, S.; Hatt, M.; Marty, M.; Vercellino, L.; De Roquancourt, A.; Cuvier, C.; Coussy, F.; Espié, M.; Hindié, E. HER2-overexpressing breast cancer: FDG uptake after two cycles of chemotherapy predicts the outcome of neoadjuvant treatment. Br. J. Cancer 2013, 109, 1157–1164. [Google Scholar] [CrossRef] [Scilit]
- Groheux, D.; Hindié, E.; Giacchetti, S.; Hamy, A.S.; Berger, F.; Merlet, P.; de Roquancourt, A.; de Cremoux, P.; Marty, M.; Hatt, M.; et al. Early assessment with 18F-fluorodeoxyglucose positron emission tomography/computed tomography can help predict the outcome of neoadjuvant chemotherapy in triple negative breast cancer. Eur. J. Cancer 2014, 50, 1864–1871. [Google Scholar] [CrossRef] [Scilit]
- Humbert, O.; Riedinger, J.M.; Charon-Barra, C.; Berriolo-Riedinger, A.; Desmoulins, I.; Lorgis, V.; Kanoun, S.; Coutant, C.; Fumoleau, P.; Cochet, A.; et al. Identification of Biomarkers Including 18FDG-PET/CT for Early Prediction of Response to Neoadjuvant Chemotherapy in Triple-Negative Breast CancerPredicting the Response in Triple-Negative Breast Cancer. Clin. Cancer Res. 2015, 21, 5460–5468. [Google Scholar] [CrossRef] [Scilit]
- Luo, J.; Zhou, Z.; Yang, Z.; Chen, X.; Cheng, J.; Shao, Z.; Guo, X.; Tuan, J.; Fu, X.; Yu, X. The value of 18F-FDG PET/CT imaging combined with pretherapeutic Ki67 for early prediction of pathologic response after neoadjuvant chemotherapy in locally advanced breast cancer. Medicine 2016, 95, e2914. [Google Scholar] [CrossRef] [Scilit]
- Cheng, L.; Zhang, J.; Wang, Y.; Xu, X.; Zhang, Y.; Zhang, Y.; Liu, G.; Cheng, J. Textural features of 18F-FDG PET after two cycles of neoadjuvant chemotherapy can predict pCR in patients with locally advanced breast cancer. Ann. Nucl. Med. 2017, 31, 544–552. [Google Scholar] [CrossRef] [Scilit]
- Antunovic, L.; De Sanctis, R.; Cozzi, L.; Kirienko, M.; Sagona, A.; Torrisi, R.; Tinterri, C.; Santoro, A.; Chiti, A.; Zelic, R.; et al. PET/CT radiomics in breast cancer: Promising tool for prediction of pathological response to neoadjuvant chemotherapy. Eur. J. Nucl. Med. Mol. Imaging 2019, 46, 1468–1477. [Google Scholar] [CrossRef] [Scilit]
- Li, P.; Wang, X.; Xu, C.; Liu, C.; Zheng, C.; Fulham, M.J.; Feng, D.; Wang, L.; Song, S.; Huang, G. 18F-FDG PET/CT radiomic predictors of pathologic complete response (pCR) to neoadjuvant chemotherapy in breast cancer patients. Eur. J. Nucl. Med. Mol. Imaging 2020, 47, 1116–1126. [Google Scholar] [CrossRef] [Scilit]
- Fantini, L.; Belli, M.L.; Azzali, I.; Loi, E.; Bettinelli, A.; Feliciani, G.; Mezzenga, E.; Fedeli, A.; Asioli, S.; Paganelli, G.; et al. Exploratory Analysis of 18F-3’-Deoxy-3’-Fluorothymidine (18F-FLT) PET/CT-Based Radiomics for the Early Evaluation of Response to Neoadjuvant Chemotherapy in Patients With Locally Advanced Breast Cancer. Front. Oncol. 2021, 11, 2315. [Google Scholar] [CrossRef] [Scilit] [PubMed]
- Crippa, F.; Agresti, R.; Sandri, M.; Marfiani, G.; Padovano, B.; Alessi, A.; Bianchi, G.; Bombardieri, E.; Maugeri, I.; Rampa, M.; et al. 18F-FLT PET/CT as an imaging tool for early prediction of pathological response in patients with locally advanced breast cancer treated with neoadjuvant chemotherapy: A pilot study. Eur. J. Nucl. Med. Mol. Imaging 2015, 42, 818–830. [Google Scholar] [CrossRef] [Scilit] [PubMed]
- Fusco, R.; Sansone, M.; Filice, S.; Carone, G.; Amato, D.M.; Sansone, C.; Petrillo, A. Pattern recognition approaches for breast cancer DCE-MRI classification: A systematic review. J. Med. Biol. Eng. 2016, 36, 449–459. [Google Scholar] [CrossRef] [Scilit]
- Chavhan, G.B.; Humphries, P.D. Functional MRI: DWI and DCE-MRI. Imaging in Pediatric Oncology; Springer: Cham, Switzerland, 2019; pp. 91–106. [Google Scholar]
- Banaie, M.; Soltanian-Zadeh, H.; Saligheh-Rad, H.R.; Gity, M. Spatiotemporal features of DCE-MRI for breast cancer diagnosis. Comput. Methods Programs Biomed. 2018, 155, 153–164. [Google Scholar] [CrossRef] [Scilit] [PubMed]
- Ahmed, A.; Gibbs, P.; Pickles, M.; Turnbull, L. Texture analysis in assessment and prediction of chemotherapy response in breast cancer. J. Magn. Reson. Imaging 2013, 38, 89–101. [Google Scholar] [CrossRef] [Scilit] [PubMed]
- Teruel, J.R.; Heldahl, M.G.; Goa, P.E.; Pickles, M.; Lundgren, S.; Bathen, T.F.; Gibbs, P. Dynamic contrast-enhanced MRI texture analysis for pretreatment prediction of clinical and pathological response to neoadjuvant chemotherapy in patients with locally advanced breast cancer. NMR Biomed. 2014, 27, 887–896. [Google Scholar] [CrossRef] [Scilit]
- Giannini, V.; Mazzetti, S.; Marmo, A.; Montemurro, F.; Regge, D.; Martincich, L. A computer-aided diagnosis (CAD) scheme for pretreatment prediction of pathological response to neoadjuvant therapy using dynamic contrast-enhanced MRI texture features. Br. J. Radiol. 2017, 90, 20170269. [Google Scholar] [CrossRef] [Scilit]
- Fan, M.; Wu, G.; Cheng, H.; Zhang, J.; Shao, G.; Li, L. Radiomic analysis of DCE-MRI for prediction of response to neoadjuvant chemotherapy in breast cancer patients. Eur. J. Radiol. 2017, 94, 140–147. [Google Scholar] [CrossRef] [Scilit]
- Cain, E.H.; Saha, A.; Harowicz, M.R.; Marks, J.R.; Marcom, P.K.; Mazurowski, M.A. Multivariate machine learning models for prediction of pathologic response to neoadjuvant therapy in breast cancer using MRI features: A study using an independent validation set. Breast Cancer Res. Treat. 2019, 173, 455–463. [Google Scholar] [CrossRef] [Scilit]
- Eom, H.J.; Cha, J.H.; Choi, W.J.; Chae, E.Y.; Shin, H.J.; Kim, H.H. Predictive clinicopathologic and dynamic contrast-enhanced MRI findings for tumor response to neoadjuvant chemotherapy in triple-negative breast cancer. Am. J. Roentgenol. 2017, 208, W225–W230. [Google Scholar] [CrossRef] [Scilit]
- Li, W.; Newitt, D.C.; Gibbs, J.; Wilmes, L.J.; Jones, E.F.; Arasu, V.A.; Strand, F.; Onishi, N.; Nguyen, A.A.T.; Kornak, J.; et al. Predicting breast cancer response to neoadjuvant treatment using multi-feature MRI: Results from the I-SPY 2 TRIAL. NPJ Breast Cancer 2020, 6, 63. [Google Scholar] [CrossRef] [Scilit] [PubMed]
- Li, X.; Arlinghaus, L.R.; Ayers, G.D.; Chakravarthy, A.B.; Abramson, R.G.; Abramson, V.G.; Atuegwu, N.; Farley, J.; Mayer, I.A.; Kelley, M.C.; et al. DCE-MRI analysis methods for predicting the response of breast cancer to neoadjuvant chemotherapy: Pilot study findings. Magn. Reson. Med. 2014, 71, 1592–1602. [Google Scholar] [CrossRef] [Scilit] [PubMed]
- Tudorica, A.; Oh, K.Y.; Chui, S.Y.; Roy, N.; Troxell, M.L.; Naik, A.; Kemmer, K.A.; Chen, Y.; Holtorf, M.L.; Afzal, A.; et al. Early prediction and evaluation of breast cancer response to neoadjuvant chemotherapy using quantitative DCE-MRI. Transl. Oncol. 2016, 9, 8–17. [Google Scholar] [CrossRef] [Scilit]
- Drisis, S.; Metens, T.; Ignatiadis, M.; Stathopoulos, K.; Chao, S.L.; Lemort, M. Quantitative DCE-MRI for prediction of pathological complete response following neoadjuvant treatment for locally advanced breast cancer: The impact of breast cancer subtypes on the diagnostic accuracy. Eur. Radiol. 2016, 26, 1474–1484. [Google Scholar] [CrossRef] [Scilit] [PubMed]
- Thibault, G.; Tudorica, A.; Afzal, A.; Chui, S.Y.; Naik, A.; Troxell, M.L.; Kemmer, K.A.; Oh, K.Y.; Roy, N.; Jafarian, N.; et al. DCE-MRI texture features for early prediction of breast cancer therapy response. Tomography 2017, 3, 23–32. [Google Scholar] [CrossRef] [Scilit]
- Lee, J.; Kim, S.H.; Kang, B.J. Pretreatment prediction of pathologic complete response to neoadjuvant chemotherapy in breast cancer: Perfusion metrics of dynamic contrast enhanced MRI. Sci. Rep. 2018, 8, 9490. [Google Scholar] [CrossRef] [Scilit] [PubMed]
- Ashraf, A.; Gaonkar, B.; Mies, C.; DeMichele, A.; Rosen, M.; Davatzikos, C.; Kontos, D. Breast DCE-MRI kinetic heterogeneity tumor markers: Preliminary associations with neoadjuvant chemotherapy response. Transl. Oncol. 2015, 8, 154–162. [Google Scholar] [CrossRef] [Scilit]
- Braman, N.M.; Etesami, M.; Prasanna, P.; Dubchuk, C.; Gilmore, H.; Tiwari, P.; Plecha, D.; Madabhushi, A. Intratumoral and peritumoral radiomics for the pretreatment prediction of pathological complete response to neoadjuvant chemotherapy based on breast DCE-MRI. Breast Cancer Res. 2017, 19, 57. [Google Scholar] [CrossRef] [Scilit]
- Caballo, M.; Sanderink, W.B.; Han, L.; Gao, Y.; Athanasiou, A.; Mann, R.M. Four-Dimensional Machine Learning Radiomics for the Pretreatment Assessment of Breast Cancer Pathologic Complete Response to Neoadjuvant Chemotherapy in Dynamic Contrast-Enhanced MRI. J. Magn. Reson. Imaging 2023, 57, 97–110. [Google Scholar] [CrossRef] [Scilit]
- Drukker, K.; Edwards, A.V.; Doyle, C.; Papaioannou, J.; Kulkarni, K.; Giger, M.L. Breast MRI radiomics for the pretreatment prediction of response to neoadjuvant chemotherapy in node-positive breast cancer patients. J. Med. Imaging 2019, 6, 034502. [Google Scholar] [CrossRef] [Scilit]
- Machireddy, A.; Thibault, G.; Tudorica, A.; Afzal, A.; Mishal, M.; Kemmer, K.; Naik, A.; Troxell, M.; Goranson, E.; Oh, K.; et al. Early prediction of breast cancer therapy response using multiresolution fractal analysis of DCE-MRI parametric maps. Tomography 2019, 5, 90–98. [Google Scholar] [CrossRef] [Scilit] [PubMed]
- Wu, J.; Gong, G.; Cui, Y.; Li, R. Intratumor partitioning and texture analysis of dynamic contrast-enhanced (DCE)-MRI identifies relevant tumor subregions to predict pathological response of breast cancer to neoadjuvant chemotherapy. J. Magn. Reson. Imaging 2016, 44, 1107–1115. [Google Scholar] [CrossRef] [Scilit] [PubMed]
- El Adoui, M.; Drisis, S.; Benjelloun, M. A PRM approach for early prediction of breast cancer response to chemotherapy based on registered MR images. Int. J. Comput. Assist. Radiol. Surg. 2018, 13, 1233–1243. [Google Scholar] [CrossRef] [Scilit]
- El Adoui, M.; Drisis, S.; Benjelloun, M. Multi-input deep learning architecture for predicting breast tumor response to chemotherapy using quantitative MR images. Int. J. Comput. Assist. Radiol. Surg. 2020, 15, 1491–1500. [Google Scholar] [CrossRef] [Scilit] [PubMed]
- Khanna, P.; Sahu, M.; Singh, B.K.; Bhateja, V. Early prediction of pathological complete response to neoadjuvant chemotherapy in breast cancer MRI images using combined Pre-trained convolutional neural network and machine learning. Measurement 2023, 207, 112269. [Google Scholar] [CrossRef] [Scilit]
- Jimenez, J.E.; Abdelhafez, A.; Mittendorf, E.A.; Elshafeey, N.; Yung, J.P.; Litton, J.K.; Adrada, B.E.; Candelaria, R.P.; White, J.; Thompson, A.M.; et al. A model combining pretreatment MRI radiomic features and tumor-infiltrating lymphocytes to predict response to neoadjuvant systemic therapy in triple-negative breast cancer. Eur. J. Radiol. 2022, 149, 110220. [Google Scholar] [CrossRef] [Scilit] [PubMed]
- Golden, D.I.; Lipson, J.A.; Telli, M.L.; Ford, J.M.; Rubin, D.L. Dynamic contrast-enhanced MRI-based biomarkers of therapeutic response in triple-negative breast cancer. J. Am. Med. Inform. Assoc. 2013, 20, 1059–1066. [Google Scholar] [CrossRef] [Scilit]
- Jahani, N.; Cohen, E.; Hsieh, M.K.; Weinstein, S.P.; Pantalone, L.; Hylton, N.; Newitt, D.; Davatzikos, C.; Kontos, D. Prediction of treatment response to neoadjuvant chemotherapy for breast cancer via early changes in tumor heterogeneity captured by DCE-MRI registration. Sci. Rep. 2019, 9, 12144. [Google Scholar] [CrossRef] [Scilit]
- Sutton, E.J.; Onishi, N.; Fehr, D.A.; Dashevsky, B.Z.; Sadinski, M.; Pinker, K.; Martinez, D.F.; Brogi, E.; Braunstein, L.; Razavi, P.; et al. A machine learning model that classifies breast cancer pathologic complete response on MRI post-neoadjuvant chemotherapy. Breast Cancer Res. 2020, 22, 57. [Google Scholar] [CrossRef] [Scilit]
- Fan, M.; Chen, H.; You, C.; Liu, L.; Gu, Y.; Peng, W.; Gao, X.; Li, L. Radiomics of tumor heterogeneity in longitudinal dynamic contrast-enhanced magnetic resonance imaging for predicting response to neoadjuvant chemotherapy in breast cancer. Front. Mol. Biosci. 2021, 8, 622219. [Google Scholar] [CrossRef] [Scilit]
- Hussain, L.; Huang, P.; Nguyen, T.; Lone, K.J.; Ali, A.; Khan, M.S.; Li, H.; Suh, D.Y.; Duong, T.Q. Machine learning classification of texture features of MRI breast tumor and peri-tumor of combined pre-and early treatment predicts pathologic complete response. BioMedical Eng. Online 2021, 20, 63. [Google Scholar] [CrossRef] [Scilit] [PubMed]
- Cho, N.; Im, S.A.; Park, I.A.; Lee, K.H.; Li, M.; Han, W.; Noh, D.Y.; Moon, W.K. Breast cancer: Early prediction of response to neoadjuvant chemotherapy using parametric response maps for MR imaging. Radiology 2014, 272, 385–396. [Google Scholar] [CrossRef] [Scilit]
- Drisis, S.; El Adoui, M.; Flamen, P.; Benjelloun, M.; Dewind, R.; Paesmans, M.; Ignatiadis, M.; Bali, M.; Lemort, M. Early prediction of neoadjuvant treatment outcome in locally advanced breast cancer using parametric response mapping and radial heterogeneity from breast MRI. J. Magn. Reson. Imaging 2020, 51, 1403–1411. [Google Scholar] [CrossRef] [Scilit] [PubMed]
- Comes, M.C.; Fanizzi, A.; Bove, S.; Didonna, V.; Diotaiuti, S.; La Forgia, D.; Latorre, A.; Martinelli, E.; Mencattini, A.; Nardone, A.; et al. Early prediction of neoadjuvant chemotherapy response by exploiting a transfer learning approach on breast DCE-MRIs. Sci. Rep. 2021, 11, 14123. [Google Scholar] [CrossRef] [Scilit] [PubMed]
- Peng, Y.; Cheng, Z.; Gong, C.; Zheng, C.; Zhang, X.; Wu, Z.; Yang, Y.; Yang, X.; Zheng, J.; Shen, J. Pretreatment DCE-MRI-Based Deep Learning Outperforms Radiomics Analysis in Predicting Pathologic Complete Response to Neoadjuvant Chemotherapy in Breast Cancer. Front. Oncol. 2022, 12, 846775. [Google Scholar] [CrossRef] [Scilit]
- Li, Y.; Chen, Y.; Zhao, R.; Ji, Y.; Li, J.; Zhang, Y.; Lu, H. Development and validation of a nomogram based on pretreatment dynamic contrast-enhanced MRI for the prediction of pathologic response after neoadjuvant chemotherapy for triple-negative breast cancer. Eur. Radiol. 2022, 32, 1676–1687. [Google Scholar] [CrossRef] [Scilit]
- Liang, X.; Chen, X.; Yang, Z.; Liao, Y.; Wang, M.; Li, Y.; Fan, W.; Dai, Z.; Zhang, Y. Early prediction of pathological complete response to neoadjuvant chemotherapy combining DCE-MRI and apparent diffusion coefficient values in breast Cancer. BMC Cancer 2022, 22, 1250. [Google Scholar] [CrossRef] [Scilit]
- Li, X.; Abramson, R.G.; Arlinghaus, L.R.; Kang, H.; Chakravarthy, A.B.; Abramson, V.G.; Farley, J.; Mayer, I.A.; Kelley, M.C.; Meszoely, I.M.; et al. Multiparametric magnetic resonance imaging for predicting pathological response after the first cycle of neoadjuvant chemotherapy in breast cancer. Investig. Radiol. 2015, 50, 195–204. [Google Scholar] [CrossRef] [Scilit]
- AM O’Flynn, E.; Collins, D.; D’Arcy, J.; Schmidt, M.; de Souza, N.M. Multi-parametric MRI in the early prediction of response to neo-adjuvant chemotherapy in breast cancer: Value of non-modelled parameters. Eur. J. Radiol. 2016, 85, 837–842. [Google Scholar] [CrossRef] [Scilit]
- Zhao, R.; Lu, H.; Li, Y.B.; Shao, Z.Z.; Ma, W.J.; Liu, P.F. Nomogram for early prediction of pathological complete response to neoadjuvant chemotherapy in breast cancer using dynamic contrast-enhanced and diffusion-weighted MRI. Acad. Radiol. 2022, 29, S155–S163. [Google Scholar] [CrossRef] [Scilit]
- Bian, T.; Wu, Z.; Lin, Q.; Wang, H.; Ge, Y.; Duan, S.; Fu, G.; Cui, C.; Su, X. Radiomic signatures derived from multiparametric MRI for the pretreatment prediction of response to neoadjuvant chemotherapy in breast cancer. Br. J. Radiol. 2020, 93, 20200287. [Google Scholar] [CrossRef] [Scilit] [PubMed]
- Tahmassebi, A.; Wengert, G.J.; Helbich, T.H.; Bago-Horvath, Z.; Alaei, S.; Bartsch, R.; Dubsky, P.; Baltzer, P.; Clauser, P.; Kapetas, P.; et al. Impact of machine learning with multiparametric magnetic resonance imaging of the breast for early prediction of response to neoadjuvant chemotherapy and survival outcomes in breast cancer patients. Investig. Radiol. 2019, 54, 110. [Google Scholar] [CrossRef] [Scilit] [PubMed]
- Eun, N.L.; Kang, D.; Son, E.J.; Park, J.S.; Youk, J.H.; Kim, J.A.; Gweon, H.M. Texture analysis with 3.0-T MRI for association of response to neoadjuvant chemotherapy in breast cancer. Radiology 2020, 294, 31–41. [Google Scholar] [CrossRef] [Scilit] [PubMed]
- Liu, Z.; Li, Z.; Qu, J.; Zhang, R.; Zhou, X.; Li, L.; Sun, K.; Tang, Z.; Jiang, H.; Li, H.; et al. Radiomics of multiparametric MRI for pretreatment prediction of pathologic complete response to neoadjuvant chemotherapy in breast cancer: A multicenter study. Clin. Cancer Res. 2019, 25, 3538–3547. [Google Scholar] [CrossRef] [Scilit]
- Syed, A.; Adam, R.; Ren, T.; Lu, J.; Maldjian, T.; Duong, T.Q. Machine learning with textural analysis of longitudinal multiparametric MRI and molecular subtypes accurately predicts Pathologic Complete Response in patients with invasive breast cancer. PLoS ONE 2023, 18, e0280320. [Google Scholar] [CrossRef] [Scilit]
- Chen, S.; Shu, Z.; Li, Y.; Chen, B.; Tang, L.; Mo, W.; Shao, G.; Shao, F. Machine learning-based radiomics nomogram using magnetic resonance images for prediction of neoadjuvant chemotherapy efficacy in breast cancer patients. Front. Oncol. 2020, 10, 1410. [Google Scholar] [CrossRef] [Scilit]
- Chen, X.; Chen, X.; Yang, J.; Li, Y.; Fan, W.; Yang, Z. Combining dynamic contrast-enhanced magnetic resonance imaging and apparent diffusion coefficient maps for a radiomics nomogram to predict pathological complete response to neoadjuvant chemotherapy in breast cancer patients. J. Comput. Assist. Tomogr. 2020, 44, 275–283. [Google Scholar] [CrossRef] [Scilit]
- Xiong, Q.; Zhou, X.; Liu, Z.; Lei, C.; Yang, C.; Yang, M.; Zhang, L.; Zhu, T.; Zhuang, X.; Liang, C.; et al. Multiparametric MRI-based radiomics analysis for prediction of breast cancers insensitive to neoadjuvant chemotherapy. Clin. Transl. Oncol. 2020, 22, 50–59. [Google Scholar] [CrossRef] [Scilit]
- Joo, S.; Ko, E.S.; Kwon, S.; Jeon, E.; Jung, H.; Kim, J.Y.; Chung, M.J.; Im, Y.H. Multimodal deep learning models for the prediction of pathologic response to neoadjuvant chemotherapy in breast cancer. Sci. Rep. 2021, 11, 18800. [Google Scholar] [CrossRef] [Scilit]
- Yoon, H.J.; Kim, Y.; Chung, J.; Kim, B.S. Predicting neo-adjuvant chemotherapy response and progression-free survival of locally advanced breast cancer using textural features of intratumoral heterogeneity on F-18 FDG PET/CT and diffusion-weighted MR imaging. Breast J. 2019, 25, 373–380. [Google Scholar] [CrossRef] [Scilit]
- Umutlu, L.; Kirchner, J.; Bruckmann, N.M.; Morawitz, J.; Antoch, G.; Ting, S.; Bittner, A.K.; Hoffmann, O.; Häberle, L.; Ruckhäberle, E.; et al. Multiparametric 18F-FDG PET/MRI-Based Radiomics for Prediction of Pathological Complete Response to Neoadjuvant Chemotherapy in Breast Cancer. Cancers 2022, 14, 1727. [Google Scholar] [CrossRef] [Scilit] [PubMed]
- Choi, J.H.; Kim, H.A.; Kim, W.; Lim, I.; Lee, I.; Byun, B.H.; Noh, W.C.; Seong, M.K.; Lee, S.S.; Kim, B.I.; et al. Early prediction of neoadjuvant chemotherapy response for advanced breast cancer using PET/MRI image deep learning. Sci. Rep. 2020, 10, 21149. [Google Scholar] [CrossRef] [Scilit] [PubMed]
- Montemezzi, S.; Benetti, G.; Bisighin, M.V.; Camera, L.; Zerbato, C.; Caumo, F.; Fiorio, E.; Zanelli, S.; Zuffante, M.; Cavedon, C. 3T DCE-MRI radiomics improves predictive models of complete response to neoadjuvant chemotherapy in breast cancer. Front. Oncol. 2021, 11, 1289. [Google Scholar] [CrossRef] [Scilit] [PubMed]
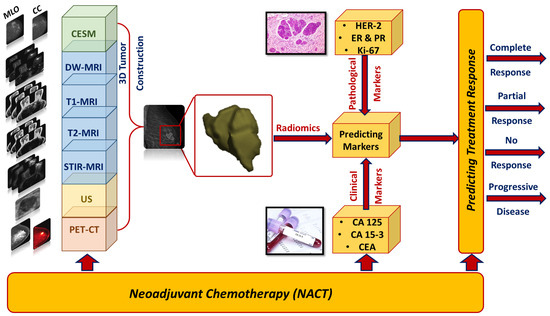
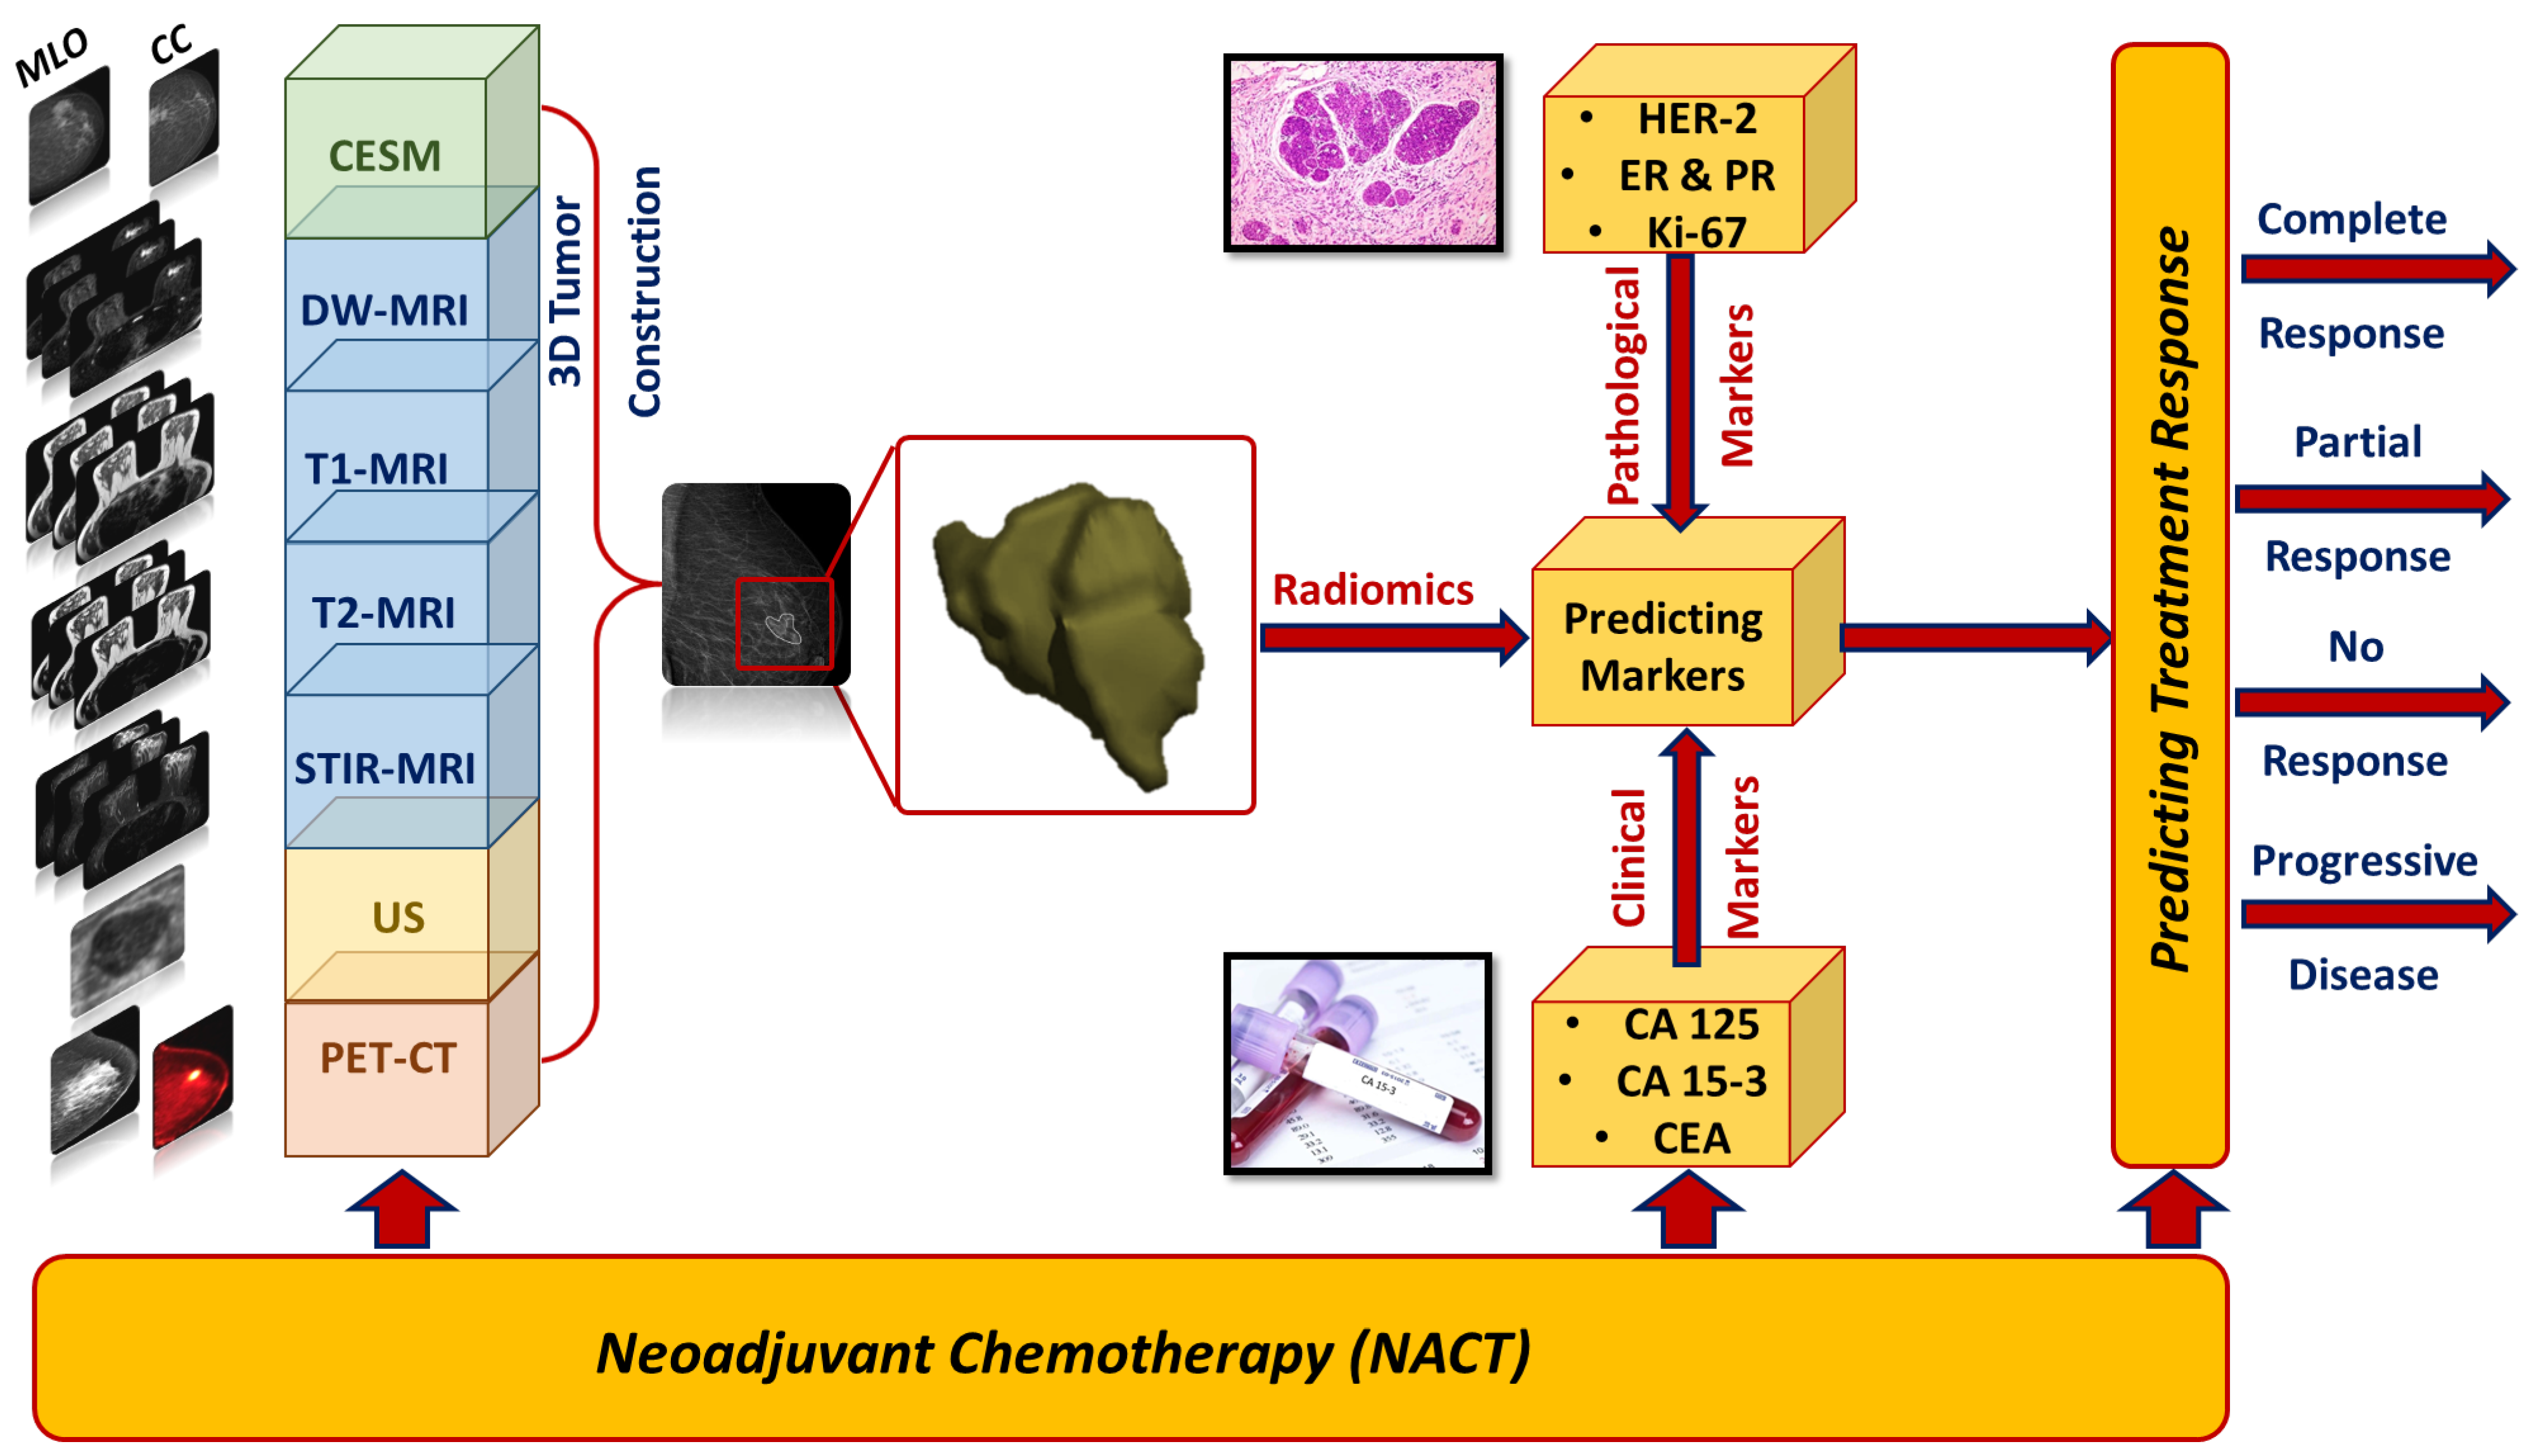
Disclaimer/Publisher’s Note: The statements, opinions and data contained in all publications are solely those of the individual author(s) and contributor(s) and not of MDPI and/or the editor(s). MDPI and/or the editor(s) disclaim responsibility for any injury to people or property resulting from any ideas, methods, instructions or products referred to in the content. |
© 2023 by the authors. Licensee MDPI, Basel, Switzerland. This article is an open access article distributed under the terms and conditions of the Creative Commons Attribution (CC BY) license (https://creativecommons.org/licenses/by/4.0/).