


Simple Summary
Immune checkpoint inhibitors (ICI) are effective in fractions of patients with disseminated melanoma. Significant toxicity can also occur from the treatments, that, in addition, are expensive. It is therefore important to increase the knowledge of predictive factors and their efficacy in different patient groups. This study is the first to analyze the plasma activity of thymidine kinase (TK), an enzyme involved in DNA synthesis and repair, as a biomarker in melanoma patients. In this study, high TK activity (TKa) levels in melanoma patients were associated with poor baseline factors, such as poor performance status, high plasma lactate dehydrogenase levels, and advanced tumor stage. High TKa levels were also associated with a poor efficacy of immune checkpoint inhibitors. TKa is hence a novel and interesting plasma biomarker in melanoma and should be further studied to define its role as a prognostic and predictive marker in this disease.
Abstract
Background. Immune checkpoint inhibitors (ICI) are effective in fractions of patients with disseminated melanoma. This study is the first to analyze the plasma activity of thymidine kinase (TK), an enzyme involved in DNA synthesis and repair, as a biomarker in melanoma patients. Methods. Plasma samples were collected prior to treatment start in patients with unresectable metastatic cutaneous melanoma, treated with ICI (anti-CTLA-4 and/or anti-PD-1). Plasma TK activity (TKa) levels were determined using the DiviTum TKa ELISA assay. TKa levels were correlated with patients’ baseline characteristics, response rate (RR), progression-free survival (PFS), and overall survival (OS). Results. In the 90 study patients, the median TKa level was 42 Du/L (range <20–1787 Du/L). A significantly higher plasma TKa was found in patients with ECOG performance status ≥1 (p = 0.003), M1c-d disease (p = 0.015), and elevated lactate dehydrogenase levels (p < 0.001). The RR was 63.2% and 30.3% in those with low or high TKa, respectively (p = 0.022). The median PFS was 19.9 and 12.6 months in patients with low or high TKa, respectively (hazard ratio (HR) 1.83 (95% CI, 1.08–3.08), p = 0.024). The median OS was >60 months and 18.5 months in patients with low or high TKa, respectively (HR: 2.25 (95% CI, 1.25–4.05), p = 0.011. Conclusions. High pretreatment plasma TKa levels were significantly associated with worse baseline characteristics and poor response and survival in ICI-treated melanoma patients. TKa is hence a novel and interesting plasma biomarker in melanoma and should be further studied to define its role as a prognostic and predictive marker in this disease.
1. Introduction
In recent years, effective immune checkpoint inhibitor (ICI) regimens with CTLA-4 and PD-1 blocking antibodies have emerged for the treatment of melanoma [1,2,3,4,5,6]. These treatments have revolutionized the melanoma oncology field, but unfortunately a considerable fraction of melanoma patients does not respond or get lasting effects from these treatments. Significant toxicity can also occur from the treatments, that, in addition, are expensive. It is therefore important to increase the knowledge of predictive factors and their efficacy in different patient groups.
Thymidine kinase 1 (TK) is a cytosolic enzyme, a phosphotransferase that plays a pivotal role in DNA synthesis and repair [7]. TK has a key function in DNA synthesis and cell division as it is part of the reaction chain to introduce thymidine into the DNA strand [7]. Dividing cells release TK during mitotic exit, and TK can thus be detected in the blood. Further, elevated TK enzyme activity has been measured in blood samples from cancer patients and is associated with tumor proliferation and tumor burden [8]. Circulating levels of TKa, measured with the DiviTum assay, have been shown to be associated with disease stage, prognosis, and treatment efficacy in several cancer types, including breast, lung, pancreatic, and renal cell cancer [9,10,11,12,13,14,15]. This study is the first to analyze TKa levels in the plasma of melanoma patients. TKa levels in metastatic melanoma patients were measured before starting ICI treatment and correlated with baseline clinical characteristics, treatment response, and survival.
2. Materials and Methods
2.1. Patients and Plasma Samples
Plasma samples were collected from patients with unresectable metastatic cutaneous melanoma, treated with ICI (anti-CTLA-4 and/or anti-PD-1) at the Department of Oncology, Karolinska University Hospital, Stockholm, Sweden in the years 2012–2019. The treatments were administrated according to standard ICI regimens and dosage approved for the treatment of metastatic melanoma. Blood samples were taken from the patients within 5 days prior to treatment start. The blood samples were collected in EDTA tubes and centrifuged at 1500× g for 10 min, and the separated plasma was centrifuged at 2400× g for 15 min and frozen at −70 °C within 1 h of processing. The baseline clinical data included age at treatment start, gender, Eastern Cooperative Oncology Group (ECOG) performance status, baseline tumor stage according to the American Joint Committee (AJCC) on Cancer, Eighth Edition [16], number of affected organs, baseline lactate dehydrogenase (LDH) levels, previous lines of treatment, and ICI regime received after TKa sampling. The study was conducted in accordance with Good Clinical Practice, with informed consent from all patients, and was approved by the Stockholm Regional Ethics Committee.
2.2. TK Activity Level Analysis
Plasma TKa levels were determined using the DiviTum TKa assay (Biovica, Sweden) in accordance with the manufacturer’s instructions, which have previously been reported [7]. DiviTum TKa is a refined ELISA-based test reflecting cell proliferation rate by measuring TKa in serum, plasma, or cells. In summary, plasma was mixed with the reaction mixture in a 96-well ELISA plate, and bromodeoxyuridine (BrdU) monophosphate was generated by TK reaction, phosphorylated to BrdU triphosphate, and incorporated into a synthetic DNA strand. An anti-BrdU monoclonal antibody conjugated to the enzyme alkaline phosphatase and a chromogenic substrate were used to detect BrdU incorporation. The absorbance readings were converted using standards with known TKa values (working range from 20 to 4000 Du/L). The lower limit of detection of the assay was set at 20 Du/L, and all values below the threshold were reported as <20 Du/L. All plasma TKa analyses were performed in the Biovica laboratory (Uppsala, Sweden) where the personnel were blinded to patient and tumor data. The samples were measured in duplicate and fulfilled the Coefficient of Variation (CV) criteria of the DiviTum assay (CV < 20%). The DiviTum assay for measuring TKa is a CE-IVD-labelled assay and has also been submitted to the FDA in a 510 (k) application that is awaiting approval. Further details regarding the assay can be found at biovica.com.
2.3. Follow-Up
Routine follow-up after initiating the ICI treatment included monthly clinical assessments and radiological evaluations every third month. The patients had a minimum follow-up of 24 months. The patients were grouped based on TKa levels in plasma at baseline (low or high) and followed for treatment response, progression-free survival (PFS), and overall survival (OS). Best response to treatment was based on radiological investigations (CT, MRI, and/or positron emission (PET) CT tomography) evaluated by a radiologist and assessed according to the Response Evaluation Criteria in Solid Tumors (RECIST) 1.1 criteria [17]. Response rate (RR) was defined as the frequency of patients with partial (PR) or complete responses (CR) as the best response. Disease control rate (DCR) was defined as the frequency of patients with PR, CR, or stable disease (SD) as the best response after at least three months of treatment. PFS was defined as the time from treatment start until the date of confirmed progression or the date of death or of the last follow-up. OS was defined as the time from treatment start until the date of death or last follow-up.
2.4. Statistical Methods
A receiver operating characteristic (ROC) analysis was performed to investigate TKa cut-offs with the most optimal sensitivity and specificity to predict tumor stage, performance stage, response, and survival. Baseline characteristics and treatment responses were compared with the Chi-square test for categorical variables and the Student’s t-test for continuous variables. p values <0.05 were deemed statistically significant. The time to event outcomes for PFS and OS were analyzed with Kaplan–Meier curves and Cox proportional hazards regression. Median PFS and OS with 95% confidence intervals (CI) were assessed. Univariable, bivariable, and multivariable models for Cox regression were used to assess each predictor’s association with PFS and OS. Hazard ratios (HR) and corresponding two-sided 95% CI were estimated. Statistical analyses were performed with R Version 4.1.1. Concordance is a measure of the model’s predicative accuracy measured as the proportion of all evaluable pairs of subjects where the model correctly predicts a higher risk for the individual in the pair with the worst outcome.
3. Results
3.1. Baseline Characteristics
A total of 90 patients with metastatic melanoma were included in the study. The median pre-treatment plasma TKa level was 42 Du/L (range <20–1787 Du/L). There were no significant differences in TKa levels related to the age or the sex of the patients (Table 1). However, a significantly higher plasma TKa was found in patients with ECOG performance status ≥1 vs. 0–1 (p = 0.003), with M1c-M1d vs. M1a-M1b disease (p = 0.015), or with elevated vs. non-elevated LDH (p < 0.001). The TKa levels were higher in patients who were previously treated or had more than three affected organs, but here the difference in TKa was not significantly different. In patients with M1b-d disease, the TKa level was compared depending on if the patients had metastatic spread to a certain organ or not. This analysis was done separately from that on M1a patients in an attempt to address if the TKa level was affected by the spread to a specific organ, rather than assessing the tumor burden (as M1a patients typically have substantially less tumor burden). To conclude, no significant differences were observed regarding which organ was affected.
Table 1.
Pre-treatment thymidine kinase 1 (TK) activity (Du/L) in the plasma of patients with unresectable melanoma.
3.2. Determining the Cut-Off for TKa
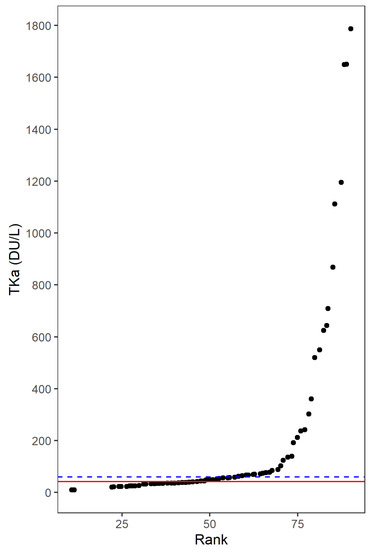
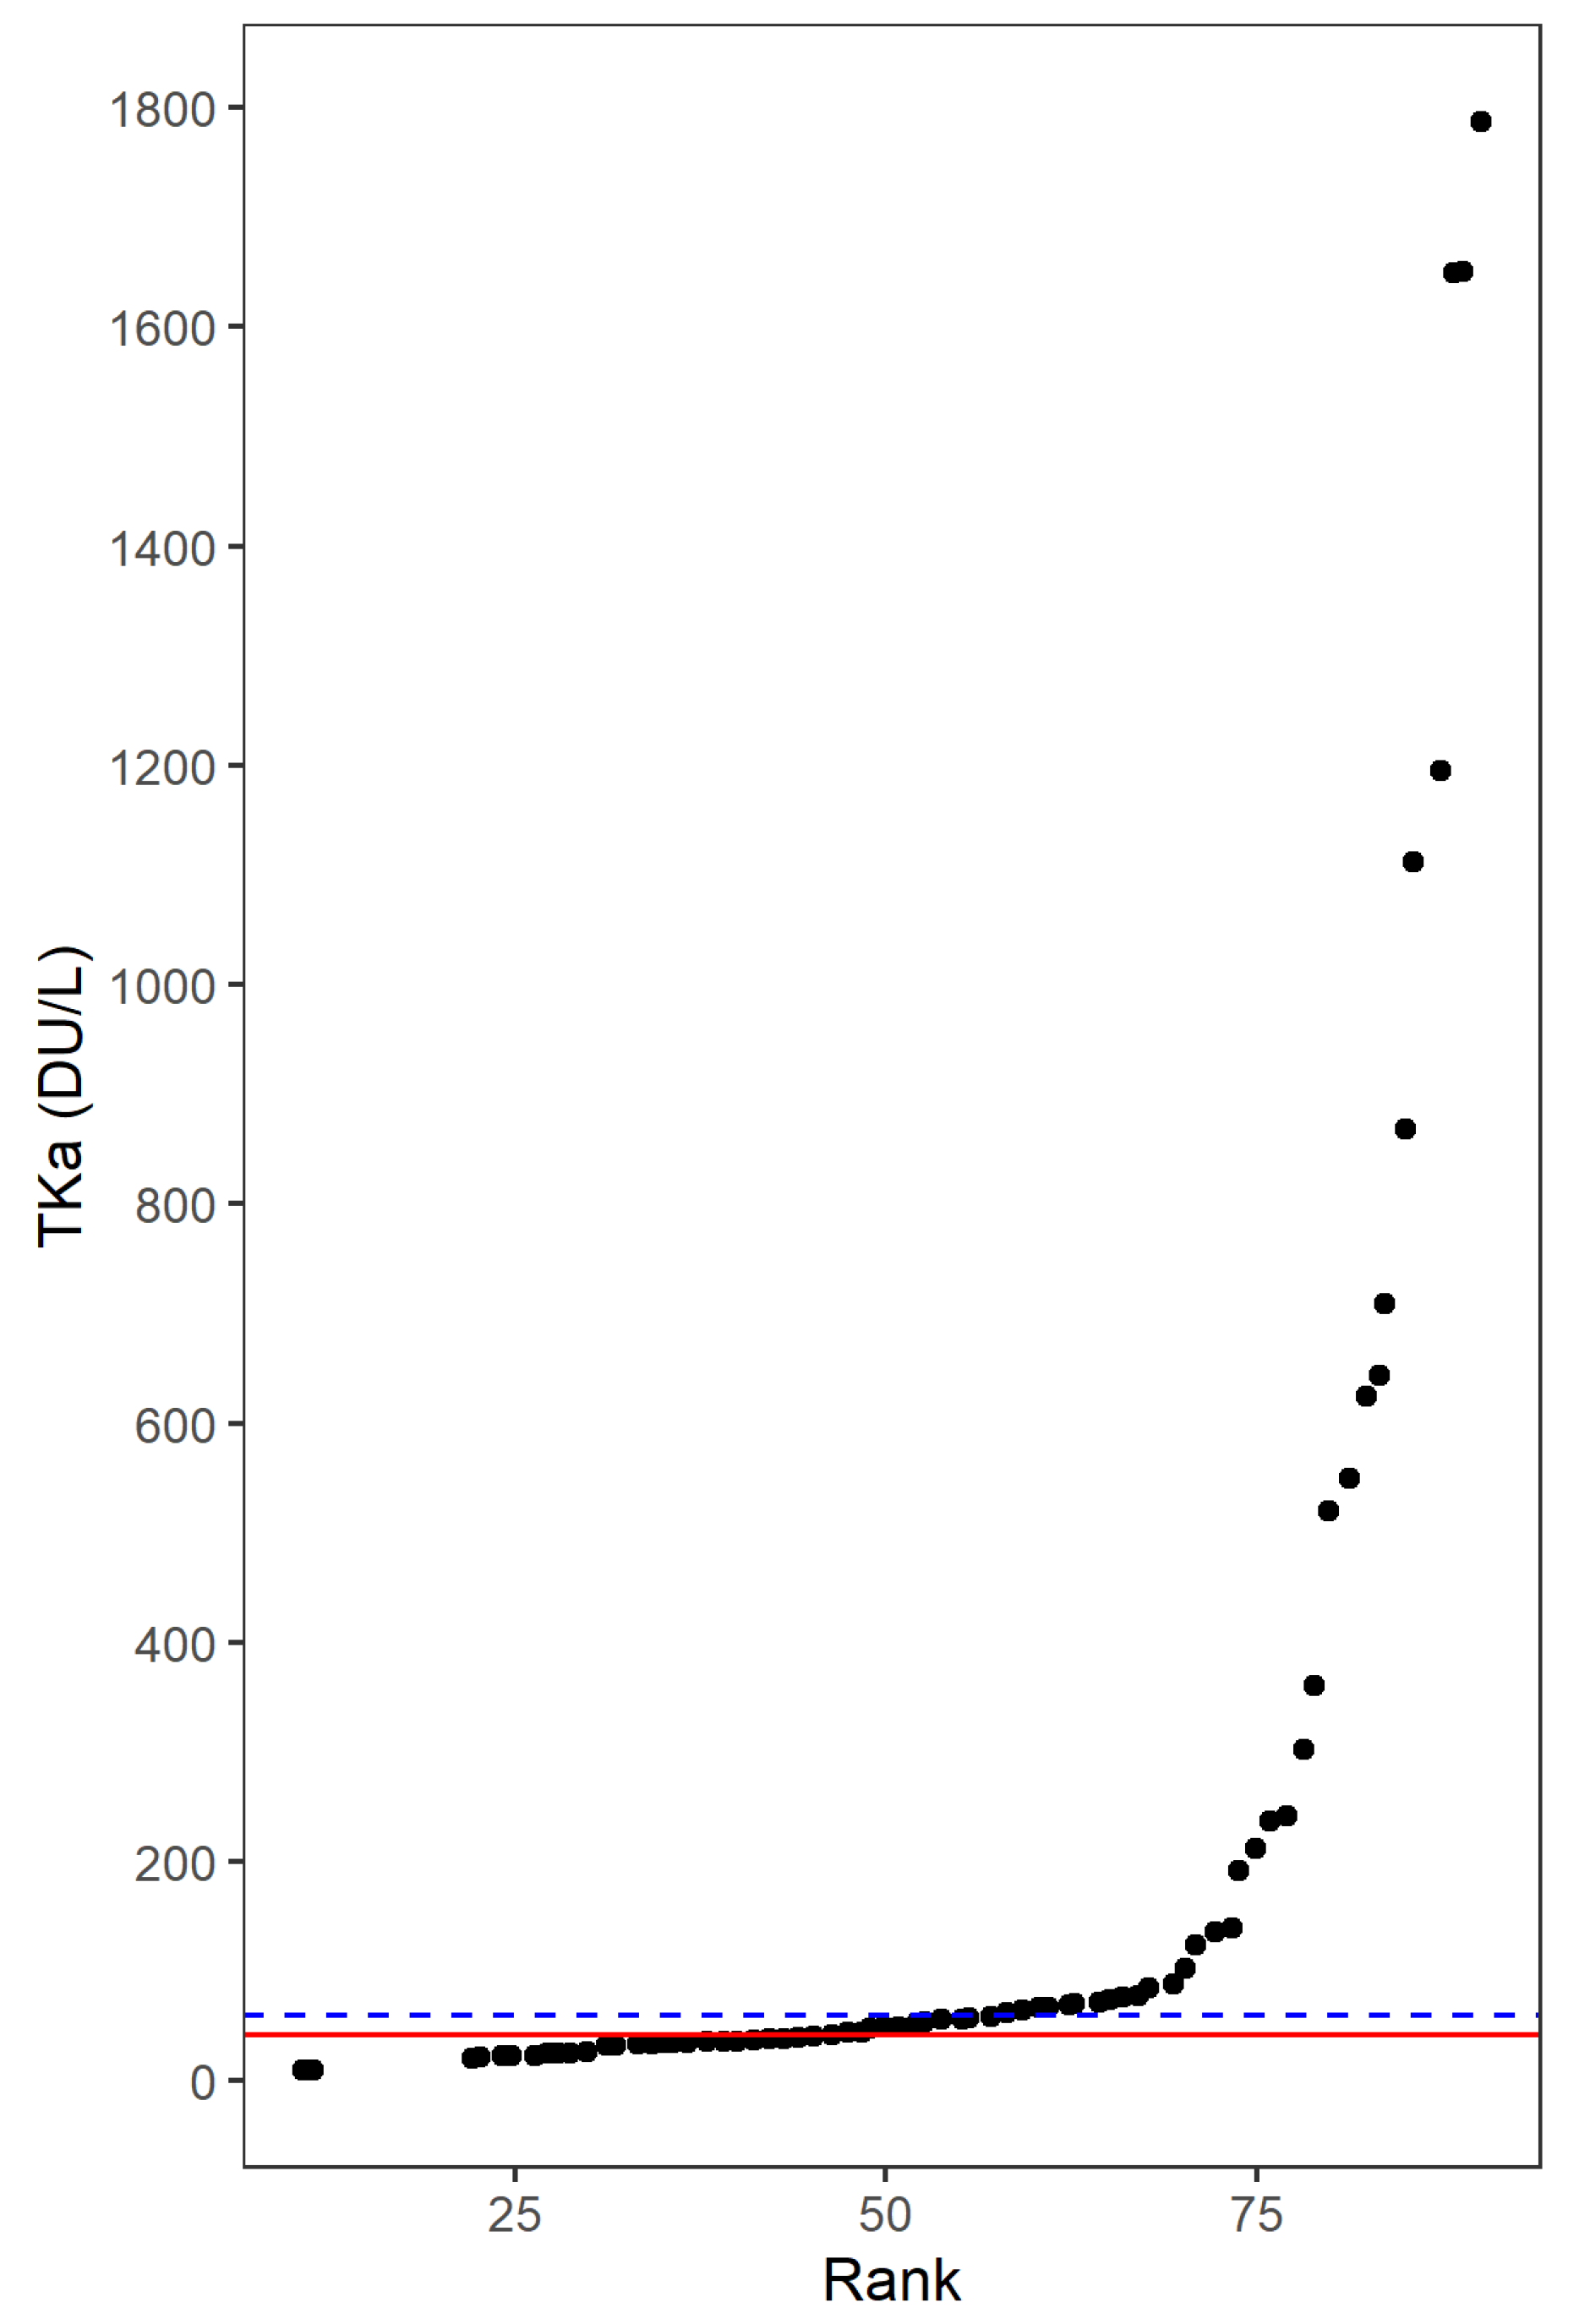
As TKa has not been studied in melanoma before, an essential aim was to determine a suitable cut-off and then compare patients with high or low plasma TKa levels. The median TKa at baseline (42 Du/L) gave a cut-off that divided patients with very similar TKa levels into different groups (Figure 1). In that sense, 60 Du/L was considered as a more suitable cut-off, since it ensured more differentiation in TKa levels and gave sufficient numbers of patients with high or low TKa levels. In a next step, ROC analyses were performed to determine TKa cut-offs with the most optimal sensitivity and specificity in predicting baseline characteristics and outcomes (Supplementary Figure S1). The ROC analyses demonstrated that TKa cut-offs between 49 and 72 achieved the highest sensitivity and specificity to predict tumor stage, performance stage, ICI response, PFS and OS at 24 months (the median of these cut-offs was 58). The ROC analyses hence further supported the use of 60 Du/L as a reasonable cut-off.
Figure 1.
Determining the cut-off for thymidine kinase 1 activity (TKa) in the plasma of metastatic melanoma patients treated with immune checkpoint inhibitors. The figures show the rank (order) of TKa in Divitum® units per liter (Du/L) on the x-axis and the TK value on the y-axis. When determining the cut-off value for TKa, the most optimal cut-off was considered as the value closest to the median that ensured a differentiation in the TKa value with sufficient numbers of observations in each group. The median TKa at baseline was 42 Du/L. This median (red line) gave a cut-off that divided patients with very similar TKa values into different groups. A cut-off of 60 Du/L (blue line) ensured more differentiation in TKa as well as enough observations in both groups.
3.3. Characteristics and Outcomes of Patients with High or Low TKa
In melanoma patients with high (≥60 Du/L) or low plasma TKa levels, there were no significant differences in the age, sex, or the tumor BRAF mutation status (Table 2). However, a high TKa level was significantly associated with ECOG performance status ≥1 (p < 0.001), M1c or M1d disease (p = 0.002), ≥3 affected organs (p = 0.031), elevated LDH (p < 0.001), and a higher median LDH (p < 0.001). In patients with high or low TKa, no significant differences were seen with respect to whether previous treatment lines had been received or to the ICI regime chosen for the patient. The majority of the patients were treated in first line with PD-1 inhibitor monotherapy (nivolumab or pembrolizumab). A smaller portion received a single CTLA-4 inhibitor (ipilimumab) or a CTLA-4 and PD-1 inhibitor combination (ipilimumab and nivolumab). Although there was not a statistically significant difference, more patients in the TKa-low group received combination immunotherapy (n = 6) compared to the TKa-high group (n = 0). A plausible explanation is that the better performance status and somewhat younger age of the TKa-low patients resulted in the fact that they more often were assessed and found to be able to tolerate the more toxic combination therapy.
Table 2.
Characteristics of melanoma patients with low (<60 Du/L) or high thymidine kinase 1 (TK) activity (Du/L) in plasma before starting immune checkpoint inhibitor treatment.
The RR was significantly higher for patients with low TKa (63.2%) than for those with high TKa (30.3%) (p = 0.022) (Table 3). The rate of complete response was also higher for the TKa-low group (33.3%) than for the TKa-high group (6.0%) (p = 0.016). The DCR was also higher for patients with low (80.7%) vs. those with high (54.3%) TKa (p = 0.022). No difference was seen related to why the treatment was ended (progressive disease, adequate response, or toxicity) (Table 3).
Table 3.
Response evaluations in melanoma patients with low (<60 Du/L) or high thymidine kinase 1 (TK) activity (Du/L) in plasma before starting immune checkpoint inhibitor treatment.
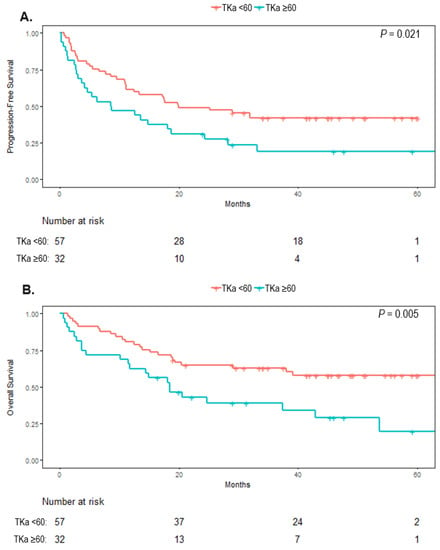
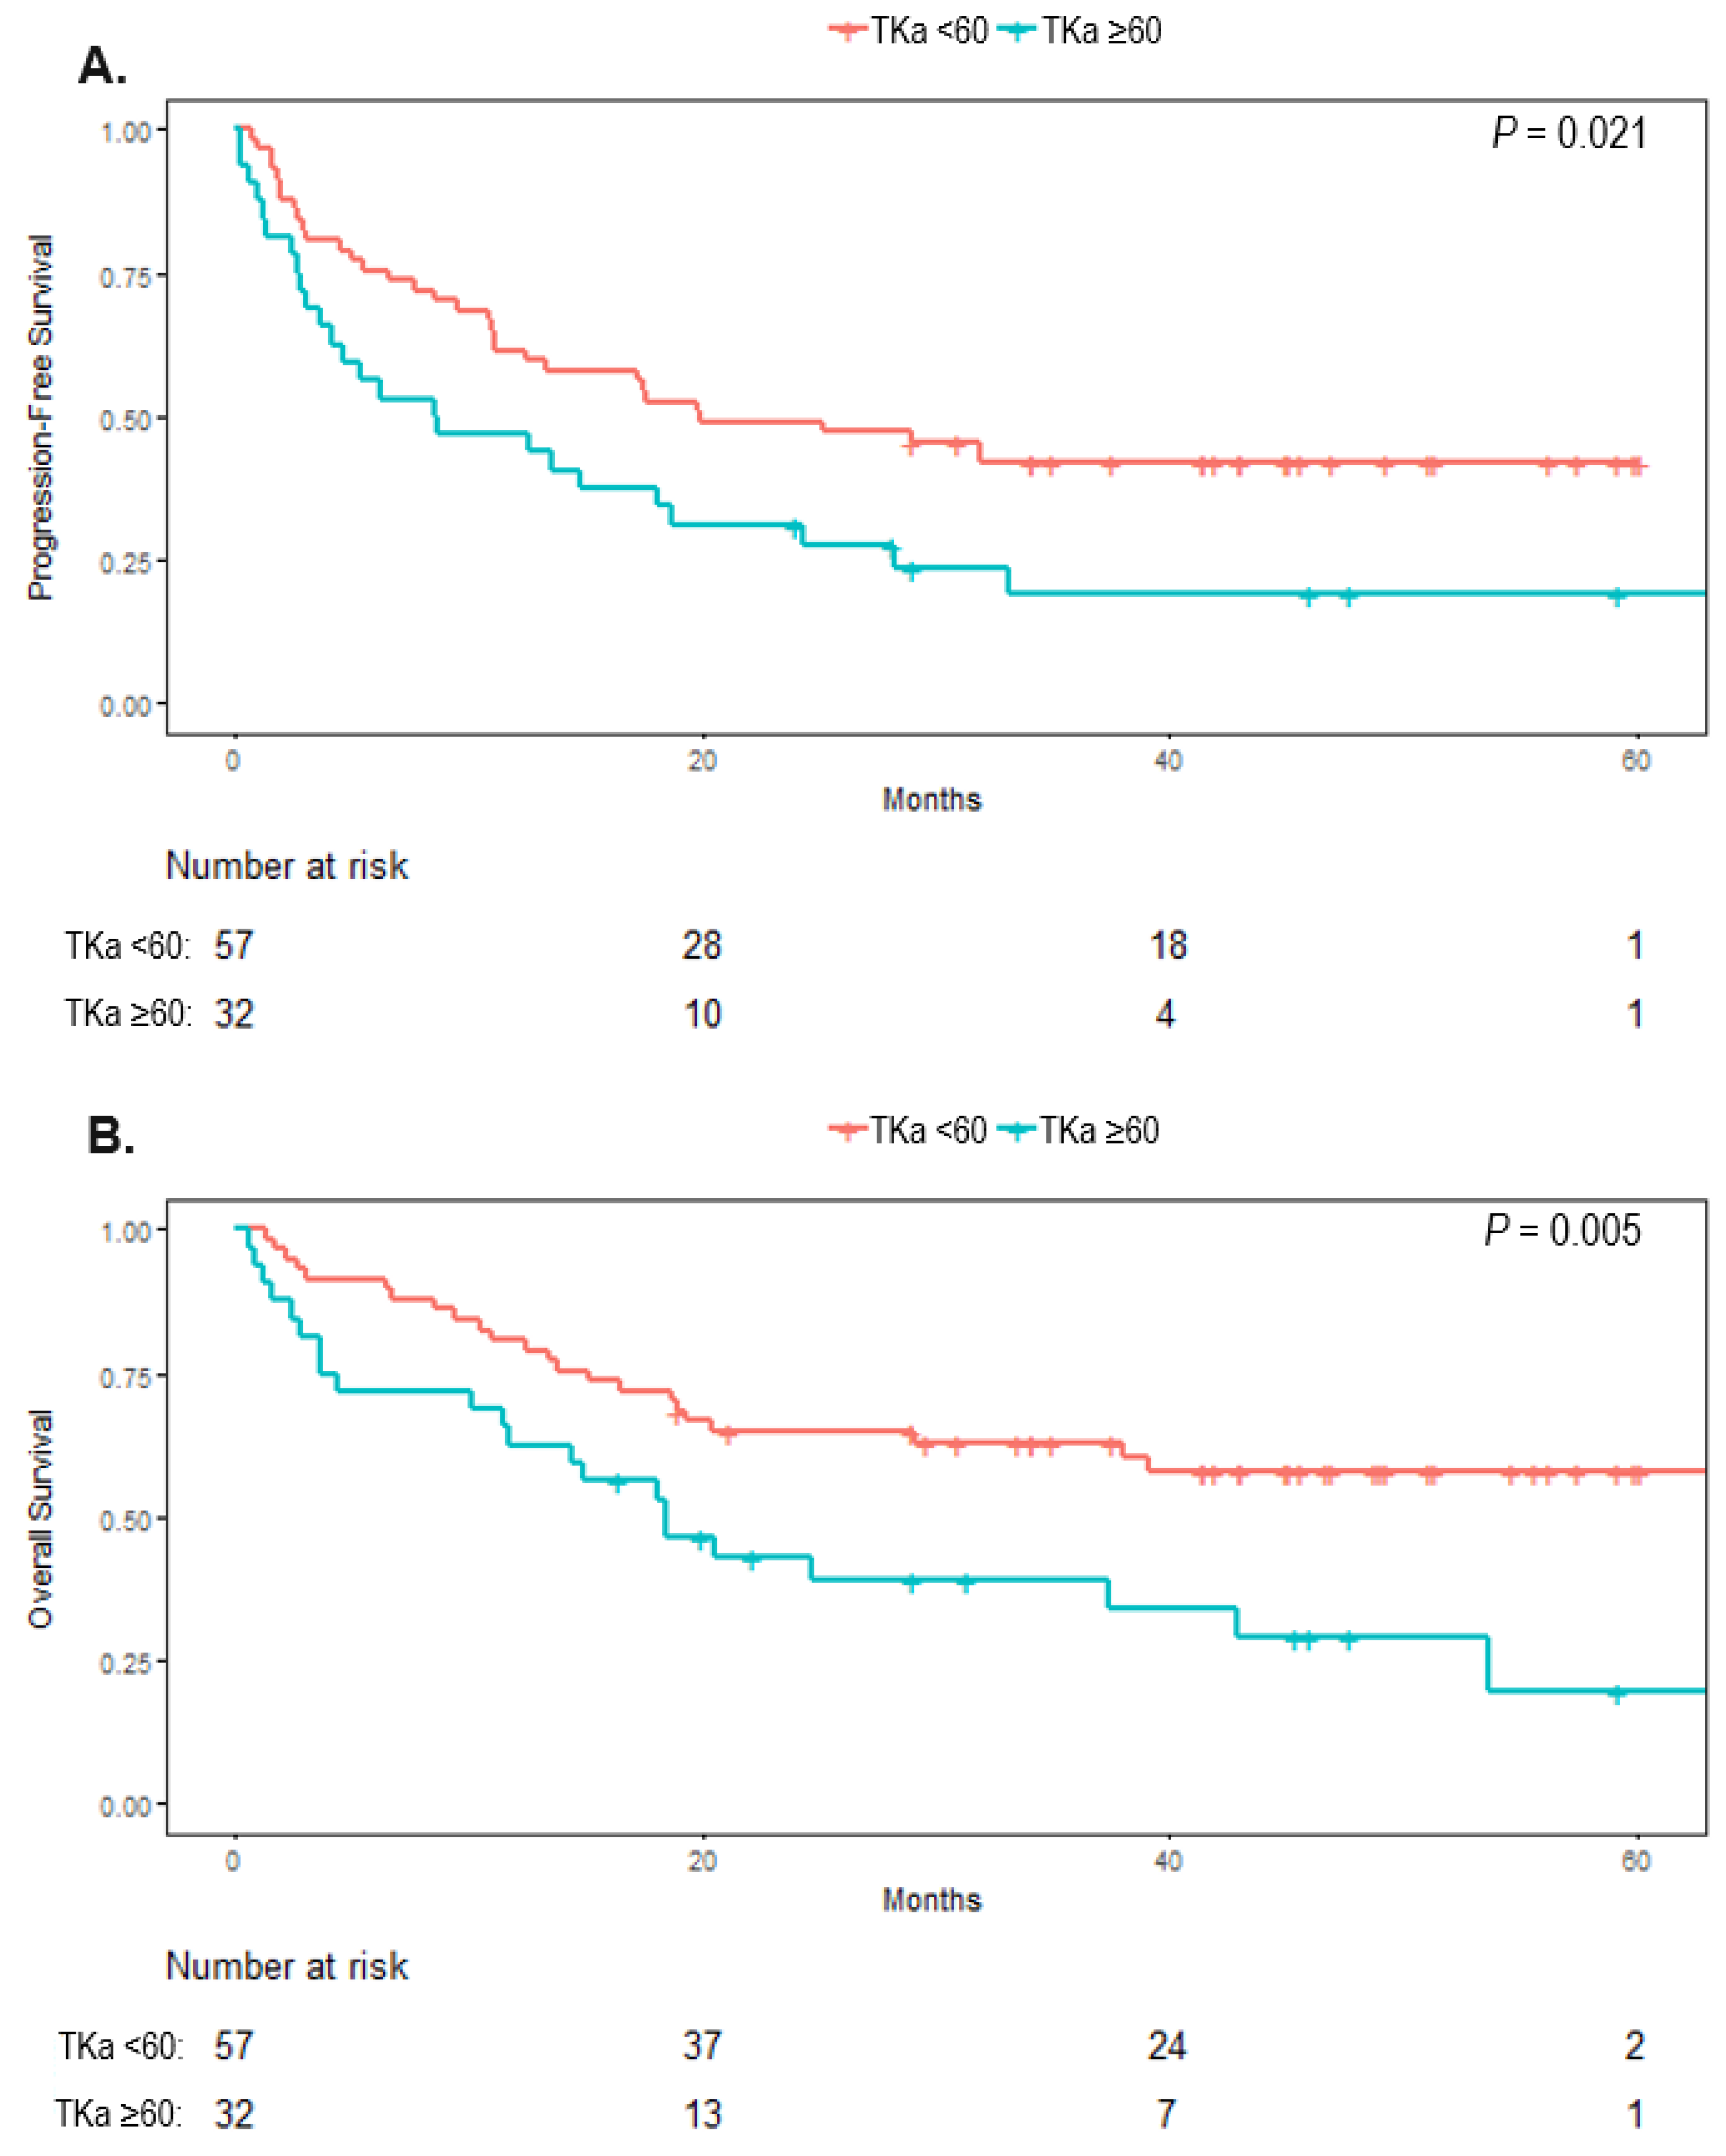
The median PFS was 19.9 months (95% CI, 11.0 to not reached) in patients with low TKa and 12.6 months (95% CI, 3.6 to 28.3) in patients with high TKa (p = 0.021) (Figure 2). The median OS was not reached (>60 months, 95% CI, 38.0 to not reached) in patients with low TKa and was 18.5 months (95% CI, 11.7 to not reached) in patients with high TKa, (p = 0.005).
Figure 2.
Kaplan–Meier curves for survival in melanoma patients with high (>60 Du/L) or low thymidine kinase 1 activity (TKa) in plasma before starting a treatment with immune checkpoint inhibitors. (A). The median progression-free survival was, in patients with low TKa, 19.9 months (95% CI, 11.0 to not reached) and in patients with high TKa, 12.6 months (95% CI, 3.6 to 28.3) (p = 0.021). (B). The median overall survival was not reached in patients with low TKa (>60 months, 95% CI, 38.0 to not reached), and in the patients with high TKa it was 18.5 (p = 0.005).
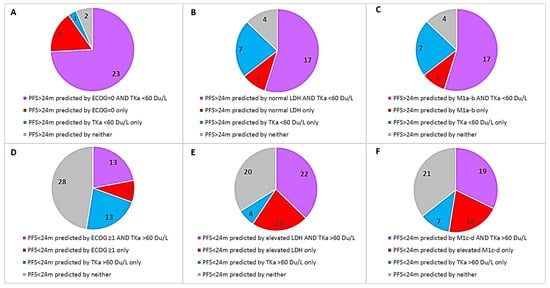
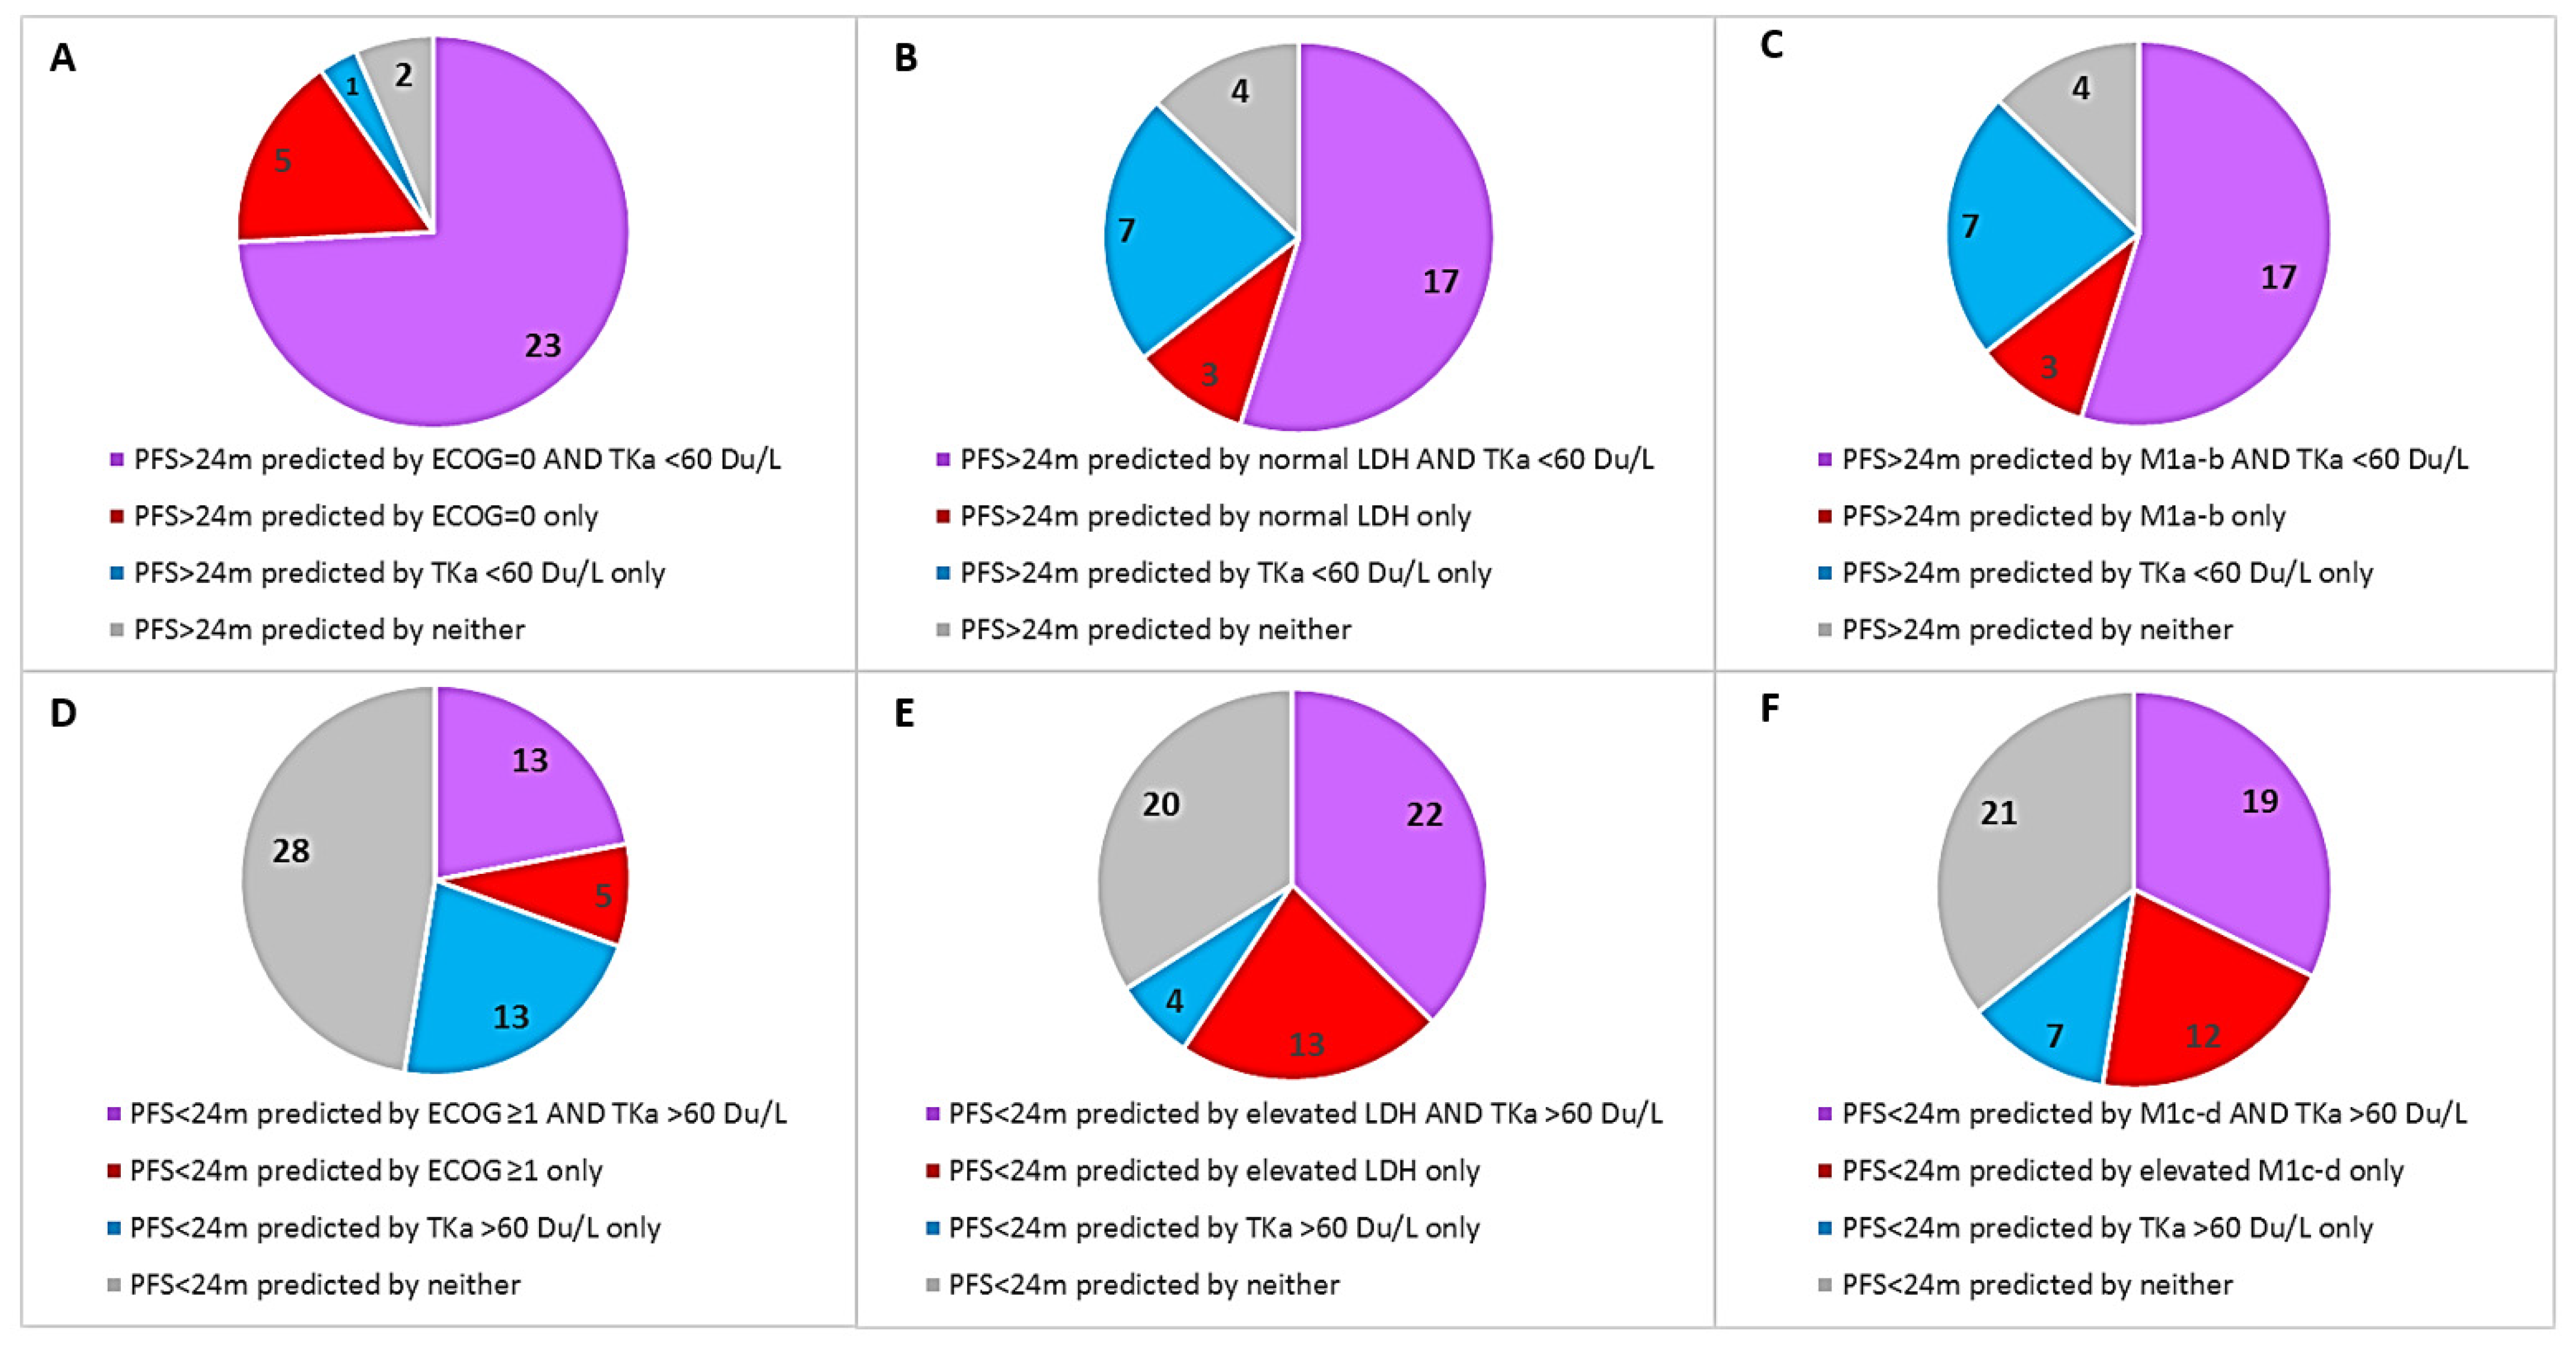
The univariate Cox regression analysis showed significantly worse PFS and OS for patients with baseline ECOG performance status ≥1, M1c or M1d disease, elevated LDH, and a high TKa (Table 4). For TKa the HR for PFS was 1.83 (95% CI, 1.08–3.08), p = 0.024), and that for OS was 2.25 (95% CI, 1.25–4.05), p = 0.007. In the multivariate analysis, TKa was not significant for PFS or OS. A high degree of multicollinearity amongst the analyzed variables was identified as a factor that resulted in that the HR for many of the variables that were significant in the univariate model, were not significant in the multivariate model. To evaluate how the TKa was affected by each of the covariates, a bivariate regression analysis was performed where TKa was analyzed pairwise with one other baseline factor (Supplementary Figure S2). As for the PFS, TKa was only independent of the patients’ sex. Further, in the bivariable analysis for OS, TKA was independent of age, sex, and tumor stage. Figure 3 shows the number of patients with longer (>24 months, Figure 3A–C) or shorter (<24 months, Figure 3D–F) PFS; each chart shows if longer or shorter PFS was correctly predicted by the TKa level together with one other baseline variable (ECOG, LDH, or M stage). The charts show that, although there was a substantial overlap of TKa and the other variables (purple in the charts), in a fraction of patients, low or high TKa levels alone were associated with long or short PFS, respectively (blue in the charts).
Table 4.
Cox regressions for survival in metastatic melanoma patients treated with immune checkpoint inhibitors.
Figure 3.
Pie charts that show the number of patients with longer (>24 months, (A–C)) or shorter (<24 months, (D–F)) progression-free survival (PFS). Each pie chart shows if longer or shorter PFS was correctly predicted by the TKa level together with one other baseline variable (ECOG, LDH, or M stage.) For example (B) shows that in 17 patients, long PFS was predicted by both low TKa and normal LDH at baseline (correctly predicted by both variables, purple), in 3 patients long PFS was predicted only by normal LDH, as TKa was elevated (correctly predicted only by LDH, red), in 7 patients long PFS was predicated only by low TKa, as LDH level was elevated (correctly predicted only by TKa, blue), and in 4 patients long PFS was predicted by neither variable, as both LDH and TKa levels were high (correctly predicted by none, gray).
4. Discussion
In the patients with advanced cutaneous melanoma included in the study, significantly higher TKa levels were seen in patients that at treatment start had poor performance status, more advanced tumor stage, and higher LDH level. The median TKa was 42 Du/L (range <20–1787 Du/L), while, as a reference, in 123 healthy subjects, the median TKa value was <20 Du/L (Biovica data on file). In a cohort of preoperative pancreatic cancer patients, the median TKa value was 40 Du/L, and in a cohort of preoperative renal cell cancer patients, the median TKa was 38 Du/L [12,14]. Further, in a cohort of non-small cell lung cancer patients, the median TKa was 129 Du/L before the start of systemic treatment, whereas in a cohort of breast cancer patients, the pre-treatment TKa was 57 Du/L in patients with locoregional disease and 101 Du/L in patients with visceral metastasis [15,18]. Collectively, our data show that TKa levels in patients with metastatic melanoma is, as for the other studied cancer types, elevated compared to the levels in healthy individuals and higher in patients with more advanced disease.
The patients with high TKa had a significantly poorer response to the ICI treatment and also a significantly shorter survival (both PFS and OS). In the multivariate analysis, TKa was not an independent predictor for PFS and OS. The bivariate analysis showed that TKa association with PFS and OS was, in a varying degree, dependent on ECOG, LDH, and tumor stage; however, a considerable fraction of patients did not have corresponding pairs of good or poor baseline variables (Figure 3). Clinical factors such as performance status, tumor stage, and tumor burden are well-known prognostic factors and are also predictive of ICI efficacy in melanoma [1,2,3,4,16]. As for serum markers, elevated LDH level is the strongest known prognostic and predictive factor and is the only biomarker that is routinely used when monitoring melanoma patients in the clinic and included as a marker in clinical trials [16]. The serum LDH level reflects the hypoxic environment often present in melanoma tumors, with reduced oxidative phosphorylation and increased anaerobic glycolysis, where LDH catalyzes the conversion of pyruvate to lactate when oxygen supply is low or absent [19]. LDH is not a secreted enzyme; thus, an elevated serum level is thought to be secondary to spillage of LDH when melanoma cells outgrow their blood supply. LDH is also often elevated in various conditions affecting the liver, both malignant and non-malignant [19]. The TK enzyme has a significant role in DNA synthesis and repair. These processes are highly active in proliferating cells, and dividing tumor cells release TK during mitotic exit [7,8]. Hence, LDH and TKa are both markers of cell proliferation and tumor burden, but through different cellular processes.
Several other markers have been reported as predicative for ICI efficacy, including the composition of peripheral blood leukocytes, circulating tumor DNA (ctDNA) and exosomes, tumor mutational burden (TMB), high interferon-gamma-related gene expression signature in tumors, as well as the diversity of the gut microbiome [20,21,22,23,24,25,26,27]. In the clinical setting, widespread implementation of predictive assays, such as TMB, ctDNA, exosomes, tumor RNA expression signatures, or microbiome analyses, is a challenge, e.g., due to the complex and costly techniques and equipment needed, and there are also many different assays that can be used. To compare TKa is simpler and less costly than an ELISA-based test for a single plasma marker, and the assay can readily be set up in regular hospital laboratories.
The current study is limited by a moderate sample size, and the associations found need to be verified and further defined in larger separate cohorts. In particular, it needs to be further assessed if TKa has any capacity to predict outcomes by itself or if it is chiefly associated with established clinical prognostic parameters. The cut-off levels in TKa for optimal sensitivity and specificity to predict outcomes need to be further established and verified. In this study, we only analyzed TKa before treatment start, and further analyses of the effects of TKa dynamics after treatment start will be valuable. We have initiated a study to investigate this. Additionally, this is the first study of TKa in ICI-treated patients; TKa should also be studied in patients with other types of cancers receiving immunotherapy.
5. Conclusions
High pretreatment plasma TKa levels were significantly associated with worse baseline characteristics and poor response and survival in ICI-treated melanoma patients. We believe that plasma TKa is an interesting, previously not explored, candidate biomarker in melanoma. Further studies are warranted to define its role as a prognostic and predictive marker in melanoma patients.
Supplementary Materials
The following supporting information can be downloaded at: https://www.mdpi.com/article/10.3390/cancers14030702/s1, Supplementary Figure S1: ROC curve analysis with the most optimal TKa cut-offs for the sensitivity and specificity in predicting performance stage, tumor stage, treatment response, progression-free survival, and overall survival. Supplementary Figure S2: Bivariable regression with pairwise analyses of TKa together with one other variable for progression-free survival and overall survival in metastatic melanoma patients treated with immune checkpoint inhibitors.
Author Contributions
H.H., M.B., F.C.S., V.H., S.R. and S.E.B. planned the study. F.C.S., H.E., S.E.B., H.H. and V.H. provided biological samples and clinical data. M.B. conducted experiments. V.G. conducted the radiological assessments. H.H. and F.S. did the statistical analyses. H.H. wrote the manuscript. F.C.S., M.J., V.G., M.B., S.R., H.E., L.N., P.A.A., S.E.B. and V.H. provided critical evaluation of experimental data and of the manuscript. All authors read and approved of the manuscript before submission.
Funding
This work was supported by grants from the Swedish Cancer society (grant numbers CAN 2017/503 and 20 0156 F), an ALF grant from Region Stockholm (grant number 20200638), the Cancer Research Funds of Radiumhemmet (grant number 194092).
Institutional Review Board Statement
The use of biomaterial and clinical data was positively reviewed by the local ethics council in Stockholm, Sweden (2011/1980-31/1).
Informed Consent Statement
Informed consent was obtained from all subjects involved in the study.
Data Availability Statement
All data relevant to the study are included in the article or uploaded as supplementary information.
Acknowledgments
The author thank the patients who participated in the study.
Conflicts of Interest
Mattias Bergqvist is an employee of Biovica. The other authors have no disclosures to make.
References
- Hodi, F.S.; O’Day, S.J.; McDermott, D.F.; Weber, R.W.; Sosman, J.A.; Haanen, J.B.; Gonzalez, R.; Robert, C.; Schadendorf, D.; Hassel, J.C.; et al. Improved Survival with Ipilimumab in Patients with Metastatic Melanoma. N. Engl. J. Med. 2010, 363, 711–723. [Google Scholar] [CrossRef] [Scilit]
- Robert, C.; Long, G.V.; Brady, B.; Dutriaux, C.; Maio, M.; Mortier, L.; Hassel, J.C.; Rutkowski, P.; McNeil, C.; Kalinka-Warzocha, E.; et al. Nivolumab in previously untreated melanoma without BRAF mutation. N. Engl. J. Med. 2015, 372, 320–330. [Google Scholar] [CrossRef] [Scilit]
- Robert, C.; Schachter, J.; Long, G.V.; Arance, A.; Grob, J.J.; Mortier, L.; Daud, A.; Carlino, M.S.; McNeil, C.; Lotem, M.; et al. Pembrolizumab versus Ipilimumab in Advanced Melano-ma. N. Engl. J. Med. 2015, 372, 2521–2532. [Google Scholar] [CrossRef] [Scilit] [PubMed]
- Larkin, J.; Chiarion-Sileni, V.; Gonzalez, R.; Grob, J.J.; Cowey, C.L.; Lao, C.D.; Schadendorf, D.; Dummer, R.; Smylie, M.; Rutkowski, P.; et al. Combined Nivolumab and Ipilimumab or Mono-therapy in Untreated Melanoma. N. Engl. J. Med. 2015, 373, 23–34. [Google Scholar] [CrossRef] [Scilit]
- Robert, C.; Karaszewska, B.; Schachter, J.; Rutkowski, P.; Mackiewicz, A.; Stroiakovski, D.; Lichinitser, M.; Dummer, R.; Grange, F.; Mortier, L.; et al. Improved overall survival in mela-noma with combined dabrafenib and trametinib. N. Engl. J. Med. 2015, 372, 30–39. [Google Scholar] [CrossRef] [Scilit] [PubMed]
- Dummer, R.; Ascierto, P.A.; Gogas, H.J.; Arance, A.; Mandala, M.; Liszkay, G.; Garbe, C.; Schadendorf, D.; Krajsova, I.; Gutzmer, R.; et al. Encorafenib plus binimetinib versus vemurafenib or encorafenib in patients with BRAF-mutant melanoma (COLUMBUS): A multicentre, open-label, randomised phase 3 trial. Lancet Oncol. 2018, 19, 603–615. [Google Scholar] [CrossRef] [Scilit]
- Schwartz, J.L.; Tamura, Y.; Jordan, R.; Grierson, J.R.; Krohn, K.A. Monitoring tumor cell proliferation by targeting DNA synthetic processes with thymidine and thymidine analogs. J. Nucl. Med. 2003, 44, 2027–2032. [Google Scholar]
- Bitter, E.E.; Townsend, M.H.; Erickson, R.; Allen, C.; O’Neill, K.L. Thymidine kinase 1 through the ages: A comprehensive review. Cell Biosci. 2020, 10, 138. [Google Scholar] [CrossRef] [Scilit]
- Bagegni, N.; Thomas, S.; Liu, N.; Luo, J.; Hoog, J.; Northfelt, D.W.; Goetz, M.P.; Forero, A.; Bergqvist, M.; Karen, J.; et al. Serum thymidine kinase 1 activity as a pharmacodynamic marker of cyclin-dependent kinase 4/6 inhibition in patients with early-stage breast cancer receiving neoadjuvant palbociclib. Breast Cancer Res. 2017, 19, 123. [Google Scholar] [CrossRef] [Scilit]
- McCartney, A.; Bonechi, M.; De Luca, F.; Biagioni, C.; Curigliano, G.; Moretti, E.; Minisini, A.M.; Bergqvist, M.; Benelli, M.; Migliaccio, I.; et al. Plasma Thymidine Kinase Activity as a Bi-omarker in Patients with Luminal Metastatic Breast Cancer Treated with Palbociclib within the TREnd Trial. Clin. Cancer Res. 2020, 26, 2131–2139. [Google Scholar] [CrossRef] [Scilit]
- Cabel, L.; Rosenblum, D.; Lerebours, F.; Brain, E.; Loirat, D.; Bergqvist, M.; Cottu, P.; Donnadieu, A.; Bethune, A.; Kiavue, N.; et al. Plasma thymidine kinase 1 activity and outcome of ER+ HER2− metastatic breast cancer patients treated with palbociclib and endocrine therapy. Breast Cancer Res. 2020, 22, 98. [Google Scholar] [CrossRef] [Scilit] [PubMed]
- Felix, K.; Hinz, U.; Dobiasch, S.; Hackert, T.; Bergmann, F.; Neumüller, M.; Gronowitz, S.; Bergqvist, M.; Strobel, O. Preoperative Serum Thymidine Kinase Activity as Novel Monitoring, Prognostic, and Predictive Biomarker in Pancreatic Cancer. Pancreas 2018, 47, 72–79. [Google Scholar] [CrossRef] [Scilit] [PubMed]
- McCartney, A.; Biagioni, C.; Schiavon, G.; Bergqvist, M.; Mattsson, K.; Migliaccio, I.; Benelli, M.; Romagnoli, D.; Bonechi, M.; Boccalini, G.; et al. Prognostic role of serum thymidine kinase 1 activity in patients with hormone receptor-positive metastatic breast cancer: Analysis of the randomised phase III Evalua-tion of Faslodex versus Exemestane Clinical Trial (EFECT). Eur. J. Cancer 2019, 114, 55–66. [Google Scholar] [CrossRef] [Scilit]
- Nisman, B.; Appelbaum, L.; Yutkin, V.; Nechushtan, H.; Hubert, A.; Uziely, B.; Pode, D.; Peretz, T. Serum Thymidine Kinase 1 Activity Following Nephrectomy for Renal Cell Carcinoma and Radiofrequency Ablation of Metastases to Lung and Liver. Anticancer Res. 2016, 36, 1791–1797. [Google Scholar] [PubMed]
- Nisman, B.; Nechushtan, H.; Biran, H.; Gantz-Sorotsky, H.; Peled, N.; Gronowitz, S.; Peretz, T. Serum Thymidine Kinase 1 Activity in the Prognosis and Monitoring of Chemotherapy in Lung Cancer Patients: A Brief Report. J. Thorac. Oncol. 2014, 9, 1568–1572. [Google Scholar] [CrossRef] [Scilit] [PubMed]
- Gershenwald, J.E.; Scolyer, R.A.; Hess, K.R.; Sondak, V.K.; Long, G.V.; Ross, M.I.; Lazar, A.J.; Faries, M.B.; Kirkwood, J.M.; McArthur, G.A.; et al. Melanoma staging: Evidence-based changes in the American Joint Committee on Cancer eighth edition cancer staging manual. CA Cancer J. Clin. 2017, 67, 472–492. [Google Scholar] [CrossRef] [Scilit] [PubMed]
- Eisenhauer, E.A.; Therasse, P.; Bogaerts, J.; Schwartz, L.H.; Sargent, D.; Ford, R.; Dancey, J.; Arbuck, S.; Gwyther, S.; Mooney, M.; et al. New response evaluation criteria in solid tu-mours: Revised RECIST guideline (version 1.1). Eur. J. Cancer. 2009, 45, 228–247. [Google Scholar] [CrossRef] [Scilit]
- Bjöhle, J.; Bergqvist, J.; Gronowitz, J.S.; Johansson, H.; Carlsson, L.; Einbeigi, Z.; Linderholm, B.; Loman, N.; Malmberg, M.; Söderberg, M.; et al. Serum thymidine kinase activity compared with CA 15-3 in locally advanced and metastatic breast cancer within a randomized trial. Breast Cancer Res. Treat. 2013, 139, 751–758. [Google Scholar] [CrossRef] [Scilit]
- Palmer, S.R.; Erickson, L.A.; Ichetovkin, I.; Knauer, D.J.; Markovic, S.N. Circulating serologic and molecular biomarkers in malignant melanoma. Mayo Clin. Proc. 2011, 86, 981–990. [Google Scholar] [CrossRef] [Scilit]
- Fujii, T.; Naing, A.; Rolfo, C.; Hajjar, J. Biomarkers of response to immune checkpoint blockade in cancer treatment. Crit. Rev. Oncol. 2018, 130, 108–120. [Google Scholar] [CrossRef] [Scilit]
- Pico de Coana, Y.; Wolodarski, M.; van der Haar Avila, I.; Nakajima, T.; Rentouli, S.; Lundqvist, A.; Masucci, G.; Hansson, J.; Kiessling, R. PD-1 checkpoint blockade in advanced melanoma patients: NK cells, monocytic subsets and host PD-L1 expression as predictive biomarker candidates. Oncoimmunology 2020, 9, 1786888. [Google Scholar] [CrossRef] [Scilit] [PubMed]
- Hugo, W.; Zaretsky, J.M.; Sun, L.; Song, C.; Moreno, B.H.; Hu-Lieskovan, S.; Berent-Maoz, B.; Pang, J.; Chmielowski, B.; Cherry, G.; et al. Genomic and Transcriptomic Features of Response to Anti-PD-1 Therapy in Metastatic Melanoma. Cell 2016, 165, 35–44. [Google Scholar] [CrossRef] [Scilit] [PubMed]
- Snyder, A.; Makarov, V.; Merghoub, T.; Yuan, J.; Zaretsky, J.M.; Desrichard, A.; Walsh, L.A.; Postow, M.A.; Wong, P.; Ho, T.S.; et al. Genetic Basis for Clinical Response to CTLA-4 Blockade in Melanoma. N. Engl. J. Med. 2014, 371, 2189–2199. [Google Scholar] [CrossRef] [Scilit] [PubMed]
- Rozeman, E.A.; Hoefsmit, E.P.; Reijers, I.L.M.; Saw, R.P.M.; Versluis, J.M.; Krijgsman, O.; Dimitriadis, P.; Sikorska, K.; van de Wiel, B.A.; Eriksson, H.; et al. Survival and biomarker analyses from the OpACIN-neo and OpACIN neoadjuvant immunotherapy trials in stage III melanoma. Nat. Med. 2021, 27, 256–263. [Google Scholar] [CrossRef] [Scilit] [PubMed]
- Grasso, C.S.; Tsoi, J.; Onyshchenko, M.; Abril-Rodriguez, G.; Ross-Macdonald, P.; Wind-Rotolo, M.; Champhekar, A.; Medina, E.; Torrejon, D.Y.; Shin, D.S.; et al. Conserved Interferon-gamma Signaling Drives Clinical Response to Immune Checkpoint Blockade Therapy in Melanoma. Cancer Cell 2020, 38, 500–515.e3. [Google Scholar] [CrossRef] [Scilit]
- Kamińska, P.; Buszka, K.; Zabel, M.; Nowicki, M.; Alix-Panabières, C.; Budna-Tukan, J. Liquid Biopsy in Melanoma: Significance in Diagnostics, Prediction and Treatment Monitoring. Int. J. Mol. Sci. 2021, 22, 9714. [Google Scholar] [CrossRef] [Scilit]
- Gopalakrishnan, V.; Spencer, C.N.; Nezi, L.; Reuben, A.; Andrews, M.C.; Karpinets, T.V.; Prieto, P.A.; Vicente, D.; Hoffman, K.; Wei, S.C.; et al. Gut microbiome modulates response to anti–PD-1 immunotherapy in melanoma patients. Science 2018, 359, 97–103. [Google Scholar] [CrossRef] [Scilit]

Publisher’s Note: MDPI stays neutral with regard to jurisdictional claims in published maps and institutional affiliations. |
© 2022 by the authors. Licensee MDPI, Basel, Switzerland. This article is an open access article distributed under the terms and conditions of the Creative Commons Attribution (CC BY) license (https://creativecommons.org/licenses/by/4.0/).