


Abstract
Ultrasound-enhanced sedimentation offers a robust strategy for microparticle separation in microfluidics. Triangular cross-sectional channels have recently emerged as a promising architecture because the acoustic radiation force and acoustic streaming-induced drag act synergistically toward the channel base—a force-field configuration unattainable in conventional rectangular or circular channels. However, quantitative relationships between operational parameters and continuous-flow sedimentation remain unexplored. Here, we systematically investigate how five parameters—volumetric flow rate, number of active transducers, active transducer length, driving voltage, and particle diameter—affect sedimentation efficiency in a triangular glass capillary. The number of active transducers is the most influential: dual-transducer operation sustains an outlet sedimentation efficiency—defined as the fractional particle removal relative to the inlet concentration—of ~77% sedimentation at 30 μL/min versus <30% for a single transducer. Flow rate shows a threshold near 27 μL/min for the baseline configuration, and increasing transducer length from 10 to 40 mm raises the measured maximum allowable flow rate from 15 to ~50 μL/min. A minimum of 19 Vpp is required for ≥80% efficiency. Ultrasound provides the greatest benefit for 5 μm particles (from <40% by gravity to >90%), while 20 μm particles gain less. A normalized sensitivity analysis offers design guidance for acoustofluidic sedimentation platforms. These findings establish quantitative design rules and confirm the feasibility of triangular-channel architectures.
1. Introduction
Sedimentation—the process by which suspended particles settle through a fluid under an applied force—is a fundamental unit operation in biological sample processing, environmental water treatment, chemical engineering, and industrial manufacturing [1,2,3]. For micrometer-scale particles with near-neutral buoyancy, gravitational sedimentation is inherently slow. A 10 μm polystyrene particle (density ≈ 1050 kg/m3) in water has a terminal settling velocity of only ~2–4 μm/s, as predicted by Stokes’ law [4], requiring roughly 7 min to traverse a vertical distance of 1 mm. This kinetic limitation has driven the development of active enhancement strategies, with centrifugal and ultrasonic actuation being the most widely adopted [5,6].
Acoustofluidics—the synergistic integration of ultrasound and microfluidics—has emerged as a versatile platform for label-free, biocompatible, and spatially precise particle manipulation [7,8,9]. Established techniques include patterning [10,11], focusing [12,13,14], sorting [15], trapping [16,17,18], shaking [19], routing [20], gripping [21], pumping [22], mixing [23,24], translation [25,26], separation [27,28], rotation [29,30,31], and settling [32]. Within ultrasonic resonant fields, suspended particles experience two dominant acoustic forces: the acoustic radiation force (ARF), arising from scattering of the incident wave [33,34,35], and the drag force induced by acoustic streaming (AS)—a steady, vortical fluid flow generated by viscous dissipation of acoustic energy [36,37,38]. The ARF scales with particle volume and primarily governs the motion of larger microparticles; the AS-induced drag scales linearly with particle diameter, imposing a lower size limit for acoustophoretic manipulation—the critical particle diameter [39]. To extend manipulation to smaller particles, AS is commonly mitigated by geometric strategies such as curved channel walls [40,41] or optimized resonant mode configurations [42].
Conventional ultrasound-enhanced sedimentation relies on a two-step mechanism: first, acoustic trapping of particles into aggregates at pressure nodal planes; second, gravity-driven settling of these enlarged clusters after ultrasound cessation or when gravitational forces overcome hydrodynamic drag [43,44,45]. This intermittent, two-step operation imposes inherent throughput limitations: particles must be trapped for a sufficient duration before settling, and the cyclic nature of the process complicates continuous-flow integration. Moreover, in conventional rectangular channels under a (1, 0) standing-wave mode, the ARF vanishes identically across the entire pressure nodal plane, leaving AS as the sole lateral transport mechanism—which in square channels drives particles toward the side walls rather than the bottom, and in circular channels focuses particles toward the channel center, in both cases opposing or failing to assist gravitational settling [46,47,48].
Recent work by our group has demonstrated that an equilateral triangular cross-section fundamentally alters this force landscape [32,49]. Under a (1, 0) mode, the triangular geometry produces an asymmetric acoustic pressure field in which the ARF and the AS-induced drag act synergistically toward the channel base (bottom wall). This configuration enables direct, continuous acoustophoretic settling without the need for intermittent aggregation–settling cycles. However, the proof-of-concept demonstration was limited to a single device configuration and a single particle size under quasi-static conditions [32]. The quantitative relationships between operational parameters—flow rate, transducer configuration, driving voltage, and particle size—and continuous-flow sedimentation performance remain entirely unexplored. Without such systematic characterization, rational design of triangular-channel acoustofluidic separators is not possible.
The present work addresses this gap. We quantitatively assess the influence of five key parameters—volumetric flow rate, number of active transducers, active transducer length, peak-to-peak driving voltage, and particle diameter—on sedimentation efficiency in an equilateral triangular microchannel. A custom-designed leveling clamp improves mounting reproducibility. Results are consolidated into an empirical parameter ranking, yielding actionable design guidelines. Collectively, this study establishes a quantitative link between fundamental acoustofluidic physics and practical engineering implementation, offering benchmark performance metrics to inform next-generation device development.
The manuscript is structured as follows: Section 2 details materials, device fabrication, experimental setup, and measurement methodology; Section 3 presents and discusses the mechanistic basis of triangular-channel sedimentation, the three-dimensional (3D) particle-laden fluid mechanics, and systematic parametric results; and Section 4 summarizes the principal findings and their implications.
2. Materials and Methods
2.1. Device Fabrication and Experimental Setup
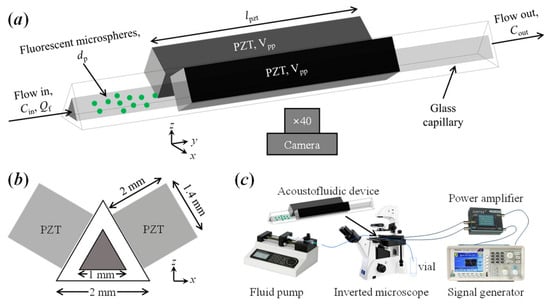
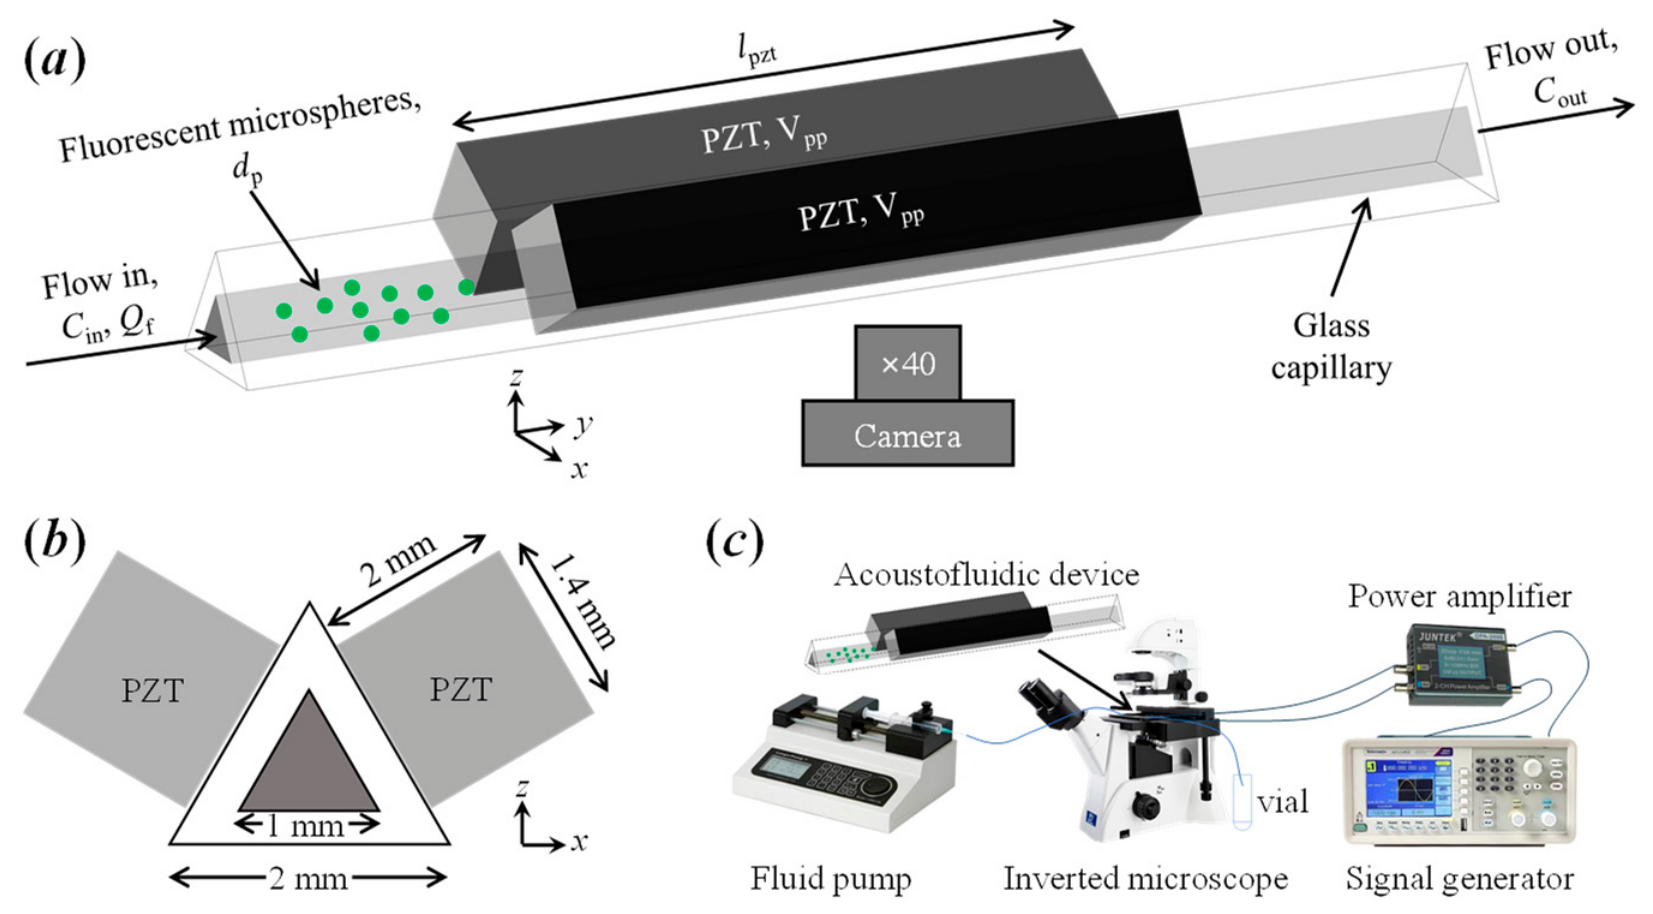
The acoustofluidic device (Figure 1a,b) comprises an equilateral triangular glass capillary (quartz, ZCQ) with inner and outer side lengths of 1 mm and 2 mm, respectively, and piezoelectric transducers (PZTs, Pz5, COSSON) bonded to two outer lateral surfaces. Two identical PZTs are affixed symmetrically using AB epoxy adhesive. Unless otherwise stated, each PZT measures 20 mm × 1.4 mm × 2 mm (length along the channel, width, thickness) and exhibits a thickness-mode resonant frequency of approximately 1 MHz. Each 1.4 mm wide PZT is centered on the 1 mm inner side of the triangular channel; the transducer therefore covers the full fluid width and overlaps the adjacent glass walls symmetrically (see Figure 1b). Electrical connections are made via enameled copper wires soldered directly to the transducer electrodes.
Figure 1.
(a) Schematic of the acoustofluidic device: equilateral triangular glass capillary with two PZTs bonded symmetrically to opposing side surfaces. (b) Cross-sectional view of the capillary geometry and transducer alignment. (c) Experimental setup. The influence of five critical operational parameters—volume flow rate (Qf), particle diameter (dp), transducer active length (lpzt), peak-to-peak driving voltage (Vpp), and number of activated transducers (npzt)—on the sedimentation efficiency is systematically evaluated. Sedimentation efficiency is quantified as the outlet particle concentration (Cout) relative to the inlet concentration (Cin).
The experimental system (Figure 1c) integrates six core components: (1) a function generator (AFG1062, Tektronix) providing sinusoidal excitation; (2) a dual-channel power amplifier (DPA2698, JUNTEK) for signal amplification; (3) the acoustofluidic device mounted on a custom-designed leveling clamp (see Appendix C); (4) a syringe pump (LSP02-2A, LongerPump) for precise volumetric flow control; (5) a fluorescence microscope (XSP-63XDV, SHUANG GUANG) for real-time visualization of particle dynamics; and (6) a collection vial positioned at the channel outlet for effluent sampling. The driving waveform is monitored in situ with an oscilloscope (TBS1102B, Tektronix).
Monodisperse fluorescent polystyrene microspheres (Fluoresbrite, Polysciences) with nominal diameters (dp) of 5 μm, 10 μm, and 20 μm (size coefficient of variation < 15%) are suspended in deionized water at a mass concentration of 0.125 mg/mL—obtained by 80-fold dilution of the commercial stock solution (10 mg/mL). The suspension is introduced into the capillary through PTFE tubing (inner diameter: 1 mm), connected with heat-shrink tubing to ensure leak-free coupling.
2.2. Particle Sedimentation Efficiency Quantification
Sedimentation efficiency (η) is defined as the fractional removal of particles: η = (1 − Cout/Cin) × 100%, where Cin and Cout are the number concentrations at the inlet and outlet, respectively. Effluent samples are collected at the channel exit and analyzed by fluorescence microscopy.
A fixed volume (Vsample) of effluent is deposited onto a clean glass slide and sealed under a standard coverslip, forming a uniform planar layer of thickness h = Vsample/Acoverslip. The effective viewing area per microscopic field (Aview) is calculated from the objective magnification and field number. Twenty non-overlapping fields of view are randomly selected; the number of fluorescent particles in each is counted manually using ImageJ, and the mean count per field () is determined. The number concentration is then Cout = /(Aview × h). Mass concentration can be derived from the calibrated particle size–mass relationship. All measurements are performed in triplicate; data points in figures represent the mean, and error bars denote ± one standard deviation unless stated otherwise.
To distinguish sedimentation from temporary acoustic trapping or particle retention on the channel walls, side-view fluorescence microscopy was used to identify where removed particles accumulate. Particles were observed to form a sediment layer along the bottom wall within the acoustic-field region, while the side walls remained largely clear. As an additional control, after a steady-state sample was collected, the ultrasound was switched off while flow continued and a second outlet sample was collected; no significant increase in Cout was observed (efficiency changed by less than 5 percentage points), indicating that the removed particles were not temporarily held on the walls. Flushing between trials also produced no large pulse of retained particles.
2.3. Experimental Parameters and Procedure
Single-factor parametric experiments were conducted around a baseline operating condition: particle mass concentration Cm = 0.125 mg/mL; number of active PZTs npzt = 2; PZT dimensions 20 mm × 1.4 mm × 2 mm; peak-to-peak driving voltage Vpp = 25 V; particle diameter dp = 5 μm; and volumetric flow rate Qf varied from 5 to 30 μL/min in 5 μL/min increments. For the active transducer length study, PZTs of different lengths (10, 20, 30, and 40 mm) but identical width and thickness were used.
For each trial, the syringe pump delivers the particle suspension at the designated flow rate. Ultrasound actuation is initiated once the suspension front reaches the upstream boundary of the acoustic-field region. Real-time particle aggregation and sedimentation dynamics are recorded via fluorescence microscopy. Because the PZT is centered on the 50 mm capillary, the suspension must traverse the remaining downstream distance from the upstream boundary of the acoustic field to the outlet—25 mm plus half the active PZT length—before acoustically processed suspension reaches the outlet. Sampling was therefore initiated only after this downstream transit delay, plus any outlet-tubing delay. For the baseline 20 mm PZT, this distance is 35 mm, corresponding to approximately 180 s at 5 μL/min and approximately 30 s at 30 μL/min. For the 10, 20, 30, and 40 mm PZTs used in Section 3.2.3, the corresponding distances are approximately 30, 35, 40, and 45 mm, and the delay was adjusted accordingly. After this initial delay, the outlet concentration was monitored over time. Steady state was confirmed when three consecutive 5 s outlet fractions varied by less than 5%. Between consecutive trials, the capillary is thoroughly flushed with deionized water to eliminate residual particles and ensure experimental independence.
3. Results and Discussion
3.1. Mechanistic Basis of Triangular-Channel Acoustophoretic Sedimentation
To illustrate the physical mechanism underlying the experimental results, a 3D reduced-fluid numerical model was constructed in COMSOL(version 6.2). The model solves, in sequence, the pressure acoustics, laminar flow, and particle-tracing problems; the governing equations and boundary conditions are provided in Appendix A. It should be emphasized that this numerical treatment serves as a qualitative mechanistic illustration—not a quantitative predictive model—and is intended solely to visualize the force-field configuration that distinguishes triangular channels from conventional geometries. Quantitative validation against experimental data is beyond the scope of the present work.
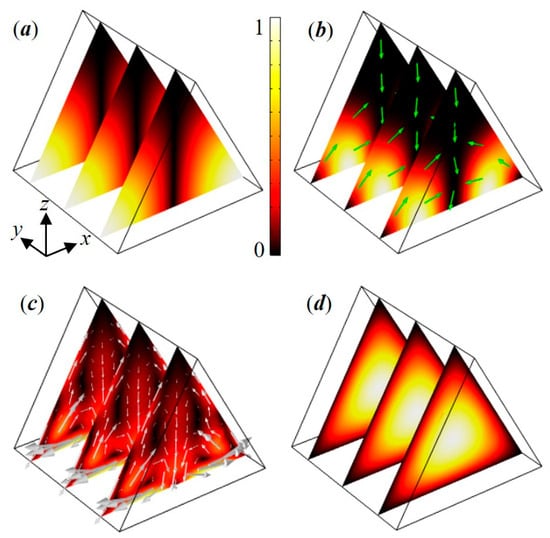
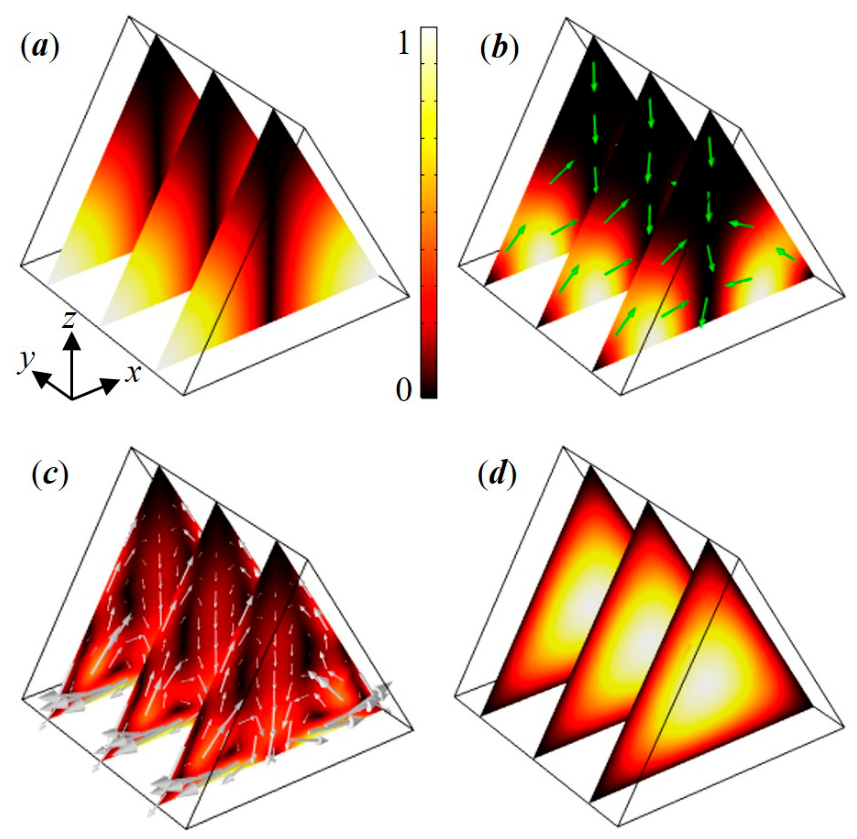
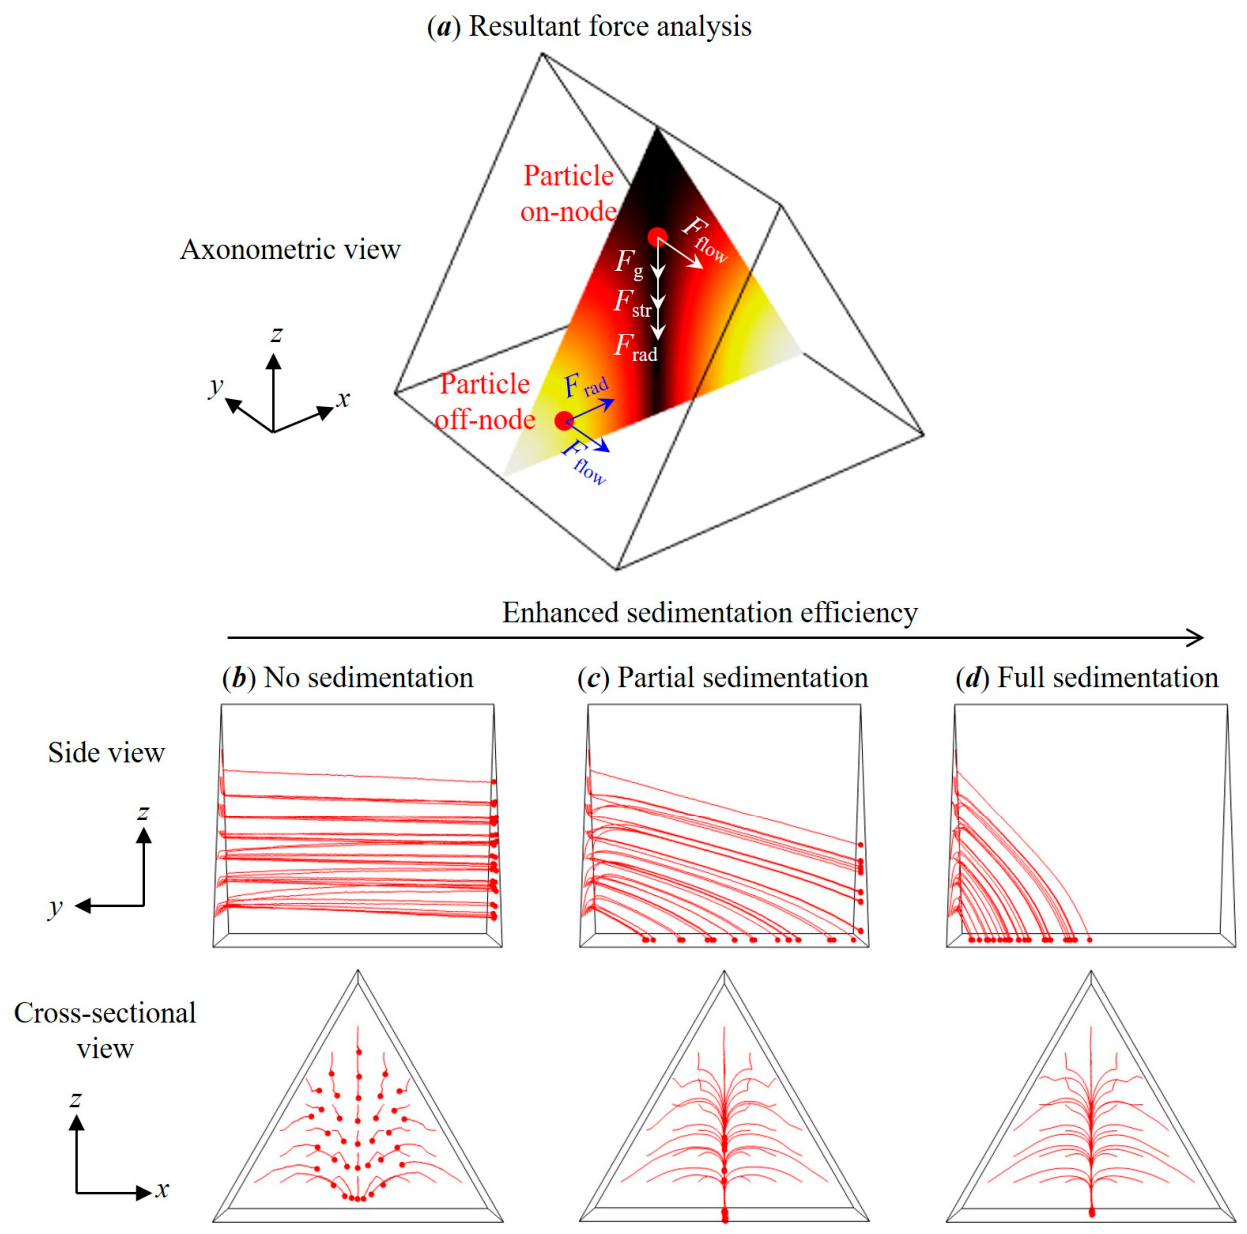
A (1, 0) mode with a single pressure node along the z-axis is generated in the cross-section of the equilateral fluid channel (Figure 2a). The resulting cross-sectional ARF (Figure 2b) tends to focus off-node particles to the nodal plane and moves on-node particles to the channel bottom wall (see also Figure 3a). The acoustic streaming consists primarily of two symmetric vortices in the cross-section; on the pressure nodal plane, the acoustic streaming velocity is directed unidirectionally toward the bottom wall. The inertial flow velocity in the y-direction is maximum at the channel axis and gradually decreases to zero at the channel boundary (Figure 2d), as expected for a fully developed laminar flow with no-slip walls. The key distinction from conventional geometries is that in the triangular channel, both the ARF and the AS-induced drag have a net downward component along the pressure nodal plane, acting cooperatively with gravity. In square channels, by contrast, the ARF vanishes on the nodal plane and AS transports particles laterally toward the side walls; in circular channels, the ARF is directed inward toward the channel center. Neither configuration produces the unidirectional downward force-field alignment that arises naturally in the triangular geometry.
Figure 2.
Modeled distributions of various fields in the 3D equilateral triangular channel of the acoustofluidic device. (a) Acoustic pressure. (b) ARF, where arrows represent the force vector field (normalized). (c) AS with arrows denoting the velocity vector field. (d) Inertial flow. The background color maps indicate the normalized magnitudes (scale bar provided). These results are intended as a qualitative mechanistic illustration; quantitative validation is provided in Appendix B through cross-geometry comparison.
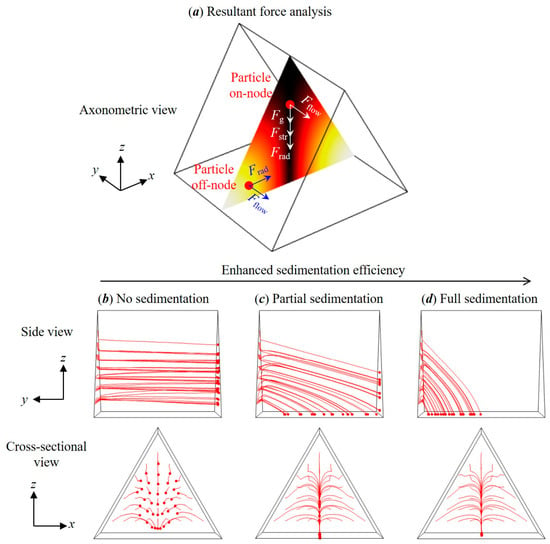
Figure 3.
(a) Schematic of the primary forces on a particle whose position is either off the pressure node or on the node. Frad, Fstr, Fflow, and Fg denote ARF, AS drag, inertial flow drag, and gravity, respectively. (b–d) Demonstration of the enhanced sedimentation of 5 μm polystyrene particles (red circles) with progressively stronger acoustic excitation (e.g., increasing vibration amplitude) at a fixed flow rate, transitioning from no sedimentation to full sedimentation as acoustophoretic forces dominate. These panels are mechanistic illustrations based on the reduced-fluid model; they are not direct simulations of the experimental conditions.
A schematic of the primary forces on an off-node or on-node microparticle is illustrated in Figure 3a. Under the action of these forces, it is intrinsically possible to enhance the sedimentation efficiency as the influence of the acoustofluidic fields increases relative to the continuous flow. Figure 3b–d demonstrates this transition at a fixed flow rate, showing particle trajectories for progressively stronger acoustic excitation (e.g., obtained by increasing the boundary vibrations). These mechanistic results provide the conceptual basis for the single-factor experimental investigations in the following subsections.
3.2. Experimental Parametric Investigation
3.2.1. Influence of Volumetric Flow Rate
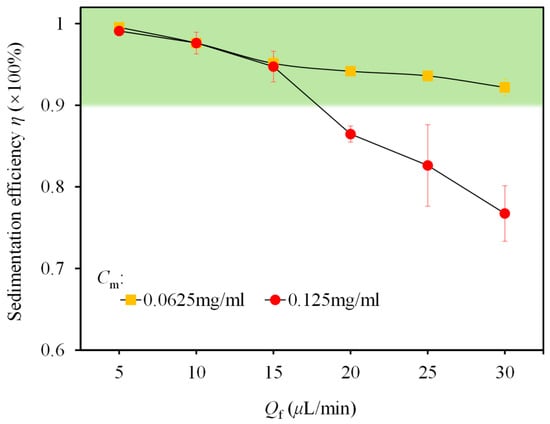
Volumetric flow rate governs particle residence time within the acoustic field and thus directly determines sedimentation efficiency. As shown in Figure 4, sedimentation efficiency exhibits a systematic inverse relationship with flow rate under baseline conditions. At 5 μL/min, efficiency exceeds 98%.
Figure 4.
Sedimentation efficiency versus volumetric flow rate (Qf) under baseline operating conditions. Cm denotes particle mass concentration. The shaded region indicates the operational window (η ≥ 90%).
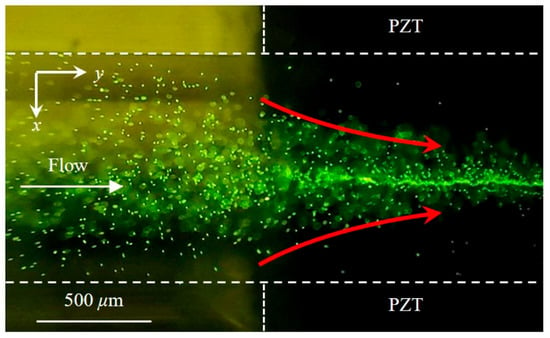
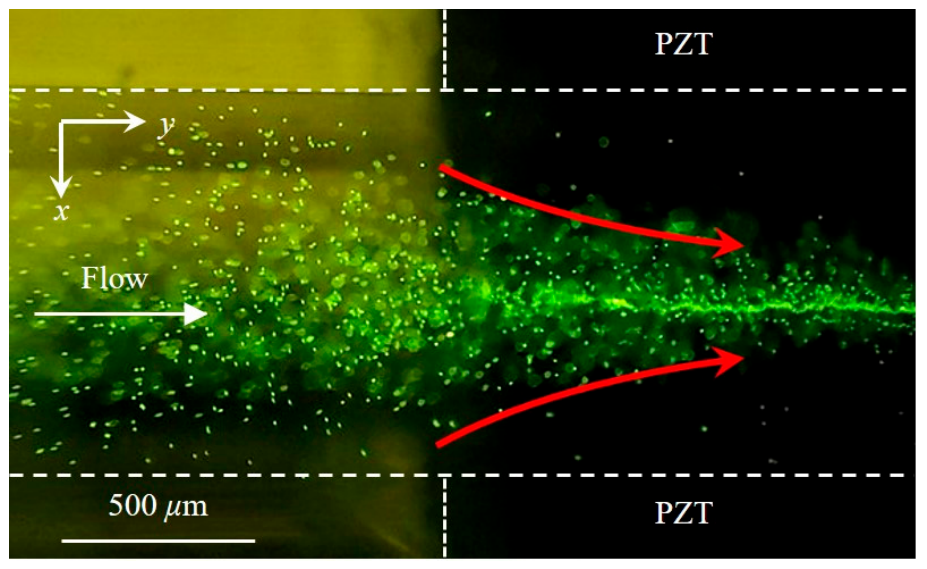
Microscopic imaging reveals rapid lateral migration of particles toward the channel centerline upon entering the acoustic field, forming a well-defined “arrowhead”-shaped concentration profile (Figure 5). Concurrently, out-of-focus particles progressively attain sharp focus as they settle toward the bottom wall—direct visual evidence of continuous sedimentation along the channel length. The cross-sectional distributions of ARF and AS governing microparticle focusing and sedimentation in the equilateral triangular channel can be found from Figure 2b,c or Figure A2c.
Figure 5.
Fluorescence microscopy image of acoustic-field-induced particle aggregation at the acoustic-field inlet region, showing the characteristic “arrowhead” pattern aligned with the pressure nodal plane.
As flow rate increases, efficiency declines gradually but remains above 90% up to 15 μL/min. At 25 μL/min, it decreases to ~83%, stabilizing at ~77% at 30 μL/min. The rate of decline accelerates beyond 15 μL/min, indicating a critical flow rate threshold. Below this threshold, particle residence time is sufficient for complete acoustic capture and settling; above it, an increasing fraction of particles exits the acoustic field before full sedimentation. For the baseline configuration, the maximum allowable flow rate (defined herein as the highest flow rate sustaining ≥80% sedimentation efficiency) is approximately 27 μL/min.
This threshold behavior can be understood through a competition between the characteristic acoustic sedimentation time and the convective transit time. The sedimentation velocity, governed by the balance of ARF, AS drag, and gravity, is approximately constant under fixed acoustic pressure. The convective velocity, by contrast, scales linearly with flow rate. The critical flow rate corresponds to the condition where the hydraulic residence time equals the characteristic sedimentation time. Defining a sedimentation Péclet number, Pes = VsedLac/(UconvLc), where Uconv is the mean flow velocity, Lac is the acoustic-field length, Vsed is the characteristic sedimentation velocity, and Lc is the characteristic transverse migration distance. The threshold corresponds to Pes ≈ 1, which gives Uconv,max ≈ VsedLac/Lc; the maximum sustainable flow rate therefore increases with acoustic-field length. This dimensionless framework rationalizes why the threshold scales with transducer length (Section 3.2.3) and why lower particle concentrations exhibit higher thresholds (reduced inter-particle interference diminishes acoustic attenuation and maintains a higher effective Vsed).
Figure 4 also shows that at a reduced particle concentration (0.0625 mg/mL) sedimentation efficiency remains above 90% across the entire tested flow range (5–30 μL/min). This illustrates the beneficial effect of lower particle loading on acoustic manipulation, likely attributable to reduced inter-particle interference and diminished attenuation of the acoustic field.
3.2.2. Influence of Transducer Configuration
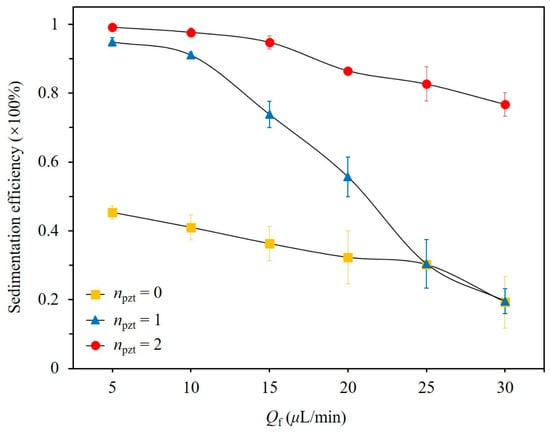
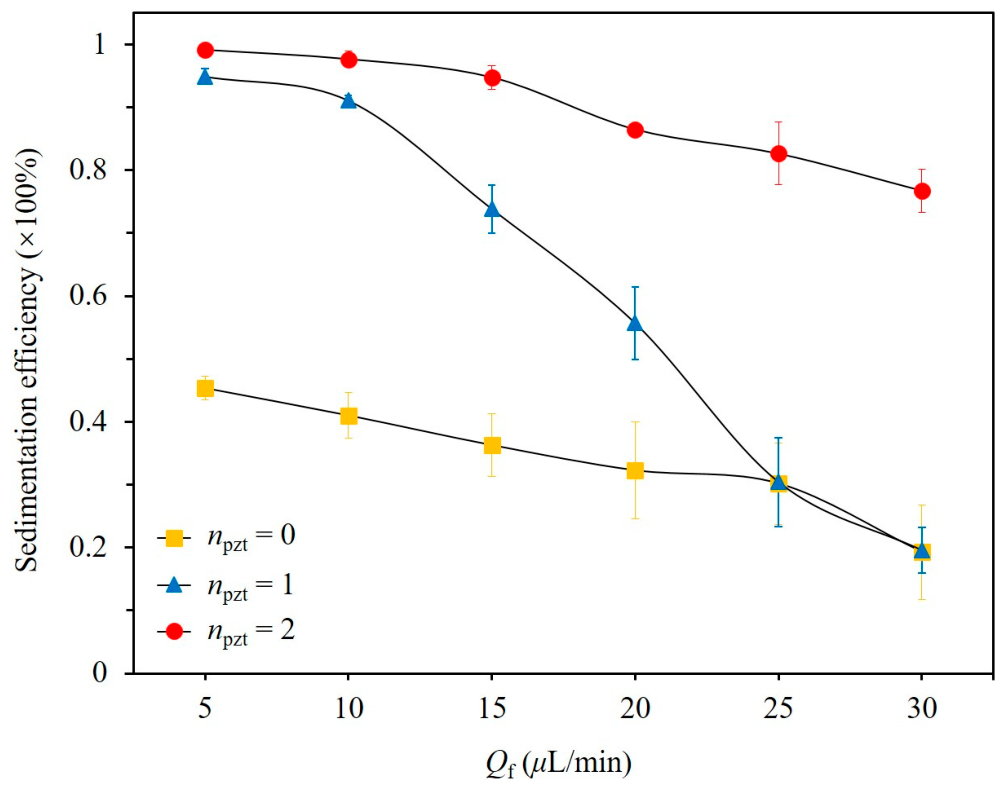
The number of active transducers significantly influences performance (Figure 6). In the dual-transducer configuration, two PZTs generate a reinforced standing-wave field via constructive interference, yielding higher acoustic pressure. In the single-transducer configuration, only one PZT is active, and the acoustic field is established by reflection from the opposite walls. The efficiency gap between dual and single excitation—more than a factor of two at high flow rates—quantifies the acoustic pressure amplification achieved by symmetric dual-transducer operation. This amplification directly increases the ARF (which scales with the square of the acoustic pressure) and the AS velocity (which scales with the square of the acoustic pressure in the boundary layer), thereby enhancing both the focusing and the downward transport of particles.
Figure 6.
Sedimentation efficiency versus volume flow rate (Qf) for three transducer activation configurations: dual-transducer (npzt = 2), single-transducer (npzt = 1), and no ultrasound (npzt = 0). All other parameters are at baseline values.
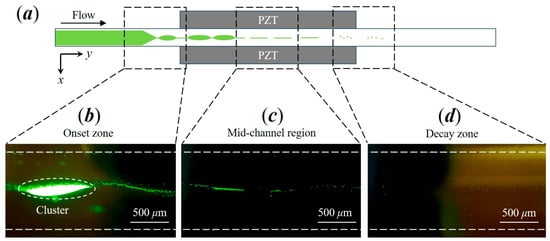
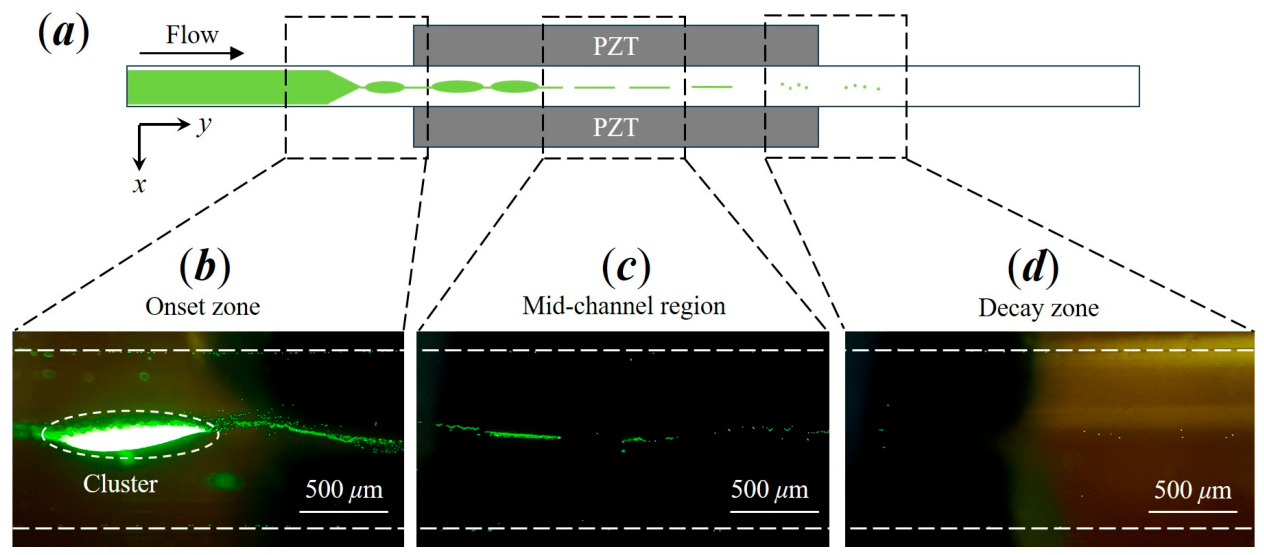
The spatiotemporal evolution of particle agglomeration is visualized in Figure 7. In the dual-transducer configuration, dense particle clusters form at the acoustic-field inlet at low flow rates (Figure 7b). These bright aggregates arise from localized particle accumulation. Along the flow direction, cluster density diminishes, and few suspended particles remain at the channel outlet—indicating efficient upstream capture, followed by sustained sedimentation.
Figure 7.
Spatiotemporal evolution of particle agglomeration within the microchannel: (a) schematic depicting preferential cluster formation zones along the fluid channel and (b–d) representative microscopy images acquired at the acoustic-field inlet (“Onset zone”), mid-channel region, and acoustic-field outlet (“Decay zone”), respectively.
3.2.3. Influence of Active Transducer Length
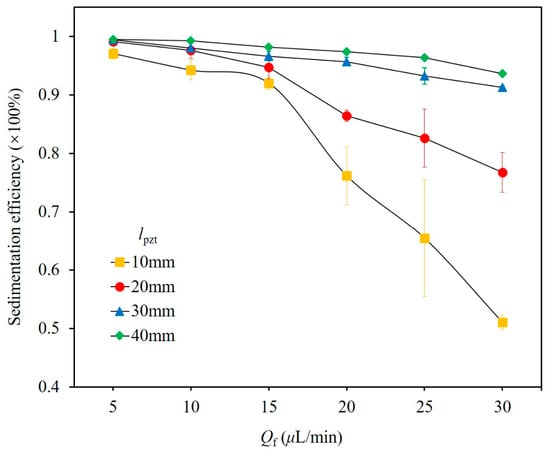
Active transducer length determines the axial extent of the acoustic field and thus the duration of acoustic exposure. Four lengths were evaluated—10, 20, 30, and 40 mm—with all other parameters at baseline values.
Sedimentation efficiency increases monotonically with transducer length (Figure 8), reflecting the extended acoustic interaction time. For 30 mm and 40 mm transducers, efficiency exceeds 90% at all tested flow rates up to 30 μL/min. To determine the maximum allowable flow rates directly, the measurements for these two transducers were extended to flow rates up to 60 μL/min. Here Qmax is defined as the highest flow rate sustaining η ≥ 80%, determined from measurements in 5 μL/min increments with linear interpolation between the bracketing flow rates; at the next higher tested flow rate, η fell below 80% in both cases. The measured values are Qmax ≈ 45 μL/min for the 30 mm transducer and Qmax ≈ 50 μL/min for the 40 mm transducer (see Figure S1 in the Supplementary Material). Because these values are measured directly, no fitting or extrapolation procedure is used. The increase in Qmax with Lac is qualitatively consistent with the increased residence time captured by the corrected sedimentation Péclet number framework introduced in Section 3.2.1.
Figure 8.
Sedimentation efficiency versus volumetric flow rate (Qf) for four active transducer lengths (lpzt). All other parameters are at baseline levels.
3.2.4. Influence of Particle Size
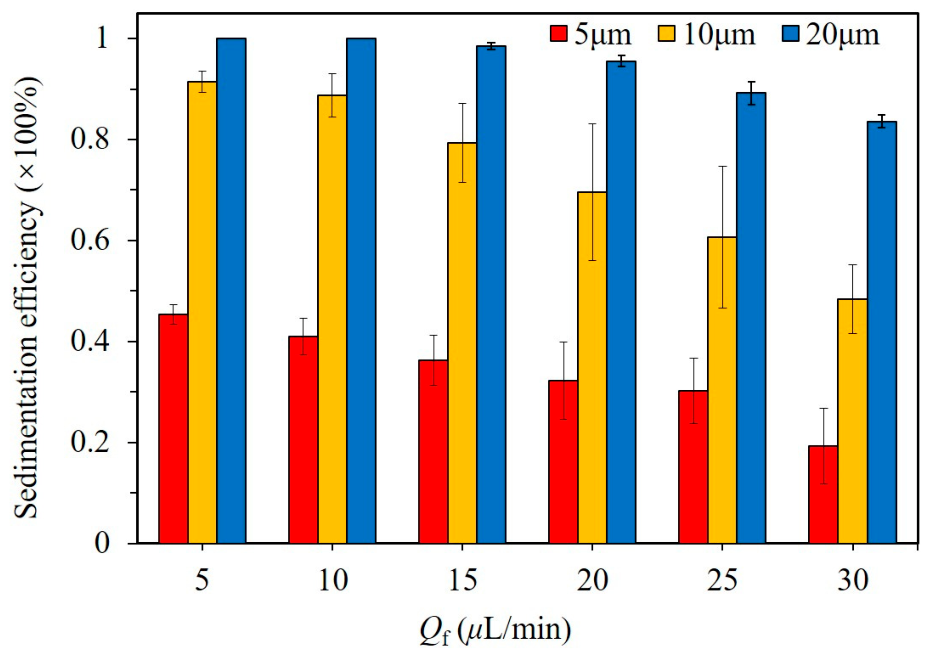
Particle size governs the magnitude of both the ARF and gravitational force (both ∝ ) as well as the AS drag force (∝ dp). Under gravity-only operation (Figure 9), 20 μm particles exhibit >80% efficiency up to 30 μL/min, whereas 5 μm particles remain below 50% even at 5 μL/min, in agreement with Stokes’ law [50].
Figure 9.
Gravity-driven sedimentation efficiency versus volumetric flow rate (Qf) for 5, 10, and 20 μm polystyrene particles (no ultrasound).
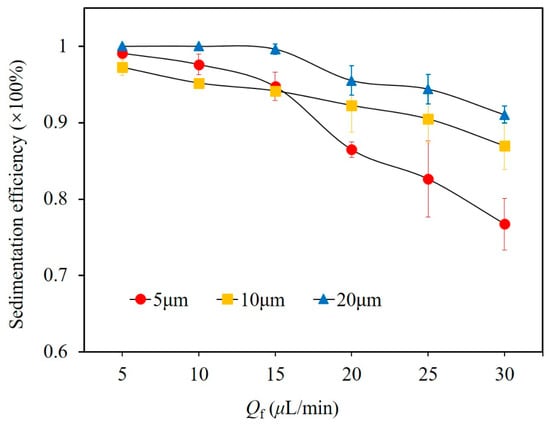
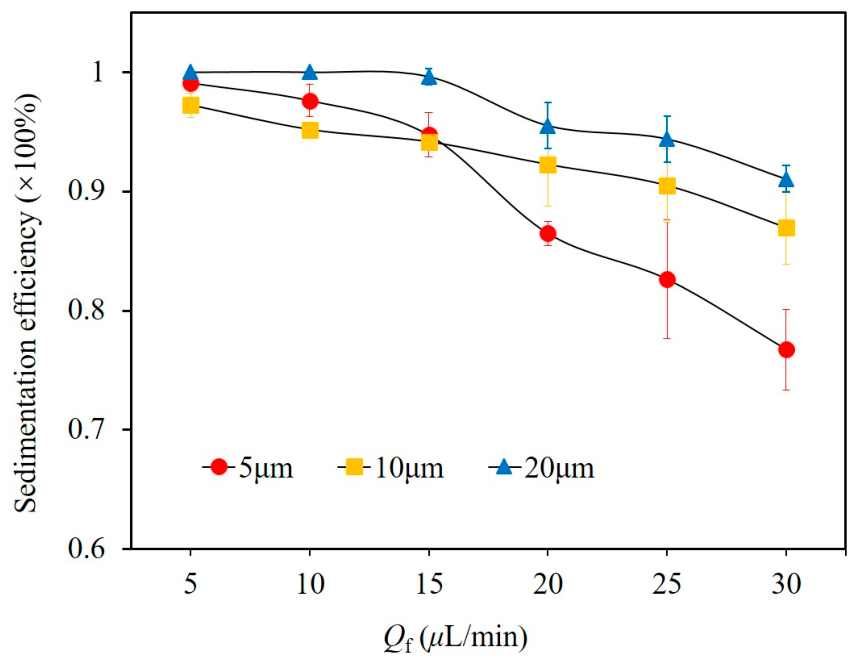
With ultrasound (Figure 10), all sizes achieve >95% efficiency at low flow rates (5–15 μL/min). At higher flow rates, divergence appears: 5 μm particles drop to ~85% at 20 μL/min, while 10 and 20 μm particles remain >90%. At 30 μL/min, the measured efficiencies are η = 77 ± 3% for 5 μm particles, 87 ± 3% for 10 μm particles, and 91 ± 1% for 20 μm particles.
Figure 10.
Ultrasound-enhanced sedimentation efficiency versus volumetric flow rate (Qf) for three particle sizes under baseline conditions.
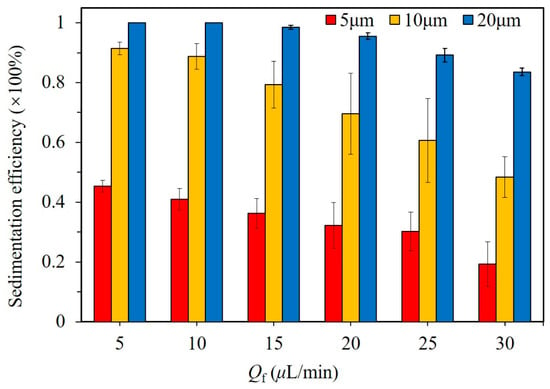
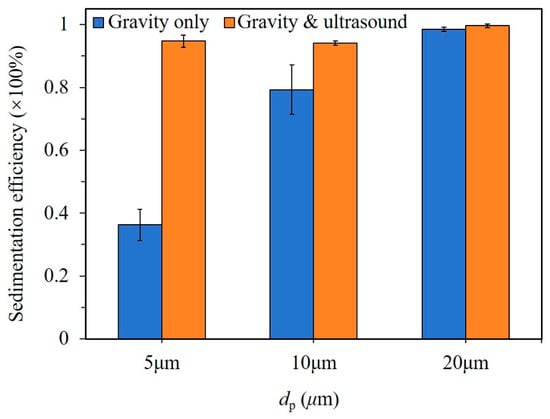
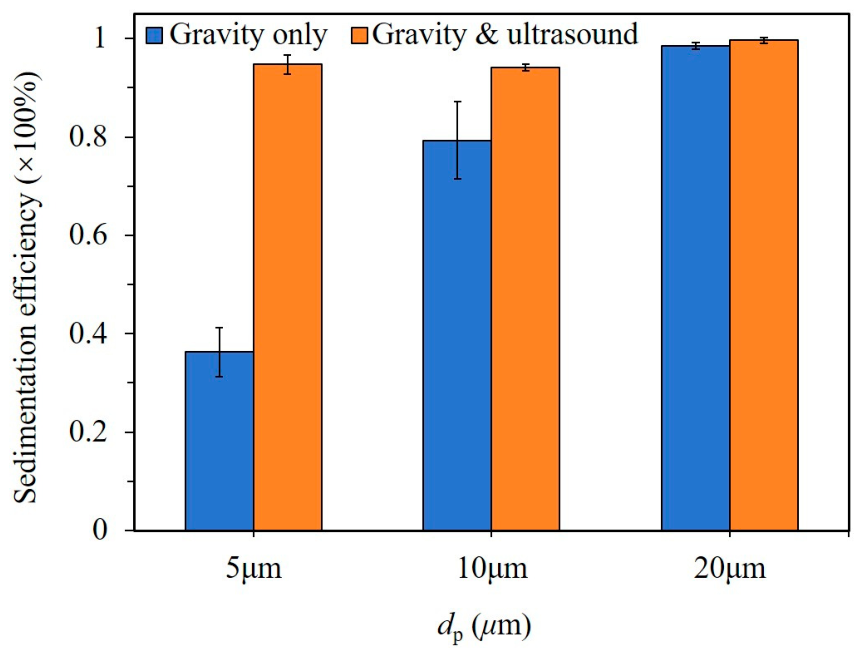
Figure 11 presents the size-dependent enhancement at a flow rate of 15 µL/min: ultrasound improves 5 µm particle efficiency by >50 percentage points (from <40% to >90%), but only ~5 points for 20 µm particles. Thus, the device delivers maximal advantage for fine particles where gravity alone is ineffective. This size-dependent amplification reflects the transition between two regimes: for large particles (dp ≳ 10 μm), gravitational sedimentation is already efficient, and the acoustic contribution is incremental; for small particles (dp ≲ 5 μm), gravitational settling is negligible, and the acoustic forces—particularly the downward-directed ARF and AS drag unique to the triangular geometry—become the dominant transport mechanism.
Figure 11.
Comparison of gravity-only and ultrasound-enhanced sedimentation efficiency at 15 μL/min, illustrating the particle-size-dependent amplification effect.
3.2.5. Influence of Driving Voltage
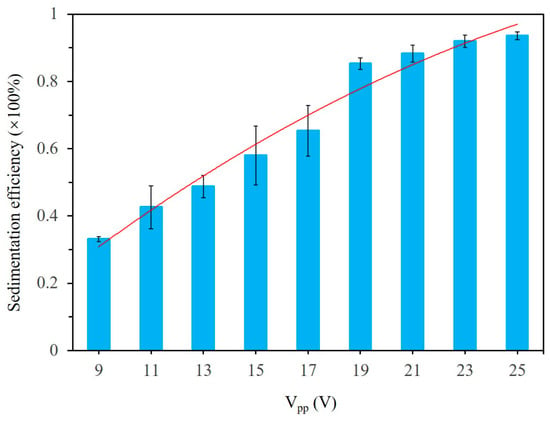
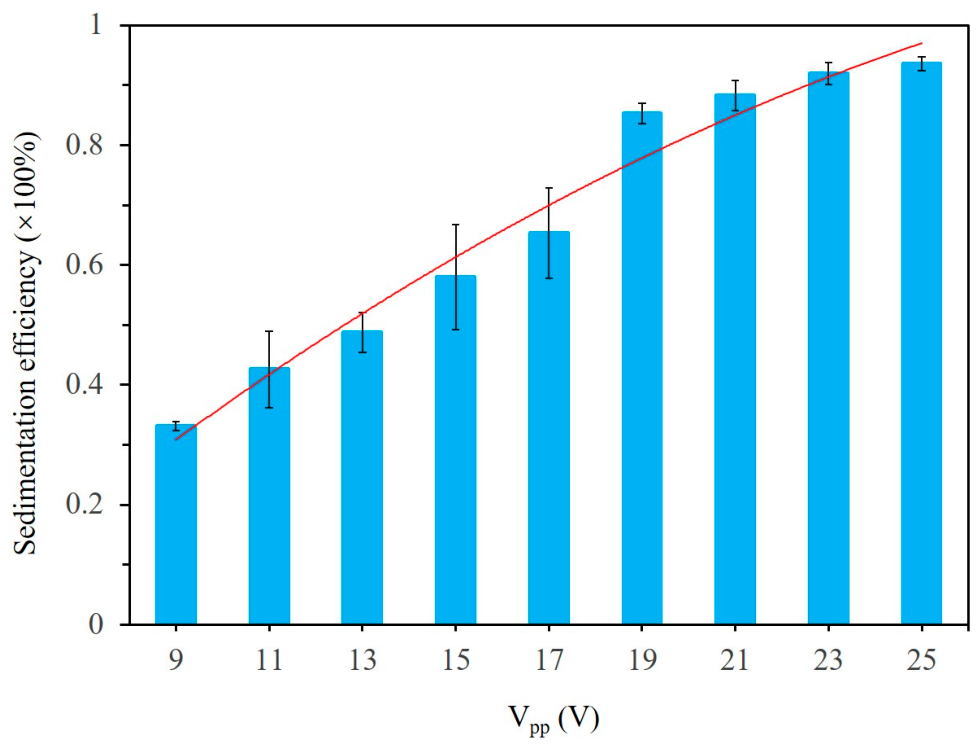
Driving voltage directly sets the acoustic pressure amplitude and, consequently, the magnitude of acoustic radiation and streaming forces. Figure 12 shows the sedimentation efficiency versus Vpp for 5 μm particles at 15 μL/min.
Figure 12.
Sedimentation efficiency versus peak-to-peak driving voltage (Vpp) for 5 μm particles at Qf = 15 μL/min. All other parameters are at baseline settings.
At the baseline 25 Vpp, efficiency exceeds 90%. Reducing to 19 Vpp yields ~85%, but below 19 Vpp efficiency falls sharply—~60% at 15 Vpp and ~30% at 9 Vpp—indicating a threshold near 19 Vpp. This threshold can be understood through the competition between transverse acoustophoretic migration and axial residence time. In the triangular channel, the ARF focuses particles toward the pressure nodal plane, and the AS-induced drag has a downward component along that plane; both transverse acoustophoretic velocities scale approximately with for fixed particle diameter, density contrast, and acoustic mode. The relevant comparison is therefore between the transverse migration time τtrans ≈ Lc/Vac, where Vac is the characteristic transverse acoustophoretic velocity, and the axial residence time τres ≈ Lac/Uconv. The threshold occurs when τtrans ≈ τres, giving Vpp,th ∝ (UconvLc/Lac)1/2 ∝ Q1/2. Below this threshold, particles are advected out of the acoustic region before completing transverse migration to the bottom wall. This is not a direct opposition between axial drag and downward acoustic force; rather, the two act in orthogonal directions, and sedimentation requires sufficient transverse migration within the available residence time.
3.3. Normalized Sensitivity Analysis
To compare the influence of the five parameters on a consistent basis, we define a range-averaged normalized sensitivity
where Δη = ηmax − ηmin is the change in sedimentation efficiency (as a fraction) across the tested range of parameter p, ηref is the reference efficiency at the baseline condition (as a fraction), Δp = pmax − pmin is the tested parameter span, and pref is the reference parameter value used to normalize that span. For the categorical parameter npzt, we use pref = 2 (dual-transducer baseline) and Δp = 1 (single-to-dual change), so Δp/pref = 0.5.
Table 1 summarizes the calculation. Using the rounded values reported in this paper, the approximate range-averaged sensitivities are: Snpzt ≈ 1.22, SVpp ≈ 1.04, Slpzt ≈ 0.35, SQf ≈ 0.13, and Sdp ≈ 0.06.
Table 1.
Range-averaged normalized sensitivity Sp.
The number of active transducers therefore has the largest categorical effect, while driving voltage has a comparable normalized influence because of its strong nonlinear threshold; because these two values overlap within experimental uncertainty, we do not claim a strict ordering between them. Transducer length, flow rate, and particle diameter follow with lower range-averaged sensitivities. We emphasize that Sp is a range-averaged measure, not a local derivative, and that it does not capture parameter interactions.
Based on these sensitivities, we make the following separate, parameter-specific observations rather than asserting a strict empirical hierarchy:
npzt: Has the largest categorical effect at high flow rates; dual-transducer operation more than doubles efficiency under high-flow conditions, making it essential for performance-critical applications.
Vpp: Exhibits a strong nonlinear threshold (~19 Vpp); below this, performance degrades rapidly.
lpzt: Extends the acoustic interaction length and increases the measured maximum allowable flow rate, but with diminishing returns at longer transducer lengths.
Qf: Sets the axial residence time and thus the primary operational control variable, with a well-defined critical flow rate threshold that depends on other parameters.
dp: Determines whether gravity alone is sufficient; ultrasound enhancement is most impactful for sub-10 μm particles, precisely where gravitational settling fails.
Interactions between parameters—for example, the dependence of the flow-rate threshold on transducer length and particle size—are not captured by single-factor experiments and represent an important direction for future work.
4. Conclusions
This work has systematically quantified the influence of five operational parameters on continuous ultrasound-enhanced sedimentation in an equilateral triangular microchannel, yielding a normalized sensitivity analysis that translates fundamental acoustofluidic behavior into actionable design rules. The analysis shows that the number of active transducers has the largest categorical effect and that driving voltage has a comparable normalized influence due to its strong nonlinear threshold; because these two values overlap within experimental uncertainty, a strict ordering between them is not warranted. Transducer length, flow rate, and particle diameter follow with lower range-averaged sensitivities.
From a design perspective, three concrete guidelines emerge: (i) dual-transducer excitation is essential for high-throughput applications, as it more than doubles efficiency compared to a single transducer at elevated flow rates; (ii) the active transducer length can be used as a linear scaling tool to extend the maximum sustainable flow rate, with each additional 10 mm projected to raise the throughput ceiling by 5–15 µL/min; and (iii) a minimum actuation voltage (~19 Vpp for the transducers used here) must be maintained to avoid a precipitous drop in performance. Furthermore, the platform proves most advantageous for particles in the sub-10 µm range, where gravitational settling alone is ineffective and acoustic forces provide a >50 percentage-point gain in sedimentation efficiency.
The physical origin of these design rules lies in the unique force-field configuration of the equilateral triangular channel: the ARF and AS-induced drag both have a net downward component along the pressure nodal plane, acting synergistically with gravity. This contrasts with square channels (where AS drives particles toward side walls) and circular channels (where ARF focuses particles toward the center), and it enables direct, continuous acoustophoretic settling without the intermittent aggregation–settling cycles required in conventional rectangular-channel devices.
Supplementary Materials
The following supporting information can be downloaded at https://www.mdpi.com/article/10.3390/mi17111252/s1, Figure S1: Extended sedimentation-efficiency measurements for the 30-mm and 40-mm transducers at flow rates up to 60 μL/min. Conditions: 5 μm polystyrene particles, Cm = 0.125 mg/mL, npzt = 2, Vpp = 25 V. Data for Qf ≤ 30 μL/min overlap with Fig. 8 and are repeated here for continuity.
Author Contributions
Conceptualization, J.L. and G.H.; investigation, D.G. and G.H.; formal analysis, D.G., G.H., X.M., S.Z. and H.L.; resources, M.Y. and X.J.; writing—original draft, D.G. and G.H.; funding acquisition, supervision, project administration, writing—review and editing, J.L. All authors have read and agreed to the published version of the manuscript.
Funding
This research was funded by the Natural Science Foundation of Guangdong Province (grant number 2024A1515011673, 2025A1515030112, and 2021A1515010244) and the National Natural Science Foundation of China (grant number 11804060).
Institutional Review Board Statement
Not applicable.
Informed Consent Statement
Not applicable.
Data Availability Statement
The raw data supporting the conclusions of this article will be made available by the authors on request.
Conflicts of Interest
The authors have no competing interests to declare.
Appendix A. 3D Numerical Model
This appendix provides the governing equations and boundary conditions for the reduced-fluid model used in Section 3.1. The model is intended as a qualitative mechanistic illustration; quantitative validation against experimental data is beyond the scope of this work.
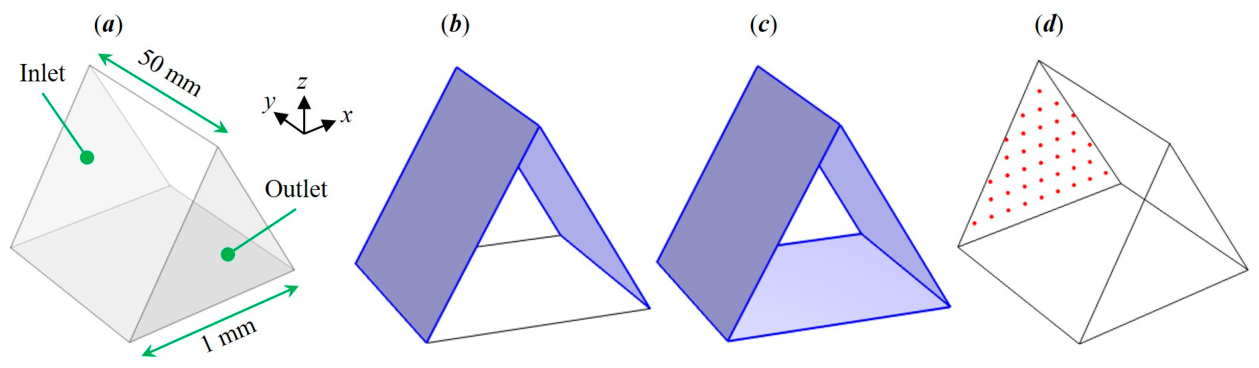
To illustrate the continuous-flow microparticle sedimentation process in the acoustofluidic device, a 3D reduced-fluid model (Figure A1a) was employed to numerically simulate acoustofluidic fields and the acoustophoretic motion of microparticles in the equilateral triangular channel using COMSOL. The governing equations for the acoustic pressure, ARF, AS, and acoustophoretic motion of suspended particles are described below. Specifically, the acoustic and streaming fields are solved using the perturbation method well-documented in the literature [51,52].
A “Pressure Acoustics, Frequency Domain” module was used to simulate the acoustic field. The acoustic resonance was generated by the excitation of both side boundaries (Figure A1b), with sound-hard conditions applied to the remaining boundaries. The acoustic pressure p1 and velocity u1 in the fluid layer were solved through
where ω denotes the angular frequency, ρf is the fluid density, and cf is the sound speed in fluid.
iρfωu1+∇p1 = 0,
A “Laminar Flow” module was employed to model the fluid flow field (u2). In addition to the inlet and outlet, two side walls and the bottom wall were set as a slip velocity boundary condition (Figure A1c), where the limiting velocities, determined from the acoustic velocity field, were applied to solve the AS in the bulk of the fluid through
where μf is the fluid dynamic viscosity.
∇∙u2 = 0,
∇p2 = μf∇2u2,
The limiting-velocity boundary condition is a standard reduced-order formulation for outer acoustic streaming [46,53]. It prescribes the slip velocity at the outer edge of the acoustic boundary layer and solves the bulk streaming field, while neglecting the detailed inner-streaming structure within the ~0.5 μm boundary layer. This approximation is appropriate here because the boundary-layer thickness is much smaller than the channel dimension (~1 mm) and because the particle trajectories of interest are dominated by outer streaming. Its limitations are that it cannot resolve inner streaming near the walls and may locally misestimate streaming near sharp corners.
A “Particle Tracing for Fluid Flow” module was used to simulate the acoustophoretic motion of microparticles. An array of 5 μm polystyrene particles was released at the inlet at time t = 0 (Figure A1d). The acoustophoretic motion of particles was determined by the action of the ARF (Frad) and the flow-induced drag force (Fd)
where mp represents the particle mass, U denotes the Gor’kov potential, and vp is the particle velocity.
Frad = −∇U,
Fd = 3πμfdp(u2 − vp),
Figure A1.
(a) The 3D reduced-fluid model. (b) Acoustics step, where acoustic resonances were generated from harmonic vibration of side boundaries (highlighted). (c) Laminar flow step, where outer streaming was solved from limiting velocities on side and bottom boundaries (highlighted). (d) Particle-tracing step, where microparticles (red circles) were released from the inlet.
Appendix B. Comparisons of Microparticle Acoustophoresis in Various Channels
To quantitatively evaluate the efficacy of triangular cross-sectional channels in enhancing microparticle sedimentation, we present a comparative analysis of acoustophoretic behavior across fluid channels with distinct geometries—specifically, square, circular, and equilateral triangular cross-sections. Figure A2 illustrates the lateral (cross-sectional) acoustophoresis of 5 μm polystyrene particles under the combined influence of the ARF and the AS-induced drag force. All configurations employ a (1, 0) standing acoustic wave mode—corresponding to a half-wavelength resonance—generated via harmonic boundary vibrations in reduced-fluid models. For AS, we focus on outer streaming [53] (or Rayleigh streaming [54]) and ignore the inner streaming [55] in the thin boundary layer (thickness of ~0.5 μm).
Figure A2.
Representative cross-sectional acoustofluidic fields and acoustophoretic particle trajectories in channels with square (a), circular (b), and equilateral triangular (c) cross-sections. The background color map indicates the normalized acoustic pressure magnitude (scale bar provided). Cyan arrows denote the spatial distribution of the ARF; magenta arrows indicate AS velocity field. Blue curves depict microparticle (red circles) trajectories.
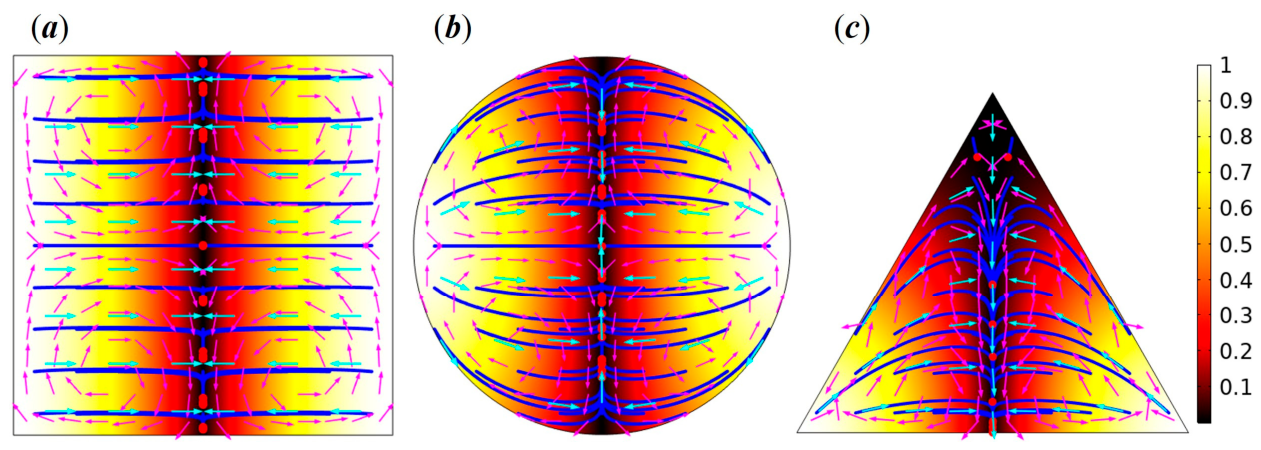
As shown, in all three geometries, microparticles are initially focused toward the pressure nodal plane by the primary ARF. However, their subsequent redistribution on this plane differs markedly due to geometry-dependent force-field characteristics: (1) In the square channel, the ARF vanishes identically across the entire pressure nodal plane under an ideal (1, 0) mode; consequently, AS-driven flow transports particles from the central region toward the side walls. (2) In the circular channel, although the AS field exhibits qualitative similarity to that in the square channel, the ARF exerts a net inward force—focusing particles from the periphery toward the channel center. (3) In the equilateral triangular channel, both the ARF and the AS-induced drag force act synergistically to drive particles toward the base (bottom) wall. This comparison establishes the fundamental physical advantage of the triangular geometry for sedimentation applications: it is the only configuration among the three in which the acoustic force field has a net downward component aligned with gravity.
Appendix C. Leveling Clamp Design
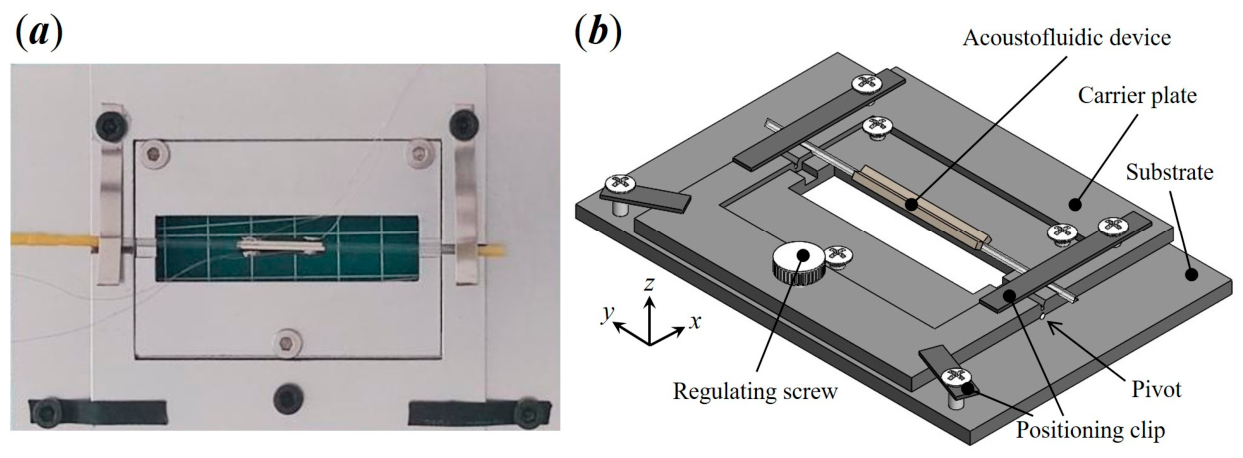
Accurate sedimentation quantification critically depends on precise horizontal alignment of the channel’s bottom surface. Even a sub-degree tilt induces lateral particle accumulation due to gravitational bias, compromising measurement fidelity. To mitigate this, we developed a custom leveling clamp that replaces the standard microscope stage plate (Figure A3).
The clamp incorporates an adjustable screw mechanism for fine rotational adjustment of the carrier plate about a cylindrical pivot axis, enabling precise leveling along the x-direction. Alignment is validated optically: when the bottom edge of the triangular channel appears equidistant from both side walls and they exhibit equal sharpness and contrast, the channel is deemed level. Positioning clips with heat-shrink tubing allow rapid, non-destructive mounting and dismounting without mechanical stress or surface damage. While a direct quantitative comparison of measurement reproducibility with and without the clamp was not performed in this study, the clamp design eliminates the adhesive-based fixation and manual stage-leveling steps that are common sources of variability in acoustofluidic sedimentation experiments. All measurements reported herein were conducted with the clamp in place, ensuring consistent alignment across trials.
Figure A3.
(a) Photograph of the acoustofluidic device mounted on a custom leveling clamp. (b) Schematic of the clamp mechanism, highlighting the adjustable leveling screw and positioning clips.
References
- Yao, S.; Chang, C.; Hai, K.; Huang, H.; Li, H. A review of experimental studies on the proppant settling in hydraulic fractures. J. Pet. Sci. Eng. 2022, 208, 109211. [Google Scholar] [CrossRef] [Scilit]
- de Kruijf, M.; Slootman, A.; de Boer, R.A.; Reijmer, J.J. On the settling of marine carbonate grains: Review and challenges. Earth-Sci. Rev. 2021, 217, 103532. [Google Scholar] [CrossRef] [Scilit]
- Abelson, A.; Denny, M. Settlement of marine organisms in flow. Annu. Rev. Ecol. Syst. 1997, 28, 317–339. [Google Scholar] [CrossRef] [Scilit]
- Stokes, G.G. On the Effect of the Internal Friction of Fluids on the Motion of Pendulums. Trans. Camb. Philos. Soc. 1851, 9, 8. [Google Scholar]
- Burger, R.; Kirby, D.; Glynn, M.; Nwankire, C.; O’Sullivan, M.; Siegrist, J.; Kinahan, D.; Aguirre, G.; Kijanka, G.; Gorkin, R.A., III. Centrifugal microfluidics for cell analysis. Curr. Opin. Chem. Biol. 2012, 16, 409–414. [Google Scholar] [CrossRef] [Scilit]
- Kilburn, D.G.; Clarke, D.J.; Coakley, W.T.; Bardsley, D.W. Enhanced sedimentation of mammalian cells following acoustic aggregation. Biotechnol. Bioeng. 1989, 34, 559–562. [Google Scholar] [CrossRef] [Scilit]
- Yun, H.; Kim, K.; Lee, W.G. Cell manipulation in microfluidics. Biofabrication 2013, 5, 022001. [Google Scholar] [CrossRef] [Scilit]
- Sivagnanam, V.; Gijs, M.A. Exploring living multicellular organisms, organs, and tissues using microfluidic systems. Chem. Rev. 2013, 113, 3214–3247. [Google Scholar] [CrossRef] [Scilit]
- Wu, Y.; Gai, J.; Zhao, Y.; Liu, Y.; Liu, Y. Acoustofluidic Actuation of Living Cells. Micromachines 2024, 15, 466. [Google Scholar] [CrossRef] [Scilit]
- Cheng, F.; Guo, Z.; Lei, J. Assembly and dynamic manipulations of 3D Chladni figures in a cylindrical cavity using standing bulk acoustic waves. J. Acoust. Soc. Am. 2025, 157, 2896–2904. [Google Scholar] [CrossRef] [Scilit]
- Shao, M.; Wang, C.; Zheng, T.; Liang, J. An Acoustofluidic Capillary Nozzle for Programmable Microstructure Assembly in Direct Ink Writing of Flexible Conductive Composites. Micromachines 2026, 17, 744. [Google Scholar] [CrossRef] [Scilit]
- Lei, J.; Cheng, F.; Li, K.; Guo, Z. Two-dimensional concentration of microparticles using bulk acousto-microfluidics. Appl. Phys. Lett. 2020, 116, 033104. [Google Scholar] [CrossRef] [Scilit]
- Zheng, J.; Wu, Q.; Lin, Z.; Hu, X.; Qiao, L.; Li, G.; Luo, J. Acoustic Streaming-Based 3D Cell Focusing and Plasma Separation. Micromachines 2026, 17, 560. [Google Scholar] [CrossRef] [Scilit]
- Fornell, A.; Söderbäck, P.; Liu, Z.; De Albuquerque Moreira, M.; Tenje, M. Fabrication of Silicon Microfluidic Chips for Acoustic Particle Focusing Using Direct Laser Writing. Micromachines 2020, 11, 113. [Google Scholar] [CrossRef] [Scilit]
- Liu, X.; Chen, X.; Dong, Y.; Zhang, C.; Qu, X.; Lei, Y.; Jiang, Z.; Wei, X. Multiple virus sorting based on aptamer-modified microspheres in a TSAW device. Microsyst. Nanoeng. 2023, 9, 64. [Google Scholar] [CrossRef] [Scilit]
- Liu, J.; Yu, Y.; Zhang, R.; Chen, Y.; Guo, Y.; Zhang, Y.; Tao, R.; Luo, J.; Zheng, H.; Feng, P.; et al. Trapping nanoscale particles via quasi-Scholte mode in acoustofluidics. Lab Chip 2025, 25, 5777–5786. [Google Scholar] [CrossRef] [Scilit]
- Costa, M.; van der Geer, L.; Joaquim, M.; Hammarström, B.; Tanriverdi, S.; Joensson, H.N.; Wiklund, M.; Russom, A. EchoTilt: An Acoustofluidic Method for the Capture and Enrichment of Nanoplastics Directed Toward Drinking Water Monitoring. Micromachines 2024, 15, 1487. [Google Scholar] [CrossRef] [Scilit]
- Fabiano, L.; Pandey, S.; Brischwein, M.; Hasanzadeh Kafshgari, M.; Hayden, O. Continuous Perfusion Experiments on 3D Cell Proliferation in Acoustic Levitation. Micromachines 2024, 15, 436. [Google Scholar] [CrossRef] [Scilit]
- Lei, J.; Cheng, F.; Zheng, G.; Lin, L. Microfluidic Ultrasonic Shaker. Phys. Rev. Appl. 2022, 18, 054013. [Google Scholar] [CrossRef] [Scilit]
- Huang, L.; Xiang, X.; Li, Z.; Peng, Y.-G.; Li, Z.-M.; Wen, Y.; Qiu, J.; Zeng, L.-S.; Chen, J.; Li, F.; et al. Demonstration of topological acoustic tweezing for robust mass transport. Sci. Adv. 2026, 12, eadz4301. [Google Scholar] [CrossRef] [Scilit]
- Yin, Q.; Song, H.; Wang, Z.; Ma, Z.; Zhang, W. Acoustic black hole effect enhanced micro-manipulator. Microsyst. Nanoeng. 2024, 10, 144. [Google Scholar] [CrossRef] [Scilit]
- Mendis, B.L.; He, Z.; Li, X.; Wang, J.; Li, C.; Li, P. Acoustic Atomization-Induced Pumping Based on a Vibrating Sharp-Tip Capillary. Micromachines 2023, 14, 1212. [Google Scholar] [CrossRef] [Scilit]
- Lan, H.; Qian, J.; Liu, Y.; Lu, S.; Zhang, B.; Huang, L.; Hu, X.; Zhang, W. Swirl-like Acoustofluidic Stirring Facilitates Microscale Reactions in Sessile Droplets. Micromachines 2023, 14, 837. [Google Scholar] [CrossRef] [Scilit]
- Zhang, J.; Zheng, T.; Tang, L.; Qi, H.; Wu, X.; Zhu, L. Bubble-Enhanced Mixing Induced by Standing Surface Acoustic Waves (SSAWs) in Microchannel. Micromachines 2022, 13, 1337. [Google Scholar] [CrossRef] [Scilit]
- Zheng, Y.; Liu, C.; Cheng, F.; Yuan, M.; Huang, Z.; Lei, J. On-chip acoustic manipulation of single or arrayed microparticles via standing Scholte waves. Appl. Phys. Lett. 2026, 128, 122702. [Google Scholar] [CrossRef] [Scilit]
- Hsu, J.-C.; Hsu, C.-H.; Huang, Y.-W. Acoustophoretic Control of Microparticle Transport Using Dual-Wavelength Surface Acoustic Wave Devices. Micromachines 2019, 10, 52. [Google Scholar] [CrossRef] [Scilit]
- Fan, Y.; Wang, X.; Ren, J.; Lin, F.; Wu, J. Recent advances in acoustofluidic separation technology in biology. Microsyst. Nanoeng. 2022, 8, 94. [Google Scholar] [CrossRef] [Scilit]
- Hsu, J.-C.; Chang, C.-Y. Continuous Particle Aggregation and Separation in Acoustofluidic Microchannels Driven by Standing Lamb Waves. Micromachines 2022, 13, 2175. [Google Scholar] [CrossRef] [Scilit]
- Lei, J.; Lin, L.; Cheng, F.; Glynne-Jones, P.; Hill, M.; Huang, Z.; Yao, Z.; Yuan, M. On-demand rotational manipulation of microparticles and zebrafish larvae via orthogonally phased BAW acoustofluidics. Microsyst. Nanoeng. 2026, 12, 268. [Google Scholar] [CrossRef] [Scilit]
- Hsu, J.-C.; Liao, K.-L. Driving Rotational Circulation in a Microfluidic Chamber Using Dual Focused Surface-Acoustic-Wave Beams. Micromachines 2025, 16, 140. [Google Scholar] [CrossRef] [Scilit]
- Feng, L.; Song, B.; Zhang, D.; Jiang, Y.; Arai, F. On-Chip Tunable Cell Rotation Using Acoustically Oscillating Asymmetrical Microstructures. Micromachines 2018, 9, 596. [Google Scholar] [CrossRef] [Scilit]
- Lei, J.; Zheng, G.; Cheng, F.; Li, K. Rapid sedimentation of microparticles by vertically asymmetric acoustofluidics in an equilateral triangular channel. Appl. Phys. Lett. 2023, 122, 204102. [Google Scholar] [CrossRef] [Scilit]
- King, L.V. On the Acoustic Radiation Pressure on Spheres. Proc. R. Soc. Lond. 1934, A147, 212–240. [Google Scholar] [CrossRef] [Scilit]
- Gor’kov, L.P. On the Forces Acting on a Small Particle in an Acoustical Field in an Ideal Fluid. Sov. Phys. Dokl. 1962, 6, 773. [Google Scholar]
- Settnes, M.; Bruus, H. Forces acting on a small particle in an acoustical field in a viscous fluid. Phys. Rev. E 2012, 85, 016327. [Google Scholar] [CrossRef] [Scilit]
- Raney, W.P.; Corelli, J.C.; Westervelt, P.J. Acoustic Streaming in the Vicinity of a Cylinder. J. Acoust. Soc. Am. 1954, 26, 1006–1014. [Google Scholar] [CrossRef] [Scilit]
- Nyborg, W.L. Acoustic Streaming near a Boundary. J. Acoust. Soc. Am. 1958, 30, 329–339. [Google Scholar] [CrossRef] [Scilit]
- Lighthill, S.J. Acoustic streaming. J. Sound Vib. 1978, 61, 391–418. [Google Scholar] [CrossRef] [Scilit]
- Lei, J. Size-Dependent Acoustophoresis in Rectangular Microchannels: Critical Particle Radius and Multidimensional Field Coupling Effects. Electrophoresis 2025, 46, 1316–1324. [Google Scholar] [CrossRef] [Scilit]
- Yang, Z.; Cheng, F.; Lin, L.; Chen, W.; Zheng, G.; Huang, Z.; Yao, Z.; Yuan, M.; Lei, J. An experimental acoustofluidic system for analyzing boundary-driven acoustic streaming generated by flat and curved walls. Exp. Therm. Fluid Sci. 2025, 160, 111319. [Google Scholar] [CrossRef] [Scilit]
- Bach, J.S.; Bruus, H. Suppression of Acoustic Streaming in Shape-Optimized Channels. Phys. Rev. Lett. 2020, 124, 214501. [Google Scholar] [CrossRef] [Scilit]
- Lei, J.; Cheng, F.; Glynne-Jones, P.; Hill, M.; Yao, Z.; Yuan, M.; Ji, X. Suppression of acoustic streaming by creating specific acoustic resonances in shaped channels. J. Fluid Mech. 2026, 1029, A15. [Google Scholar] [CrossRef] [Scilit]
- Prest, J.E.; Treves Brown, B.J.; Fielden, P.R.; Wilkinson, S.J.; Hawkes, J.J. Scaling-up ultrasound standing wave enhanced sedimentation filters. Ultrasonics 2015, 56, 260–270. [Google Scholar] [CrossRef] [Scilit]
- Trampler, F.; Sonderhoff, S.A.; Pui, P.W.S.; Kilburn, D.G.; Piret, J.M. Acoustic Cell Filter for High Density Perfusion Culture of Hybridoma Cells. Nat. Biotechnol. 1994, 12, 281–284. [Google Scholar] [CrossRef] [Scilit]
- Hawkes, J.J.; Limaye, M.S.; Coakley, W.T. Filtration of bacteria and yeast by ultrasound-enhanced sedimentation. J. Appl. Microbiol. 1997, 82, 39–47. [Google Scholar] [CrossRef] [Scilit]
- Lei, J.J.; Glynne-Jones, P.; Hill, M. Comparing methods for the modelling of boundary-driven streaming in acoustofluidic devices. Microfluid. Nanofluid. 2017, 21, 23. [Google Scholar] [CrossRef] [Scilit]
- Muller, P.B.; Barnkob, R.; Jensen, M.J.H.; Bruus, H. A numerical study of microparticle acoustophoresis driven by acoustic radiation forces and streaming-induced drag forces. Lab Chip 2012, 12, 4617–4627. [Google Scholar] [CrossRef] [Scilit]
- Lei, J.; Cheng, F.; Li, K. Numerical Simulation of Boundary-Driven Acoustic Streaming in Microfluidic Channels with Circular Cross-Sections. Micromachines 2020, 11, 240. [Google Scholar] [CrossRef] [Scilit]
- Lei, J.; Zheng, G.; Cheng, F.; Li, K.; Huang, Z. Acoustofluidics in an equilateral triangular channel. Exp. Therm. Fluid Sci. 2024, 151, 111088. [Google Scholar] [CrossRef] [Scilit]
- Kynch, G.J. A theory of sedimentation. Trans. Faraday Soc. 1952, 48, 166–176. [Google Scholar] [CrossRef] [Scilit]
- Bruus, H. Acoustofluidics 2: Perturbation theory and ultrasound resonance modes. Lab Chip 2012, 12, 20–28. [Google Scholar] [CrossRef] [Scilit]
- Sadhal, S.S. Acoustofluidics 13: Analysis of acoustic streaming by perturbation methods Foreword. Lab Chip 2012, 12, 2292–2300. [Google Scholar] [CrossRef] [Scilit]
- Lee, C.P.; Wang, T.G. Outer Acoustic Streaming. J. Acoust. Soc. Am. 1990, 88, 2367–2375. [Google Scholar] [CrossRef] [Scilit]
- Rayleigh, L. On the Circulation of Air Observed in Kundt’s Tubes, and on Some Allied Acoustical Problems. Philos. Trans. R. Soc. Lond. 1884, 175, 1–21. [Google Scholar] [CrossRef] [Scilit]
- Schlichting, H. Berechnung ebener periodischer Grenzschichtstromungen (Calculation of plane periodic boundary layer streaming). Phys. Z. 1932, 33, 327–335. [Google Scholar]

Disclaimer/Publisher’s Note: The statements, opinions and data contained in all publications are solely those of the individual author(s) and contributor(s) and not of MDPI and/or the editor(s). MDPI and/or the editor(s) disclaim responsibility for any injury to people or property resulting from any ideas, methods, instructions or products referred to in the content. |
© 2026 by the authors. Licensee MDPI, Basel, Switzerland. This article is an open access article distributed under the terms and conditions of the Creative Commons Attribution (CC BY) license.