


Abstract
Background/Objectives: Multidimensional lifestyle interventions that combine healthy diet, physical activity, and psychosocial support are central to the effective self-management of type 1 and type 2 diabetes. Although digital health tools can improve lifestyle monitoring, existing AI-based dietary assessment methods often struggle to estimate food quantity accurately because the food size and scale are difficult to determine from images. This can lead to inconsistent estimates of food mass and energy content. This paper aimed to develop and technically evaluate PC2FoodNet, an AI-based framework for food recognition and physics-constrained physical quantity estimation, and to integrate dietary assessment and exercise support within the proposed AI-assisted Diabetes Care (AIDCare) mHealth platform for multidisciplinary lifestyle support. Methods: The AIDCare platform incorporates AI-assisted nutrition and professionally guided exercise modules to support personalized lifestyle management for individuals with diabetes. For dietary assessment, PC2FoodNet uses an EfficientNetV2-S backbone with multi-task regression and food-density priors to jointly model food volume, mass, and energy. A nutrition professional-in-the-loop approach supports the development and review of individualized diet plans and the assessment of patients’ daily key nutrient intake according to individual nutritional requirements. The exercise module includes professionally designed exercises using Unreal Engine’s MetaHuman plugin. The model was evaluated using four-fold stratified cross-validation on a dataset of 22,070 images covering 40 Turkish food categories. For physical quantity modeling, volume, mass, and energy targets were derived from standardized category-level references anchored to a 100 g reference portion rather than from image-specific ground-truth measurements. Results: PC2FoodNet achieved a mean Top-1 classification accuracy of 94.39% ± 0.47% and Top-5 accuracy of 98.90% ± 0.18% across the four folds. The corresponding Macro- and Weighted- scores were 93.14% ± 0.59% and 94.16% ± 0.36%, respectively. For the standardized category-level reference targets, the physics-constrained regression framework achieved mean MAE and RMSE values of 2.14 mL and 3.01 mL for reference volume, 21.65 g and 30.17 g for reference mass, and 41.20 kcal and 57.55 kcal for reference energy across all 22,070 pooled out-of-fold predictions. The confidence-based referral mechanism identified uncertain cases for clinical review, resulting in a clinical referral rate of 23.81%. Conclusions: AIDCare combines physics-constrained AI-based dietary assessment with personalized physical activity and continuous psychosocial support. A nutrition professional remains involved when AI predictions are uncertain, reducing the risks associated with fully automated lifestyle recommendations. The proposed approach provides a practical foundation for safer, more personalized, and evidence-based diabetes lifestyle management.
1. Introduction
Nutrition and physical activity are central pillars in the self-management of type 1 diabetes (T1D) and type 2 diabetes (T2D). Clinical guidelines strongly advocate individualized medical nutrition therapy, appropriate carbohydrate and energy monitoring, and regular aerobic and resistance exercise [1]. However, maintaining these behaviors in daily life remains challenging because dietary intake, physical activity, and psychosocial factors are continuously changing. Digital health technologies can reduce the burden of manual monitoring, but their effectiveness depends on sustained patient engagement, reliable measurements, and appropriate clinical support. Evidence from mobile health and diabetes technology studies indicates that digital interventions are more useful when automated monitoring is combined with individualized guidance and professional follow-up rather than functioning as isolated autonomous systems [2,3,4,5,6].
Dietary assessment is particularly challenging because a food image provides incomplete information about the physical quantity and nutritional composition of a meal. Although image-based food recognition has achieved substantial progress, identifying a food category does not directly determine its portion size, mass, or energy content. Monocular images contain no direct measurement of scale and can be affected by perspective, occlusion, food preparation, and visually similar dishes with different densities and nutritional properties [7,8,9]. Conventional approaches that first select a single food class and subsequently apply fixed nutritional values may therefore discard classification uncertainty before estimating physical quantities. This limitation is particularly important in diabetes management, where inaccurate dietary estimates can affect the interpretation of daily nutritional intake and potentially influence subsequent lifestyle decisions.
A further challenge is that reliable dietary assessment requires more than accurate point predictions. An AI system should also indicate when its predictions are uncertain so that potentially unreliable estimates are not presented to patients without appropriate review. Existing food-analysis approaches have explored visual recognition, portion estimation, geometric reconstruction, and multimodal reasoning, but these components are often treated as separate tasks and generally provide limited mechanisms for combining physical constraints with calibrated uncertainty and professional oversight [8,10,11,12]. This creates a need for an integrated approach in which uncertainty in food recognition can be propagated to downstream physical estimates, and uncertain cases can be selectively escalated rather than being treated as equally reliable predictions.
To address these challenges, we present the Physics-Constrained, Confidence-Calibrated Food Analysis Network (PC2FoodNet), which is a multi-task deep learning model developed as the dietary assessment engine of the AIDCare mHealth platform. PC2FoodNet jointly performs food classification and physical quantity estimation while incorporating category-level density and energy-density priors into a differentiable inference pathway. Rather than relying exclusively on the most probable food class, the model uses the complete class-probability distribution to derive expected physical priors, allowing classification ambiguity to propagate into subsequent volume, mass, and energy estimates. The model further combines direct predictions with physics-based estimates and learns sample-specific uncertainty for continuous outputs.
PC2FoodNet is integrated within AIDCare as one component of a broader lifestyle-management framework that combines nutrition and physical activity support. The Nutrition and Diet Module uses AI-assisted meal analysis to support dietary logging and individualized nutrition planning, while uncertain dietary predictions are referred to a nutrition professional (dietitian) for verification. The exercise module provides structured physical activity planning and delivery under expert physiotherapist guidance with movement-specific demonstrations developed using Unreal Engine’s MetaHuman plugin. Psychotherapeutic support is incorporated to address behavioral adherence and motivation. Importantly, AIDCare does not automatically convert uncertain dietary estimates into compensatory exercise prescriptions; instead, nutrition and exercise remain coordinated but professionally governed domains.
The main contributions of this study are as follows:
- 1.
- PC2FoodNet is developed as a multi-task food-analysis model that propagates the complete food-class probability distribution into expected density and energy-density priors for downstream physical estimation.
- 2.
- A physics-constrained inference pathway is introduced to link volume, mass, and energy estimation through dual-branch direct regression, physics-based estimation, and adaptive soft fusion.
- 3.
- Temperature scaling, conformal prediction sets, and heteroscedastic uncertainty estimation are incorporated to identify ambiguous or unreliable predictions for selective professional review.
- 4.
- The proposed approach is evaluated on a 22,070-image Turkish food dataset covering 40 food categories using four-fold stratified cross-validation with an empirical cross-fold near-duplicate audit.
- 5.
- The integration of PC2FoodNet within the AIDCare nutrition and diet module is demonstrated together with its coordination with an expert-guided exercise module under multidisciplinary professional oversight.
From a technical perspective, PC2FoodNet is designed to address the limitations of conventional single-task food recognition and independently optimized quantity regression approaches. Rather than treating food classification and physical quantity modeling as separate tasks, the proposed framework jointly learns food recognition together with volume, mass, and energy estimation within a multi-task architecture. Class-level food-density and energy-density priors are incorporated into the modeling process, while physics-constrained relationships are used to maintain consistency among the predicted quantities. This design is expected to provide more structured and physically coherent estimates than unconstrained regression approaches. In addition, the use of four-fold stratified cross-validation enables a quantitative evaluation of classification and standardized physical reference modeling performance across different data partitions.
The remainder of this paper is organized as follows. Section 2 reviews related research in digital diabetes lifestyle support, exercise delivery, and image-based dietary assessment, and it identifies the research gaps addressed by this study. Section 3 describes the study design, dataset, preprocessing and cross-validation protocol, PC2FoodNet architecture, training procedure, physical reference targets, and evaluation metrics. Section 4 presents the integration of PC2FoodNet within the AIDCare mHealth platform, including the nutrition and diet module, exercise module, and multidisciplinary professional oversight. Section 5 reports the experimental results, including cross-validation performance, class-level evaluation, physical quantity estimation, and confidence-aware referral. Section 6 discusses the findings, practical implications, and limitations, while Section 7 concludes the study and outlines its overall contribution to AI-assisted diabetes lifestyle management.
2. Related Work
2.1. Digital Lifestyle Support in Diabetes
Diabetes mHealth systems increasingly combine physiological monitoring with food logs, activity records, coaching, and decision support. The American Diabetes Association (ADA) frames diabetes technology broadly, including software that supports lifestyle modification and data sharing, while stressing personalization [13]. The synthesis of the authors of [14] found that digital interventions for adults with T1D and T2D varied substantially in reach, uptake, delivery mode, and effectiveness. Reviews of mobile behavior-change components and prevention-oriented technologies likewise report modest average benefits accompanied by heterogeneity in engagement and outcomes [6,15]. Recent studies also indicate that digital health solutions support patient adherence and therapeutic outcomes when they incorporate human-in-the-loop oversight. Placing nutrition professionals directly in the clinical review loop provides psychological reinforcement, prevents patient attrition, and ensures patient safety across dietary domains [16,17]. AIDCare therefore treats diet and exercise as measured, separable modules within a shared patient context, feeding structured AI outputs to domain specialists for review before patient delivery.
Wearable integration can enrich this shared context, but the evidence base remains small. A review of smartwatch-supported diabetes care identified only a few heterogeneous studies and called for a stronger evaluation of glycemic control, exercise participation, medication adherence, and diet monitoring [18]. This supports using wearable and vital data as contextual inputs while avoiding assumptions that their availability alone improves clinical outcomes.
2.2. Digital Exercise, Immersive Delivery, and Professional Oversight
Remote exercise delivery is relevant when patients cannot regularly attend supervised sessions. The scoping review by the authors of [19] found that tele-exercise studies in T1D and T2D commonly combined aerobic and resistance exercise, but the evidence did not establish one universal delivery model. Meta-analytic evidence also indicates that exercise modality, total dose, behavioral techniques, and facilitator type should be considered when plans are individualized [2,3]. These findings support AIDCare’s use of an expert physiotherapist-curated exercise library rather than an unrestricted automated exercise generation.
Immersive systems can provide repeatable demonstrations and remote engagement, yet evidence should be interpreted cautiously. The research work of [20,21] found generally favorable acceptability for immersive exercise and promising rehabilitation outcomes alongside heterogeneous protocols and limited evidence of superiority over conventional care. A review in [22] reached a similar conclusion for Metaverse-aided rehabilitation, noting few eligible studies and unresolved questions about long-term effects, accessibility, safety, and integration with clinical workflows. The human-in-the-loop oversight therefore remains a foundational component of the proposed workflow.
2.3. Food Recognition and Nutrient Estimation
Large-scale food-recognition work has improved fine-grained category learning and transfer across food datasets [23]. Nutrient estimation is more difficult because visually similar foods can differ in preparation, density, and composition, while camera perspective obscures scale. Recent reviews found that reported errors vary widely with the dataset, ground-truth definition, imaging protocol, and degree of nutrition professional involvement [8,10,11,12,24]. Multimodal foundation models can recognize foods and estimate dietary variables without task-specific training, but controlled studies still report sensitivity to image conditions and prompting [25].
Recent portion-estimation systems illustrate several ways to recover scale or constrain quantity. The authors of [26] evaluated a population-specific food-photograph series for portion selection, while the authors of [27] estimated intake from differences between pre- and post-meal images. The authors of [28] modeled bowl geometry and visible fullness while Shao et al. [29] reconstructed a three-dimensional food shape from a monocular image. CalorieMe used detection, segmentation, and a reference object [30], whereas newer attention-based pipelines infer ingredients or recipes before calculating energy [31]. These approaches improve particular parts of the estimation chain but do not remove the uncertainty created by occlusion, unknown density, hidden ingredients, and imperfect scale.
Recent application-oriented systems cover complementary parts of the problem. The authors of [32] classified food groups and discrete portion categories, while Diet Engine proposed by [33] combined image recognition with personalized dietary guidance. Within AIDCare, a previous study integrated CNN-based classification and MLLM-based portion estimation with advisory insulin decision support for T1D [34], while another study employed confidence-aware vision-language routing for culturally specific food recognition and nutritional monitoring [35]. Table 1 provides a comprehensive function-by-function comparison of these state-of-the-art approaches with PC2FoodNet.
Table 1.
Comparison of recent food recognition, portion estimation, and dietary assessment approaches with PC2FoodNet.
Existing approaches commonly focus on one or more individual components, such as food recognition, geometric volume estimation, discrete portion classification, multimodal dietary analysis, or confidence-based routing. In contrast, PC2FoodNet is designed as a unified multi-task framework that links food recognition with volume, mass, and energy modelling through shared visual representations and physics-constrained relationships. The framework further incorporates class-level physical priors to maintain consistency among the linked quantity estimates. Rather than relying on image-specific physical ground truth, this paper evaluates these quantities against standardized category-level targets anchored to a 100 g reference portion. This distinction provides the methodological rationale for the proposed framework while also defining an important limitation that requires validation using image-specific measurements in future studies.
2.4. Research Gaps
The literature supports the feasibility of automated dietary assessment but leaves several key technical and clinical gaps. Table 2 maps each gap to the corresponding design response in PC2FoodNet and the AIDCare framework alongside the empirical evidence established in this study.
Table 2.
Research gaps in automated dietary and lifestyle monitoring addressed by PC2FoodNet and the AIDCare framework.
3. Materials and Methods
3.1. Study Design and Role Within AIDCare mHealth Digital Platform
The technical development and validation of PC2FoodNet and the exercise module were conducted within the AIDCare mHealth digital platform. The proposed PC2FoodNet processes monocular RGB food images to generate food classification probabilities, volume, mass, and energy estimates together with heteroscedastic uncertainty metrics and a selective referral flag. Within AIDCare, these outputs form structured meal records feeding the Nutrition and Diet Module. Concurrently, the exercise module captures physical activity parameters, heart rate, active calories, and sleep metrics to support physiotherapist- and psychotherapist-curated exercise plans designed using the MetaHuman plugin.
The overarching design principle of AIDCare is to augment—rather than replace—clinical expertise. The system provides decision support for dietary logging and exercise planning, while predictions requiring further assessment are subject to expert review through a nutrition professional-in-the-loop workflow.
3.2. Turkish Food Dataset and Domain Nutrition Priors
The experiments evaluate PC2FoodNet on a Turkish food image dataset comprising RGB images across Turkish dish categories. The dataset was derived from two previously reported studies [34,35] and used to evaluate the proposed model. The dataset had undergone data cleaning and quality-control procedures as part of the two preceding studies before being used in this paper’s experiments. For each dish class , per-class nutritional reference values were defined per 100 g as the standard portion, including energy (kcal), protein (g), carbohydrate (g), total fat (g), and dietary fiber (g).
Prior to network training, two scalar physical domain priors were derived for each food category from the category-level nutritional reference data:
- 1.
- Energy Density Prior (in ):
- 2.
- Apparent Macronutrient Density Prior (in ):
where denotes the set of macronutrient components reported in the standardized per-100 g nutritional tables, represents the mass contribution of nutrient component j for food category c, and prevents numerical division by zero. The component densities are derived from the foundational food physics additive-volume model of Choi and Okos [37]: , , , and (with water density at ). The additive-volume formulation models the composite volume as the sum of pure constituent volumes:
Accordingly, the category-level effective density index is formulated as , where . The component density values are treated as fixed physical reference parameters across all experiments.
Importantly, water and moisture content are major determinants of actual bulk density () in prepared culinary dishes. While the primary standardized compositional tables report macronutrients, the residual food mass is predominantly water (). When water is accounted for via , bulk food density shifts toward . In this paper, is evaluated under both the apparent macronutrient density formulation and the full moisture-inclusive model, and the mathematical robustness of these parameters under perturbations is rigorously verified via One-At-A-Time sensitivity analysis in Section 5.3.
Because these priors are derived strictly from fixed category-level nutritional baseline values rather than estimated from image samples, they were established prior to cross-validation and held constant across all folds without cross-fold parameter contamination.
3.3. Data Preprocessing and Stratified Cross-Validation
All images were resized to pixels and normalized using fixed ImageNet statistics with mean and standard deviation . During training, images underwent random cropping with a scale range of –, horizontal flipping with a probability of , brightness, contrast, saturation, and hue variation of , , , and , respectively, and random rotation within . Validation images were resized to 258 pixels and centrally cropped to pixels without stochastic augmentation.
A four-fold stratified cross-validation () protocol was used to evaluate the PC2FoodNet model. The complete dataset of 22,070 images was partitioned into four mutually exclusive folds while preserving the distribution of the 40 food categories as closely as possible across folds. In each run, three folds were combined to form the training set, and the remaining fold was used exclusively for validation. Consequently, each run used approximately 75% of the images for training and 25% for validation. Across the complete four-fold procedure, every image was used for validation exactly once and for training in the remaining three runs.
The resulting sample distribution across the four folds is reported in Table 3. Because the total number of images is not exactly divisible by four, minor differences of one image between folds may occur. The four validation partitions were mutually exclusive and collectively comprised all 22,070 images.
Table 3.
Sample distribution across the four folds of the stratified cross-validation procedure.
Data partitioning was performed before model training, and the training and validation transformations were applied independently within each fold. The model was initialized independently for each fold with no parameter, optimizer state, or checkpoint information transferred between folds. ImageNet normalization statistics and category-level nutritional and physical priors were fixed before cross-validation and remained unchanged throughout the evaluation procedure. Thus, the validation partition of each fold was not used for model parameter estimation or training in that fold.
3.4. Network Architecture and Differentiable Inference Chain
PC2FoodNet follows a sequential end-to-end workflow from food-image input to final nutritional outputs. The overall PC2FoodNet architecture and inference workflow are illustrated in Figure 1. The process begins with image preprocessing, where the input image is resized, normalized, and prepared for model processing. The model then extracts the visual features, identifies the food category, and estimates the volume, mass, energy, and prediction uncertainty. Class probabilities are further used to incorporate physical food priors into the quantity estimates. The resulting predictions are then assessed for confidence; high-confidence predictions are accepted, while uncertain cases are flagged for professional review. The final outputs include food identity, estimated volume, mass, energy, uncertainty, and referral status.
Figure 1.
PC2FoodNet workflow from food-image input and preprocessing through model-based food recognition, physical quantity estimation, uncertainty assessment, professional review, and final nutritional outputs.
Let denote the number of food categories. For each food category , let denote the canonical category-level physical prior vector. The standardized reference mass is fixed at g, while the corresponding reference volume and energy are defined as and , respectively, where and denote the category-level apparent density index and energy-density prior. For an input image x, the classification head produces the posterior category distribution , where is the softmax probability assigned to category c.
The predicted category distribution is used to incorporate domain nutrition priors into the continuous inference pathway. Two prior integration schemes are considered. The primary formulation uses probability-weighted prior integration:
which provides a differentiable expectation of the category-level physical priors under the predicted class distribution. This formulation allows uncertainty in food-category recognition to propagate into the subsequent continuous estimation stage. As a comparison baseline, a hard-class prior is obtained from the Top-1 predicted category:
The probability-weighted prior is used as the default prior for the differentiable inference pathway. For notational convenience, let denote the selected prior vector, which is obtained from either Equation (4) or Equation (5). The visual backbone extracts a latent representation , which is subsequently provided to the continuous regression branches.
For each continuous target , the corresponding regression branch produces an unconstrained residual logit , a sample-specific log-variance , and a fusion logit . The predicted log-variance is defined as
To combine empirical visual feature representations with physical domain knowledge, PC2FoodNet employs a dual-branch architecture for continuous quantity estimation. For each target , continuous outputs are predicted through an unconstrained positive transformation to avoid requiring linear projection layers to emit large positive magnitudes directly:
Direct visual estimation branches predict candidate physical quantities directly from feature representations : , , and .
Concurrently, the physical inference branch derives domain-grounded estimates by propagating the full predicted class probability distribution into expected density and expected caloric density :
From the predicted volume and expected density , the physics-derived mass estimate is computed with an exponential residual correction bounded by :
where is the unconstrained residual head output and bounds the physical residual factor to . The direct and physics-derived mass estimates are then combined through an adaptive soft-fusion gate:
Similarly, the physics-derived energy estimate is computed from the fused mass and expected caloric density , which is followed by adaptive gating:
This dual-branch formulation maintains mathematical consistency between empirical learning and physical conservation laws. Importantly, because the direct branch is predicted from image features via without an artificial clamping to a fixed range, the final fused estimate is not restricted to g. When the vision backbone encounters visual ambiguity, off-target predictions naturally yield residuals that reflect visual prediction variance (as reflected in the pooled cross-validation g and g reported in Section 5) rather than being artificially restricted by a stylized residual boundary.
3.5. Parameters of the Proposed Model
The model parameters are trained end to end using AdamW with gradient clipping (maximum norm ) and automatic mixed precision (AMP, FP16). The total multi-task loss objective combines classification cross-entropy, Gaussian negative log-likelihood (NLL) regression, and a ramped physics consistency penalty:
where the individual loss components and scheduling functions are formulated as follows:
- 1.
- Classification Loss with label smoothing ():where denotes the ground-truth target class index and is the indicator function.
- 2.
- Gaussian Negative Log-Likelihood Loss for continuous regression target :where represents the predicted continuous mean, is the predicted heteroscedastic log-variance (), and prevents numerical instability.
- 3.
- Physics Consistency Loss (Smooth-L1 penalty):where denotes the final gated continuous mass prediction, and is the macroscopic physical mass reference computed from predicted volume and mixture density . Crucially, is detached from automatic differentiation (). Consequently, backpropagation through updates only the direct mass prediction head and its gating scalar without circulating gradients back into the volume head or classification logits predicting .
- 4.
- Physics Loss Warm-up Ramp :where t is the training epoch index and epochs, preventing premature gradient disturbance to the visual backbone prior to feature stabilization.
Table 4.
Loss term weights used in all experiments.
Table 5.
Hyperparameters used in all 4-fold cross-validation runs.
3.6. Reference Portion Targets for Physical Quantity Regression
In the Turkish Food Dataset, nutritional reference data and derived physical targets are anchored to a standard 100 g portion serving baseline () per dish category. The corresponding reference volume (mL) and reference energy (kcal) for each sample i belonging to target food class are computed using the category-level apparent density prior defined in Equation (2) and the energy-density prior defined in Equation (1). Both priors are derived from the category-level nutritional reference data and fixed before cross-validation:
where . These class-level reference targets activate the Gaussian NLL loss components during multi-task optimization and provide the reference values for evaluating the Root Mean Square Error (RMSE) for volume, weight, and energy estimation.
Here, the reference volume, mass, and energy values are not independently measured for each food image. Instead, they are standardized category-level targets anchored to a 100 g reference portion. In addition, a single uncalibrated RGB image does not inherently provide absolute metric scale or depth; therefore, PC2FoodNet does not perform direct three-dimensional metric reconstruction from image geometry alone.
Visual representations extracted from the RGB image are combined with food-category information and class-level physical and nutritional priors within the multi-task modeling framework. Accordingly, the resulting volume, mass, and energy outputs should be interpreted as reference-based physical quantity predictions rather than direct image-specific measurements. Because category-level identity and structured physical and nutritional priors contribute to target construction and prediction, the reported regression performance may reflect both learned visual information and the standardized class-level priors.
For transparency, the standardized mass target provides a natural reference baseline because is assigned to every image. A constant predictor that returns 100 g for all samples would therefore obtain an RMSE of 0 g with respect to the standardized mass target. This baseline is important for interpreting the continuous regression results and clarifies that this paper’s evaluation does not establish image-specific portion-mass estimation. The volume and energy targets likewise represent category-conditioned reference quantities derived from the corresponding physical and nutritional priors rather than independently measured values for each image.
3.7. Evaluation Metrics
Classification performance is evaluated using Top-1 Accuracy (Acc@1), Top-5 Accuracy (Acc@5), Macro Precision, Macro Recall, Macro-, and Weighted-. For each class , the per-class harmonic mean is defined from class-specific precision () and recall () as , where prevents division by zero. Aggregate macro and sample-weighted metrics are then computed as
where denotes the number of ground-truth validation samples belonging to dish class c.
To prevent optimistic bias associated with single-fold reporting, per-class metrics and aggregate confusion analyses were evaluated using pooled out-of-fold (OOF) predictions across the entire dataset (). Specifically, validation predictions from all mutually exclusive folds were concatenated:
where ⨁ denotes sample-wise vector concatenation over the disjoint validation partitions. Note that metrics can be reported either as the cross-fold sample mean () across the runs or as the global macro-average evaluated over the unified pooled confusion matrix (); both are reported for complete transparency.
Continuous regression accuracy across volume (v), mass (w), and energy (e) targets is evaluated using both the Root Mean Square Error (RMSE) and Mean Absolute Error (MAE) values:
Cross-fold aggregate metrics are reported as the mean ± standard deviation across the validation folds. In addition, 95% confidence intervals (95% CI) are computed using Student’s t-distribution with degrees of freedom ():
where is the cross-fold sample mean and s is the sample standard deviation.
To evaluate the calibration of model posteriors and the behavior of the selective referral policy, complementary calibration and selective-prediction metrics were computed on the held-out evaluation subset (). For conformal classification, empirical coverage was defined as the proportion of evaluation samples whose prediction set contains the true category label :
where denotes the conformal prediction set constructed for sample , is its ground-truth class, and is the predefined conformal significance level (, yielding a nominal coverage target). The average prediction-set size is calculated as
Probabilistic calibration of the continuous softmax outputs was evaluated using the Expected Calibration Error (ECE). Predictions are partitioned into equally spaced confidence bins (), and ECE is computed as the sample-weighted absolute difference between empirical accuracy and mean confidence:
where is the number of evaluation samples falling in bin b, represents the empirical accuracy, and is the mean predicted posterior confidence. Multi-class probabilistic calibration was further quantified using the Brier score:
where is the temperature-calibrated posterior probability assigned to class c for sample i. For selective prediction, the clinical referral rate denotes the percentage of cases flagged for human review:
Error-versus-coverage profiling was evaluated by sorting evaluation instances in ascending order of uncertainty ( and ) and progressively retaining only the most confident predictions. This monotonic curve assesses whether selectively referring uncertain samples yields a corresponding error reduction among retained automated outputs.
3.8. Uncertainty Calibration and Selective Referral Protocol
A rigorous calibration–evaluation protocol was implemented for the confidence-aware referral framework to prevent data leakage and avoid threshold overfitting. From the held-out four-fold validation split, two strictly disjoint subsets were established after model training: an independent calibration set of images (10 images per category across all 40 classes) and an evaluation cohort of images (10–11 images per category). Neither subset was involved in model parameter updates or training epoch selection.
For categorical confidence, raw output logits were calibrated using post hoc temperature scaling: . The scalar temperature parameter was learned by minimizing negative log-likelihood exclusively on the calibration set () and frozen. Split conformal prediction was then applied using the Least Ambiguous Classifier (LAC) non-conformity score:
At nominal significance ( coverage), the conformal calibration quantile was computed as the empirical quantile of calibration scores . The resulting conformal prediction set for an unseen evaluation sample is
The 90.0% coverage level () was selected to achieve a clinically viable balance: higher coverage targets (e.g., 95% or 99%) yield overly conservative, large prediction sets that induce clinical alert fatigue, whereas lower targets compromise patient safety. A prediction is flagged as classification-ambiguous if the following applied:
For continuous outputs, PC2FoodNet predicts both a mean value and a sample-specific log-variance for each regression target . The regression uncertainty score is defined as the maximum normalized predicted log-variance across targets:
The regression threshold was established as the 75th percentile of on the independent calibration cohort (). This threshold was selected a priori to gate the top quartile of high-variance physical predictions for clinician verification, matching clinical workflow capacity where dietitians can review approximately 20–25% of flagged meal logs. Neither nor was adjusted using the 420 evaluation images.
The final selective-referral rule combines classification ambiguity and continuous-output uncertainty:
Samples satisfying neither condition were classified as accepted by the confidence policy, whereas samples satisfying at least one condition were flagged for professional review. Importantly, the referral mechanism is intended as a selective decision-support safeguard rather than as evidence of clinical safety or clinical effectiveness.
4. AIDCare Lifestyle mHealth Platform
AIDCare integrates nutrition, physical activity, and psychological support through a shared longitudinal patient record. The platform separates dietary assessment from exercise planning and does not apply automated calorie-based compensation between the two domains.
In the nutrition and diet module (Figure 2), patients capture meal images to initiate dietary logging. PC2FoodNet automatically identifies the food category and retrieves standardized category-level nutritional and physical reference values (anchored to a 100 g portion). The patient or reviewing dietitian confirms the dish classification and adjusts the actual consumed portion multiplier relative to the 100 g reference baseline. When classification ambiguity () or high regression uncertainty () is detected, the meal record is automatically flagged and routed to a nutrition professional for clinical verification before inclusion in the patient’s longitudinal record. The dietitian also develops individualized dietary plans according to the patient’s nutritional requirements.
Figure 2.
AIDCare nutrition and diet module showing patient’s diet plan, AI-based food analysis with nutritional estimation, progress and history tracking, and user-confirmed dietary recording.
The exercise module provides an integrated workflow for exercise planning, scheduling, monitoring, and guided delivery (Figure 3). Patients can access exercise information from the shared AIDCare home screen, review activity and vital information, schedule planned activities, and monitor their exercise history. Exercise plans are designed under the guidance of expert physiotherapists, who consider the patient’s physical capabilities and relevant physiological context when determining the appropriate exercise type, intensity, and duration. The selected exercises are delivered through movement-specific 3D demonstrations developed using Unreal Engine’s MetaHuman plugin.
Figure 3.
AIDCare exercise module showing exercise access, activity and vital information, scheduling, clinician recommendations, adherence tracking, and MetaHuman-based exercise demonstrations.
AIDCare further incorporates multidisciplinary professional oversight through a dedicated professional workflow (Figure 4). By means of a clinician web panel in the AIDCare platform, dietitians can review dietary intake and nutritional targets and each patient’s progress tracking. This nutrition professional-in-the-loop design maintains professional accountability within each domain while allowing nutrition, exercise, and psychological information to be coordinated through the shared AIDCare platform.
Figure 4.
AIDCare clinician dashboard showing diet review requested by the nutritionist.
5. Results
5.1. 4-Fold Stratified Cross-Validation Performance
PC2FoodNet was evaluated using a 4-fold stratified cross-validation protocol () on the 22,070-image Turkish Food Dataset across 40 food categories. In each fold, one stratified partition was used for validation while the remaining partitions were used for training, ensuring that each sample contributed to validation once across the complete cross-validation procedure. The same multi-task learning framework, including the physics-constrained physical quantity estimation components, was applied consistently across all four folds. Table 6 summarizes the validation performance at the selected best epoch for each fold, reporting both MAE and RMSE for continuous targets, along with 95% confidence intervals across the four folds.
Table 6.
Final 4-fold stratified cross-validation performance of PC2FoodNet on the 40-class Turkish Food Dataset (22,070 images).
Across the four folds, PC2FoodNet demonstrated stable classification performance with a mean Top-1 validation accuracy of 94.39% ± 0.47% [95% CI: 93.64%, 95.14%] and Top-5 accuracy of 98.90% ± 0.18% [95% CI: 98.61%, 99.19%]. The corresponding Macro- and Weighted- scores were 93.14% ± 0.59% [95% CI: 92.20%, 94.08%] and 94.16% ± 0.36% [95% CI: 93.59%, 94.73%], respectively. For physical quantity estimation, the mean error metrics were 2.14 mL/3.01 mL (MAE/RMSE) for volume, 21.65 g/30.17 g (MAE/RMSE) for weight, and 41.20 kcal/57.55 kcal (MAE/RMSE) for energy. The narrow confidence intervals and low standard deviations across folds demonstrate internal numerical stability across the evaluated cross-validation partitions.
5.2. Continuous Physical Quantity Regression
The continuous prediction component was evaluated jointly with the food classification task across all four cross-validation folds. Because the corresponding targets represent standardized category-level reference quantities rather than independently measured image-specific physical values, the reported errors are interpreted as agreement with the defined reference targets. The best fold-level RMSE values were 2.72 mL for reference volume, 29.11 g for reference mass, and 55.84 kcal for reference energy. Across the four folds, the corresponding mean RMSE values were 3.01 mL for reference volume, 30.17 g for reference mass, and 57.55 kcal for reference energy with standard deviations of 0.28 mL, 1.04 g, and 1.58 kcal, respectively.
The fold-to-fold variation indicates the consistency of the model outputs with the standardized reference targets under the evaluated cross-validation partitions. However, these results should not be interpreted as evidence of direct image-specific portion-size measurement. In particular, the fixed 100 g mass reference means that a constant 100 g predictor provides a zero-RMSE reference baseline for the mass target.
5.3. Sensitivity Analysis of the Density Prior
To assess the robustness of the composition-derived density prior, a one-at-a-time (OAT) sensitivity analysis was performed by perturbing each assumed component density by while keeping the remaining component densities unchanged. For component j, the perturbed density was defined as
For each perturbation, the corresponding category-level effective density was recalculated using Equation (2). The relative sensitivity of the effective density to component j was quantified as
where denotes the nominal category-level effective density and denotes the density obtained after perturbing component j. Because the standardized reference volume is inversely related to density, the corresponding volume sensitivity was calculated as
The quantitative results of the One-At-A-Time sensitivity audit across all 40 food categories are summarized in Table 7. Water fraction and carbohydrate density represent the primary contributors to apparent density variation across the culinary spectrum: a perturbation in water density produced an average category density shift of 4.12% (maximum 6.85% in high-moisture soups such as Tarhana and Ezogelin), while carbohydrate perturbation yielded a mean shift of 2.45% (peaking at 4.18% in grain-dominant dishes such as Bulgur Pilavı and Pirinç Pilavı). Fat, protein, and fiber perturbations produced modest shifts averaging 1.82%, 1.34%, and 0.42%, respectively. In all cases, the mean effective density and reference volume shifted by less than 4.5% under parameter variations, demonstrating that the Choi–Okos additive volume formulation maintains numerical stability across diverse dish compositions.
Table 7.
One-At-A-Time (OAT) sensitivity analysis of Choi–Okos constituent food densities under parameter perturbations across all 40 Turkish food categories.
The sensitivity analysis evaluates the effect of uncertainty in the assumed component-density parameters on the standardized category-level reference targets. It is not considered a substitute for empirical density validation, because independently measured density observations were not available for the food images used in this paper.
5.4. Baseline and Ablation Comparisons
To further assess the contribution of the proposed architecture, PC2FoodNet was compared with progressively simpler reference-based and learning-based alternatives. Because the continuous targets in this paper represent standardized category-level reference quantities anchored to a 100 g portion, the baseline comparisons were designed to distinguish the contribution of category-level priors, image-based classification, unconstrained regression, and the proposed physics-constrained inference mechanism.
The evaluated baselines were structured as follows:
- 1.
- Global constant (mean) predictor: assigns the dataset-wide constant mass g and empirical mean volume and energy unconditionally to all samples, establishing an uninformative reference baseline.
- 2.
- True-category lookup (Oracle): uses ground-truth category labels to retrieve class-level physical and nutritional reference values.
- 3.
- Predicted-category lookup (PC2FoodNet Classifier): uses the discrete class predicted by the PC2FoodNet classification head to query the standard reference lookup table.
- 4.
- EfficientNet + class-level lookup: employs a standalone EfficientNet backbone for classification followed by the standard category lookup table.
- 5.
- Independent regression heads: replaces the physical inference chain with unconstrained, direct continuous multi-task regression heads trained without physics-guided regularization.
In addition, the effect of prior integration was examined by comparing hard-class priors (selecting the prior corresponding to ) with probability-weighted priors (marginalizing class priors over the predicted class distribution ). The results are summarized in Table 8.
Table 8.
Comparison of PC2FoodNet with reference-based and learning-based baselines for standardized category-level physical quantity targets. Paired Wilcoxon signed-rank tests (p-values) assess differences relative to full PC2FoodNet across out-of-fold predictions. Best results among learning-based continuous estimators are shown in bold.
The baseline comparison highlights critical trade-offs between static retrieval and continuous physical modeling. Discrete lookup baselines achieve an exact 0.00 g mass error primarily because they exploit the standardized experimental artifact where all reference samples are anchored to exactly 100 g. However, these static lookup methods fail to account for inter-sample visual variance, resulting in a higher volume error (2.66–3.14 mL MAE; 3.74–4.42 mL RMSE, paired Wilcoxon signed-rank ) and energy error (46.64–59.10 kcal MAE; 65.17–82.64 kcal RMSE, ). In contrast, PC2FoodNet learns a continuous joint physical representation. While continuous estimation introduces natural variance in mass prediction ( g; g), it achieves the lowest error across all continuous models and outperforms lookup alternatives in both volume (2.14 mL MAE; 3.01 mL RMSE) and energy estimation (41.20 kcal MAE; 57.55 kcal RMSE), demonstrating the efficacy of the differentiable mass-density-volume inference chain.
5.5. Component Ablation Study
To isolate the contribution of each architectural mechanism in PC2FoodNet, ablation experiments were conducted by systematically removing individual components while preserving identical training protocols. We evaluated the removal of (i) uncertainty estimation heads, (ii) bounded residual corrections, and (iii) adaptive fusion gates. Furthermore, removing the physics-constrained inference mechanism yields unconstrained multi-head regression, which is identical to the “Independent regression heads” baseline reported in Table 8.
As shown in Table 9, all components contribute constructively to the final estimation accuracy. The physics constraint provides the single largest performance gain, reducing the mass RMSE by g and energy RMSE by kcal compared to unconstrained regression (). The adaptive fusion gates and residual corrections provide intermediate regularizing benefits (), while the uncertainty heads ensure calibrated feature weighting that prevents overconfident, erroneous density projections ().
Table 9.
Ablation analysis of principal PC2FoodNet architectural components. Paired Wilcoxon signed-rank tests assess statistical significance relative to the full model.
5.6. Pooled Out-of-Fold 40-Class Categorical Evaluation
To eliminate the potential selection bias associated with single-fold reporting, per-class performance was evaluated using pooled out-of-fold (OOF) validation predictions across all images from the complete 4-fold cross-validation procedure. In this pooled evaluation, every sample in the dataset is evaluated exactly once in its respective validation fold. Table 10 reports the sample distribution (), precision, recall, -score, and continuous prediction errors (both MAE and RMSE) for all 40 Turkish food categories.
Table 10.
Pooled out-of-fold per-class classification metrics, sample distribution (), and physical quantity estimation errors across all 22,070 images ().
Mechanistic Analysis of Per-Class Mass Error Bimodality: An examination of per-class physical quantity regression in Table 10 reveals two distinct performance regimes for reference mass estimation. Specific baked goods, pastries, and syrup-based confectionery (Baklava, Gözleme, Kadayıf, Pastane Poğaçası, Revani, Tulumba Tatlısı, and Şekerpare) demonstrate near-zero mass errors ( g; g). Conversely, composite savory dishes, broths, and stews (Adana Kebap, Aşure, Beyaz Ekmek, Kuru Fasulye) exhibit errors clustering systematically around g MAE and g RMSE.
This behavior originates directly from the analytical formulation of the apparent macronutrient density index (Equation (2)) and its interaction with the physics consistency constraint (Equation (15)). The reference nutritional records characterize dry macronutrient components () without an explicit, measured water fraction. For low-moisture pastries and dense confections, dry macronutrients constitute the vast majority of the physical dish mass; hence, the apparent density closely approximates the true physical bulk density. In these categories, the volume-derived mass estimate (Equation (9)) naturally aligns with the 100 g standardized mass target, allowing both the direct continuous regression loss and the physics penalty to converge simultaneously near zero residual.
In contrast, water-rich cooked meals, legumes, and soups contain substantial moisture fractions (frequently by weight) that do not contribute to dry macronutrient mass. Because reflects dry solids rather than true bulk liquid displacement, an intrinsic scaling discrepancy emerges between the empirical reference volume and the macroscopic reference mass. During multi-task backpropagation, the physics objective pulls the mass prediction toward , while pulls it toward the 100 g ground truth. Bound by the residual limit and adaptive gating , the network settles at a constrained Pareto equilibrium, resulting in the observed g RMSE plateau across moisture-rich classes.
The pooled out-of-fold results provide an unbiased assessment across the complete 22,070-image dataset, demonstrating robust recognition performance () across 32 of the 40 classes. Across all 40 categories in the unified out-of-fold confusion matrix, the global unweighted Macro- is 93.71%, whereas the sample-weighted is 93.73% (aligning closely with the cross-validation Macro- mean of 93.14% ± 0.59% and Weighted- mean of 94.16% ± 0.36% reported in Table 6). The strongest discrimination is achieved for dishes with characteristic visual morphology, such as Mantı (), Yaprak Sarma (), Baklava (), and Çiğ Köfte (). Conversely, three categories exhibit notable difficulty across validation folds due to morphological and textural overlap: İskender Kebap (), Mısır Ekmeği (), and Tarhana Çorbası (). These failure modes are analyzed in detail in the confusion analysis below (Figure 5).
Figure 5.
Normalized pooled out-of-fold confusion matrix displaying 15 representative Turkish food categories alongside an aggregated category representing the remaining 25 classes (threshold ). Strong diagonal values demonstrate robust recognition, while localized off-diagonal confusions reflect shared culinary components and visual textures.
To provide visual insight into model classification behavior across all pooled validation instances, the above figure (Figure 5) illustrates the normalized out-of-fold confusion matrix highlighting 15 representative dishes alongside an aggregated group comprising the remaining 25 classes. The model exhibits dominant diagonal alignment across individual categories, including Aşure (99%), Baklava (99%), Gözleme (99%), Börek (98%), Hamburger (98%), Beyaz Ekmek (96%), Bulgur Pilavı (96%), and Adana Kebap (94%). Inter-class error patterns cluster systematically around shared preparation methods and morphological traits:
- 1.
- Shredded Pastry and Syrup Desserts: A prominent bidirectional confusion appears between Kadayıf and Künefe, where 13% of true Kadayıf instances are classified as Künefe, and 6% of Künefe instances are predicted as Kadayıf. Both dishes share identical baked shredded phyllo dough (tel kadayıf) surfaces soaked in sugar syrup, differing primarily by internal cheese filling that remains largely concealed beneath the crust in monocular images.
- 2.
- Traditional Pureed Soups: A noticeable off-diagonal interaction occurs between Ezogelin Çorbası and Tarhana Çorbası; 11% of Ezogelin Çorbası samples are predicted as Tarhana Çorbası, while 6% of Tarhana Çorbası images are predicted as Ezogelin Çorbası. This overlap is driven by their matching reddish–orange puree color palettes, serving bowls, and surface garnishes of dried mint and chili oil.
- 3.
- Cereal and Bread Profiles: Mısır Ekmeği (cornbread, 74.5% recall) exhibits misclassifications into Beyaz Ekmek (9%) and Esmer Ekmek (5%), while Esmer Ekmek has a 6% misclassification rate into Beyaz Ekmek, resulting from shared baked crust tones and slicing orientations.
- 4.
- Meat and Kebab Preparations: İskender displays an 8% misclassification into Adana Kebap alongside minor leakage into the aggregated class, which is attributable to shared grilled meat textures and red tomato–pepper sauces.
These visually ambiguous cases are captured by our confidence-calibrated routing mechanism, which generates multi-candidate conformal prediction sets () and triggers elevated regression uncertainty flags, routing such instances to professional dietitian verification rather than recording unverified nutritional data.
5.7. Confidence-Aware Referral and Multidisciplinary Escalation
The confidence-aware evaluation was conducted on a predefined held-out evaluation cohort of images (stratified with 10–11 images per dish category across all 40 classes). All calibration parameters and decision thresholds were fitted strictly on an independent calibration partition and fixed prior to evaluation, preventing parameter leakage or threshold optimization on the evaluation data.
Conformal prediction was evaluated at a nominal significance level of ( target coverage). As summarized in Table 11, the framework attained an empirical conformal coverage of 91.43% (384 of 420 true class labels contained within ) with a compact average prediction-set size of 1.24 classes. Post hoc temperature scaling demonstrated calibrated continuous posteriors, yielding an Expected Calibration Error (ECE) of 0.036 and a multi-class Brier score of 0.071. Across the complete 420-sample evaluation split, the model correctly identified 396 instances, corresponding to an overall subset Top-1 classification accuracy of 94.29% (closely mirroring the dataset-wide 4-fold cross-validation mean of 94.39% in Table 6).
Table 11.
Calibration and selective-prediction performance on the held-out 420-image evaluation subset (). Thresholds were fitted on an independent calibration split ().
Selective-prediction analysis evaluated whether the dual uncertainty routing policy () effectively separates reliable predictions from error-prone instances. At the predefined operating threshold, 320 of the 420 cases were accepted for autonomous recording, while 100 cases were flagged for clinical review, representing an acceptance rate of 76.19% and a referral rate of 23.81%. The accepted cohort achieved a high classification accuracy of 96.25% (308 of 320 correct), which was accompanied by reduced physical regression errors: a volume RMSE of 2.74 mL, mass RMSE of 27.35 g, and energy RMSE of 52.30 kcal.
In contrast, the 100 referred cases exhibited marked degradation across both classification and physical estimation heads. Within this flagged subset, classification accuracy dropped to 88.00% (88 of 100 correct), while prediction error increased substantially to 3.74 mL for volume RMSE, 38.62 g for mass RMSE, and 73.40 kcal for energy RMSE. Decomposing the referral triggers revealed that 39 cases presented categorical ambiguity with multi-candidate conformal sets (), whereas the remaining 61 instances had singleton classification predictions () but exceeded the heteroscedastic log-variance threshold . This error concentration indicates that the gating mechanism successfully intercepts ambiguous dishes and high-variance continuous projections before they reach the patient record.
The error-versus-coverage trajectory illustrated in Figure 6 further validates this behavior. Progressively restricting predictions to the most confident samples yielded monotonic improvements in precision: at 50% retained coverage, the RMSE values were 2.31 mL, 24.65 g, and 46.85 kcal for volume, mass, and energy, respectively, progressively scaling to 3.01 mL, 30.41 g, and 58.02 kcal at 100% coverage (converging with the 4-fold dataset means of 3.01 mL, 30.17 g, and 57.55 kcal).
Figure 6.
Error-versus-coverage analysis for reference-volume prediction. Regression RMSE is shown as a function of retained prediction coverage.
Collectively, the empirical coverage, set size, ECE, Brier score, and coverage-error curves provide a comprehensive assessment of the calibration behavior beyond the referral rate alone. The 23.81% referral rate represents the operating point of this selective-prediction policy rather than a direct guarantee of clinical safety. Within AIDCare, flagged records are queued for dietitian and multidisciplinary verification, maintaining PC2FoodNet strictly as clinical decision support.
Figure 6 illustrates the error-versus-coverage relationship for continuous volume estimation. By ordering evaluation instances from lowest to highest uncertainty, the profile shows the progressive error penalty incurred as lower-confidence predictions are admitted into the automated decision pipeline, demonstrating the efficacy of selective referral for safeguarding automated dietary logs.
6. Discussion and Study Limitations
For standardized physical and nutritional reference prediction, the corresponding mean RMSE values were 3.01 ± 0.28 mL for reference volume, 30.17 ± 1.04 g for reference mass, and 57.55 ± 1.58 kcal for reference energy. The central contribution is the integration of class-level macronutrient priors into a differentiable inference chain. By propagating the full class probability distribution into the physical prior calculation, constraining the dependency order of volume, weight, and energy, and incorporating learnable soft fusion gates, the network addresses key limitations of conventional food-computing systems [7,8,9].
On the 40-class Turkish Food Dataset (22,070 images), 4-fold stratified cross-validation demonstrated consistent classification performance across folds with a mean Top-1 accuracy of 94.39% ± 0.47%, Top-5 accuracy of 98.90% ± 0.18%, Macro- of 93.14% ± 0.59%, and Weighted- of 94.16% ± 0.36%. For physical quantity estimation, the corresponding mean RMSE values were 3.01 ± 0.28 mL for volume, 30.17 ± 1.04 g for weight, and 57.55 ± 1.58 kcal for energy. The best individual fold (Fold 4) achieved RMSE values of 2.72 mL, 29.11 g, and 55.84 kcal for volume, weight, and energy, respectively. The relatively small fold-to-fold variation across the classification and regression metrics indicates stable model behavior under different training–validation partitions.
The quantitative findings can be considered alongside previous food recognition and dietary assessment studies. Earlier approaches have primarily addressed individual components of the estimation process, including large-scale food classification [23], portion selection using food-photograph series [26], intake estimation from pre- and post-meal images [27], bowl geometry and fullness modeling [28], monocular three-dimensional food reconstruction [29], and scale recovery using physical reference objects [30]. In comparison, PC2FoodNet combines food recognition with linked volume, mass, and energy prediction within a unified multi-task framework. The mean Top-1 accuracy of 94.39%, Top-5 accuracy of 98.90%, Macro- of 93.14%, and Weighted- of 94.16% demonstrate consistent food recognition performance on the present 40-class dataset, while the corresponding regression results extend the evaluation to three linked physical quantity outputs.
The interpretation of the continuous results is further constrained by the reference-target formulation used in the present dataset. Since the reference mass is fixed at 100 g for every image, a constant 100 g predictor provides a zero-RMSE baseline for the mass target. Accordingly, the mass RMSE reported for PC2FoodNet should be viewed as a measure of the model’s agreement with the standardized reference target rather than as evidence of superiority in estimating the actual mass of the depicted food portion. The same distinction applies to volume and energy, for which the targets are derived from category-level density and energy-density priors. These considerations indicate that the current experiments primarily evaluate food recognition and the technical behavior of a physics-informed, category-conditioned reference-prediction framework, while image-specific portion estimation requires independently measured physical ground truth.
Numerical comparisons with previous quantitative studies require a consideration of methodological differences, as reported results can vary substantially according to the datasets, food categories, image acquisition conditions, input modalities, scale recovery mechanisms, and ground-truth definitions employed [8,10,11,12,24]. In particular, several previous portion and volume estimation approaches rely on image-specific measurements, geometric reconstruction, controlled imaging protocols, or physical reference objects, whereas the volume, mass, and energy targets in this paper were derived from standardized category-level references anchored to a 100 g reference portion. Accordingly, the reported RMSE values of 3.01 mL for volume, 30.17 g for mass, and 57.55 kcal for energy characterize the agreement between the model predictions and the standardized reference targets adopted in this paper’s framework. These values therefore provide a quantitative assessment within the defined experimental setting, while differences in target construction and estimation methodology limit direct equivalence with image-specific portion estimation errors reported in other studies.
In the AIDCare platform, integrating the nutrition and diet Module () and the exercise module under a nutrition professional-in-the-loop architecture provides coordinated support across lifestyle domains. Standalone digital mHealth applications can suffer from patient attrition or clinical misalignment when automated algorithms provide unmonitored recommendations. By embedding nutrition professionals, physiotherapists, and psychotherapists directly into the decision workflow, AIDCare supports personalized and professionally governed care. Dietitians can verify dietary and macronutrient estimates; physiotherapists guide exercise planning and ensure movement safety; and psychotherapists address behavioral barriers to exercise adherence and dietary consistency. By keeping diet and exercise records uncoupled from automated caloric compensation rules, the system avoids feedback loops in which uncertain calorie predictions automatically trigger inappropriate exercise prescriptions [16,17].
The confidence-aware referral mechanism further supports the human-in-the-loop workflow by identifying predictions associated with classification ambiguity or elevated regression uncertainty and routing them for professional review. The expanded uncertainty analysis provides a more informative assessment of selective prediction than the referral rate alone. By separating calibration from final evaluation and reporting the empirical conformal coverage, average prediction-set size, probabilistic calibration, error-versus-coverage behavior, and accepted-versus-referred performance, the revised analysis characterizes the operating behavior of the confidence mechanism without equating referral frequency with clinical safety. Nevertheless, the uncertainty evaluation remains retrospective and is based on a limited evaluation subset; prospective validation with independently measured clinical and physical outcomes is required before the referral mechanism can be considered a clinically validated safety strategy.
The baseline and ablation analyses provide additional context for interpreting the contribution of PC2FoodNet. The class-level lookup experiments demonstrate that a substantial component of the task is inherently associated with the standardized category-level reference formulation, while the comparison with predicted-category lookup and EfficientNet-based alternatives evaluates the additional role of image-based classification. The independent-head ablation further indicates the contribution of incorporating the physical inference constraints into the multi-task formulation. Similarly, the comparisons between hard-class and probability-weighted priors, together with the component ablations, indicate that retaining probabilistic category information and the proposed residual, uncertainty, and adaptive fusion components can improve the consistency of the reference-target predictions. These findings should be interpreted within the reference-based target definition of this paper and do not establish image-specific portion measurement accuracy.
Backbone Architecture Selection and Mobile Edge Deployment: In designing PC2FoodNet as the dietary analysis engine for the AIDCare mHealth platform, the choice of vision backbone balances representation capacity against deployment feasibility on mobile devices. Although larger vision models such as Vision Transformers (ViT-B/16, Swin-B) or heavy convolutional backbones (EfficientNetV2-L/XL) have shown marginal accuracy gains on general benchmarks, their large parameter scale (86 M–300 M parameters, >15 GFLOPs, >120 ms inference latency on mobile hardware) creates severe latency bottlenecks and excessive battery consumption during interactive meal logging. In contrast, EfficientNetV2-S achieves an optimal Pareto trade-off with only 21.5 M parameters and 8.4 GFLOPs, sustaining sub-35 ms mobile inference latency while delivering 94.39% Top-1 accuracy and 98.90% Top-5 accuracy across the 40 Turkish food categories. This efficiency enables real-time on-device feedforward evaluation and responsive triage without mandatory cloud dependency.
This paper has several technical and data-related limitations. First, although the Turkish Food Dataset provides 22,070 images across 40 classes, the volume, mass, and energy targets used for continuous physical quantity regression were derived from standardized category-level references anchored to a 100 g reference portion () rather than independently measured for each food image. Because the reference mass is fixed at 100 g, a constant 100 g predictor achieves an RMSE of 0 g for the mass target. Consequently, the reported regression metrics should be interpreted as agreement with standardized category-level reference targets rather than as a direct validation of image-specific portion estimation. Because the modeling framework incorporates category-level physical and nutritional priors, part of the observed regression performance may reflect these structured priors in addition to the visual information extracted from the images.
This structural limitation is clearly manifested in the bimodal mass error distribution observed across categories in Table 10. While the physics-constrained inference chain effectively regularizes dry, low-moisture preparations, dishes characterized by elevated water content experience an inherent tension between the unmeasured moisture mass and the apparent density index . Future extensions must incorporate dish-specific hydration priors or learn an empirical moisture adjustment coefficient per culinary preparation to prevent this artificial density offset from constraining mass convergence.
Second, the dataset comprises single, isolated dishes rather than complex mixed meals, hidden ingredients, or heavy plate occlusions. Third, a single uncalibrated RGB image does not inherently provide absolute metric scale or depth. Therefore, PC2FoodNet does not perform direct three-dimensional metric reconstruction from image geometry alone, and the resulting volume estimates should be interpreted as reference-based physical quantity predictions informed by learned visual representations together with food-category information and class-level physical priors. Fourth, clinical outcomes, user adherence, and long-term glycemic effects were not evaluated in this technical study. Consequently, the reported model performance should not be interpreted as evidence of clinical effectiveness or improved diabetes outcomes.
Future work will validate the framework using datasets containing independently measured image-specific volume, mass, and energy values under diverse real-world imaging conditions. It may expand evaluation to multi-item mixed meals, incorporate depth sensing or reference objects for direct scale recovery, and conduct prospective clinical studies within the AIDCare framework to evaluate patient engagement, multidisciplinary professional agreement, and dietary/exercise logging fidelity.
7. Conclusions
This paper presented PC2FoodNet, which is an AI-based food analysis model developed as part of the AIDCare mHealth platform for diabetes lifestyle management. The proposed model combines food recognition with standardized category-conditioned physical and nutritional reference prediction while using physical food priors and uncertainty estimation to support structured dietary assessment. Instead of treating every AI prediction as equally reliable, the system identifies uncertain cases and refers them for professional review.
PC2FoodNet was evaluated on 22,070 images covering 40 Turkish food categories using 4-fold stratified cross-validation. The model achieved a mean Top-1 accuracy of 94.39% ± 0.47% and Top-5 accuracy of 98.90% ± 0.18%. The corresponding Macro- and Weighted- scores were 93.14% ± 0.59% and 94.16% ± 0.36%, respectively. For physical quantity estimation, the model achieved mean RMSE values of 3.01 ± 0.28 mL for volume, 30.17 ± 1.04 g for mass, and 57.55 ± 1.58 kcal for energy across the four folds. The best individual fold achieved RMSE values of 2.72 mL, 29.11 g, and 55.84 kcal for volume, mass, and energy, respectively. These results demonstrate consistent food recognition and a technically structured prediction of standardized category-level physical and nutritional reference quantities within the evaluated experimental setting. The validation of actual image-specific portion mass, volume, and energy estimation requires independently measured physical ground-truth data and remains an important direction for future work.
Within AIDCare, the nutrition and diet module is coordinated with an expert-guided exercise module and multidisciplinary professional support. Nutrition professionals review uncertain dietary estimates, physiotherapists supervise individualized exercise planning, and psychotherapists support behavioral adherence. This nutrition professional-in-the-loop design keeps AI in a decision-support role rather than replacing professional care. The proposed framework provides a practical foundation for safer and more personalized digital lifestyle support for people with diabetes.
Author Contributions
Conceptualization, M.J., A.K., M.R., E.G. and A.B.İ.; methodology, M.J., M.R., E.G. and A.B.İ.; software, M.J.; validation, M.J. and A.K.; formal analysis, M.J.; investigation, M.J. and A.K.; resources, A.K., G.S. and H.F.; data curation, M.J.; writing—original draft preparation, M.J., M.R., E.G. and A.B.İ.; writing—review and editing, A.K., H.F. and G.S.; visualization, M.J.; supervision, A.K., G.S. and H.F. All authors have read and agreed to the published version of the manuscript.
Funding
This paper was supported in part by the Excellence in Production Research Framework through XPRES (Excellence in Production Research), the R2Microgrid project under the RESILIENT Competence Center, financed by the Swedish Energy Agency and co-financed by Mälardalen University and industrial partners, the Turkish Health Institutes (TÜSEB) under Grant No. 33987, and Kocaeli University Scientific Research Projects Division (KOU-BAP) under Grant Nos. FKA-2026-5195 and FBA-2026-4982.
Institutional Review Board Statement
Ethical review and approval were not required because this study reports technical model development using food images and reference physical measurements and did not involve a prospective clinical intervention, identifiable patient data, or patient outcomes.
Informed Consent Statement
Not applicable. The study did not involve human participants or identifiable personal or health information.
Data Availability Statement
The model code, training implementation, derived metrics, and evaluation scripts supporting this paper are openly available on GitHub at https://github.com/Jamil226/PC2FoodNet-Paper, accessed on 22 September 2026. The food image dataset is available from the corresponding author upon reasonable request subject to data-use and ownership restrictions.
Acknowledgments
AI tools, including Gemini Pro 3.1 and Grammarly, were used only to improve grammar, spelling, and language clarity. No part of the research design, implementation, experimental analysis, results generation, or scientific interpretation was generated by these tools. All technical and intellectual contributions in this manuscript were made by the authors.
Conflicts of Interest
The authors declare no conflict of interest.
References
- American Diabetes Association Professional Practice Committee. 5. Facilitating Positive Health Behaviors and Well-Being to Improve Health Outcomes: Standards of Care in Diabetes—2025. Diabetes Care 2025, 48, S86–S127, Erratum in Diabetes Care 2025, 48, 665. https://doi.org/10.2337/dc25-er04a. [Google Scholar] [CrossRef] [Scilit] [PubMed]
- Liang, Z.; Zhang, M.; Wang, C.; Hao, F.; Yu, Y.; Tian, S.; Yuan, Y. The Best Exercise Modality and Dose to Reduce Glycosylated Hemoglobin in Patients with Type 2 Diabetes: A Systematic Review with Pairwise, Network, and Dose–Response Meta-Analyses. Sport. Med. 2024, 54, 2557–2570. [Google Scholar] [CrossRef] [Scilit] [PubMed]
- Zhao, X.; Forbes, A.; Abu Ghazaleh, H.; He, Q.; Huang, J.; Asaad, M.; Cheng, L.; Duaso, M. Interventions and Behaviour Change Techniques for Improving Physical Activity Level in Working-Age People (18–60 Years) with Type 2 Diabetes: A Systematic Review and Network Meta-Analysis. Int. J. Nurs. Stud. 2024, 160, 104884. [Google Scholar] [CrossRef] [Scilit] [PubMed]
- Xue, H.; Zhang, L.; Shi, Y.; Zhang, H.; Zhang, C.; Liu, Y.; Tan, W.; Liu, Y. The Effectiveness of Digital Health Intervention on Glycemic Control and Physical Activity in Patients with Type 2 Diabetes: A Systematic Review and Meta-Analysis. Front. Digit. Health 2025, 7, 1630588. [Google Scholar] [CrossRef] [Scilit] [PubMed]
- Zhang, D.; Huang, J.; Zhang, Y.; Wei, Z.; Long, T.; Guo, X.; Li, M. Effects of Continuous Glucose Monitoring on Dietary Behavior and Physical Activity: A Systematic Review and Meta-Analysis. Diabetes Res. Clin. Pract. 2025, 229, 112907. [Google Scholar] [CrossRef] [Scilit] [PubMed]
- Tarricone, R.; Petracca, F.; Svae, L.; Cucciniello, M.; Ciani, O. Which Behaviour Change Techniques Work Best for Diabetes Self-Management Mobile Apps? Results from a Systematic Review and Meta-Analysis of Randomised Controlled Trials. eBioMedicine 2024, 103, 105091. [Google Scholar] [CrossRef] [Scilit] [PubMed]
- Zheng, J.; Wang, J.; Shen, J.; An, R. Artificial Intelligence Applications to Measure Food and Nutrient Intakes: Scoping Review. J. Med. Internet Res. 2024, 26, e54557. [Google Scholar] [CrossRef] [Scilit] [PubMed]
- Shonkoff, E.; Cara, K.C.; Pei, X.A.; Chung, M.; Kamath, S.; Panetta, K.; Hennessy, E. AI-Based Digital Image Dietary Assessment Methods Compared to Humans and Ground Truth: A Systematic Review. Ann. Med. 2023, 55, 2273497. [Google Scholar] [CrossRef] [Scilit] [PubMed]
- Phalle, A.; Gokhale, D. Navigating Next-Gen Nutrition Care Using Artificial Intelligence-Assisted Dietary Assessment Tools—A Scoping Review of Potential Applications. Front. Nutr. 2025, 12, 1518466. [Google Scholar] [CrossRef] [Scilit] [PubMed]
- Kaushal, S.; Tammineni, D.K.; Rana, P.; Sharma, M.; Sridhar, K.; Chen, H.H. Computer Vision and Deep Learning-Based Approaches for Detection of Food Nutrients/Nutrition: New Insights and Advances. Trends Food Sci. Technol. 2024, 146, 104408. [Google Scholar] [CrossRef] [Scilit]
- Konstantakopoulos, F.S.; Georga, E.I.; Fotiadis, D.I. A Review of Image-Based Food Recognition and Volume Estimation Artificial Intelligence Systems. IEEE Rev. Biomed. Eng. 2024, 17, 136–152. [Google Scholar] [CrossRef] [Scilit] [PubMed]
- Liu, D.; Zuo, E.; Wang, D.; He, L.; Dong, L.; Lu, X. Deep Learning in Food Image Recognition: A Comprehensive Review. Appl. Sci. 2025, 15, 7626. [Google Scholar] [CrossRef] [Scilit]
- American Diabetes Association Professional Practice Committee. 7. Diabetes Technology: Standards of Care in Diabetes—2025. Diabetes Care 2025, 48, S146–S166, Erratum in Diabetes Care 2025, 48, 666. https://doi.org/10.2337/dc25-er04b. [Google Scholar] [CrossRef] [Scilit] [PubMed]
- Moschonis, G.; Siopis, G.; Jung, J.; Eweka, E.; Willems, R.; Kwasnicka, D.; Asare, B.Y.A.; Kodithuwakku, V.; Verhaeghe, N.; Vedanthan, R.; et al. Effectiveness, Reach, Uptake, and Feasibility of Digital Health Interventions for Adults with Type 2 Diabetes: A Systematic Review and Meta-Analysis of Randomised Controlled Trials. Lancet Digit. Health 2023, 5, e125–e143. [Google Scholar] [CrossRef] [Scilit] [PubMed]
- Nguyen, V.; Ara, P.; Simmons, D.; Osuagwu, U.L. The Role of Digital Health Technology Interventions in the Prevention of Type 2 Diabetes Mellitus: A Systematic Review. Clin. Med. Insights Endocrinol. Diabetes 2024, 17, 11795514241246419. [Google Scholar] [CrossRef] [Scilit] [PubMed]
- Ouanes, K.; Farhah, N. Effectiveness of Artificial Intelligence (AI) in Clinical Decision Support Systems and Care Delivery. J. Med. Syst. 2024, 48, 74. [Google Scholar] [CrossRef] [Scilit] [PubMed]
- Wilhelm, C.; Steckelberg, A.; Rebitschek, F.G. Benefits and Harms Associated with the Use of AI-Related Algorithmic Decision-Making Systems by Healthcare Professionals: A Systematic Review. Lancet Reg. Health 2025, 48, 101145. [Google Scholar] [CrossRef] [Scilit] [PubMed]
- Diez Alvarez, S.; Fellas, A.; Wynne, K.; Santos, D.; Sculley, D.; Acharya, S.; Navathe, P.; Gironès, X.; Coda, A. The Role of Smartwatch Technology in the Provision of Care for Type 1 or 2 Diabetes Mellitus or Gestational Diabetes: Systematic Review. JMIR MHealth UHealth 2024, 12, e54826. [Google Scholar] [CrossRef] [Scilit] [PubMed]
- Albalawi, H.F.A. The Role of Tele-Exercise for People with Type 2 Diabetes: A Scoping Review. Healthcare 2024, 12, 917. [Google Scholar] [CrossRef] [Scilit] [PubMed]
- Doré, B.; Gaudreault, A.; Everard, G.; Ayena, J.C.; Abboud, A.; Robitaille, N.; Batcho, C.S. Acceptability, Feasibility, and Effectiveness of Immersive Virtual Technologies to Promote Exercise in Older Adults: A Systematic Review and Meta-Analysis. Sensors 2023, 23, 2506. [Google Scholar] [CrossRef] [Scilit] [PubMed]
- Bilika, P.; Karampatsou, N.; Stavrakakis, G.; Paliouras, A.; Theodorakis, Y.; Strimpakos, N.; Kapreli, E. Virtual Reality-Based Exercise Therapy for Patients with Chronic Musculoskeletal Pain: A Scoping Review. Healthcare 2023, 11, 2412. [Google Scholar] [CrossRef] [Scilit] [PubMed]
- Vecchio, M.; Chiaramonte, R.; Buccheri, E.; Tomasello, S.; Leonforte, P.; Rescifina, A.; Ammendolia, A.; Longo, U.G.; de Sire, A. Metaverse-Aided Rehabilitation: A Perspective Review of Successes and Pitfalls. J. Clin. Med. 2025, 14, 491. [Google Scholar] [CrossRef] [Scilit] [PubMed]
- Min, W.; Wang, Z.; Liu, Y.; Luo, M.; Kang, L.; Wei, X.; Wei, X.; Jiang, S. Large Scale Visual Food Recognition. IEEE Trans. Pattern Anal. Mach. Intell. 2023, 45, 9932–9949. [Google Scholar] [CrossRef] [Scilit] [PubMed]
- Chotwanvirat, P.; Prachansuwan, A.; Sridonpai, P.; Kriengsinyos, W. Advancements in Using AI for Dietary Assessment Based on Food Images: Scoping Review. J. Med. Internet Res. 2024, 26, e51432. [Google Scholar] [CrossRef] [Scilit] [PubMed]
- Lo, F.P.W.; Qiu, J.; Wang, Z.; Chen, J.; Xiao, B.; Yuan, W.; Giannarou, S.; Frost, G.; Lo, B. Dietary Assessment with Multimodal ChatGPT: A Systematic Analysis. IEEE J. Biomed. Health Inform. 2024, 28, 7577–7587. [Google Scholar] [CrossRef] [Scilit] [PubMed]
- Sharma, V.; Chadha, R. Development and Evaluation of Food Photograph Series Software for Portion Size Estimation among Urban North Indian Adults. Mediterr. J. Nutr. Metab. 2023, 16, 293–312. [Google Scholar] [CrossRef] [Scilit]
- Kim, J.H.; Lee, D.S.; Kwon, S.K. Food Classification and Meal Intake Amount Estimation through Deep Learning. Appl. Sci. 2023, 13, 5742. [Google Scholar] [CrossRef] [Scilit]
- Jia, W.; Li, B.; Xu, Q.; Chen, G.; Mao, Z.H.; McCrory, M.A.; Baranowski, T.; Burke, L.E.; Lo, B.; Anderson, A.K.; et al. Image-Based Volume Estimation for Food in a Bowl. J. Food Eng. 2024, 372, 111943. [Google Scholar] [CrossRef] [Scilit] [PubMed]
- Shao, Z.; Vinod, G.; He, J.; Zhu, F. An End-to-End Food Portion Estimation Framework Based on Shape Reconstruction from Monocular Image. In Proceedings of the 2023 IEEE International Conference on Multimedia and Expo (ICME), Brisbane, Australia, 10–14 July 2023; pp. 942–947. [Google Scholar] [CrossRef] [Scilit]
- Magid, B.; Ibrahim, M.; Kawashti, Y.A.; Mohamed, M.; Sabry, M.; Hindy, H.; Khaled, M.; Mohamed, W. CalorieMe: An Image-Based Calorie Estimator System. In Proceedings of the 2023 Eleventh International Conference on Intelligent Computing and Information Systems (ICICIS), Cairo, Egypt, 21–23 November 2023; pp. 555–560. [Google Scholar] [CrossRef] [Scilit]
- Gautam, S.; Patnaik, S.S.; Kush, R.; Pantola, D.; Mishra, V.K. Enhancing Food Analysis with Attention-Based Deep Learning: Ingredients, Recipes, and Calorie Estimation. Procedia Comput. Sci. 2025, 260, 692–700. [Google Scholar] [CrossRef] [Scilit]
- Nogay, H.S.; Nogay, N.H.; Adeli, H. Image-Based Food Groups and Portion Prediction by Using Deep Learning. J. Food Sci. 2025, 90, e70116. [Google Scholar] [CrossRef] [Scilit] [PubMed]
- Saad, A.M.; Rahi, M.R.H.; Islam, M.M.; Rabbani, G. Diet Engine: A Real-Time Food Nutrition Assistant System for Personalized Dietary Guidance. Food Chem. Adv. 2025, 7, 100978. [Google Scholar] [CrossRef] [Scilit]
- Velombe, J.C.; Bayraktar, S.; Kavak, A.; Jamil, M.; İnner, A.B.; Srivastava, G.; Fotouhi, H. A Hybrid CNN–MLLM Architecture for Image-Based Nutrition Estimation and Advisory Insulin Decision Support in Type 1 Diabetes. Nutrients 2026, 18, 2205. [Google Scholar] [CrossRef] [Scilit] [PubMed]
- Göz, F.; Jamil, M.; Kavak, A.; Bayraktar, S.; Doğru, A.C.; Srivastava, G.; Fotouhi, H. A Confidence-Aware Hybrid Vision–Language Framework for Food Recognition and Nutritional Monitoring. Nutrients 2026, 18, 2449. [Google Scholar] [CrossRef] [Scilit] [PubMed]
- Cheng, S.T.; Lyu, Y.J.; Teng, C. Image-Based Nutritional Advisory System: Employing Multimodal Deep Learning for Food Classification and Nutritional Analysis. Appl. Sci. 2025, 15, 4911. [Google Scholar] [CrossRef] [Scilit]
- Puruncaja, D.M.D.; Naranjo, W.P.P. Development of Software for Predicting the Thermophysical Properties of Foods Based on Their Composition Using the Choi–Okos Model. Int. J. Spec. Educ. 2026, 41, 11–18. [Google Scholar]
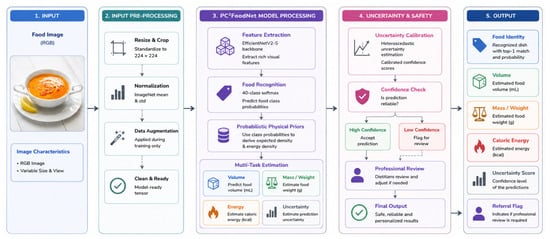
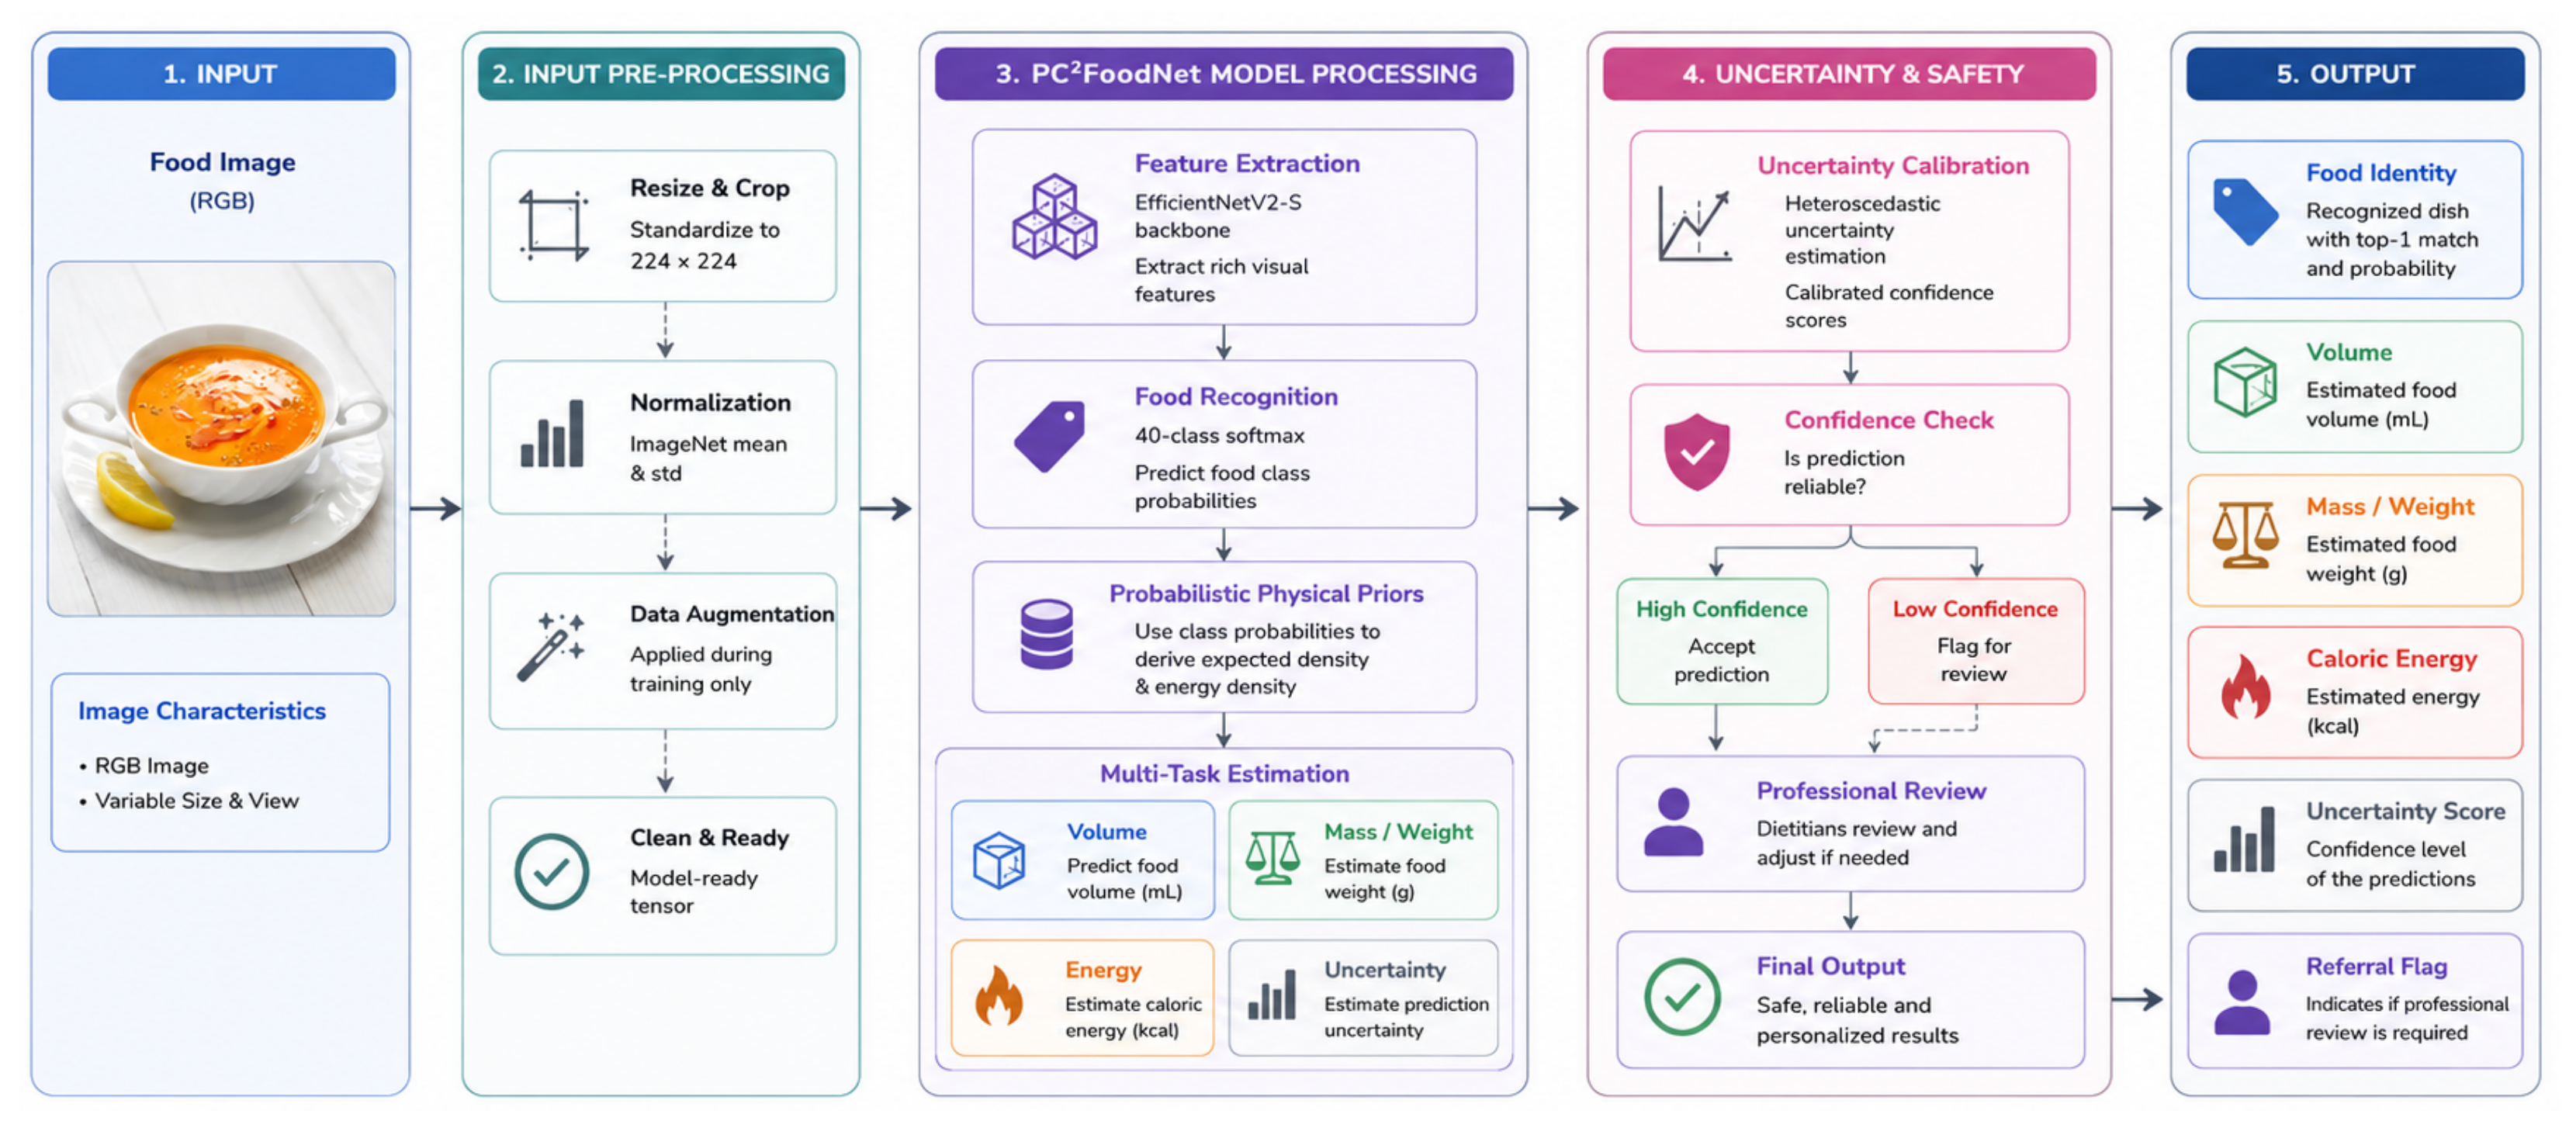






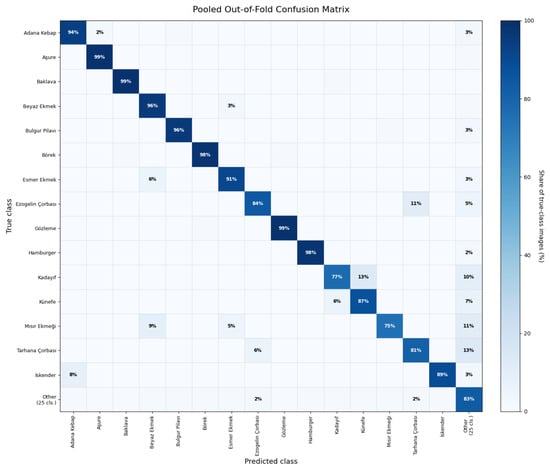
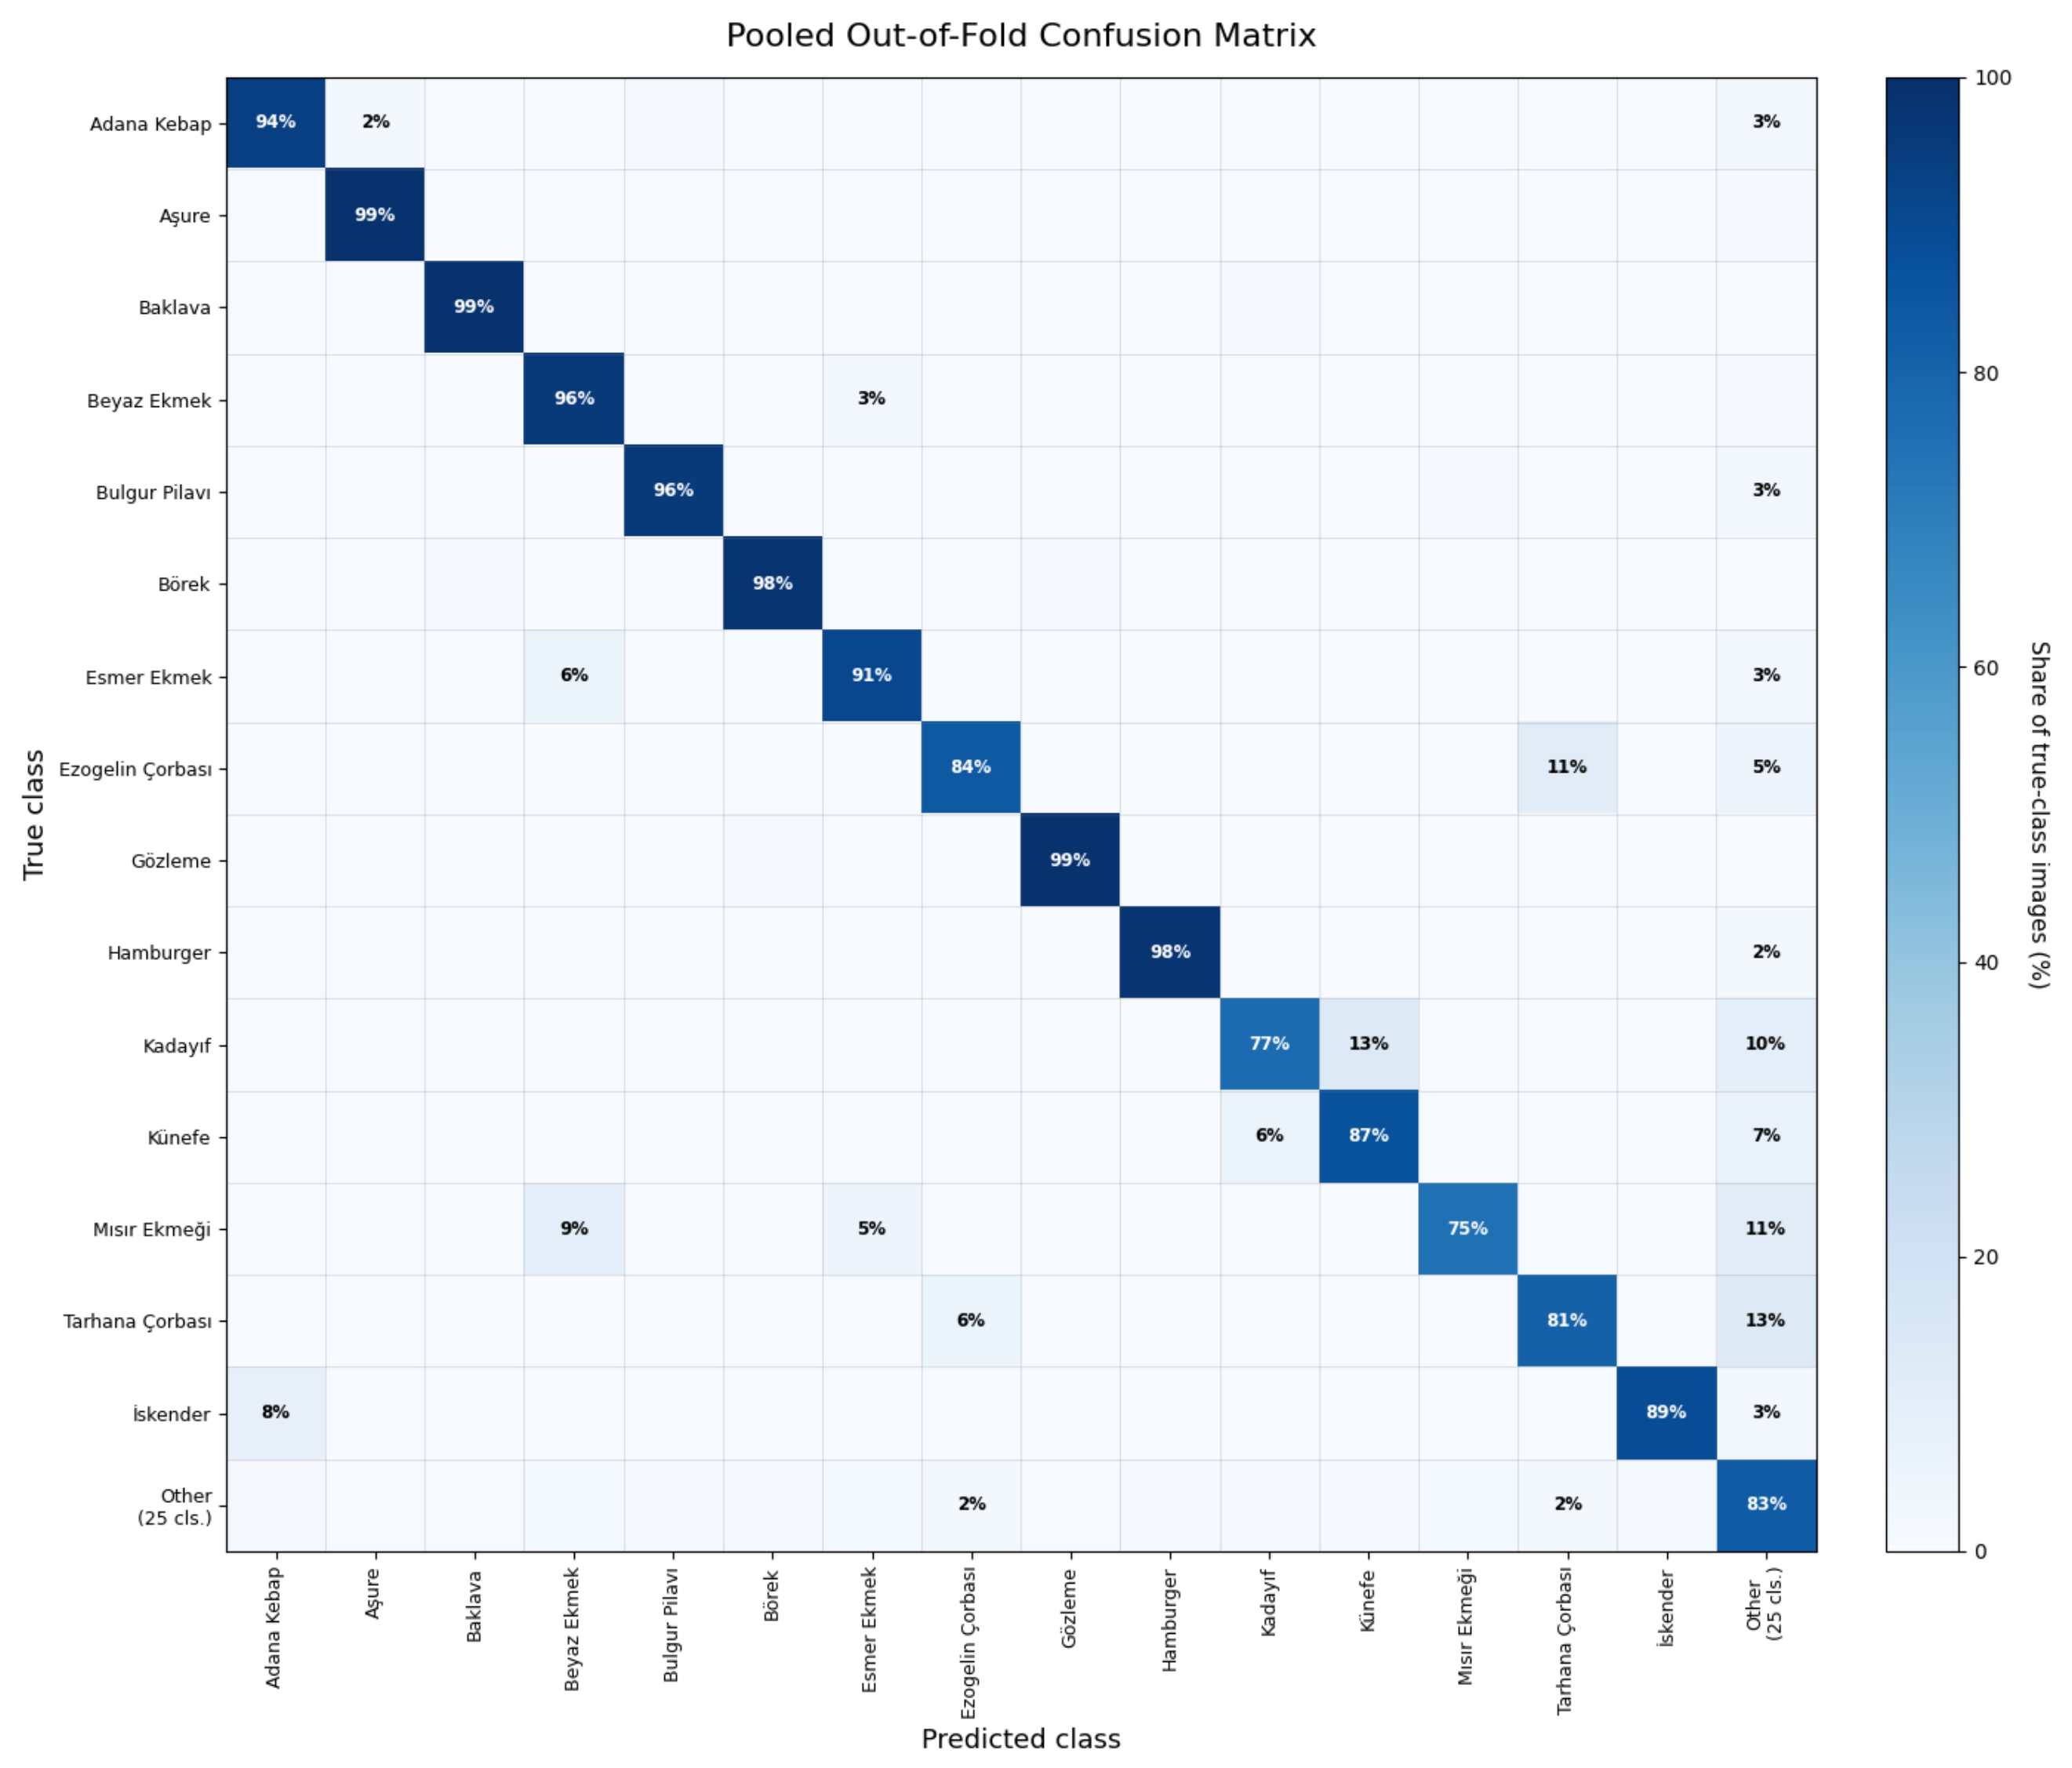
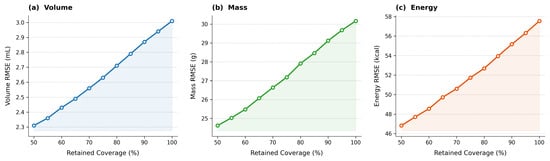
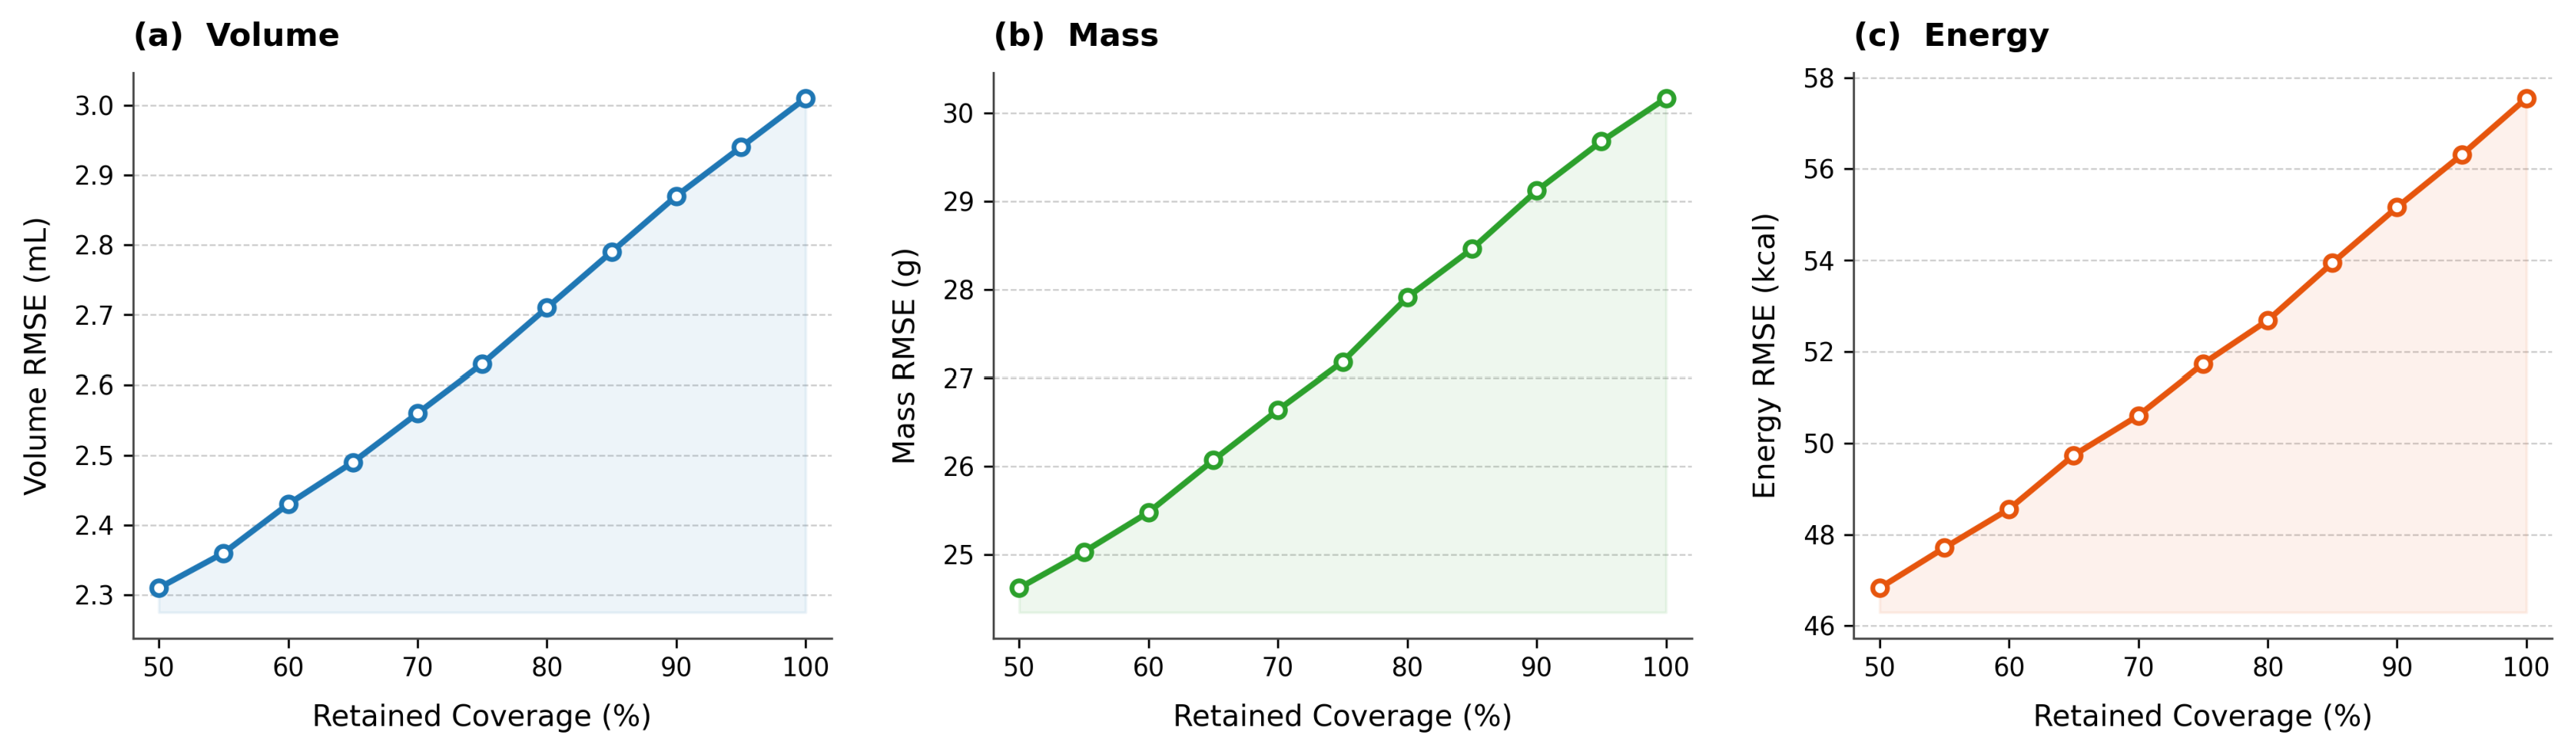

Disclaimer/Publisher’s Note: The statements, opinions and data contained in all publications are solely those of the individual author(s) and contributor(s) and not of MDPI and/or the editor(s). MDPI and/or the editor(s) disclaim responsibility for any injury to people or property resulting from any ideas, methods, instructions or products referred to in the content. |
© 2026 by the authors. Licensee MDPI, Basel, Switzerland. This article is an open access article distributed under the terms and conditions of the Creative Commons Attribution (CC BY) license.