


Abstract
Background: Fasting-mimicking diets (FMDs) induce metabolic changes associated with immunomodulation in preclinical studies, yet little is known about the effects of FMD on the human circulating immune system. Methods: In the single-arm FIND pilot study (NCT04833439), six of nine healthy participants completed two cycles of a 4-day FMD separated by 3 weeks of regular diet in a repeated-measures design. Blood samples were collected at baseline, after an overnight fast, and the morning after completion of the second FMD cycle. Peripheral blood mononuclear cells (PBMCs) were analyzed by transcriptomic profiling and spectral flow cytometry. Results: FMD was associated with reduced plasma glucose and insulin-like growth factor-1 and increased ketone levels. Transcriptomic analysis showed increased expression of genes involved in the TNFα, IFNγ and IFNα signaling pathway after two FMD cycles. Fifteen of the 39 leading-edge genes of the TNFα signature that have previously been associated with myeloid activity and rapid stress responses corresponded with the increased frequencies of circulating CD14-CD11b-CD11c+ dendritic cells (DCs), CD123+ plasmacytoid DCs, and CD14+ CD16+ intermediate monocytes. Moreover, the frequencies of HLA-DR-expressing CD4+ and CD8+ T-cells increased (p < 0.05) after two FMD cycles. Conclusions: In healthy volunteers, two cycles of FMD were associated with metabolic changes and alterations in circulating myeloid and T-cell populations consistent with activation of selected inflammatory pathways. These exploratory findings warrant larger validation studies in healthy volunteers in combination with functional analyses.
1. Introduction
Short-term fasting (STF) and particularly fasting-mimicking diets (FMDs) exert beneficial effects on disease risk factors and longevity in preclinical models [1]. It may potentiate the treatment of a broad range of chronic diseases, including cancer [1,2,3,4]. STF consists of 2–3 days of fluid-only fasting (beverages, broth, and vegetable/fruit juice up to 500 kcal/day) but has been used to describe other durations and regimens in the past [5]. FMD is a special type of fasting regimen, usually 3–7 days every few weeks or per month, with a maximum of about 1000 kcal per day, providing ≥50% of energy requirement [5]. FMD induces the metabolic effects of fasting without complete food abstinence and nutrient deprivation and is typically plant-based, low in protein and high in plant-based fats [5]. FMDs are still being developed and optimized and may therefore vary with respect to frequency, duration, calorie content, types of food used and palatability.
FMD and STF are investigated clinically as adjuncts to the treatment of a wide range of diseases, such as autoimmune diseases [6,7], neurodegenerative diseases [8,9] and cancer [10,11]. Early clinical studies suggest that FMD-induced metabolic reprogramming reduces immunosuppressive myeloid and regulatory T-cell compartments in peripheral blood, while also enhancing intratumor T helper type 1 (Th1)/cytotoxic responses and enrichment of interferon-gamma (IFNγ) signatures, and is associated with better clinical outcomes in patients with cancer [10,12,13]. A subgroup analysis, comprising a few healthy volunteers, suggested a similar effect on immune cells in the blood [10], although these data are limited. FMD and STF were used to modify cardiometabolic risk factors in the context of disease prevention [14,15,16,17] and in longevity studies on anti-aging processes [18], but little is known about the immunomodulatory effects of metabolic reprogramming by FMD in these healthy participants. This raises the question of how FMD-induced metabolic effects may affect immune cells.
FMD induces metabolic changes by reducing glucose and insulin-like growth factor-1 (IGF-1) levels in the blood. This results in downregulation of the IGF-1 receptor (IGF-1R)–AKT–mTOR pathway, which may subsequently affect immune cell metabolism and differentiation, including T-cell fate decisions [19,20,21,22]. This is particularly relevant as mTOR signaling regulates how T-cells sense and integrate immune signals from antigen-presenting cells such as dendritic cells (DCs), nutrients, and growth- and immunoregulatory factors [23]. Moreover, downregulation of the IGF-1R–AKT–mTOR pathway promotes autophagy, thereby prioritizing internal repair and supporting a process called differential stress resistance (DSR) in healthy cells [1,24]. A sub-study including 15 participants who completed three cycles of a 5-day FMD per month not only showed improved body composition with decreased total body fat, visceral adipose fat and hepatic fat mass, but also revealed an effect on immune cells, namely an increased lymphoid-to-myeloid ratio [14].
The immunomodulatory effects of STF have yet to be thoroughly explored in humans, particularly in the absence of typical confounding factors such as disease or treatment. The immune impacts of FMD outside such contexts and over time have not been systematically studied. To fill this gap, an exploratory pilot study in healthy participants undergoing two 4-day FMD cycles was conducted. Comprehensive immune profiling was performed at both the transcriptomic and protein level using peripheral blood mononuclear cells (PBMCs).
2. Materials and Methods
2.1. FIND Study
Healthy volunteers were asked to fast for two cycles using the Xentigen FMD for immune monitoring. Briefly, the main inclusion criteria were: ≥18 years old; body mass index (BMI) ≥ 18.5 and ≤25 kg/m2; no chronic diseases, allergies, or use of medication except for contraceptives during the last 12 weeks prior to inclusion. Exclusion criteria were COVID-19 infection or vaccination 6 weeks prior to or during study participation or blood/plasma donation in the last 12 weeks prior to inclusion. Toxicity was investigated at final visit using Common Terminology Criteria for Adverse Events v5.0. The study was conducted in accordance with the Declaration of Helsinki (October 2013, version 1) and approved by the Medical Ethics Committee of Leiden–The Hague–Delft in agreement with Dutch law for medical research involving human subjects and with the General Data Protection Regulation. All healthy volunteers gave written informed consent. Blood was drawn at three time points (Figure 1): at baseline (day 1, fed state), after an overnight fast (day 2, overnight-fasted) and the final blood draw took place the morning after completion of the second FMD cycle (around day 31, FMD-fasted). The FMD Xentigen™ diet (kindly provided by L-Nutra) is for four days, with 1100 kcal on day 1 followed by 240 kcal on days 2–4. Xentigen™ is plant-based, low in calories and amino acids and comprises meals (soups and broths), an energy bar, vitamin and mineral capsule, energy drink, and tea, which the participants were allowed to consume at any time of the designated day. If diet adherence was not possible due to feelings of hunger or lack of energy, an extra 0.5–1 nut bar was allowed on days 2 and 3.
Figure 1.
FIND study design. Study design, 2 cycles of a 4-day FMD with a period of about 20 days of regular diet without any restrictions. Blood sampling took place at baseline (fed state), after an overnight fast before the first day of the first FMD cycle (overnight-fasted) and the morning after completion of the second FMD cycle (FMD-fasted). FMD: fasting-mimicking diet.
2.2. Peripheral Blood Mononuclear Cells (PBMC) Isolation
Venous blood samples (~9 mL) were collected in sodium heparin collection tubes. PBMCs were isolated using Ficoll gradient centrifugation within 6 h of blood withdrawal according to the standard operating procedure at the Medical Oncology Research Laboratory. PBMC samples were cryopreserved in Fetal Calf Serum plus 10% dimethyl sulfoxide and stored in liquid nitrogen for later analysis. Serum was stored at −80 °C before it was analyzed for ketones (β-hydroxybutyrate), IGF-1 and glucose levels in the clinical chemical lab for patient care at the LUMC.
2.3. Transcriptomic Analyses
Cryopreserved PBMCs were thawed using the standard operating procedure in medical oncology. RNA was isolated using RNeasy minikit (Qiagen, Venlo, The Netherlands). RNA quality and quantity were assessed using a NanoDrop and Agilent 2100 Bioanalyzer system. Samples had at least 97% of RNA fragments ≥300 nucleotides (>20% required) and corrected RNA concentration was between 82 and 655 ng/μL among samples. The Nanostring nCounter (Bruker Spatial Biology, Seattle, Washington, USA) was performed with the human PanCancer IO360 panel, consisting of 20 housekeeping genes and 750 cancer-associated genes, including immune cell- and immunometabolism-related genes to investigate expression profile changes. Per sample, 200 ng RNA was used as input for the 17 h hybridization with the probes as described previously [25,26]. After quality control in nSolver, the RNA counts were normalized using the nSolver advanced analysis software package (v 1.1.4 ) and according to the guidelines of the software’s developer Bruker. The standard normalization was performed using a combination of normalization on the 6 synthetic ssDNA positive control targets and the housekeeping genes. Linear modeling was used for differentially expressed gene analysis. Benjamini–Hochberg multiple comparison correction was done with the advanced analysis software package of Bruker. Paired analysis was performed in R using the normalized linear and log2 counts.
Gene set enrichment analysis (GSEA) was performed with the freely available Broad Institute GSEA software package (version 4.3.3, www.gsea-msigdb.org, accessed on 27 June 2024) and collections for human gene sets [27], using the nSolver normalized genes from the nCounter dataset. Default setting of 1000 permutations were applied and the human hallmark gene set (h.all.v2023.1.Hs.symbols) was used [28]. Furthermore, default weighted enrichment statistic, default Signal2Noise ranking metric, default max size of 500 and min size of 15, and the Human_Gene_Symbol_with Remapping_MsigDB.v2025.1.Hs.chip were used. Gene sets with a false discovery rate < 0.25 as well as a p-value < 0.05 were selected. The FDR threshold of <0.25 was chosen because of the explorative nature of the study, per recommendation by the analysis software package; see: https://docs.gsea-msigdb.org/#GSEA/GSEA_FAQ/#2-why-do-you-recommend-a-false-discovery-rate-fdr-of-025-rather-than-the-more-classic-005-for-gsea (accessed on 27 June 2024).
2.4. Multispectral Flow Cytometry
A 40-marker multispectral immunofluorescence panel comprising directly fluorescently labeled antibodies was used for phenotyping myeloid and lymphoid cells in the PBMC samples (three time points per participant), as previously described [29].
2.5. Statistical Analysis
The Friedman test and Dunn’s test with adjusted p-values were used for post hoc pairwise comparison of metabolic parameters (Dunn–Sidak correction for multiple comparison, two-sided). The Friedman test and Wilcoxon signed rank test post hoc was performed (pairwise and two-sided) for single gene differential expression analysis of the 750 gene nCounter panel, cell type score, pathway signaling score and flow cytometry per subset, using GraphPad Prism 10.2.3 or R 4.2.1 (http://cran.r-project.org, accessed on 8 March 2025). A p-value < 0.05 was considered statistically significant.
3. Results
3.1. FMD Was Tolerable and Safe in Healthy Participants
Sixteen healthy volunteers (participants) were enrolled between November 2021 and February 2022, but seven were ineligible due to COVID-19 infection or COVID-19 vaccination within 4–6 weeks before participation, as depicted in the consort diagram in Supplementary Figure S1. The nine participants who met the inclusion criteria followed a 4-day low-caloric and low-protein FMD cycle twice with a 3-week break without any dietary restrictions. Blood samples were collected at baseline (day 1, fed state), after an overnight fast on the first day of the first FMD cycle (day 2, overnight-fasted state), and on the morning after completion of the second FMD cycle (day 31, FMD-fasted state), as shown in Figure 1.
Nine participants were included for feasibility and toxicity analysis. Six participants completed all measurements, and three participants were missing the final measurement due to interference of COVID-19 infection or vaccination (booster) before final assessment could be conducted. Participant characteristics are shown in Table 1. Six of the nine participants experienced only transient side effects, all probably or possibly related to the FMD, mostly grade 1 (fatigue, muscle weakness). One participant reported a grade-2 headache; no grade-3 or higher side effects were experienced (Supplementary Table S2).
Table 1.
FIND participant characteristics.
3.2. FMD Effectively Modulates Systemic Metabolism from Glycolytic Toward Fatty Acid Oxidation
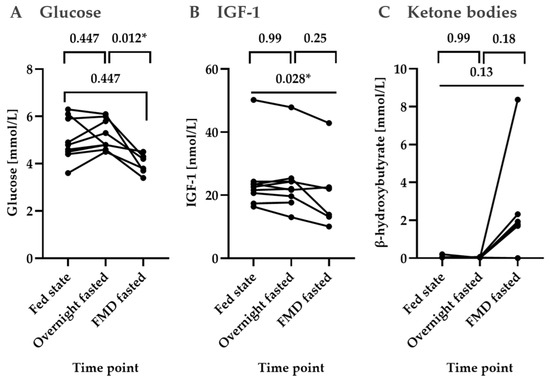
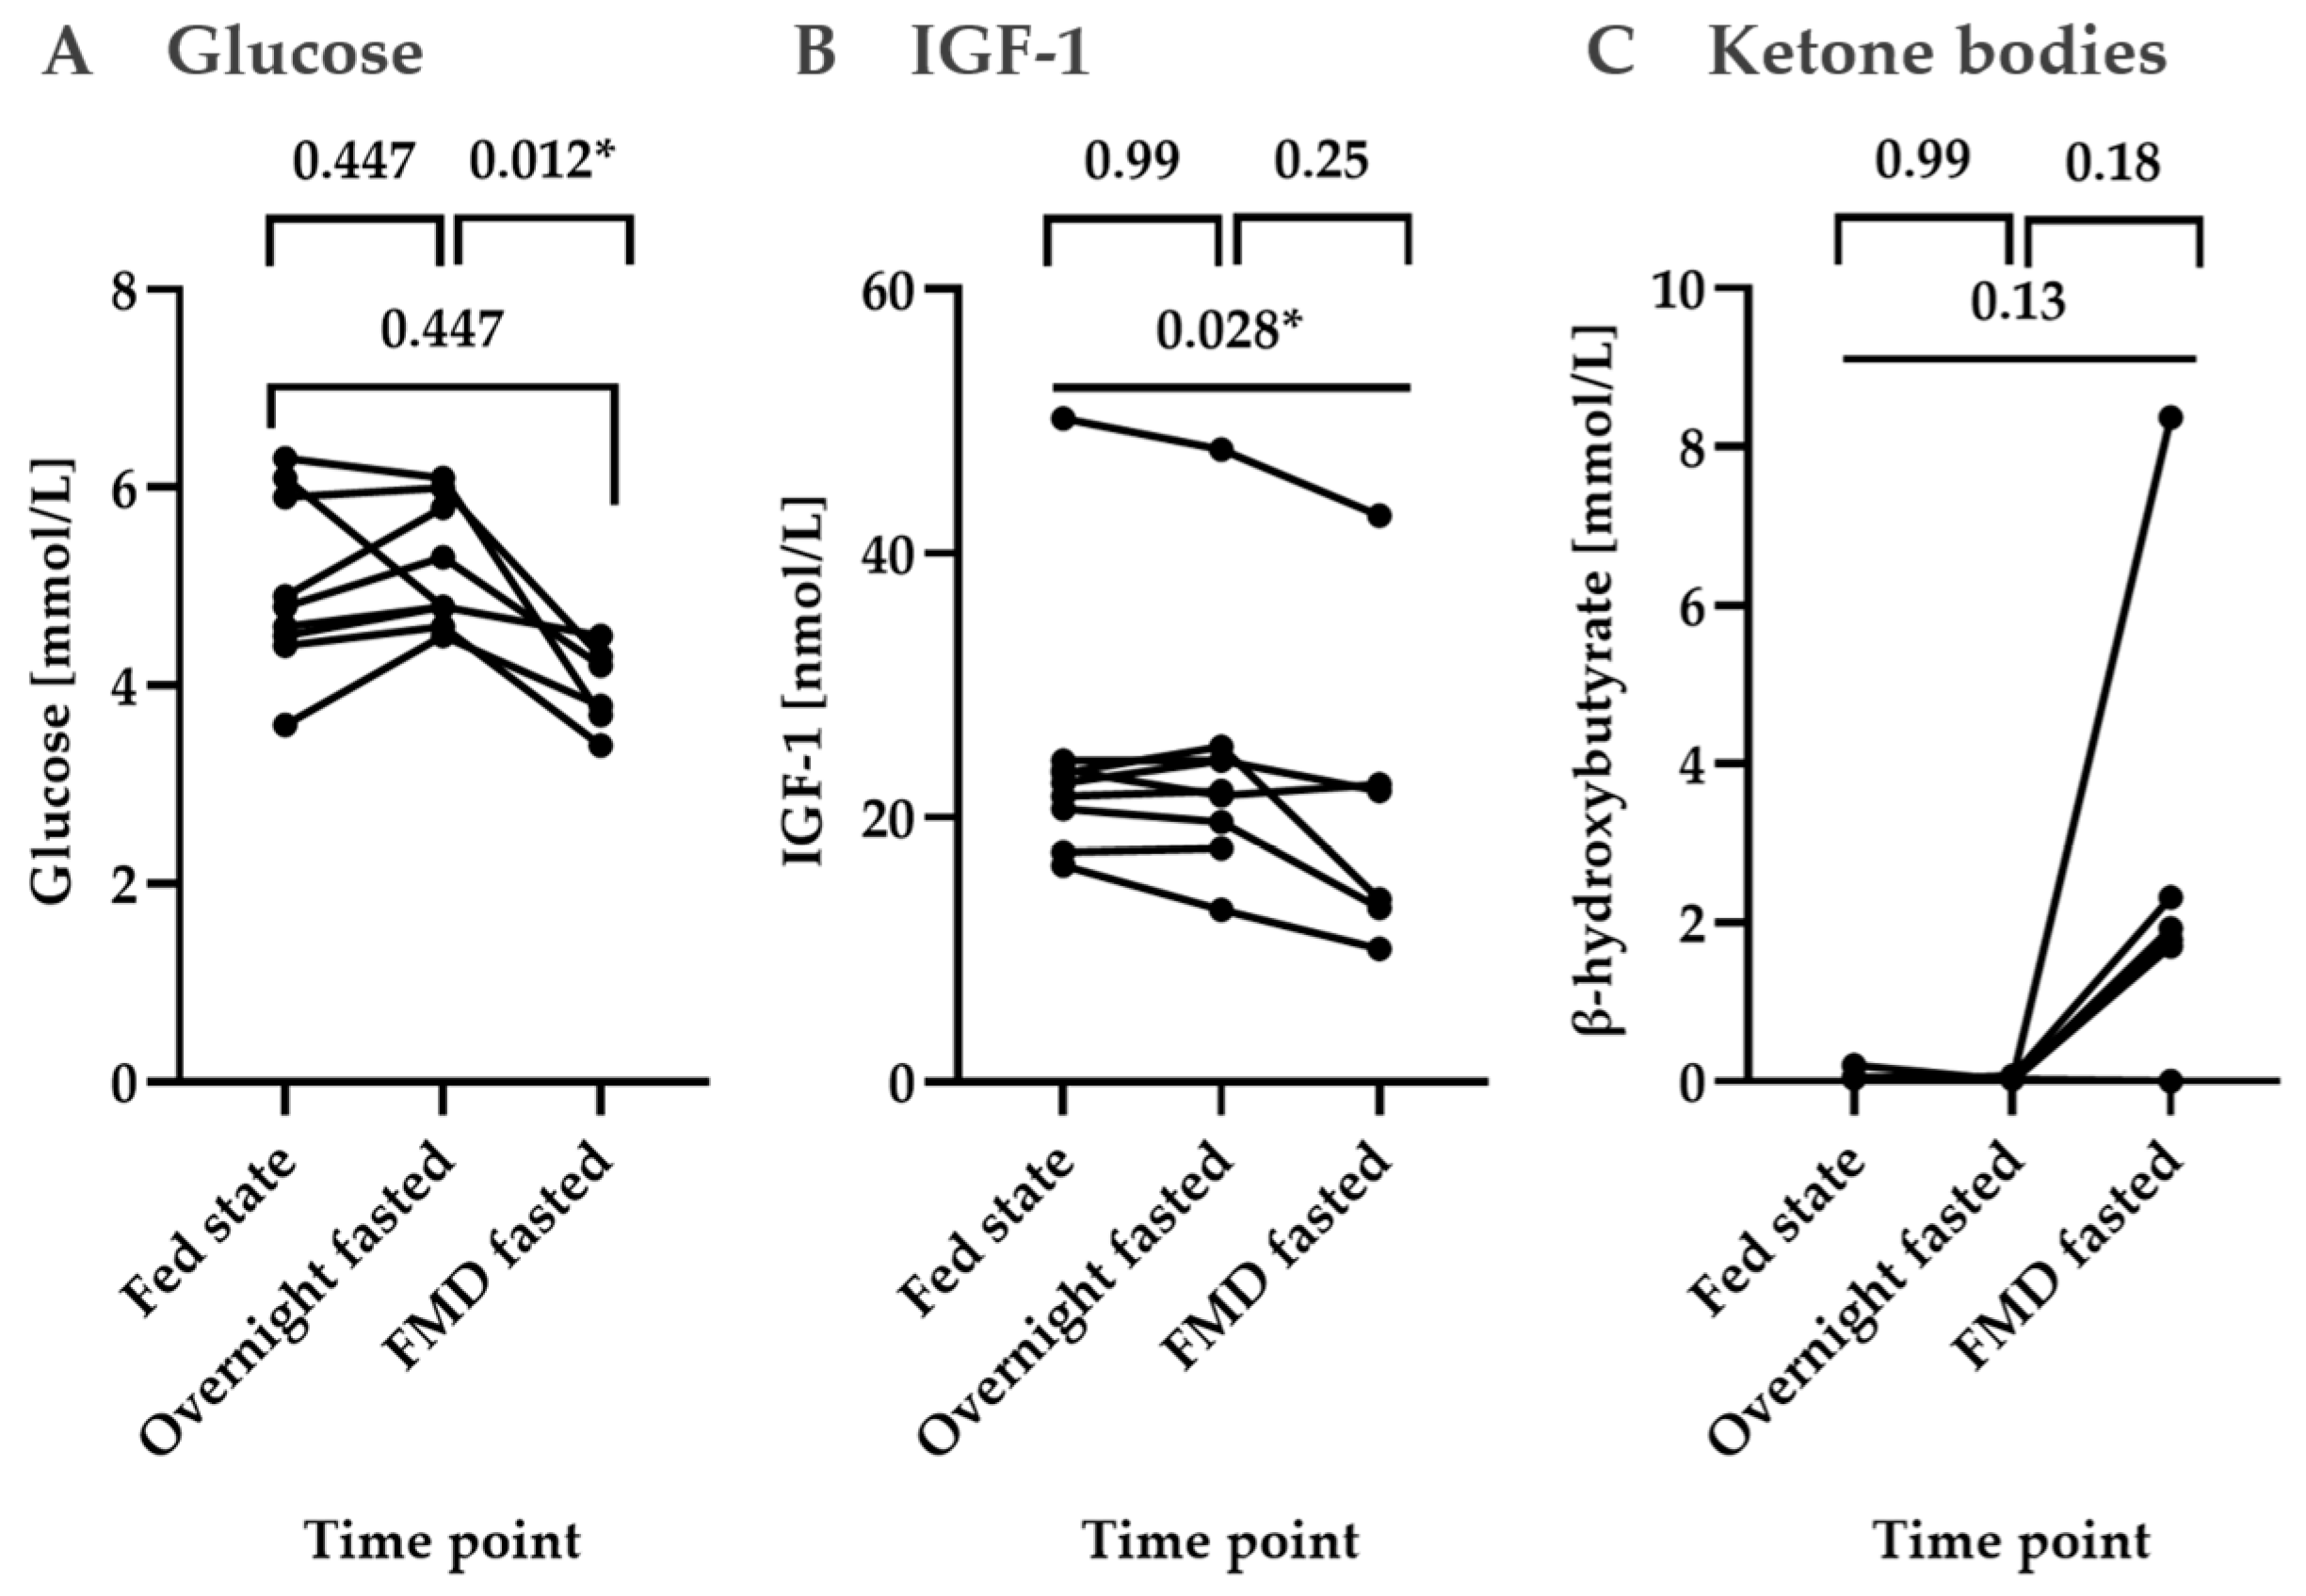
To assess the systemic effect of FMD on the body’s metabolism, the plasma levels of glucose, IGF-1 and ketones were measured. The plasma glucose level significantly decreased over time (p = 0.012) from the fed state 4.7 mmol/L (median, IQR 4.2–6.0) to FMD-fasted 4.0 mmol/L (median, IQR 3.63–4.35), with the most pronounced difference between overnight-fasted and FMD-fasted (p = 0.012; Figure 2). Similarly, IGF-1 plasma levels decreased over time (p = 0.029) with the fed state 23 nmol/L (median, IQR 19.6–30.3) and FMD-fasted 17.9 nmol/L (median, IQR 12.4–27.6) showing the largest difference (p = 0.028; Figure 2).
Figure 2.
Metabolic markers. Glucose (normal range 3.9–7.7 mmol/L fed; 3.9–5.6 mmol/L fasted), IGF-1 (depending on age within 5.4–47.4 nmol/L for this study group) and ketone levels (normal range 0.02–0.3 mmol/L) were measured and compared at baseline (fed state, day 1), after an overnight fast (overnight-fasted, day 2) and the morning after completion of the second FMD cycle (FMD-fasted, around day 31). Friedman test was used with Dunn’s test for post hoc pairwise comparison, p-value adjusted. IGF-1 insulin-like growth factor 1. * level of significance is p < 0.05.
Plasma ketone levels, measured as β-hydroxybutyrate, were near zero for all participants at the fed state and overnight-fasted state, but increased at FMD-fasted to a median level of 1.86 mmol/L, with IQR 1.28–3.83, p = 0.067 over all three time points and with the largest difference between the fed state and FMD-fasted (p = 0.13) as shown in Figure 2. Thus, FMD effectively modulated systemic metabolism from glycolytic toward fatty acid oxidation pathways in these participants.
3.3. TNFα, IFNγ, IFNα Pathway Signature Enrichment After FMD
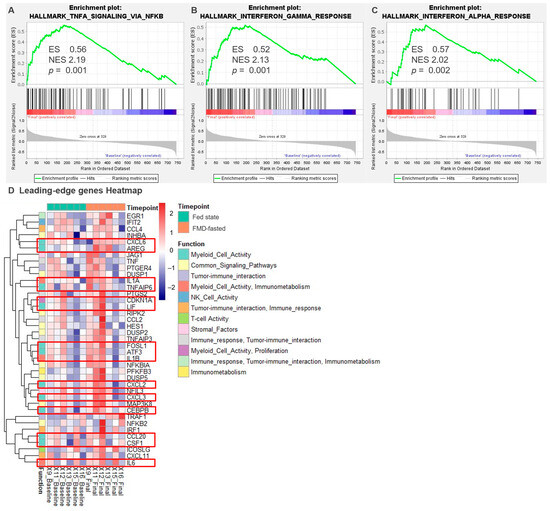
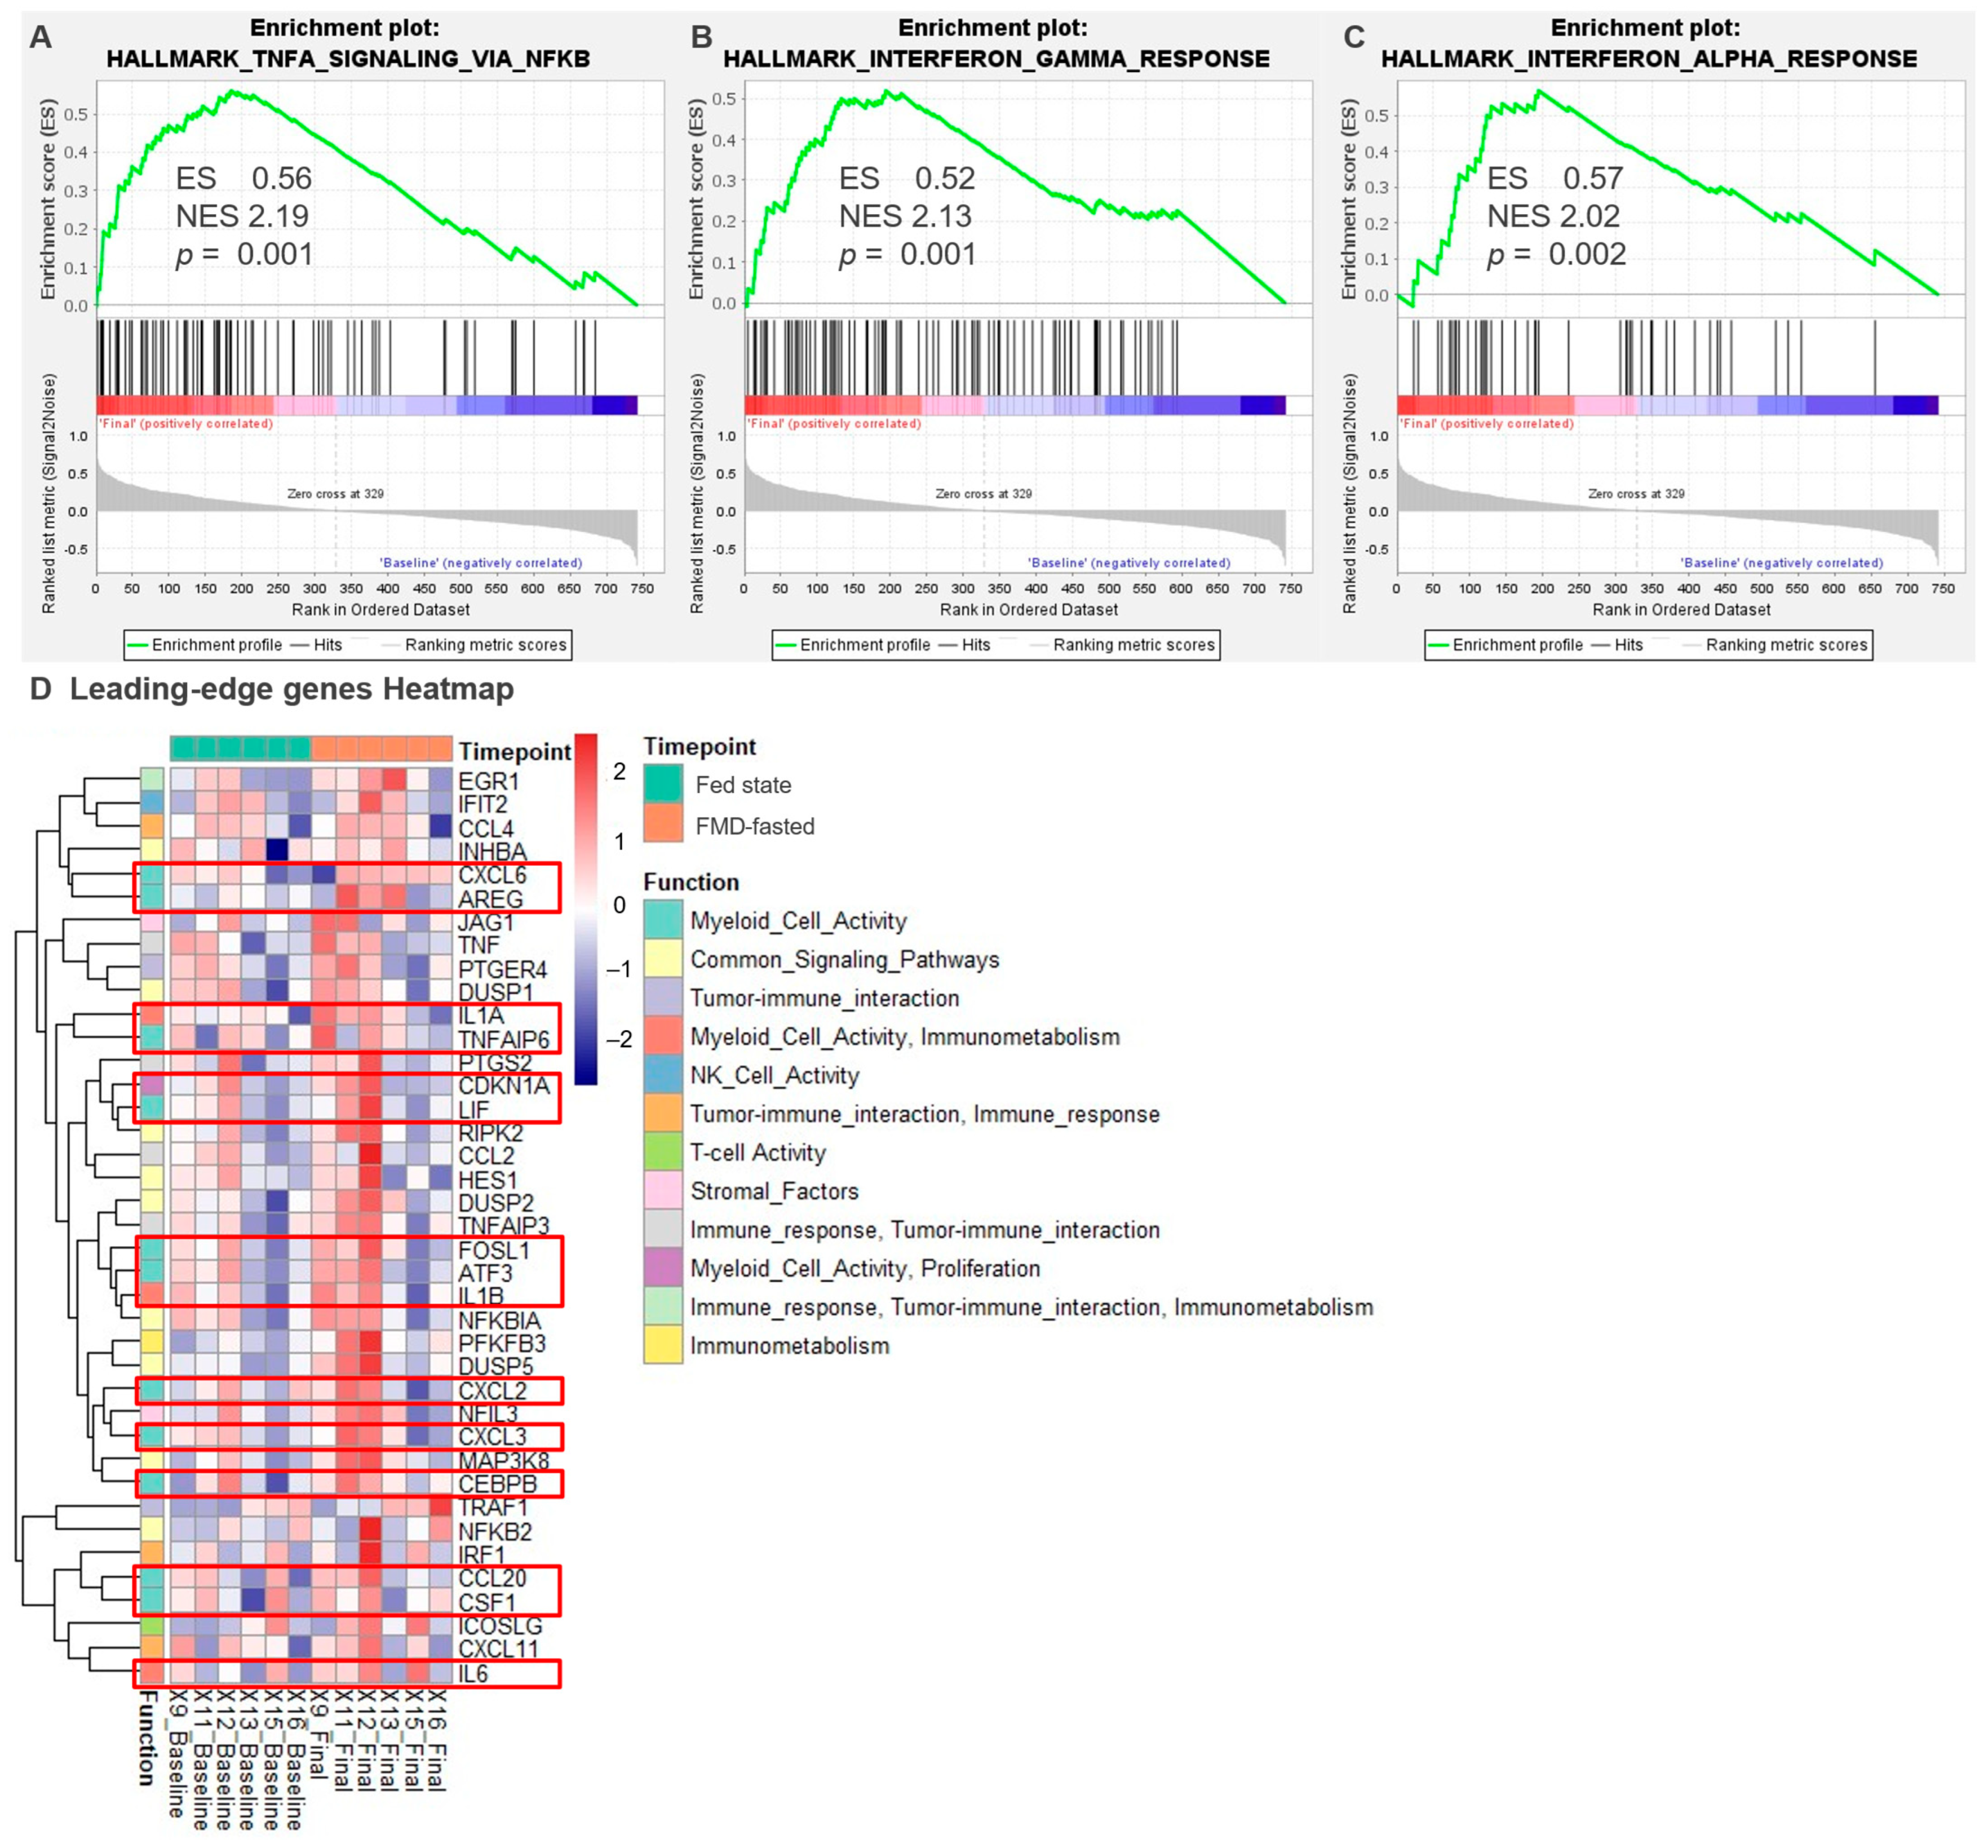
To determine FMD-induced changes in circulating immune cells, a transcriptomic analysis on bulk RNA isolated from PBMCs was performed. There was no overt effect on specific genes (Supplementary Figure S2). As it is more likely that the expression of whole sets of genes belonging to specific pathways were altered, rather than a few single genes, GSEA was performed. This revealed an upregulation of genes involved in the tumor necrosis factor alpha (TNFα) pathway, IFNγ pathway and interferon alpha (IFNα) pathway after two FMD cycles (FMD-fasted) compared to the fed state (Figure 3). Fifteen of the 39 leading-edge genes in the TNFα signature via nuclear factor kappa-light-chain-enhancer of activated B cells (NF-κB) are associated with myeloid activity. For example, interleukin 6 promotes macrophage responses in acute innate responses [30,31], and interleukin-1 beta stimulates pro-inflammatory M1 type myeloid activation [32]. In addition, CEPBP (C/EBPβ) and CDKN1A are part of stress-response programs. C/EBPβ is a key transcription factor that induces emergency myelopoiesis and myeloid differentiation [33]. CDKN1A, induced by stress and TNFα transcriptional programs, regulates the cell cycle G1 phase and autophagy, thereby reflecting the cellular stress response [34]. The IFNγ and IFNα leading-edge genes were only strongly upregulated in a few but not all samples (Supplementary Figure S3).
Figure 3.
TNFα, IFNγ, IFNα pathway signature enrichment. Gene set enrichment analysis using Nanostring nCounter counts as input, Hallmark gene set to compare, reported gene set with FDR < 25% and p-value < 5% and <1%. (A) TNFα, (B) IFNγ, (C) IFNα pathway signature enrichment after two FMD cycles (FMD-fasted state) compared to baseline (fed state), p < 0.01 based on 72, 86 and 42 gene expressions respectively. (D) Heatmap shows gene expression (log2 fold change) of the 39 leading-edge genes of the TNF gene set with function annotation and the 15 myeloid activity-associated genes outlined in red. NES normalized enrichment score, ES enrichment score, FDR false discovery rate.
3.4. Increased Percentages of Circulating Intermediate Monocytes, Myeloid Dendritic Cells (mDC) and Plasmacytoid DCs (pDC) After Two Cycles of FMD
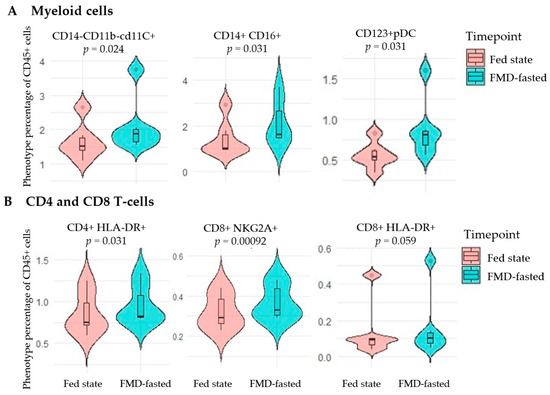
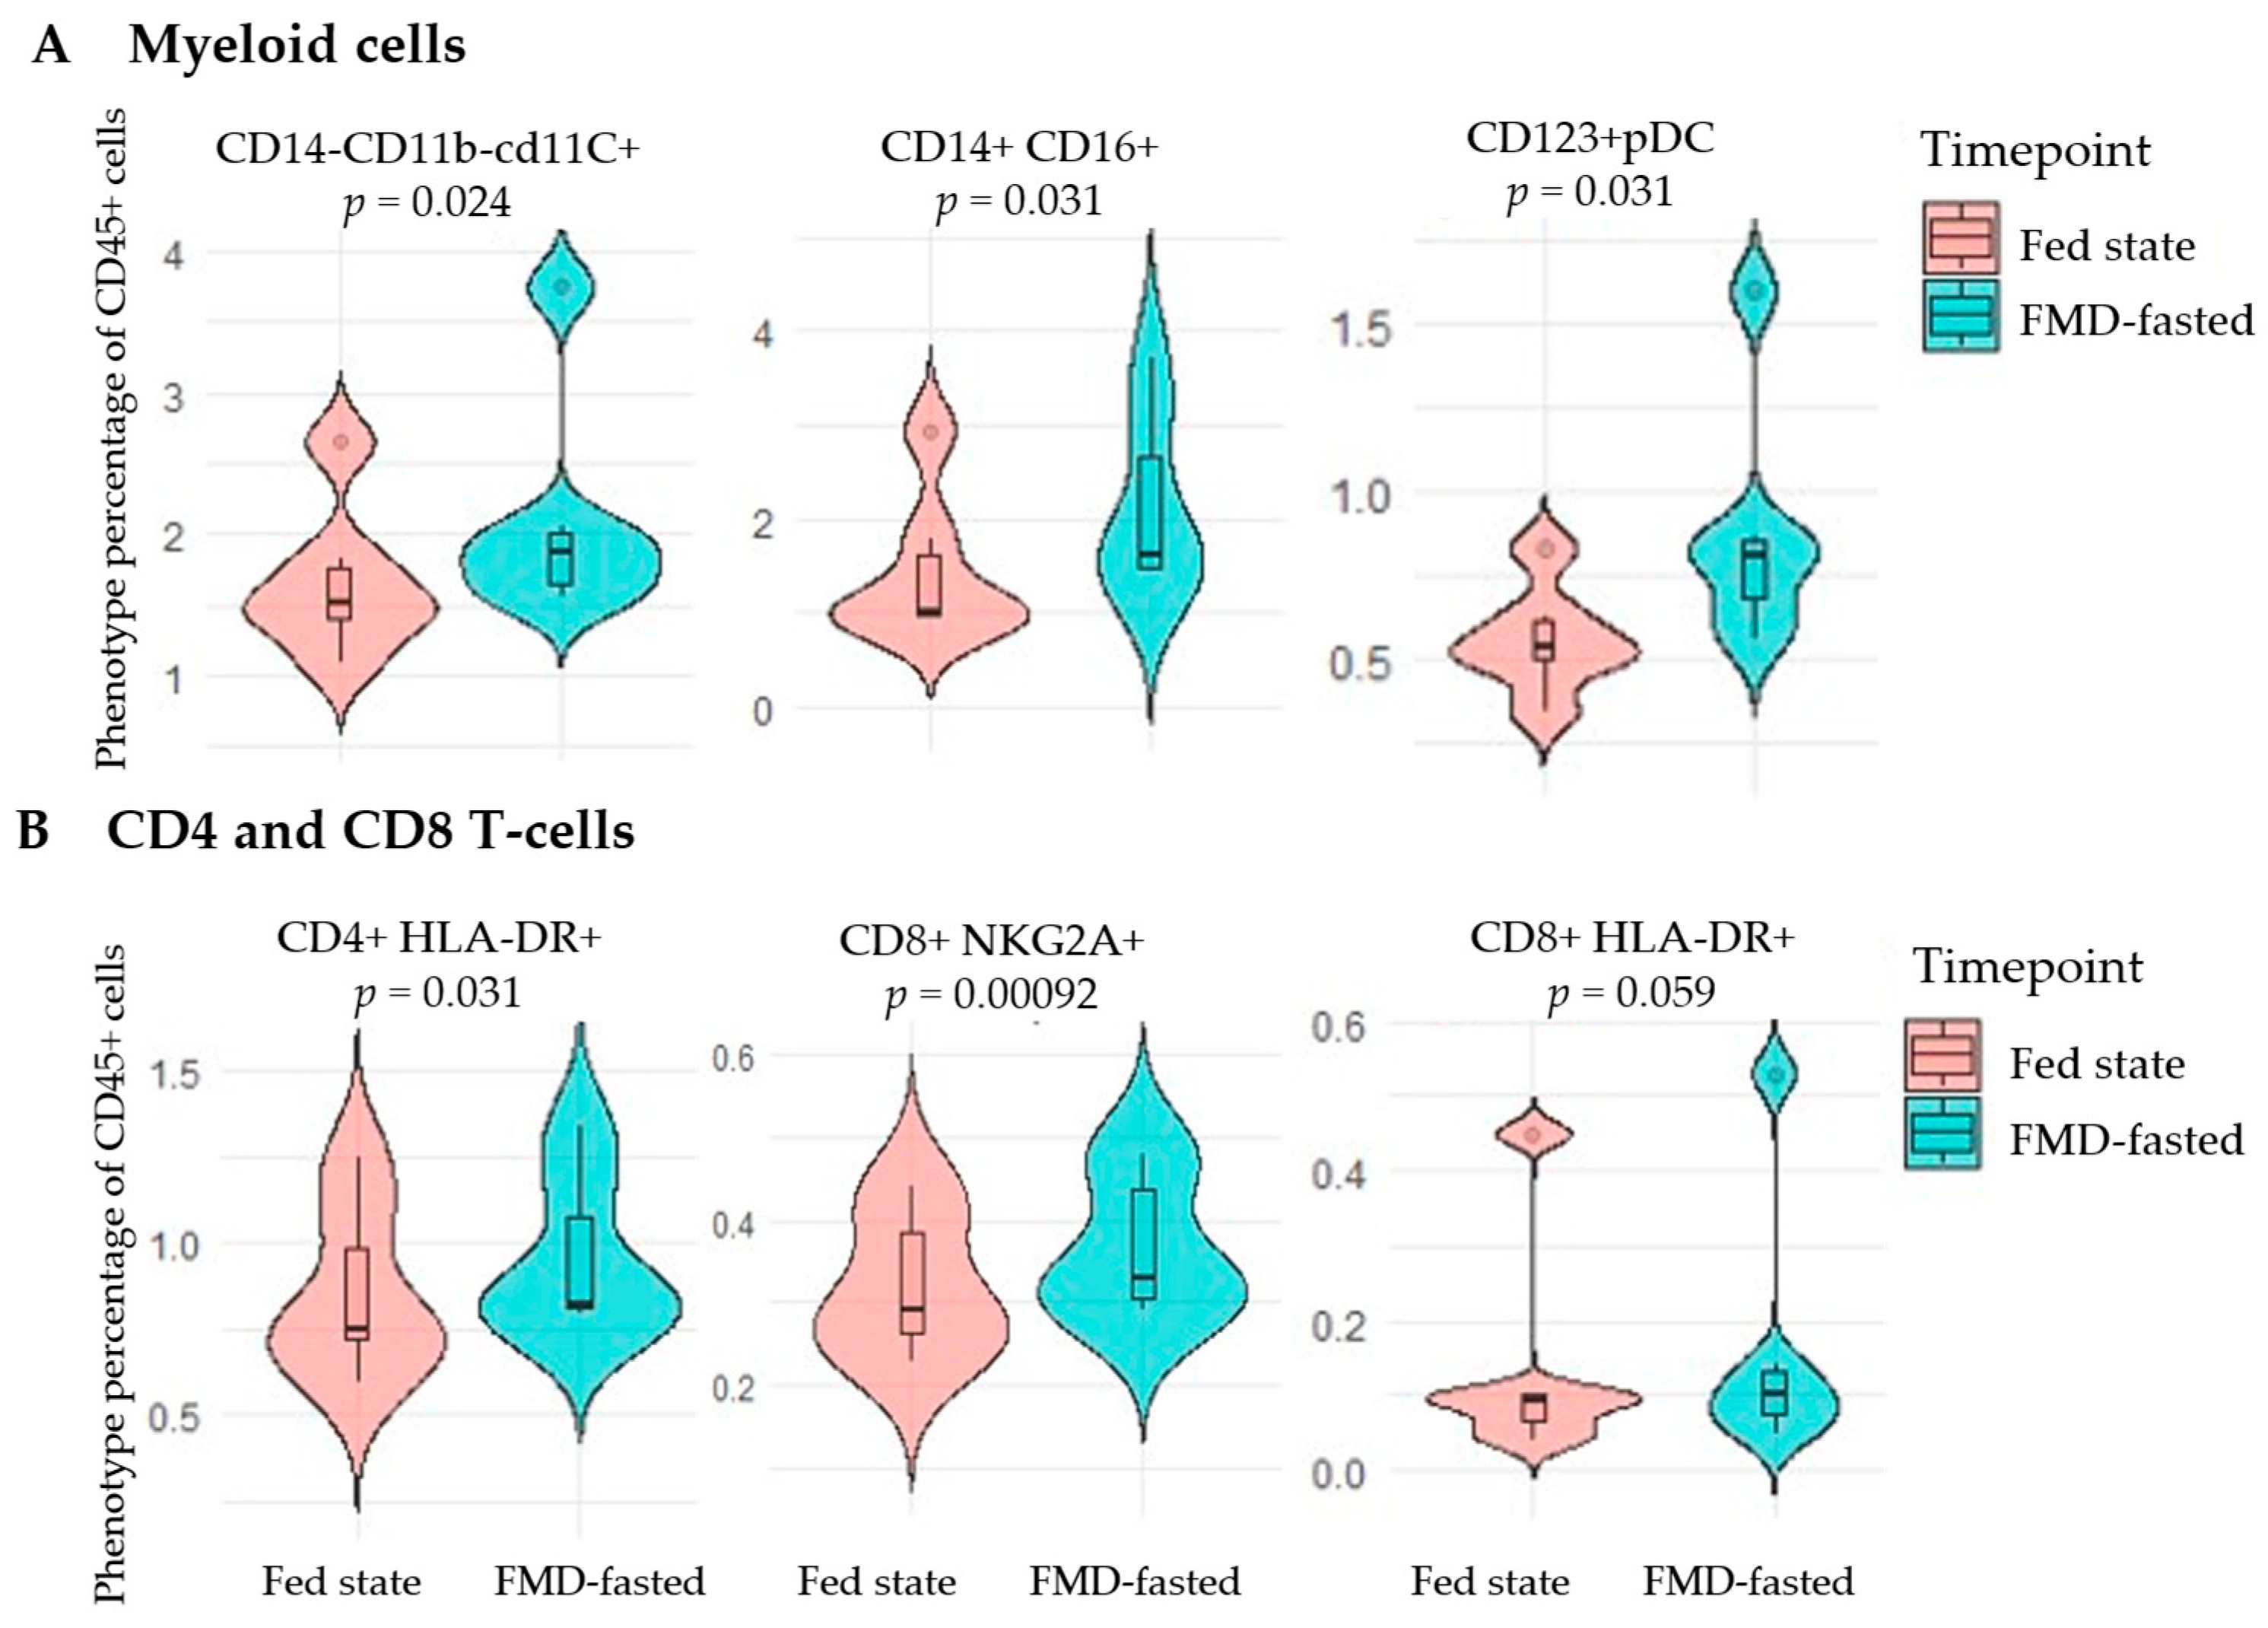
To assess the impact of FMD on the composition and phenotype of circulating immune cells, a flow cytometric analysis was performed. This revealed that the percentages of intermediate monocyte (IM), mDC and pDC subsets were increased after two FMD cycles (FMD-fasted, final) compared to the fed state at baseline (Figure 4A). The increase in these myeloid subpopulations is in line with the enrichment of genes expressed in the TNFα- and IFNα-related transcriptional pathways. IMs are known to mediate inflammatory responses and are responsible for the production of TNF-α and interleukin-1 beta as a rapid response to stressors [35], while CD123+ pDCs are principal producers of type I interferons, and as such may have driven the increased systemic IFNα signature in peripheral blood [36].
Figure 4.
Immunophenotypic changes in percentage of CD45% population. (A) Myeloid dendritic cells (CD14-CD11b-CD11c+), intermediate monocytes (CD14+CD16+) and plasmacytoid dendritic cells are increased after two FMD cycles (FMD-fasted) compared to fed state. (B) Other cell subsets (CD4+HLA-DR+, CD8+NKG2A+, CD8+HLA-DR+) that are associated with immune activation were increased.
3.5. An Increase in Activated T-Cells After FMD
The lymphocyte populations were altered after FMD as well. This was reflected by the increases in CD4+HLA-DR+, CD8+NKG2A+, and CD8+HLA-DR+ T-cells in the FMD-fasted state (Figure 4B). Importantly, the expression of HLA-DR and/or NKG2A is likely to reflect the activation of these T-cells [37,38] and may occur after interaction with activated myeloid cells [39].
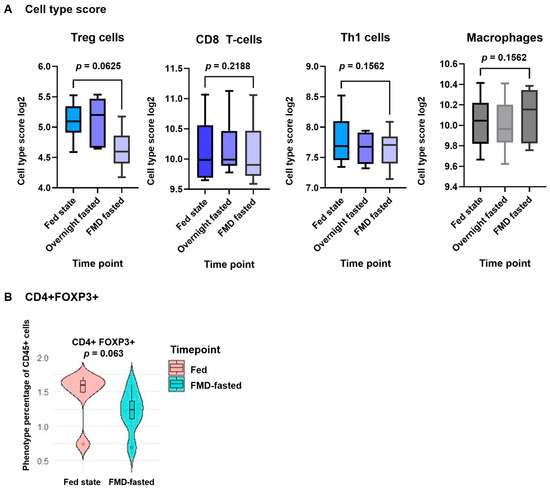
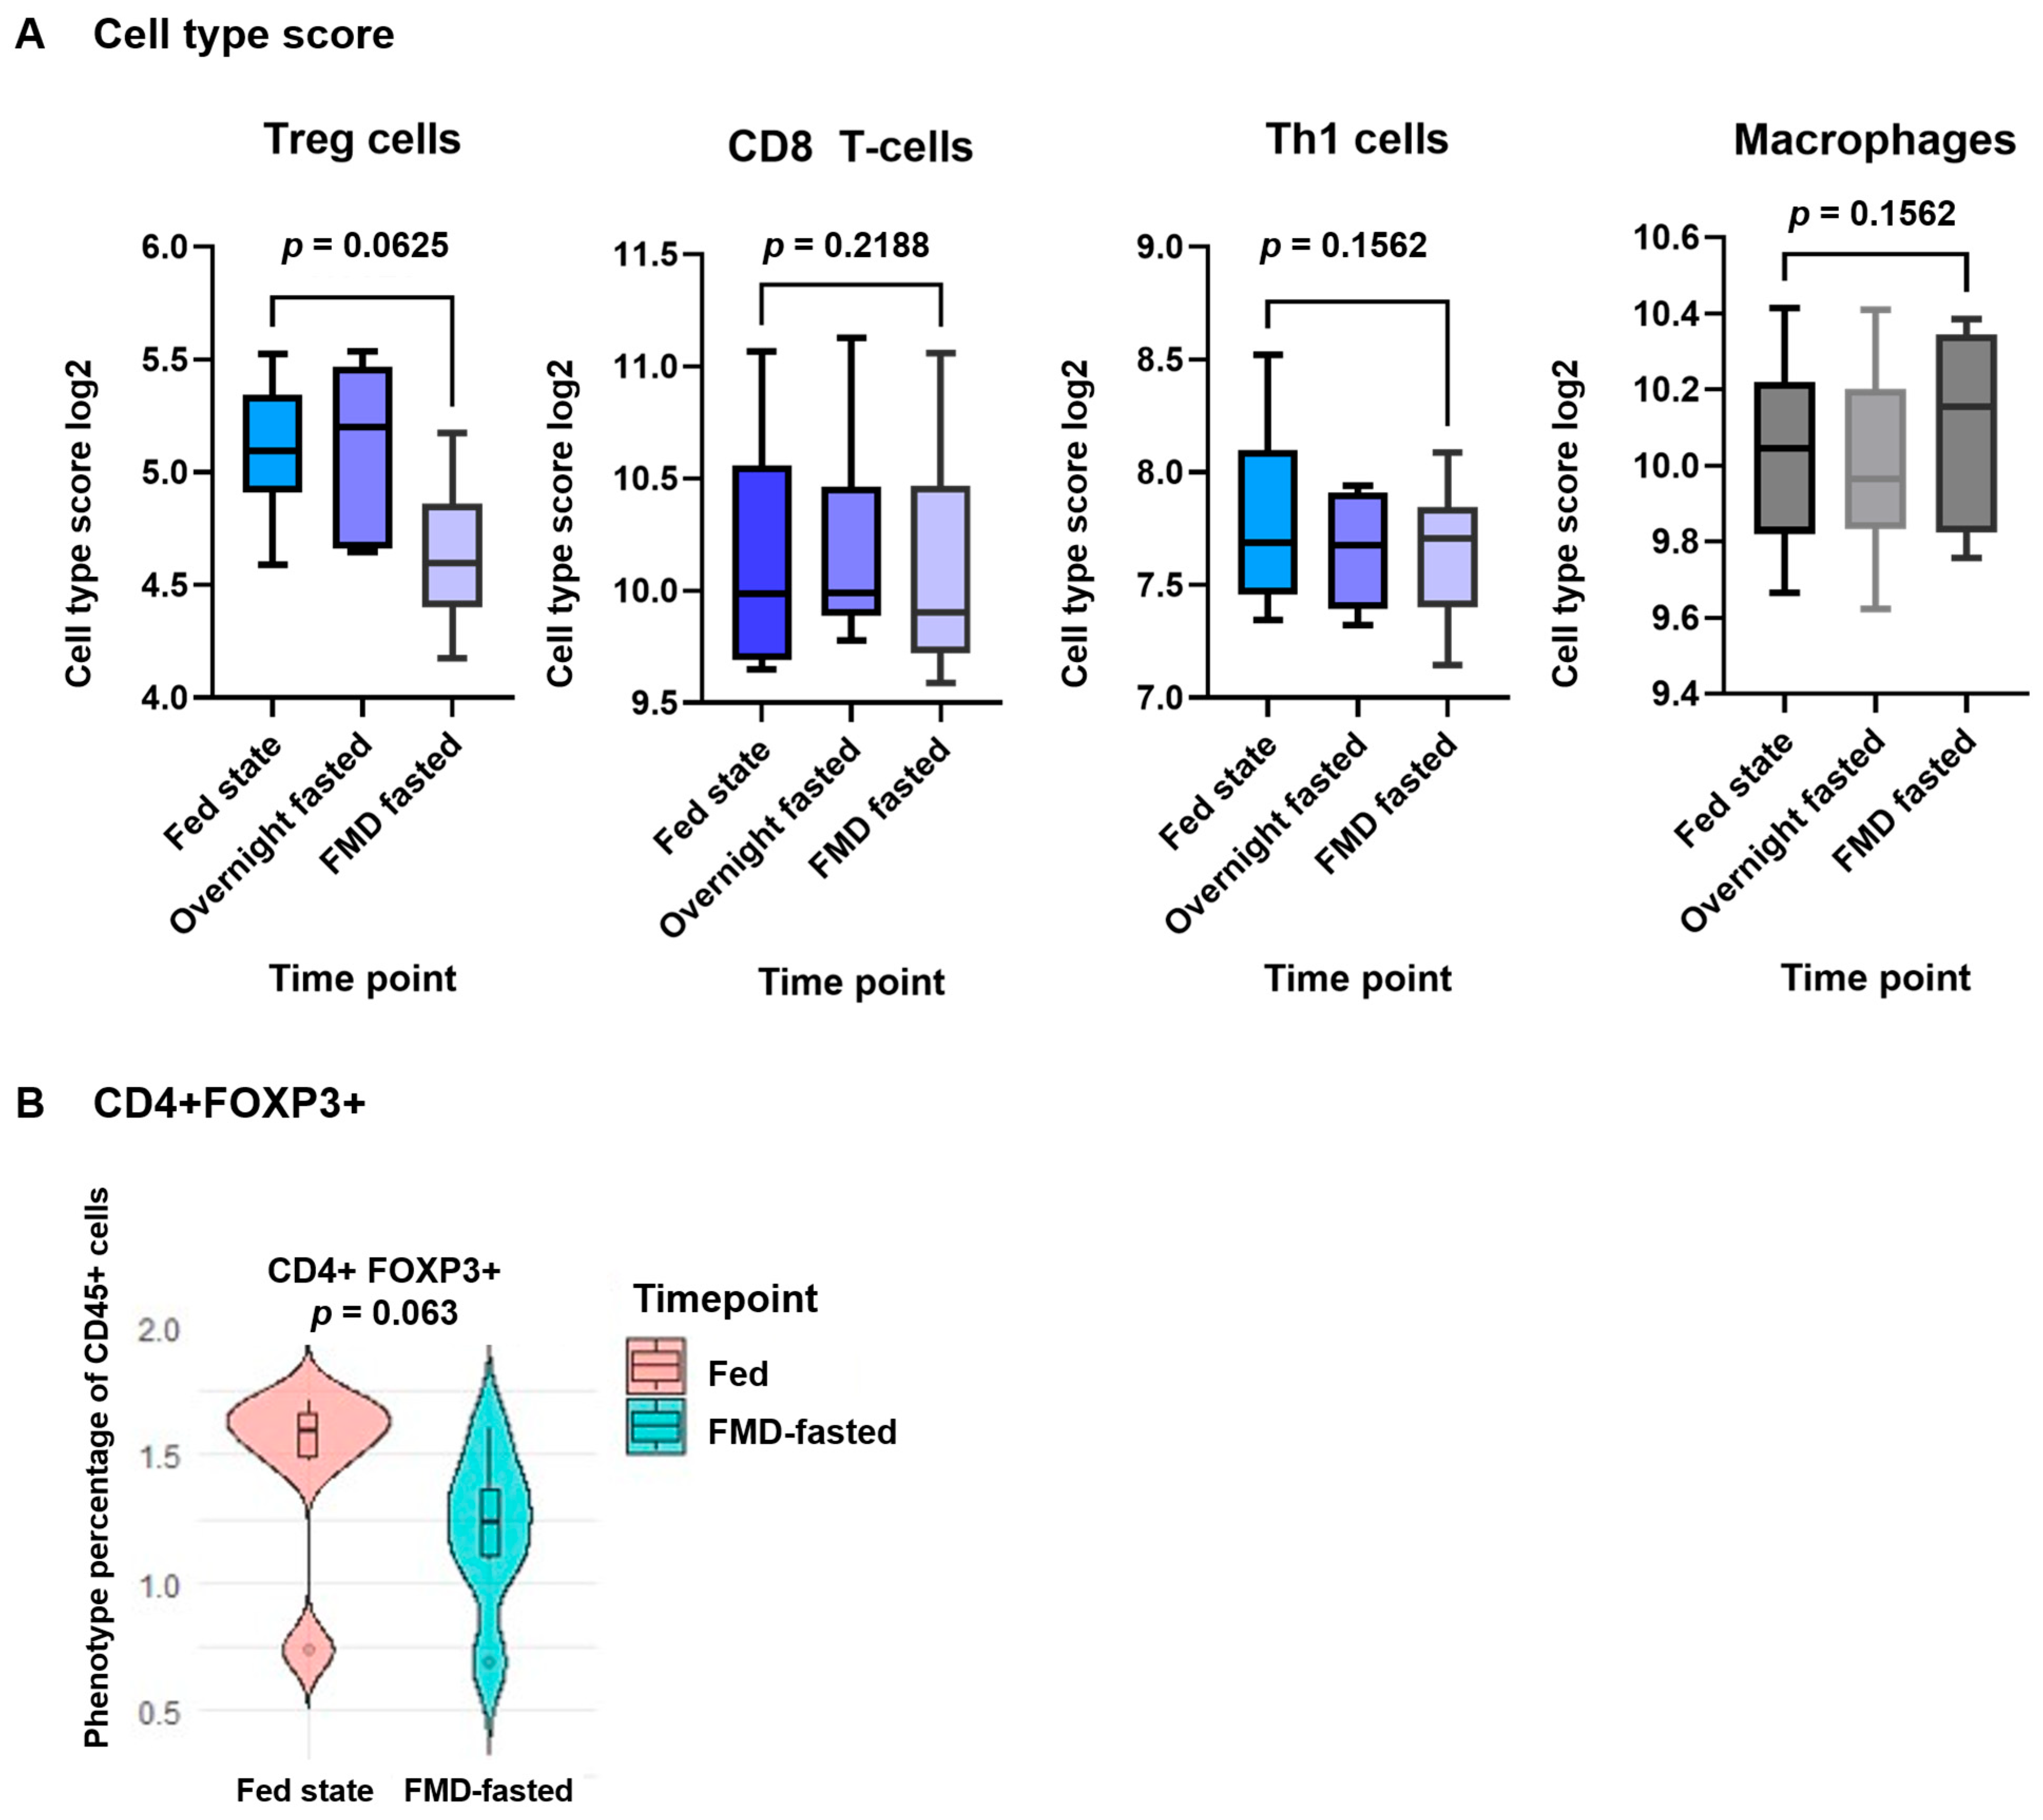
In addition, we observed a trend towards lower percentages of CD4+FOXP3+ regulatory T-cells (Tregs) (p = 0.063, Figure 5A) by flow cytometry. This was also observed in our transcriptomic dataset when using the advanced analysis software to estimate cell composition of the bulk RNA sample based on genes that are specific to a cell type. A trend toward Treg downregulation was observed, with a decreasing Treg cell type score in paired analysis between baseline (p = 0.0625) and after two FMD cycles, while other major cell type scores (CD8, Th1, macrophages) remained similar (Figure 5B). FMD did not induce changes in circulating lymphoid (CD3+, CD19+, CD56+) to myeloid (CD3-CD19-CD56-) proportions, nor did it remodel the total lymphoid, monocyte (CD14CD16) or dendritic compartments.
Figure 5.
(A) Cell type score, which is based on a set of gene expression counts taken together that are characteristically expressed in these immune cell populations and provide an estimate of immune composition in the bulk RNA samples at three time points. (B) CD4+FOXP3 Tregs subset as percentage of CD45 showed a decreasing trend at FMD-fasted state compared to fed state. Paired analysis Mann–Whitney U test, 2-sided. Treg, regulatory T-cells; Th1, helper T-cells.
4. Discussion
This pilot study evaluated the dynamics of the immune system during two cycles of a 4-day FMD in healthy individuals. Our findings showed that short-term FMD may induce marked metabolic and immunological changes. Metabolically, FMD reduced glucose and IGF-1 and elevated ketone levels, reflecting a shift from glycolysis toward fatty acid oxidation. Immunologically, this shift coincided with increased expression of genes involved in the TNFα, IFNγ, and IFNα signaling pathways in PBMCs, and with increased percentages of mDCs, pDCs, IMs, and CD4+ and CD8+ T-cells expressing activation-associated markers HLA-DR or NKG2A. In addition, a trend toward reduced Tregs was observed. Collectively, these exploratory findings suggest that short-term FMD is associated with changes in cell composition of the immune system consistent with activation of selected inflammatory pathways in healthy individuals.
In contrast to Brandhorst et al., who reported an increased lymphoid-to-myeloid ratio (LMR) following three cycles of a 5-day FMD in an obese, partly prediabetic population [14], we did not observe a shift in the LMR across time points in this cohort. Obesity is known to be associated with baseline expansion of the myeloid compartment, but the FIND cohort included participants with BMI ≤ 25 kg/m2. Differences in immune cell assessment methods may also contribute to different results, as LMR in the present study was determined by flow cytometry, whereas Brandhorst et al. determined LMR using a complete blood count [14]. Interestingly, in patients with multiple sclerosis, one cycle of FMD resulted in a decrease in overall lymphocyte numbers [6]. This was not the case in our study, although a trend for a reduction in peripheral Tregs was observed. This is in line with recent reports showing decreased numbers of circulating Tregs [40]. These studies also describe how Treg metabolism relies on glycolysis to maintain suppressive function, activation, and survival through mTOR signaling, whereas FMD is associated with a metabolic shift toward fatty acid oxidation [41]. Although some studies report that upon mTOR inhibition, FOXP3 expression and Treg differentiation increases, such effects may depend on the context, intensity, and duration of nutrient restriction [42]. Alternatively, peripheral reduction may indicate redistribution of Tregs in the body [42,43]. The increased percentage of HLA-DR and/or NKG2A-expressing CD4+ and CD8+ T-cells indicates T-cell activation after two cycles of FMD [37,38]. It coincided with an increase in fatty acid oxidation, a process required for T memory cells to survive longer and to preserve their capacity to rapidly respond [44]. However, Oudmaijer et al. observed a slightly reduced activation of the central memory subset in healthy living kidney donors after 40h STF [40]. Preclinical studies in tumor-bearing mice consistently demonstrate that FMD or caloric restriction depletes Tregs and enhances CD8+ T-cell immunity [12,45].
The increased frequencies of IMs, mDCs and pDCs contrast with earlier work showing a decrease in CD14+ and CD16+ monocytes in healthy volunteers after 19 h of fasting [46]. This difference may be explained by the fact that these cell populations were measured after two cycles of FMD in our current study. Interestingly, Snodgrass et al. reported altered monocyte dynamics after 12 h of overnight fasting and showed that the group with a metabolic profile indicative for lower carbohydrate oxidation but higher fatty oxidation displayed higher numbers of non-canonical CD14dimCD16+ monocytes after fasting [47]. This is in line with our observations of increased IMs coinciding with a shift from glycolytic toward fatty acid oxidation. In addition, our study shows that FMD cycles not only alter monocyte numbers but also increase expression of myeloid-related gene sets, particularly genes involved in the TNFα signaling pathway. This supports a potential role for fasting-induced metabolic stress in shaping innate immune responses. An increased frequency of IMs is also in line with reports indicating that this subset participates in emergency myelopoiesis and rapid immune mobilization during acute stress, such as starvation [40]. The increased percentages of CD11c+ mDCs and CD123+ pDCs may reflect changes in antigen-presenting cell populations, potentially priming the immune system for enhanced responsiveness. This is consistent with the report by Oudmaijer et al., showing the increase in cDC1 (a subset of mDCs) [40]. In line with this, Vernieri et al. observed enhanced IFNγ pathway activation in triple-negative breast cancer patients undergoing repeated FMD cycles [10]. However, intermittent fasting such as Ramadan fasting transiently decreases pro-inflammatory cytokines and circulating immune cells in healthy volunteers, suggesting an overall anti-inflammatory effect [48].
The immune effects of fasting and FMD in humans vary between studies. This is due to differences in setting (healthy, obese, disease, and treatments), types of fasting diet, duration and composition, timing of sampling, metabolic status, and the analytical methods used. Additionally, transient lymphocyte reductions during fasting could precede immune regeneration. Several human studies investigating FMD or STF have not included metabolic validation through circulating ketone measurements [14,40,44,47]. Therefore, it is unclear if the results are from fasting-induced metabolic changes or just caloric restriction. Future clinical studies should focus on healthy participants undergoing FMD, while incorporating metabolic validation and repeated sampling over time.
As this was a pilot study, there are several important limitations, including the small sample size and the lack of a control group. The latter was mitigated by analyzing the data of samples taken before and after FMD intervention over time. As this design did not allow us to fully distinguish FMD-induced changes from individual fluctuations over time or stress, only the most pronounced changes observed in most of the participants were reported here. Another limitation is the inability to link immune composition shifts in IMs, mDCs, pDCs and HLA-DR+ T-cells to specific effector functions or cytokine production. In addition, transcriptomic changes in TNFα, IFNγ, and IFNα pathway signatures may not fully reflect functional outcomes without corroborating data at the protein level or in situ evidence. Moreover, as we analyzed a restricted set of genes focused on immune oncology rather than the whole transcriptome, other changes may have been missed. Functional analyses of monocyte and DC subsets are required to determine whether these FMD-associated immunophenotypic changes are accompanied by altered antigen presentation, cytokine production, or immunosuppressive mechanisms. Furthermore, the impact of the decrease in Tregs should be evaluated functionally.
5. Conclusions
In conclusion, our exploratory pilot data supports the hypothesis that FMD is associated with metabolic changes, enrichment of inflammatory pathways, and alterations in circulating innate and adaptive immune cell populations. These preliminary findings require confirmation in larger cohorts with a control group and incorporating metabolic validation (e.g., ketone levels), serial sampling to better understand the kinetics of immune adaptation and functional immune assays to determine whether these phenotypic changes translate into altered immune function.
Supplementary Materials
The following supporting information can be downloaded at: https://www.mdpi.com/article/10.3390/nu18152514/s1. Supplementary Table S1: Antibody panel spectral flowcytometry for immunophenotyping of PBMC samples; Supplementary Table S2: phenotype overview; Supplementary Table S3: toxicity details; Supplementary Figure S1: FIND CONSORT diagram; Supplementary Figure S2: Volcano plot of Nanostring analysis; Supplementary Figure S3: IFNγ and IFNα heatmaps.
Author Contributions
Conceptualization/study design: N.d.G., M.J.P.W., H.P., J.R.K., S.H.v.d.B.; data acquisition: N.d.G., S.J.S., M.J.P.W., S.B., S.K.; data analysis: N.d.G., M.J.P.W., S.H.v.d.B., S.J.S., J.R.K.; interpretation of data: N.d.G., M.J.P.W., S.H.v.d.B., H.P., J.R.K.; manuscript preparation: N.d.G., M.J.P.W., S.H.v.d.B., H.P., J.R.K. All authors have read and agreed to the published version of the manuscript.
Funding
This research received no external funding. S.H.v.d.B. is supported by base funding from the Oncode Institute.
Institutional Review Board Statement
The study was conducted in accordance with the Declaration of Helsinki (October 2013, version 1) and approved by the Ethics Committee of the Leiden–The Hague–Delft (code: P21.017, date: 16 August 2021) in agreement with Dutch law for medical research involving human subjects and with the General Data Protection Regulation. All healthy volunteers gave written informed consent.
Informed Consent Statement
Informed consent was obtained from all subjects involved in the study.
Data Availability Statement
All study data are presented in the manuscript and Supplementary Materials. The raw data that supports the findings of this study are not available due to data privacy laws; access can be obtained from the corresponding author upon reasonable request.
Acknowledgments
We thank all the participants and the study team for their participation in this trial. This work was supported by the Leiden University Medical Center. We thank L-Nutra and Valter Longo from USC Longevity Institute for providing the FMD kits and for their expert advice.
Conflicts of Interest
The authors declare no conflicts of interest.
Abbreviations
The following abbreviations are used in this manuscript:
| FMD | Fasting-mimicking diet |
| STF | Short-term fasting |
| PBMCs | peripheral blood mononuclear cells |
| TNFα | tumor necrosis factor alpha |
| IFNα | Interferon alpha |
| IFNγ | Interferon gamma |
| DC | dendritic cells |
| mDC | myeloid dendritic cells |
| pDC | plasmacytoid dendritic cells |
| IM | Intermediate monocytes |
| Treg | regulatory Tf-cells |
| Th1 | T-helper cell type 1 |
| IGF-1 | insulin-like growth factor 1 |
| IGF-1R | insulin-like growth factor 1 receptor |
| DSR | differential stress resistance |
| GSEA | gene set enrichment analysis |
| BMI | body mass index |
| NF-κB | Nuclear Factor kappa-light-chain-enhancer of activated B cells |
| LMR | lymphoid-to-myeloid ratio |
References
- Brandhorst, S.; Choi, I.Y.; Wei, M.; Cheng, C.W.; Sedrakyan, S.; Navarrete, G.; Dubeau, L.; Yap, L.P.; Park, R.; Vinciguerra, M.; et al. A Periodic Diet that Mimics Fasting Promotes Multi-System Regeneration, Enhanced Cognitive Performance, and Healthspan. Cell Metab. 2015, 22, 86–99. [Google Scholar] [CrossRef] [PubMed]
- Nencioni, A.; Caffa, I.; Cortellino, S.; Longo, V.D. Fasting and cancer: Molecular mechanisms and clinical application. Nat. Rev. Cancer 2018, 18, 707–719. [Google Scholar] [CrossRef] [PubMed]
- Longo, V.D.; Mattson, M.P. Fasting: Molecular mechanisms and clinical applications. Cell Metab. 2014, 19, 181–192. [Google Scholar] [CrossRef] [PubMed]
- Longo, V.D.; Anderson, R.M. Nutrition, longevity and disease: From molecular mechanisms to interventions. Cell 2022, 185, 1455–1470. [Google Scholar] [CrossRef] [PubMed]
- Koppold, D.A.; Breinlinger, C.; Hanslian, E.; Kessler, C.; Cramer, H.; Khokhar, A.R.; Peterson, C.M.; Tinsley, G.; Vernieri, C.; Bloomer, R.J.; et al. International consensus on fasting terminology. Cell Metab. 2024, 36, 1779–1794.e4. [Google Scholar] [CrossRef] [PubMed]
- Choi, I.Y.; Piccio, L.; Childress, P.; Bollman, B.; Ghosh, A.; Brandhorst, S.; Suarez, J.; Michalsen, A.; Cross, A.H.; Morgan, T.E.; et al. A Diet Mimicking Fasting Promotes Regeneration and Reduces Autoimmunity and Multiple Sclerosis Symptoms. Cell Rep. 2016, 15, 2136–2146. [Google Scholar] [CrossRef] [PubMed]
- Hartmann, A.M.; Dell’Oro, M.; Spoo, M.; Fischer, J.M.; Steckhan, N.; Jeitler, M.; Häupl, T.; Kandil, F.I.; Michalsen, A.; Koppold-Liebscher, D.A.; et al. To eat or not to eat—An exploratory randomized controlled trial on fasting and plant-based diet in rheumatoid arthritis (NutriFast-study). Front. Nutr. 2022, 9, 1030380. [Google Scholar] [CrossRef] [PubMed]
- Boccardi, V.; Pigliautile, M.; Guazzarini, A.G.; Mecocci, P. The Potential of Fasting-Mimicking Diet as a Preventive and Curative Strategy for Alzheimer’s Disease. Biomolecules 2023, 13, 1133. [Google Scholar] [CrossRef] [PubMed]
- Rangan, P.; Lobo, F.; Parrella, E.; Rochette, N.; Morselli, M.; Stephen, T.L.; Cremonini, A.L.; Tagliafico, L.; Persia, A.; Caffa, I.; et al. Fasting-Mimicking Diet Cycles Reduce Neuroinflammation to Attenuate Cognitive Decline in Alzheimer’s Models. Cell Rep. 2022, 40, 111417. [Google Scholar] [CrossRef] [PubMed]
- Vernieri, C.; Fucà, G.; Ligorio, F.; Huber, V.; Vingiani, A.; Iannelli, F.; Raimondi, A.; Rinchai, D.; Frigè, G.; Belfiore, A.; et al. Fasting-Mimicking Diet Is Safe and Reshapes Metabolism and Antitumor Immunity in Patients with Cancer. Cancer Discov. 2022, 12, 90–107. [Google Scholar] [CrossRef] [PubMed] [PubMed Central]
- de Groot, S.; Lugtenberg, R.T.; Cohen, D.; Welters, M.J.; Ehsan, I.; Vreeswijk, M.P.; Smit, V.T.; de Graaf, H.; Heijns, J.B.; Portielje, J.E.; et al. Fasting mimicking diet as an adjunct to neoadjuvant chemotherapy for breast cancer in the multicentre randomized phase 2 DIRECT trial. Nat. Commun. 2020, 11, 3083. [Google Scholar] [CrossRef] [PubMed]
- Di Biase, S.; Lee, C.; Brandhorst, S.; Manes, B.; Buono, R.; Cheng, C.-W.; Cacciottolo, M.; Martin-Montalvo, A.; de Cabo, R.; Wei, M.; et al. Fasting-Mimicking Diet Reduces HO-1 to Promote T Cell-Mediated Tumor Cytotoxicity. Cancer Cell 2016, 30, 136–146. [Google Scholar] [CrossRef] [PubMed]
- de Gruil, N.; Pijl, H.; van der Burg, S.H.; Kroep, J.R. Short-Term Fasting Synergizes with Solid Cancer Therapy by Boosting Antitumor Immunity. Cancers 2022, 14, 1390. [Google Scholar] [CrossRef] [PubMed] [PubMed Central]
- Brandhorst, S.; Levine, M.E.; Wei, M.; Shelehchi, M.; Morgan, T.E.; Nayak, K.S.; Dorff, T.; Hong, K.; Crimmins, E.M.; Cohen, P.; et al. Fasting-mimicking diet causes hepatic and blood markers changes indicating reduced biological age and disease risk. Nat. Commun. 2024, 15, 1309. [Google Scholar] [CrossRef] [PubMed]
- Wei, M.; Brandhorst, S.; Shelehchi, M.; Mirzaei, H.; Cheng, C.W.; Budniak, J.; Groshen, S.; Mack, W.J.; Guen, E.; Di Biase, S.; et al. Fasting-mimicking diet and markers/risk factors for aging, diabetes, cancer, and cardiovascular disease. Sci. Transl. Med. 2017, 9, eaai8700. [Google Scholar] [CrossRef] [PubMed]
- Harvie, M.; Howell, A. Potential Benefits and Harms of Intermittent Energy Restriction and Intermittent Fasting Amongst Obese, Overweight and Normal Weight Subjects-A Narrative Review of Human and Animal Evidence. Behav. Sci. 2017, 7, 4. [Google Scholar] [CrossRef] [PubMed]
- Hutchison, A.T.; Regmi, P.; Manoogian, E.N.C.; Fleischer, J.G.; Wittert, G.A.; Panda, S.; Heilbronn, L.K. Time-Restricted Feeding Improves Glucose Tolerance in Men at Risk for Type 2 Diabetes: A Randomized Crossover Trial. Obesity 2019, 27, 724–732. [Google Scholar] [CrossRef] [PubMed]
- Longo, V.D.; Di Tano, M.; Mattson, M.P.; Guidi, N. Intermittent and periodic fasting, longevity and disease. Nat. Aging 2021, 1, 47–59. [Google Scholar] [CrossRef] [PubMed]
- Lee, C.; Safdie, F.M.; Raffaghello, L.; Wei, M.; Madia, F.; Parrella, E.; Hwang, D.; Cohen, P.; Bianchi, G.; Longo, V.D. Reduced levels of IGF-I mediate differential protection of normal and cancer cells in response to fasting and improve chemotherapeutic index. Cancer Res. 2010, 70, 1564–1572. [Google Scholar] [CrossRef] [PubMed]
- Safdie, F.M.; Dorff, T.; Quinn, D.; Fontana, L.; Wei, M.; Lee, C.; Cohen, P.; Longo, V.D. Fasting and cancer treatment in humans: A case series report. Aging 2009, 1, 988–1007. [Google Scholar] [CrossRef] [PubMed]
- Raffaghello, L.; Lee, C.; Safdie, F.M.; Wei, M.; Madia, F.; Bianchi, G.; Longo, V.D. Starvation-dependent differential stress resistance protects normal but not cancer cells against high-dose chemotherapy. Proc. Natl. Acad. Sci. USA 2008, 105, 8215–8220. [Google Scholar] [CrossRef] [PubMed]
- Pearce, E.L.; Walsh, M.C.; Cejas, P.J.; Harms, G.M.; Shen, H.; Wang, L.-S.; Jones, R.G.; Choi, Y. Enhancing CD8 T-cell memory by modulating fatty acid metabolism. Nature 2009, 460, 103–107. [Google Scholar] [CrossRef] [PubMed]
- Chi, H. Regulation and function of mTOR signalling in T cell fate decisions. Nat. Rev. Immunol. 2012, 12, 325–338. [Google Scholar] [CrossRef] [PubMed]
- Takakuwa, T.; Nakashima, Y.; Koh, H.; Nakane, T.; Nakamae, H.; Hino, M. Short-Term Fasting Induces Cell Cycle Arrest in Immature Hematopoietic Cells and Increases the Number of Naïve T Cells in the Bone Marrow of Mice. Acta Haematol. 2019, 141, 189–198. [Google Scholar] [CrossRef] [PubMed]
- Abdulrahman, Z.; Santegoets, S.J.; Sturm, G.; Charoentong, P.; Ijsselsteijn, M.E.; Somarakis, A.; Höllt, T.; Finotello, F.; Trajanoski, Z.; van Egmond, S.L.; et al. Tumor-specific T cells support chemokine-driven spatial organization of intratumoral immune microaggregates needed for long survival. J. Immunother. Cancer 2022, 10, e004346. [Google Scholar] [CrossRef] [PubMed]
- Abdulrahman, Z.; Kortekaas, K.E.; Welters, M.J.P.; van Poelgeest, M.I.E.; van der Burg, S.H. Monocyte infiltration is an independent positive prognostic biomarker in vulvar squamous cell carcinoma. Cancer Immunol. Immunother. 2024, 73, 166. [Google Scholar] [CrossRef] [PubMed] [PubMed Central]
- Subramanian, A.; Tamayo, P.; Mootha, V.K.; Mukherjee, S.; Ebert, B.L.; Gillette, M.A.; Paulovich, A.; Pomeroy, S.L.; Golub, T.R.; Lander, E.S.; et al. Gene set enrichment analysis: A knowledge-based approach for interpreting genome-wide expression profiles. Proc. Natl. Acad. Sci. USA 2005, 102, 15545–15550. [Google Scholar] [CrossRef] [PubMed]
- Liberzon, A.; Birger, C.; Thorvaldsdóttir, H.; Ghandi, M.; Mesirov, J.P.; Tamayo, P. The Molecular Signatures Database (MSigDB) hallmark gene set collection. Cell Syst. 2015, 1, 417–425. [Google Scholar] [CrossRef] [PubMed]
- Verdegaal, E.M.; Santegoets, S.J.; Welters, M.J.; de Bruin, L.; Visser, M.; van der Minne, C.E.; de Kok, P.M.; Loof, N.M.; Boekestijn, S.; Kroep, J.R.; et al. Timed adoptive T cell transfer during chemotherapy in patients with recurrent platinum-sensitive epithelial ovarian cancer. J. Immunother. Cancer 2023, 11, e007697. [Google Scholar] [CrossRef] [PubMed]
- Hunter, C.A.; Jones, S.A. IL-6 as a keystone cytokine in health and disease. Nat. Immunol. 2015, 16, 448–457, Erratum in Nat. Immunol. 2017, 18, 1271. https://doi.org/10.1038/ni1117-1271b. [Google Scholar] [CrossRef] [PubMed]
- Beyranvand Nejad, E.; Labrie, C.; van der Sluis, T.C.; van Duikeren, S.; Franken, K.L.M.C.; Roosenhoff, R.; Arens, R.; van Hall, T.; van der Burg, S.H. Interleukin-6-mediated resistance to immunotherapy is linked to impaired myeloid cell function. Int. J. Cancer 2021, 148, 211–225. [Google Scholar] [CrossRef] [PubMed] [PubMed Central]
- Wang, N.; Liang, H.; Zen, K. Molecular mechanisms that influence the macrophage m1-m2 polarization balance. Front. Immunol. 2014, 5, 614. [Google Scholar] [CrossRef] [PubMed]
- Hirai, H.; Yokota, A.; Tamura, A.; Sato, A.; Maekawa, T. Non-steady-state hematopoiesis regulated by the C/EBPβ transcription factor. Cancer Sci. 2015, 106, 797–802. [Google Scholar] [CrossRef] [PubMed]
- Paudel, S.; Ghimire, L.; Jin, L.; Jeansonne, D.; Jeyaseelan, S. Regulation of emergency granulopoiesis during infection. Front. Immunol. 2022, 13, 961601. [Google Scholar] [CrossRef] [PubMed]
- Belge, K.U.; Dayyani, F.; Horelt, A.; Siedlar, M.; Frankenberger, M.; Frankenberger, B.; Espevik, T.; Ziegler-Heitbrock, L. The proinflammatory CD14+CD16+DR++ monocytes are a major source of TNF. J. Immunol. 2002, 168, 3536–3542. [Google Scholar] [CrossRef] [PubMed]
- Gilliet, M.; Cao, W.; Liu, Y.J. Plasmacytoid dendritic cells: Sensing nucleic acids in viral infection and autoimmune diseases. Nat. Rev. Immunol. 2008, 8, 594–606. [Google Scholar] [CrossRef] [PubMed]
- Rea, I.; McNerlan, S.; Alexander, H. CD69, CD25, and HLA-DR Activation Antigen Expression on CD3+ Lymphocytes and Relationship to Serum TNF-Alpha, IFN-Gamma, and SIL-2R Levels in Aging. Exp. Gerontol. 1999, 34, 79–93. [Google Scholar] [CrossRef] [PubMed]
- Tanaka, J.; Tutumi, Y.; Li, Z.; Katho, N.; Sugita, J.; Mori, A.; Toyoshima, N.; Ota, S.; Kobayashi, M.; Kasai, M.; et al. Induction of CD94/NKG2A expression on T cells in mixed lymphocyte culture by CD14+ cells from granulocyte colony-stimulating factor-mobilized peripheral blood mononuclear cells. Br. J. Haematol. 2002, 117, 751–754. [Google Scholar] [CrossRef] [PubMed]
- McMahon, C.W.; Zajac, A.J.; Jamieson, A.M.; Corral, L.; Hammer, G.E.; Ahmed, R.; Raulet, D.H. Viral and bacterial infections induce expression of multiple NK cell receptors in responding CD8(+) T cells. J. Immunol. 2002, 169, 1444–1452. [Google Scholar] [CrossRef] [PubMed]
- Oudmaijer, C.A.J.; Komninos, D.S.J.; Ozinga, R.A.; Smit, K.; Rozendaal, N.E.M.; Hoeijmakers, J.H.J.; Vermeij, W.P.; Aerts, J.G.J.V.; IJzermans, J.N.M.; Willemsen, M. Short-term fasting before living kidney donation has an immune-modulatory effect. Front. Immunol. 2025, 16, 1488324. [Google Scholar] [CrossRef] [PubMed]
- Lu, Y.; Wang, Y.; Ruan, T.; Wang, Y.; Ju, L.; Zhou, M.; Liu, L.; Yao, D.; Yao, M. Immunometabolism of Tregs: Mechanisms, adaptability, and therapeutic implications in diseases. Front. Immunol. 2025, 16, 1536020. [Google Scholar] [CrossRef] [PubMed]
- Bulygin, A.S.; Khantakova, J.N.; Shkaruba, N.S.; Shiku, H.; Sennikov, S.S. The role of metabolism on regulatory T cell development and its impact in tumor and transplantation immunity. Front. Immunol. 2022, 13, 1016670. [Google Scholar] [CrossRef] [PubMed] [PubMed Central]
- Tomaszewicz, M.; Ronowska, A.; Zieliński, M.; Jankowska-Kulawy, A.; Trzonkowski, P. T regulatory cells metabolism: The influence on functional properties and treatment potential. Front. Immunol. 2023, 14, 1122063. [Google Scholar] [CrossRef] [PubMed]
- Lochner, M.; Berod, L.; Sparwasser, T. Fatty acid metabolism in the regulation of T cell function. Trends Immunol. 2015, 36, 81–91. [Google Scholar] [CrossRef] [PubMed]
- Pietrocola, F.; Pol, J.; Vacchelli, E.; Rao, S.; Enot, D.P.; Baracco, E.E.; Levesque, S.; Castoldi, F.; Jacquelot, N.; Yamazaki, T.; et al. Caloric restriction mimetics enhance anticancer immunosurveillance. Cancer Cell 2016, 30, 136–146. [Google Scholar] [CrossRef] [PubMed]
- Jordan, S.; Tung, N.; Casanova-Acebes, M.; Chang, C.; Cantoni, C.; Zhang, D.; Wirtz, T.H.; Naik, S.; Rose, S.A.; Brocker, C.N.; et al. Dietary Intake Regulates the Circulating Inflammatory Monocyte Pool. Cell 2019, 178, 1102–1114.e17. [Google Scholar] [CrossRef] [PubMed] [PubMed Central]
- Snodgrass, R.G.; Stephensen, C.B.; Laugero, K.D. Atypical monocyte dynamics in healthy humans in response to fasting and refeeding are distinguished by fasting HDL and postprandial cortisol. Am. J. Physiol. Endocrinol. Metab. 2024, 327, E229–E240. [Google Scholar] [CrossRef] [PubMed] [PubMed Central]
- Faris, M.A.-I.E.; Kacimi, S.; Al-Kurd, R.A.; Fararjeh, M.A.; Bustanji, Y.K.; Mohammad, M.K.; Salem, M.L. Intermittent fasting during Ramadan attenuates proinflammatory cytokines and immune cells in healthy subjects. Nutr. Res. 2012, 32, 947–955. [Google Scholar] [CrossRef] [PubMed]



Disclaimer/Publisher’s Note: The statements, opinions and data contained in all publications are solely those of the individual author(s) and contributor(s) and not of MDPI and/or the editor(s). MDPI and/or the editor(s) disclaim responsibility for any injury to people or property resulting from any ideas, methods, instructions or products referred to in the content. |
© 2026 by the authors. Licensee MDPI, Basel, Switzerland. This article is an open access article distributed under the terms and conditions of the Creative Commons Attribution (CC BY) license.