


Abstract
Children with disabilities have higher prevalence estimates of obesity than typically developing children. The Healthy Caregivers–Healthy Children Phase 3 (HC3) project implemented an obesity prevention program adapted for children with special health care needs (CSHCN) that includes dietary intake and physical activity (PA) components. The primary outcome was a change in dietary intake, PA, and the body mass index (BMI) percentile. Ten childcare centers (CCCs) serving low-resource families with ≥30 2- to 5-year-olds attending were randomized to either the intervention (n = 5) or control (n = 5). The HC3 CCCs received (1) snack, beverage, PA, and screen time policies via weekly technical assistance; (2) adapted lesson plans for CSHCN; and (3) parent curricula. The control CCCs received a behavioral health attention curriculum. HC3 was delivered over three school years, with data collected at five different timepoints. It was delivered weekly for six months in year one. To ensure capacity building, the HC3 tasks were scaled back, with quarterly intervention delivery in year 2 and annually in year 3. Adaptations were made to the curriculum to ensure appropriate access for CSHCN. Given that the program was being delivered during the COVID-19 pandemic, special modifications were made to follow CDC safety standards. The primary outcome measures included the Environment and Policy Assessment and Observation (EPAO) tool, standardized dietary intake and PA assessments, and the child BMI percentile. CCCs are an ideal setting for targeting CSHCN for obesity prevention efforts as they provide an opportunity to address modifiable risk factors.
1. Introduction
One in four children in the US under the age of 5 years have either overweight (body mass index [BMI] >85th–< 95th percentile for age and sex) or obesity (BMI > 95th % for age and sex) [1]. In 2017–2018, the obesity prevalence was 13.4% among 2- to 5-year-olds [2]. Children with special health care needs (CSHCN) and ethnic minority children are disproportionately affected by the obesity epidemic [2,3]. Moving forward, CSHCN will be collectively defined as those with developmental, physical, or intellectual disabilities, with special emphasis on those with developmental disabilities as specified by the Child and Adolescent Health Measurement Initiative (CAMHI) [4]. Children at the intersection of these two disparities (ethnic minority status and CSHCN) have rarely been studied, yet obesity is 38% higher in CSHCN compared to their peers without disabilities and three to four times higher in non-Hispanic Black (NHB) and Hispanic preschool age children compared to non-Hispanic Whites (NHWs) [2,4,5]. These statistics are concerning because preschool-age children with obesity are (1) five times more likely to have overweight during adolescence, (2) four times more likely to have obesity as adults compared to their normal weight counterparts [6,7], and (3) contrary to popular belief, children do not “grow out of their baby fat”. In fact, excessive weight gain in the first five years of life can alter developing neural, metabolic and behavioral systems in ways that increase the risk of chronic disease (type 2 diabetes, cardiovascular disease, hypertension, and stroke) later in life [8,9]. Reports have shown that childhood-onset obesity significantly contributes to increased morbidity and mortality in adulthood [10], particularly among ethnic minority groups, who are disproportionately affected by many of these chronic conditions [11]. Our team has reported that not only are US adolescents with disabilities significantly more likely to have overweight and obesity compared to their peers with no disabilities, they are over three times as likely to have elevated blood pressure, insulin, lipids and metabolic syndrome, the hallmark precursors to type 2 diabetes [12].
Limited research exists on the causes, consequences, prevention, and treatment of obesity among CSHCN. Virtually no research has addressed the intersection of CSHCN and obesity prevention in the early childhood years (ages 2 to 5 years) or the preschool/childcare setting. Yet, the first years of life may present the best opportunity for obesity prevention. During early childhood, lifestyle behaviors that promote obesity are formed, and it is easier to establish new healthy-weight-promoting behaviors than to change poor, existing ones [13]. Childcare settings offer a potentially powerful infrastructure to implement such efforts because: (1) 50% of CSHCN are enrolled in daily, out-of-home childcare [14]; (2) CSHCN from low-income backgrounds consume 50–100% of their Recommended Dietary Allowances in the childcare setting [15]; (3) many children spend the majority of their waking hours out of home and in the childcare setting [16]; and (4) access to high-quality nutrition is a major health disparity [17].
This study was designed to build on our previously designed Healthy Caregivers–Healthy Children Phase 1 and Phase 2 programs. The goal of HC2 Phase 1 was to test effective healthy weight strategies in early childhood settings utilizing educators and parents as nutritional and physical activity gatekeepers and healthy lifestyle role models for 2- to 5-year-olds [18]. We developed and delivered a bilingual (English/Spanish) toolkit to increase dietary intakes of fruits and vegetables; decrease dietary intakes of foods high in solid fats and added sugars; decrease the amount of television viewing and computer use; increase physical activity in preschool children; and decrease the proportion of preschool children on an unhealthy growth trajectory [19]. The goal of HC2 Phase 2 was to test the effectiveness of implementing the HC2 curriculum via a Train-the-Trainer design [20]. Overall, the findings across both phases showed that our HC2 obesity prevention intervention (1) is effective in maintaining a healthy weight and decreasing the obesity prevalence in ethnically diverse preschoolers; (2) significantly improves the consumption of healthy foods, including fruits and vegetables; (3) significantly decreases the consumption of unhealthy foods; and (4) increases physical activity among children and their families [18]. In a sub-sample of CSHCN, we showed similar, promising results that support the expansion of HC2 among this group specifically [21,22]. Therefore, the primary Aim 1 of this Phase 3 Healthy Caregivers–Healthy Children (HC3) program was to adapt and evaluate our HC2 program to specifically include childcare centers serving low-income, multiethnic CSHCN. The secondary Aim 2 was to determine the mediators that could impact obesity-related outcomes within this population.
2. Materials and Methods
2.1. Study Design Overview
This 3-year randomized controlled cluster trial was conducted with 10 childcare centers—5 intervention and 5 control (ClinicalTrials.gov ID: NCT05106426). The measures were completed over the following 5 timepoints (T): T1 at the beginning of school year 1, or pre-intervention (Time 1 = baseline, October–December 2021); T2 at the completion of post-intervention (Time 2 = end of the first school year, April–June 2022); T3 at the beginning of the second school year (September 2022); T4 at the end of the second school year (April–June 2023); and T5 at the beginning of the third school year (October–December 2023).
2.2. Study Participants and Inclusion/Exclusion Criteria
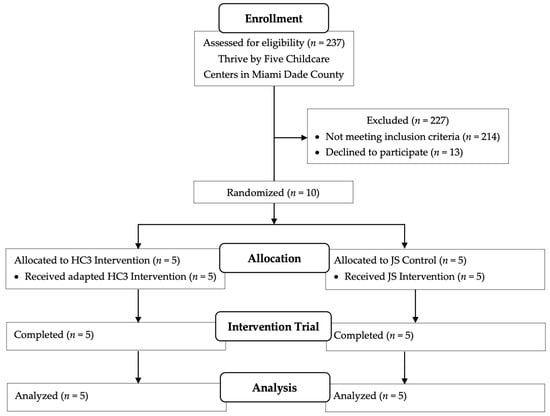
Childcare centers must have met the following criteria to be included in this study: (1) ≥30 children ages 2- to 5-years-old enrolled; (2) be located in a low-income census tract zone; (3) at least 50% of the children are ethnic minorities; (4) at least 10 children in the center with a disability or at risk of delays as per an evaluation; and (5) center directors and teachers agree to participate. Childcare centers were excluded if they did not meet these criteria (see Figure 1). Children were included if a parent/guardian consented to study participation. Children with feeding tubes, failure to thrive or children who bring their own meals due to dietary restrictions were excluded. It is likely that children with extreme allergies are not participating in group childcare settings as center directors indicate a very low number of children with any allergies or sensitivities at this time. Children identified by parents as failure to thrive (<5th BMI %ile) on the demographic form were excluded.
Figure 1.
CONSORT flow diagram.
2.3. Recruitment
Centers that were eligible were contacted by the program coordinator via telephone, and after being given a description of HC3, were asked to provide a verbal commitment of interest in participating. Study staff followed up with those centers that were interested in participating to obtain a signed consent form. Once a signed consent was obtained, study staff met with the center director to discuss the role their center would have in the study. Parents/guardians were recruited for study participation via verbal announcements, informational flyers, and letters sent home. Family members who returned a signed interest form were contacted by telephone. After verbal consent was obtained, an appointment was made for the child and parent to be seen at the childcare center, at which time the written informed consent from the parents was obtained and initial baseline data collected. Due to COVID-19, appointments had to be held outside of the center or indoors in an area designated by each center for parent drop off and pick up and in line with CDC guidelines on social distancing. Parents were also given an option to complete paperwork via phone or electronically through a secured REDCap server after obtaining a signed consent. In addition to following the childcare centers’ COVID-19 protocol, the research assistant also had to follow the university’s COVID-19 protocol, which was consistent with CDC guidelines and updated as new stipulations were released [23].
Primary caregivers were given a USD 20 gift card for completing the nutritional and physical activity assessment battery for their child. The same compensation schedule was used for the intervention and control participants. Incentives were issued for completion of pre-measures (Time 1 = baseline, October 2021) and at completion of all post-measures. We increased the incentives over the course of the study to assist with longitudinal retention. This compensation amount was appropriate, given that it took approximately 30 min to complete the assessment battery.
2.4. Measures
2.4.1. Intake Interview
Our HC2 baseline questionnaire was used to capture age, sex, and race/ethnicity (children and parents). Given the ethnically diverse target population, cultural influences were explored as possible moderators impacting HC2 adaption, such as language(s) spoken in the home and level of acculturation using the Stephenson Multigroup Acculturation Scale [24]. The Collins Figural Rating Scale [25], a common pictorial tool for measuring body figures in preschool children, was used to assess parent perception of child anthropometric phenotype status. Caregivers were asked to identify their child’s phenotype from the seven figures on the silhouette chart featuring preschool-aged figures. Images 1–3 are categorized as normal weight and images 4–7 are categorized as unhealthy weight [26]. Lastly, caregivers were asked to identify their child’s disability status and developmental milestones.
2.4.2. Child Food Intake
The child’s nutrition intake was measured by the (1) Healthy Kids Checklist (HKC) [27,28] and (2) Food Frequency Questionnaire (FFQ) [29]. The HKC is a parent-reported measure of child dietary intake at home of fat, fiber, fruit/vegetable, calcium/dairy, and sweetened beverages, as well as nutrition behaviors, including eating in restaurants, breakfast skipping, and physical activity habits, and parent role-modeling of healthy eating. The HKC uses visuals with text at a second-grade reading level and is validated for our target age population [27,28].
The FFQ measures nutritional behaviors at school based on center director reports of menu items served [29]. We have used this measure previously and modified it to include categories of food items with the frequency served per week (i.e., juice, 1% milk, fresh fruit etc.) [18,20].
2.4.3. Caregiver Nutrition and Physical Activity
The Fruit and Vegetable Inventory (13 psychosocial items) measures fruit and vegetable (FV) intake and perceived control, self-efficacy for eating healthier, readiness to eat more FV, and perceived diet quality [30]. It also measures role-modeling variables such as what items are consumed when their children are present.
The Physical Activity Self-Efficacy Scale is a 5-item reliable questionnaire that measures confidence regarding participation in physical activity (e.g., addresses overcoming barriers to becoming or being physically active) and role-modeling [31].
2.4.4. Anthropometric Variables
Height (stadiometer) and weight (digital scale) were collected for each child and converted to an age- and sex-adjusted BMI percentile (study primary outcome). The data collection methods were based on US Department of Health and Human Services (US HHS) guidelines [32].
2.4.5. The Health Environment Rating Scale
The Health Environment Rating Scale (HERS) is an observational measure that examines children’s levels of exposure to time spent in front of screens (sedentary behavior) and in physical activity, as well as the quality of food and beverage types served in the classroom [33]. Classrooms were observed for a 6 h period and were rated on 21 items that compose the 4 scales (screen time, physical activity time, beverage type, quality nutrition intake). Items were rated on a Likert scale from 1–7 (1 sub-optimal to 7 above optimal). Trained research assistants were required to reach 80% interrater reliability prior to conducting observations on their own.
2.4.6. The Environmental and Policy Outcomes
The Environmental and Policy Outcomes (EPAO) tool assessed the level of implementation of the HC2 policies through direct observation of the diet and physical activity environments in the childcare facilities [34]. The EPAO required a one-day evaluation that began from the first meal served to the last child that left the facility. It is the first tool to measure critical components such as the type of food served to children, teachers and facility staff. The scales directly match the HC3 toolkit policies. This was also a primary study measure conducted by a trained research assistant who met the interrater reliability of 80%.
All the study measures apart from the intake interview were collected at all five timepoints.
3. Intervention
3.1. Detailed Description of HC2 Tiers
This program was modeled after our USDA-funded Phase 1 and Phase 2 work that developed an obesity prevention program for childcare centers [18,20]. A general description of the HC2 toolkit can be found elsewhere [18,19]. In brief, the HC2 toolkit includes 42 lesson plans for teachers to use that show them a script for implementation and how each lesson plan meets the state of Florida classroom curriculum standards as defined by the Classroom Assessment Scoring System® (CLASS) [35]. In this current Phase 3, we have included recommended modifications for CSHCN. The HC2 toolkit consists of material designed to incorporate all the current nutrition and physical activity policy requirements for preschool children in Florida and embraces best-practice guidelines from the American Academy of Pediatrics Caring for Children, 3rd Edition [36], Let’s Move [37], and USDA Team Nutrition [38,39] as well as UM-developed policies guided by evidence-based research [18,19]. These policies are the foundation of the entire program and include: (1) Snack Policy—fresh fruits and vegetables and whole grains (no sweets, high-fat foods) are the snack foods of choice/preferred foods; (2) Beverage Policy—serve low-fat (1%) or nonfat milk only (no whole milk), serve juice only one time per week, make water available all day and encourage it as the beverage of choice; (3) Physical Activity Policy—at least 90 min of physical activity every day; and (4) Screen Time Policy—limits screen time to 30 min per week, which does not include screens used for educational purposes or for communication (i.e., ACC device, tablet, or smart board). Recommendations were made to the centers, and UM coaches provided weekly Technical Assistance visits to assist with toolkit implementation and address barriers. In addition, five parent and teacher role-modeling workshops were held that focused on one of the four policies and one on the adaptations for CSCHN. Both the parent and teacher curriculums mirror key concepts taught to the children so that caregivers can role model and reinforce topics their children receive in the classroom about healthy lifestyle choices. All the parent and teacher workshops were held at the childcare centers and delivered by the Curriculum Specialist. The toolkit is available in English and Spanish.
3.2. Adaptation of HC2 for CSHCN
Each month one of the policies was the focus of the intervention and thus adaptations were made to the corresponding lesson plans to accommodate CSHCN on a monthly basis. A team consisting of a dietitian, special educator, physical therapist, and pediatric psychologist met monthly to adapt the lesson plans. Table 1 provides a summary of the modifications that were made to the HC3 curriculum based on the disability type and for the four program policies. For example, children with intellectual disabilities may need support in self-help skills, problem solving, and learning; children with physical disabilities may need support to address fine and gross motor skills; and children with ASD may need support in behavior, social skills, and communication. For children with more complex special needs, a physical therapist and a special educator were available to further modify the curriculum based on the child’s individual education plan (IEP).
Table 1.
Modification of the curriculum based on the policy and disability eligibility category of the child’s IEP.
The curriculum included 42 lesson plans, and each lesson plan had its own page of the general adaptations that could be utilized if that classroom had CSHCN. Adaptations to the curriculum were based on recommended practices by the Division for Early Childhood (DEC), which are evidenced-based strategies to support the needs of young children with disabilities [42]. DEC Recommended Practices emphasize the use of assistive technology adaptations and strategies to promote access to and participation in early learning experiences [42]. As shown in Table 2, suggestions for six different adaptations were utilized that included considerations for fine motor, gross motor, visual, social-emotional, communication, and participation challenges. A variety of assistive technology tools, such as visual supports, adapted books, switch-activated toys, visual timer, and book stands, were included to accommodate a wide range of abilities. Not all the adaptations were needed for all the lesson plans. Depending on the lesson plan, anywhere from one to all six adaptations may have been necessary.
Table 2.
List of adaptation materials based on types of special needs.
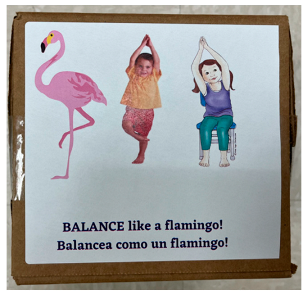
Table 3 demonstrates a sample lesson plan and how the adaptations for CSHCN are embedded into the curriculum. For this lesson plan, which focused on physical activity by having children participate in yoga, adaptations were needed that included the use of visual aids, communication aides, and gross motor aides. The study team was available to make further accommodations for individual students based on their IEP.
Table 3.
Sample lesson plan for the HC3 physical activity curriculum policy.
3.3. Adaptations Based on the COVID-19 Pandemic
Given that COVID-19 posed many challenges for childcare centers, the curriculum was adapted to offer a telehealth delivery option. Depending on the variant spikes in Miami-Dade County, the centers limited the amount of in-person services they would allow in their centers due to the risk of transmission of the virus. The curriculum began in January 2022 during a spike of the Omicron variant and so for the month of January services had to be implemented virtually. The childcare centers used an iPad and were taught how to use Zoom for business. A Zoom account was set up for all the centers that did not already have one. Weekly consultations were held virtually with teachers during lunch time or breaks. Parent workshops were held virtually one time per month, in which all participating parents from all five centers were invited to participate. As COVID-19 rates fluctuated and declined, the use of a hybrid model in which there were some in-person and some virtual workshops and consultations became an option.
3.4. Control Condition
Those centers randomized to the control arm received an attention control consisting of Jump Start, a behavioral support consultation program. Consultants virtually implemented the Jump Start program at the same level of exposure and contact time as the treatment arm. The control centers received all the same pre–post measures and incentives as the intervention arm (to ensure retention/reduce loss to follow up). The Jump Start program has been in existence for 4 years and has already been targeted for CSHCN, so it did not need to be adapted.
4. Analysis Plan
The analysis plan will include hierarchical linear (i.e., multilevel) growth modeling techniques (data are currently being analyzed). The cluster-randomized design of this study yields a so-called 3-level model, where repeated measures are nested within children (level 1), individual teachers and parents (level 2), and children, teachers and parents are nested within preschools/childcare centers (level 3). This basic modeling framework will be used for all the repeated measures outcomes (e.g., parent and teacher efficacy measures and child BMI). Moreover, the statistical model can be expanded to address the relevant moderating effects, and thus, it is an ideal statistical method to apply to our proposed study, given our exploratory approach in Aim 2 in particular. However, in terms of both study aims, we are specifically interested in what it is about the system (e.g., childcare center/preschool, home environment) that might influence a child’s BMI. A simple way to examine this is to explore other study measurements and see how they may vary between the treatment and control conditions. This is perhaps the simplest method and has also been called a “secondary outcomes” approach [43]. This may be regarded as a first step approach in “exploring” for possible moderators and/or mediators. As an example, if the teacher’s “healthy lifestyle role-modeling scores” are higher in the treatment than the control group, then it might be the case that modeling influenced the system (given that there was a treatment effect on BMI). However, one can quickly see that this approach can create many different explanations, which is why the approach is labeled “exploratory”. Specifically, in Aim 2, we can model the outcome (e.g., BMI) and then, along with the treatment classification, include other variables (e.g., ethnicity, level of parent and/or role modeling, agency adherence to curriculum) we predict may moderate the treatment effect. These other variables will primarily need to be measured at the subject (individual) level. The issues with nested effects only apply to methodology that involves the generation of p values (inferential stats), so variables measured at the teacher or family level could be included here.
Power Analysis
Within the cost and time limitations of the current grant, the maximum number of schools in which a designed randomized trial is possible is 10 (5 CCC in each arm; intervention versus control). The CCC is the primary unit of analysis as this is the level in which the intervention will be applied. Past research has shown that the intraclass correlation (i.e., within school dependency of students within a school) is, in general, very low and for all practical purposes close to zero [44]. Given the standard deviation of the student-to-student BMI z scores is by definition 1.0, and it is expected that, on average, the number of students per school will be approximately 30 (accounting for a 10% attrition rate) the school-to-school variation (i.e., standard deviation) should be approximately 0.1690 standard deviation units. Given these estimates, we determined how much of a statistical difference in the BMI z scores can be detected for a given power (i.e., 0.80) using a Type I error rate of 5% (two-tailed). Assuming that the correlation of the pre to post BMI z scores is fairly high (i.e., 0.80; which is roughly equivalent to the reliability coefficient of the BMI), the standard deviation of the difference in the BMI z scores (i.e., post–pre) works out to approximately 0.1070. The detectable effect size equates to a Cohen’s d statistic of 0.20. According to Cohen’s taxonomy, this would be considered a “small” effect with a corresponding R2 (i.e., percent variance explained of 1%) [44].
5. Discussion
While numerous studies have found the prevalence of obesity is higher among CSHCN than in the general population, limited research exists on the contributing factors, consequences, prevention, and treatment of overweight and obesity among CSHCN, especially very young children. To compound this issue, even at young age, children who are from ethnic minorities with a disability are disproportionately affected [45]. Article 25 of the Convention on the Rights of Persons with Disabilities states that persons with disabilities not be withheld from access to mainstream health promotion programs [46]. We are addressing this critical gap, given there is limited research on interventions that target CSHCN in childcare settings, particularly among those from ethnic minority groups [47].
5.1. Barriers to and Facilitators of Implementation
Addressing the barriers faced by children with special healthcare needs (CSHCN) in participating in health and wellness programs requires a multifaceted approach. One significant barrier is the lack of teacher training and awareness on how to include CSHCN in such programs, alongside limited access to information and resources. Simple modifications based on identified disabilities, as outlined in Table 1; Table 2, offer potential solutions. Additionally, adapting the curriculum to ensure inclusivity and providing support to teachers to address implementation barriers are crucial elements of the weekly technical assistance. By implementing such programs, we can enhance our understanding of the obesity risk factors in CSHCN, thus bolstering the evidence base for wellness-promoting policies in childcare centers. Effective delivery strategies in targeted preschools can mitigate health disparities and improve the well-being of early childhood populations, which is particularly important in reducing obesity rates. Furthermore, amidst the ongoing challenges posed by COVID-19, childcare centers must adapt interventions to comply with CDC guidelines on social distancing and mask usage. While these guidelines have hindered in-person interventions like HC3, virtual modifications have shown promise in offering adaptable curriculum and equipment, thus ensuring continued support for CSHCN in maintaining healthy weights despite the pandemic’s constraints.
5.2. Childcare Centers and Role-Modeling as a Medium for Change
Childcare centers are an ideal setting for targeting this population because they provide an opportunity to modify most risk factors for childhood-onset obesity, including increased physical activity, provision of healthy nutrition, and healthy lifestyle education. A program such as ours that targets younger children is likely to be more successful because eating patterns are less rigid earlier in a child’s life. Furthermore, we include the family and home environment, given the importance that parents/caregivers play in shaping the dietary patterns of children. If home and parent/caregiver practices are unhealthy, it can put young children at risk of obesity because they depend on adults for their nutritional needs [48]. Young children learn by observing the behavior of the important adults in their lives, and if their parent/caregiver enjoys a particular food, a young child is likely to view that food as a safe and nutritious choice to try for themselves. Parents/caregivers have an impact on the nutritional habits of the children under their care, not only by making choices regarding the types of foods that are available but also by influencing children’s attitudes and beliefs about those foods. The USDA’s concept of the “nutritional gatekeeper” suggests that the person buying and serving the food, which is most often a parent/caregiver, has a powerful impact on the child’s outcomes [48]. Our multi-tiered design with opportunities for caregiver training and technical assistance will further address the needs of children with disabilities by acknowledging the other environmental and behavioral factors that parents/caregivers may face in serving healthy meals (stress of raising a child with CSHCN, picky eaters) and encouraging physical activity (need for increased supervision, additional opportunities to participate) [49,50,51].
6. Conclusions
Efforts to prevent obesity and overweight during early childhood among CSHCN have been scarce. Yet, supporting a healthy weight gain trajectory, quality nutritional intake and habits, and sedentary behavior would have substantial benefits for CSHCN, their families, and society at large. Examining the policies in the childcare setting specifically is needed, as this setting could be especially strategic for effective healthy weight development interventions. Our methods are replicable and scalable for testing the effects of obesity prevention programs in childcare centers and have the potential to improve early childhood nutrition and physical activity for those with special health care needs.
Author Contributions
Conceptualization, R.N. and S.E.M.; methodology, R.N., S.E.M. and J.P.; writing—original draft preparation, R.N. and M.S.; writing—review and editing, Y.A., S.E.M., J.H., M.S. and M.H.B.; supervision, J.P.; project administration, J.P., Y.A. and Y.P.; funding acquisition, R.N. and S.E.M. All authors have read and agreed to the published version of the manuscript.
Funding
This research was funded by the HRSA/Maternal Child Health Bureau, grant number R40MC41747.
Institutional Review Board Statement
This study was conducted in accordance with the Declaration of Helsinki, and it was approved by the Institutional Review Board of the University of Miami (protocol code 20210920 and approved on 4 October 2021).
Informed Consent Statement
Informed consent was obtained from all the subjects involved in the study.
Data Availability Statement
The original contributions presented in the study are included in the article, further inquiries can be directed to the corresponding author.
Acknowledgments
We would like to thank the childcare center staff, children, and families in Miami-Dade County who participated in this study.
Conflicts of Interest
The authors declare no conflicts of interest. The HRSA/Maternal Child Health Bureau had no role in the design of the study; in the collection, analyses, or interpretation of data; in the writing of the manuscript; or in the decision to publish the results.
References
- Ogden, C.L.; Carroll, M.D.; Kit, B.K.; Flegal, K.M. Prevalence of Childhood and Adult Obesity in the United States, 2011–2012. JAMA 2014, 311, 806–814. [Google Scholar] [CrossRef] [Scilit] [PubMed]
- Fryar, C.D.; Carroll, M.D.; Afful, J. Prevalence of Overweight, Obesity, and Severe Obesity among Children and Adolescents Aged 2–19 Years: United States, 1963–1965 through 2017–2018. NCHS Health E-Stats. 2020. Available online: https://www.cdc.gov/obesity/data/childhood.html (accessed on 16 February 2022).
- Kim, J.; Greaney, M.L. Prevalence of physical activity, screen time, and obesity among US children by the service type of special health care needs. Disabil. Health J. 2014, 7, 318–324. [Google Scholar] [CrossRef] [Scilit] [PubMed]
- Bethell, C.D.; Read, D.; Stein, R.E.; Blumberg, S.J.; Wells, N.; Newacheck, P.W. Identifying children with special health care needs: Development and evaluation of a short screening instrument. Ambul. Pediatr. 2002, 2, 38–48. [Google Scholar] [CrossRef] [Scilit] [PubMed]
- Messiah, S.E.; Arheart, K.L.; Lopez-Mitnik, G.; Lipshultz, S.E.; Miller, T.L. Ethnic group differences in cardiometabolic disease risk factors independent of body mass index among American youth. Obesity 2013, 21, 424–428. [Google Scholar] [CrossRef] [Scilit] [PubMed]
- Centers for Disease Control and Prevention. Obesity Declines among Low-Income Preschoolers. 2019. Available online: https://www.cdc.gov/nccdphp/dnpao/division-information/media-tools/dpk/vs-childhood-obesity/index.html# (accessed on 16 February 2022).
- Nader, P.R.; O’Brien, M.; Houts, R.; Bradley, R.; Belsky, J.; Crosnoe, R.; Friedman, S.; Mei, Z.; Susman, E.J. Identifying risk for obesity in early childhood. Pediatrics 2006, 118, e594–e601. [Google Scholar] [CrossRef] [Scilit] [PubMed]
- Birch, L.L.; Anzman, S.L. Learning to eat in an obesogenic environment: A developmental systems perspective on childhood obesity. Child Dev. Perspect. 2010, 4, 138–143. [Google Scholar] [CrossRef] [Scilit]
- Gluckman, P.D.; Hanson, M.A.; Cooper, C.; Thornburg, K.L. Effect of in utero and early-life conditions on adult health and disease. N. Engl. J. Med. 2008, 359, 61–73. [Google Scholar] [CrossRef] [Scilit] [PubMed]
- Sun, S.S.; Liang, R.; Huang, T.T.-K.; Daniels, S.R.; Arslanian, S.; Liu, K.; Grave, G.D.; Siervogel, R.M. Childhood obesity predicts adult metabolic syndrome: The Fels Longitudinal Study. J. Pediatr. 2008, 152, 191–200.e191. [Google Scholar] [CrossRef] [Scilit] [PubMed]
- Ogden, C.L.; Carroll, M.D.; Flegal, K.M. High body mass index for age among US children and adolescents, 2003–2006. JAMA 2008, 299, 2401–2405. [Google Scholar] [CrossRef] [Scilit] [PubMed]
- Messiah, S.E.; Vidot, D.C.; Somarriba, G.; Haney, K.; Aytur, S.; Natale, R.A.; Brosco, J.P.; Arheart, K.L. Obesity and cardiometabolic disease risk factors among US adolescents with disabilities. World J. Diabetes 2015, 6, 200. [Google Scholar] [CrossRef] [Scilit] [PubMed]
- McGuire, S. Institute of Medicine (IOM) Early Childhood Obesity Prevention Policies. Washington, DC: The National Academies Press; 2011. Adv. Nutr. 2012, 3, 56–57. [Google Scholar] [CrossRef] [Scilit] [PubMed]
- Knoche, L.; Peterson, C.A.; Edwards, C.P.; Jeon, H.-J. Child care for children with and without disabilities: The provider, observer, and parent perspectives. Early Child. Res. Q. 2006, 21, 93–109. [Google Scholar] [CrossRef] [Scilit]
- Fox, M.; Glantz, F.; Endahl, J.; Wilde, J. Early Childhood and Child Care Study; US Department of Agriculture: Alexandria, VA, USA, 1997.
- Fitzgibbon, M.L.; Stolley, M.R.; Dyer, A.R.; VanHorn, L.; KauferChristoffel, K. A community-based obesity prevention program for minority children: Rationale and study design for Hip-Hop to Health Jr. Prev. Med. 2002, 34, 289–297. [Google Scholar] [CrossRef] [Scilit] [PubMed]
- Zenk, S.N.; Schulz, A.J.; Israel, B.A.; James, S.A.; Bao, S.; Wilson, M.L. Neighborhood racial composition, neighborhood poverty, and the spatial accessibility of supermarkets in metropolitan Detroit. Am. J. Public Health 2005, 95, 660–667. [Google Scholar] [CrossRef] [Scilit] [PubMed]
- Natale, R.A.; Messiah, S.E.; Asfour, L.; Uhlhorn, S.B.; Delamater, A.; Arheart, K.L. Role modeling as an early childhood obesity prevention strategy: Effect of parents and teachers on preschool children’s healthy lifestyle habits. J. Dev. Behav. Pediatr. 2014, 35, 378–387. [Google Scholar] [CrossRef] [Scilit] [PubMed]
- Natale, R.; Scott, S.H.; Messiah, S.E.; Schrack, M.M.; Uhlhorn, S.B.; Delamater, A. Design and methods for evaluating an early childhood obesity prevention program in the childcare center setting. BMC Public Health 2013, 13, 78. [Google Scholar] [CrossRef] [Scilit] [PubMed]
- Messiah, S.E.; Lebron, C.; Moise, R.; Mathew, M.S.; Sardinas, K.; Chang, C.; Palenzuela, J.; Walsh, J.; Shelnutt, K.P.; Spector, R.; et al. Healthy caregivers-healthy children (HC2) phase 2: Integrating culturally sensitive childhood obesity prevention strategies into childcare center policies. Contemp. Clin. Trials 2017, 53, 60–67. [Google Scholar] [CrossRef] [Scilit] [PubMed]
- Natale, R.R.; Camejo, S.T.; Asfour, L.; Uhlhorn, S.B.; Delamater, A.; Messiah, S.E. Promoting healthy weight among children with developmental delays. J. Early Interv. 2017, 39, 51–65. [Google Scholar] [CrossRef] [Scilit]
- Natale, R.; Atem, F.D.; Lebron, C.; Mathew, M.S.; Weerakoon, S.M.; Martinez, C.C.; Shelnutt, K.P.; Spector, R.; Messiah, S.E. Cluster randomized trial of the impact of an obesity prevention intervention on child care center nutrition and physical activity environment over two years. Public Health Nutr. 2021, 25, 3172–3181. [Google Scholar] [CrossRef] [Scilit] [PubMed]
- Centers for Disease Control and Prevention. COVID-19: How to Protect Yourself & Others. 2022. Available online: https://www.cdc.gov/coronavirus/2019-ncov/prevent-getting-sick/prevention.html (accessed on 25 February 2022).
- Stephenson, M. Development and validation of the Stephenson Multigroup Acculturation Scale (SMAS). Psychol. Assess. 2000, 12, 77. [Google Scholar] [CrossRef]
- Collins, M.E. Body figure perceptions and preferences among preadolescent children. Int. J. Eat. Disord. 1991, 10, 199–208. [Google Scholar] [CrossRef] [Scilit]
- Xie, L.-Y.; Atem, F.D.; Bar, S.; Mathew, M.S.; Lebron, C.; Chang, C.; Natale, R.; Messiah, S.E. Relationship between parent perception of child anthropometric phenotype and body mass index change among children with developmental disabilities. World J. Pediatr. 2021, 17, 210–214. [Google Scholar] [CrossRef] [Scilit] [PubMed]
- Townsend, M.S.; Sylva, K.; Martin, A.; Metz, D.; Wooten-Swanson, P. Improving readability of an evaluation tool for low-income clients using visual information processing theories. J. Nutr. Educ. Behav. 2008, 40, 181–186. [Google Scholar] [CrossRef] [Scilit] [PubMed]
- Townsend, M.S.; Sylva, K.; Shilts, M.K.; Davidson, C.; Leavens, L.; Sitnick, S.L. Healthy Kids: Pediatric Obesity Risk Assessment Tool. [45 Items Reflecting 23 Behaviors and 12 Determinants of Obesity Identified in Our Research]. 2011. Available online: https://townsendlab.ucdavis.edu/evaluation-research-tools/validation-research/ (accessed on 16 February 2022).
- Willett, W.C.; Sampson, L.; Stampfer, M.J.; Rosner, B.; Bain, C.; Witschi, J.; Hennekens, C.H.; Speizer, F.E. Reproducibility and validity of a semiquantitative food frequency questionnaire. Am. J. Epidemiol. 1985, 122, 51–65. [Google Scholar] [CrossRef] [Scilit] [PubMed]
- Townsend, M.; Kaiser, L.; Designer, G.; Chao, L. Fruit and Vegetable Inventory; University of California Cooperative Extension and UC Davis: Davis, CA, USA, 2008. [Google Scholar]
- Marcus, B.H.; Selby, V.C.; Niaura, R.S.; Rossi, J.S. Self-efficacy and the stages of exercise behavior change. Res. Q. Exerc. Sport 1992, 63, 60–66. [Google Scholar] [CrossRef] [Scilit] [PubMed]
- Centers for Disease Control and Prevention. National Health and Nutrition Examination Survey (NHANES): National Youth Fitness Survey (NYFS) Body Measures Procedures Manual. 2012. Available online: https://www.cdc.gov/nchs/data/nnyfs/body_measures.pdf (accessed on 16 February 2022).
- Natale, R.; Page, M.; Sanders, L. Nutrition and physical activity practices in childcare centers versus family childcare homes. Early Child. Educ. J. 2014, 42, 327–334. [Google Scholar] [CrossRef] [Scilit]
- Ball, S.; Benjamin, S.; Hales, D.; Marks, J.; McWilliams, C.; Ward, D. The Environment and Policy Assessment and Observation (EPAO) Child Care Nutrition and Physical Activity Instrument; Center for Health Promotion and Disease Prevention, University of North Carolina: Chapel Hill, NC, USA, 2005. [Google Scholar]
- Downer, J.T.; López, M.L.; Grimm, K.J.; Hamagami, A.; Pianta, R.C.; Howes, C. Observations of teacher–child interactions in classrooms serving Latinos and dual language learners: Applicability of the Classroom Assessment Scoring System in diverse settings. Early Child. Res. Q. 2012, 27, 21–32. [Google Scholar] [CrossRef] [Scilit]
- American Academy of Pediatrics; American Public Health Association; National Resource Center for Health and Safety in Child Care and Early Education. Caring for Our Children: National Health and Safety Performance Standards: Guidelines for Early Care and Early Education Programs; American Academy of Pediatrics: Itasca, IL, USA, 2011. [Google Scholar]
- Nemours Children’s Health. Let’s Move! Child Care. Available online: https://healthykidshealthyfuture.org (accessed on 16 February 2022).
- Wansink, B. Nutritional gatekeepers and the 72% solution. J. Am. Diet. Assoc. 2006, 106, 1324–1327. [Google Scholar] [CrossRef] [Scilit] [PubMed]
- US Department of Agriculture Food and Nutrition Service. Child and Adult Care Food Program. Available online: http://www.fns.usda.gov/tn/team-nutrition (accessed on 16 February 2022).
- Hinckson, E.A.; Dickinson, A.; Water, T.; Sands, M.; Penman, L. Physical activity, dietary habits and overall health in overweight and obese children and youth with intellectual disability or autism. Res. Dev. Disabil. 2013, 34, 1170–1178. [Google Scholar] [CrossRef] [Scilit] [PubMed]
- Wind, W.M.; Schwend, R.M.; Larson, J. Sports for the physically challenged child. JAAOS-J. Am. Acad. Orthop. Surg. 2004, 12, 126–137. [Google Scholar] [CrossRef] [Scilit] [PubMed]
- Division for Early Childhood. DEC Recommended Practices in Early Intervention/Early Childhood Special Education 2014. 2014. Available online: https://www.dec-sped.org/dec-recommended-practices (accessed on 18 February 2022).
- Parker, R.A.; Weir, C.J. Multiple secondary outcome analyses: Precise interpretation is important. Trials 2022, 23, 27. [Google Scholar] [CrossRef] [Scilit] [PubMed]
- Cohen, J. Statistical Power Analysis for the Behavioral Sciences; Routledge: Milton, UK, 2013. [Google Scholar]
- Zablotsky, B.; Black, L.I.; Blumberg, S.J. Estimated Prevalence of Children with Diagnosed Developmental Disabilities in the United States, 2014–2016; National Center for Health Statistics: Hyattsville, MD, USA, 2017. [Google Scholar]
- United Nations Department of Economic and Social Affairs. Article 25 of the UN Convention on the Rights of Persons with Disabilities (CRPD). Available online: https://www.un.org/development/desa/disabilities/convention-on-the-rights-of-persons-with-disabilities/article-25-health.html (accessed on 18 February 2022).
- Abeysekara, P.; Turchi, R.; O’Neil, M. Obesity and children with special healthcare needs: Special considerations for a special population. Curr. Opin. Pediatr. 2014, 26, 508–515. [Google Scholar] [CrossRef] [Scilit] [PubMed]
- US Department of Health and Human Services; U.S. Department of Agriculture (HHS/USDA). Report of the Dietary Guidelines Advisory Committee on the Dietary Guidelines for Americans; USDA, Agricultural Research Service: Washington, DC, USA, 2010. [Google Scholar]
- Baxter, C.; Cummins, R.A.; Yiolitis, L. Parental stress attributed to family members with and without disability: A longitudinal study. J. Intellect. Dev. Disabil. 2000, 25, 105–118. [Google Scholar] [CrossRef] [Scilit]
- Olsen, S.F.; Marshall, E.S.; Mandleco, B.L.; Allred, K.W.; Dyches, T.T.; Sansom, N. Support, communication, and hardiness in families with children with disabilities. J. Fam. Nurs. 1999, 5, 275–291. [Google Scholar] [CrossRef] [Scilit]
- AbilityPath.org. Finding Balance: Obesity and Children with Special Needs. 2015. Available online: https://abilitypath.org (accessed on 18 February 2022).

Disclaimer/Publisher’s Note: The statements, opinions and data contained in all publications are solely those of the individual author(s) and contributor(s) and not of MDPI and/or the editor(s). MDPI and/or the editor(s) disclaim responsibility for any injury to people or property resulting from any ideas, methods, instructions or products referred to in the content. |
© 2024 by the authors. Licensee MDPI, Basel, Switzerland. This article is an open access article distributed under the terms and conditions of the Creative Commons Attribution (CC BY) license (https://creativecommons.org/licenses/by/4.0/).