


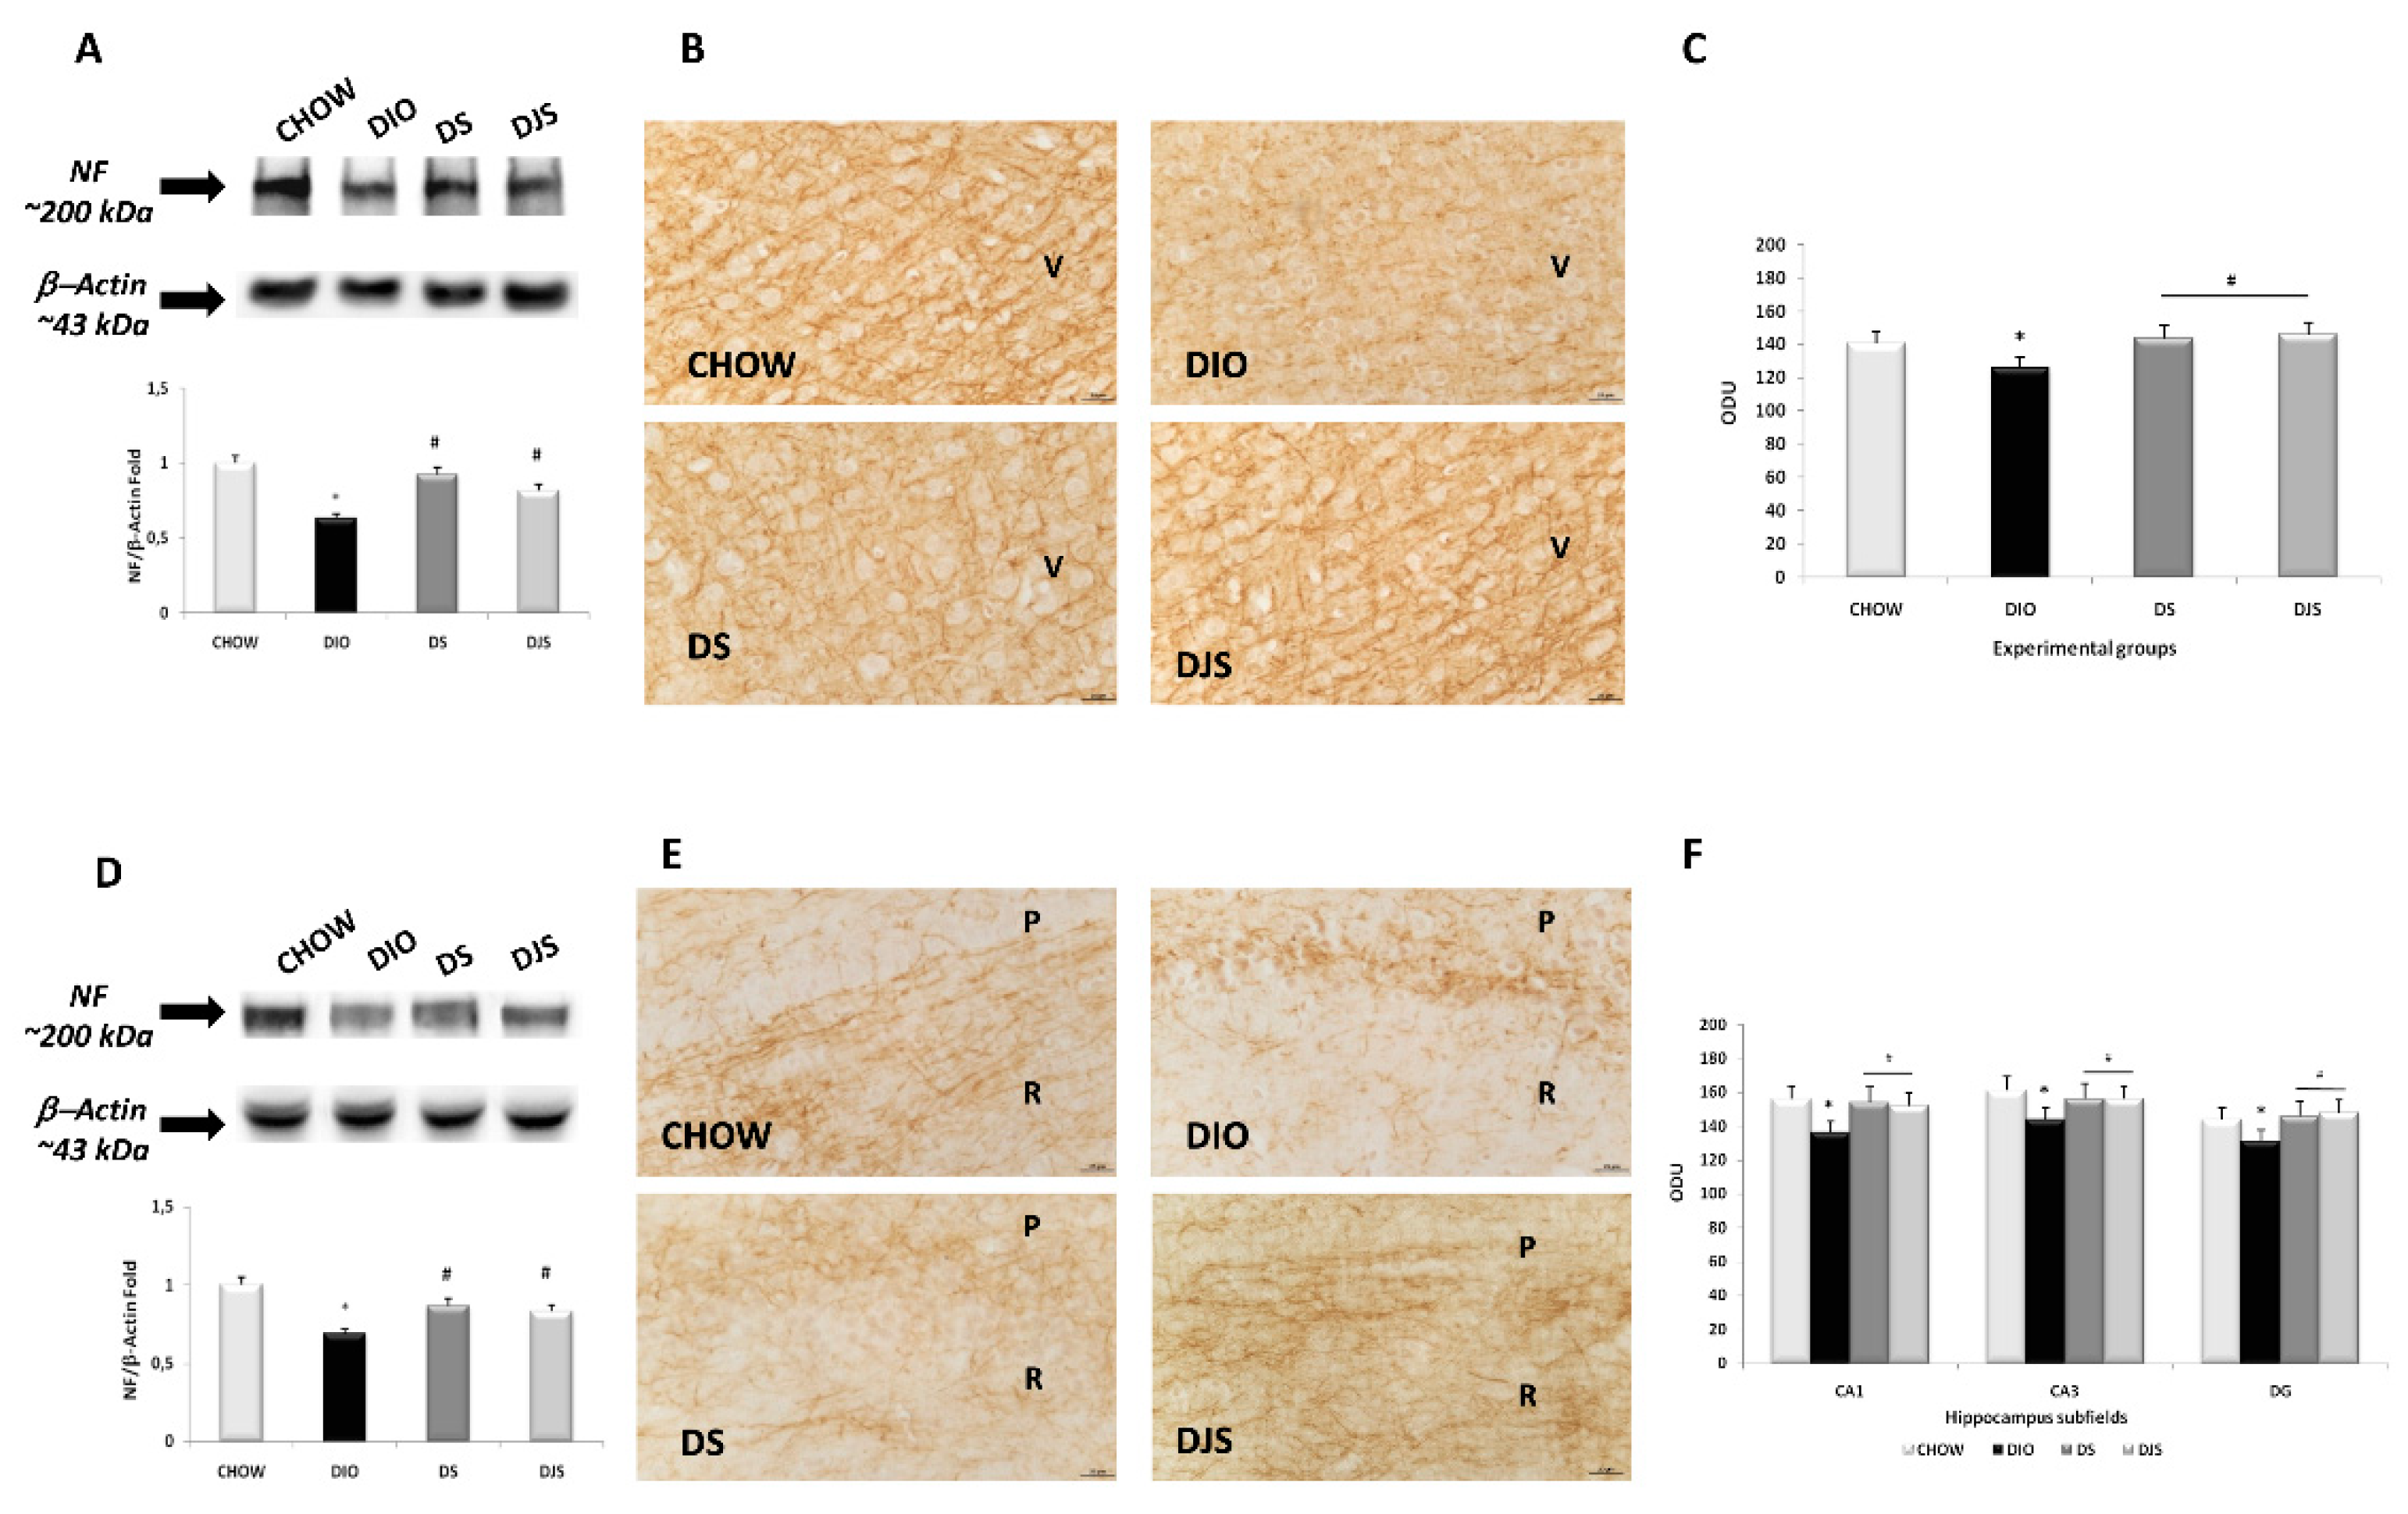
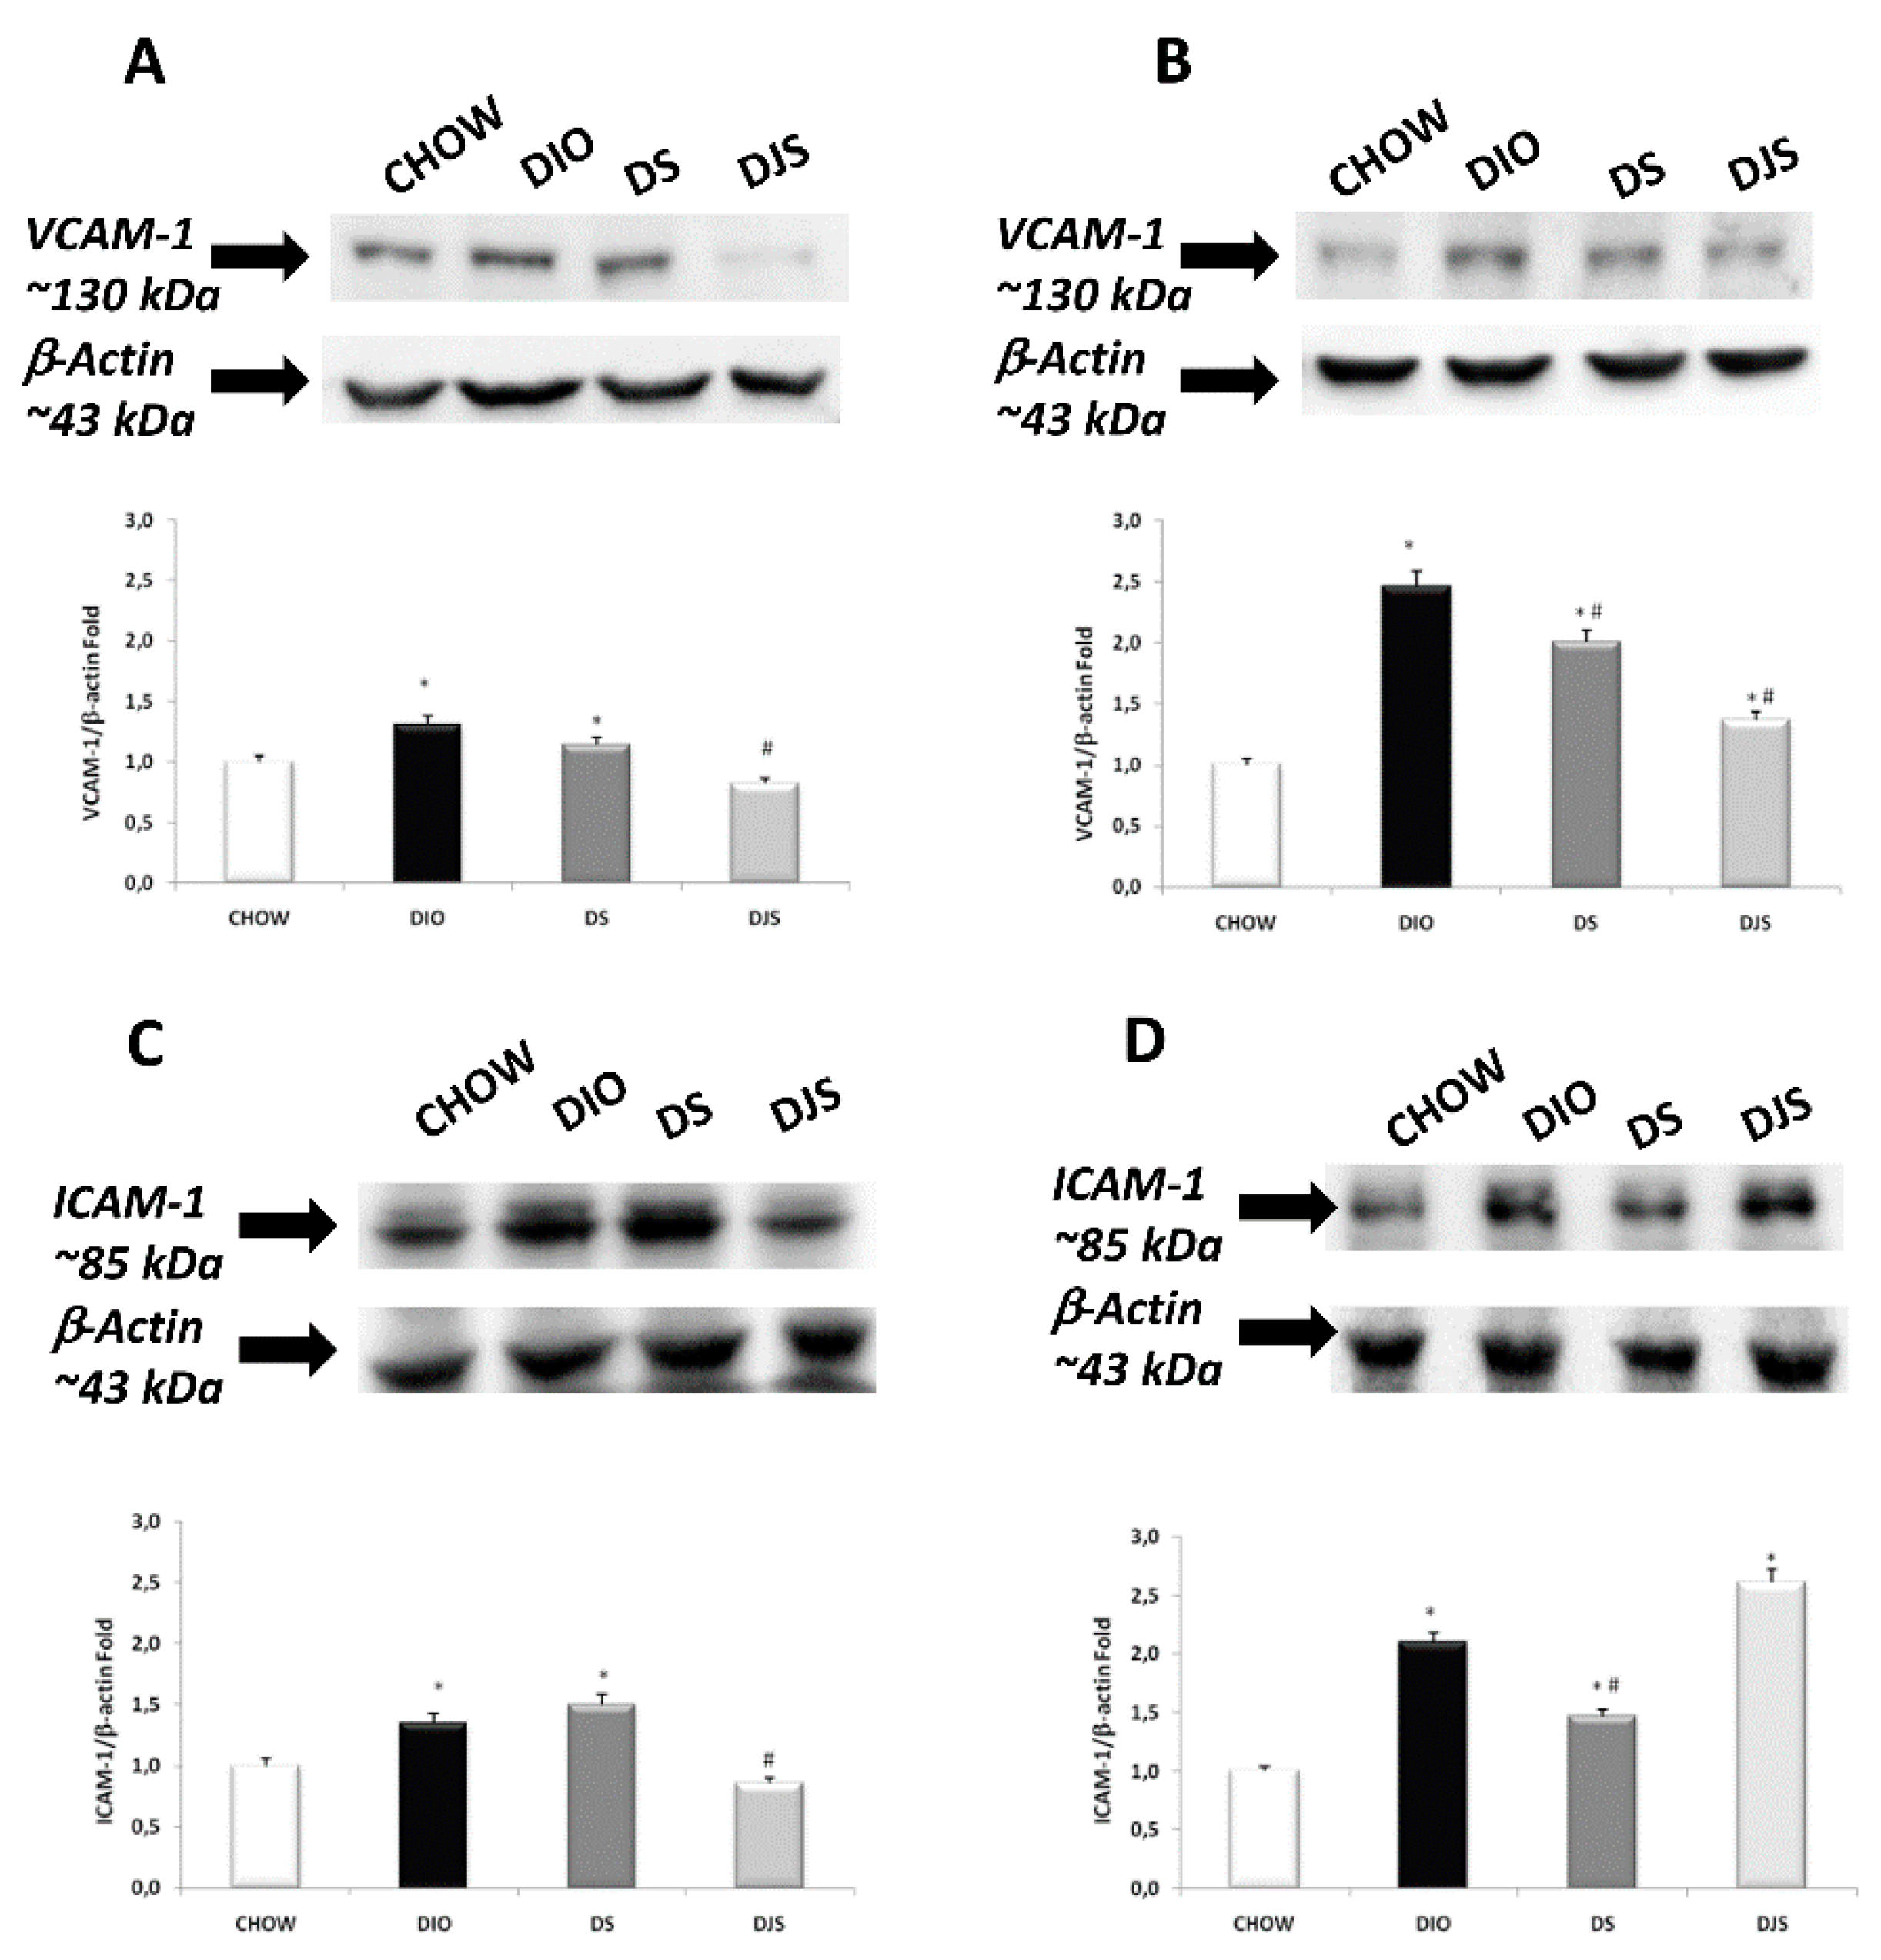
In the original publication [1], there were two mistakes in Figure 3 and Figure 7. Unfortunately, in Figure 3, panel E, an error occurred during assembly, with the wrong image used of DJS from our collection, which is now replaced with the correct image. Then, in Figure 7, the beta-actin blots were similar in different brain areas; as a result, we did not realize that there was an error during assembly, with the incorrect blot used in panel A. Figure 7 is now modified to show the correct blot. The corrected figures appear below.
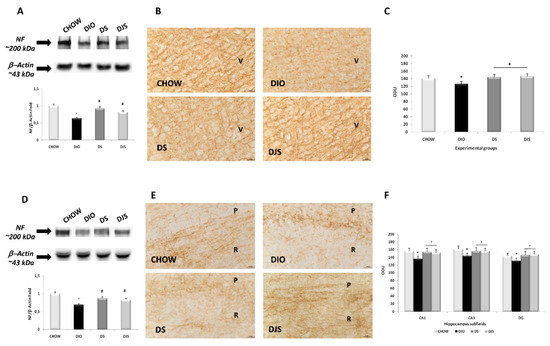
Figure 3.
Expression of neurofilament in the different brain areas. Western blot analysis (representative of three different experimental sessions) for samples of the frontal cortex (A) and hippocampus (D) were probed for NF and β-actin, with corresponding densitometric analysis of the bands. Sections of the frontal cortex (B) and CA1 subfield of the hippocampus (E) were processed for neurofilament immunohistochemistry, with densitometric analysis of the immunoreaction intensity for the frontal cortex (C) and hippocampus (F). V, the fifth layer of the frontal cortex; P, pyramidal neurons; R, stratum radiatum of the hippocampus. The values are the mean ± S.E.M.; * p < 0.05 vs. CHOW rats; # p < 0.05 vs. DIO rats. Calibration bar: 25 μm.
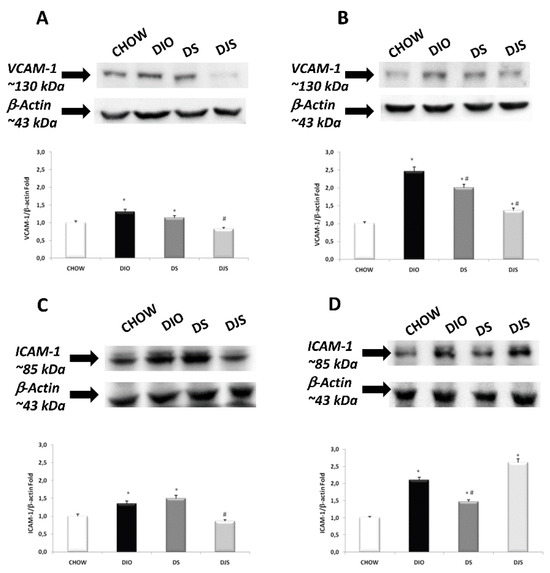
Figure 7.
Western blot analysis (representative of three different experimental sessions) for VCAM-1 in the frontal cortex (A) and hippocampus (B), and for ICAM-1 in the frontal cortex (C) and hippocampus (D) in the CHOW, DIO, DIO after supplementation with tart cherry seeds (DS), and DIO after supplementation with seeds and tart cherry juice (DJS) groups. Graphs represent the intensity of bands normalized to the band intensity of the reference protein β-actin. The values are the mean ± S.E.M.; * p < 0.05 vs. CHOW rats; # p < 0.05 vs. DIO rats.
The authors apologize for any inconvenience caused and wish to make clear that the scientific conclusions are unaffected by the corrections herein. These corrections were approved by the Academic Editor, and the original publication has also been updated.
Reference
- Micioni Di Bonaventura, M.V.; Martinelli, I.; Moruzzi, M.; Micioni Di Bonaventura, E.; Giusepponi, M.E.; Polidori, C.; Lupidi, G.; Tayebati, S.K.; Amenta, F.; Cifani, C.; et al. Brain Alterations in High Fat Diet Induced Obesity: Effects of Tart Cherry Seeds and Juice. Nutrients 2020, 12, 623. [Google Scholar] [CrossRef] [Scilit] [PubMed]
Disclaimer/Publisher’s Note: The statements, opinions and data contained in all publications are solely those of the individual author(s) and contributor(s) and not of MDPI and/or the editor(s). MDPI and/or the editor(s) disclaim responsibility for any injury to people or property resulting from any ideas, methods, instructions or products referred to in the content. |
© 2024 by the authors. Licensee MDPI, Basel, Switzerland. This article is an open access article distributed under the terms and conditions of the Creative Commons Attribution (CC BY) license (https://creativecommons.org/licenses/by/4.0/).