


Highlights
What are the main findings?
- A workflow integrating iPhone mobile sensor data (RGB, LiDAR depth, and FLIR One thermography) into 3D modeling pipelines is presented, enabling the creation of thermal mosaics, maintaining full 16-bit radiometric information.
- A stereo calibration model enabling effective registration and the fusion of multi-modal inputs from the iPhone sensor stack and FLIR One thermographic module is introduced.
What are the implications of the main findings?
- Low-cost mobile devices can produce 3D thermographic mosaics with resolutions of within several millimeters for capture distances of less than 5 m, democratizing thermal diagnostics for built and heritage environments.
- Open-source methodologies for radiometric data extraction and multi-sensor fusion enable reproducible scientific analysis without reliance on proprietary processing.
Abstract
Infrared thermography provides key information for a wide range of diagnostic applications within built and natural environments. As thermal states are changing with ambient conditions, it is important to deploy thermal imaging systems and operators opportunistically. It is therefore an attractive proposition to make these systems more affordable and accessible. Low-cost thermal sensors generally produce low-resolution outputs. To increase data density across large subjects, diagnosticians may create image mosaics from multiple overlapping thermographs. The registration of individual inputs into large mosaics is aided by the acquisition of additional sensor data (photographs and depthmaps), which can provide critical spatial references. In many cases, the materials inherent to the modern built environment present challenges to traditional data registration workflows between multiple sensor streams. Mobile devices offer an opportunity to innovate in the creation of these mosaics, integrating rapid geospatial mapping functionality with radiometric thermography within a 3D context. In this paper the authors evaluate the FLIR One Pro thermal camera module along with iOS/iPhone specific rapid mapping capabilities, and present a methodology: (1) introducing a workflow for the integration of short-range (within 0.3–5 m capture distance) iPhone mobile sensor data into modeling pipelines; (2) introducing a calibration model enabling effective registration and fusion of multi-modal inputs from the iPhone mobile sensor stack and FLIR One thermographic module; and (3) detailing an alternative open-source methodology for the evaluation and translation of thermographic imagery for multi-sensor fusion. The end product of this pipeline is a 3D radiometric thermographic mosaic: a spatially continuous, textured surface model in which hundreds of individual low-resolution thermographs are fused into a single queryable output retaining full 16-bit temperature values at every point. All datasets have been made openly available and the two case studies used in this paper have been made accessible at full resolution for interactive 3D online viewing.
1. Introduction
Infrared thermography (TIR) is a powerful tool for the interpretation of the built environment, but the data can be difficult to manage. The sensors are generally low-resolution, and the thorough investigation of large areas requires the acquisition of many images. Commercial software focuses on per-image visualization, and does not scale well to large real-world environments. Though commercial software exists to merge many images into panoramas, it relies on stationary capture methodologies with simple 2D transformations and lacks the ability to support large-scale or complex topologies. The problem of thermographic data positioning, and therefore its general accessibility and scalability, can be solved through data fusion with other commonly available sensors.
Mobile devices offer powerful rapid mapping capabilities, fusing data from multiple sensors to capture imagery, positional data, and depth, and then merging these into scaled 3D models. Though these technologies were pioneered by other manufacturers, the release of the iPhone 12 Pro in 2020 marked a turning point, refining sensor integrations to a degree that spurred significant development in this space. The uniformity and commonality of the iOS-specific hardware/software development environment has brought these technologies into the mainstream, resulting in widespread adoption across a number of fields. As of 2025, there are an estimated 1.38 billion iPhones in current use worldwide. The iOS platform holds a 27% market share globally, with majority market shares in the United States and Japan [1], and is the key driver in the domain of mobile device 3D scanning applications. However, the focus on derivative products over raw data and open processing belies an important limitation: this fusion takes place within an AI-based proprietary environment, the details of which are not well documented publicly [2].
Commercially available architectural 3D mapping software built on the iPhone LiDAR system uses SLAM (Simultaneous Localization and Mapping), involving real-time stitching of visible and depth snapshots in sequence. As these images are captured and resolved in order, the resultant models are subject to “drift” error. Often, when a scan is performed in a loop—for example, starting and returning to one corner of a room—the beginning and end points will not align [3]. Some products offer optional photogrammetric reconstruction services, often reliant on paid cloud computing subscriptions or credit-based services, but these are subject to proprietary processing with results limited by resolution and non-modifiable outputs.
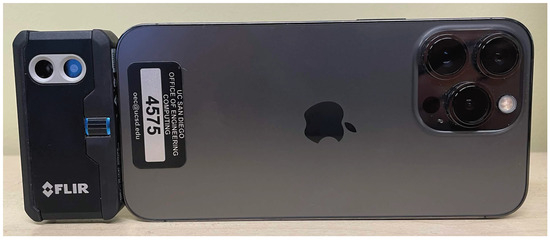
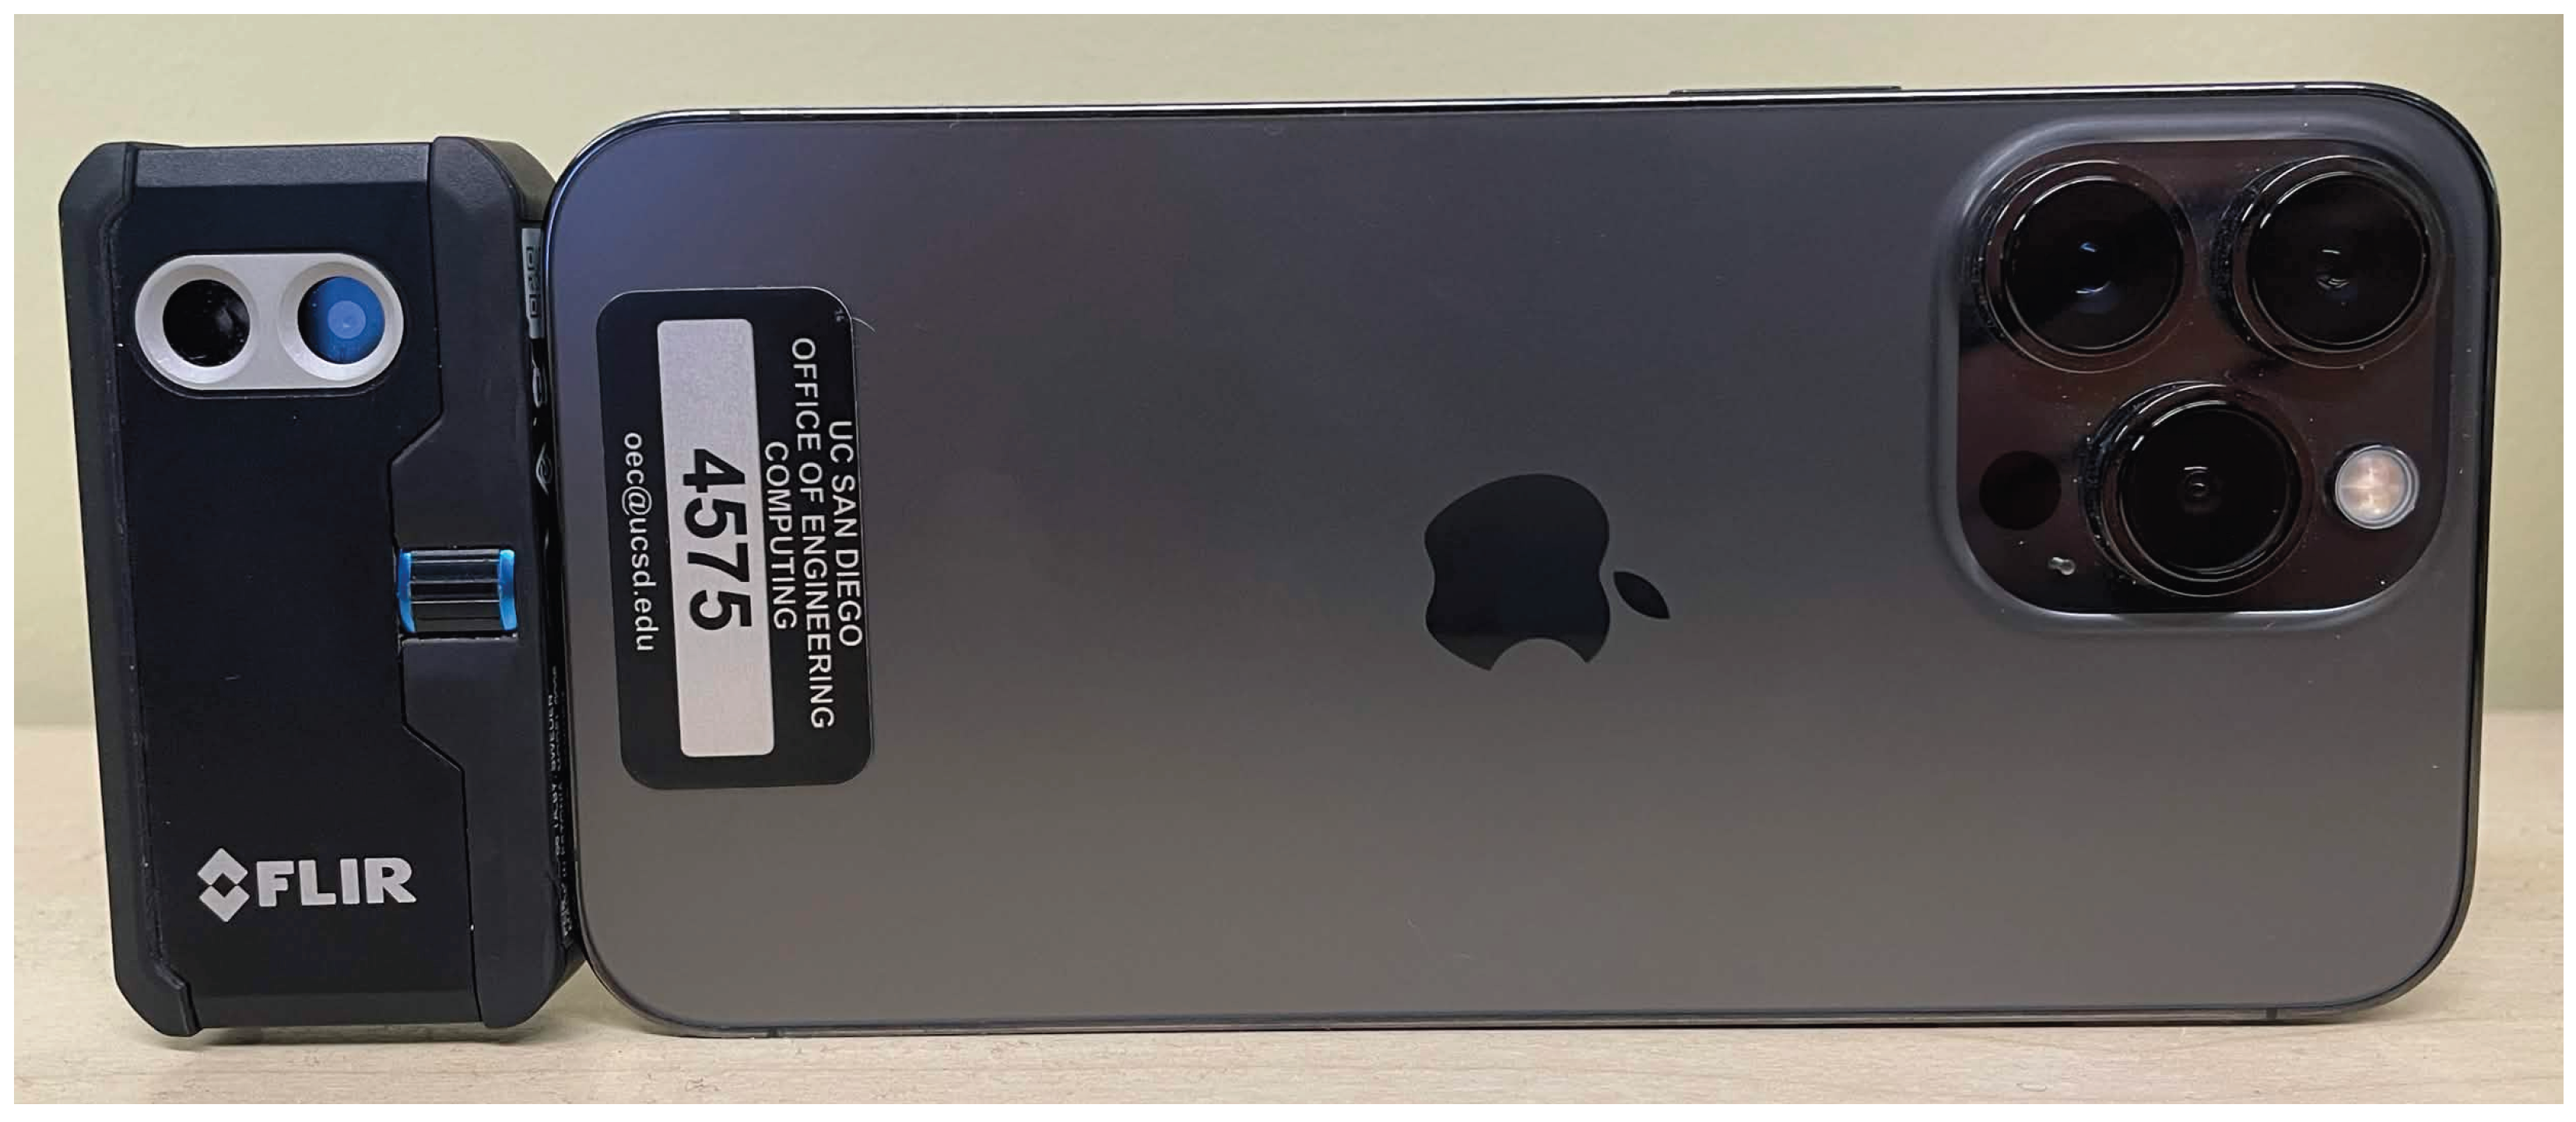
The FLIR One mobile IR module (manufactured in Goleta, CA, USA) was released in January 2014 as the first consumer-oriented thermal imaging system, designed as a smartphone accessory case for the iPhone 5/5S. It used the original Lepton thermal microcamera core with an 80 × 60 pixel sensor and included an additional visible light camera to support the MSX (Multi-Spectral Dynamic Imaging) feature, which overlays edges extracted from the RGB image feed to provide greater spatial context. Over subsequent generations, camera resolutions and thermal operating ranges improved, and by 2018 the form factor changed to a separate module connecting to the bottom of a phone via USB-C or Lightning connector (Figure 1). This 2018 FLIR One Pro version offers radiometric image output, meaning that temperature values can be extracted from the images, rather than purely visual outputs which sacrifice detail to fit all image features within an adjusted visual range.
Figure 1.
FLIR One Pro on iPhone.
In this paper we seek to employ readily available mobile devices to enhance the quality and accessibility of both 3D and thermographic outputs, by outlining a framework to democratize their input data sources and open them to re-use and testing in myriad external software environments, and integration with additional tried methodologies for metrological survey. We capture individually co-registered RGB and depth frame and TIR pairs, enabling the application of traditional survey methodologies including control points (freeing us from inaccuracies inherent to GPS or GNSS) and scale bars for trigonometric adjustment. An added benefit is the reconstruction of flat, featureless surfaces that would otherwise fail to reconstruct through photogrammetric processes, such as the flat walls in an office building, for example. This ability is still limited by the availability of features for image alignment. By exporting these data in their most granular, raw usable forms, we enable more effective and accurate fusion of iPhone sensor data. These outputs can then be integrated within tried and tested workflows, enabling more rigorous scientific analysis that is reusable and reworkable to inform future work and change detection.
1.1. IR Thermography
Thermographs render infrared radiation (heat) being emitted by an object. Surface temperature gradients may result from features beneath the surface transferring heat to or from the surface structure, such as air leaks, gaps, moisture differentials, or hidden wires, pipes, or structural materials. The key utility of thermography, for building inspectors, is not necessarily to obtain objectively accurate readings of specific temperatures, but in the subjective identification of anomalies that can indicate the presence of these thermal differentials. Though thermographic anomalies are not conclusive, they contribute to foundational understanding of a structure to be elaborated upon and confirmed by additional investigations, while also providing additional evidence for diagnoses of visible surface degradations.
Thermal imaging sensors do not measure temperature directly, but rather the incident infrared radiance at the sensor, which is dominated primarily by surface emissions and reflections as well as emissions and attenuation from the intermediate atmosphere [4]. The contributions of these components to the total radiance can be expressed as follows:
where is the infrared radiance from emissions relative to an object’s true temperature, is radiance from the reflected apparent temperatures of surrounding objects, and is radiance from the intermediate atmosphere. Additionally, represents surface emissivity and represents atmospheric transmissivity.
The interpretation of surface thermography can be complicated by differing surface materials, since materials emit or reflect infrared radiation at varying ratios, expressed above as . Two objects at the same temperature may render differently in a thermograph depending on their surface properties. For example, certain fixatives and other materials applied to a wall surface may be the same temperature, but one may reflect environmental features as much as a mirror reflects a person standing in front of it, with this contributing radiance component expressed as . These inaccuracies can be corrected for known materials using emissivity/reflectance index tables, but this is a time-intensive process requiring significant manual effort and prior knowledge. Atmospheric radiance, expressed as , further affects the measured signal by both attenuating target radiance as well as creating additional emissions along the optical path. The magnitude of these effects is determined by atmospheric transmissivity as a function of optical path length, ambient temperature, and relative humidity. The true temperature may then be derived from this computed total radiance model using inverse Planck’s equations [4,5].
The information obtained through TIR is largely dependent on ambient conditions, making timeliness a key consideration in thermal data capture. Structures generally exhibit changing thermal profiles according to the time of day and weather, as the sun is a powerful and changing heat source. During the day, a short period may result in significant changes in the sun’s position relative to features of interest. During daytime, the exterior is heated by the sun and the interior’s influence appears as a cooler temperature; the opposite is true at night, when the interior is often warmer. For a baseline understanding of thermal distribution, imaging at noon and midnight reveals how heat is naturally retained. TIR performed under ideal conditions—in the early pre-dawn hours of cold, dry days—reveals significantly more detail [6]. For this reason, it is important to make thermal imaging systems more accessible, to enable their deployment on demand, to be operated by non-professional users.
1.2. Photogrammetry with Thermographs
It is possible to perform 3D photogrammetric alignment and 3D reconstruction solely using TIR outputs, but this method presents significant challenges. A major difficulty is the low resolution of most thermal cameras compared to standard RGB cameras, limiting the ability to capture the fine details necessary for accurate feature matching. Furthermore, thermal images often suffer from low contrast and lack distinct, consistent features, especially in scenes with uniform temperature distributions, causing structure-from-motion (SfM) algorithms to fail in finding enough tie points for reliable alignment. Environmental factors also pose problems. Variations in sunlight, wind, and moisture can cause surface temperatures to change rapidly and unevenly, leading to inconsistent thermal patterns across images taken at different times or angles. These limitations often necessitate a workaround: co-processing thermal data with higher-resolution RGB image datasets to provide the necessary geometric information for accurate 3D modeling [7]. While it is possible to perform photogrammetry using only thermographic inputs, the low resolution means many more images must be taken at a far closer range to obtain enough pixel features for alignment and reconstruction (160 × 120 or 0.019 megapixels versus the back camera’s 3024 × 4032 or 12.19 megapixels). Additionally, RGB features provide critical visual contextual information for comparing non-visible surface qualities with their subjects. With a multi-sensor system, with known camera characteristics (intrinsics), and sensors held at fixed locations relative to each other (extrinsics), these data can be co-registered and swapped out, effectively placing TIR data accurately within 3D space and overlaying that data on 3D reconstructions to create high-quality image mosaics.
2. Related Works
Early work by Vidas et al. [8] established critical methodologies for combining RGB, depth, and thermal camera data for the 3D thermal mapping of building interiors. Their approach demonstrated the feasibility of registering thermal imagery with depth information in indoor environments using early RGB-depth sensors. Hess et al. [6] and Napolitano et al. [9] established methodological frameworks for multi-modal thermal data fusion in architectural heritage, including integration of non-destructive testing, laser scanning, and numerical modeling. These studies provide theoretical and practical foundations for understanding how disparate data types (thermal, geometric, and photographic) can be fused into comprehensive digital documentation systems. This work laid the groundwork for understanding the technical challenges inherent in aligning sensors with different fields of view, resolutions, and calibration requirements. Muzika et al. [10] contributed essential understanding regarding emissivity influence suppression on thermographic data. This is particularly important for heritage documentation and building assessment applications, where surface materials exhibit varying emissivities. Their comparison of methods provides practical guidance for processing thermal data in scenarios where material properties are unknown or variable, a common situation in field documentation work.
Tondo et al. [11], in exploring the iPhone LiDAR-based sensing system for vibration measurement and modal analysis, characterized the performance of the sensor stack, providing unique insights into the temporal precision and high-frequency capabilities of the sensor. While focused on structural dynamics, their characterization of sensor noise, temporal resolution, and data acquisition rates informs any application requiring precise 3D reconstruction. They documented sampling rates, latency characteristics, and noise floors that establish realistic expectations for iPhone LiDAR in demanding applications.
2.1. Mobile 3D Thermography Fusion
Yang et al. [12] and Stojcsics et al. [13] demonstrated that smartphone sensors could produce viable 3D thermal models when proper calibration and registration techniques were applied. They proposed methods for the smartphone-based fusion of infrared thermal imagery and visible images for 3D thermal model reconstruction. Their methodology is particularly relevant to iPhone-based workflows, as they addressed the unique constraints of mobile sensors including limited computational resources, uncalibrated sensors, and the need for real-time processing. Brea et al. [14] provided the most recent and directly applicable work on low-cost thermal point clouds of indoor environments, creating an extrinsic calibration projecting thermal data from the Lepton 3.1R directly on to LiDAR point clouds. Their research tackled the issue of creating affordable, accessible thermal 3D documentation methods. Though the camera calibration methodology involved was rudimentary, the study demonstrated the viability of this fusion. These previous studies fell short of providing the means to query full resolution thermographic datasets, instead reducing the 16-bit temperature reading to normalized abstractions fitting within the eight-bit range.
In general, the registration of images and thermograms is a complex topic, requiring thorough calibration. Dlesk et al. [7] addressed a critical technical challenge: transformations in the photogrammetric co-processing of thermal infrared images and RGB images. Their research demonstrated that proper geometric transformation and radiometric calibration are essential for accurate fusion. The study identified that thermal and RGB sensors have fundamentally different optical characteristics, requiring specialized co-registration algorithms. For iPhone-based workflows using FLIR One attachments, these findings suggest that simple geometric alignment is insufficient—proper calibration matrices accounting for lens distortion, field of view differences, and sensor offset are necessary.
2.2. Depth, Indoor Mapping Performance
Spreafico et al. [15] and Teppati Lose et al. [3] provided assessments of the iPad Pro’s built-in LiDAR sensor for un-referenced 3D rapid mapping, establishing baseline performance metrics. Their tests demonstrated centimeter-level accuracy for indoor and outdoor rapid mapping scenarios, with particular attention to the limitations of the sensor’s range (approximately 5 m maximum effective distance). The study noted that while absolute accuracy depended heavily on scanning technique, relative accuracy within a single scan session was remarkably consistent. Teo and Yang [16] built upon these concepts and introduced a scan methodology rotating from a fixed position, mimicking a terrestrial LiDAR scanner (TLS) system. They showed that, in this configuration, a 1 mm planar accuracy was achievable from a distance of 1–1.5 m. In drawing comparisons to photogrammetric reconstruction capabilities, these studies confirm the benefits of the LiDAR acquisition in reconstructing certain objects which are not well suited to image-based modeling, and the increased resilience to variant environmental lighting conditions which can often limit image-based reconstructions. The studies concluded that Apple LiDAR sensors are viable for rapid documentation, preliminary surveys, and contexts where traditional surveying equipment is impractical, though they should be supplemented with photogrammetry for high-precision requirements. Tavani et al. [17] expressed disappointment in the current state-of-the-art as applied to practical fieldwork in geoscience survey applications. They note poor performance with out-of-the-box low-cost methodologies for 3D capture, as they are advertised, and express a need for improvement.
Suleymanoglu et al. [18] conducted one of the most rigorous accuracy assessments of the iPhone 14 Pro for road infrastructure mapping, providing directly comparable metrics against professional survey equipment. Their study compared iPhone 14 Pro data (using viDoc RTK enhancement within the Pix4Dcatch 1.19 software ecosystem [19]) against a commercial UAV-LiDAR platform. Critically, Suleymanoglu et al. demonstrated that the iPhone’s input data, when fused and corrected, showed greater consistency than professional systems in certain metrics, though with some limitations in boundary detection for complex geometries. This study shows the potential to alleviate drift concerns through the application of control points in a post-processing software pipeline.
The gaps in the current literature involve the characterization of individual depth maps from ARKit, characterization of data outputs from FLIR radiometric JPEGs, the addition of the third data feed, in the specific integration of iPhone native LiDAR with thermal cameras like the FLIR One in a unified, open-source workflow for generating large-scale 3D thermographic mosaics. While individual components have been validated, the complete pipeline—from data capture through calibration, registration, and fusion into scalable mosaics, and the maintenance of full 16-bit thermal temperature ranges—represents novel contribution potential.
2.3. Multi-Sensor Cross-Calibration
The varying sensors employed by this study (visible light cameras, TIR, and IR-based depth cameras) may represent the same target in different ways, making the registration of shared features difficult. It is, therefore, necessary to design a calibration target which ensures shared features across all three imaging modalities. Geometric calibration targets for thermal and RGB cameras can be generally classified into two groups: square corner-point calibration methods and circle center-point calibration methods. The square corner-point method utilizes the checkerboard method of RGB camera calibration, designing the black and white squares with different emissivity values so they are thermally distinct. Methods include standard checkerboard calibration boards heated with a floodlamp [20] and a UV-printed aluminum composite target heated with an electric heater [21]. The squares are visible in both the IR and visible spectrum, which allows a single pattern to be used for simultaneous thermal and RGB calibration. However, due to the significantly lower resolution of thermal cameras, the accuracy of corner-point finding methods can be low. The circle center-point calibration method replaces the checkerboard pattern with a grid of circles, where the circle centers serve as the control points. Thermally, circles can be “generated” by a grid of point heat sources such as lightbulbs [22] or resistors [23]. Notably, for simultaneous RGB calibration, this requires an additional visible-light calibration pattern to be constructed. The circles can also be physically created by printing on a rigid surface [24], or through the combination of two materials with different emissivity values, where one serves as a cold “mask” to clearly distinguish the circles on the hot “background” [25]. For thermal camera calibration, circular patterns have been shown to deliver better results for thermal calibration than a checkerboard pattern, when UV-printed on an aluminum composite panel [24]. However, the design of circular calibration targets can be more difficult, especially if the thermal and RGB calibration points are provided through separate sources. Offline targetless calibration methods have also been explored to derive a notion of inter-camera geometry directly from scene context. Cortesi et al. [26] co-registered asynchronous multi-spectral and thermal UAV imagery from a non-rigidly mounted sensor pair by fitting a five-parameter transformation (three inter-camera rotation angles and a 2D image-plane translation) per image pair, dropping the 3D inter-camera translation under a high-altitude planar-scene approximation. The parameters are optimized by maximizing correlation between manually corresponded, segmented object masks in each modality. The method avoids a physical calibration target but depends on shared content and a near-planar scene.
3. Materials and Methods
The research in this paper utilizes sensors on the iPhone 12 Pro (RGB and LiDAR), and the FLIR One Pro thermography module. At the time of this publication there are newer versions of each of these devices available, but a review of newer models led to the conclusion that upgrades are unnecessary. In the case of the iPhone, all models from the iPhone 12 until the iPhone 14 employed the same hardware. In 2024 there was a change in LiDAR hardware, but the resolution and operating distance remained the same [27]. In the case of the FLIR One Pro, a new form factor was introduced in 2022 without upgrades to the resolution, and actually featuring a downgrade in the RGB reference from 1440 × 1080 pixels to 640 × 480 pixels.
3.1. Imaging Sensors
The iPhone 12 Pro features a number of specialized cameras and sensors (Table 1). The integration explored in this paper is performed with two sensor pairs to bridge visible photographs, depth, and TIR information. The iPhone LiDAR is registered with the 26 mm “wide” camera. The TIR is registered to the FLIR One RGB camera, which, unfortunately, has no public documentation.
Table 1.
Specifications for the iPhone 12/FLIR One sensor stack.
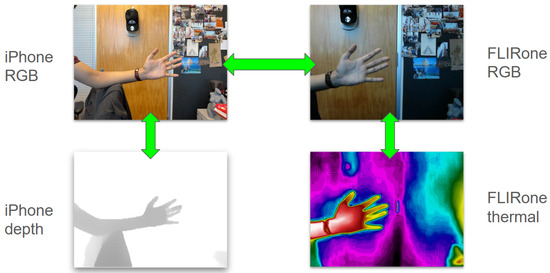
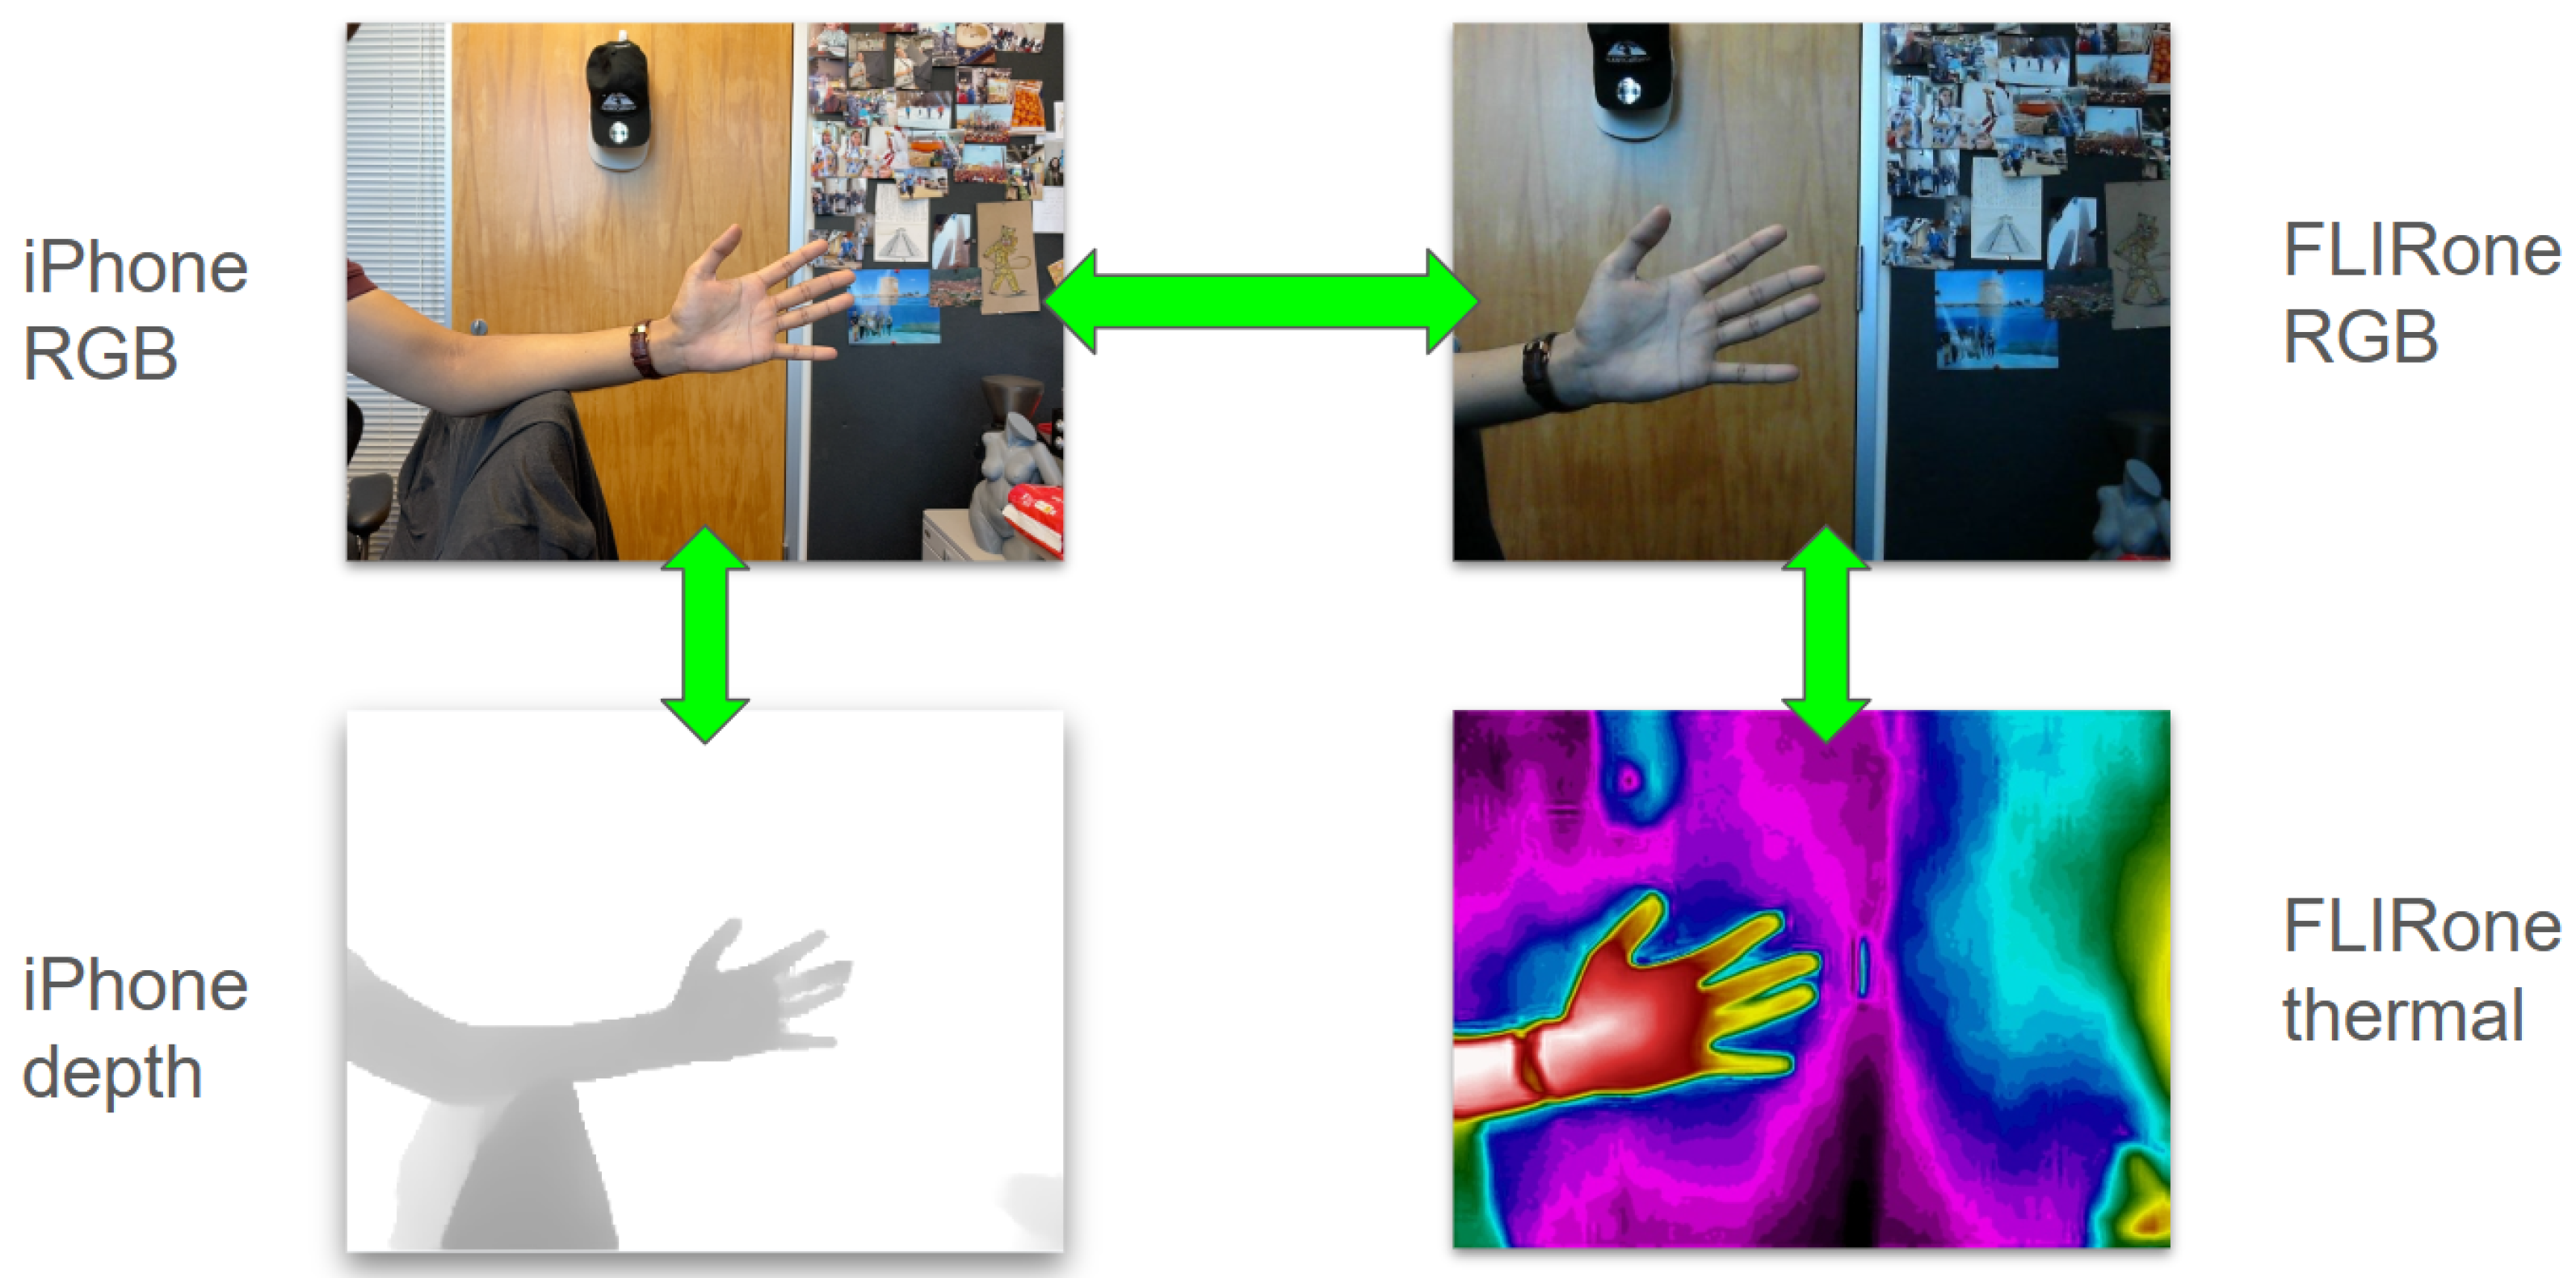
The photographs from the iPhone wide camera and the FLIR One RGB camera are then matched to each other to complete the sensor network (Figure 2). The two sensor pairs may be constrained geometrically, by capturing all four inputs from a single fixed position (ensuring accuracy), or they may be captured separately performing photo/depth and photo/thermal surveys in succession (enabling freedom of movement and speeding acquisition).
Figure 2.
Multi-cam inputs from iPhone and FLIR One assembly.
3.1.1. FLIR One Pro Hardware
The FLIR One Pro (third generation) is an upgraded version of a consumer-grade thermal imaging camera attachment product line. The device features a native thermal resolution of pixels (19,200 pixels) and a radiometric image output, using the FLIR Lepton 3.5 R (radiometric) TIR camera module, manufactured in Goleta, California, USA. The FLIR One Pro can measure temperatures ranging from to with a thermal sensitivity of 70 mK for detecting subtle temperature differences. The sensor has a pitch of 12 microns and a 57-degree field of view. No specific distance cutoff is specified, and lenses are focused to ∞. The camera integrates FLIR’s MSX (Multi-Spectral Dynamic Imaging) technology, which combines thermal imagery with detail from a built-in RGB camera to create real-time overlays with clearly defined edges. The RGB camera’s specifications are not made public, and it must be characterized from scratch [28].
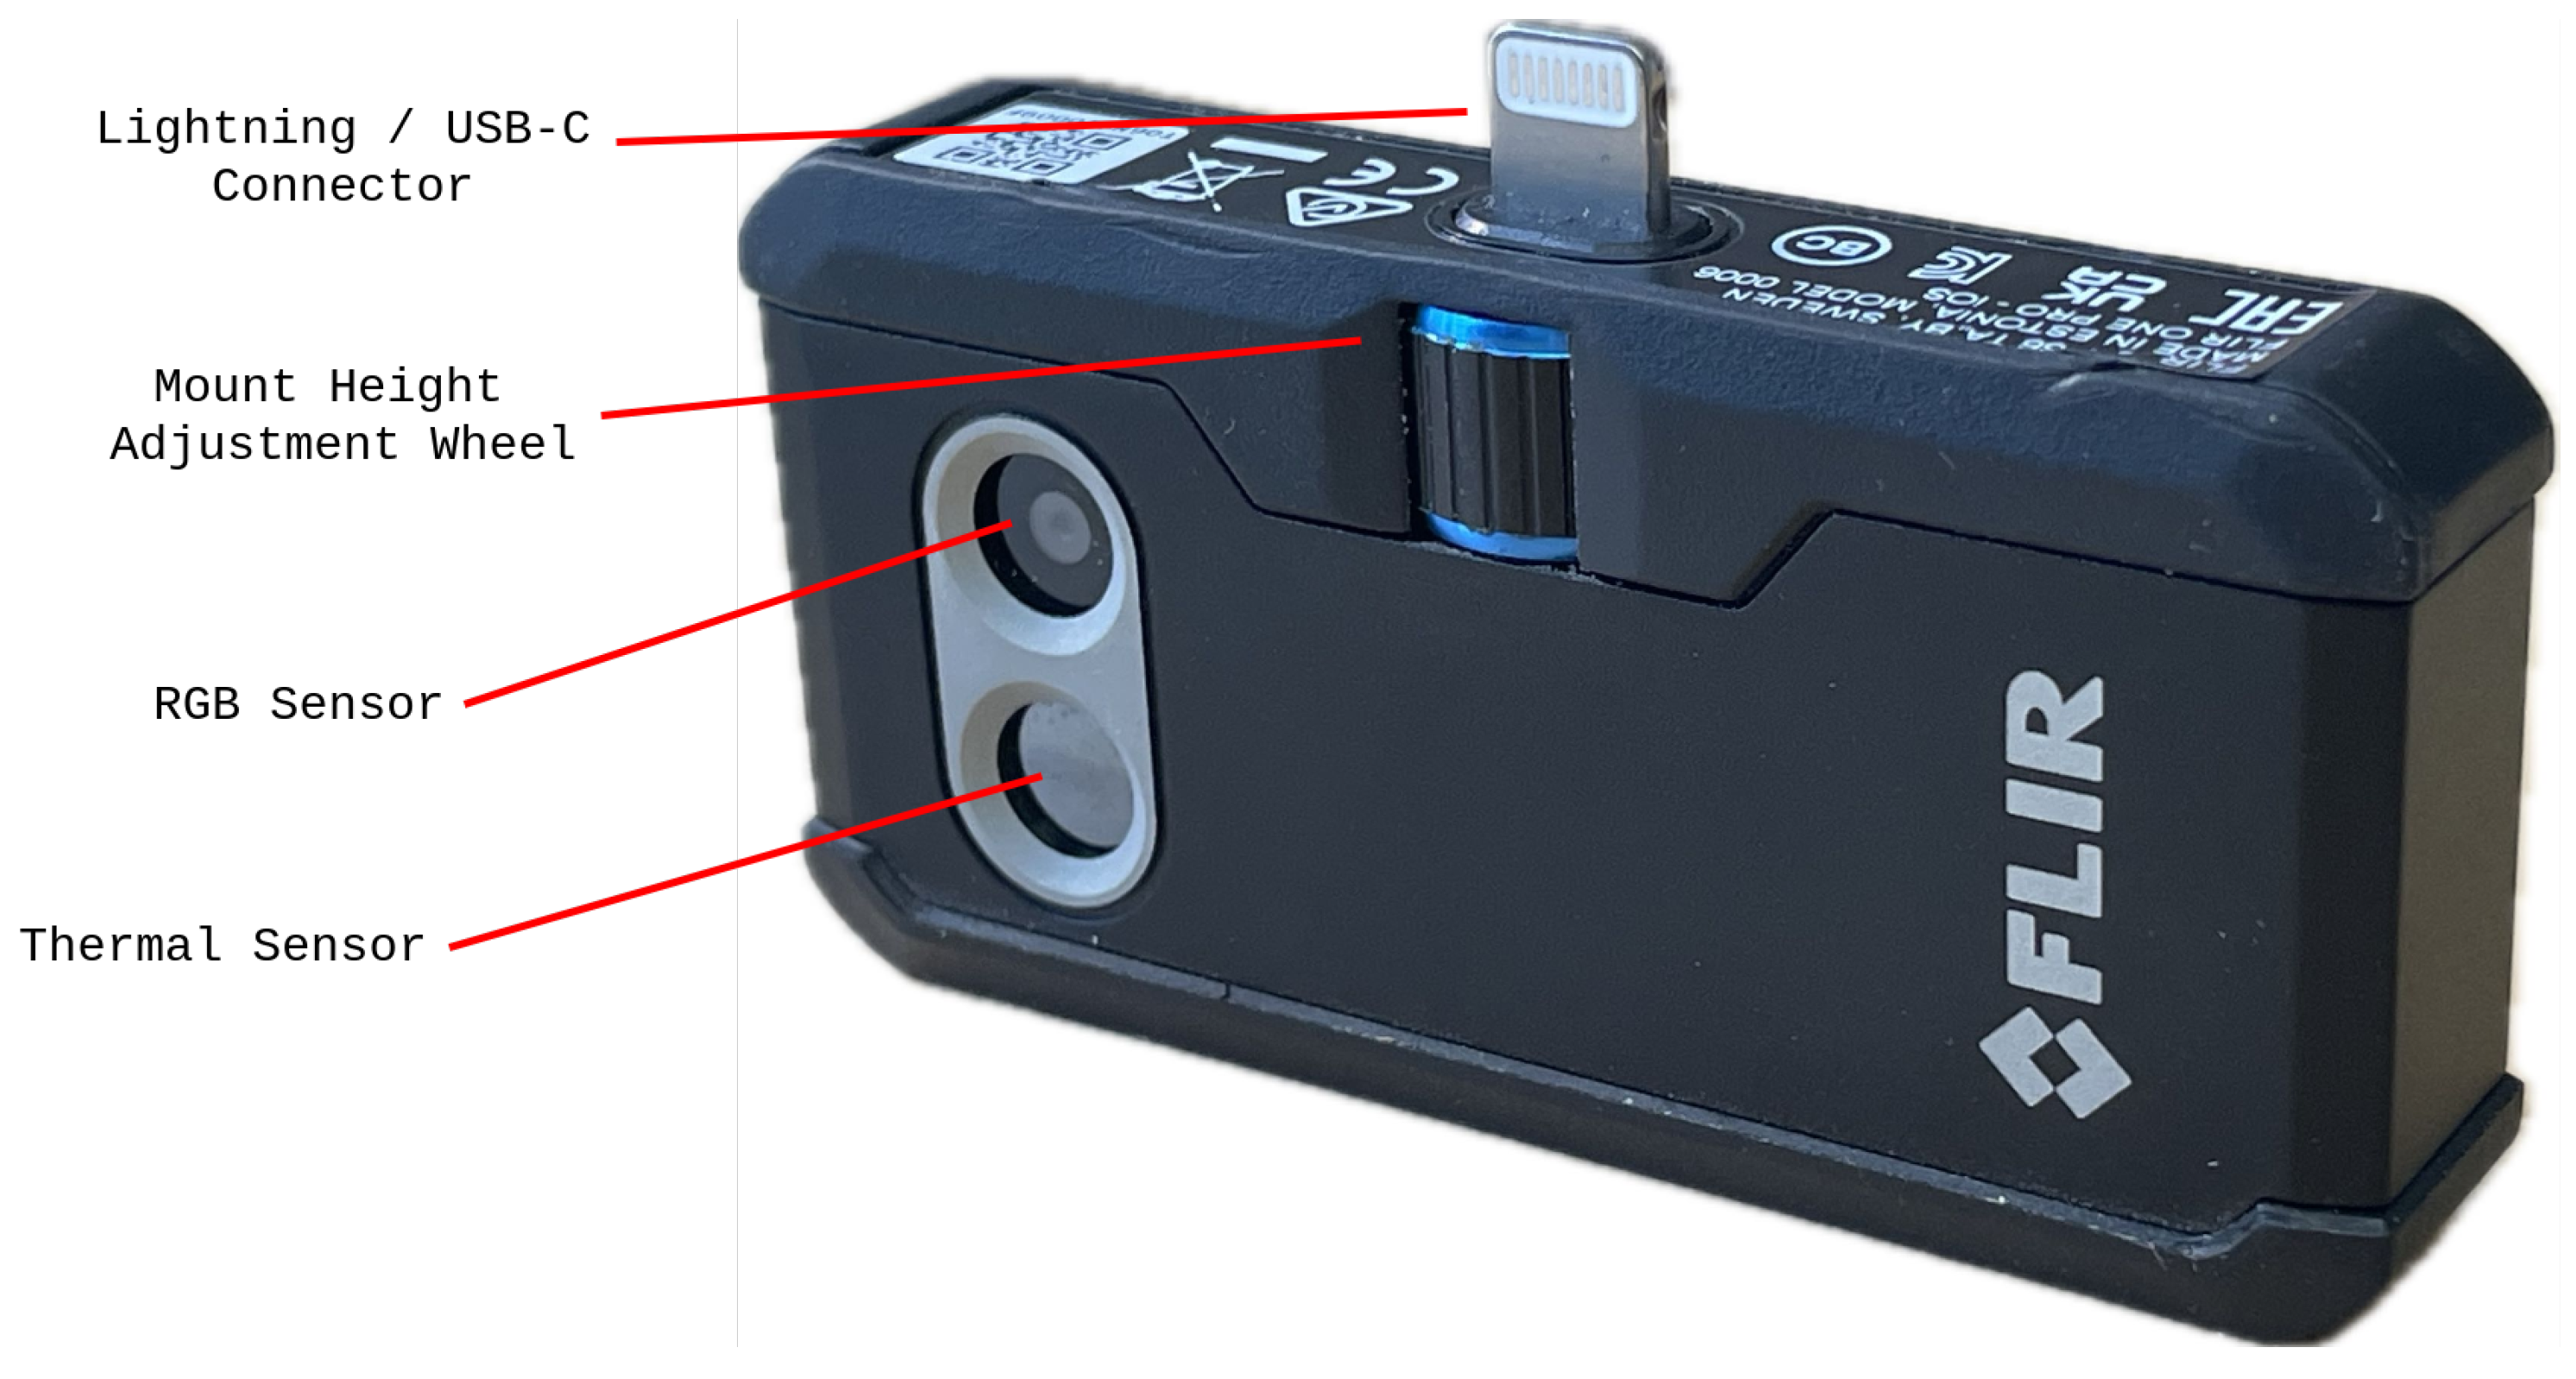
The device features an adjustable connector that extends up to 4 mm to accommodate different phone cases (Figure 3), but in the case of this study it is left at zero-level to ensure uniformity between experiments. The system is optimized for a working distance between 0.3 m and 3 m [28].
Figure 3.
Labeled layout diagram of FLIR One Pro.
To translate TIR images into 3D space, it is important that we translate these specifications into functional guidelines which can help guide users in planning their surveys. The ground sample distance (GSD) helps us to understand the space represented by a single pixel in an image within a given range. It is calculated as
Dimensionally, pixel pitch (mm/pixel on the sensor) is scaled by the ratio of scene distance to focal length (both in mm), projecting the on-sensor pixel size out to the corresponding physical footprint on the target in mm/pixel. Within our effective range of 0.3 m to 3 m, we can expect a GSD of ≈2 mm to ≈19.6 mm (Table 2), and we should not expect to be able to see any features in the physical environment which are smaller than our lower threshold.
Table 2.
Imaging distance and corresponding ground sample distance (GSD).
3.1.2. iPhone Camera Hardware
The iPhone 12 Pro features two camera systems (front and rear) designed for close-up and distance photography. On the rear, the device is equipped with a triple-camera array consisting of a 12-megapixel Wide camera with an ƒ/1.6 aperture for standard photography, a 12-megapixel Ultra Wide camera with an ƒ/2.4 aperture for capturing expansive scenes with a broader field of view, and a 12-megapixel Telephoto camera with an ƒ/2.0 aperture and 52 mm focal length for optical zoom capabilities. This rear camera system is complemented by a time of flight (ToF) LiDAR scanner using a Vertical-Cavity Surface-Emitting Laser (VCSEL) array, with an optimal range of 0.3 to 2 m [11] that provides depth sensing for improved autofocus in low-light conditions and enhanced augmented reality applications. On the front, the iPhone 12 Pro incorporates the TrueDepth camera system, which includes a 12-megapixel camera for selfies and video calls along with specialized depth-sensing components. The TrueDepth system uses a dot projector that projects over 30,000 infrared dots onto a user’s face, an infrared camera to capture this pattern, and an infrared flood illuminator to enable operation in low-light conditions. This front-facing array generates detailed depth maps at a resolution of pixels with an ideal range of less than 1 m [29], primarily enabling Face ID facial recognition but also supporting features like selfie focus optimization.
3.1.3. iPhone Depth Sensors
Within the iOS environment there are multiple methods to pull depth outputs from the iPhone (Table 3). In this paper we focus on the Apple ARKit on iOS 17.5.1 (21f90) outputs which form the basis of 3D scanning apps. There is an alternate method using the media-focused “AVFoundation” library [30], which enables depth extraction from RGB camera pairs (as was the standard practice prior to the release of the LiDAR sensors), and also LiDAR-based depth maps of reportedly higher resolution () than ARKit (). Though the methodology outlined here for data fusion should remain valid for whichever depth source is used, the differences and potential for improvement between ARKit and AVFoundation outputs should be the subject of an additional study.
Table 3.
Comparison of available depth sensing methods on iPhone 12 Pro.
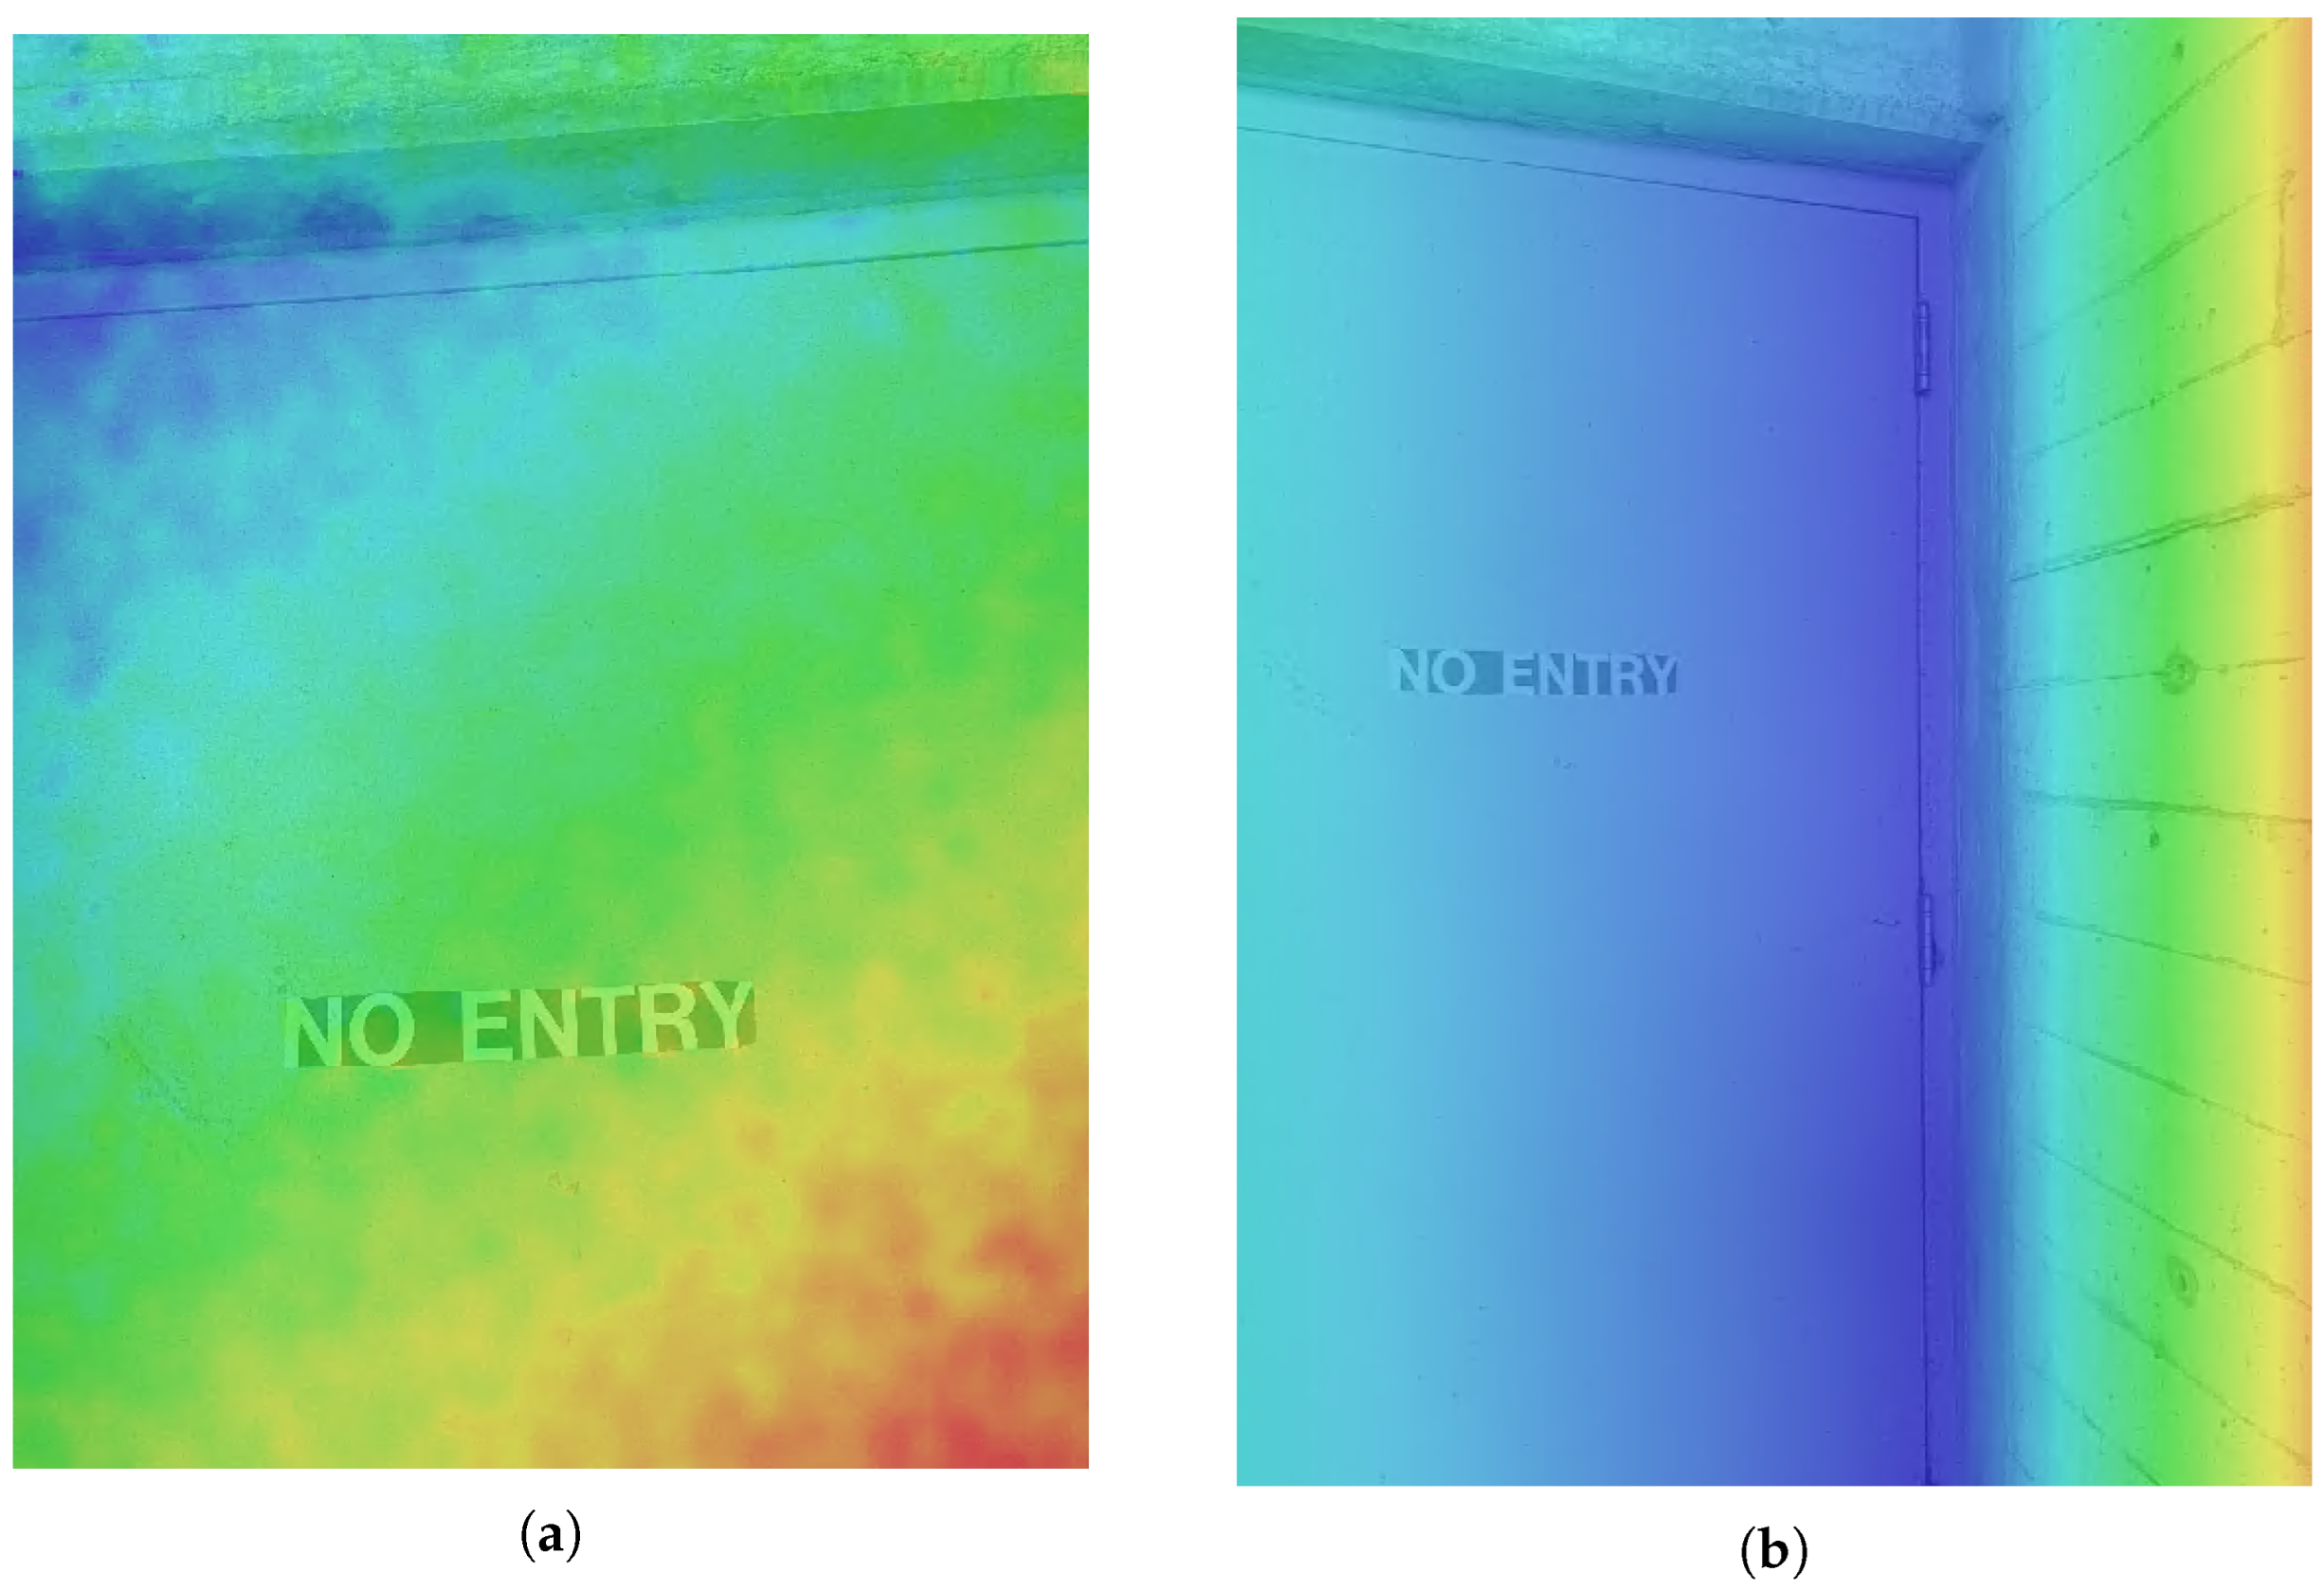
The iPhone’s LiDAR-based 3D scanning applications are based on real-time SLAM, and generally do not provide individual depth inputs for post-processing. The iPhone’s standard camera application provides depth information layers for images taken in portrait mode, coregistering RGB and depth feeds. In the case of the TrueDepth system (including a dot projector and IR camera), this information is fed into facial recognition features, while both the front and back sensors use the depth information to improve image quality and focus. The images from the front TrueDepth camera save data on a real-world scale and can be imported into photogrammetry systems as RGB-D inputs, but the depth maps they produce are very noisy. A cursory planar deviation analysis performed in CloudCompare suggested distortion of up to 2 cm from a distance of 2 m, but further study would be needed to characterize these depth maps properly (Figure 4). One might assume that these images undergo additional filtering when utilized in other applications, especially as other sources report 2 mm accuracy [29]. The images from the back camera save depth in a normalized eight-bit format which removes real-world depth information, requiring additional processing to obtain usable data. The low-cost application Depth Camera RAW uses Apple ARKit to extract individual frames from the back LiDAR camera with full depth resolution exported in meters, allowing their use in photogrammetric workflows [31,32,33].
Figure 4.
(a) TrueDepth depth map: very rough; (b) LiDAR depth map: smooth. Colors indicate relative depth over a normalized mapping, ranging red to blue over increasing distance.
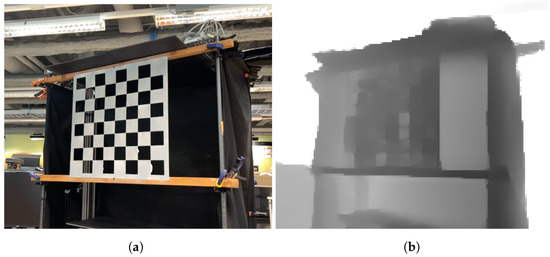
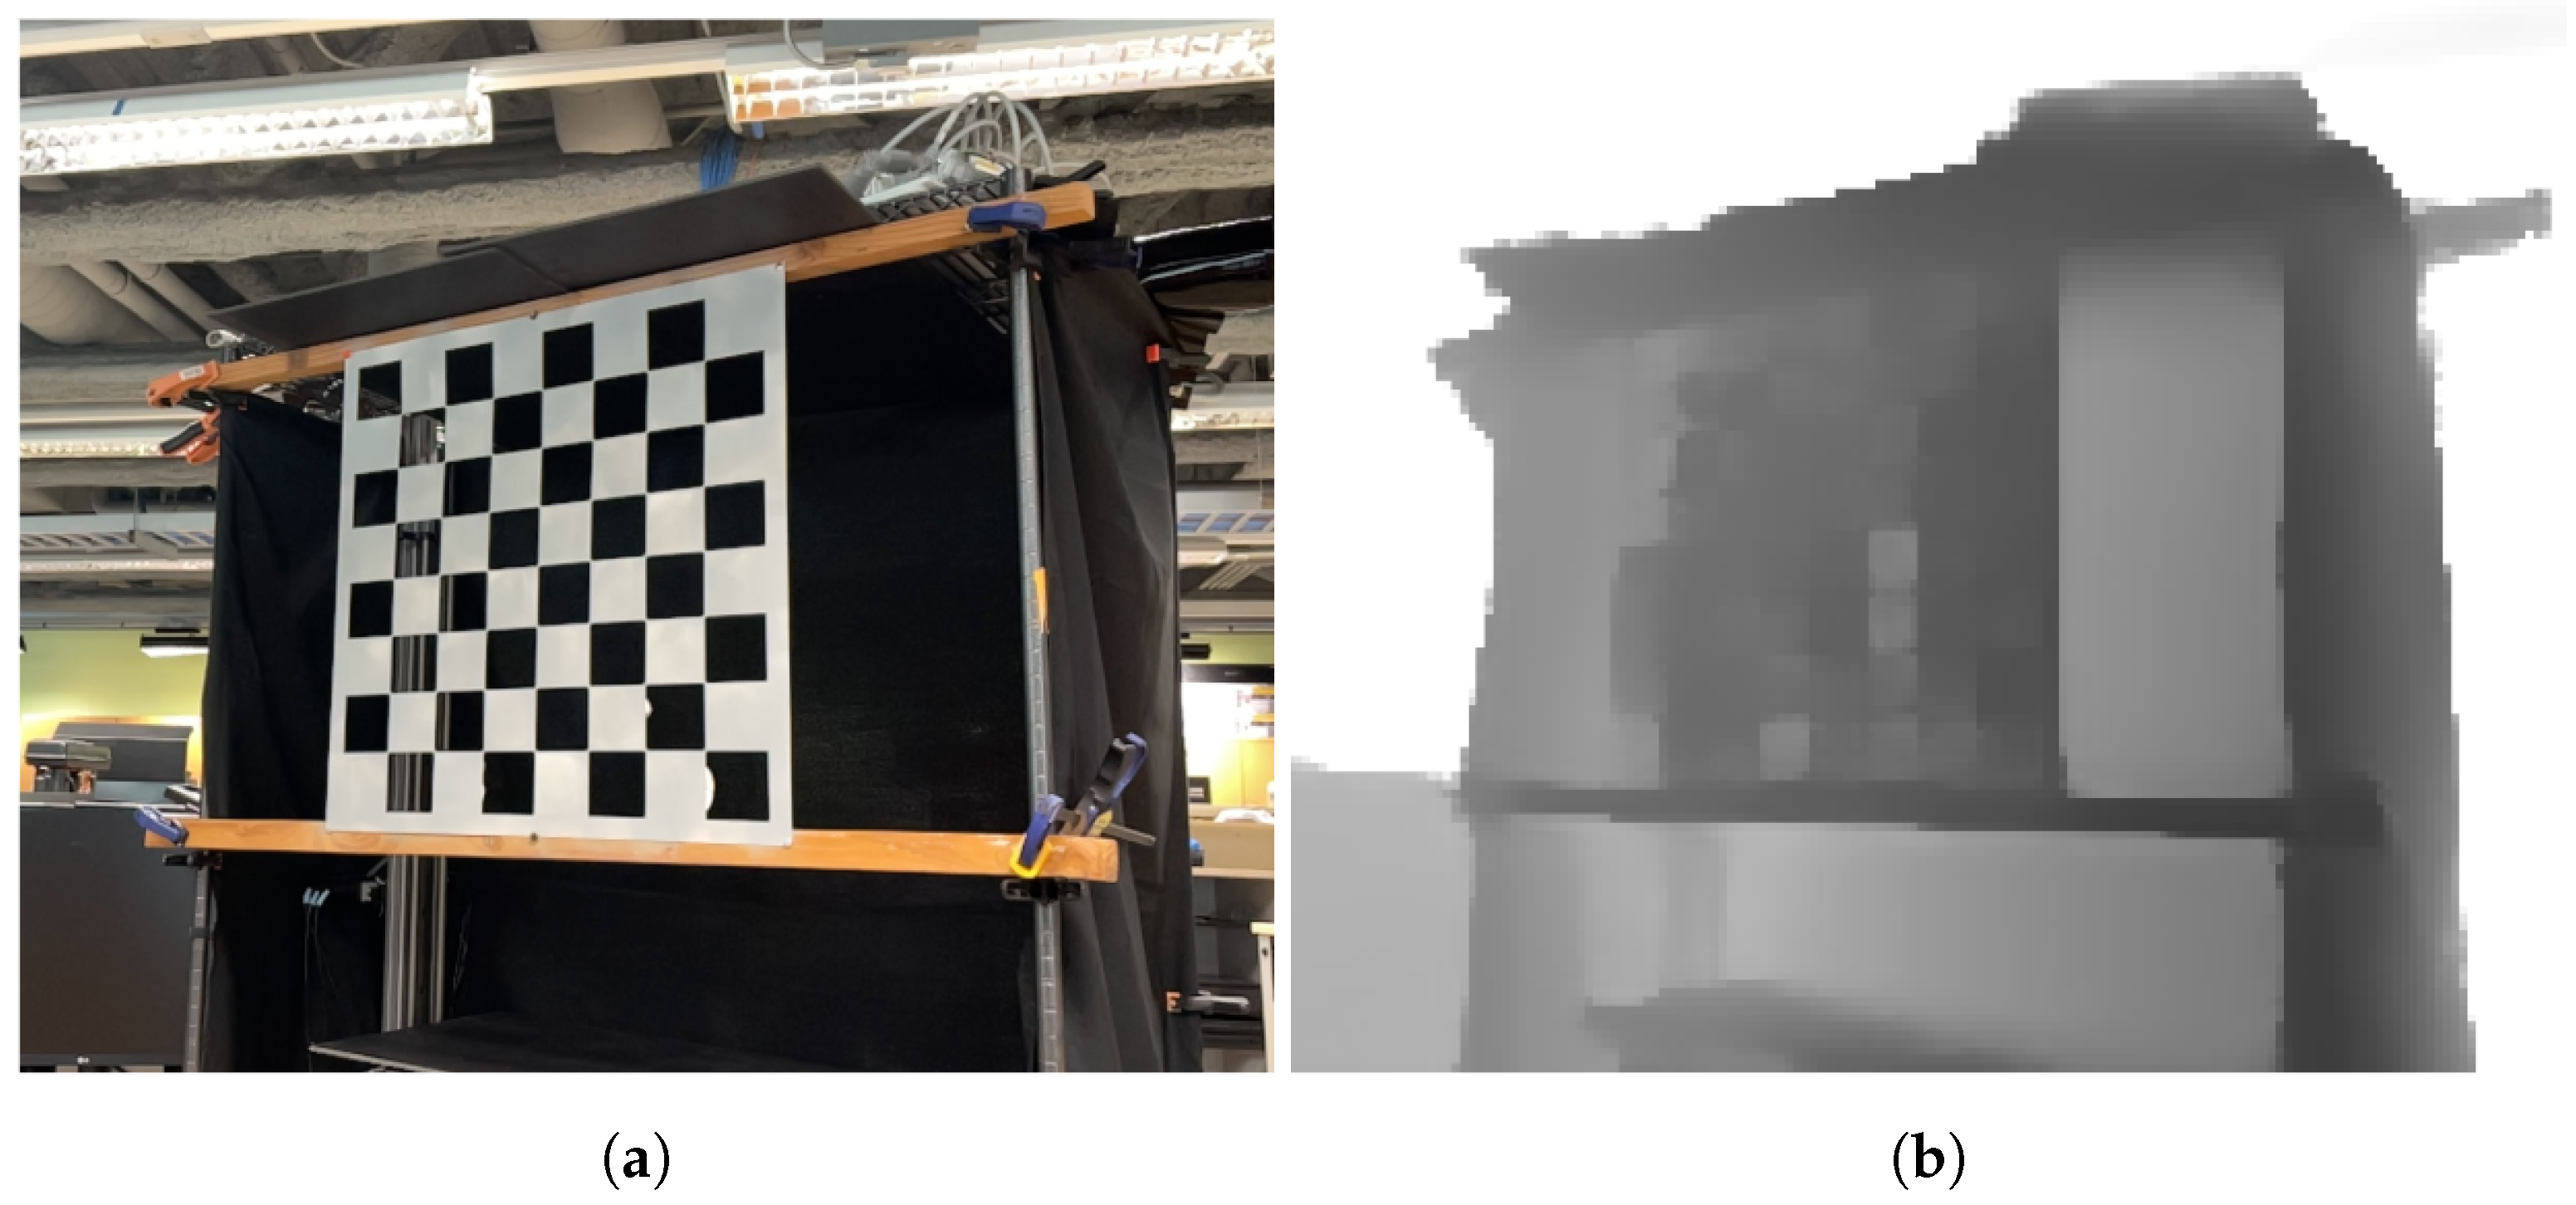
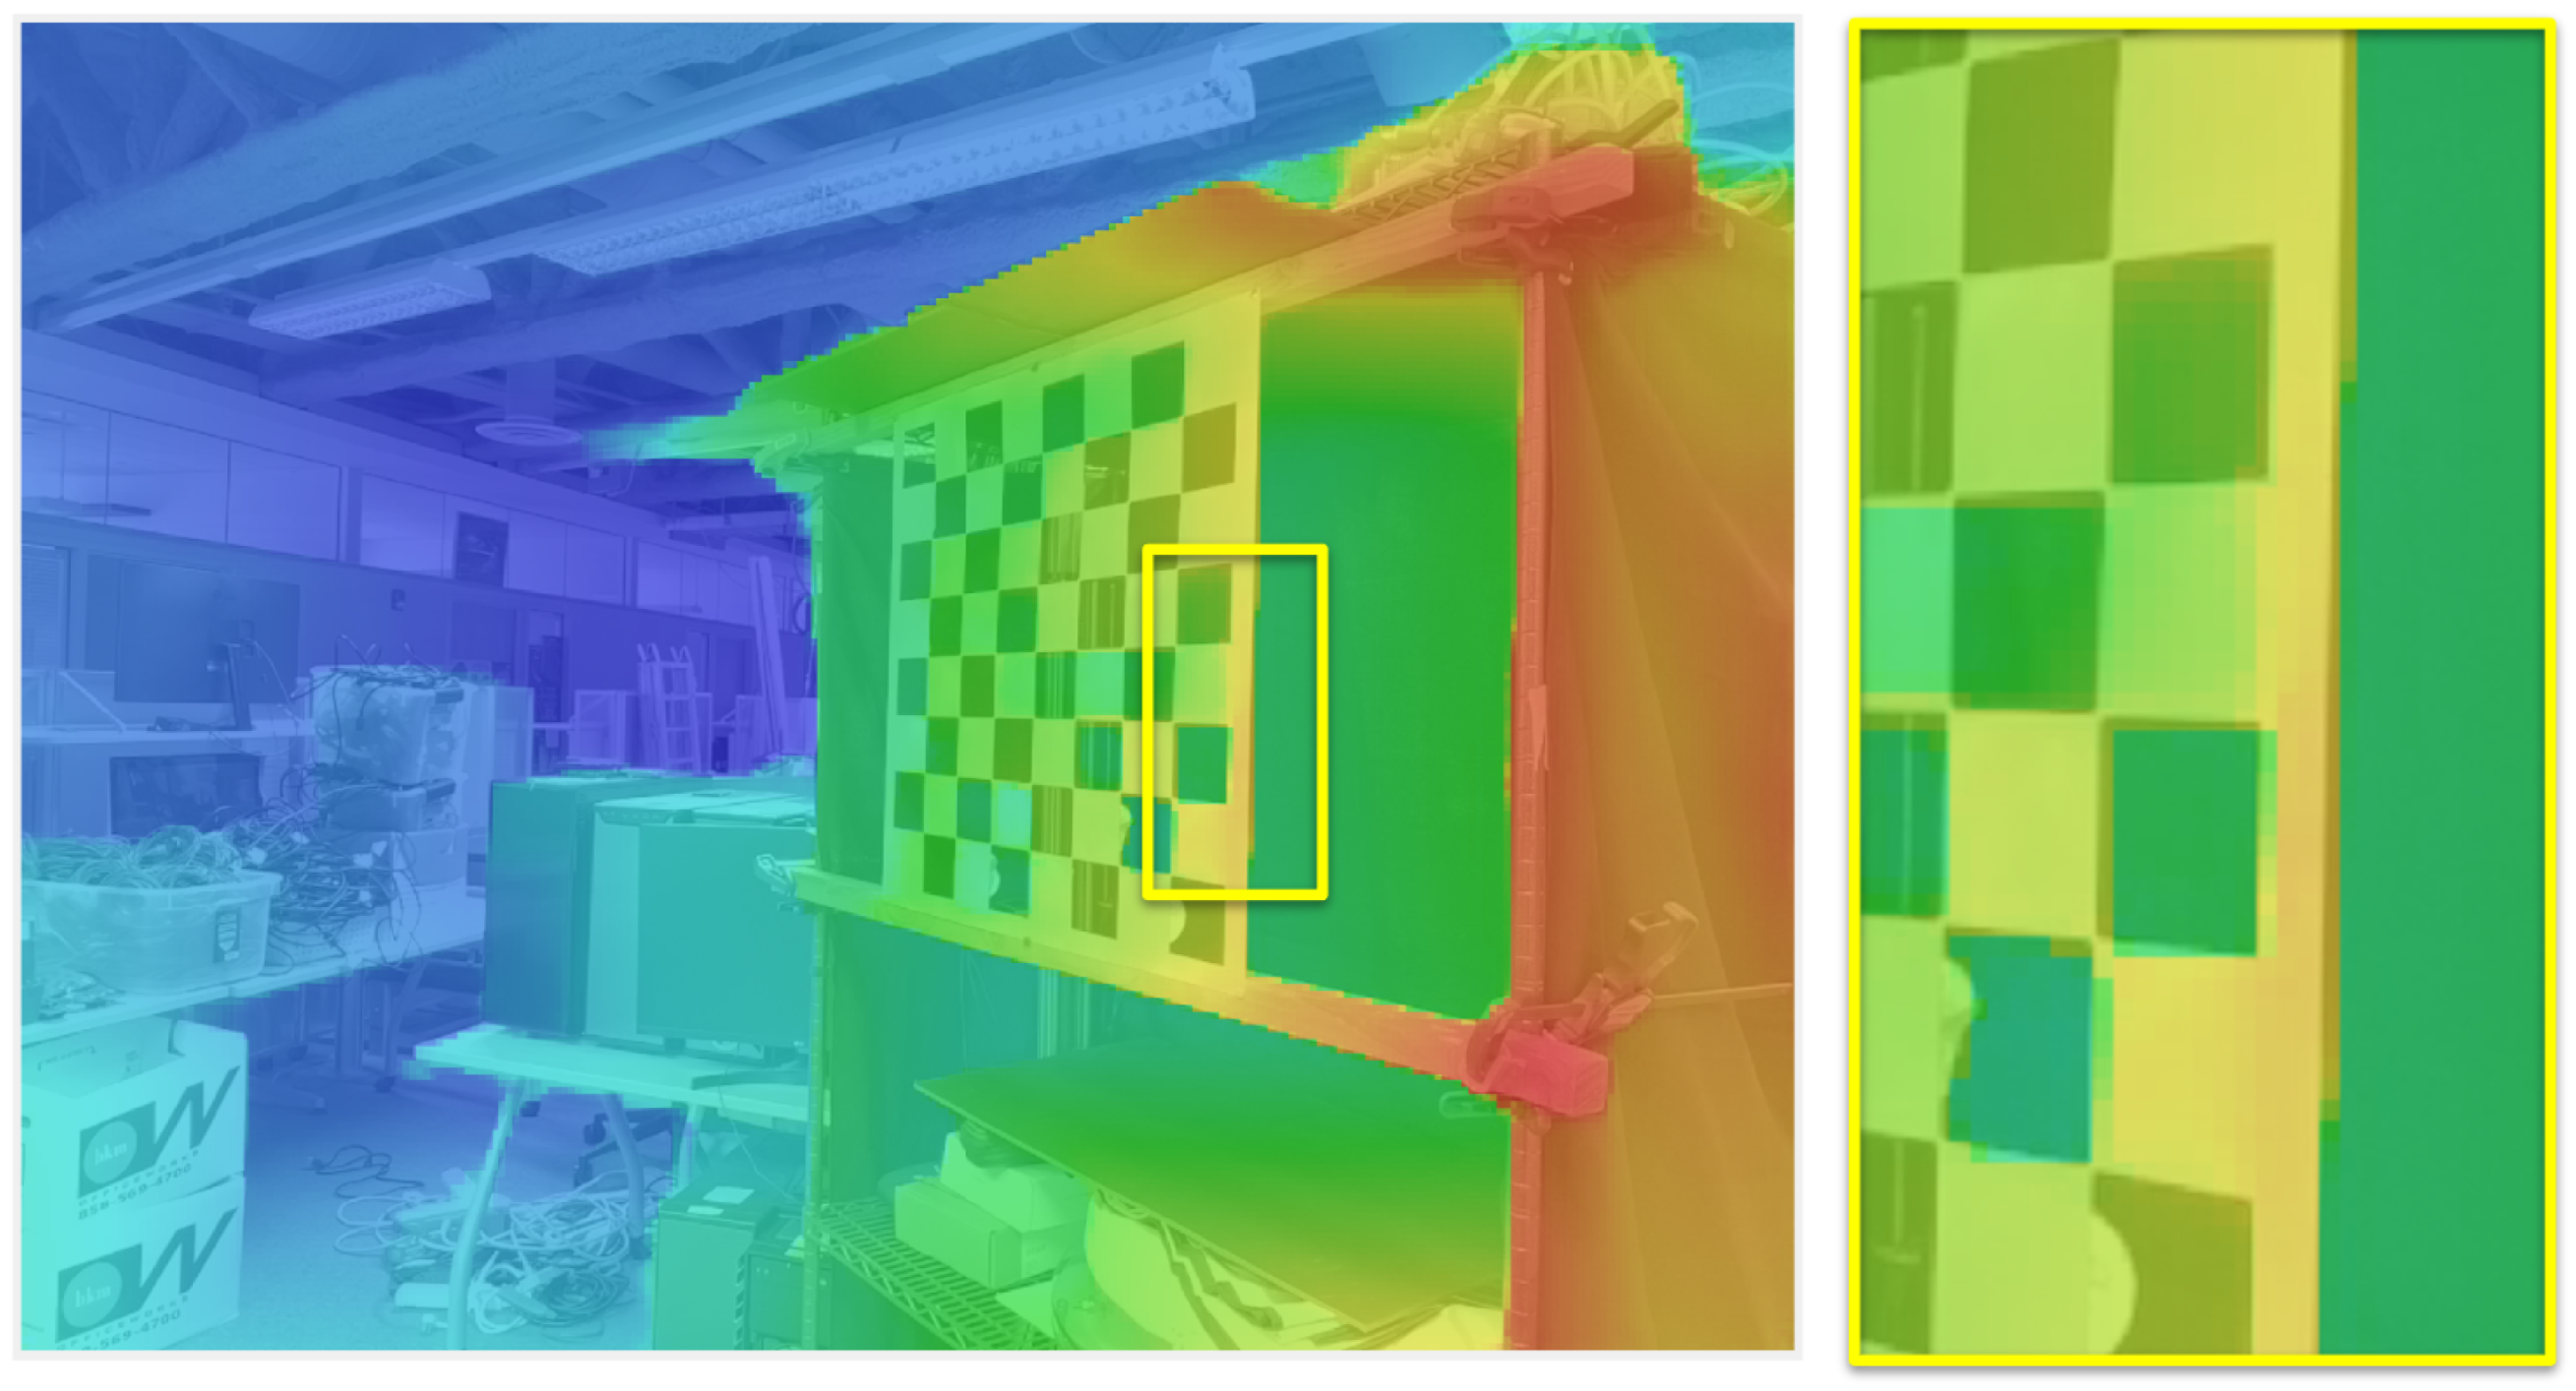
While the LiDAR camera results are smoother, they do not handle small repetitive features consistently. Initial unsuccessful calibration tests involving a large checkerboard target with negative space cut out show an odd interpretation of the checkerboard pattern (Figure 5), possibly due to the proprietary AI-based depth map refinement employed by ARKit [31]. Further study is needed to characterize this behavior, and we are left to assume that this kind of distortion is unique to this particular pattern. After careful manual inspection of thousands of inputs, it was not observed in other images portraying the natural or built environment. Still, the aberration is troubling and warrants further study for proper characterization.
Figure 5.
iPhone “wide” camera RGB image (a) and matching ToF depth map, with errors (b).
3.2. TIR Data Preparation
The raw outputs from the FLIR One Pro are .JPG images featuring RGB images with embedded TIFs with the raw radiometric thermal data (not yet in a usable temperature format) saved into their headers. Radiometric cameras measure and store information enabling the calculation of the absolute temperature for every pixel in an image, while non-radiometric cameras provide a visual representation of relative heat intensity without specific temperature values. If the image shows a summary of relative data in the scene, rather than storing these raw values, a significant amount of information is lost, and the images themselves will be different depending on the presence of outliers in each frame (features with very high or very low temperatures). Using FLIR Studio version 2.062 [34] to batch process these inputs, it is not possible to obtain a radiometric JPG containing the RGB without an overlay image and the corrected thermal values. It is not possible to export a single non-normalized radiometric thermal image. They must, instead, be separated. Non-normalized temperature values can only be exported as .CSV spreadsheets, which must then be converted into TIF files. When the thermal images are overlaid with the cropped RGB images we see that there is significant error. Therefore, a new methodology must be established to extract appropriate data inputs and correct their registrations.
The FLIR One camera outputs images in JPEG format, containing a pre-processed colormap image within the image data segment, as well as an extended set of metadata within the EXIF fields typically used to process RGB and temperature-mapped RGB outputs in the FLIR Thermal Studio software suite. The EXIF headers of each image contain the embedded RGB image of the colocated camera (in the -EmbeddedImage field), raw thermal sensor data (-RawThermalImage), manufacturer-defined per-sensor Planck’s law calibration data (R1, B, F, O, and R2), and a wide set of user-defined atmospheric and capture parameters, including subject emissivity and distance, atmospheric transition model parameters, relative humidity, atmospheric temperature, and reflected apparent temperature.
To extract each of these fields, a custom script (Appendix D) was generated starting from a publicly available extraction utility [35] and rewriting to improve the utility data exports, by creating PNGs which both maintain radiometric values, and enable simple visualization in standard image viewers. This version is also optimized for batch conversion, necessary for large photogrammetric imaging projects involving hundreds and thousands of individual inputs. The tool uses ExifTool [36] to read their values from the headers. The temperature conversion pipeline was rewritten to apply a radiometric correction function using these extracted parameters and calibration constants.
We begin by computing atmospheric transmissivity by estimating the partial pressure of water vapor, and then compute radiance contributions of reflective apparent temperature and atmospheric emission. These are then used to compute a corrected true object radiance, as described in Section 1.1.
The corrected radiance is then mapped to temperature in degrees Celsius per pixel via the inverse Planck equation, parameterized by the per-sensor calibration constants extracted from the EXIF headers:
3.3. Calibration and Transformation
One of the most straightforward methods for thermographic mosaicing is to employ aligned RGB images for photogrammetric modeling, and simply switch out the images after model reconstruction, and before texture creation [13]. If thermographs are properly registered with the source images, thermal features will be overlaid accurately. This registration, however, requires a planar transformation to fit the thermograph to the RGB image using high-contrast features which are visible in both images. Within the built environment, we are often presented with use cases in which flat featureless surfaces do not share any visible indications of their thermographic features. A large and perfectly flat plaster wall may hide electrical components, water pipes, structural cracks, and moist spots which appear in a thermogram, and not in a visible image.
Header data parsed from the original FLIR One images indicates the use of only linear transformations to create a notion of alignment between the thermal and RGB imagery. Specifically, the file headers contain an X and Y pixel offset, RGB to IR scale factor (approximately 1.25), and picture-in-picture crop window, indicating only translation and scaling operations for alignment. However, due to the effective nonlinearity of lens distortion qualities and manufacturing tolerances, such an alignment model proves insufficient in accurately mapping point correspondences between the RGB and thermal imagery, especially in image regions with the greatest degrees of distortion (e.g., near edges). A typical description of imaging geometry uses a pinhole camera model, in which some 3D world point projects to a 2D image point via intrinsic matrix K and camera extrinsic rotation R and translation t.
where are the focal lengths in pixels, is the principal point, and s is a scale factor. Real lenses depart from this idealization through radial and tangential distortion, modeled as
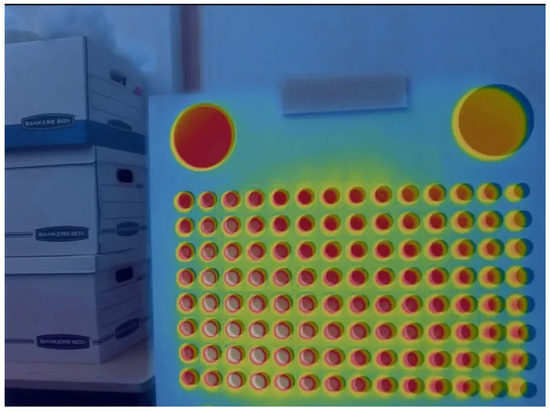
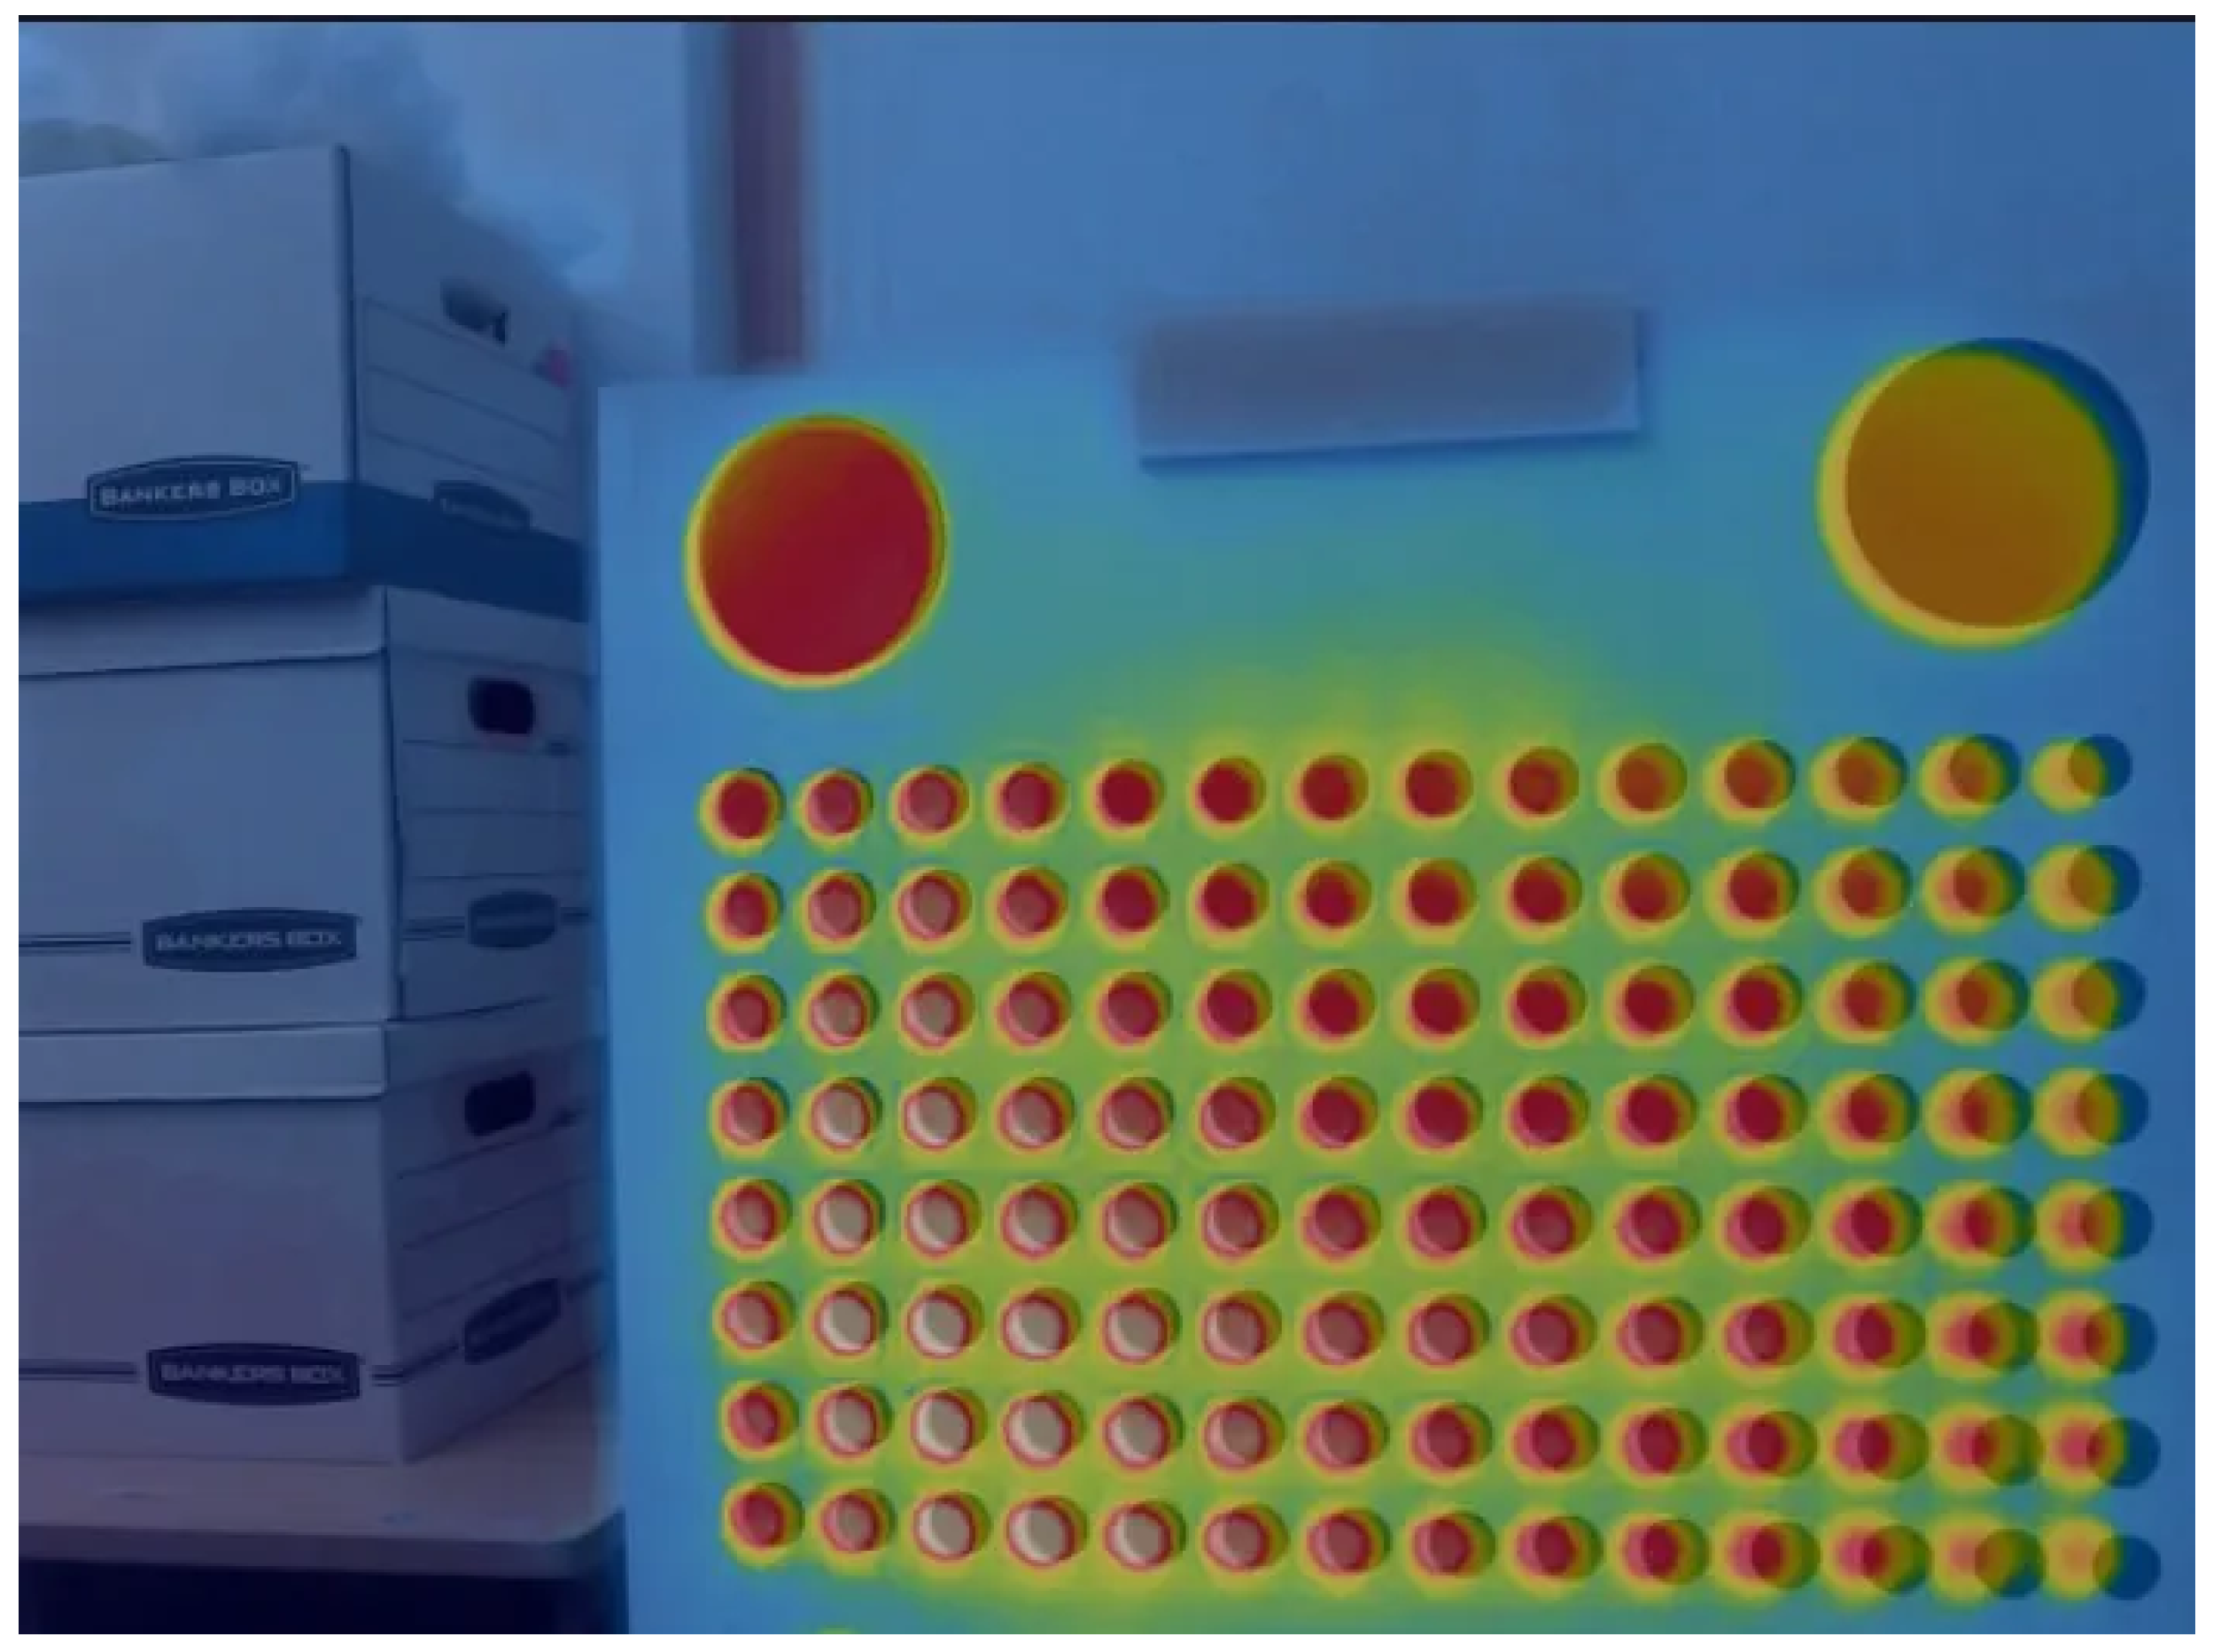
where are normalized image coordinates, , are radial distortion coefficients, and and are tangential distortion coefficients. The FLIR One’s naive alignment model accounts for none of these terms, treating the relationship between the RGB and thermal sensors as a pure scale-and-translate operation, which fails most visibly near image edges where r is large. Thus, photogrammetry methods utilizing colocated RGB imagery under this method of correspondence may not be considered to be accurate in the thermal layer. An inconsistent offset in thermal correspondences will be observed throughout the data, and would require extensive manual alignment without undistortion Figure 6.
Figure 6.
FLIR One TIR image overlaid over cropped RGB image.
3.4. Calibration as a Multiview Rig
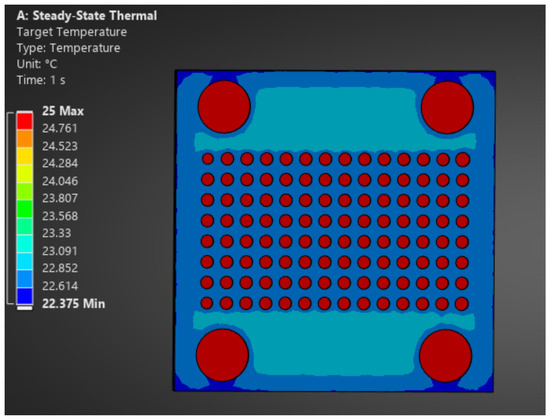
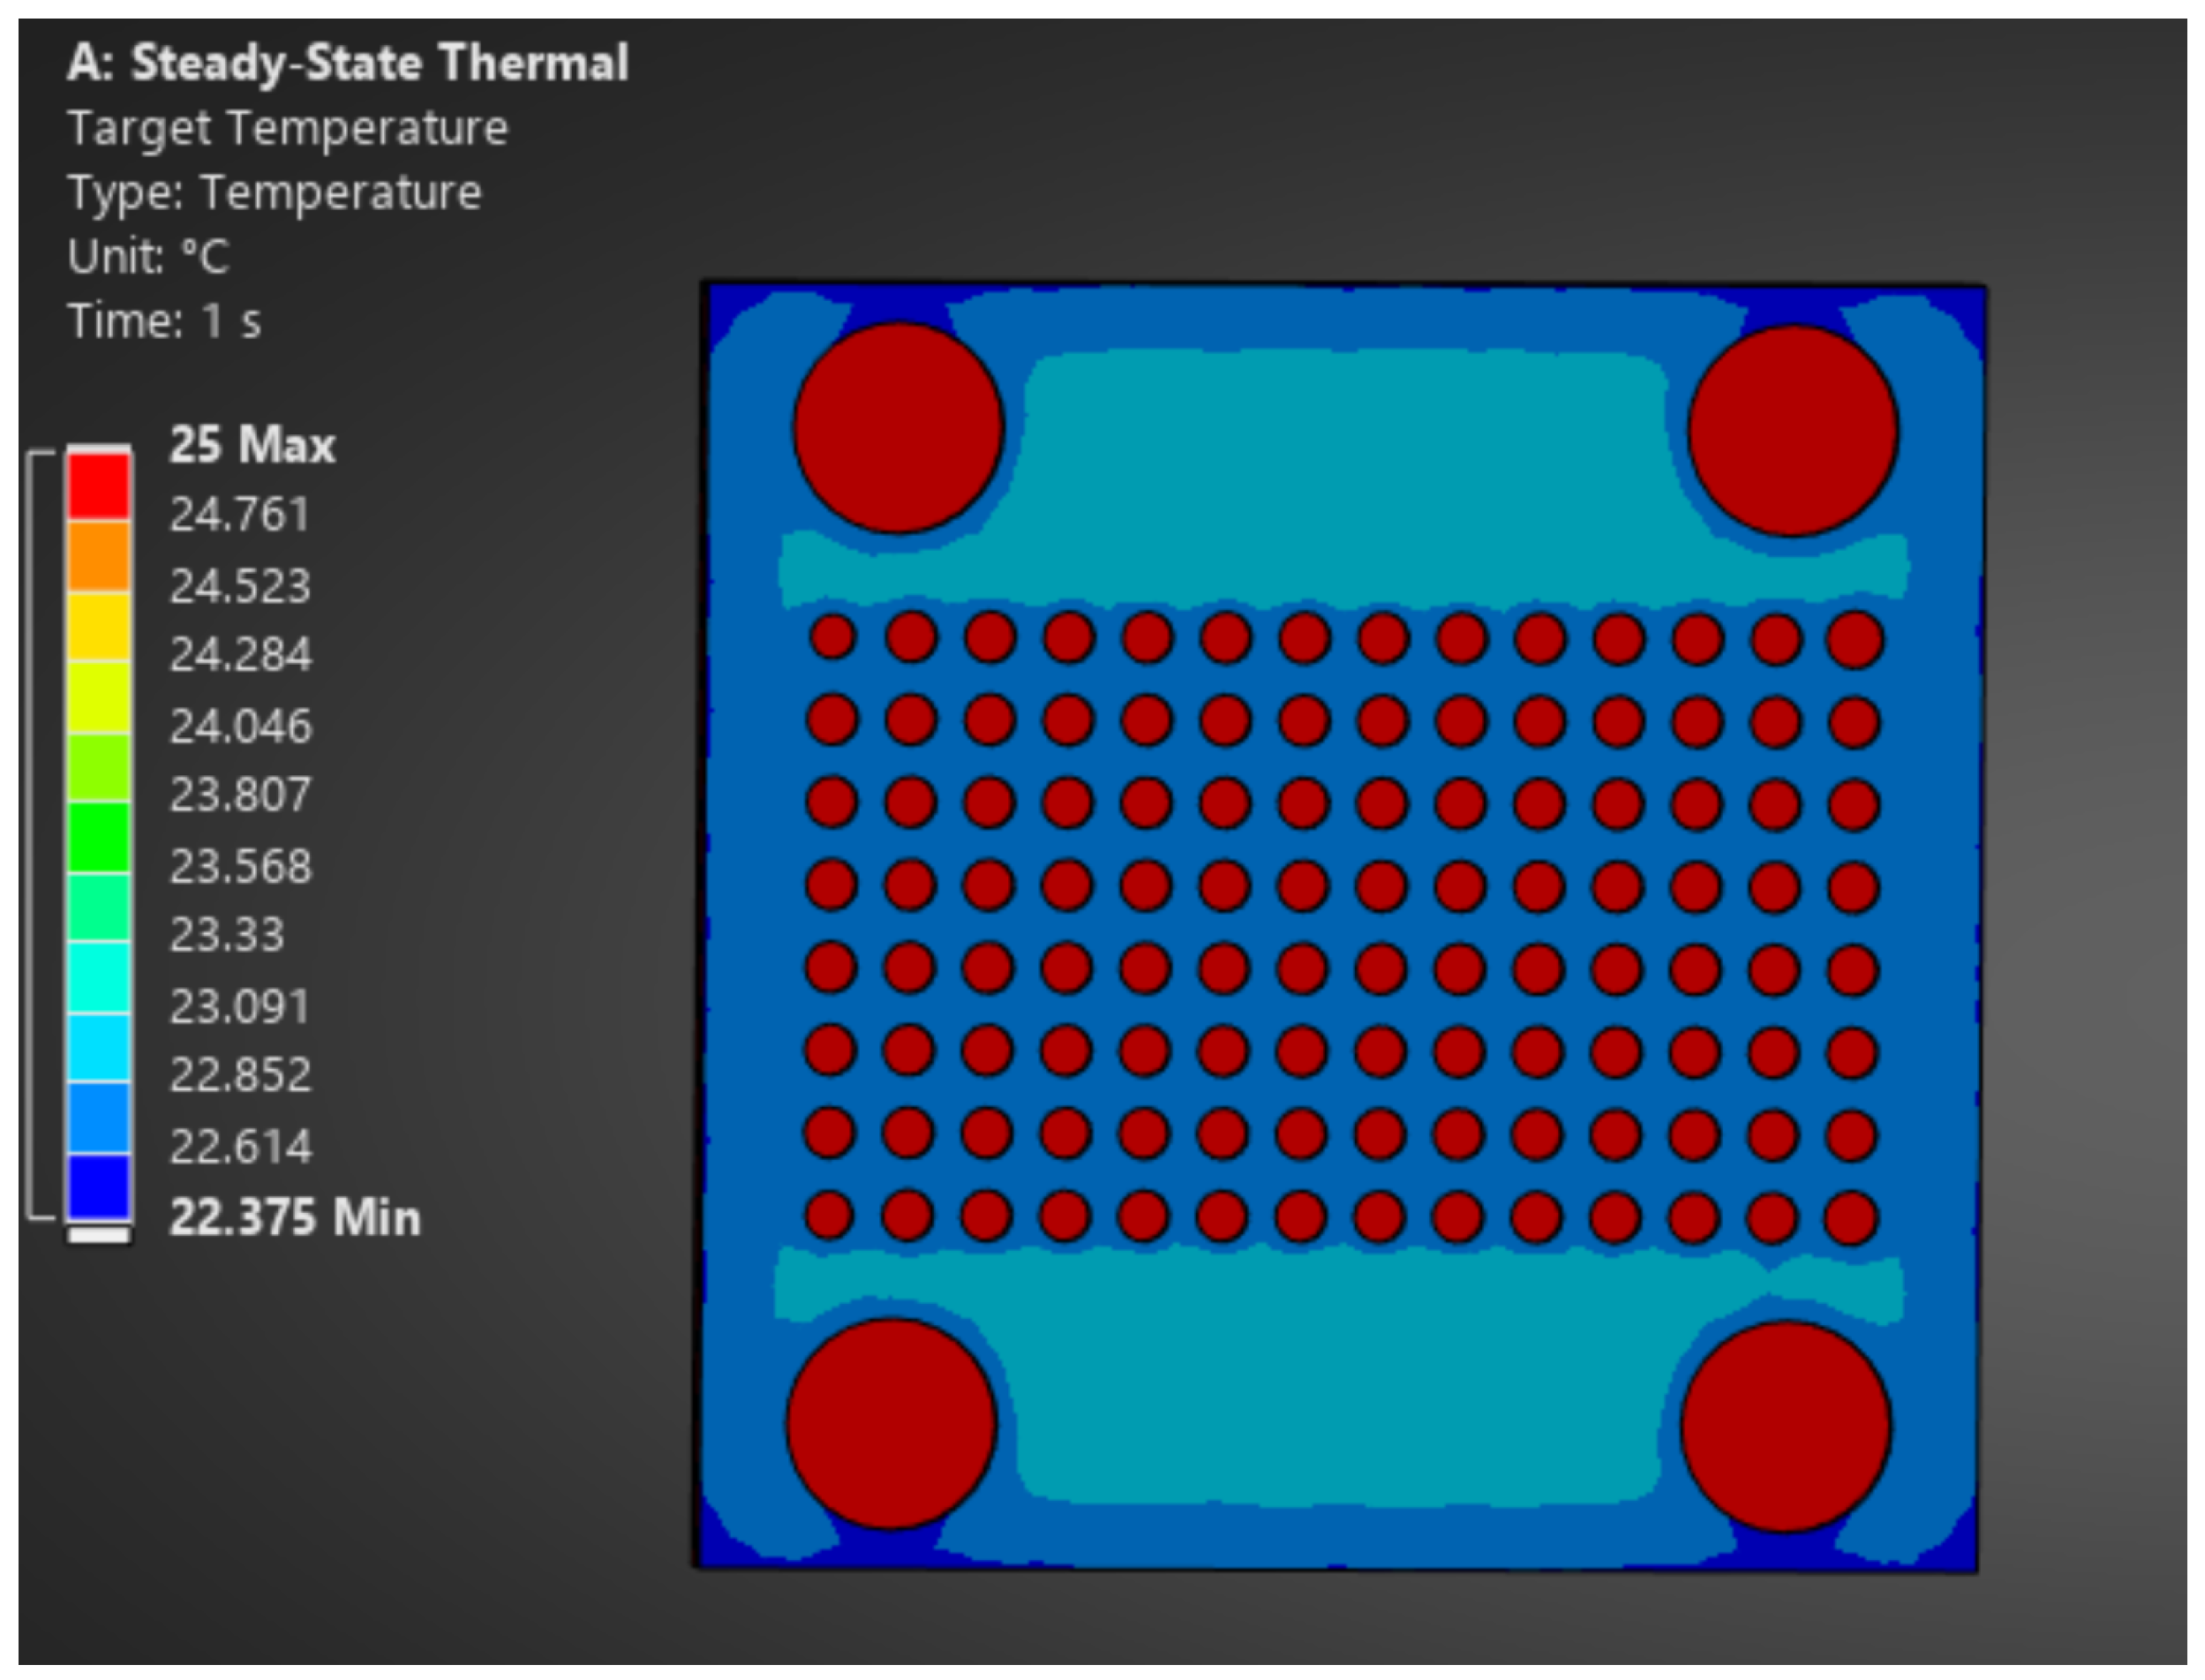
A RGB and thermal co-calibration target constructed by Kim et al. [25] was composed of two anodized aluminum layers, where the front layer (painted for low emissivity) contained a series of cut-out circles and the back layer (painted for high emissivity) was heated. While this design was able to distinguish between the background and foreground, the authors were unable to obtain the desired accuracy. To prevent conduction between layers, our target design uses a circular dot-grid target pattern consisting of a laser-cut white-painted acrylic foreground layer and a black-painted wooden background layer, with 2 cm separation between the background and foreground layers. The back layer is heated by an electric heater placed behind the target, yielding sufficient thermal contrast for consistent calibration feature detection. The full target is 50.8 cm in length and width, with 1.9 cm circular holes and a center-to-center spacing of 3.27 cm between circles. The spacing between holes was validated through ANSYS 2025 R2 steady-state thermal simulation to verify that heating would generate non-overlapping circular thermal gradients at each hole (Figure 7). The background heating layer was assumed to be at a uniform temperature of .
Figure 7.
ANSYS steady-state thermal simulation of calibration target.
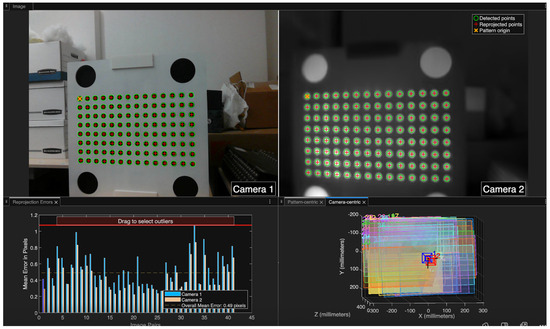
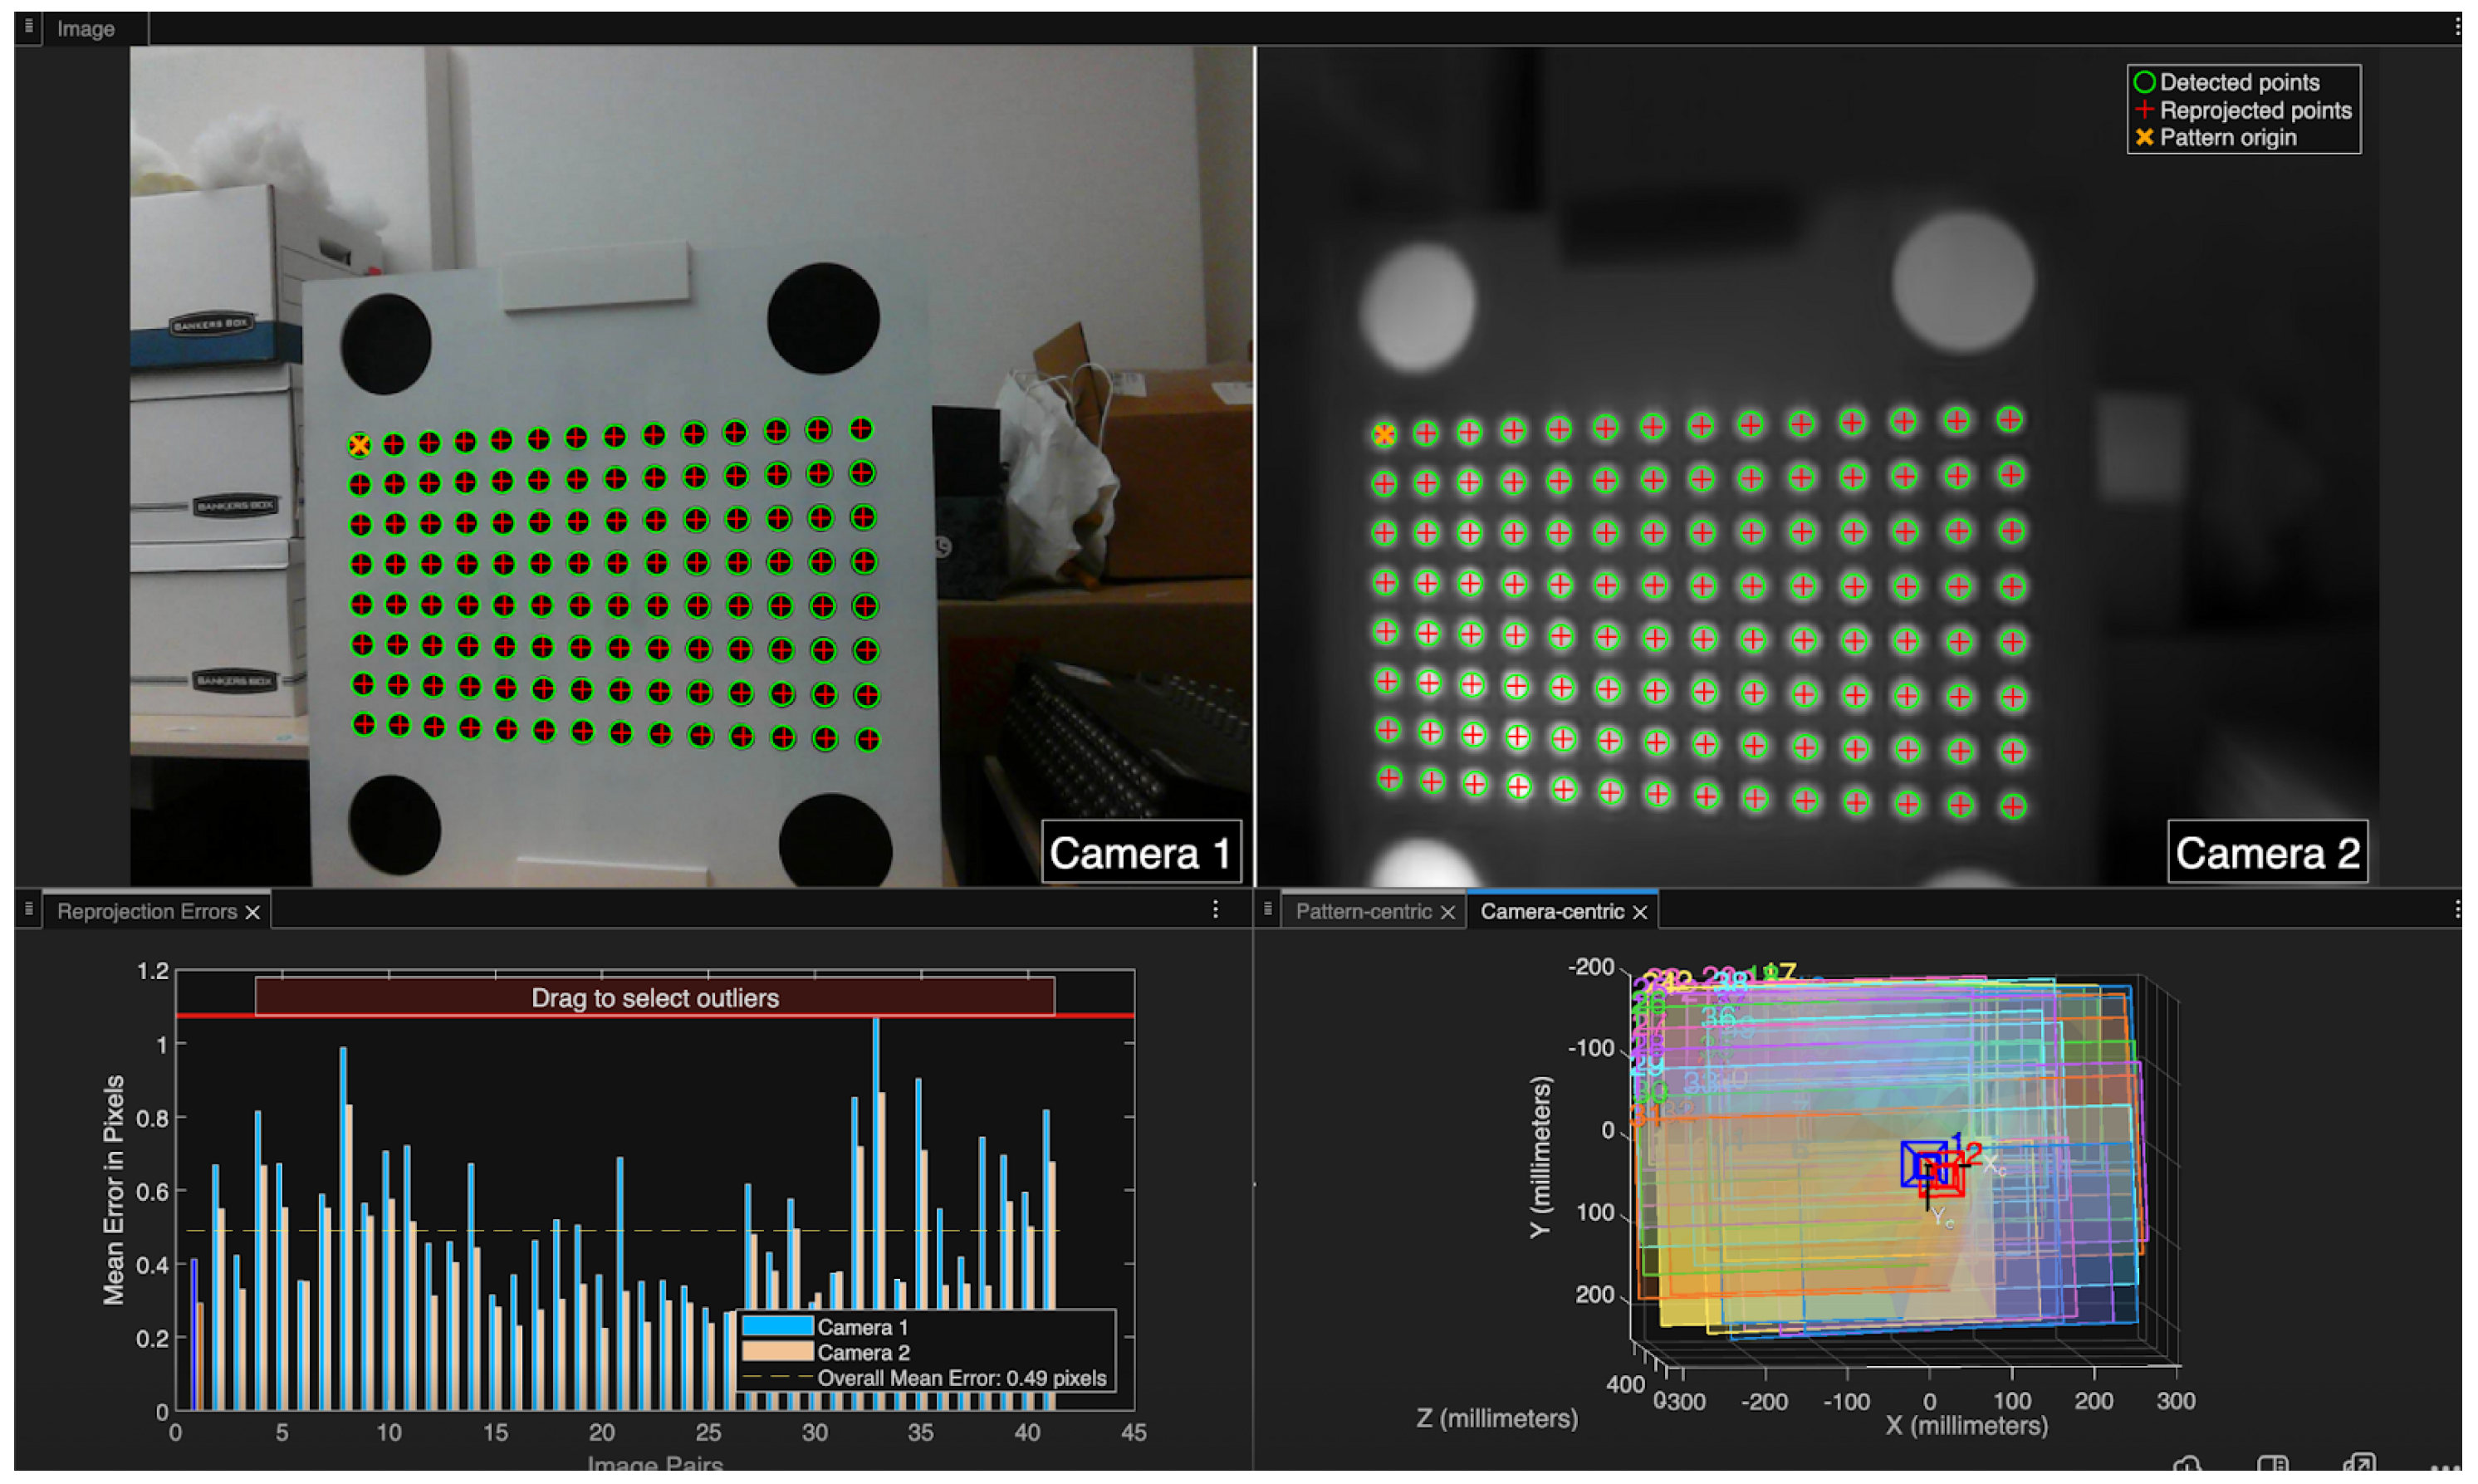
For this target, a custom stereo detector was written in MATLAB R2025b, utilizing the robust included “detectCircleGridPoints” functions for symmetric circle grid targets (Figure 8). Symmetric grid targets are typically not used for stereo calibration due to the potential for 180-degree ambiguity in extrinsic model optimization in certain calibration datasets. Thus, this custom detector class was implemented to enforce the known top-left feature point origin across our calibration dataset.
Figure 8.
Calibration feature correspondences between image pairs in MATLAB stereo calibration.
This improved target design allowed for fitting of a stereo calibration model with an overall mean reprojection error of 0.49 pixels across the 51-image calibration set. The intrinsic matrices and distortion coefficients for each camera are estimated using Zhang’s planar calibration method [37], in which multiple views of a planar target with a known feature geometry yield a homography for each view relating target-plane coordinates to image coordinates. Each homography imposes constraints on the image of the conic and stacking constraints from views allows for the linear recovery of K, from which per-view extrinsics follow. Distortion coefficients and and refined intrinsics are then obtained by nonlinear least-squares minimization of the total reprojection error. Multiview stereo calibration extends this by jointly optimizing both cameras’ parameters together with a rigid relative pose and , enforcing across all views.
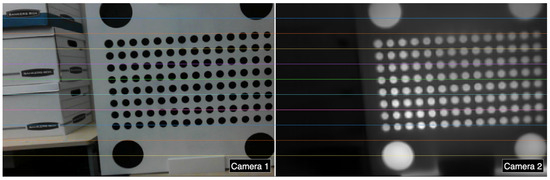
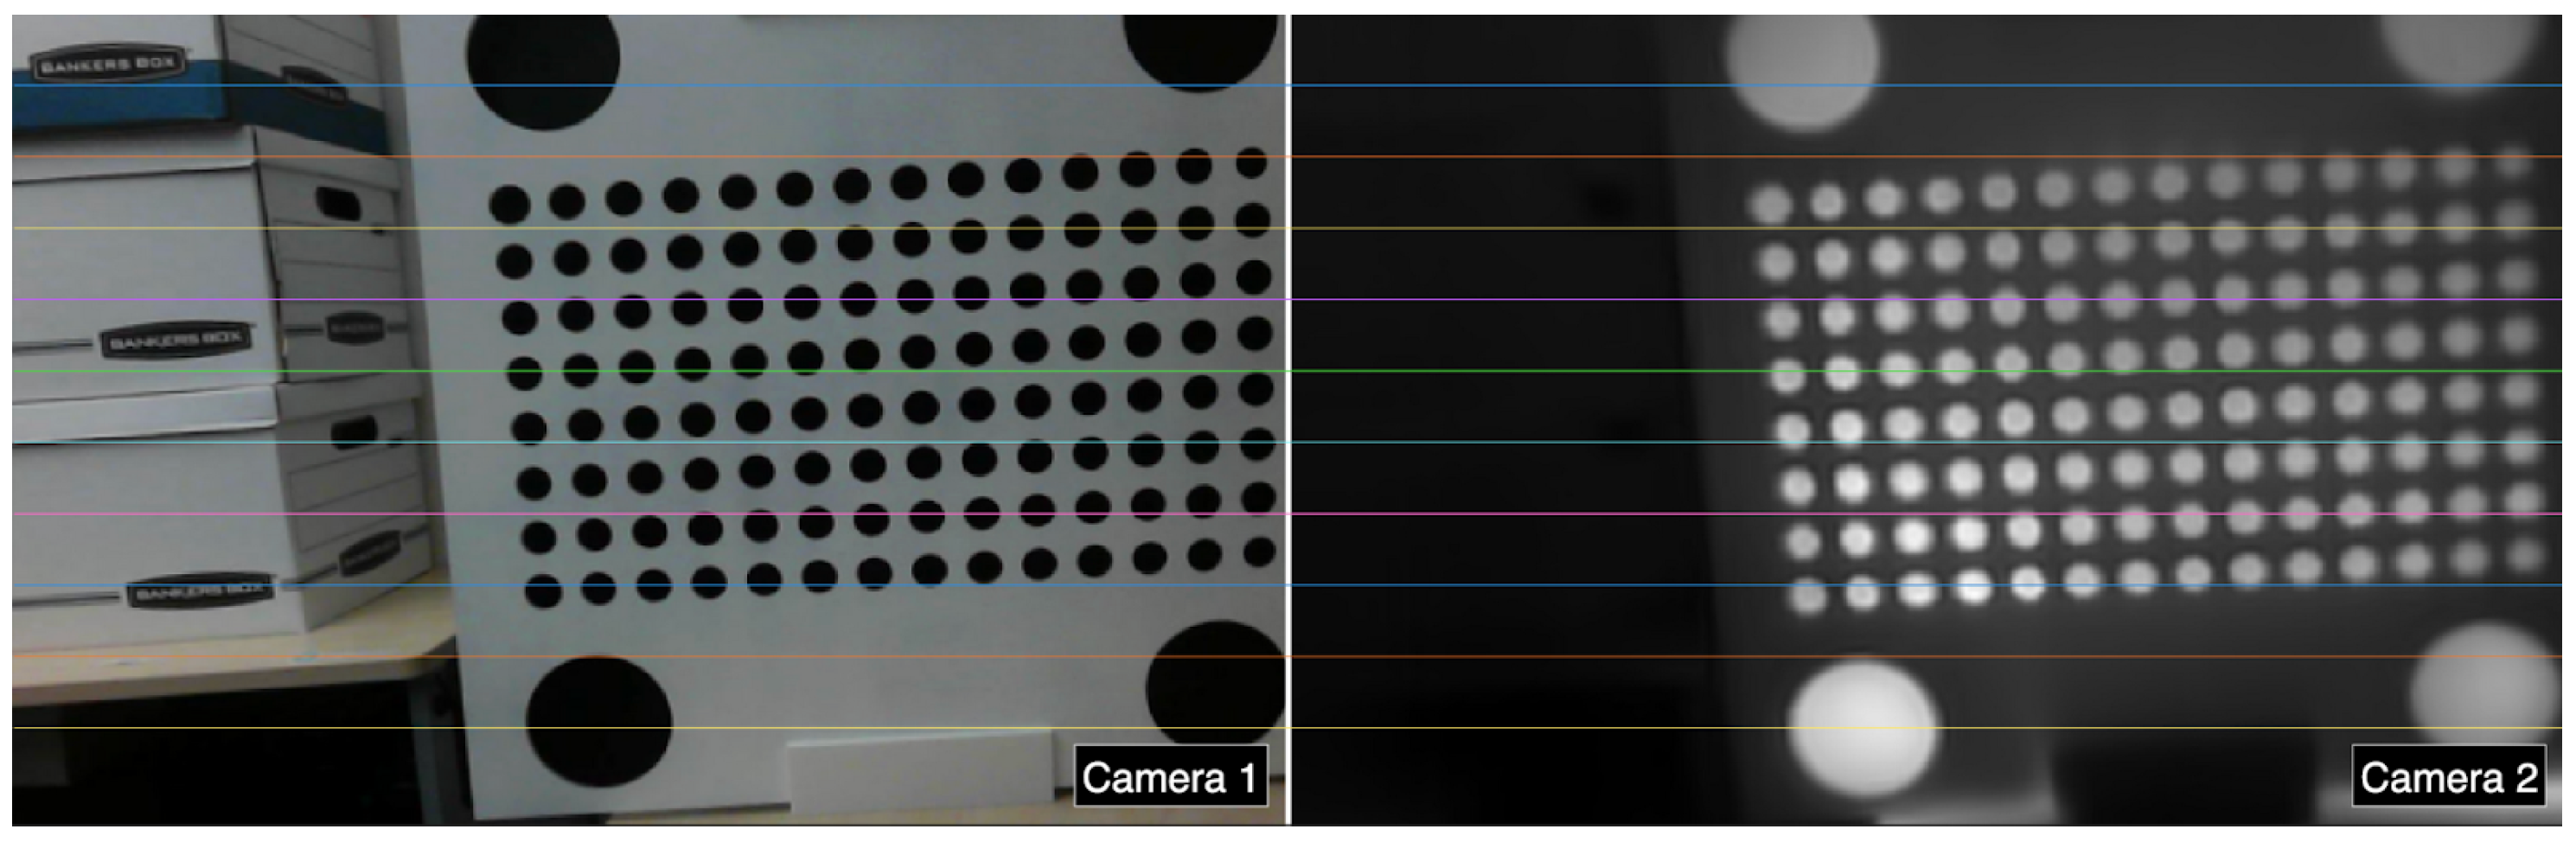
With this calibrated model, stereo rectification computes a pair of homographies that warp both images onto a common image plane, undistorting them via the estimated distortion coefficients and aligning corresponding points along horizontal scanlines for direct pixel-to-pixel matching between modalities (Figure 9).
Figure 9.
Stereo-rectified images from RGB (left) and thermal (right), showing pixel alignment.
The mean reprojection error of 0.49 pixels across the calibration set indicates a well-fit model and bounds the expected 2D registration accuracy between the rectified RGB and thermal images. The corresponding metric registration error at the surface scales linearly with object distance as
where Z is the object distance, is the mean reprojection error, and px is the thermal camera focal length recovered from calibration. Evaluated across typical indoor inspection distances (Table 4), the surface registration error remains on the order of a few millimeters or less, which is substantially smaller than the geometric uncertainty of the photogrammetric reconstruction itself. The calibration is therefore not the limiting factor in the accuracy of the final textured thermal model; thermal features can be expected to land where they belong on the reconstructed surface, with the overall metric accuracy governed by the RGB photogrammetry pipeline rather than by the stereo registration step.
Table 4.
Imaging distance and corresponding 2D thermal-to-RGB surface registration error.
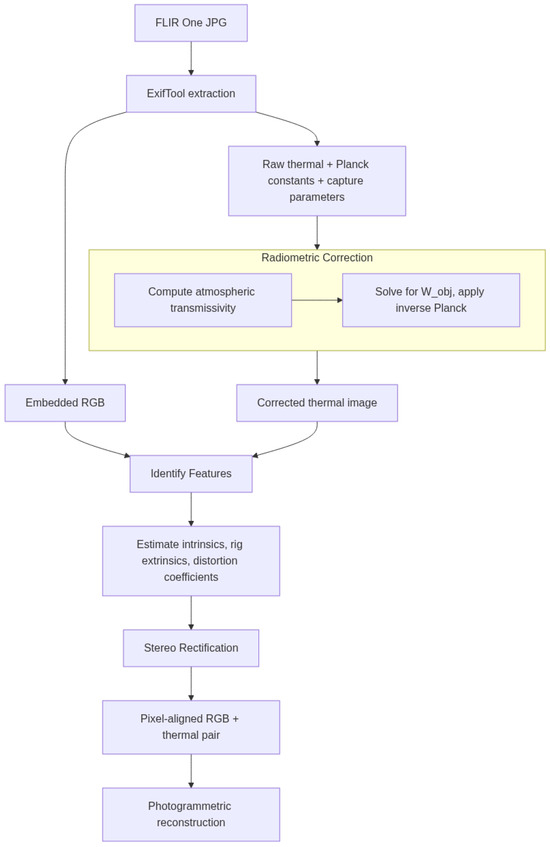
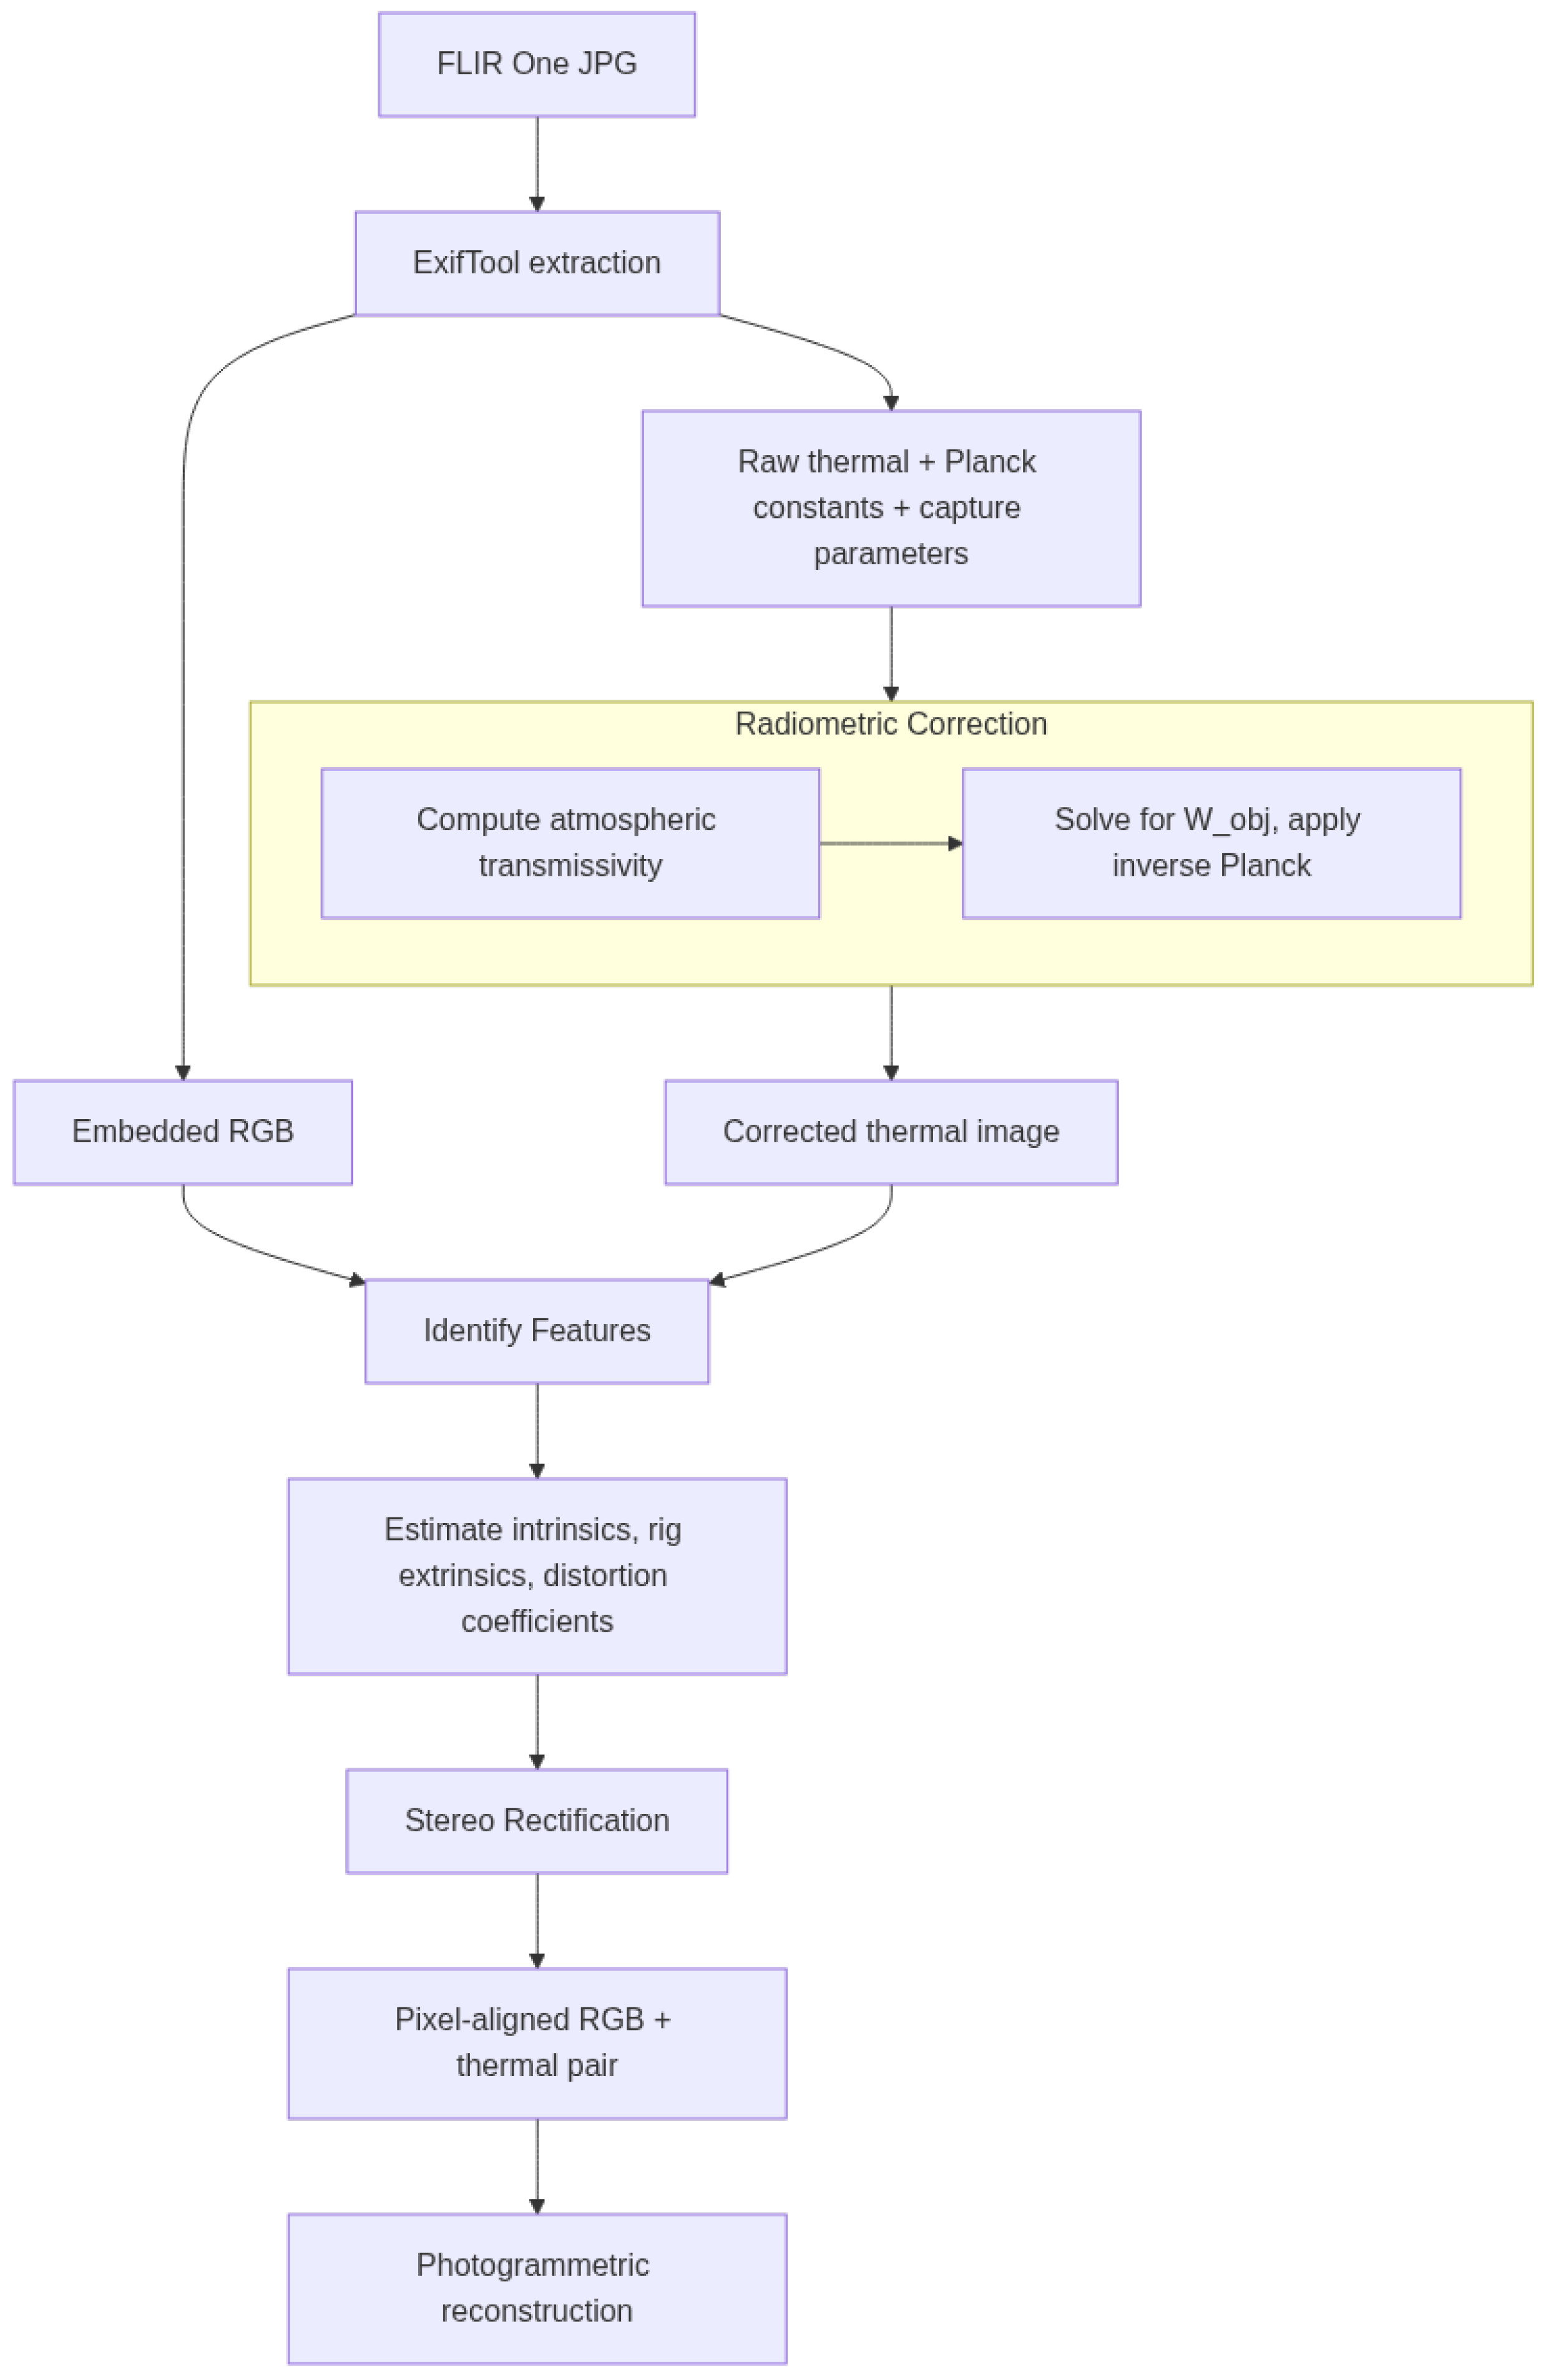
A full summary of the thermal infrared to 3D modeling pipeline is provided in Figure 10.
Figure 10.
Flowchart of TIR image extraction, correction, calibration, and photogrammetric processing.
3.5. Depth Map Integration
RGB image and depth pairs from the iPhone 12 wide lens and LiDAR module seem to be well aligned by the default ARKit library. Unfortunately, ARKit downsamples the RGB image to increase performance and optimize subprocesses, but these images may be swapped out with full resolution versions taken from the same point. The large difference in resolution between the iPhone RGB (12 megapixels) and LiDAR depth image (0.049 megapixels) makes the registration of full-resolution RGB inputs less accurate. Simply due to the number of pixels, within a perfectly registered depth–RGB pair a slanted line may result in an error of up to five pixels (halved resolution) and ten pixels (full resolution) (Figure 11). This difference can lead to significant distortion.
Figure 11.
iPhone 12 LiDAR depth map overlay on RGB image with pixelated overflow. Color map is normalized depth, on a range of red to blue over increasing distance.
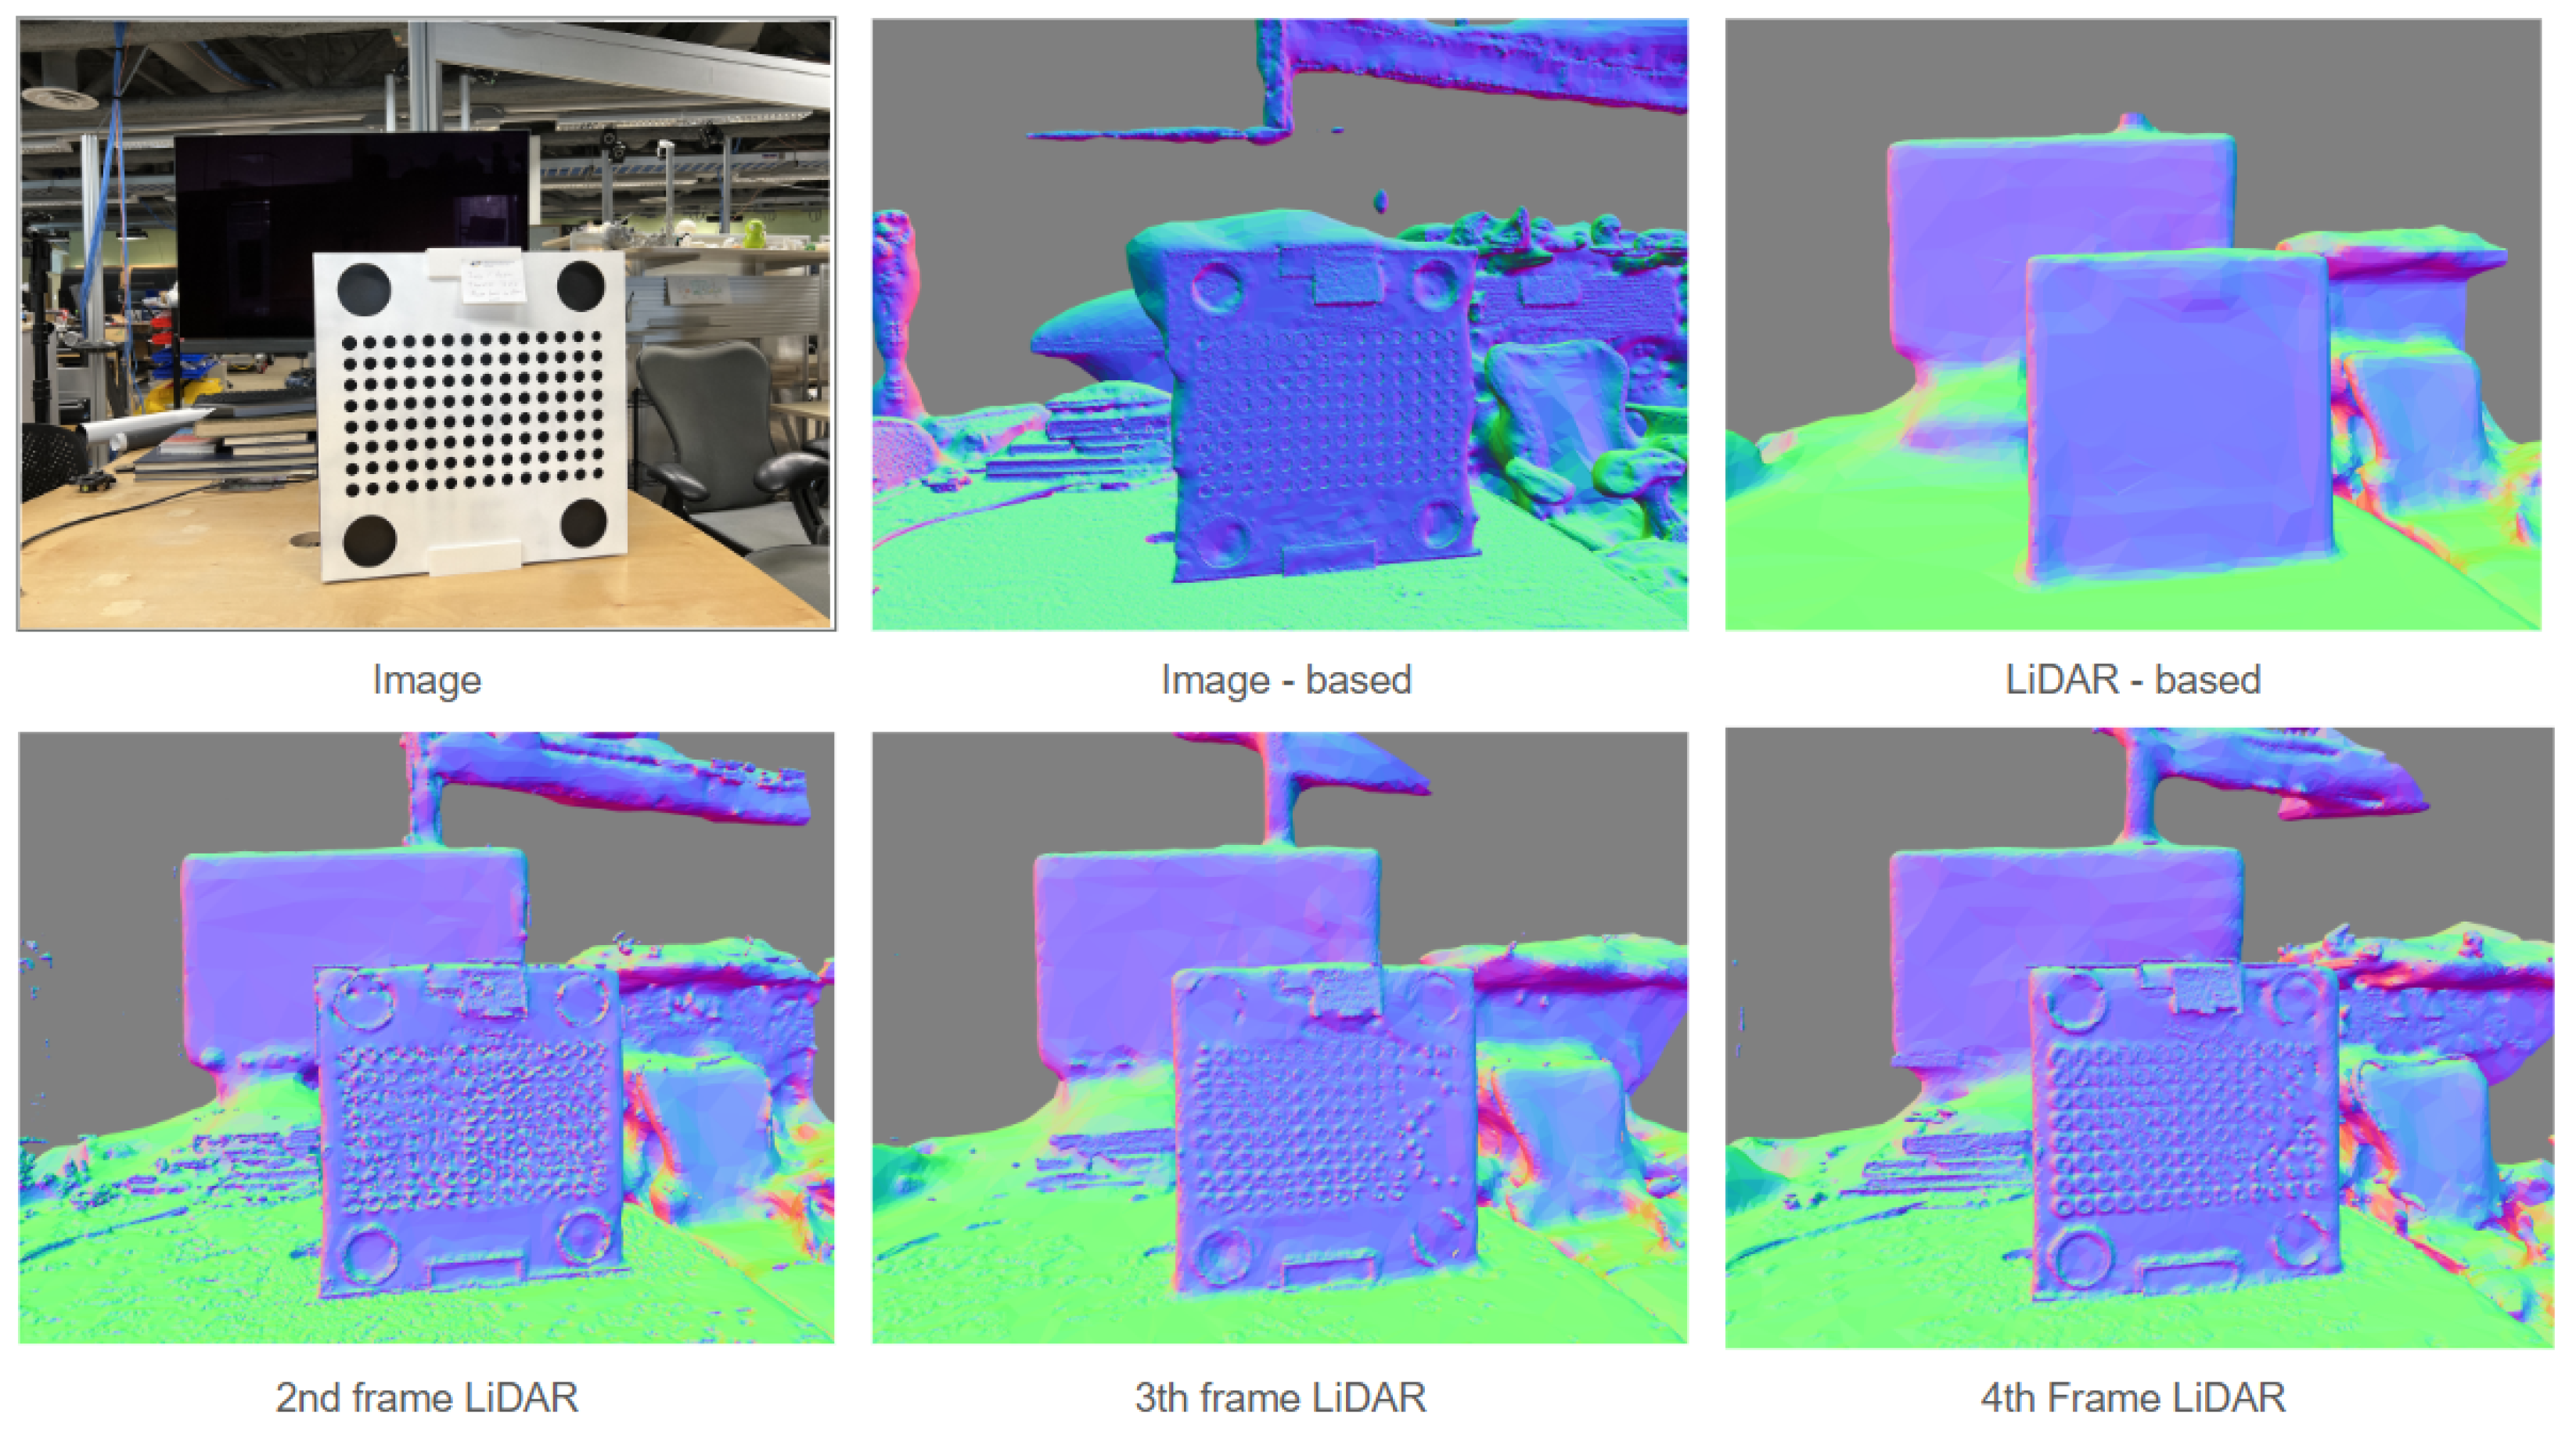
The depth maps from LiDAR are poor resolution, but they fill in gaps which traditional photogrammetric reconstruction cannot fill. By mixing these LiDAR depth maps in with higher-resolution depth maps made using structure from motion (SfM), a fused model can be generated taking advantage of both methods. When an LiDAR-image pair is imported into Agisoft Metashape, the depth map provided is used by default. A simple experiment was run using a dataset of 39 iPhone 12 image-LiDAR pairs of the calibration target (Appendix A), changing the proportion of LiDAR-image pairs to normal images (Figure 12). When images are used by themselves, the TV screen in the background is not reconstructed. When only LiDAR depth is used, we lose fine features but gain featureless structures. As we change the frequency of LiDAR/image-based depth maps, we move towards a happy medium at a ratio of about 1 to 4. In the case that the scene is rich with visible features, the inclusion of LiDAR-based depth maps has a negative impact, except to help establish an initial scale.
Figure 12.
LiDAR and image-based modeling depth map fusion. Colors are mapped according to the model’s normal map, indicating directionality of surface faces.
3.6. Data Fusion and Processing
This study employs Agisoft Metashape 2.2 for 3D reconstruction and fusion, with the goal of producing a 3D radiometric thermographic mosaic: a spatially registered, fully textured 3D surface model in which many individual low-resolution thermographs are combined into a single continuous output. The mosaic is the end product of the registration and calibration pipeline described in the preceding sections. The multi-sensor fusion workflow exists specifically to make this output possible with consumer-grade hardware, and to ensure that the full 16-bit radiometric content of each thermograph is preserved in the final model rather than normalized or reduced for visualization. For the sake of scientific investigation, it is critical to maintain the full range of temperature information. By normalizing the values for media exports, as is common practice, fine detail is lost. With a 16-bit value, ranges can be set on the fly to account for outliers, or to adjust to see variation within extreme hot or cold features like electrical components or heating/cooling systems. To maintain the full range of information contained within the 16-bit thermal images it is important to use these values on the final texture overlaid over the 3D model. Attempts to “colorize” a point cloud resulted in suboptimal noisy outputs as compared to mosaicked textures. As this paper employs a methodology switching out coregistered thermographs with RGB images, rather than using the thermographs themselves for the reconstruction, this step must occur after a mesh has already been built. The most common 3D model texturing pipelines do not support this data type, so a somewhat convoluted workaround is employed to ensure data integrity on the final 3D outputs.
FLIR cropped RGB images must be saved in their own directory, with the same filetype and name as their corresponding TIR images saved in another directory. After alignment, the FLIR images are selected as a group, and the “change path” option is chosen, and then the directory full of corresponding TIR images is selected. After the images are switched, a standard “build texture” workflow using the “mosaic” feature was used. The texture, in Agisoft, is not visually parseable, but it does contain the full 16-bit values. As mesh format exports do not generally support 16-bit textures, the “build pointcloud” is used, using the mesh as the source, and sampling at a distance of 5 mm. The resultant point cloud can then be exported as an ASCII .XYZ file, maintaining full 16-bit values. We create a copy of the chunk and do the same process using the RGB images again to produce a matching color point cloud, exported as .LAZ. It should be noted that while the .LAS/.LAZ file format does support 16-bit color values, the Agisoft exporter does not use it.
After the .XYZ file (containing the 16-bit temperature values) and the .LAZ file are both exported, they are imported into CloudCompare 2.13.2 In CloudCompare the 16-bit scalar thermal value is renamed to Intensity. The .LAZ file is selected, and, using the “interpolate from another entity” tool the Intensity values are transferred onto corresponding points in the .LAZ file. Some LAZ renderers have issues with Intensity values stored in decimal format. To account for these issues, and ensure widespread compatibility, the “Intensity” scalar value is copied to create an additional field (named celsius, kelvin, or fahrenheit) and then normalized across a 16-bit range. This file can then be exported, maintaining all color and temperature information with the additional benefit of live gradient manipulation to highlight features of interest.
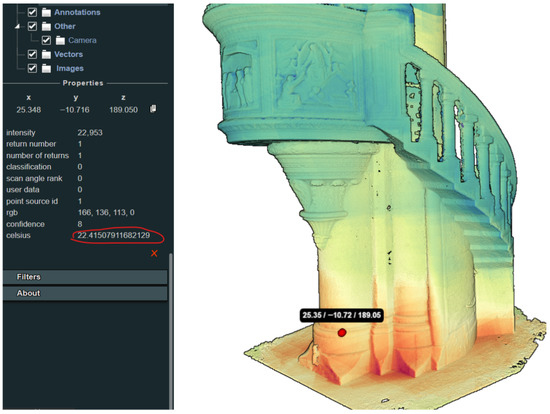
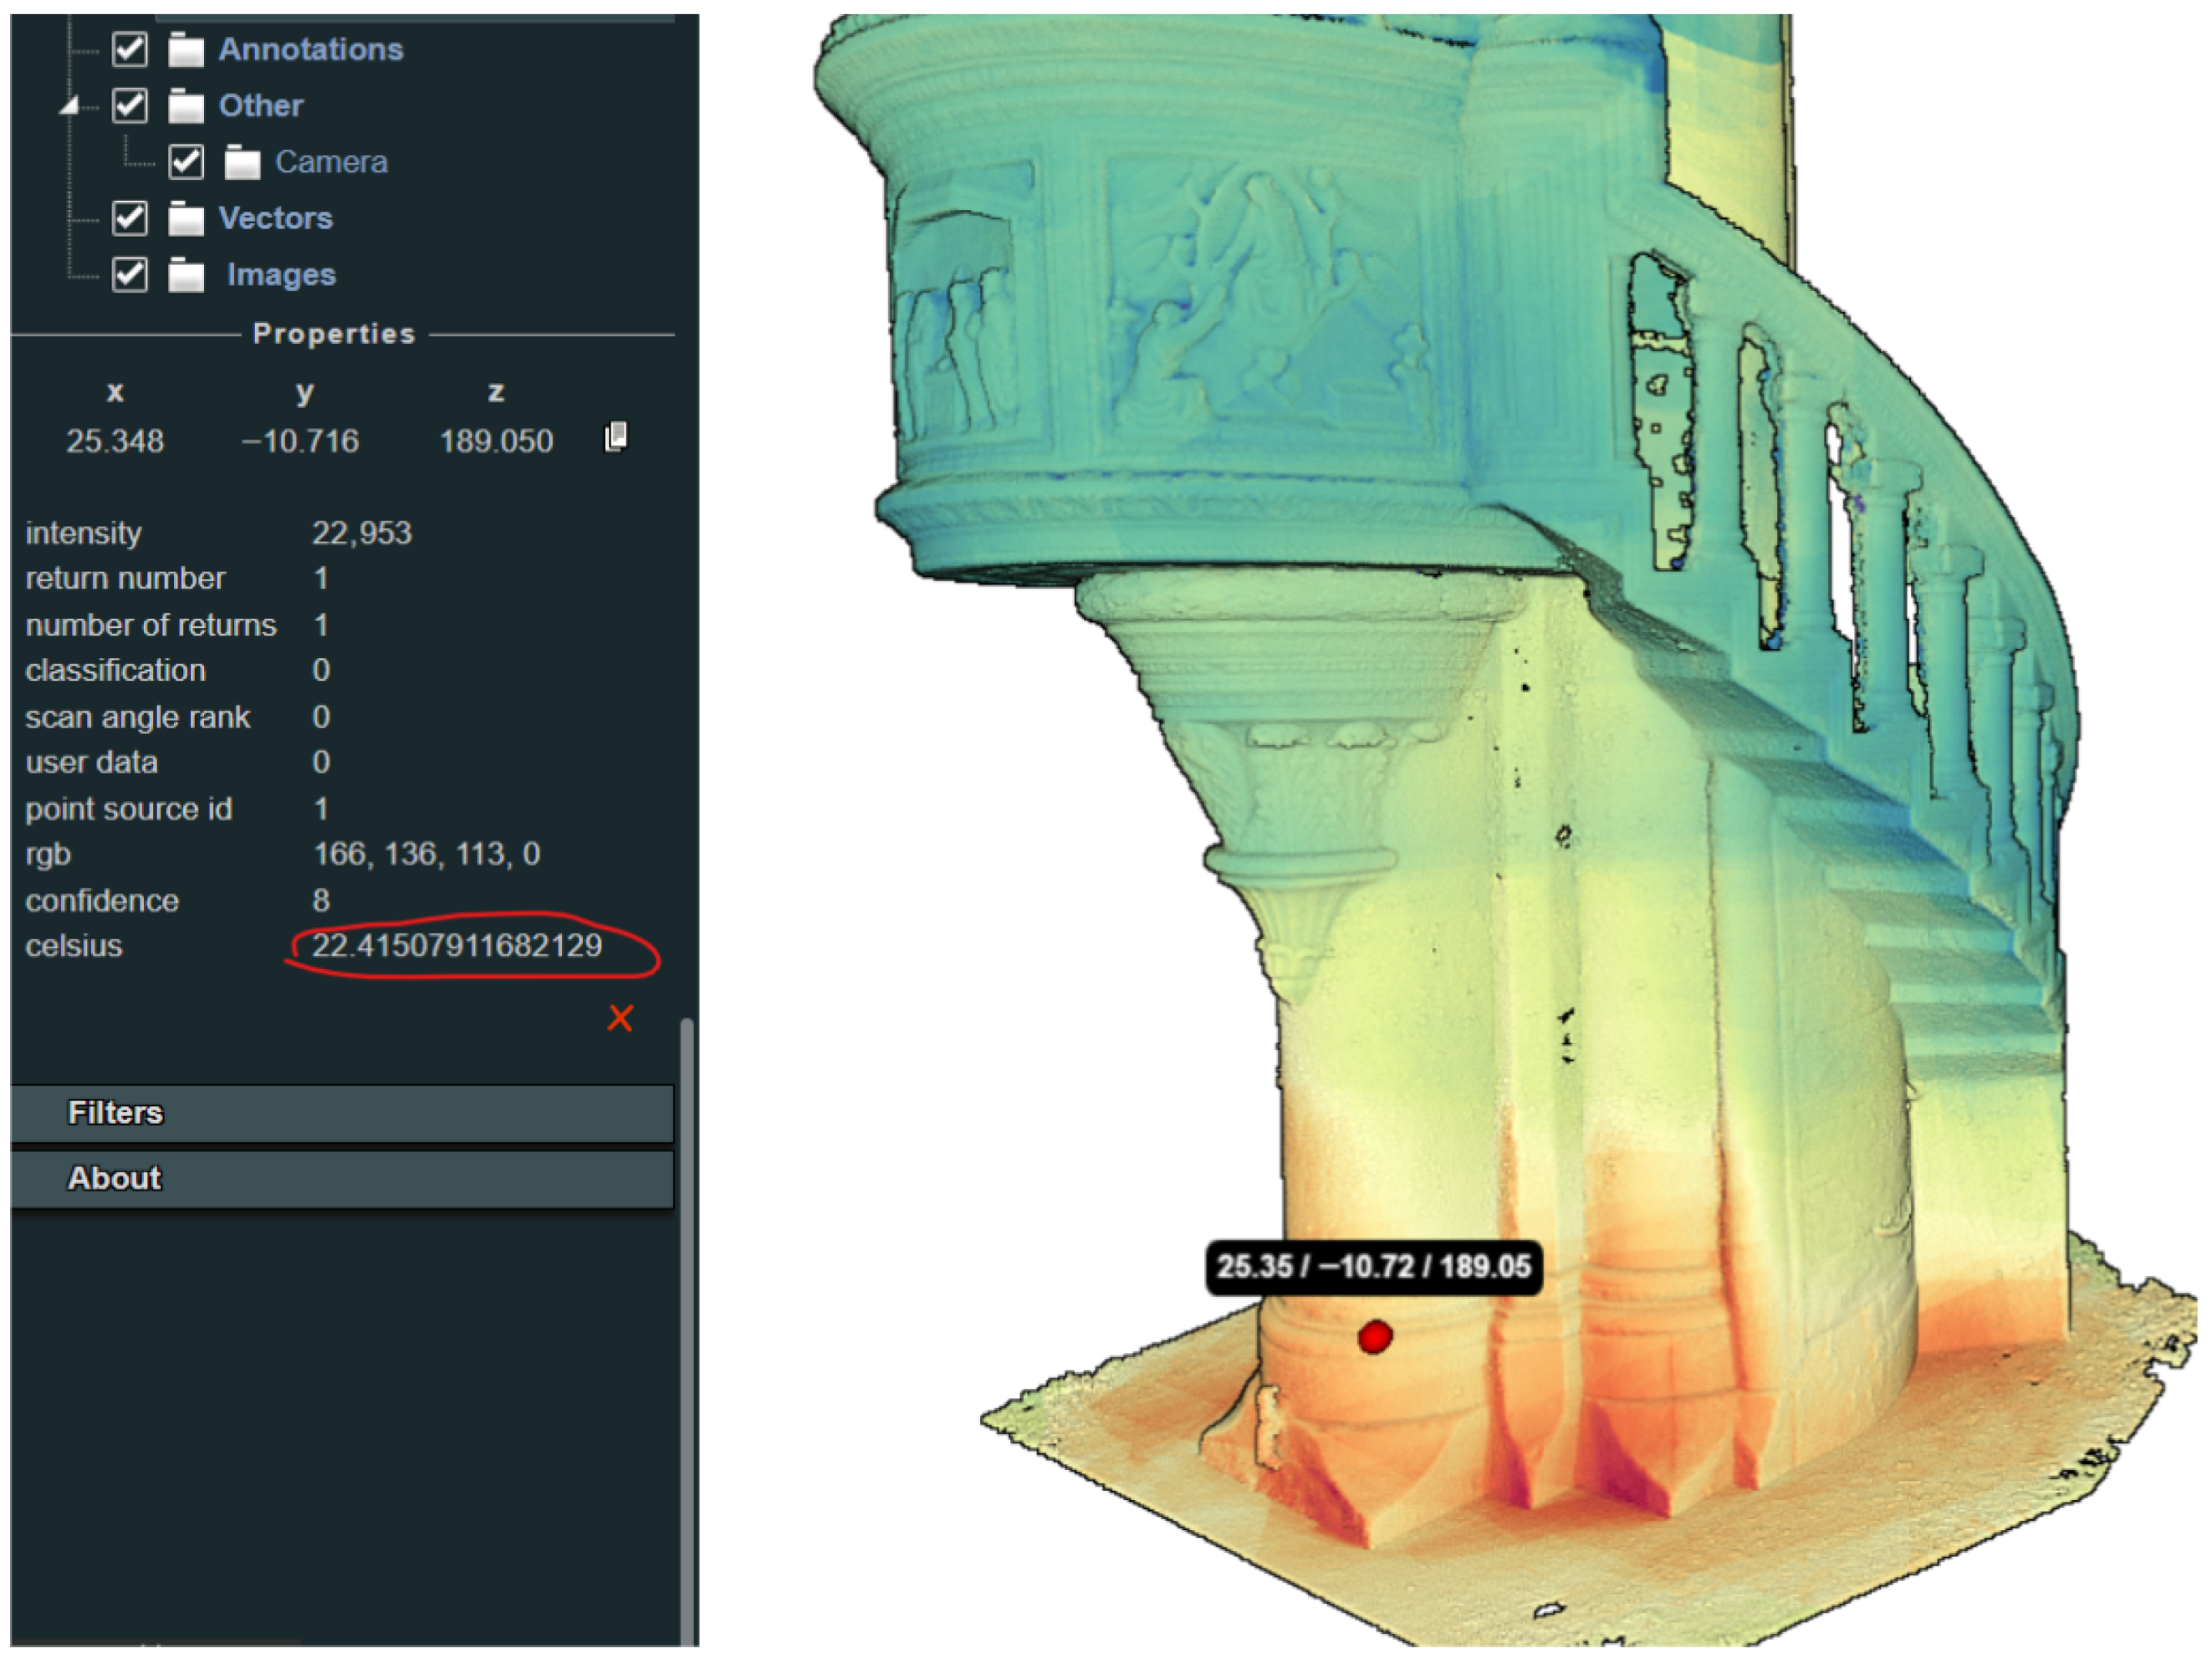
The LAZ file is then imported into PotreeDesktop 1.8.1 [38], where each point and its value can be queried using the point tool (Figure 13). This program enables optimized full-resolution point cloud visualization “composite” views, allowing the overlay of multiple contextual layers. Examples are included (Appendices Appendix A, Appendix B and Appendix C), showing these resultant point clouds within a custom Potree web viewer framework [39], co-registered with additional data layers.
Figure 13.
Fusion result in Potree viewer, with temperature displayed by point. Colors are mapped to indicate relative temperatures.
3.7. Use of Artificial Intelligence
The AI tool Claude.ai using the Sonnet 4.5 Large Language Model [40] was used in the later stages of the literature review, to search for highly specific relevant sources related to the paper’s subject matter. It was also employed to suggest grammatical corrections to original text, to improve clarity and flow, and to perform basic document formatting tasks. The authors of this paper have reviewed and approved the final manuscript, and take full responsibility for its content, including the content which has been generated or modified by AI tools.
4. Results
To test these methods in the field, we performed two different case studies, each using different acquisition methodologies, and changing between interior and exterior environments where the influence of the sun was significantly different.
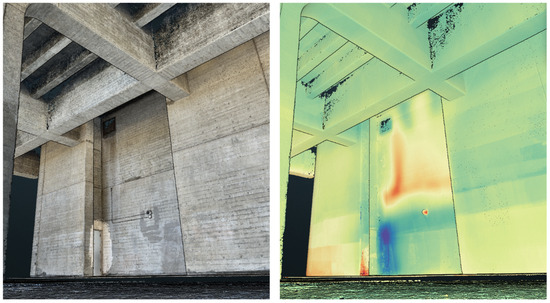
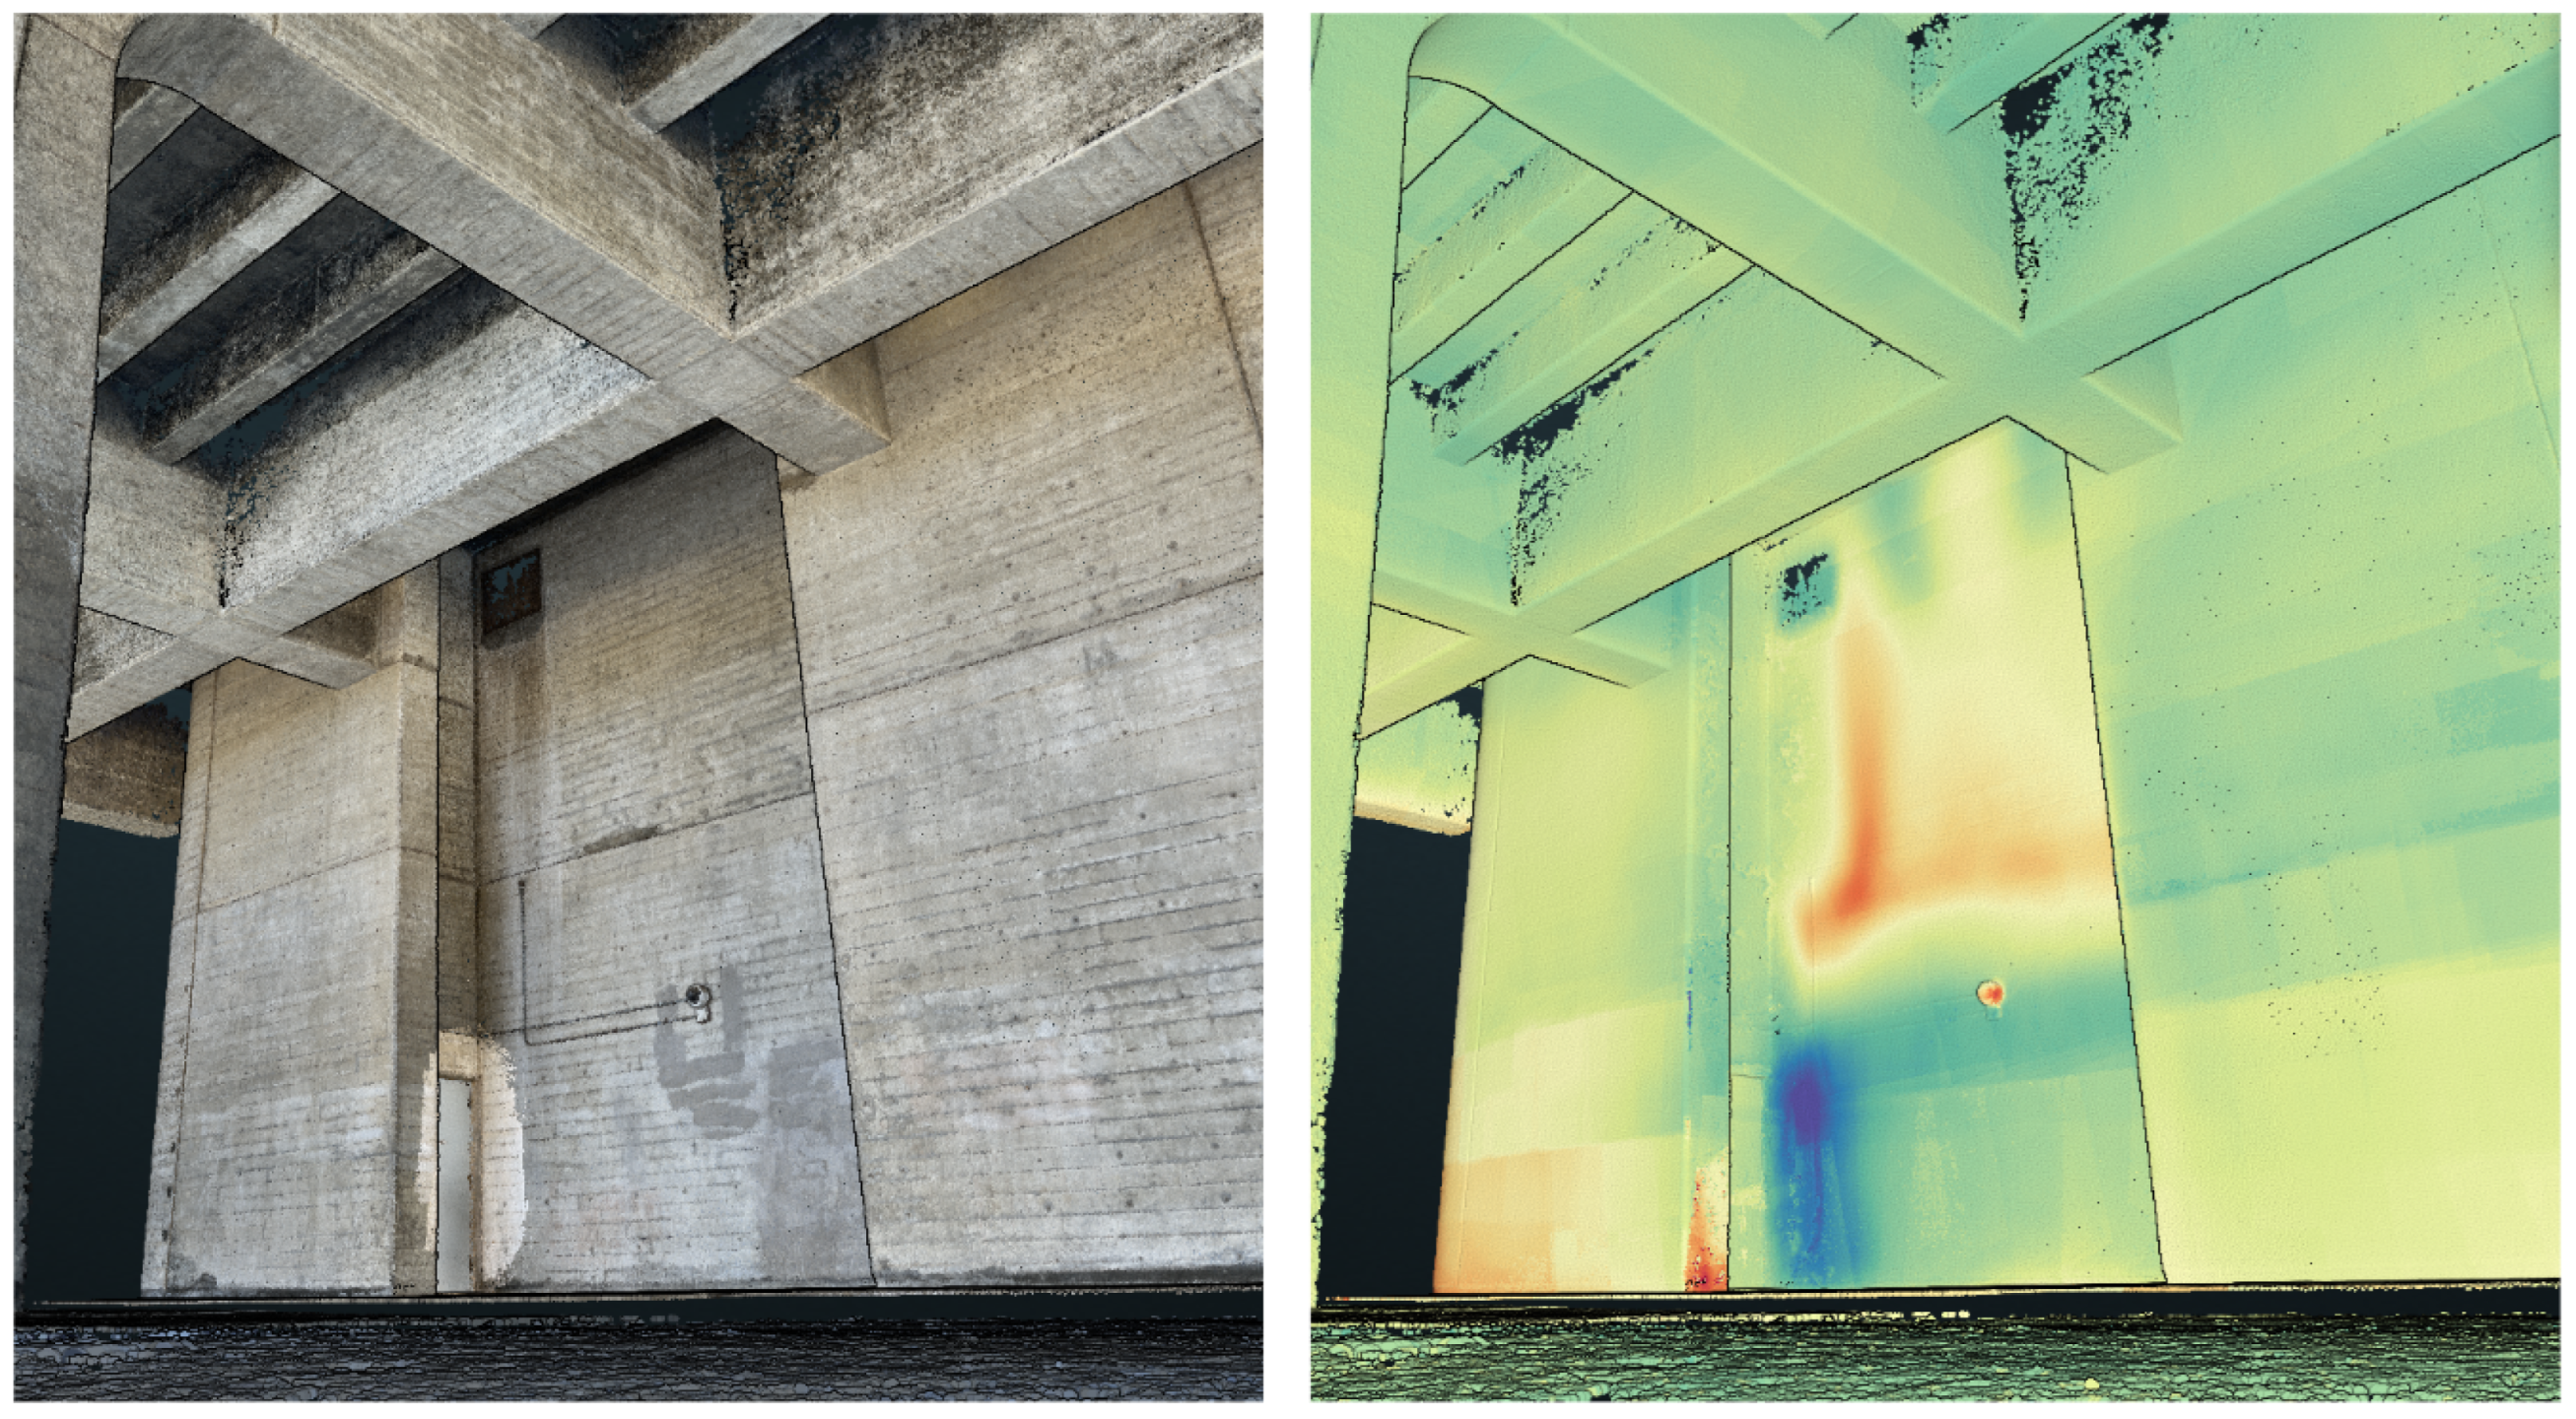
The first was a test of concept on the brutalist Geisel Library at UC San Diego, famous for its irregular shape. The capture was performed in three phases, first capturing 570 FLIR One and iPhone “wide” camera pairs using a fixed tripod (Appendix B). Anomalies were present and well registered, including the heat of the security camera, and cool air leaking through the door (Figure 14). The signature of a utility pipe was revealed on the north wall of the structure, and confirmed by the facility’s staff. The Geisel Library case study covers an area of 25.86 m × 10.81 m, with a max ceiling height 8.94.
Figure 14.
Reconstruction of Geisel Library, photo-based with LiDAR added for door at a later time (left), and thermal mosaic, with normalized relative temperature color map. (right).
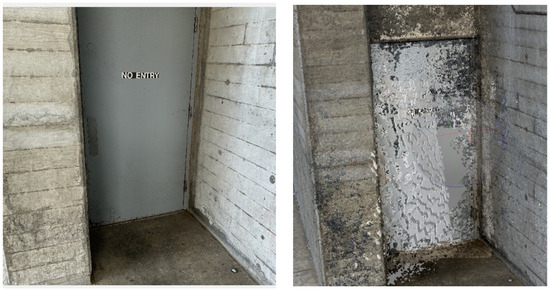
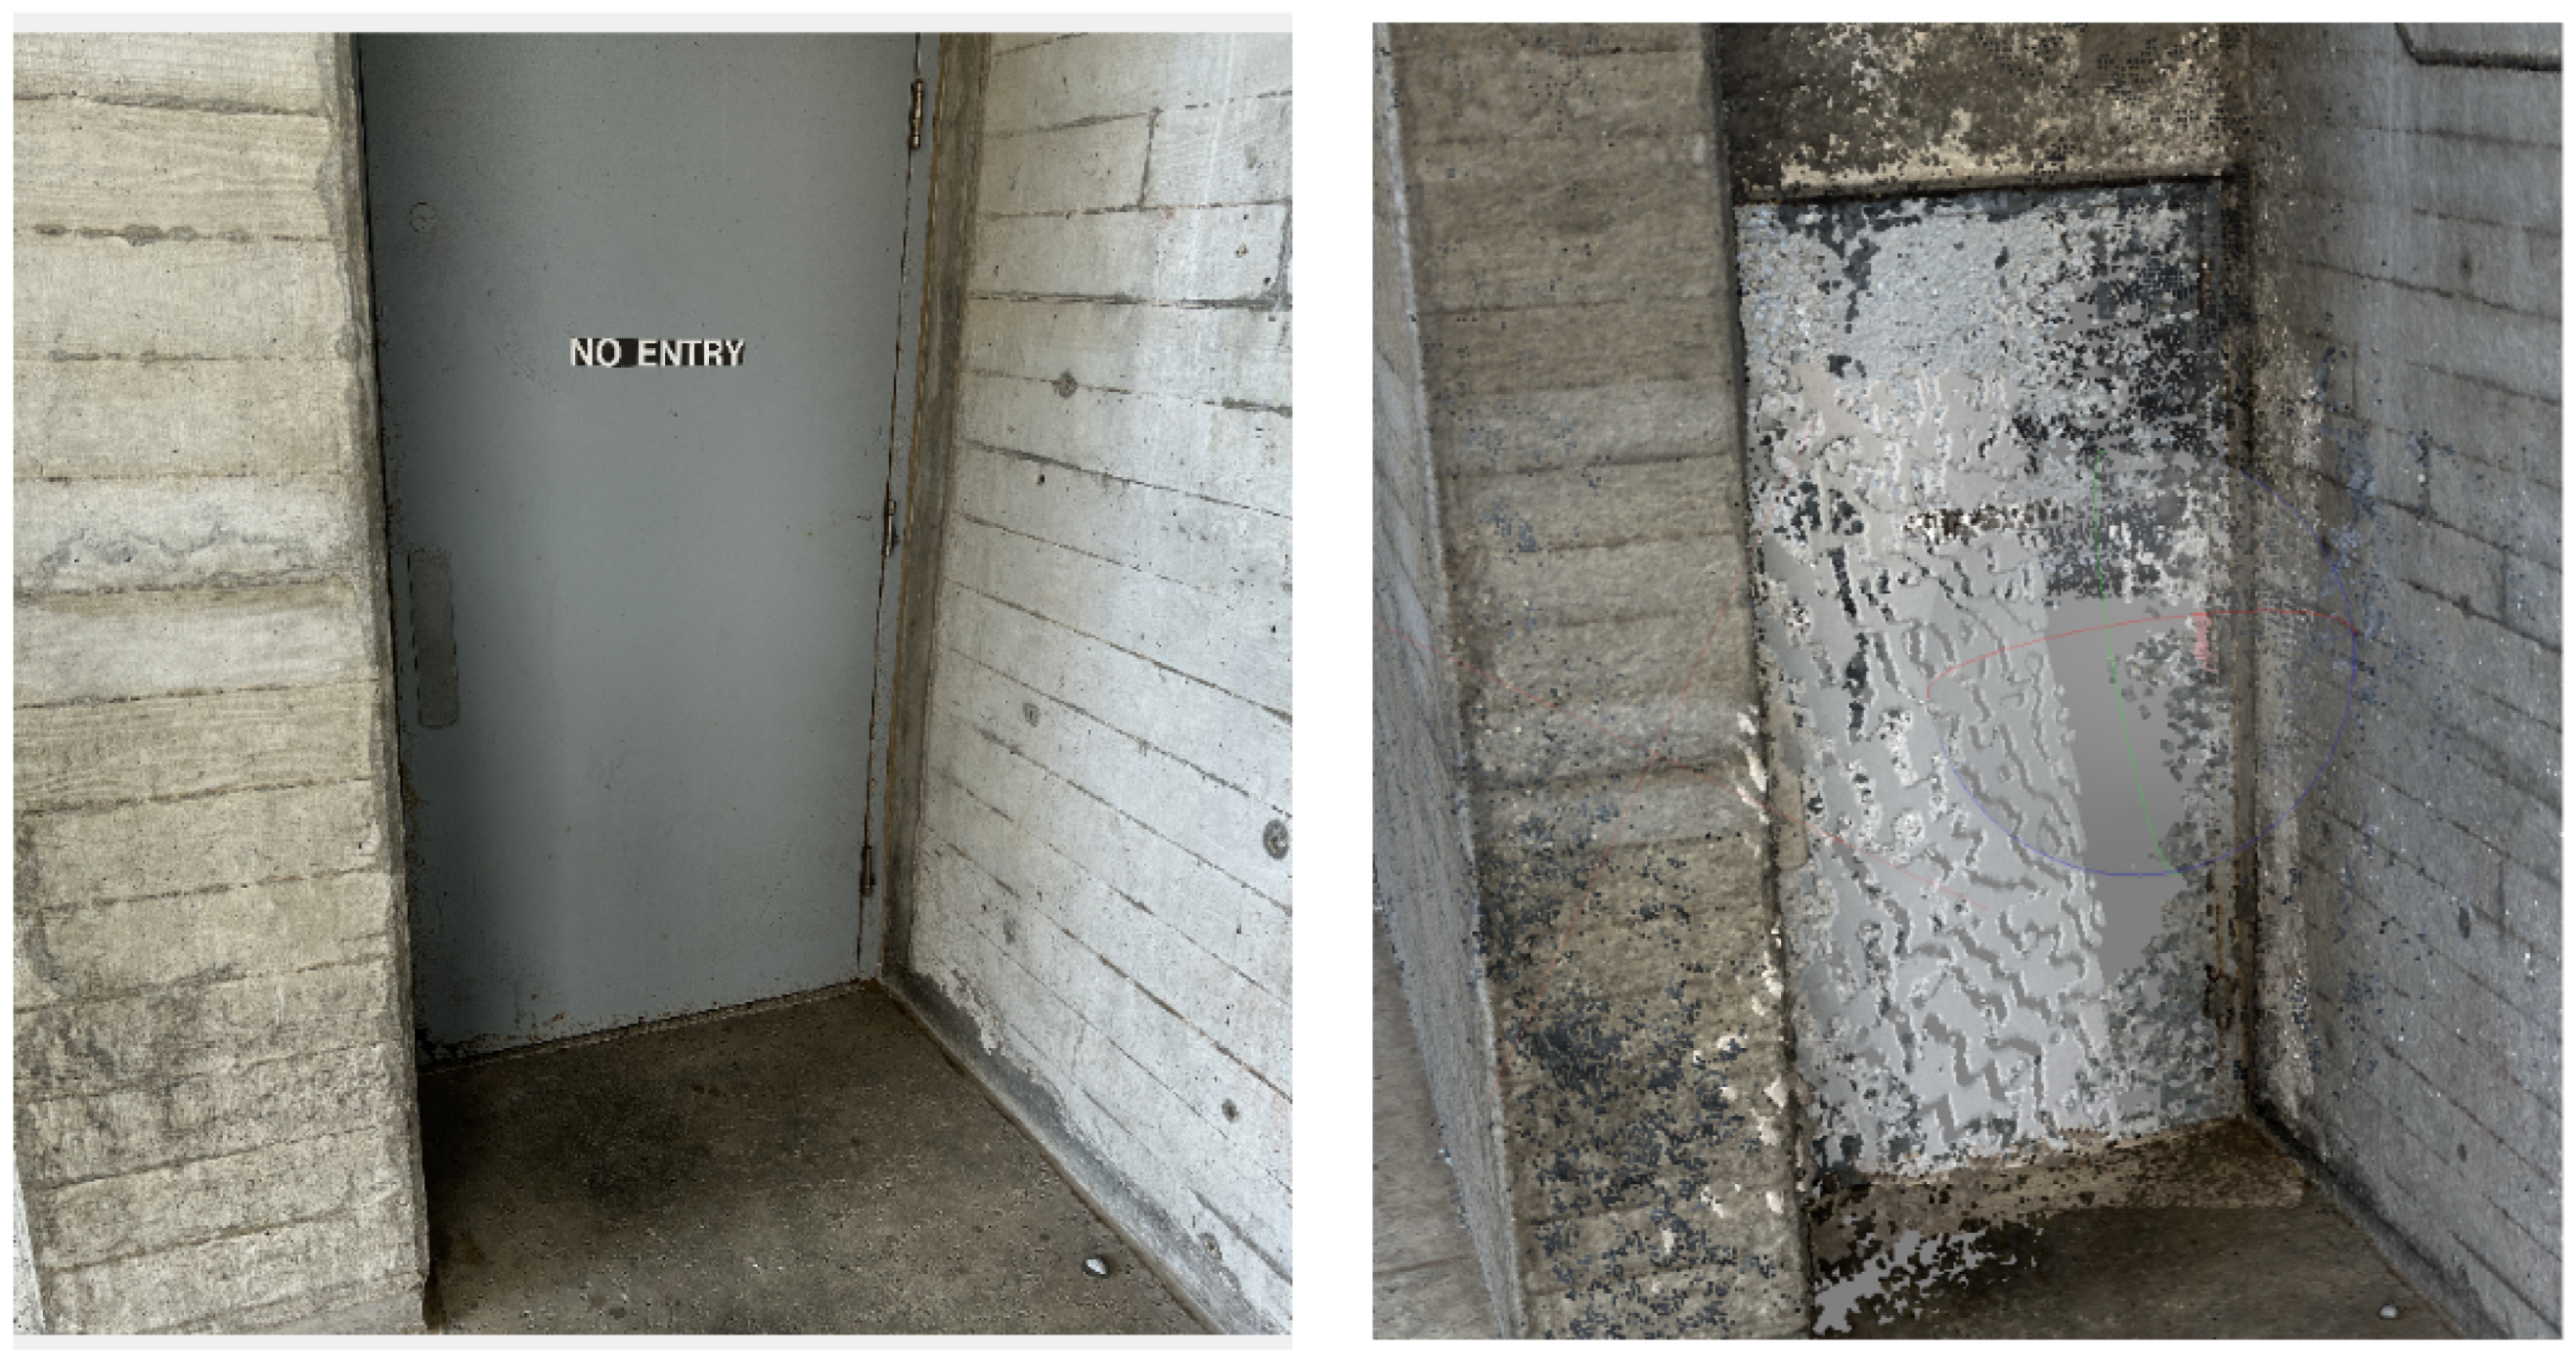
A layered effect is visible: where certain images overlap, there is a sharper transition in temperature of 0.1 to 0.2 degrees. This may be due to changes in ambient temperature over the course of the long acquisition, or could be due to a failure to correct the temperature for changes in acquisition distance. More troubling was the failure to reconstruct a flatly painted utility door (Figure 15). This spurred further investigation into the use of depth sensors.
Figure 15.
Utility door, image from iPhone 12 (left) reconstruction in Agisoft Metashape (right).
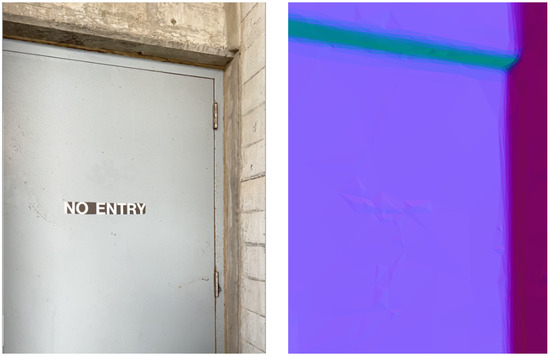
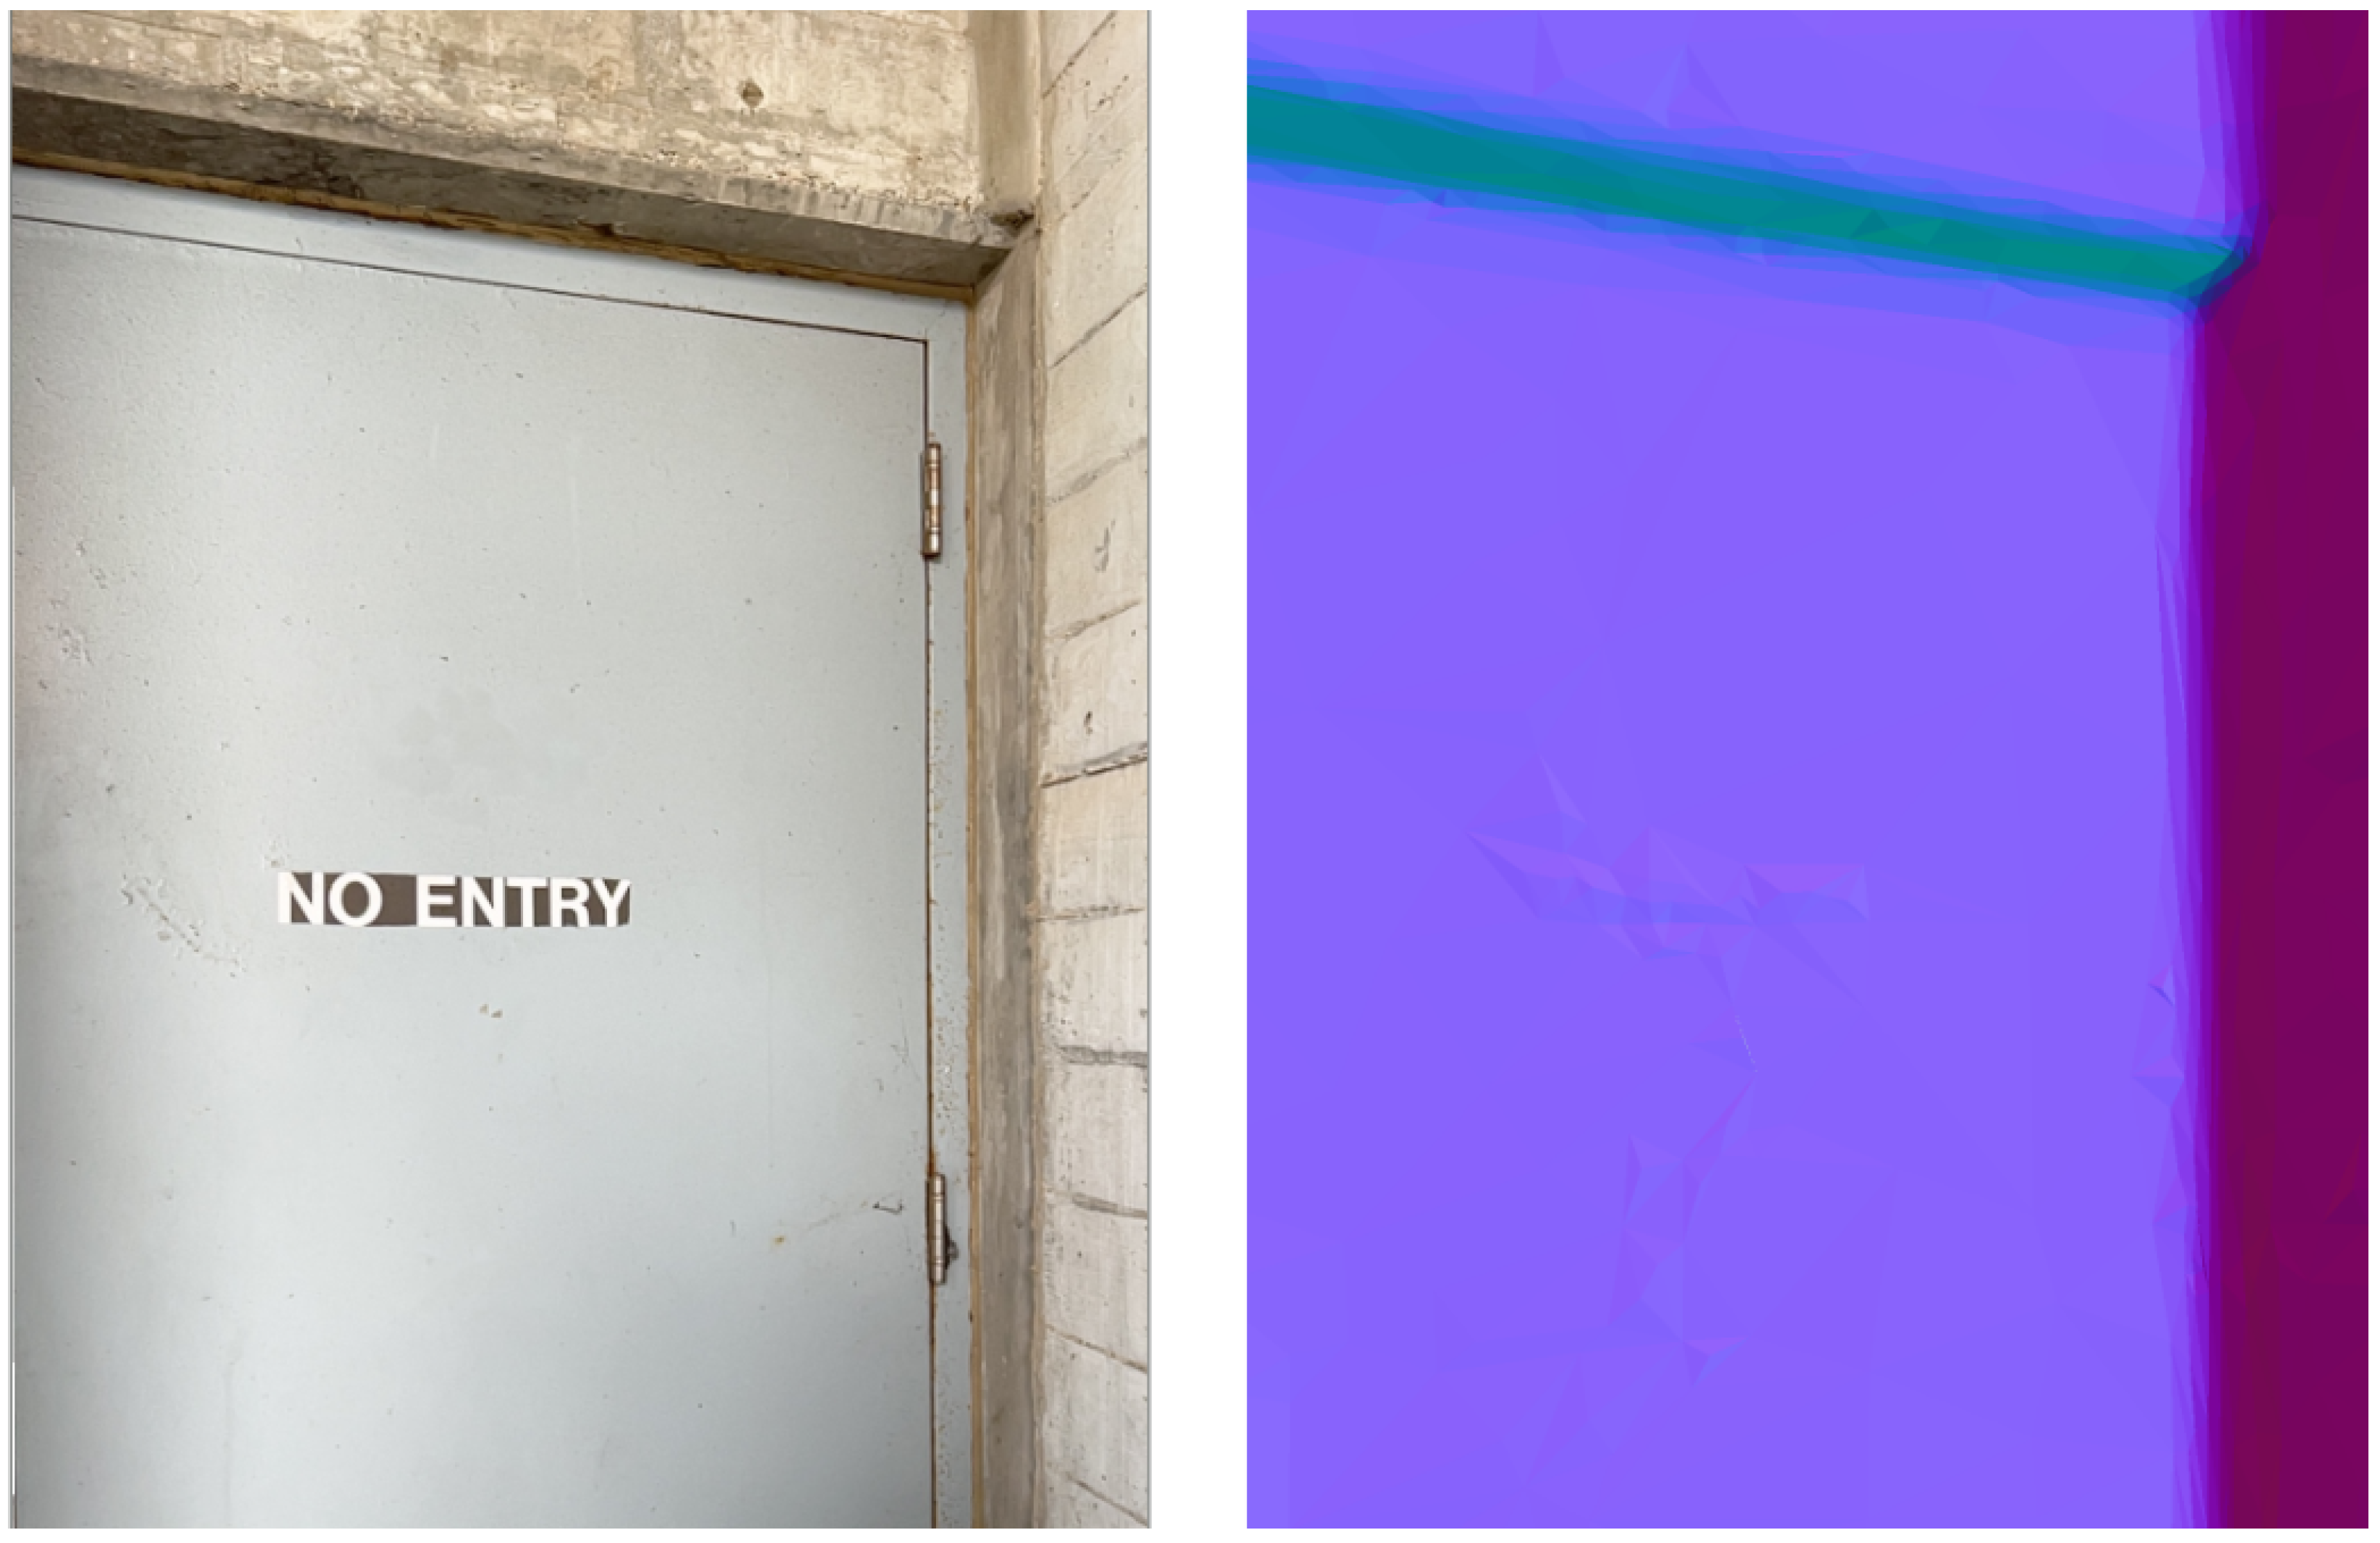
On a later date, additional 26 iPhone camera and FLIR One sets were collected, this time using the iPhone TrueDepth front camera on a fixed tripod. It was difficult to use the front camera, as the screen points away from the photographer, leaving them to operate blindly. These results were poor, and another later set was captured, this time a set of eight iPhone “wide” downscaled images and LiDAR depth maps using the Depth Camera RAW app (Version 1.1). The selective integration of depth maps resulted in a smooth surface with some artifacts over the high-contrast lettering (Figure 16).
Figure 16.
Geisel Library, colors mapped according to directionality of surface normals door image (left) and LiDAR/image-based reconstruction (right).
Tests were performed with and without the camera calibration applied to the FLIR One image TIR pairs. Without calibration there was clear misalignment of features, especially when the camera was pointed upwards, where the edges of the building met the sky, and a cold band was projected onto the building’s edge.
Pulpit in Santa Maria Novella
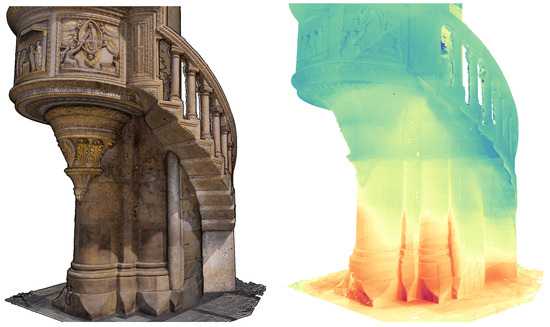
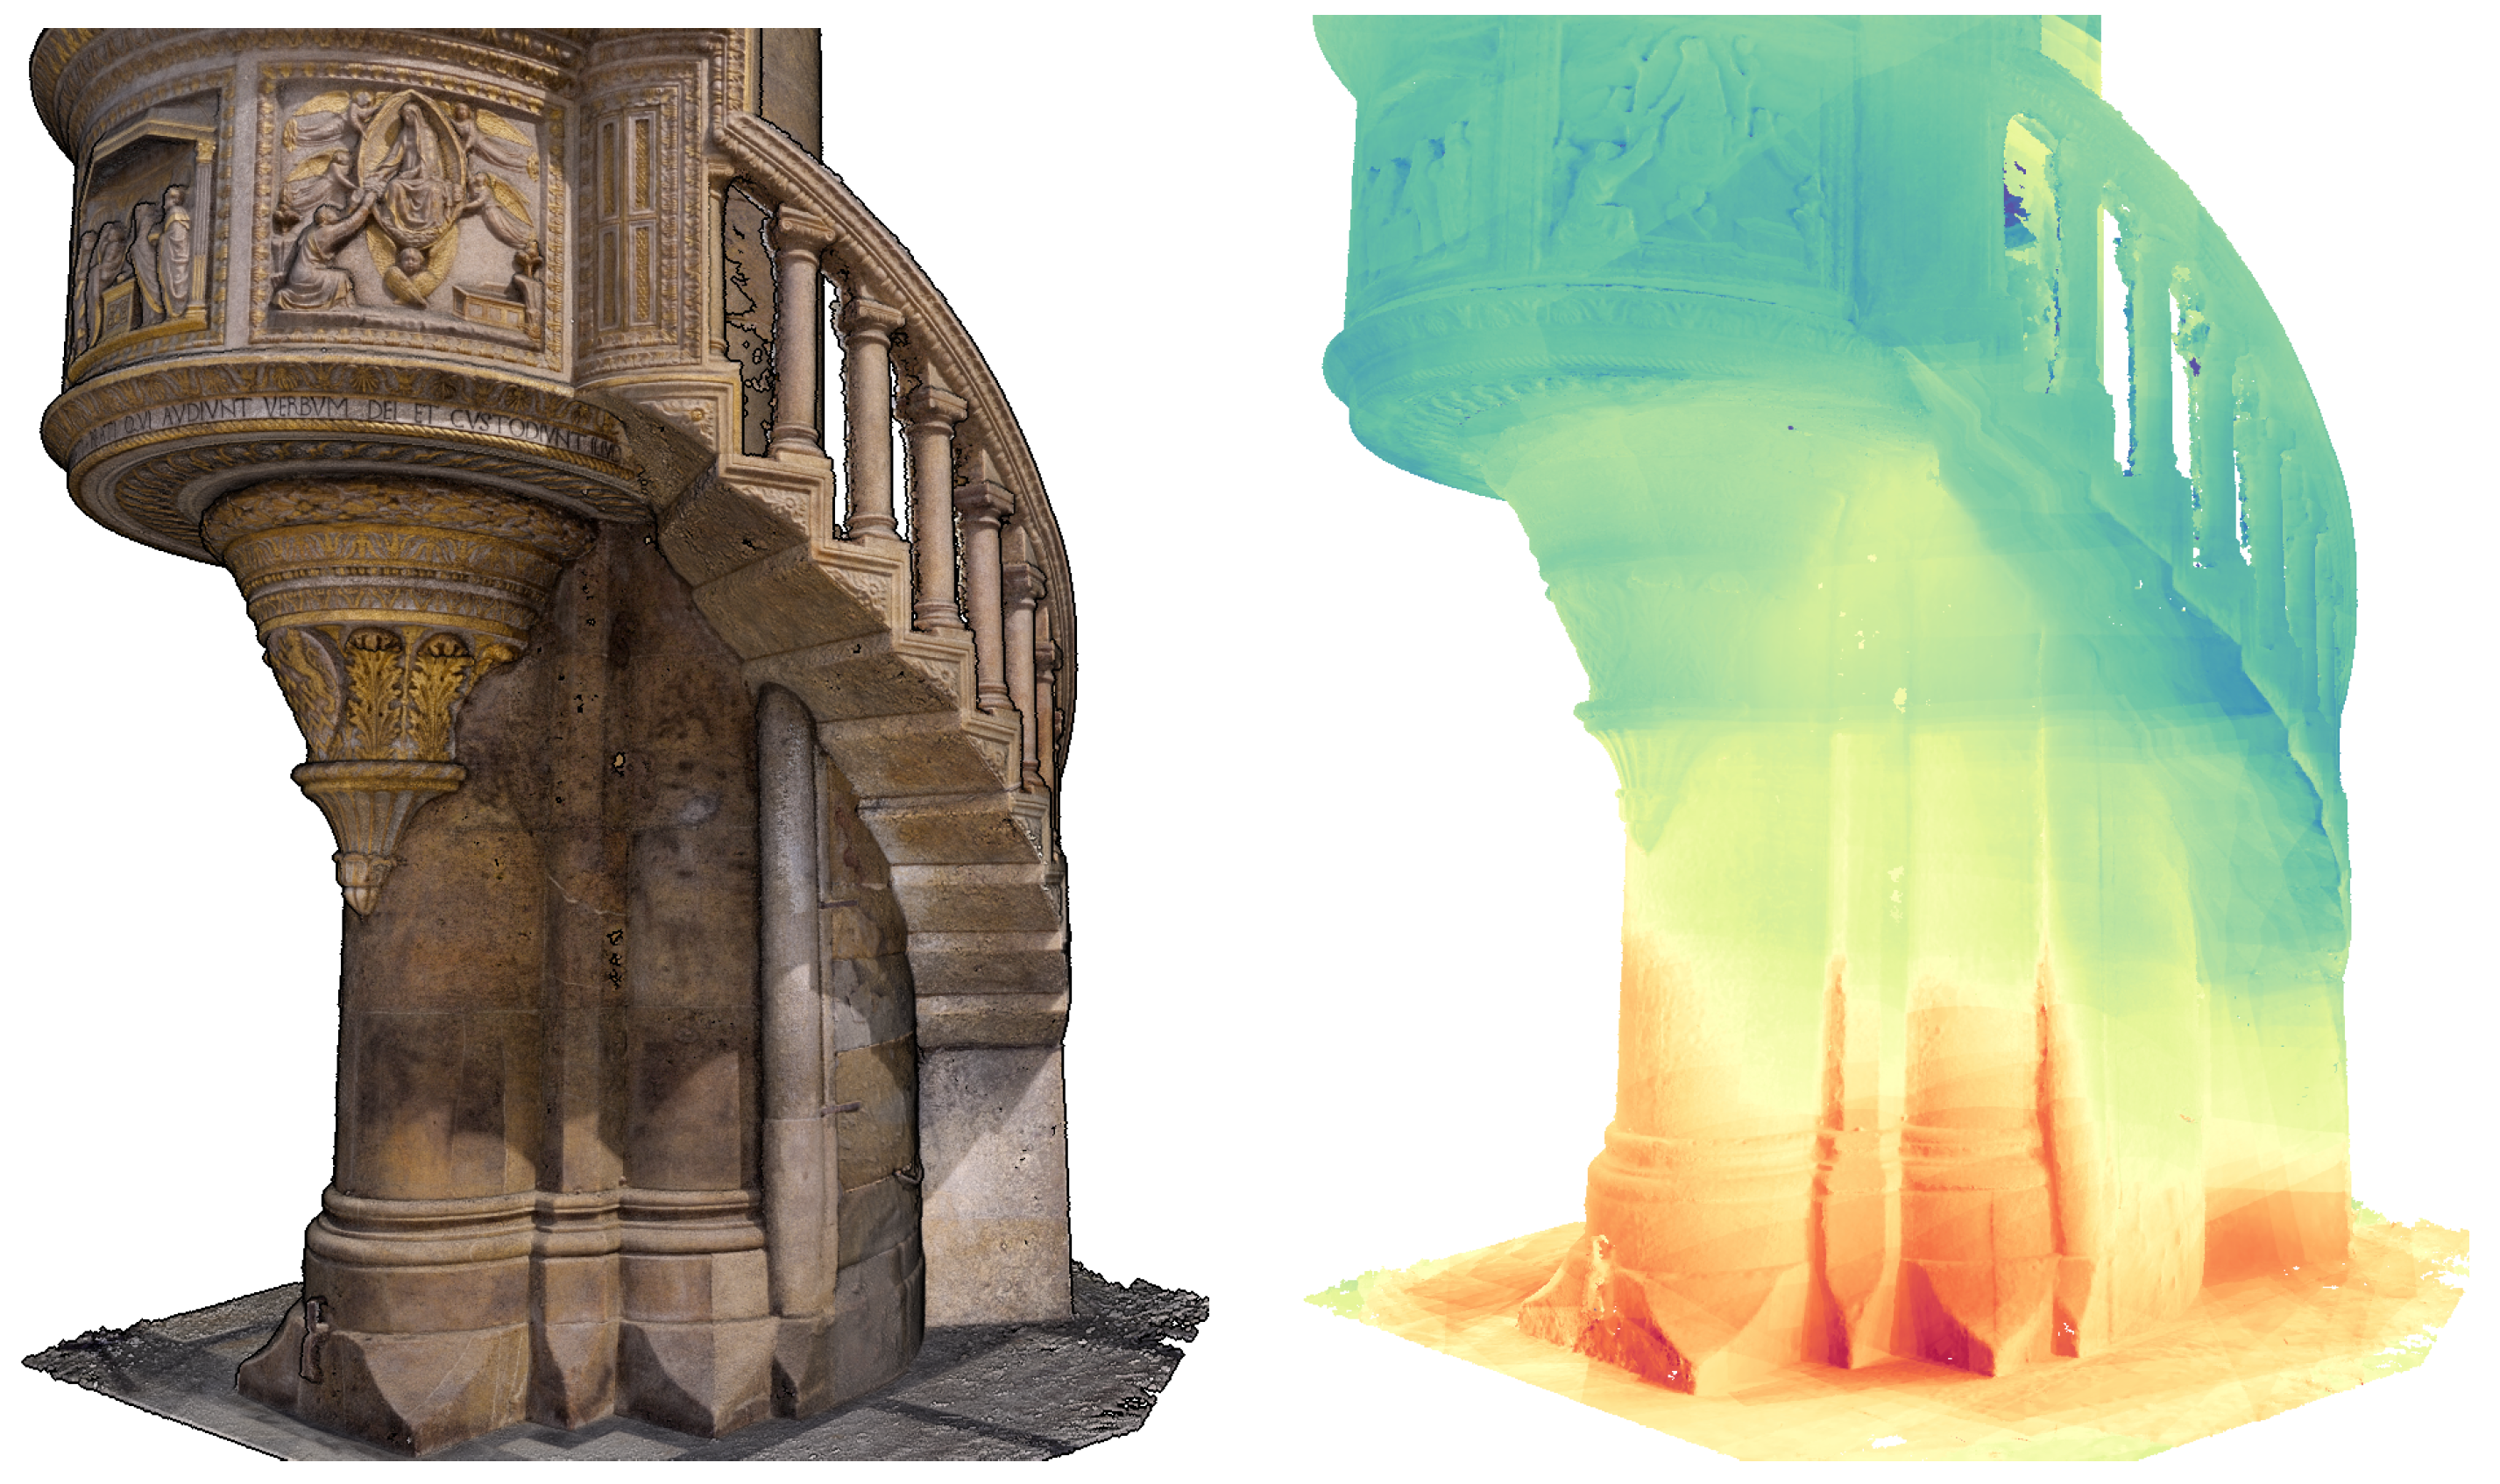
The second case study was a thermal investigation of the 15th century Brunelleschi Pulpit in the Church of Santa Maria Novella in Florence, Italy. This acquisition was more free-form, capturing thermography separately from high-quality imaging, depth, and geometry provided by other professional grade systems. Clear discoloration “leeching” on the pietra dura column supporting the wooden pulpit, and softer stone risers showing surface degradation, suggested that the feature was subject to seepage from a possible channel built beneath the church. A 3D thermographic imaging campaign was performed with 207 RGB/IR image pairs from the FLIR One captured at a distance of between 0.5 m and 1 m, 422 images from a Sony A7 R3 mirrorless camera captured in a separate acquisition pass at a distance of approximately 2–3 m, 17 terrestrial LiDAR scans from a BLK 360 G2, and 5 HD scans from an Artec Leo structured light scanner. The total height of the pulpit was 5.13 m, with a column diameter of 1.85 m. The maximum height of observations was approximately 2 m. All data are made available for online viewing and download (Appendix C).
Images from the Sony mirrorless camera were aligned with cropped images from the FLIR RGB and terrestrial LiDAR inputs. The FLIR inputs were disabled for reconstruction, and then made default for texturing (Figure 17). Though thermal features seemed to have aligned well where visible, there were several instances of clear error where the temperature from surrounding ropes and stanchions (placed to keep tourists from coming too close) were projected onto the model behind it. After masking, the errors were removed.
Figure 17.
Brunelleschi Pulpit: photogrammetry LiDAR fusion (left) thermal texture overlay with normalized relative temperature color map (right).
It is difficult to quantify the error of the TIR alignment, as heat spreads as gradients in many places, but on the sharp faces of the marble base we can see that the thermal features match the geometric features well. To compare the accuracy of positions of thermal anomalies with their corresponding visible features, a point-based analysis was performed. Though the model is imperfect, given our method it is reasonable to assume that the projected positions of known paired references should have the same accuracy as anomalies which are not represented in the visible range. Ten points were chosen, mostly around the base of the column and carved panels, where both thermal and visible features were clearly identifiable (Table 5). This method is not rigorous, and is based upon human observation and manual selection of points. This cursory analysis showed an average 3D distance of 2.77 mm. We expected our error to fall somewhere between 3.3–6.5 mm, within the GSD ranges of 0.5 m and 1 m (Table 2).
Table 5.
Manual comparison of thermal anomalies with analogous RGB features.
5. Discussion
There seems to be great potential in the incremental application of iPhone LiDAR depth maps within a photogrammetric network to enable reconstruction of features which are otherwise poorly served by either individual input. The iPhone’s LiDAR system is based on low-resolution proprietary AI-assisted pipelines which are not publicly documented [31]. They are optimized for rapid modeling, utilizing proprietary depth filtering processes which average out error from individual input frames. The individual depth maps extracted from these sensors are subject to unexplained errors, e.g., the filled tiles in the checkerboard target (Figure 5). Instead, the value LiDAR does seem to be useful in initial scaling, and in the specific circumstance where photogrammetric inputs possess enough features to align, but not enough features to reconstruct. This is a common situation when mapping built infrastructure. Big flat single-color surfaces (like blank interior walls) may contain imperfections or occasional high-contrast furnishings which enable the alignment of the images, but not the reconstruction of the surface between them. Here, the LiDAR-derived depth maps may be inserted, filling gaps with data which is not dependent upon the presence of visibly contrasting elements. Commercially available workflows apply hybrid processes coregistering and reconstructing LiDAR and photogrammetry point clouds after reconstruction [19], leaving artifacts from both processes. The results from this paper suggest the utility of a new pipeline involving the registration of both inputs at the image level, and point to a need for additional related studies in the fusion of depth frames and photogrammetry.
Another interesting potential, in the co-registration of thermography with depth, is the possibility for highly localized atmospheric corrections, changing the temperature reading based on the distance from the sensor. Usually this correction is applied globally, to an entire image, but through the inclusion of depth it can be applied for every individual pixel on the thermograph.
In comparison with prior work, the most directly analogous studies (i.e., Brea et al. [14], Yang et al. [12], and Stojcsics et al. [13]) demonstrated viable 3D thermal reconstructions using low-cost sensors but reduced radiometric data to normalized eight-bit outputs, discarding absolute temperature information in favor of relative visual representations. This normalization limits their utility for scientific analysis, as fine thermal gradients are compressed or lost depending on the temperature range of each scene. The present workflow is distinguished by the preservation of full 16-bit radiometric values throughout the processing chain, from raw sensor extraction through calibration, fusion, and final point cloud export, enabling precise, repeatable temperature queries at any point on the reconstructed surface. This distinction is particularly significant for heritage and building diagnostic applications, where subtle thermal anomalies indicative of subsurface moisture, structural discontinuities, or concealed infrastructure may fall within a fraction of a degree.
The validation presented here is preliminary, relying on visual inspection and a small set of manually selected anomaly–feature pairs, and a more rigorous quantitative assessment is warranted. A structured campaign using independent check points distributed across the object surface, with positions measured by an external reference instrument, would yield error statistics in object space that better characterize geometric accuracy. The radiometric component could be validated in parallel against contact sensors such as thermocouples or calibrated surface probes placed at known locations, enabling direct comparison between the corrected radiometric estimates and physically measured surface temperatures. A natural extension is the use of dedicated thermal control points: fiducial markers with both distinct visual features and a known, controlled thermal signature, such as small heated or cooled targets affixed at surveyed positions. Such markers would serve simultaneously as geometric check points and radiometric references, unifying both error assessments within a single framework.
Errors across the processing chain accumulate across four stages: radiometric correction, 2D registration between thermal and RGB images, photogrammetric reconstruction of surface geometry, and projection of the registered thermal texture onto that geometry. Radiometric uncertainty is dominated by assumed surface emissivity and reflected apparent temperature, which for the high-emissivity building materials surveyed limits absolute temperature error to within a few tenths of a degree without affecting the relative thermal contrast underlying anomaly detection. Registration error, as quantified in Section 3.4, contributes sub-millimeter to low-millimeter lateral displacement at typical inspection distances. Photogrammetric reconstruction error, governed by image overlap and feature density, dominates the geometric uncertainty of the final model and typically falls in the low-millimeter range. Because each stage operates in a different domain (temperature, image-plane pixels, and 3D surface geometry), the dominant contribution to any given quantity in the final model comes from the stage most directly responsible for it, rather than compounding across stages.
This methodology and sensor stack, however, includes significant limitations which exclude widescale adoption. One major drawback to a mosaic approach, in general, is the capture time and the dynamic nature of thermal environments. As many inputs must be created to cover a large space, the anomalies being captured may change between each pass. The capture distance is another major limitation. The poor resolution (256 × 192 pixels) of the iPhone LiDAR depth maps and the FLIR One thermographs (160 × 120 pixels) requires a very close operating range to extract meaningful data. These constraints limit the utility of the system to environments with low ceilings, and features which allow a close approach. Aside from the image resolution, the iPhone’s VCSEL sensor has an effective range cap at 5 m, after which measurements become unreliable.
There is a clear necessity to improve and customize processing pipelines. The current methodology, employing agisoft metashape, utilizes a depth map weighting system which inordinately favors the low-resolution direct-measurement depth maps from the LiDAR over the high-resolution derivative depth maps obtained through photogrammetry. This weighting will need to be optimized to enable the priority selection of high-quality features. Furthermore, the unexplained anomaly observed in the early checkerboard tests (Figure 5) raises serious concerns with the accuracy of the LiDAR depth maps, leaving us to trust the interpretation of an undocumented proprietary software system.
6. Conclusions
This paper presents a methodology for creating 3D radiometric thermography mosaics using low-cost mobile sensor stacks, integrating iPhone LiDAR and RGB data with FLIR One Pro thermographic imagery. The workflow demonstrates that thermographic documentation can be achieved with consumer-grade equipment through careful calibration, open-source data extraction, and multi-sensor fusion within established photogrammetric pipelines. Two case studies validated the approach, achieving thermal-to-geometric registration accuracy of within several millimeters. The open-source tools and methodologies presented enable reproducible scientific analysis while maintaining full 16-bit thermal data integrity throughout the processing chain.
Author Contributions
Conceptualization, S.M., J.K., A.T., E.L., F.K. and M.S.; methodology, S.M., J.K., A.T., E.L. and M.S.; software, S.M., J.K. and E.L.; validation, S.M., J.K., A.T. and E.L.; formal analysis, S.M. and J.K.; investigation, S.M., J.K. and M.S.; resources, S.M., J.K., A.T., N.D., M.S. and F.K.; data curation, S.M.; writing—original draft preparation, S.M., J.K. and A.T.; writing—review and editing, E.L., N.H., D.R., F.K., M.S. and N.D.; visualization, S.M., J.K. and A.T.; supervision, F.K., D.R., M.S. and N.D.; project administration, M.S. and F.K.; and funding acquisition, N.D., S.M. and F.K. All authors have read and agreed to the published version of the manuscript.
Funding
This research was funded, in part, by the US Army Corps of Engineers under research Cooperative Agreement W912HZ-17-2-0024.
Data Availability Statement
Datasets are made openly available as CC-BY-NC; their specific locations are detailed as Appendices Appendix A, Appendix B, Appendix C and Appendix D in this article.
Acknowledgments
The authors would like to thank the AlertCalifornia project, The Kinsella Innovation fund, Carol Tohsaku, Simona Macina of Editech, The Opera for Santa Maria Novella, Arch. Francesco Sgambelluri, George Bent, Dave Pfaff and the Florence as it Was project. We also give a special thanks to Aviral Agarwal for lending us a hand with the comparative image dataset in Figure 2. During the preparation of this manuscript, the authors used Claude.ai (Sonnet 4.5, Anthropic 2025) for the purposes of literature search and grammatical correction. The authors have reviewed and edited the output and take full responsibility for the content of this publication.
Conflicts of Interest
The authors declare no conflicts of interest. The funders had no role in the design of the study; in the collection, analyses, or interpretation of data; in the writing of the manuscript; or in the decision to publish the results.
Appendix A
Experimental datasets are made available for public download here: https://doi.org/10.34946/D63G6T. This dataset repository contains: (A1) dot matrix target dataset and Agisoft Metashape project files; (A2) large checkerboard test dataset and Agisoft Metashape project files.
Appendix B
The Geisel Library North Forum: Scott McAvoy, Falko Kuester, Cultural Heritage Engineering Initiative (CHEI) 2025: Geisel Library—UC San Diego Forum Level North—Photogrammetry—Terrestrial, Short Range Scanner. Distributed by Open Heritage 3D https://doi.org/10.34946/D6V01X.
Appendix C
Scott McAvoy, Maurizio Seracini, Elizaveta Dvorshchenko, Vanda Antunovic, Dominique Rissolo, Falko Kuester, Cultural Heritage Engineering Initiative (CHEI), Center of Interdisciplinary Science for Art, Architecture and Archaeology (CISA3) 2025: Brunelleschi Pulpit—Church of Santa Maria Novella, Florence—LiDAR—Terrestrial, Photogrammetry—Terrestrial, Short Range Scanner. Distributed by Open Heritage 3D https://doi.org/10.34946/D6ZP4W.
Appendix D
The script for batch extraction of a FLIR image dataset is available here: https://github.com/jklingspon/FlirBatchExtractor (accessed on 22 April 2026). This script is forked from ITVRoC’s FlirImageExtractor, available here: https://github.com/ITVRoC/FlirImageExtractor/tree/master (accessed on 22 April 2026).
References
- gsmChina. iOS Market Share 2025: Complete Analysis and Statistics, 2025. Available online: https://gsmchina.com/ios-market-share-13208/ (accessed on 6 September 2025).
- Apple Developer. Capturing Photos with Depth. Available online: https://developer.apple.com/documentation/avfoundation/additional_data_capture/capturing_photos_with_depth (accessed on 13 November 2025).
- Teppati Lose, L.; Spreafico, A.; Chiabrando, F.; Giulio Tonolo, F. Apple LiDAR Sensor for 3D Surveying: Tests and Results in the Cultural Heritage Domain. Remote Sens. 2022, 14, 4157. [Google Scholar] [CrossRef] [Scilit]
- Usamentiaga, R.; Venegas, P.; Guerediaga, J.; Vega, L.; Molleda, J.; Bulnes, F.G. Infrared thermography for temperature measurement and non-destructive testing. Sensors 2014, 14, 12305–12348. [Google Scholar] [CrossRef] [Scilit]
- Minkina, W.; Dudzik, S. Infrared Thermography: Errors and Uncertainties; John Wiley & Sons: Hoboken, NJ, USA, 2009. [Google Scholar]
- Hess, M.; Vanoni, D.; Petrovic, V.; Kuester, F. High-Resolution Thermal Imaging Methodology for Non-Destructive Evaluation of Historic Structures. Infrared Phys. Technol. 2015, 73, 219–225. [Google Scholar] [CrossRef] [Scilit]
- Dlesk, A.; Vach, K.; Pavelka, K. Transformations in the Photogrammetric Co-Processing of Thermal Infrared Images and RGB Images. Sensors 2021, 21, 5061. [Google Scholar] [CrossRef] [Scilit] [PubMed]
- Vidas, S.; Moghadam, P.; Bosse, M. 3D Thermal Mapping of Building Interiors Using an RGB-D and Thermal Camera. In Proceedings of the 2013 IEEE International Conference on Robotics and Automation, Karlsruhe, Germany, 6–10 May 2013; pp. 2311–2318. [Google Scholar] [CrossRef] [Scilit]
- Napolitano, R.; Hess, M.; Glisic, B. Integrating Non-Destructive Testing, Laser Scanning, and Numerical Modeling for Damage Assessment: The Room of the Elements. Heritage 2019, 2, 151–168. [Google Scholar] [CrossRef] [Scilit]
- Muzika, L.; Tesar, J.; Svantner, M.; Skala, J.; Honnerova, P. Comparison of Methods for Emissivity Influence Suppression on Thermographic Data. Buildings 2023, 13, 69. [Google Scholar] [CrossRef] [Scilit]
- Tondo, G.R.; Riley, C.; Morgenthal, G. Characterization of the iPhone LiDAR-Based Sensing System for Vibration Measurement and Modal Analysis. Sensors 2023, 23, 7832. [Google Scholar] [CrossRef] [Scilit] [PubMed]
- Yang, M.D.; Su, T.C.; Lin, H.Y. Fusion of Infrared Thermal Image and Visible Image for 3D Thermal Model Reconstruction Using Smartphone Sensors. Sensors 2018, 18, 2003. [Google Scholar] [CrossRef] [Scilit] [PubMed]
- Stojcsics, D.; Lovas, I.; Domozi, Z.; Molnar, A. High Resolution 3D Thermal Imaging Using FLIR DUO R Sensor. In Proceedings of the 2018 IEEE 22nd International Conference on Intelligent Engineering Systems (INES), Las Palmas de Gran Canaria, Spain, 21–23 June 2018; pp. 311–316. [Google Scholar] [CrossRef] [Scilit]
- Brea, A.; Garcia-Corbeira, F.J.; Tsiranidou, E.; Pelaez, G.C.; Diaz-Vilarino, L.; Martinez, J. Low-Cost Thermal Point Clouds of Indoor Environments. Int. Arch. Photogramm. Remote Sens. Spatial Inf. Sci. 2024, XLVIII-4-2024, 99–105. [Google Scholar] [CrossRef] [Scilit]
- Spreafico, A.; Chiabrando, F.; Teppati Lose, L.; Giulio Tonolo, F. The iPad Pro Built-In LiDAR Sensor: 3D Rapid Mapping Tests and Quality Assessment. Int. Arch. Photogramm. Remote Sens. Spatial Inf. Sci. 2021, XLIII-B1-2021, 63–69. [Google Scholar] [CrossRef] [Scilit]
- Teo, T.A.; Yang, C.C. Evaluating the Accuracy and Quality of an iPad Pro’s Built-In LiDAR for 3D Indoor Mapping. Dev. Built Environ. 2023, 14, 100169. [Google Scholar] [CrossRef] [Scilit]
- Tavani, S.; Billi, A.; Corradetti, A.; Mercuri, M.; Bosman, A.; Cuffaro, M.; Seers, T.; Carminati, E. Smartphone Assisted Fieldwork: Towards the Digital Transition of Geoscience Fieldwork Using LiDAR-Equipped iPhones. Earth-Sci. Rev. 2022, 227, 103969. [Google Scholar] [CrossRef] [Scilit]
- Suleymanoglu, B.; Tamimi, R.; Yilmaz, Y.; Soycan, M.; Toth, C. Road Infrastructure Mapping by Using iPhone 14 Pro: An Accuracy Assessment. Int. Arch. Photogramm. Remote Sens. Spatial Inf. Sci. 2023, XLVIII-M-1-2023, 347–353. [Google Scholar] [CrossRef] [Scilit]
- Pix4D. PIX4Dmatic 1.19: Combined LiDAR and Photogrammetry Workflow, 2025. Available online: https://www.pix4d.com/blog/pix4dmatic-fusion-lidar-photogrammetry-point-clouds (accessed on 22 November 2025).
- Shinko, Y.C.; Park, S.; Trivedi, M.M. Multiperspective Thermal IR and Video Arrays for 3D Body Tracking and Driver Activity Analysis. In Proceedings of the 2005 IEEE Computer Society Conference on Computer Vision and Pattern Recognition (CVPR’05) Workshops, San Diego, CA, USA, 21–23 September 2005; p. 3. [Google Scholar] [CrossRef] [Scilit]
- ElSheikh, A.; Abu-Nabah, B.A.; Hamdan, M.O.; Tian, G.Y. Infrared Camera Geometric Calibration: A Review and a Precise Thermal Radiation Checkerboard Target. Sensors 2023, 23, 3479. [Google Scholar] [CrossRef] [Scilit] [PubMed]
- Laguela, S.; Gonzalez-Jorge, H.; Armesto, J.; Arias, P. Calibration and Verification of Thermographic Cameras for Geometric Measurements. Infrared Phys. Technol. 2011, 54, 92–99. [Google Scholar] [CrossRef] [Scilit]
- Gschwandtner, M.; Kwitt, R.; Uhl, A.; Pree, W. Infrared Camera Calibration for Dense Depth Map Construction. In Proceedings of the 2011 IEEE Intelligent Vehicles Symposium (IV), Baden-Baden, Germany, 5–9 June 2011; pp. 857–862. [Google Scholar] [CrossRef] [Scilit]
- Usamentiaga, R.; Garcia, D.F.; Ibarra-Castanedo, C.; Maldague, X. Highly Accurate Geometric Calibration for Infrared Cameras Using Inexpensive Calibration Targets. Measurement 2017, 112, 105–116. [Google Scholar] [CrossRef] [Scilit]
- Kim, S.U.; Choi, M.Y.; Park, J.H.; Kim, W.T. Lens Distortion Calibration for Mid-Wave and Long-Wave Infrared Thermal Cameras. In Proceedings of the 6th Pan American Conference for NDT, Cartagena, Colombia, 12–14 August 2015; pp. 12–14. [Google Scholar]
- Cortesi, I.; Masiero, A.; Pfeifer, N.; Tucci, G. On the co-registration of asynchronous multi-spectral and thermal images. Int. Arch. Photogramm. Remote Sens. Spat. Inf. Sci. 2023, 48, 101–106. [Google Scholar] [CrossRef] [Scilit]
- Yole Group. iPhone 15 Pro LiDAR Module, 2025. Available online: https://www.yolegroup.com/product/report/iphone-15-pro-lidar-module/ (accessed on 22 November 2025).
- Teledyne FLIR. FLIR ONE Pro Series Datasheet. Available online: https://docs.rs-online.com/7167/0900766b81622025.pdf (accessed on 22 November 2025).
- Laan, J. TrueDepth Scanning—Accurate Small Scans with the iPhone Infrared Depth Sensor. Available online: https://labs.laan.com/casestudies/truedepth-3d-scanning-case-study/ (accessed on 23 November 2025).
- Apple Developer. AVFoundation. Available online: https://developer.apple.com/av-foundation/ (accessed on 22 November 2025).
- Apple Developer. Explore ARKit 4, 2020. Available online: https://developer.apple.com/videos/play/wwdc2020/10611/?time=1114 (accessed on 22 June 2020).
- Apple Inc. ARKit. Available online: https://developer.apple.com/augmented-reality/arkit/ (accessed on 22 November 2025).
- Kojima, I. LiDAR-Depth-Map-Capture-for-iOS: Capture Full-Resolution, 32-Bit Floating-Point Depth Maps from Your iPhone’s LiDAR Scanner. Available online: https://github.com/ioridev/LiDAR-Depth-Map-Capture-for-iOS (accessed on 22 November 2025).
- Teledyne FLIR. FLIR Thermal Studio, Version 2.0.62. Available online: https://www.flir.com/products/flir-thermal-studio-suite/ (accessed on 22 November 2025).
- ITVRoC. FlirImageExtractor: A Small Tool/Lib to Read Temperatures and Original Photos from FLIR Thermal Camera Images. Available online: https://github.com/ITVRoC/FlirImageExtractor (accessed on 22 November 2025).
- Harvey, P. ExifTool, Version 13.42. Available online: https://exiftool.org/ (accessed on 22 November 2025).
- Zhang, Z. A flexible new technique for camera calibration. IEEE Trans. Pattern Anal. Mach. Intell. 2000, 22, 1330–1334. [Google Scholar] [CrossRef] [Scilit]
- Schutz, M. Potree: Rendering Large Point Clouds in Web Browsers. Master’s Thesis, Vienna University of Technology, Vienna, Austria, October 2016. [Google Scholar]
- McAvoy, S.; Seracini, M.; Bent, G.R.; Pfaff, D.; Verdiani, G.; Mangano, D.; Carnevale, F.; Liu, G.; Rocca, E.; Rissolo, D. Data Report: Cappella Tornabuoni—Indagine Preliminare Termografica e Geometrica; Technical Report; Cultural Heritage Engineering Initiative (CHEI) at Calit2; UC San Diego: La Jolla, CA, USA, 2025. [Google Scholar]
- Anthropic. Claude (Sonnet 4.5) [Large Language Model]. Available online: https://claude.ai (accessed on 22 November 2025).

Disclaimer/Publisher’s Note: The statements, opinions and data contained in all publications are solely those of the individual author(s) and contributor(s) and not of MDPI and/or the editor(s). MDPI and/or the editor(s) disclaim responsibility for any injury to people or property resulting from any ideas, methods, instructions or products referred to in the content. |
© 2026 by the authors. Licensee MDPI, Basel, Switzerland. This article is an open access article distributed under the terms and conditions of the Creative Commons Attribution (CC BY) license.