Article

Validation of SMAP Surface Soil Moisture Using In Situ Measurements in Diverse Agroecosystems Across Texas, US


College of Agriculture, Food and Natural Resources, Prairie View A&M University, Prairie View, TX 77446, USA
*
Author to whom correspondence should be addressed.
Remote Sens. 2026, 18(7), 994; https://doi.org/10.3390/rs18070994
Submission received: 4 February 2026 / Revised: 3 March 2026 / Accepted: 23 March 2026 / Published: 25 March 2026
(This article belongs to the Special Issue Remote Sensing for Hydrological Management)

Highlights

What are the main findings?
  • SMAP captures seasonal soil-moisture patterns across Texas, with performance varying by site due to rainfall, temperature, and land cover conditions.
  • Quantile Delta Mapping and Empirical Cumulative Density Function bias correction methods substantially reduce RMSE in some stations, demonstrating the benefit of site-specific calibration.
What is the implication of the main finding?
  • It validated SMAP daily soil moisture across Texas climate zones and land covers.
  • This is an approach to validate/calibrate satellite soil moisture against in situ measurements.

Abstract

Accurate soil moisture assessment is essential for effective agricultural management in the southern US, where water availability has a significant impact on crop productivity. This study evaluates the Soil Moisture Active Passive (SMAP) Level-4 daily soil moisture product using in situ measurements from Natural Resources Conservation Service (NRCS) Soil Climate Analysis Network (SCAN) stations and the US. Climate Reference Network (USCRN) across diverse agroecosystems in Texas from 2016 to 2024. SMAP’s performance was examined across ten climate zones and six major land cover types, including urban regions, pastureland, grassland, rangeland, shrubland, and deciduous forests. Statistical metrics, including the coefficient of determination (R2), Root Mean Square Error (RMSE), Bias, and unbiased RMSE (ubRMSE) were used to evaluate the agreement between SMAP-derived and in situ soil moisture measurements. Results show that SMAP effectively captures seasonal soil moisture dynamics but exhibits spatially variable accuracy. The highest agreement was observed at Panther Junction (R2 = 0.57, RMSE = 2.29%), followed by Austin (R2 = 0.57, RMSE = 9.95%). While a weaker coefficient of determination was observed at PVAMU (R2 = 0.28, RMSE = 11.28%) and Kingsville (R2 = 0.11, RMSE = 7.33%), likely due to heterogeneity in land cover, and urbanized landscapes in these stations. Applying the quantile mapping bias correction methods significantly reduced RMSE and improved the accuracy of SMAP soil moisture data at some in situ measurement stations. The results highlight the importance of station-specific calibration and the integration of satellite and ground-based measurements to improve soil moisture monitoring for agriculture and drought management in Texas and similar regions.

1. Introduction

Soil moisture is a critical component of hydrological, ecological, and meteorological processes, playing a vital role in separating water and energy exchange within the soil–plant–atmosphere continuum [1,2,3,4,5,6]. As a fundamental component of the Earth’s climate system, soil moisture regulates evapotranspiration, groundwater recharge, and surface runoff [7,8], and significantly influences weather patterns and climate variability [9,10,11]. Since 2010, soil moisture has been classified as an Essential Climate Variable (ECV) by the Global Climate Observing System (GCOS) [12,13] due to its fundamental role in linking the water and carbon cycles, regulating plant growth and biological processes, and controlling the partitioning of latent and sensible heat fluxes [2,14,15]. It is a critical component of Earth’s system stability, governing ecohydrological processes, regulating land–atmosphere energy exchange, and sustaining water and carbon cycling essential for climate resilience and biodiversity [16]. Its importance spans a wide range of applications, including improving weather and climate models, forecasting crop yields, managing irrigation, and monitoring extreme events such as droughts and floods [3,17,18,19,20]. Moreover, soil moisture conditions affect greenhouse gas (GHG) fluxes, particularly CO2, CH4, and N2O, making it a critical parameter for assessing land–atmosphere carbon exchange [2,21].
Despite its importance, accurate monitoring of soil moisture at a global scale remains a challenge. Traditional in situ measurement methods, while reliable, are limited by cost, spatial coverage, and accessibility, especially in remote or diverse terrains [22]. Gravimetric and other manual methods lack temporal high resolution, and deploying dense sensor networks at scale is impractical. To overcome these limitations, satellite-based remote sensing has emerged as a powerful tool to provide near-global, frequent observations of soil moisture [4,23,24,25,26,27,28]. Passive microwave sensors, particularly those operating at L-band frequencies (1.4 GHz), offer greater sensitivity to soil moisture and improved accuracy in vegetated areas [29]. To meet the global demand for soil moisture data, ESA launched the Soil Moisture and Ocean Salinity (SMOS) satellite in 2009, followed by NASA’s Soil Moisture Active Passive (SMAP) mission in 2015 [30]. SMAP, with its L-band radiometer, provides global surface soil moisture estimates at low/coarse spatial and high temporal resolutions. However, validating these satellite-derived products remains essential, particularly in heterogeneous landscapes such as agricultural regions [31,32]. Validation with in situ measurements is a widely used approach for assessing the accuracy of satellite soil moisture products [26,33,34,35]. Yet, discrepancies often arise due to differences in spatial scale: while satellite sensors average measurements over large areas, ground stations provide point-based data. Thus, evaluation efforts require dense, representative ground-based networks to effectively quantify uncertainty and bias.
Several studies have evaluated SMAP and other satellite-based soil moisture products globally and regionally, including over the Tibetan Plateau [36], continental U.S. [37], and across diverse climates in Europe [38]. However, the validation of previous studies has often been limited by narrow geographic scope, uniform land cover types, or short evaluation periods. Although SMAP products have demonstrated high performance in reproducing seasonal soil moisture trends and have met mission-level accuracy thresholds (e.g., ubRMSE ≤ 0.04 m3/m3 [38], there are studies that investigate a favorable correlation (r ≥ 0.7) between SMAP and in situ soil moisture data [3,38]. Nevertheless, site-level performance of SMAP still varies widely due to factors such as soil texture, vegetation density, and topographic complexity. Texas, located in the southern US, presents an ideal case study for validating satellite-derived soil moisture products because of its large geographic extent, diverse soils and vegetation, and pronounced climatic gradients spanning humid coastal plains to semi-arid and arid agroecosystems.
This study advances satellite soil moisture evaluation by providing a comprehensive, climate zone scale assessment of SMAP performance across different biophysical gradients in Texas, spanning humid, semi-arid, and arid regions and multiple dominant land covers. Unlike prior studies that focused on limited regions or uniform landscapes, this study investigates how soil moisture differences vary across land cover types, precipitation regimes, and temperature zones. Prior evaluations have rarely applied bias-correction techniques like quantile delta mapping, which can significantly enhance the agreement between SMAP and ground-based observations. Existing assessments are limited in duration and have rarely applied bias-correction techniques like quantile mapping, which can significantly improve agreement with ground observations. By considering different climate zones, land-cover, and bias correction techniques, this work provides both methodological and knowledge advances that improve the reliability of satellite soil moisture for hydrologic and agricultural applications. Evaluating SMAP products across different climate zones and land cover types with bias correction improves understanding of their reliability for drought monitoring and agricultural planning, particularly in data-scarce regions. Such assessments help determine where SMAP can robustly capture soil moisture variability and where uncertainties remain, enabling more confident use of its spatially and temporally continuous observations to support irrigation management, crop stress assessment, and early drought warning systems. In addition, applying bias-correction methods improves SMAP soil moisture estimates by reducing uncertainty and enhancing their reliability for drought monitoring through more robust and consistent soil moisture information.

2. Materials and Methods

2.1. Study Area

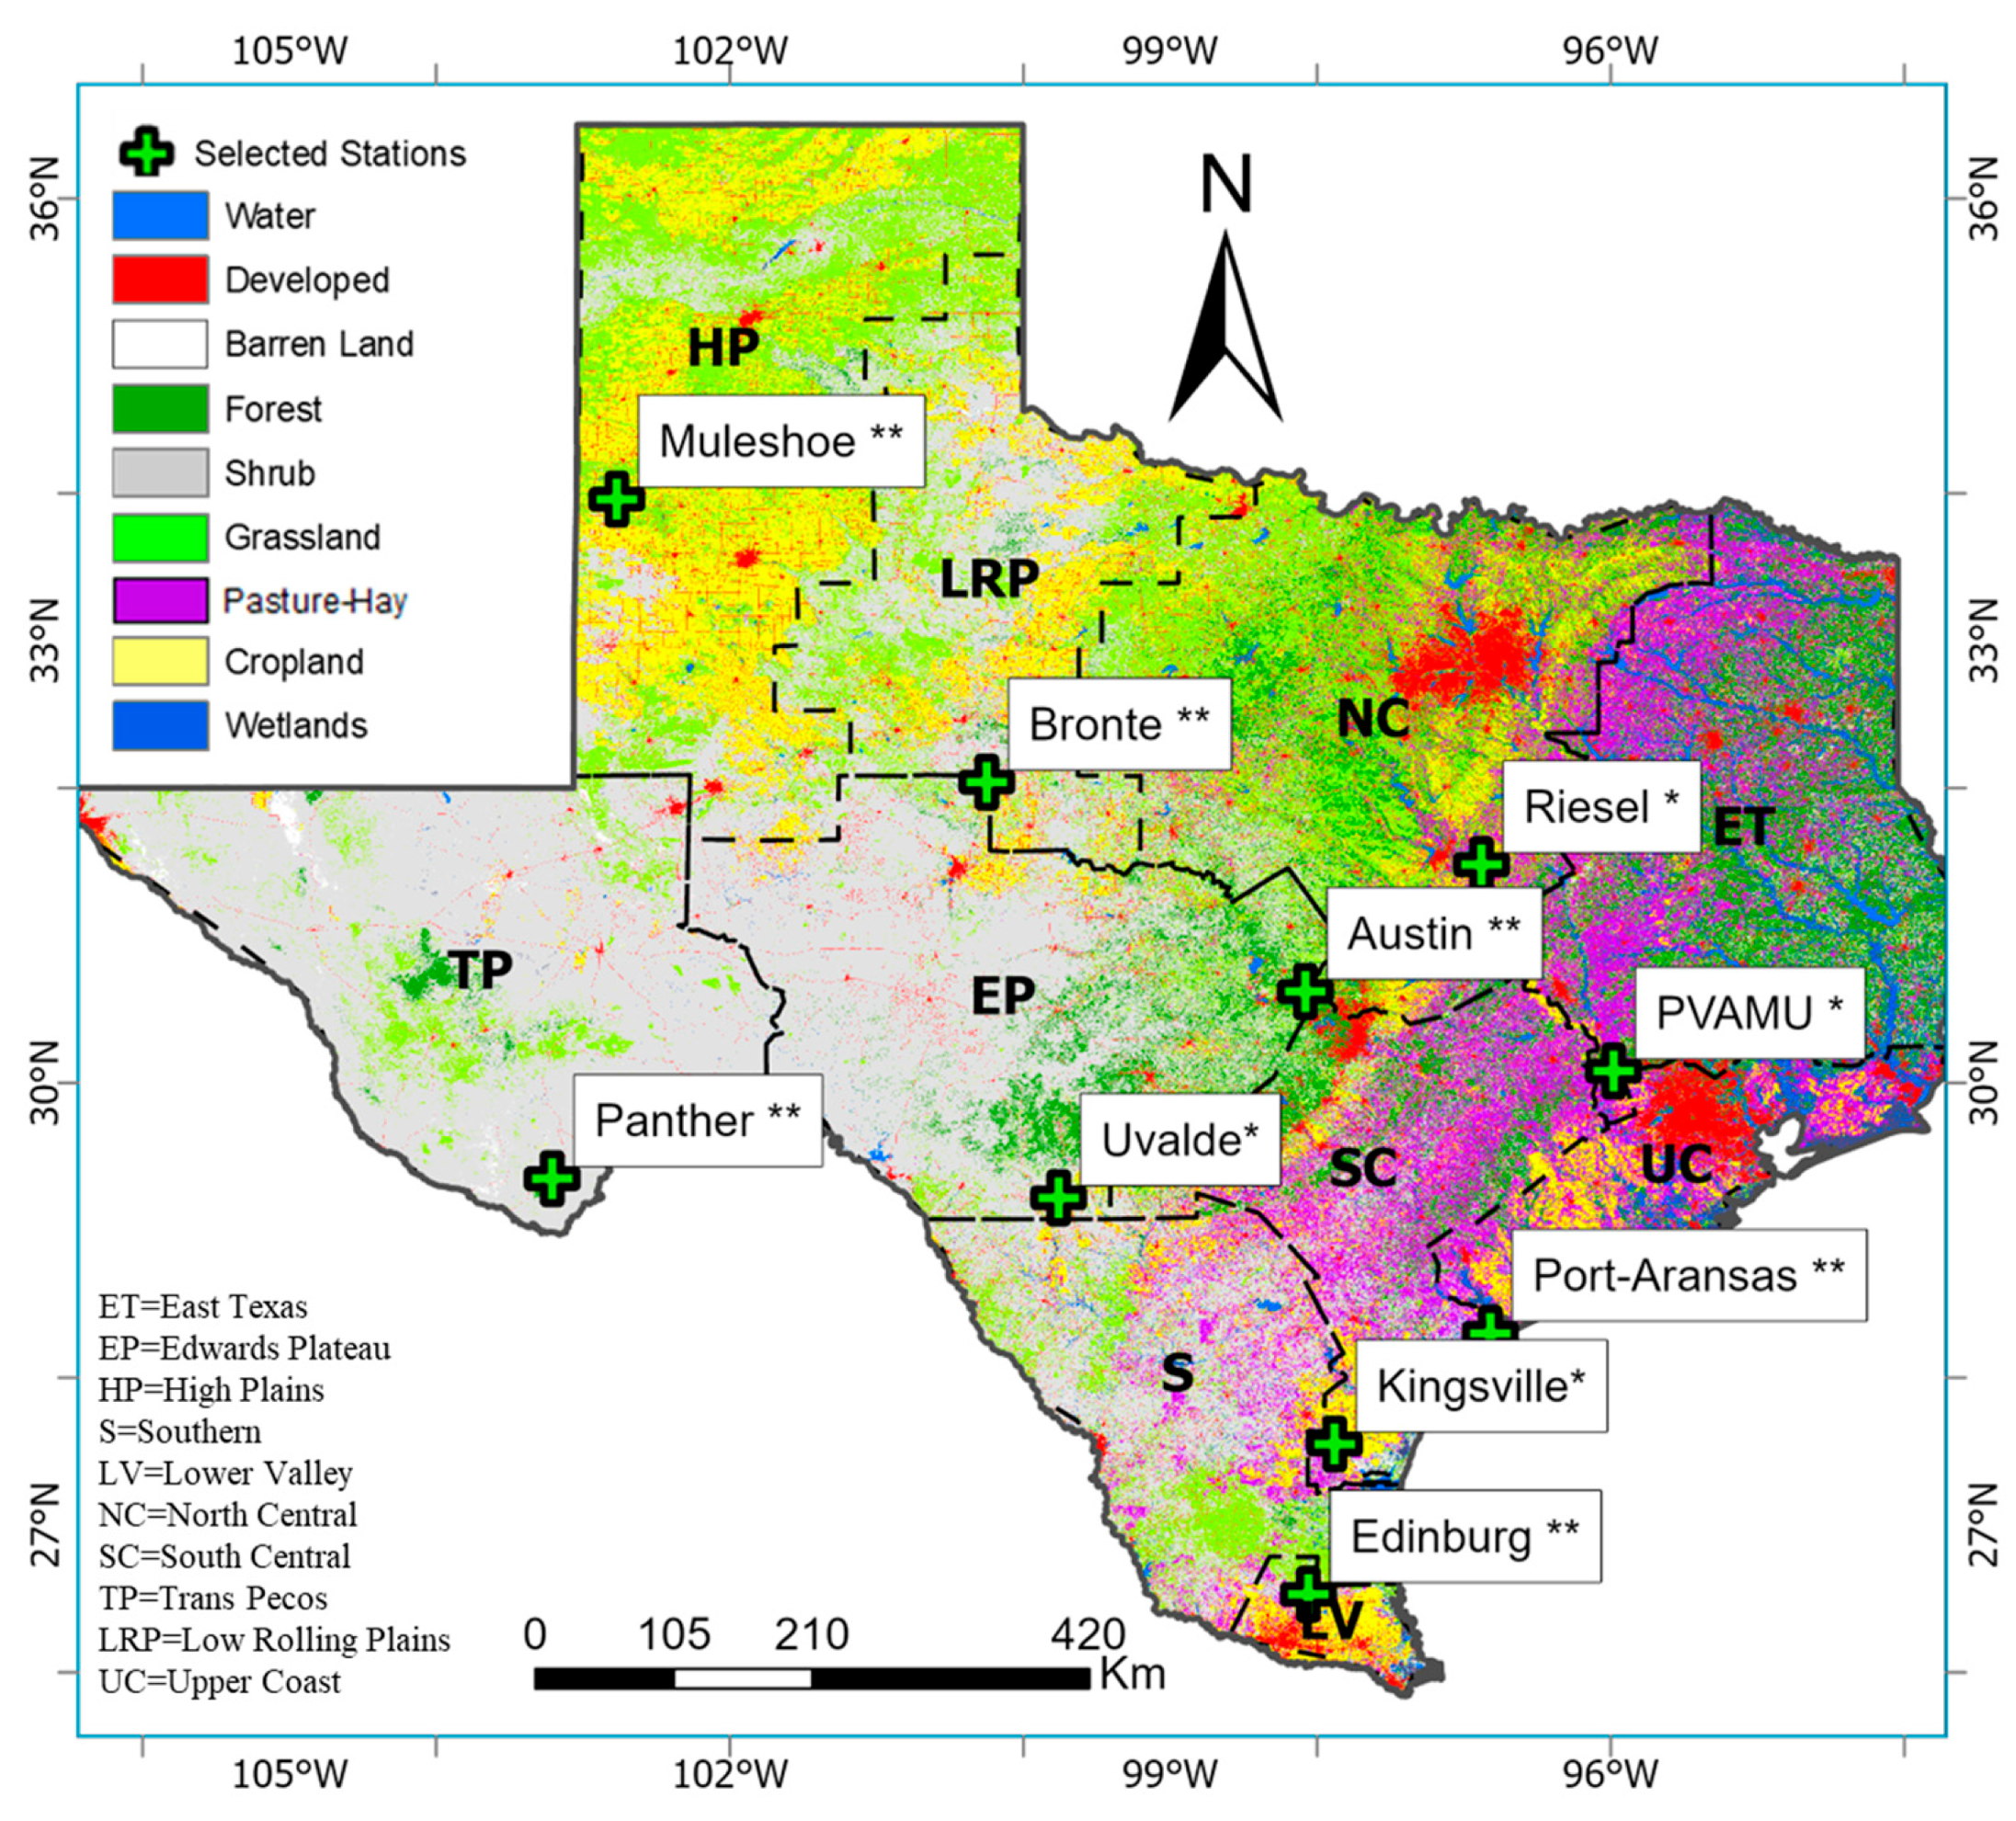
This study was conducted in Texas, located in the southern United States (Figure 1), where climate, geography, land cover, and precipitation vary widely from arid deserts in the west to humid forests in the east and from sparsely populated rural areas to dense metropolitan areas [3,39,40]. Texas has highly diverse climatic conditions, ranging from drier environments in the southwest to wetter conditions in the northeast, with ten distinct climatic regions. The state’s climate is complex, with no single dominant process controlling precipitation, resulting in strong spatial and temporal variability [3,39,40]. The ten study sites (stations) were selected to capture this broad climatic and geographic heterogeneity across Texas, ensuring representative coverage of major climatic regions, land-cover types, and precipitation gradients.
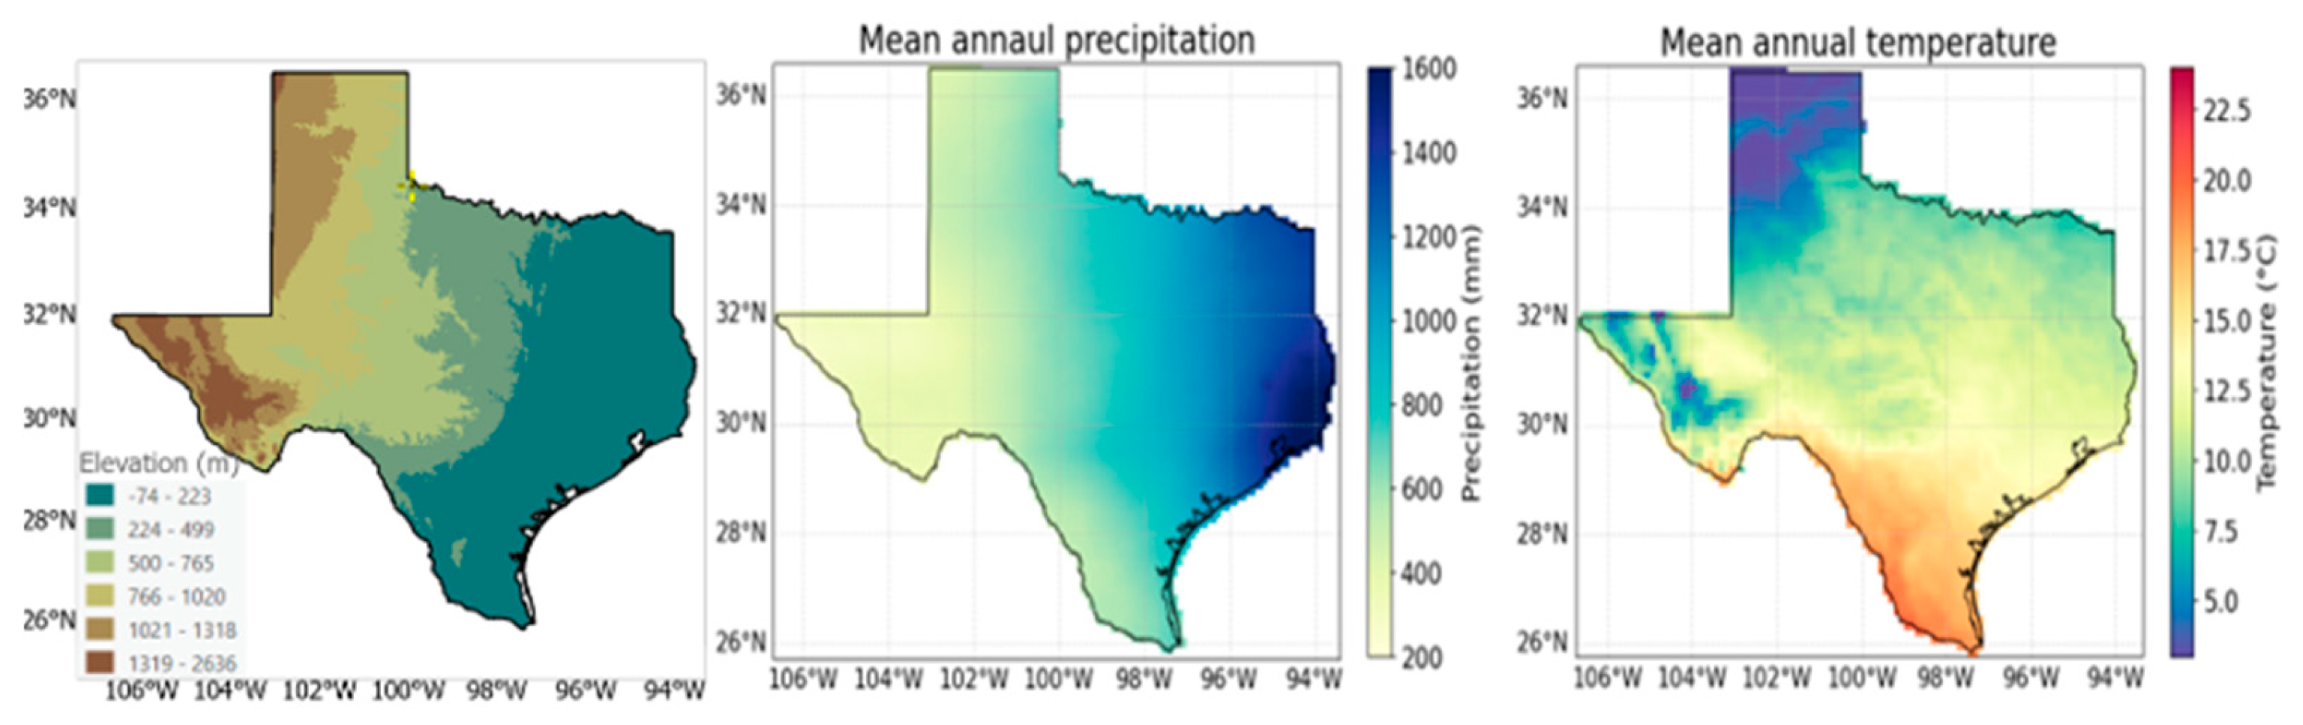
Annual precipitation in Texas varies significantly, ranging from approximately 200 mm in the west to 1600 mm in the east, with a statewide average of about 700 mm per year (Figure 2). Precipitation shows little to no spatial correlation with elevation: higher elevations are found in western Texas, while lower elevations dominate the eastern region. In contrast, temperature patterns across the state reveal that southern Texas experiences higher temperatures. These temperature variations do not align with the spatial patterns of precipitation or elevation, suggesting that other factors, particularly the north–south latitudinal gradient, which influences solar radiation, and proximity to the coast, play a more significant role in controlling the state’s temperature distribution.
The state also experiences extreme hydrological variability, including severe droughts, influenced by its diverse climate, geography, economic development, and water management practices [3,40]. The selected sites represent diverse agroecosystems, including Developed/Urban Regions at PVAMU (East Texas—ET), Pastureland at Riesel (North Central—NC), Rangeland at Kingsville (South Central—SC), Shrubland at Uvalde (Edwards Plateau—EP), Shrubland at Austin (Edwards Plateau—EP), Grassland at Bronte (Low Rolling Plains—LRP), Pastureland at Edinburg (Lower Valley—LV), Grassland at Muleshoe (High Plains—HP), Shrubland at Panther Junction (Trans-Pecos—TP), and Deciduous Forest at Port Aransas (Upper Coast—UC).

2.2. Remotely Sensed Data

SMAP Soil Moisture

NASA’s Soil Moisture Active Passive (SMAP) satellite mission, launched on 31 January 2015, aims to map global soil moisture and landscape freeze/thaw states. The primary goal of the SMAP mission was to enhance estimates of water, energy, and carbon exchanges between the land and atmosphere [17,30]. The mission aims to integrate the attributes of radar and radiometer observations, such as spatial resolution and sensitivity to soil moisture, surface roughness, and vegetation, to estimate soil moisture at a 10 km resolution and freeze–thaw state at a 1–3 km resolution. The SMAP instrument features an L-band radar and an L-band radiometer, both of which utilize a single feedhorn and a parabolic mesh reflector. The passive radiometer onboard SMAP measures naturally emitted microwave radiation at 1.4 GHz. It detects subtle variations in microwave signals resulting from moisture on the land surface [41]. The primary objectives of SMAP, shared by other soil moisture missions, include: (i) Understanding the interactions between terrestrial water, energy, and carbon cycles; (ii) Estimating global water and energy fluxes at the land surface; (iii) Quantifying net carbon flux in boreal landscapes; (iv) Improving weather, flood, and drought predictions; and (v) Supporting applications in agriculture, human health, and other sectors [42]. Many of these applications require long-term, consistent soil moisture datasets with frequent observations. The utility of the SMAP soil moisture product depends on its revisit frequency, as accurate soil moisture estimates enhance water resource management and serve as key indicators of agricultural productivity [43,44,45,46]. The soil moisture products from SMOS and SMAP missions have been extensively validated and proven valuable in agricultural and hydrological applications [18,42,47,48,49,50,51].
This study evaluated SMAP Level-4 daily soil moisture product (SPL4SMGP.008), which provides daily surface and root-zone soil moisture estimates at 9000 m (9 km) spatial resolution. In this study, the SMAP surface soil moisture product representing the top 0–5 cm of the soil profile was used for analysis. The use of Level-4 ensures consistency with the latest algorithm updates and ancillary data inputs. Specifying the product level, version, spatial resolution, and temporal frequency is essential because each SMAP product differs in processing algorithms, model integration, vegetation correction, and temporal sampling. Including these details enhances the transparency and interpretability of the evaluation, thereby strengthening its relevance for future SMAP-based applications. By comparing satellite-modeled soil moisture estimates with ground-based observations, the study aims to quantify the performance of the product under varying soil textures, vegetation conditions, and climate settings. This evaluation provides critical insights into the applicability of SMAP Level-4 soil moisture for agricultural and hydrological monitoring in semi-arid and humid agricultural landscapes.

2.3. In Situ Measurements

Various techniques have been developed to measure soil moisture using ground-based instruments. These include gravimetric methods [52,53,54], time domain reflectometry (TDR) [52,55,56], and capacitance sensors [52,57,58]. Other methods include neutron probes [52,59], electrical resistivity measurements [52,60,61], heat pulse sensors [52,62], and fiber optic sensors [52,63]. This study utilized in situ soil moisture data (measured at a depth of 5 cm) and precipitation data from the Soil Climate Analysis Network (SCAN) of the Natural Resources Conservation Service (NRCS) and the US Climate Reference Network (USCRN) to compare with satellite-derived soil moisture data. The SCAN, managed by the NRCS under the US Department of Agriculture (USDA), includes 129 observation stations across 39 states, 14 of which are in Texas [3].

2.3.1. Soil Climate Analysis Network (SCAN) Station

The Soil Moisture/Soil Temperature Pilot Project, proposed in 1990, aimed to establish a national soil–climate monitoring program to meet the needs of the global climate change community and other stakeholders [64]. Led by the USDA-NRCS, the Soil Climate Analysis Network (SCAN) is a nationwide system that supports natural resource assessments and conservation, with a focus on US agricultural areas [64]. It includes 129 stations across 39 states and Puerto Rico, providing valuable data for research and decision-making. Launched in 1999 with support from the USDA Agricultural Research Service (ARS) and the USDA World Agricultural Outlook Board, SCAN began by integrating 21 existing SM/ST stations and adding 9 more on ARS watersheds nationwide [64]. Now, SCAN primarily targets agricultural areas in the United States, with over 200 soil moisture monitoring stations across various climate regions, mainly to track drought and climate change [65]. The SCAN is set up to provide data on an hourly basis. Each SCAN station uses a dedicated datalogger and a meteor burst transceiver to enhance data collection flexibility [66].
This study used data from four SCAN stations in Texas, each representing different land cover and climate conditions. The Prairie View A&M University (PVAMU) station in East Texas represents a developed urban environment within a pastureland use type and adjacent to agricultural research fields. The Riesel station in North Central Texas is situated in a pastureland area with moderate rainfall and rolling terrain, capturing soil moisture variability in actively grazed and managed agricultural systems. The Kingsville station, located in South Central Texas, lies within a semi-arid rangeland dominated by native grasses and shrubs, offering insights into soil moisture responses under natural vegetation and minimal management. The Uvalde station, positioned in the Edwards Plateau region, is characterized by shrubland cover, shallow rocky soils, and limited precipitation, making it representative of dryland ecosystems with water constraints. Together, these four SCAN stations cover a broad spectrum of land uses and environmental conditions, providing essential in situ soil moisture data to support the validation of satellite-derived products and improve our understanding of soil moisture dynamics across diverse Texas agroecosystems.

2.3.2. US Climate Reference Network (USCRN)

The US Climate Reference Network (USCRN), established in 2004 to monitor near-surface air temperature and precipitation across the United States [67,68], began incorporating soil moisture measurements between 2009 and 2010 [24,68]. This extensive collection of long-term, high-quality surface climate data has the potential to enhance applications across various fields, including remote sensing [68,69,70,71], drought prediction [72], and flood forecasting [73]. Similar soil moisture networks in the United States include SCAN [64], the North Carolina Environmental and Climate Observing Network [74], and the Oklahoma Mesonet [75]. The first prototype USCRN station was installed at the North Carolina Arboretum near Asheville, North Carolina, during the first World Congress of Botanical Gardens in June 2000, highlighting the connection between climate measurements and their sectoral users. Following several years of development and testing, the USCRN was officially commissioned in January 2004, drawing on the experience of operating 40 pre-commissioned stations [67]. The primary objective of the USCRN is to detect climate change on a national scale by collecting consistent in situ temperature and precipitation records that are not influenced by the biases present in other observing networks [24]. The USCRN comprises 114 land-based stations, which are sparsely distributed across the continental United States. On average, there are approximately two stations per state; however, the actual number varies, with California and Texas having as many as seven and eight stations, respectively. In contrast, eight other states (Iowa, Tennessee, Wisconsin, Michigan, Indiana, Ohio, Pennsylvania, and New Hampshire) each have only one station [68].
In this study, we used six USCRN stations across diverse ecological zones of Texas (Figure 1). The Austin station in the Edwards Plateau region represents a shrubland environment with rocky terrain and shallow soils, typical of semi-arid central Texas. The Bronte station, situated in the Low Rolling Plains, captures climate and soil moisture dynamics in predominantly grassland areas used for grazing. In contrast, the Edinburg station in the Lower Rio Grande Valley represents pastureland and irrigated agriculture in a subtropical setting with relatively higher humidity and warmth. The Muleshoe station in the High Plains is situated in a semi-arid grassland and cropland environment, providing insights into soil moisture in regions that rely on groundwater from the Ogallala Aquifer. Within Big Bend National Park, the Panther Junction station, located in the Trans-Pecos region, reflects the extreme arid conditions, low precipitation, and sparse desert vegetation typical of the area. Lastly, the Port Aransas station on the Upper Coast is situated in a coastal deciduous forest zone influenced by maritime conditions, providing valuable data from a humid, storm-prone environment. Together, these stations encompass a diverse range of land cover types and climate zones, providing robust in situ data to validate satellite-based soil moisture products and deepen our understanding of soil–climate interactions across Texas. For each station, in situ soil moisture records were first quality-controlled by removing missing values and converting all observations into a consistent daily time series.
Soil moisture and precipitation trends were analyzed for 10 distinct climate zones across six major land cover types (Table 1). The selected sites represent diverse agroecosystems and soil types, enabling a comprehensive evaluation of SMAP performance across various environmental conditions. The soil moisture distributions were analyzed for Developed/Urban Regions at PVAMU (East Texas—ET), Pastureland at Riesel (North Central—NC), Rangeland at Kingsville (South Central—SC), Shrubland at Uvalde (Edwards Plateau—EP), Shrubland Cover at Austin (Edwards Plateau—EP), Grassland at Bronte (Low Rolling Plains—LRP), Pastureland at Edinburg (Lower Valley—LV), Grassland at Muleshoe (High Plains—HP), Shrubland at Panther Junction (Trans Pecos—TP), Deciduous Forest at Port Aransas (Upper Coast—UC). This classification enables a more accurate assessment of SMAP’s ability to capture soil moisture variations across different climate zones and land covers. The findings provide insights into how soil properties, elevation, and climatic conditions influence the accuracy of satellite-based soil moisture retrievals.

2.4. Statistical Bias Correction and Evaluation of the SMAP Product

To enhance the applicability of SMAP soil moisture data for agricultural and water resource management and to reduce product uncertainties, two bias correction techniques were applied: Quantile Delta Mapping (QDM) [76] and Empirical Cumulative Density Function (ECDF) [77]. QDM is a distribution-based, non-parametric method that adjusts simulated data by aligning the Cumulative Distribution Function (CDF) of the simulation with that of the CDF of observed (reference) data while preserving the change signal [78]. In this study, the QDM aligns the CDFs of the SMAP and in situ soil moisture datasets to correct systematic biases in the SMAP product. Compared with mean-based bias correction methods, QDM is advantageous because it adjusts not only the mean but also the variability, frequency, and intensity of the data, thereby improving the representativeness of soil moisture across diverse hydroclimatic conditions.
In addition to QDM, ECDF, also known as empirical or equidistant bias mapping, was applied. This method constructs empirical distributions from the calibration dataset and adjusts the validation data by mapping the quantiles of the simulated data onto the observed distribution. Unlike QDM, ECDF does not explicitly preserve deltas but effectively corrects distributional differences and non-stationary biases. However, the ECDF method is effective in correcting distributional differences and non-stationary biases, particularly under changing conditions, and has important implications for extreme soil moisture values triggered through high precipitation and droughts.
In practice, the implementation involved the following steps: (1) SMAP and in situ soil moisture values from a calibration period (2016–2018) were sorted to construct CDFs; (2) for each SMAP value in the validation period (2019–2024), its corresponding QDM and ECDF outputs in the calibration CDF was determined; (3) the observed value corresponding to that of QDM and ECDF were then mapped as the corrected value; (4) the resulting transfer function was then applied to the SMAP observations in the validation period to generate bias-corrected SMAP soil moisture estimates.
The performance of each bias correction method was evaluated using several statistical metrics: the Pearson correlation coefficient (r), Unbiased root mean squared error (ubRMSE) and Bias. RMSE quantifies differences in volumetric soil moisture magnitude, providing insight into the accuracy of absolute soil moisture estimates, ubRMSE quantifies differences in volumetric soil moisture variability after removing systematic errors, and Bias to quantify systematic over- or underestimation to evaluate the residual error after removing the mean bias. These metrics allowed for a comprehensive comparison of the raw and bias-corrected SMAP soil moisture data across different stations. To statistically compare the performance of the QDM and ECDF bias-correction methods, a paired Wilcoxon signed-rank test was applied across all stations. The test was conducted on RMSE, unbiased RMSE (ubRMSE), absolute bias (Bias), and absolute correlation (r) to assess whether the median differences between the two methods were significant. The Wilcoxon test was selected as a non-parametric alternative that does not assume normality of the performance metrics, ensuring a robust comparison of model skill between QDM and ECDF.
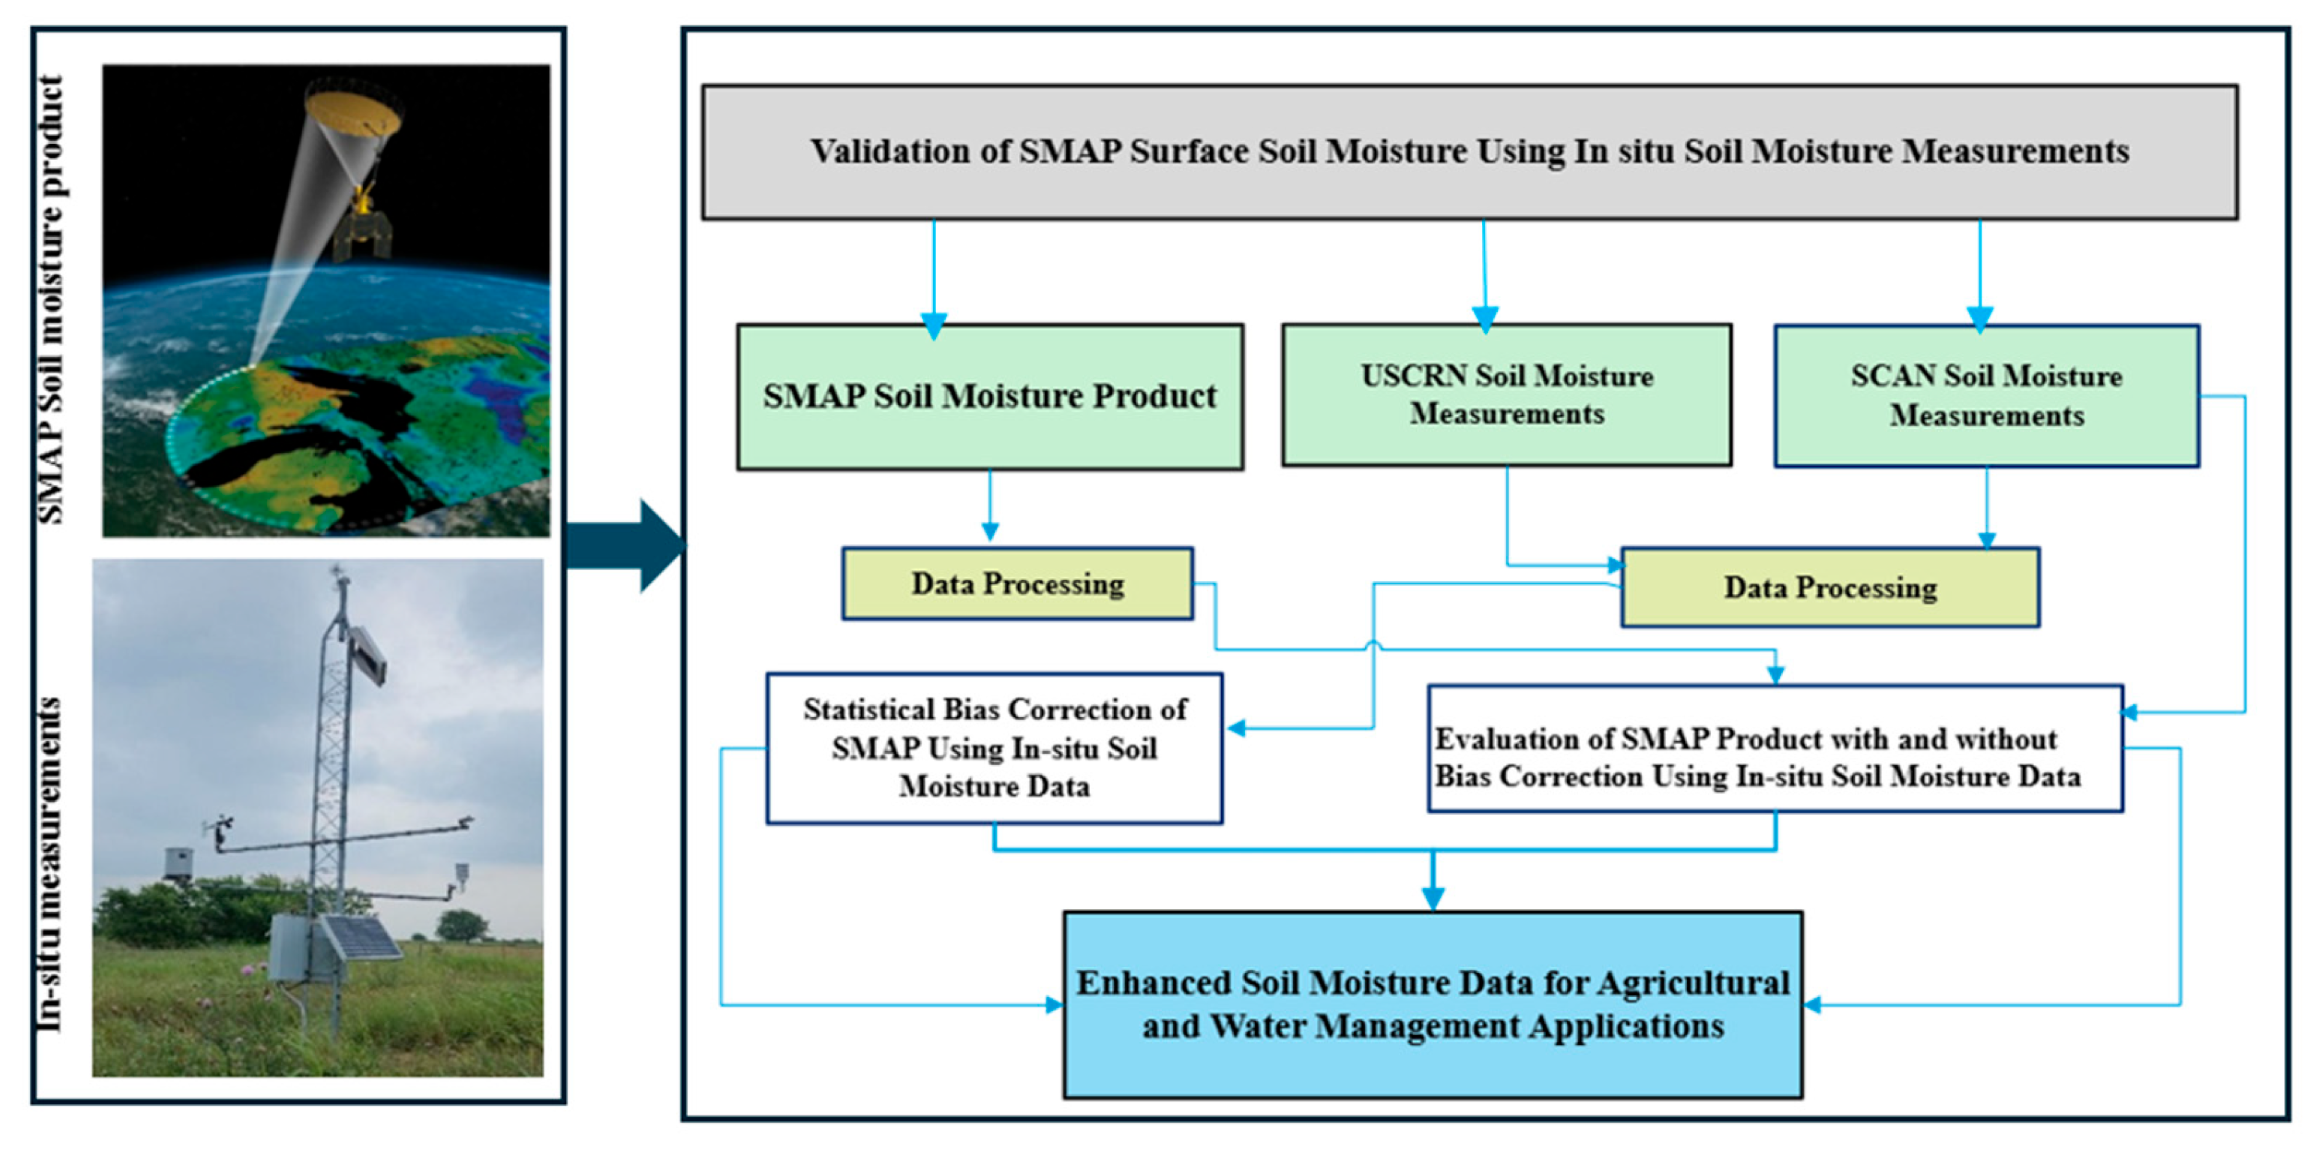
In situ soil moisture observations from US SCAN and USCRN stations served as the reference dataset for evaluating both raw and bias-corrected SMAP products. The overall study framework, including the integration of in situ and SMAP soil moisture data, and the evaluation of SMAP performance before and after bias corrections, is illustrated in Figure 3.

3. Results

3.1. In Situ Soil Moisture Measurements in Texas

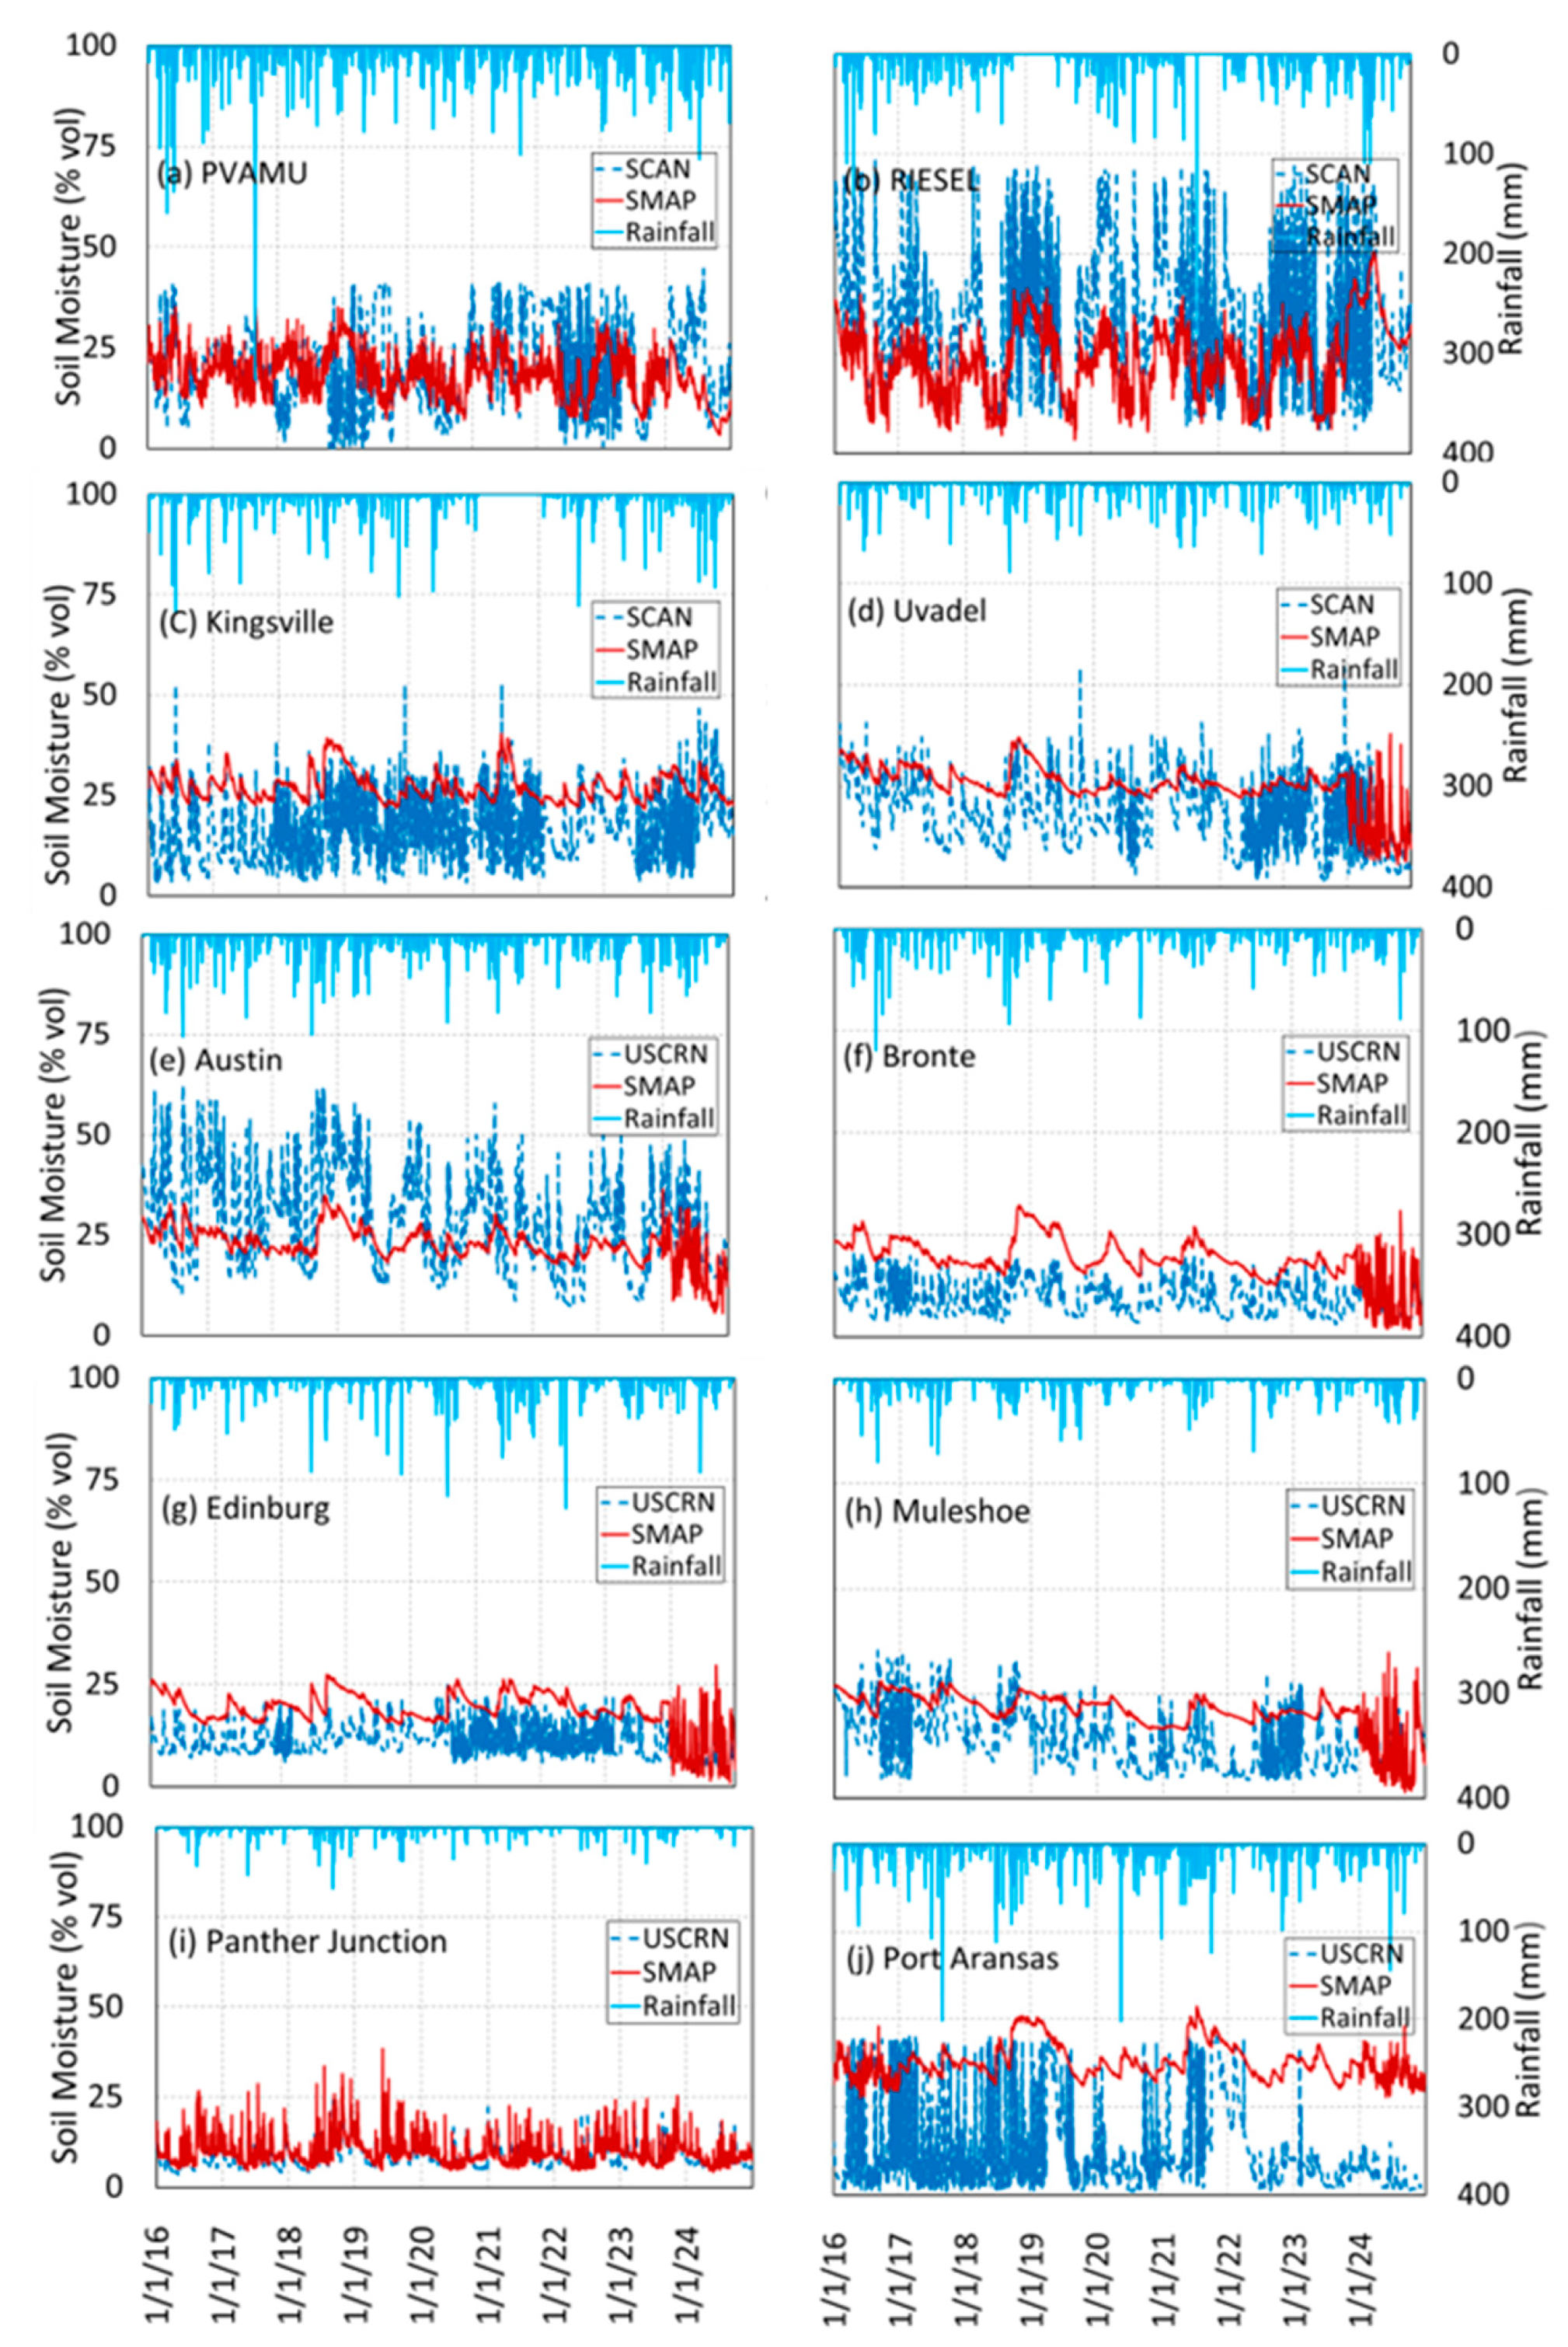
Figure 4 illustrates a time series of daily surface soil moisture observations measured using SCAN and USCRN stations located across different climate zones in Texas from 2016 to 2024. Soil moisture stations in the eastern part of Texas, such as the Riesel SCAN station, typically record higher soil moisture levels than those in the western part of Texas, such as the Panter-Junction-USCRN. This east–west soil moisture gradient is associated with rainfall distribution, which is higher in the eastern part of Texas and lower in the western part of Texas. Among the soil moisture stations, Riesel-SCAN and Austin-USCRN, located in the east and central parts of Texas, showed higher soil moisture levels than other stations in the Trans Pecos, High Plains, South Central, North Central, and other climate zones of Texas. Regarding the interannual difference, soil moisture values in 2017 and 2022 are substantially lower. These dips correspond to severe drought events during those years. The lower soil moisture in these years could be attributed to the drought that occurred during these years. The 2022 drought, particularly in the Northern and Southern High Plains of Texas, had a devastating impact, resulting in a 30% to 65% reduction in crop production [79].
Soil moisture values and time series across SCAN and USCRN stations showed clear differences, which could be attributed to stations’ surface characteristics, including land use, soil texture, and climate zone (Figure 4 and Table 1). Stations located in wetter and more humid regions of East Texas and the Upper Coast (e.g., PVAMU and Port Aransas) revealed higher soil moisture levels and lower temporal variability. This corroborates the effect of higher precipitation, greater vegetation cover, and finer-textured soils. In contrast, stations in semi-arid to arid regions such as the Edwards Plateau, Trans Pecos, High Plains, and Low Rolling Plains (e.g., Panther Junction, Uvalde, Austin, and Muleshoe) show lower soil moisture and stronger seasonal fluctuations, which could be driven by higher evapotranspiration demand, limited rainfall, coarser soils, and shrub or grassland cover. Pasture and grassland sites (e.g., Riesel, Bronte, and Edinburg) with soil texture (clay or sandy loam) tend to exhibit intermediate behavior, but moisture availability remains sensitive to precipitation variability. Overall, the observed differences in soil moisture highlight the strong control of precipitation, temperature, and land cover, emphasizing the importance of site-specific surface characteristics when interpreting and modeling in situ soil moisture observations.
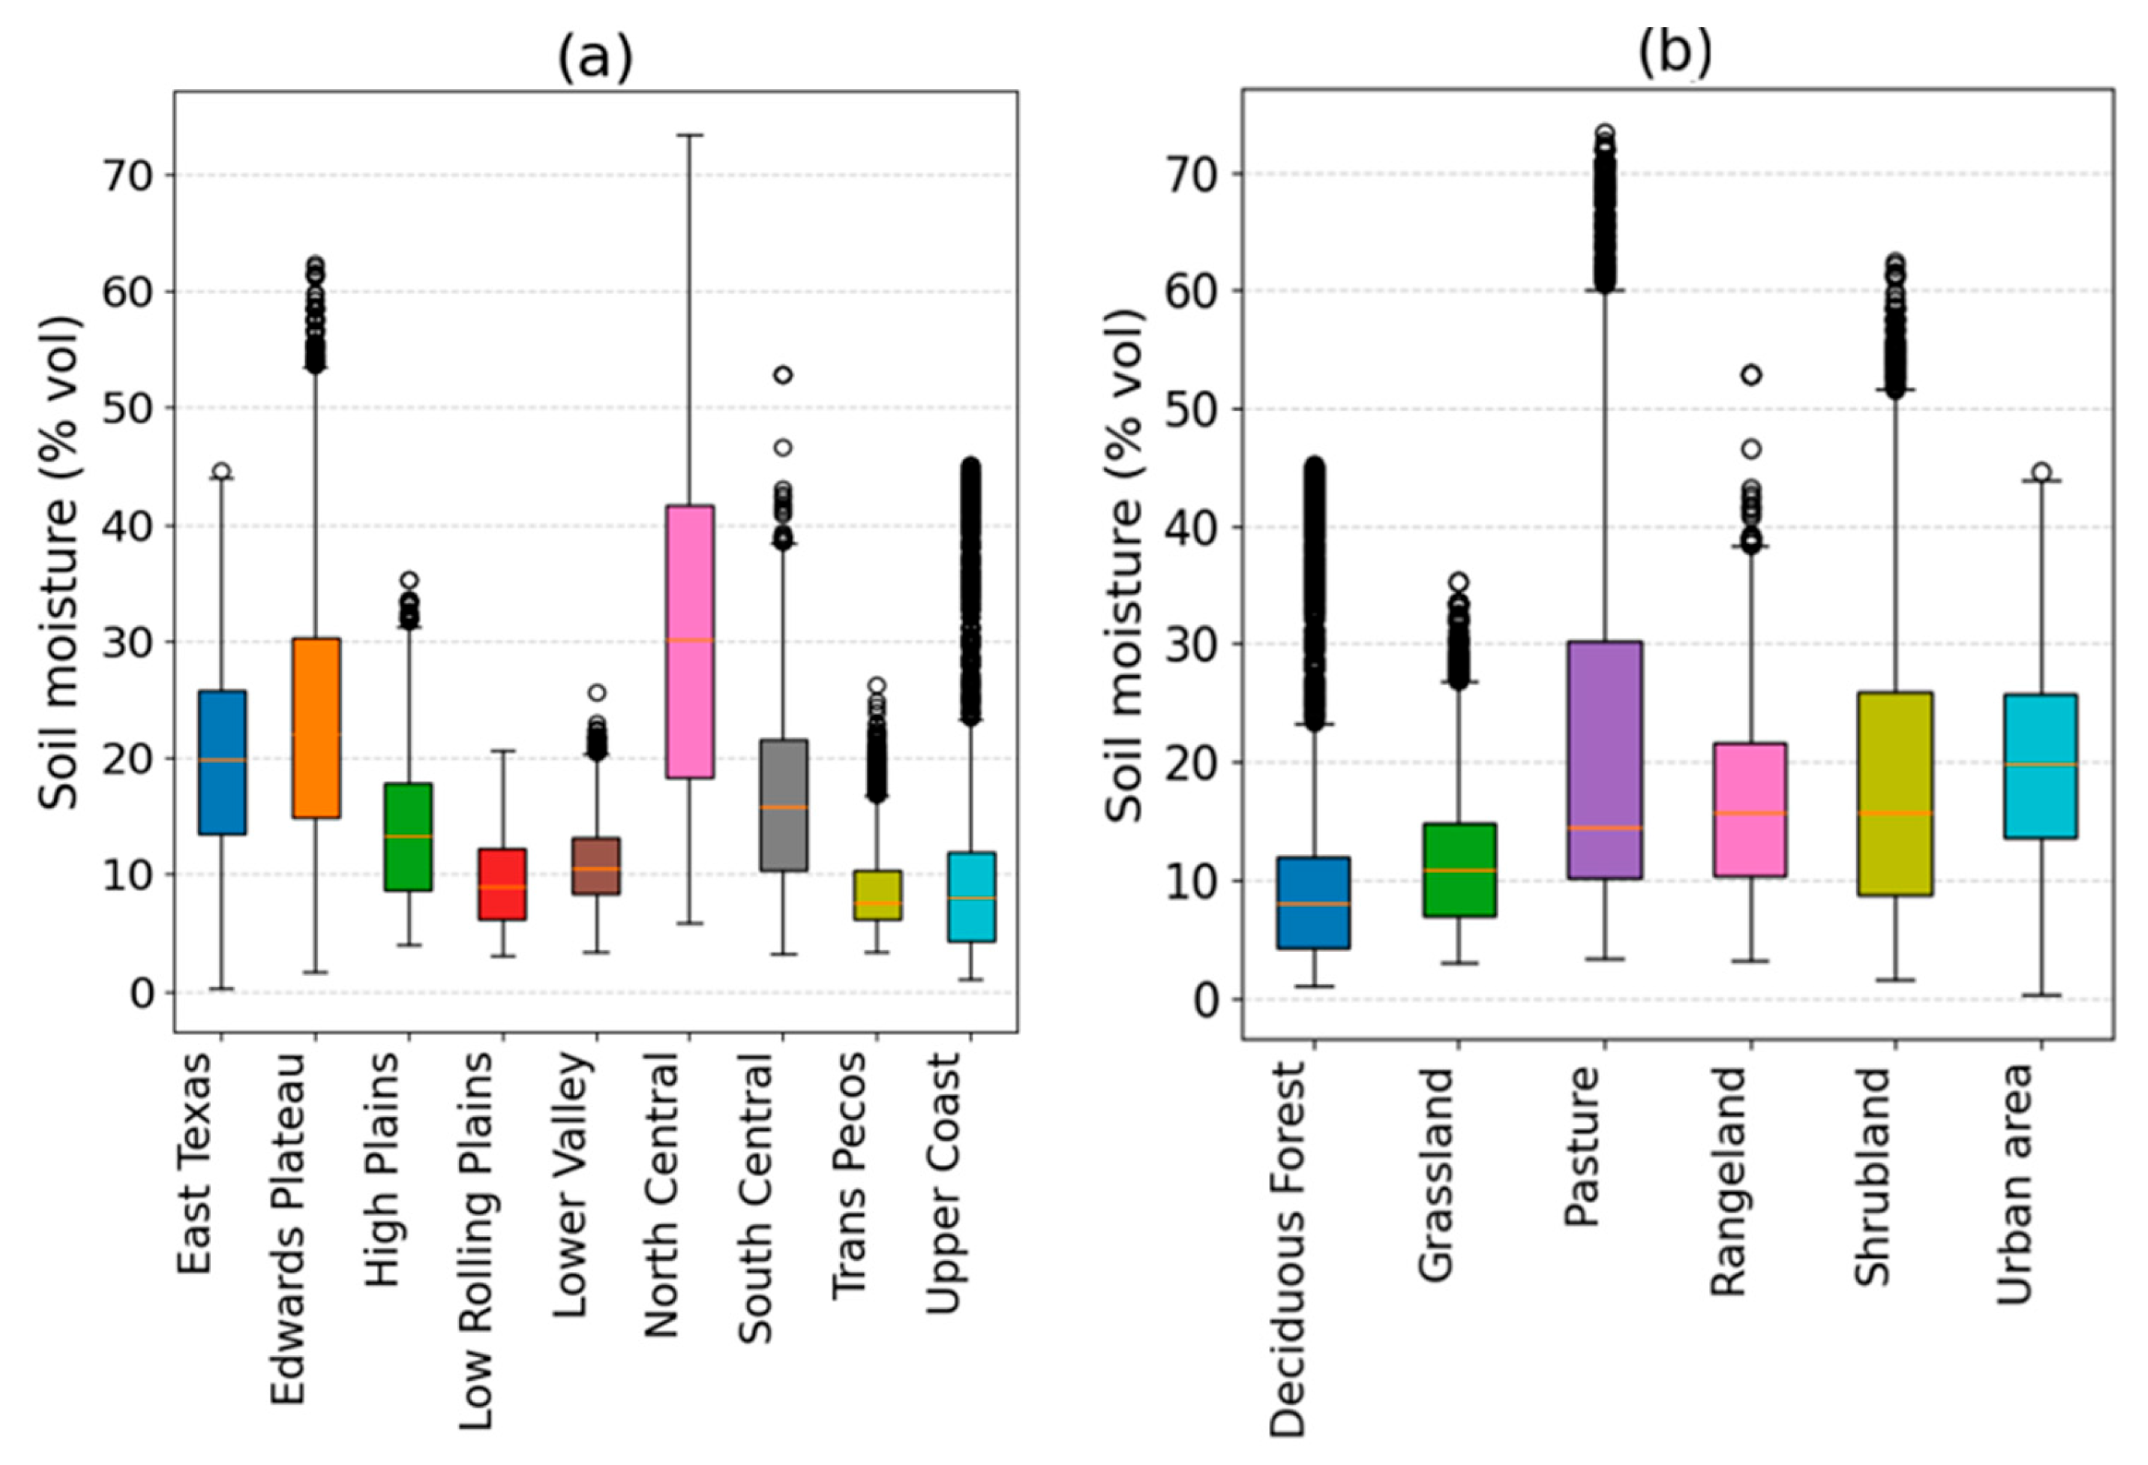
Figure 5 presents in situ soil moisture across major land-cover and climate types and reveals clear differences in mean, minimum, maximum, and interquartile values. Stations located in relatively humid and sub-humid climate regions, such as East Texas, North central Texas, and the Edwards Plateau (PVAMU, Riesel, Austin), exhibit the highest median soil moisture and the widest ranges in minimum, maximum, first quartile, and third quartile values (Figure 5). This could be associated with better precipitation, higher atmospheric humidity, and vegetation cover that reduces evaporative losses in these regions. In contrast, arid, semi-arid, and subtropical climate zones, including Trans Pecos (Panther Junction), Lower Valley (Edinburg), Low Rolling Plains (Bronte), and Upper Coast (Port-Aransas), display lower medians and wider interquartile ranges, indicating episodic wetting and rapid drying under strong evaporative demand. The High Plains (Muleshoe) and South Central (Kingsville) climate zones also show low and narrow soil moisture values and distribution, followed by arid and semi-arid climate zones.
In situ soil moisture measurements from pastureland and shrubland (Riesel, Edinburg, and Austin) land cover types showed higher maximum values and wider interquartile ranges (Figure 5b). Shrubland and Rangeland sites also tend to exhibit higher median soil moisture than other land cover types. The Urban (PVAMU) station also shows better soil moisture than other stations, even though impervious surfaces and direct runoff are expected to result in low soil moisture. While the PVAMU station is classified under an urban setting due to its proximity to built-up infrastructure, the soil moisture sensor itself is installed in a pasture field with vegetative cover and permeable soils. Therefore, the observed higher median soil moisture reflects the micro-local land cover and soil conditions at the sensor location rather than the broader urban landscape characteristics. In addition, this station is located in the East Texas climate, which is characterized by higher soil moisture than other climate zones. In situ stations from deciduous Forests and grassland land cover types reveal lower median, minimum, maximum, and interquartile soil moisture values than other stations (Figure 5b). This is attributed to the climate types (Upper Coast and High Plains), which are characterized by low soil moisture. Overall, the results demonstrate that climate types are the primary driver of soil moisture values and variability, while land cover and site characteristics play an important secondary role in determining soil moisture across Texas.

3.2. Soil Moisture Estimated Through the SMAP Satellite in Texas

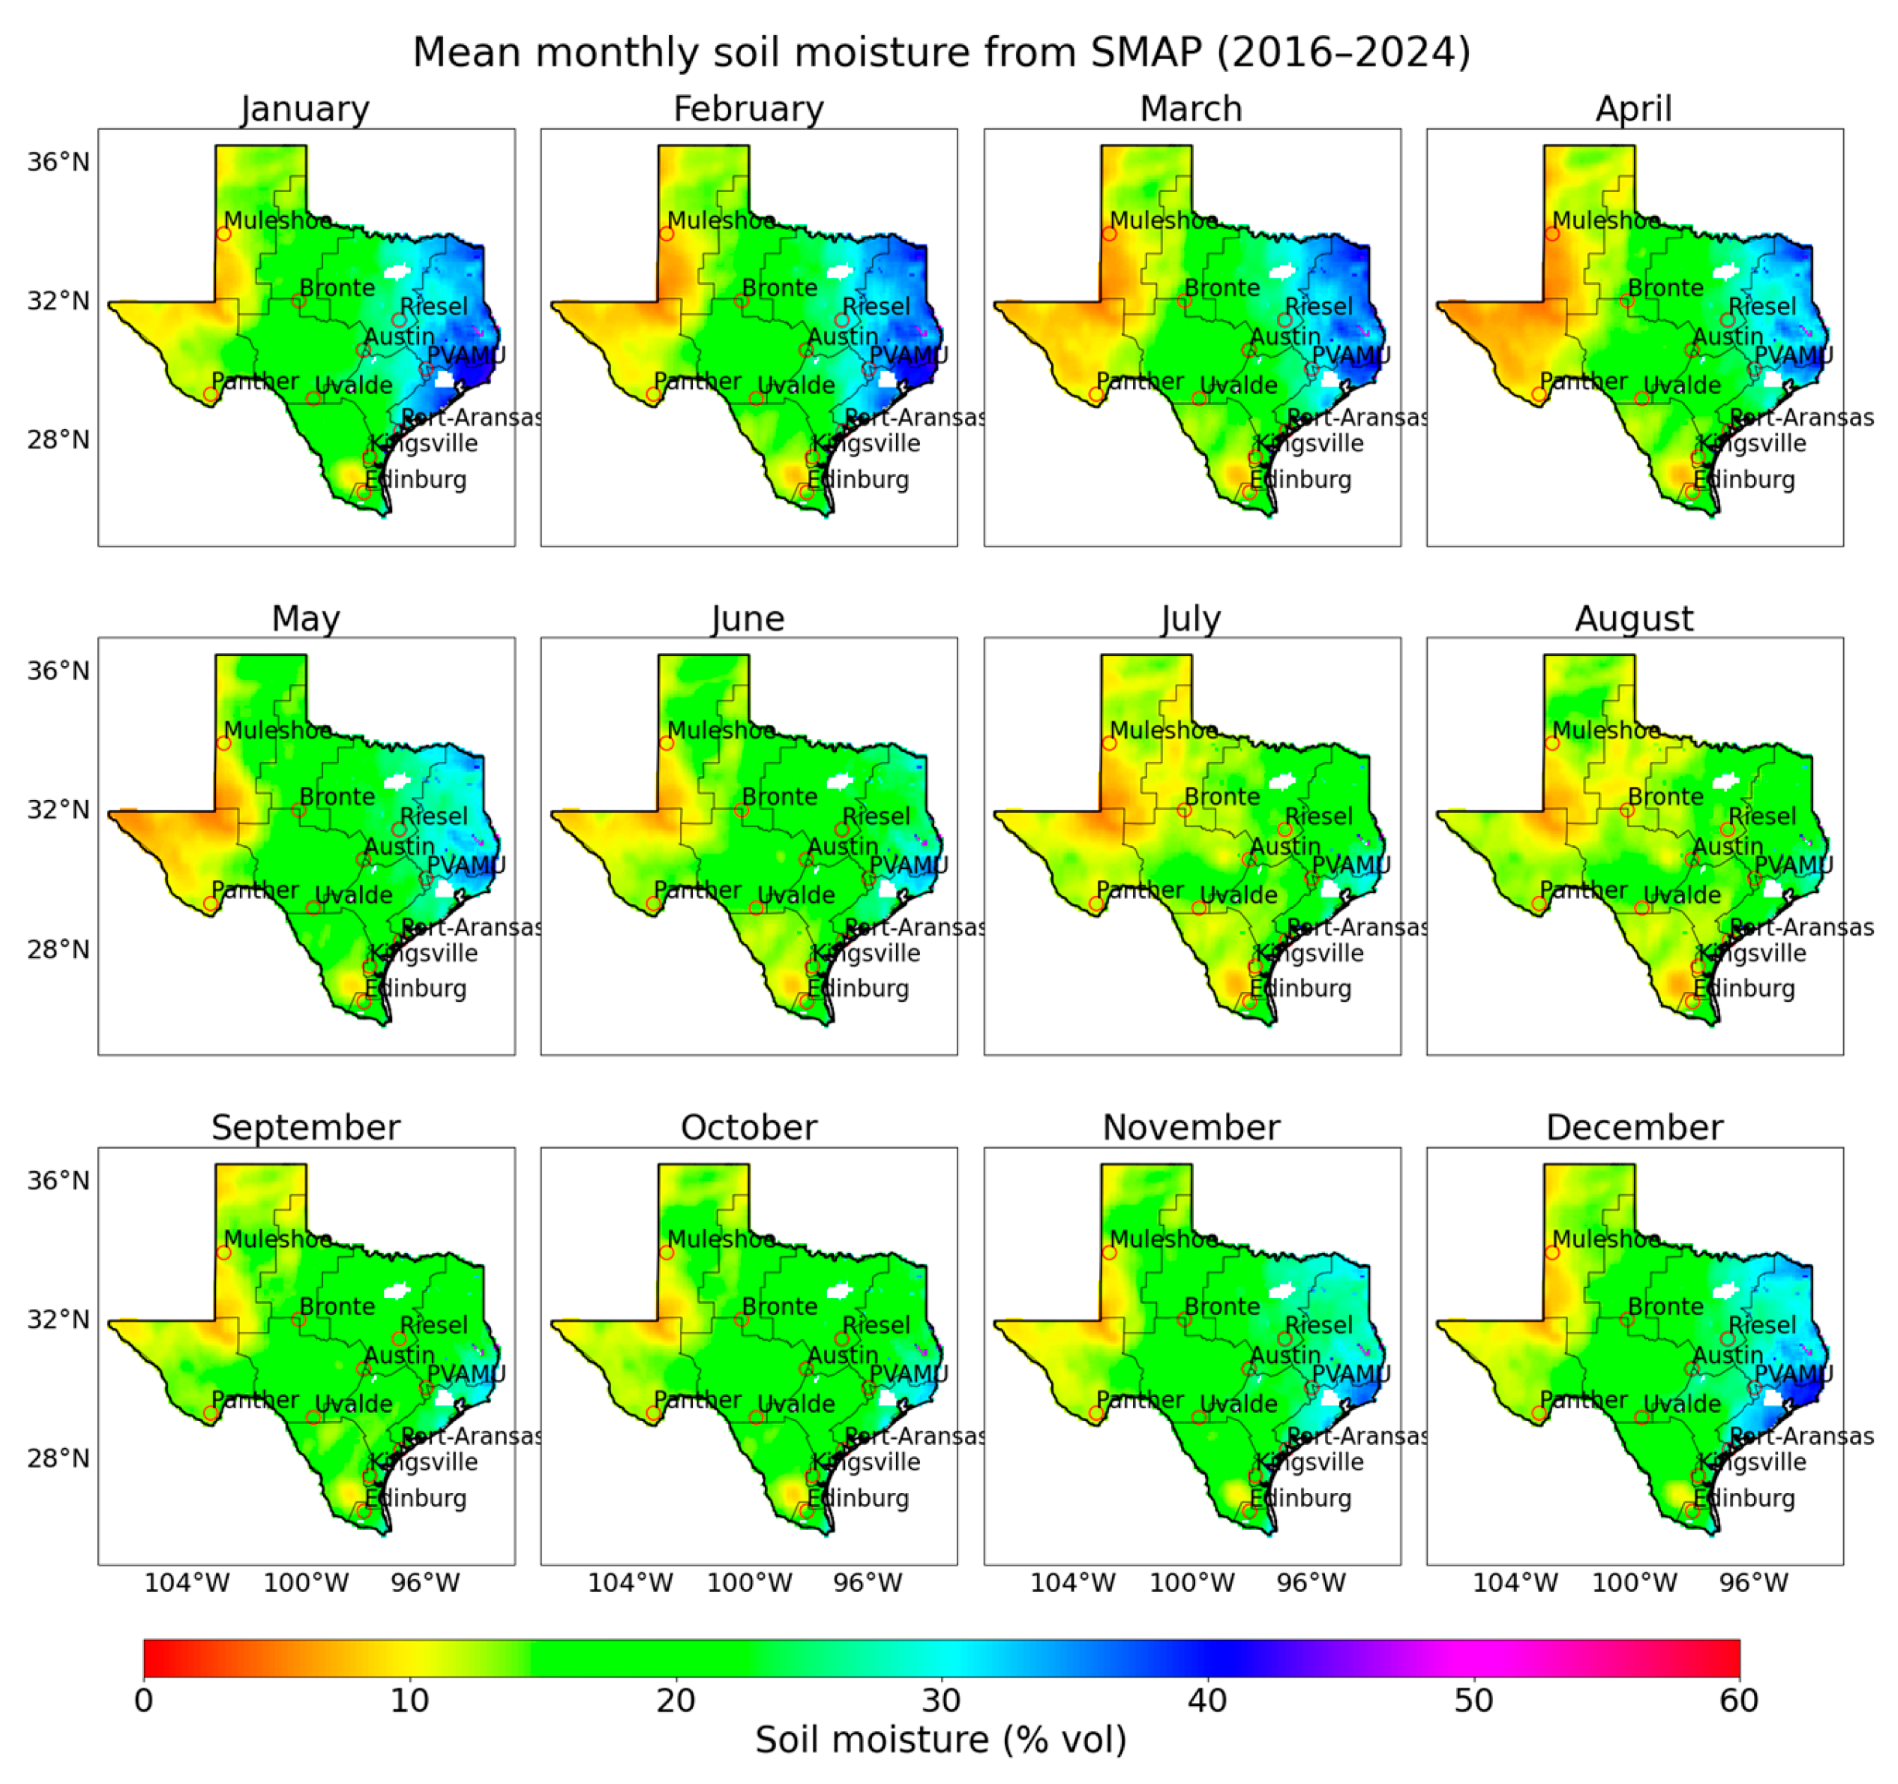
Soil moisture patterns across Texas, as estimated by the SMAP satellite, exhibit pronounced spatial and temporal variability (Figure 6). Spatially, the eastern region of Texas consistently shows higher surface soil moisture levels compared to the western region. This gradient aligns with the east–west precipitation (Figure 2) and vegetation distribution in the state, where eastern Texas receives significantly more rainfall and supports denser vegetation cover, both of which enhance soil moisture retention. Temporally, SMAP data reveal that soil moisture peaks during winter and early spring, while reaching its lowest levels during summer.
This seasonal pattern corresponds to Texas’s climate regime, characterized by reduced precipitation and elevated temperatures in summer, leading to intensified evapotranspiration and accelerated soil moisture depletion from the upper soil layers. Conversely, cooler temperatures and increased precipitation during winter reduce evaporative demand, resulting in higher soil moisture retention. These observations are consistent with the well-established influence of climatic drivers such as precipitation, air temperature, and evapotranspiration on surface soil moisture dynamics [4]. While this analysis focuses on the mean seasonal cycle, interannual variability also influences soil moisture dynamics. Texas is strongly affected by the El Niño–Southern Oscillation (ENSO), which can modulate precipitation between years [80]. Thus, the reported seasonal patterns represent climatological averages, and year-to-year deviations may occur due to large-scale climate oscillations.
Similar spatial and seasonal soil moisture patterns have been reported in prior studies using both in situ measurements and other remote sensing platforms. For example, [3,81,82] also observed higher soil moisture in eastern Texas relative to the west and elevated soil moisture during winter months. These findings reinforce the potential application of SMAP soil moisture data in capturing large-scale hydroclimatic patterns and highlight the critical role of regional climate and land surface characteristics in governing soil moisture variability.

3.3. Cross-Validation of SMAP Using In Situ Measurements

Figure 4 illustrates a time series of daily surface soil moisture observations from SMAP and in situ measurements alongside daily precipitation records at 10 locations across Texas from 2016 to 2024. This visualization enables a direct comparison of soil moisture dynamics across different agroecosystems and climatic zones while evaluating SMAP’s accuracy in capturing temporal variations in soil moisture. Precipitation and soil moisture measurements were plotted together for the respective situ stations and corresponding SMAP grid cells for an effective comparison. When selecting the in situ soil moisture stations and satellite grid points, we ensured that each land cover type was represented across multiple climatic regions to assess variability and model performance.
Table 2 presents the statistical analysis, including R2, RMSE, mean soil moisture, and standard deviations for both SMAP and in situ soil moisture datasets. The temporal analysis of soil moisture trends demonstrated that SMAP generally captures seasonal variations, with soil moisture peaks corresponding to periods of increased precipitation. However, variations in agreement between SMAP and in situ datasets were evident across locations. Sites such as Riesel, Panther Junction, and Austin exhibited relatively high agreement between SMAP and in situ data, consistent with their higher R2 values (Table 2). In contrast, PVAMU and Kingsville showed significant deviations, with SMAP consistently underestimating soil moisture levels at PVAMU and exhibiting greater fluctuations at Panther Junction, reflecting the observed low correlation. In Austin, Uvalde, and Kingsville, SMAP followed the general trends observed in situ soil moisture but failed to capture short-term fluctuations, suggesting a potential smoothing effect inherent in satellite retrievals. In contrast, at Bronte and Edinburgh, where soil moisture variability was lower, both SMAP and in situ datasets exhibited relatively stable trends, albeit with noticeable biases in magnitude. These discrepancies highlight the influence of soil type, land cover, and climate conditions on SMAP’s performance and underscore the need for additional calibration efforts to improve satellite-derived soil moisture estimates across diverse agroecosystems.
The coefficient of determination (R2) values varied significantly across the study sites, with the highest (R2) observed at Panther Junction (R2 = 0.45), followed by Riesel (R2 = 0.35), Austin (R2 = 0.33), and Uvalde (R2 = 0.27). In contrast, the lowest (R2) was observed at PVAMU (R2 = 0.04), Kingsville (R2 = 0.11), and Port Aransas (R2 = 0.19), indicating poor agreement between SMAP and in situ soil moisture data.
RMSE values ranged from 2.66 at Panther Junction to 12.75 at Riesel, reflecting variations in SMAP retrieval accuracy across different locations. The mean soil moisture values from the SMAP and in situ datasets also showed site-specific differences. SMAP tended to overestimate soil moisture in Port Aransas (SMAP = 37.83% vs. in situ at Aransas = 12.02%) while underestimating it in PVAMU (Mean SMAP = 18.03% vs. in situ = 20.24%) and Austin (Mean SMAP = 22.63% vs. in situ = 28.32%). Additionally, standard deviation values indicate that in situ soil moisture variability is generally higher than SMAP-derived values across most stations (e.g., Riesel: SMAP SD = 9.14 vs. in situ SD = 15.75), except for Bronte (SMAP SD = 5.19 vs. in situ SD = 3.84) and Panther Junction (SMAP SD = 3.95 vs. in situ SD = 3.58), where SMAP exhibited slightly higher variability.
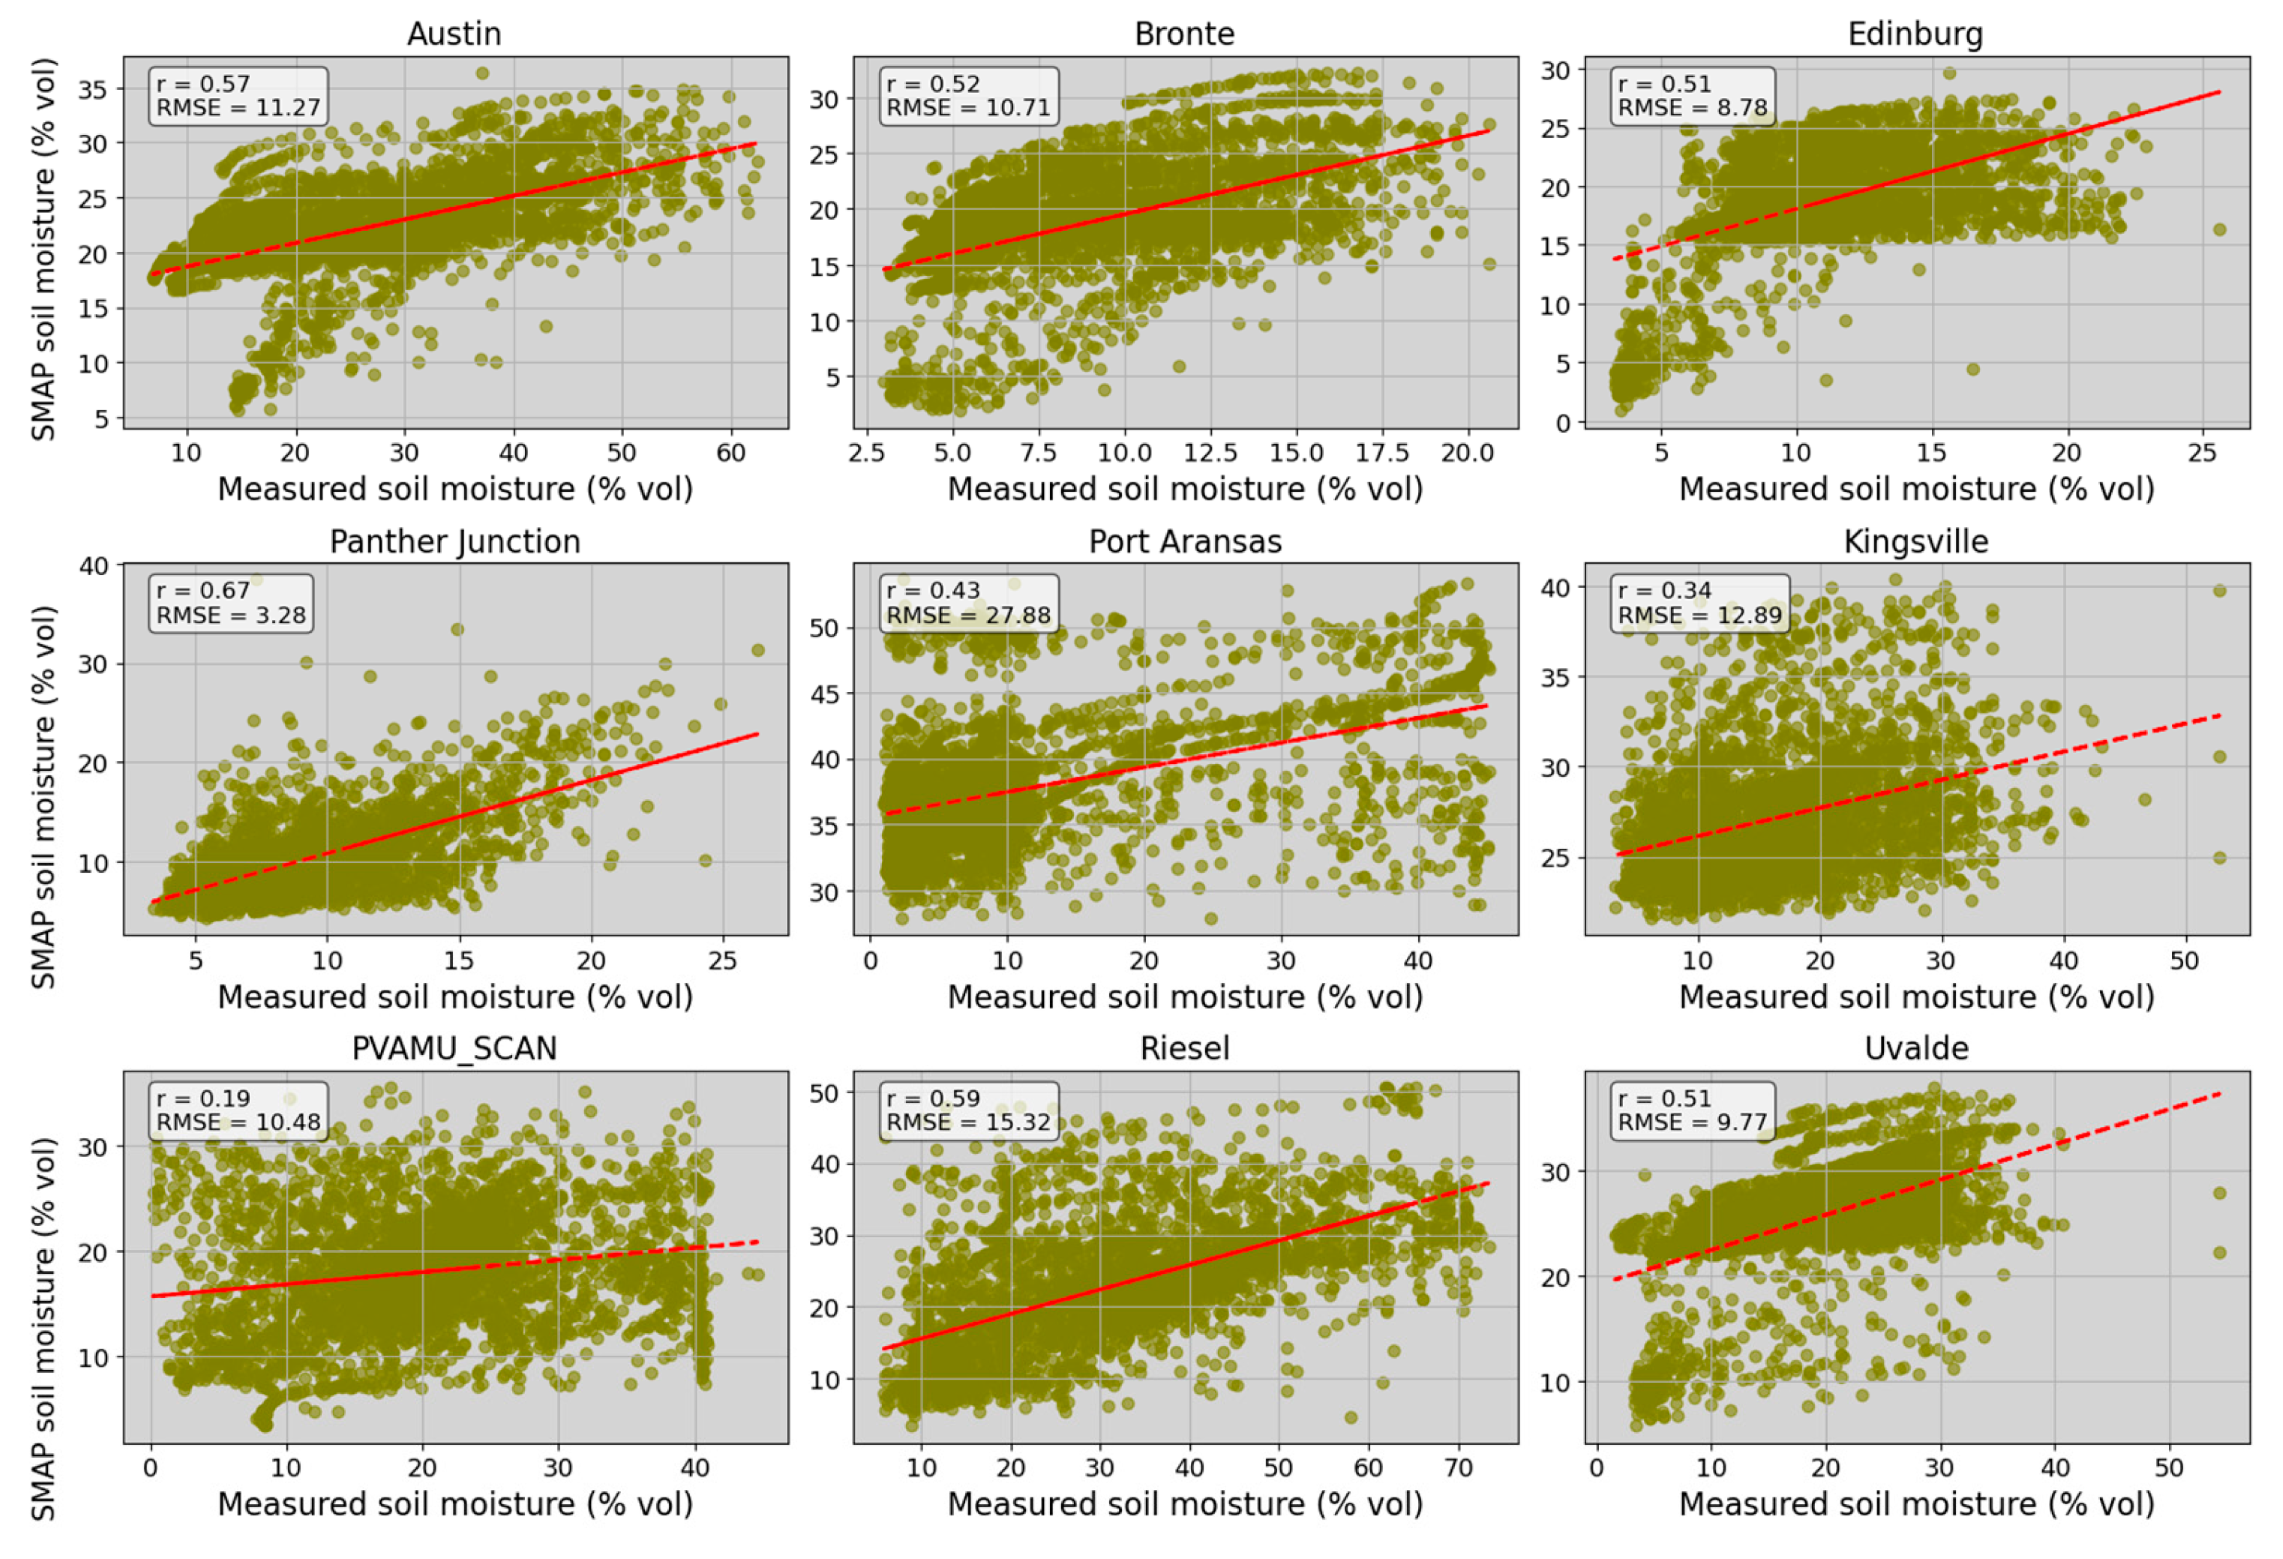
Figure 7 illustrates the performance of the SMAP satellite product in capturing in situ soil moisture observations from the USCRN and SCAN stations. SMAP demonstrates relatively strong performance at the Austin, Bronte, Edinburg, and Panter Junction stations, where correlation coefficients are higher and error metrics are lower, indicating its ability to effectively reproduce surface soil moisture dynamics in these regions. Notably, the SMAP product shows better agreement with the measured soil moisture at the Panther-Junction station, with a correlation of 0.67 and a low RMSE (3.28%), indicating good overall agreement in both temporal variability and absolute magnitude between the SMAP product and in situ measurements. In contrast, SMAP soil moisture shows weak agreement with ground measurements at the PVAMU SCAN station, Port Aransas, and Kingsville USCRN stations. This spatial variability in SMAP performance aligns with previous studies highlighting how retrieval accuracy can be influenced by heterogeneous land surface conditions, including soil texture, vegetation cover, and land use [83,84]. For instance, the Port Aransas and Kingsville USCRN stations are located near the coast, and the weak performance of SMAP at these stations could be attributed to coastal microclimate effects or vegetation effects that are not well-captured in the SMAP retrieval algorithm. These biophysical factors, such as vegetation water content, surface roughness, and soil type, are well-documented influences on passive microwave soil moisture retrievals [30,75]. Therefore, the spatial discrepancies in SMAP performance likely stem from site-specific surface and atmospheric characteristics that affect the quality of remotely sensed data.

3.4. Statistical Bias Correction SMAP Soil Moisture

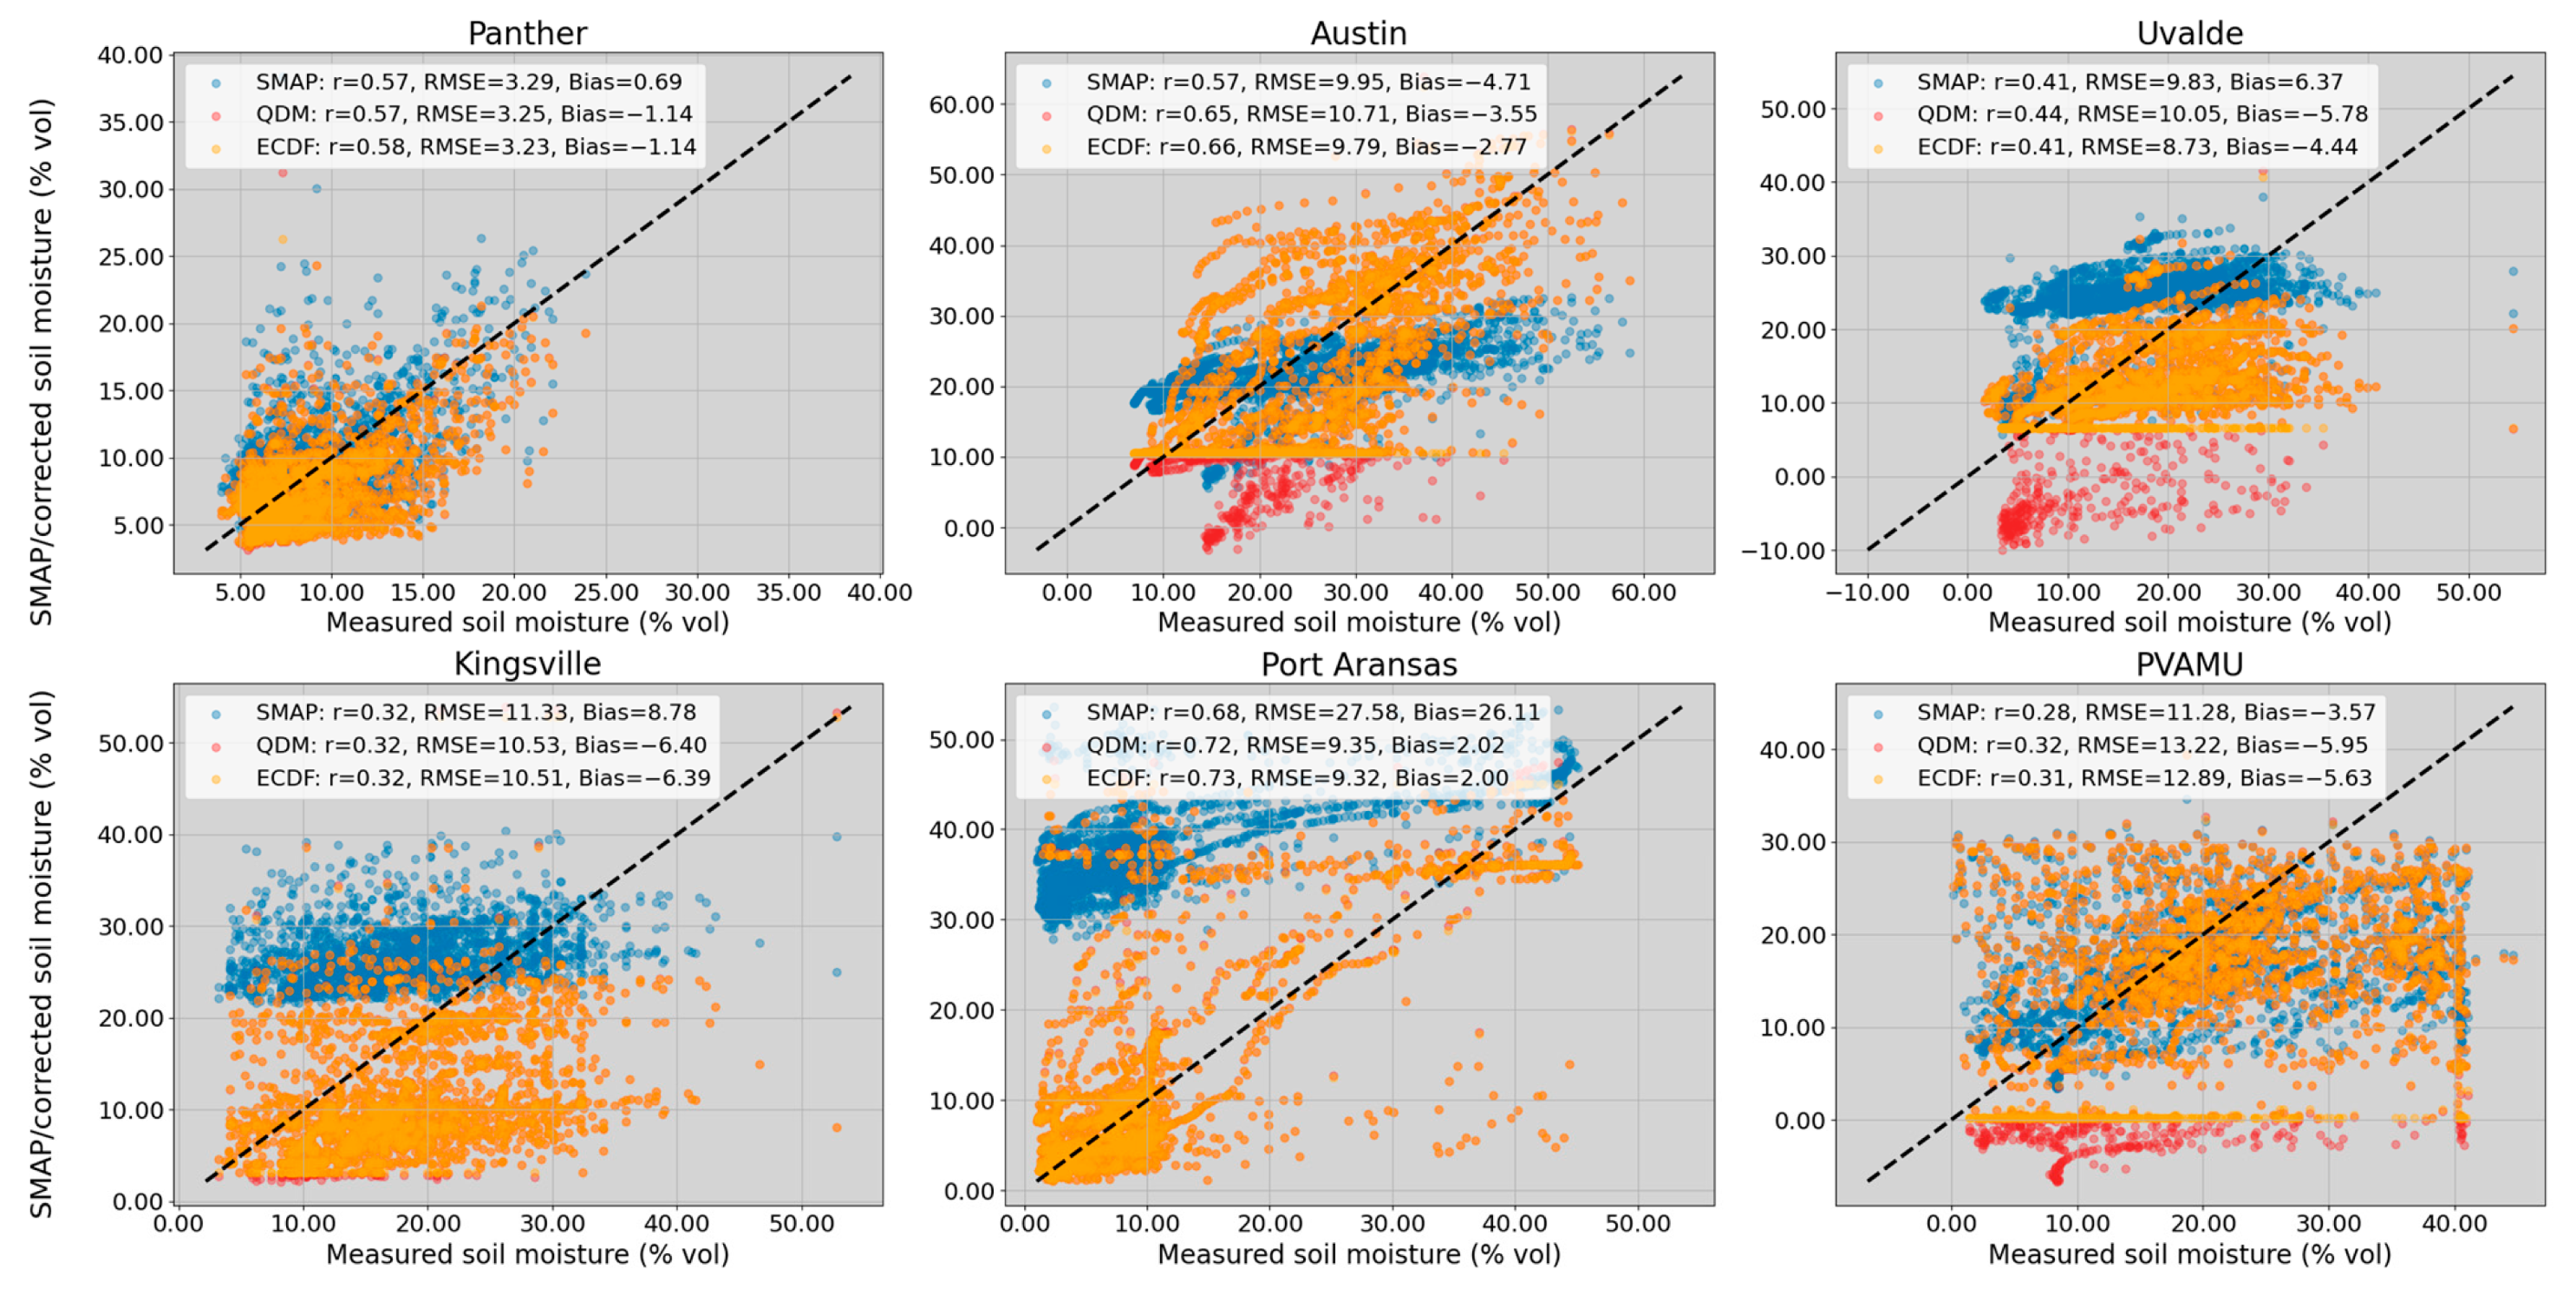
To enhance the accuracy of SMAP soil moisture estimates, we applied QDM and ECDF distribution-based bias correction methods using in situ soil moisture data from USCRN and SCAN stations as reference. Bias correction significantly improved the RMSE between SMAP and observed soil moisture, as shown in Figure 8. Specifically, large RMSE reductions were observed at Port Aransas from 27.58% to 9.32%, whereas Kingsville showed a less improvement from 11.33% to 10.51% (Figure 8). Additionally, the bias correction enhanced the agreement between SMAP and measured soil moisture. The correlation between measured soil moisture and bias-corrected SMAP was higher than that of the uncorrected SMAP data. For example, at the Austin station, the correlation increased from 0.57 for the raw SMAP product to 0.66 after bias correction. Similarly, quantile mapping bias correction improved the correlation between measured and SMAP soil moisture at the Port Aransas and Panther stations.
When we observe improvements at SCAN stations, statistical bias correction resulted in less improvement in correcting SMAP soil moisture data. This could be due to the bias correction methods that may oversimplify local soil moisture dynamics and reduce the inherent variability and unique signals captured by satellite observations. These results highlight the effectiveness of statistical post-processing in reducing systematic errors in satellite-derived soil moisture products, particularly at the USCRN stations. However, improvements in correlations were more modest and site-dependent. For example, enhanced correlations were observed only at Port Aransas and Muleshoe stations after bias correction. This suggests that while RMSE can be improved through rescaling and error minimization, temporal dynamics (as captured by correlation) are more strongly influenced by site-specific conditions. This outcome highlights that the success of bias correction techniques is not solely determined by the statistical algorithm or its parameterization, but is also constrained by the quality and representativeness of the reference observations and the underlying biophysical characteristics of each site.
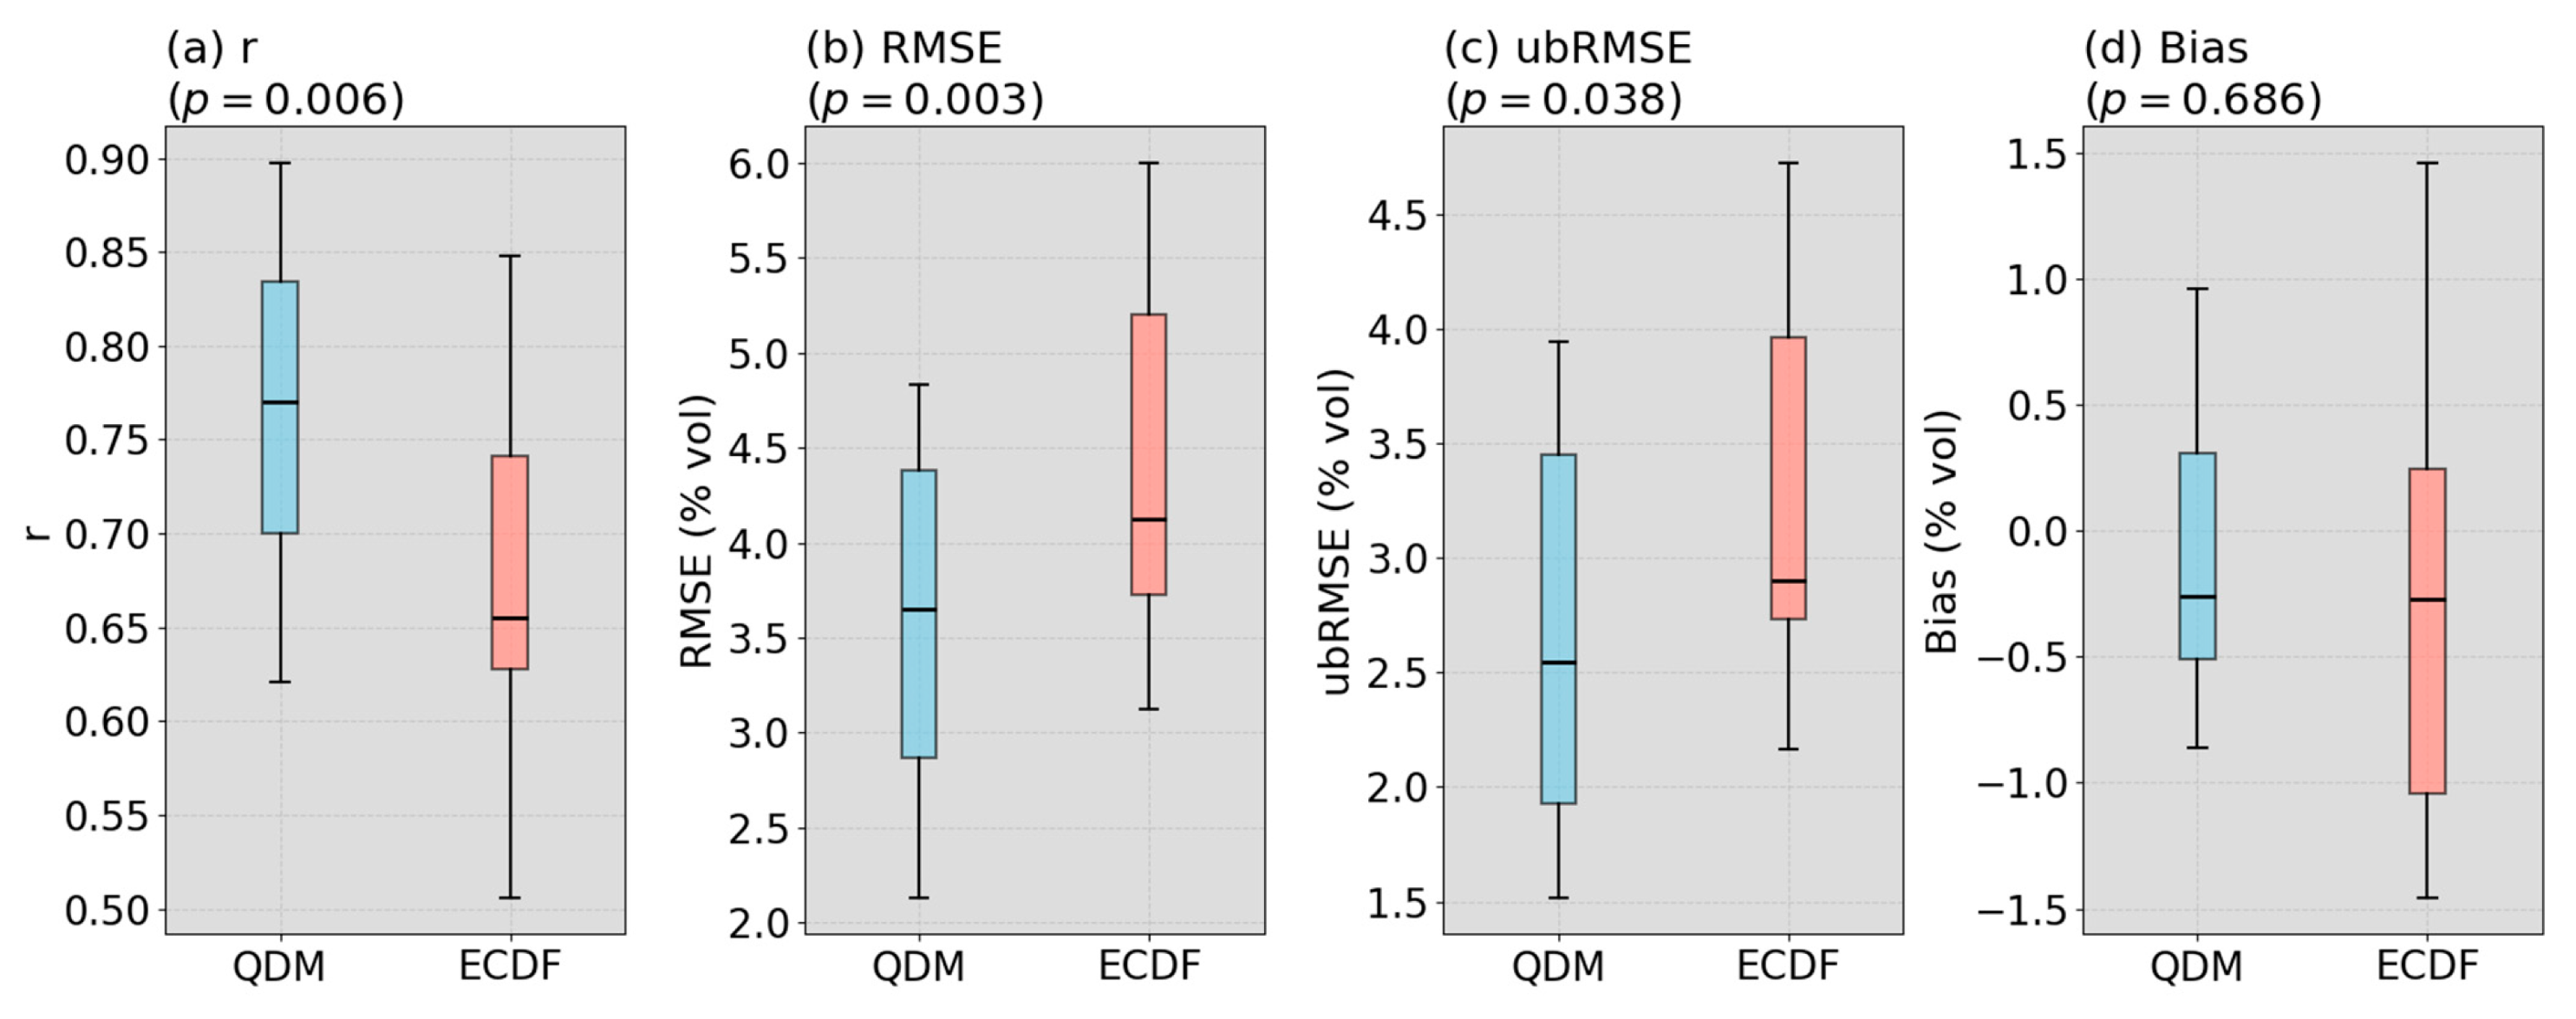
The Wilcoxon signed-rank test indicates that ECDF outperforms QDM primarily in terms of error reduction rather than correlation improvement (Figure 9). Significant differences were found for both RMSE and ubRMSE (W = 0.0, p = 0.0312), demonstrating that ECDF provides a statistically superior reduction in errors in soil moisture estimates across the evaluated sites than QDM. In contrast, the difference in absolute correlation (r) between the two methods was not significant (W = 3.0, p = 0.6250), suggesting that both approaches preserve the temporal variability of observations similarly. When we see correlation metrics, QDM is better than ECDF. The difference in Bias was marginal and not statistically significant at the 5% level (W = 1.0, p = 0.0625), indicating that while QDM tends to reduce systematic bias more effectively than ECDF, this improvement is modest and site dependent. Overall, these results highlight that the main advantage of ECDF lies in its ability to reduce random and total errors making it the more-effective bias-correction method in this analysis, while QDM is better in enhancing correlation or bias alone.
The performance of raw and bias-corrected SMAP soil moisture exhibits substantial spatial variability across stations (Table 3 and Figure 8). Both QDM and ECDF modestly improve correlation between in situ observations at most sites, with the largest gains observed at Austin and Port Aransas stations, where r increases from 0.57 to ~0.65 and from 0.68 to 0.73, respectively (Table 3). Bias correction methods substantially reduce large systematic biases, particularly at Port Aransas, where the raw SMAP overestimation (Bias = 26.1% vol) is reduced to approximately 2% vol after bias correction. However, improvements in RMSE and ubRMSE are site dependent; while ECDF generally yields lower RMSE and ubRMSE at Panther, Austin, Uvalde, and Kingsville, performance at PVAMU shows limited improvement and in some cases increased error after bias correction. These results show that bias correction reduces systematic errors and improves temporal agreement at some sites, but residual random errors and site-specific factors remain, emphasizing the need for localized evaluation when using bias-corrected SMAP soil moisture data.
These findings are consistent with previous studies that have reported spatially variable performance of bias correction techniques across heterogeneous landscapes [84,85]. For instance, linear scaling approaches may perform well in regions with stable land cover and homogeneous soil properties. Still, they may yield limited benefits in transitional zones or in areas with complex land surface processes. Another study found that bias correction improves SMAP soil moisture data at USCRN stations, while local bias correction yields smaller improvements in correcting SMAP soil moisture at SCAN stations [86]. Therefore, when applying bias correction to remote sensing products, it is crucial to consider both the methodological framework and the environmental context of the target region.

4. Discussion

This study finds a generally strong correlation between SMAP and in situ soil moisture measurements at most SCAN and USCRN stations. At sites such as Riesel, Austin, Uvalde, Kingsville, Muleshoe, and Port Aransas, SMAP closely tracks in situ soil moisture dynamics, consistent with the higher R2 values observed in the statistical analysis. However, performance varies across stations. For example, SMAP shows stronger agreement with soil moisture measurements at Panther Junction, located near the Chihuahuan Desert and dominated by shrubland, but weaker correlation at the PVAMU station, which is characterized by pastureland use. Previous studies have similarly reported that the accuracy of satellite-derived soil moisture tends to decline as vegetation density [3,9,87,88]. Locations such as Bronte and Edinburgh, where soil moisture variability is low, exhibit relatively stable trends in both SMAP and in situ datasets, though noticeable biases in magnitude remain.
The variability in SMAP performance across different agroecosystems can also be attributed to multiple environmental and technical factors. Soil characteristics play a crucial role in retrieval accuracy, as sandy soils (e.g., PVAMU and Kingsville) exhibit lower soil moisture retention, which affects microwave signal responses and leads to discrepancies between SMAP and in situ data. Vegetation cover and land use also affect SMAP accuracy, with sites featuring dense vegetation (e.g., Austin and Uvalde) exhibiting greater biases due to interference between vegetation water content and microwave retrievals. Conversely, semi-arid regions like Panther Junction and Muleshoe, where vegetation is sparse, tend to have more accurate SMAP estimates. Topography and climate variability further influence soil moisture retrievals. Locations experiencing frequent and intense rainfall, such as Port Aransas and Austin, exhibit high fluctuations in soil moisture. Yet, SMAP struggles to capture rapid changes following heavy precipitation due to its lower temporal resolution (every 2–3 days) compared to hourly in situ measurements. Additionally, SMAP’s 36 km spatial resolution limits the representation of heterogeneous landscapes, such as Riesel and Kingsville, where localized variations in soil moisture may not be fully captured in satellite retrievals.
The findings highlight both strengths and limitations of SMAP soil moisture retrievals. High-performing locations, such as Riesel, Muleshoe, and Port Aransas, demonstrate that SMAP can provide reliable soil moisture estimates in regions with moderate vegetation and stable soil properties. Conversely, low-performing locations, such as PVAMU, Panther Junction, and Edinburg, indicate the need for further calibration and bias correction, particularly in areas with high land-use heterogeneity, extreme soil conditions, or sensor anomalies. The lower standard deviation in SMAP compared to in situ measurements suggests that SMAP smooths out fine-scale soil moisture variations, making it less sensitive to short-term changes in soil moisture dynamics.
A limitation that can be a source of uncertainty in this study is the scale mismatch between the satellite-derived soil moisture product and point-based in situ observations. The SMAP surface soil moisture product represents an area-averaged estimate over a ~9 km × 9 km footprint, whereas SCAN and USCRN measurements reflect soil moisture conditions at a single location and depth (0–5 cm). Within a single SMAP pixel, substantial subgrid heterogeneity in land cover, management practices, and precipitation patterns may exist, which cannot be fully captured by point-scale measurements. As a result, large discrepancies between SMAP and in situ observations may exist. This effect is particularly pronounced in heterogeneous landscapes, such as urbanized areas (e.g., PVAMU and Kingsville) or locations with complex terrain, where localized soil and vegetation characteristics differ from the dominant conditions within the SMAP footprint. Conversely, sites with relatively homogeneous land cover and soil properties (e.g., rangeland or arid shrubland at Panther Junction and grassland at Riesel) exhibited stronger agreement, suggesting improved representativeness of point measurements at these locations. These findings underscore the importance of accounting for scale mismatch when interpreting satellite validation results and highlight the value of multi-site, climate-zone-based analyses and bias-correction approaches to partially mitigate spatial representativeness errors in satellite soil moisture assessments.
Future research should focus on incorporating higher-resolution remote sensing data, such as Sentinel-1 and SMOS, to improve soil moisture retrieval accuracy. Machine learning, robust statistical bias correction techniques, and data assimilation techniques could also help reduce biases in SMAP estimates, while enhancing ground-based validation networks may refine calibration efforts to improve SMAP performance across diverse agroecosystems. The results suggest that SMAP soil moisture data can be beneficial for large-scale agricultural monitoring and drought assessment, but site-specific corrections may be necessary for precision applications. In regions where SMAP underperforms, integrating local soil moisture sensors, weather station data, and hydrological models could improve decision-making in water resource management and climate-smart agriculture. By refining SMAP retrievals and leveraging complementary datasets, soil moisture information can be more effectively utilized to optimize irrigation strategies, enhance crop yield predictions, and improve drought resilience in various agroecosystems.

5. Conclusions

Soil moisture is a crucial indicator of a region’s hydrological and meteorological conditions. Various remote sensing satellites have been deployed to monitor soil moisture at different temporal and spatial scales, each with varying degrees of measurement uncertainties. Assessing the accuracy of satellite-derived soil moisture products is essential at regional and global scales, especially across diverse climate zones and land cover types This study evaluated the accuracy of Soil Moisture Active Passive (SMAP) satellite-derived soil moisture data by comparing it with in situ measurements across diverse agroecosystems in Texas from 2016 to 2024 The analysis covered ten distinct climate zones and six major land cover types, including urban regions, pastureland, grassland, rangeland, shrubland, and deciduous forests, providing a comprehensive assessment of SMAP’s performance in different environmental conditions.
The results revealed that SMAP effectively captures seasonal soil moisture trends but shows varying accuracy across different land cover types and climatic zones. Higher correlations were observed in pastureland and grassland regions, particularly in Riesel and Muleshoe, where soil moisture variations align closely with precipitation patterns. In contrast, weaker correlations were found at PVAMU and Panther Junction, likely due to differences in soil properties, topography, and vegetation cover. The discrepancies between SMAP and in situ measurements underscore the influence of environmental factors such as soil texture, elevation, and land use on satellite-based soil moisture retrievals. The study also highlighted the importance of integrating satellite-derived soil moisture data with in situ observations to improve the reliability of soil moisture assessments. While SMAP provides valuable large-scale insights, localized calibration and data assimilation techniques are necessary to enhance its accuracy for site-specific applications. These findings significantly affect agricultural water management, drought monitoring, and climate resilience efforts in Texas and similar agroecological regions worldwide.
The bias-correction techniques applied in this study (QDM and ECDF) are effective at matching SMAP soil moisture data with in situ observations, particularly at stations with relatively homogeneous land cover types. Which means their applicability is inherently site- and data-dependent, as performance varies with local vegetation, topography, and the representativeness of reference measurements. While bias correction substantially reduces RMSE and mean bias, improvements in correlation are more modest and not universal, especially at SCAN stations where local heterogeneity and management effects are more pronounced. Therefore, bias-corrected SMAP soil moisture should be applied with caution beyond calibration sites using the SMAP bias-corrected data for operational drought and agricultural applications.
In conclusion, while SMAP is a valuable tool for large-scale soil moisture monitoring, its effectiveness varies based on regional and site-specific characteristics. Future research should focus on integrating machine learning frameworks (e.g., random forests or deep learning) better to capture nonlinear relationships between soil moisture and environmental controls. In addition, fusing SMAP with complementary data sources, such as in situ observations, high-resolution optical and thermal remote sensing, reanalysis products, and precipitation datasets, could further improve soil moisture estimation accuracy. In parallel, improving spatial downscaling that accounts for land cover, climate zones soil properties, and management practices will further enhance the use of SMAP soil moisture for precision agriculture and drought monitoring.

Author Contributions

Conceptualization, S.G. and G.W.T.; methodology, S.G.; formal analysis, S.G.; investigation, R.L.R.; resources, G.W.T.; data curation, S.G.; writing—original draft preparation, S.G.; writing—review and editing, G.W.T. and R.L.R.; visualization, R.L.R.; supervision, R.L.R.; project administration, R.L.R.; funding acquisition, R.L.R. All authors have read and agreed to the published version of the manuscript.

Funding

There is no funding information available.

Data Availability Statement

Data will be available upon request.

Acknowledgments

This study was supported by the Evans-Allen 1890 Research Formula Program (under section 1445) of the United States Department of Agriculture (USDA), National Institute of Food and Agriculture.

Conflicts of Interest

The authors declare no conflict of interest.

References

  1. Al Bitar, A.; Leroux, D.; Kerr, Y.H.; Merlin, O.; Richaume, P.; Sahoo, A.; Wood, E.F. Evaluation of SMOS soil moisture products over continental US using the SCAN/SNOTEL network. IEEE Trans. Geosci. Remote Sens. 2012, 50, 1572–1586. [Google Scholar] [CrossRef] [Scilit]
  2. Griesfeller, A.; Lahoz, W.A.; de Jeu, R.A.; Dorigo, W.; Haugen, L.; Svendby, T.M.; Wagner, W. Evaluation of satellite soil moisture products over Norway using ground-based observations. Int. J. Appl. Earth Obs. Geoinf. 2016, 45, 155–164. [Google Scholar] [CrossRef] [Scilit]
  3. Ray, R.L.; Fares, A.; He, Y.; Temimi, M. Evaluation and Inter-Comparison of Satellite Soil Moisture Products Using In Situ Observations over Texas, U.S. Water 2017, 9, 372. [Google Scholar] [CrossRef] [Scilit]
  4. Seneviratne, S.I.; Corti, T.; Davin, E.L.; Hirschi, M.; Jaeger, E.B.; Lehner, I.; Orlowsky, B.; Teuling, A.J. Investigating soil moisture–climate interactions in a changing climate: A review. Earth-Sci. Rev. 2010, 99, 125–161. [Google Scholar] [CrossRef] [Scilit]
  5. Xiao, Z.; Jiang, L.; Zhu, Z.; Wang, J.; Du, J. Spatially and Temporally Complete Satellite Soil Moisture Data Based on a Data Assimilation Method. Remote Sens. 2016, 8, 49. [Google Scholar] [CrossRef] [Scilit]
  6. Zhang, M.; Zhang, D.; Jin, Y.; Wan, X.; Ge, Y. Evolution of soil moisture mapping from statistical models to integrated mechanistic and geoscience-aware approaches. Inf. Geogr. 2025, 1, 100005. [Google Scholar] [CrossRef] [Scilit]
  7. Azedou, A.; Amine, A.; Lahssini, S.; Osterman, G.; Arboleda-Zapata, M.; Cosh, M.; Kisekka, I. Ensemble deep learning towards high-resolution soil-moisture mapping for enhanced water management in California’s Central Valley. Environ. Model. Softw. 2026, 197, 106824. [Google Scholar] [CrossRef] [Scilit]
  8. Mei, Y.; Mai, J.; Do, H.X.; Gronewold, A.; Reeves, H.; Eberts, S.; Niswonger, R.; Regan, R.S.; Hunt, R.J. Can Hydrological Models Benefit From Using Global Soil Moisture, Evapotranspiration, and Runoff Products as Calibration Targets? Water Resour. Res. 2023, 59, e2022WR032064. [Google Scholar] [CrossRef] [Scilit]
  9. Collow, T.W.; Robock, A.; Basara, J.B.; Illston, B.G. Evaluation of SMOS retrievals of soil moisture over the central United States with currently available in situ observations. J. Geophys. Res. Atmos. 2012, 117. [Google Scholar] [CrossRef] [Scilit]
  10. Li, H.; Robock, A.; Wild, M. Evaluation of Intergovernmental Panel on Climate Change Fourth Assessment soil moisture simulations for the second half of the twentieth century. J. Geophys. Res. Atmos. 2007, 112. [Google Scholar] [CrossRef] [Scilit]
  11. Eva, E.A.; Quiring, S.M. Comparison of different machine learning techniques for downscaling SMAP and NLDAS soil moisture over CONUS. J. Environ. Manag. 2025, 394, 127442. [Google Scholar] [CrossRef] [Scilit] [PubMed]
  12. Notarnicola, C.; Solorza, R. Integration of remotely sensed images and electromagnetic models into a bayesian approach for soil moisture content retrieval: Methodology and effect of prior information. In Dynamic Programming and Bayesian Inference, Concepts and Applications; IntechOpen: London, UK, 2014; pp. 48–52. [Google Scholar]
  13. Ochsner, T.E.; Cosh, M.H.; Cuenca, R.H.; Dorigo, W.A.; Draper, C.S.; Hagimoto, Y.; Kerr, Y.H.; Larson, K.M.; Njoku, E.G.; Small, E.E.; et al. State of the Art in Large-Scale Soil Moisture Monitoring. Soil Sci. Soc. Am. J. 2013, 77, 1888–1919. [Google Scholar] [CrossRef] [Scilit]
  14. Humphrey, V.; Berg, A.; Ciais, P.; Gentine, P.; Jung, M.; Reichstein, M.; Seneviratne, S.I.; Frankenberg, C. Soil moisture–atmosphere feedback dominates land carbon uptake variability. Nature 2021, 592, 65–69. [Google Scholar] [CrossRef] [Scilit] [PubMed]
  15. Zhao, H.; Montzka, C.; Keller, J.; Li, F.; Vereecken, H.; Hendricks Franssen, H.J. How Does Assimilating SMAP Soil Moisture Improve Characterization of the Terrestrial Water Cycle in an Integrated Land Surface-Subsurface Model? Water Resour. Res. 2025, 61, e2024WR038647. [Google Scholar]
  16. Tefera, G.W.; Ray, R.; Kumar, N.; Tarkegn, T.G.; Sarkar, R. Soil moisture in the Anthropocene: A tipping component in planetary boundary transgressions. Environ. Res. Lett. 2025, 20, 103002. [Google Scholar] [CrossRef] [Scilit]
  17. Colliander, A.; Jackson, T.J.; Bindlish, R.; Chan, S.; Das, N.; Kim, S.; Cosh, M.; Dunbar, R.; Dang, L.; Pashaian, L. Validation of SMAP surface soil moisture products with core validation sites. Remote Sens. Environ. 2017, 191, 215–231. [Google Scholar]
  18. Martínez-Fernández, J.; González-Zamora, A.; Sánchez, N.; Gumuzzio, A.; Herrero-Jiménez, C.M. Satellite soil moisture for agricultural drought monitoring: Assessment of the SMOS derived Soil Water Deficit Index. Remote Sens. Environ. 2016, 177, 277–286. [Google Scholar] [CrossRef] [Scilit]
  19. Renzullo, L.J.; van Dijk, A.I.J.M.; Perraud, J.M.; Collins, D.; Henderson, B.; Jin, H.; Smith, A.B.; McJannet, D.L. Continental satellite soil moisture data assimilation improves root-zone moisture analysis for water resources assessment. J. Hydrol. 2014, 519, 2747–2762. [Google Scholar] [CrossRef] [Scilit]
  20. Babaeian, E.; Sadeghi, M.; Jones, S.B.; Montzka, C.; Vereecken, H.; Tuller, M. Ground, Proximal, and Satellite Remote Sensing of Soil Moisture. Rev. Geophys. 2019, 57, 530–616. [Google Scholar] [CrossRef] [Scilit]
  21. Henderson-Sellers, A. Soil moisture: A critical focus for global change studies. Glob. Planet. Chang. 1996, 13, 3–9. [Google Scholar] [CrossRef] [Scilit]
  22. Vinnikov, K.Y.; Robock, A.; Qiu, S.; Entin, J.K.; Owe, M.; Choudhury, B.J.; Hollinger, S.E.; Njoku, E.G. Satellite remote sensing of soil moisture in Illinois, United States. J. Geophys. Res. Atmos. 1999, 104, 4145–4168. [Google Scholar] [CrossRef] [Scilit]
  23. Balsamo, G.; Albergel, C.; Beljaars, A.; Boussetta, S.; Brun, E.; Cloke, H.; Dee, D.; Dutra, E.; Muñoz-Sabater, J.; Pappenberger, F. ERA-Interim/Land: A global land surface reanalysis data set. Hydrol. Earth Syst. Sci. 2015, 19, 389–407. [Google Scholar] [CrossRef] [Scilit]
  24. Bell, J.E.; Palecki, M.A.; Baker, C.B.; Collins, W.G.; Lawrimore, J.H.; Leeper, R.D.; Hall, M.E.; Kochendorfer, J.; Meyers, T.P.; Wilson, T. US Climate Reference Network soil moisture and temperature observations. J. Hydrometeorol. 2013, 14, 977–988. [Google Scholar] [CrossRef] [Scilit]
  25. Dirmeyer, P.A.; Guo, Z.; Gao, X. Comparison, Validation, and Transferability of Eight Multiyear Global Soil Wetness Products. J. Hydrometeorol. 2004, 5, 1011–1033. [Google Scholar] [CrossRef] [Scilit]
  26. Liu, Y.Y.; Parinussa, R.; Dorigo, W.A.; De Jeu, R.A.; Wagner, W.; Van Dijk, A.; McCabe, M.F.; Evans, J. Developing an improved soil moisture dataset by blending passive and active microwave satellite-based retrievals. Hydrol. Earth Syst. Sci. 2011, 15, 425–436. [Google Scholar] [CrossRef] [Scilit]
  27. Nicolai-Shaw, N.; Hirschi, M.; Mittelbach, H.; Seneviratne, S.I. Spatial representativeness of soil moisture using in situ, remote sensing, and land reanalysis data. J. Geophys. Res. Atmos. 2015, 120, 9955–9964. [Google Scholar] [CrossRef] [Scilit]
  28. Owe, M.; de Jeu, R.; Holmes, T. Multisensor historical climatology of satellite-derived global land surface moisture. J. Geophys. Res. Earth Surf. 2008, 113. [Google Scholar] [CrossRef] [Scilit]
  29. Kerr, Y.H.; Waldteufel, P.; Wigneron, J.-P.; Delwart, S.; Cabot, F.; Boutin, J.; Escorihuela, M.-J.; Font, J.; Reul, N.; Gruhier, C. The SMOS mission: New tool for monitoring key elements ofthe global water cycle. Proc. IEEE 2010, 98, 666–687. [Google Scholar] [CrossRef] [Scilit]
  30. Entekhabi, D.; Njoku, E.G.; O’neill, P.E.; Kellogg, K.H.; Crow, W.T.; Edelstein, W.N.; Entin, J.K.; Goodman, S.D.; Jackson, T.J.; Johnson, J. The soil moisture active passive (SMAP) mission. Proc. IEEE 2010, 98, 704–716. [Google Scholar] [CrossRef] [Scilit]
  31. Entekhabi, D.; Reichle, R.H.; Koster, R.D.; Crow, W.T. Performance metrics for soil moisture retrievals and application requirements. J. Hydrometeorol. 2010, 11, 832–840. [Google Scholar] [CrossRef] [Scilit]
  32. Wagner, W.; Dorigo, W.; De Jeu, R.; Fernandez, D.; Benveniste, J.; Haas, E.; Ertl, M. Fusion Of Active And Passive Microwave Observations To Create An Essential Climate Variable Data Record On Soil Moisture. ISPRS Ann. Photogramm. Remote Sens. Spat. Inf. Sci. 2012, 1, 315–321. [Google Scholar] [CrossRef] [Scilit]
  33. Dorigo, W.A.; Xaver, A.; Vreugdenhil, M.; Gruber, A.; Hegyiová, A.; Sanchis-Dufau, A.D.; Zamojski, D.; Cordes, C.; Wagner, W.; Drusch, M. Global Automated Quality Control of In Situ Soil Moisture Data from the International Soil Moisture Network. Vadose Zone J. 2013, 12, vzj2012.0097. [Google Scholar] [CrossRef] [Scilit]
  34. Gruhier, C.; de Rosnay, P.; Hasenauer, S.; Holmes, T.; de Jeu, R.; Kerr, Y.; Mougin, E.; Njoku, E.; Timouk, F.; Wagner, W.; et al. Soil moisture active and passive microwave products: Intercomparison and evaluation over a Sahelian site. Hydrol. Earth Syst. Sci. 2010, 14, 141–156. [Google Scholar] [CrossRef] [Scilit]
  35. Jackson, T.J.; Cosh, M.H.; Bindlish, R.; Starks, P.J.; Bosch, D.D.; Seyfried, M.; Goodrich, D.C.; Moran, M.S.; Du, J. Validation of Advanced Microwave Scanning Radiometer Soil Moisture Products. IEEE Trans. Geosci. Remote Sens. 2010, 48, 4256–4272. [Google Scholar] [CrossRef] [Scilit]
  36. Li, C.; Lu, H.; Yang, K.; Han, M.; Wright, J.S.; Chen, Y.; Yu, L.; Xu, S.; Huang, X.; Gong, W. The evaluation of SMAP enhanced soil moisture products using high-resolution model simulations and in-situ observations on the Tibetan Plateau. Remote Sens. 2018, 10, 535. [Google Scholar] [CrossRef] [Scilit]
  37. Pan, M.; Cai, X.; Chaney, N.W.; Entekhabi, D.; Wood, E.F. An initial assessment of SMAP soil moisture retrievals using high-resolution model simulations and in situ observations. Geophys. Res. Lett. 2016, 43, 9662–9668. [Google Scholar]
  38. Zeng, J.; Chen, K.S.; Bi, H.; Chen, Q. A Preliminary Evaluation of the SMAP Radiometer Soil Moisture Product Over United States and Europe Using Ground-Based Measurements. IEEE Trans. Geosci. Remote Sens. 2016, 54, 4929–4940. [Google Scholar] [CrossRef] [Scilit]
  39. Wong, C.I.; Banner, J.L.; Musgrove, M. Holocene climate variability in Texas, USA: An integration of existing paleoclimate data and modeling with a new, high-resolution speleothem record. Quat. Sci. Rev. 2015, 127, 155–173. [Google Scholar] [CrossRef] [Scilit]
  40. Wurbs, R.A. Sustainable Statewide Water Resources Management in Texas. J. Water Resour. Plan. Manag. 2015, 141, A4014002. [Google Scholar] [CrossRef] [Scilit]
  41. Velpuri, N.M.; Senay, G.B.; Morisette, J.T. Evaluating New SMAP Soil Moisture for Drought Monitoring in the Rangelands of the US High Plains. Rangelands 2016, 38, 183–190. [Google Scholar] [CrossRef] [Scilit]
  42. Liu, P.-W.; Bindlish, R.; Fang, B.; Lakshmi, V.; O’Neill, P.E.; Yang, Z.; Cosh, M.H.; Bongiovanni, T.; Bosch, D.D.; Collins, C.H. Assessing disaggregated SMAP soil moisture products in the United States. IEEE J. Sel. Top. Appl. Earth Obs. Remote Sens. 2021, 14, 2577–2592. [Google Scholar] [CrossRef] [Scilit]
  43. Bolten, J.D.; Crow, W.T.; Zhan, X.; Jackson, T.J.; Reynolds, C.A. Evaluating the utility of remotely sensed soil moisture retrievals for operational agricultural drought monitoring. IEEE J. Sel. Top. Appl. Earth Obs. Remote Sens. 2009, 3, 57–66. [Google Scholar] [CrossRef] [Scilit]
  44. Judge, J. Microwave remote sensing of soil water: Recent advances and issues. Trans. ASABE 2007, 50, 1645–1649. [Google Scholar] [CrossRef] [Scilit]
  45. Liu, P.-W.; Bongiovanni, T.; Monsivais-Huertero, A.; Judge, J.; Steele-Dunne, S.; Bindlish, R.; Jackson, T.J. Assimilation of active and passive microwave observations for improved estimates of soil moisture and crop growth. IEEE J. Sel. Top. Appl. Earth Obs. Remote Sens. 2016, 9, 1357–1369. [Google Scholar] [CrossRef] [Scilit]
  46. Steele-Dunne, S.C.; McNairn, H.; Monsivais-Huertero, A.; Judge, J.; Liu, P.W.; Papathanassiou, K. Radar Remote Sensing of Agricultural Canopies: A Review. IEEE J. Sel. Top. Appl. Earth Obs. Remote Sens. 2017, 10, 2249–2273. [Google Scholar] [CrossRef] [Scilit]
  47. Brocca, L.; Pellarin, T.; Crow, W.T.; Ciabatta, L.; Massari, C.; Ryu, D.; Su, C.H.; Rüdiger, C.; Kerr, Y. Rainfall estimation by inverting SMOS soil moisture estimates: A comparison of different methods over Australia. J. Geophys. Res. Atmos. 2016, 121, 12062–12079. [Google Scholar] [CrossRef] [Scilit]
  48. Chakrabarti, S.; Bongiovanni, T.; Judge, J.; Zotarelli, L.; Bayer, C. Assimilation of SMOS soil moisture for quantifying drought impacts on crop yield in agricultural regions. IEEE J. Sel. Top. Appl. Earth Obs. Remote Sens. 2014, 7, 3867–3879. [Google Scholar] [CrossRef] [Scilit]
  49. Koster, R.D.; Liu, Q.; Mahanama, S.P.; Reichle, R.H. Improved hydrological simulation using SMAP data: Relative impacts of model calibration and data assimilation. J. Hydrometeorol. 2018, 19, 727–741. [Google Scholar] [CrossRef] [Scilit]
  50. Mladenova, I.E.; Bolten, J.D.; Crow, W.T.; Sazib, N.; Cosh, M.H.; Tucker, C.J.; Reynolds, C. Evaluating the Operational Application of SMAP for Global Agricultural Drought Monitoring. IEEE J. Sel. Top. Appl. Earth Obs. Remote Sens. 2019, 12, 3387–3397. [Google Scholar] [CrossRef] [Scilit]
  51. Ridler, M.-E.; Madsen, H.; Stisen, S.; Bircher, S.; Fensholt, R. Assimilation of SMOS-derived soil moisture in a fully integrated hydrological and soil-vegetation-atmosphere transfer model in Western Denmark. Water Resour. Res. 2014, 50, 8962–8981. [Google Scholar] [CrossRef] [Scilit]
  52. Peng, J.; Loew, A.; Merlin, O.; Verhoest, N.E.C. A review of spatial downscaling of satellite remotely sensed soil moisture. Rev. Geophys. 2017, 55, 341–366. [Google Scholar] [CrossRef] [Scilit]
  53. Robock, A.; Vinnikov, K.Y.; Srinivasan, G.; Entin, J.K.; Hollinger, S.E.; Speranskaya, N.A.; Liu, S.; Namkhai, A. The global soil moisture data bank. Bull. Am. Meteorol. Soc. 2000, 81, 1281–1300. [Google Scholar] [CrossRef] [Scilit]
  54. Vinnikov, K.Y.; Yeserkepova, I.B. Soil Moisture: Empirical Data and Model Results. J. Clim. 1991, 4, 66–79. [Google Scholar] [CrossRef] [Scilit]
  55. Clarke Topp, G.; Reynolds, W.D. Time domain reflectometry: A seminal technique for measuring mass and energy in soil. Soil Tillage Res. 1998, 47, 125–132. [Google Scholar] [CrossRef] [Scilit]
  56. Robinson, D.A.; Jones, S.B.; Wraith, J.M.; Or, D.; Friedman, S.P. A Review of Advances in Dielectric and Electrical Conductivity Measurement in Soils Using Time Domain Reflectometry. Vadose Zone J. 2003, 2, 444–475. [Google Scholar] [CrossRef] [Scilit]
  57. Bogena, H.R.; Huisman, J.A.; Oberdörster, C.; Vereecken, H. Evaluation of a low-cost soil water content sensor for wireless network applications. J. Hydrol. 2007, 344, 32–42. [Google Scholar] [CrossRef] [Scilit]
  58. Dean, T.J.; Bell, J.P.; Baty, A.J.B. Soil moisture measurement by an improved capacitance technique, Part I. Sensor design and performance. J. Hydrol. 1987, 93, 67–78. [Google Scholar] [CrossRef] [Scilit]
  59. Hollinger, S.E.; Isard, S.A. A soil moisture climatology of Illinois. J. Clim. 1994, 7, 822–833. [Google Scholar] [CrossRef] [Scilit]
  60. Samouëlian, A.; Cousin, I.; Tabbagh, A.; Bruand, A.; Richard, G. Electrical resistivity survey in soil science: A review. Soil Tillage Res. 2005, 83, 173–193. [Google Scholar] [CrossRef] [Scilit]
  61. Zhou, Q.Y.; Shimada, J.; Sato, A. Three-dimensional spatial and temporal monitoring of soil water content using electrical resistivity tomography. Water Resour. Res. 2001, 37, 273–285. [Google Scholar] [CrossRef] [Scilit]
  62. Valente, A.; Morais, R.; Tuli, A.; Hopmans, J.W.; Kluitenberg, G.J. Multi-functional probe for small-scale simultaneous measurements of soil thermal properties, water content, and electrical conductivity. Sens. Actuators A Phys. 2006, 132, 70–77. [Google Scholar] [CrossRef] [Scilit]
  63. Garrido, F.; Ghodrati, M.; Chendorain, M. Small-scale measurement of soil water content using a fiber optic sensor. Soil Sci. Soc. Am. J. 1999, 63, 1505–1512. [Google Scholar] [CrossRef] [Scilit]
  64. Schaefer, G.L.; Cosh, M.H.; Jackson, T.J. The USDA Natural Resources Conservation Service Soil Climate Analysis Network (SCAN). J. Atmos. Ocean. Technol. 2007, 24, 2073–2077. [Google Scholar] [CrossRef] [Scilit]
  65. Gao, X.; Zhao, X.; Brocca, L.; Pan, D.; Wu, P. Testing of observation operators designed to estimate profile soil moisture from surface measurements. Hydrol. Process. 2019, 33, 575–584. [Google Scholar] [CrossRef] [Scilit]
  66. Schaefer, G.L.; Paetzold, R.F. SNOTEL (SNOwpack TELemetry) and SCAN (soil climate analysis network). Autom. Weather Stn. Appl. Agric. Water Resour. Manag. Curr. Use Future Perspect. 2001, 1074, 187–194. [Google Scholar]
  67. Diamond, H.J.; Karl, T.R.; Palecki, M.A.; Baker, C.B.; Bell, J.E.; Leeper, R.D.; Easterling, D.R.; Lawrimore, J.H.; Meyers, T.P.; Helfert, M.R.; et al. U.S. Climate Reference Network after One Decade of Operations: Status and Assessment. Bull. Am. Meteorol. Soc. 2013, 94, 485–498. [Google Scholar] [CrossRef] [Scilit]
  68. Wilson, T.B.; Baker, C.B.; Meyers, T.P.; Kochendorfer, J.; Hall, M.; Bell, J.E.; Diamond, H.J.; Palecki, M.A. Site-Specific Soil Properties of the US Climate Reference Network Soil Moisture. Vadose Zone J. 2016, 15, vzj2016.2005.0047. [Google Scholar] [CrossRef] [Scilit]
  69. Panciera, R.; Walker, J.P.; Jackson, T.J.; Gray, D.A.; Tanase, M.A.; Ryu, D.; Monerris, A.; Yardley, H.; Rüdiger, C.; Wu, X.; et al. The Soil Moisture Active Passive Experiments (SMAPEx): Toward Soil Moisture Retrieval From the SMAP Mission. IEEE Trans. Geosci. Remote Sens. 2014, 52, 490–507. [Google Scholar] [CrossRef] [Scilit]
  70. Sahoo, A.K.; Houser, P.R.; Ferguson, C.; Wood, E.F.; Dirmeyer, P.A.; Kafatos, M. Evaluation of AMSR-E soil moisture results using the in-situ data over the Little River Experimental Watershed, Georgia. Remote Sens. Environ. 2008, 112, 3142–3152. [Google Scholar] [CrossRef] [Scilit]
  71. Zarco-Tejada, P.J.; Rueda, C.A.; Ustin, S.L. Water content estimation in vegetation with MODIS reflectance data and model inversion methods. Remote Sens. Environ. 2003, 85, 109–124. [Google Scholar] [CrossRef] [Scilit]
  72. Torres, G.M.; Lollato, R.P.; Ochsner, T.E. Comparison of Drought Probability Assessments Based on Atmospheric Water Deficit and Soil Water Deficit. Agron. J. 2013, 105, 428–436. [Google Scholar] [CrossRef] [Scilit]
  73. Gourley, J.J.; Erlingis, J.M.; Hong, Y.; Wells, E.B. Evaluation of tools used for monitoring and forecasting flash floods in the United States. Weather Forecast. 2012, 27, 158–173. [Google Scholar] [CrossRef] [Scilit]
  74. Pan, W.; Boyles, R.P.; White, J.G.; Heitman, J.L. Characterizing Soil Physical Properties for Soil Moisture Monitoring with the North Carolina Environment and Climate Observing Network. J. Atmos. Ocean. Technol. 2012, 29, 933–943. [Google Scholar] [CrossRef] [Scilit]
  75. Scott, B.L.; Ochsner, T.E.; Illston, B.G.; Fiebrich, C.A.; Basara, J.B.; Sutherland, A.J. New Soil Property Database Improves Oklahoma Mesonet Soil Moisture Estimates. J. Atmos. Ocean. Technol. 2013, 30, 2585–2595. [Google Scholar] [CrossRef] [Scilit]
  76. Cannon, A.J.; Sobie, S.R.; Murdock, T.Q. Bias correction of GCM precipitation by quantile mapping: How well do methods preserve changes in quantiles and extremes? J. Clim. 2015, 28, 6938–6959. [Google Scholar] [CrossRef] [Scilit]
  77. Hoffman, R.N.; Boukabara, S.-A.; Kumar, V.K.; Garrett, K.; Casey, S.P.F.; Atlas, R. An Empirical Cumulative Density Function Approach to Defining Summary NWP Forecast Assessment Metrics. Mon. Weather Rev. 2017, 145, 1427–1435. [Google Scholar] [CrossRef] [Scilit]
  78. Gudmundsson, L.; Bremnes, J.B.; Haugen, J.E.; Engen-Skaugen, T. Downscaling RCM precipitation to the station scale using statistical transformations–a comparison of methods. Hydrol. Earth Syst. Sci. 2012, 16, 3383–3390. [Google Scholar] [CrossRef] [Scilit]
  79. Wade, R.; Hudson, D. Estimated Regional Economic Impacts of the 2022 Drought in the Texas Northern and Southern High Plains: Row Crop Agriculture; Texas Tech University: Lubbock, TX, USA, 2023. [Google Scholar]
  80. Piacentini, R.D.; Valle Seijo, M.F.; Pani, A. Impact of ENSO events and climate change on soil drying. Dry. Technol. 2024, 42, 1395–1396. [Google Scholar] [CrossRef] [Scilit]
  81. Caldwell, T.G.; Bongiovanni, T.; Cosh, M.H.; Jackson, T.J.; Colliander, A.; Abolt, C.J.; Casteel, R.; Larson, T.; Scanlon, B.R.; Young, M.H. The Texas soil observation network: A comprehensive soil moisture dataset for remote sensing and land surface model validation. Vadose Zone J. 2019, 18, 1–20. [Google Scholar] [CrossRef] [Scilit]
  82. Nielsen-Gammon, J.W.; Banner, J.L.; Cook, B.I.; Tremaine, D.M.; Wong, C.I.; Mace, R.E.; Gao, H.; Yang, Z.-L.; Gonzalez, M.F.; Hoffpauir, R.; et al. Unprecedented Drought Challenges for Texas Water Resources in a Changing Climate: What Do Researchers and Stakeholders Need to Know? Earth’s Future 2020, 8, e2020EF001552. [Google Scholar] [CrossRef] [Scilit]
  83. Chen, Y.; Yang, K.; Qin, J.; Cui, Q.; Lu, H.; La, Z.; Han, M.; Tang, W. Evaluation of SMAP, SMOS, and AMSR2 soil moisture retrievals against observations from two networks on the Tibetan Plateau. J. Geophys. Res. Atmos. 2017, 122, 5780–5792. [Google Scholar] [CrossRef] [Scilit]
  84. Gruber, A.; De Lannoy, G.; Albergel, C.; Al-Yaari, A.; Brocca, L.; Calvet, J.-C.; Colliander, A.; Cosh, M.; Crow, W.; Dorigo, W. Validation practices for satellite soil moisture retrievals: What are (the) errors? Remote Sens. Environ. 2020, 244, 111806. [Google Scholar] [CrossRef] [Scilit]
  85. Monsivais-Huertero, A.; Judge, J.; Steele-Dunne, S.; Liu, P.W. Impact of Bias Correction Methods on Estimation of Soil Moisture When Assimilating Active and Passive Microwave Observations. IEEE Trans. Geosci. Remote Sens. 2016, 54, 262–278. [Google Scholar] [CrossRef] [Scilit]
  86. Kolassa, J.; Reichle, R.H.; Liu, Q.; Cosh, M.; Bosch, D.D.; Caldwell, T.G.; Colliander, A.; Holifield Collins, C.; Jackson, T.J.; Livingston, S.J. Data assimilation to extract soil moisture information from SMAP observations. Remote Sens. 2017, 9, 1179. [Google Scholar] [CrossRef] [Scilit]
  87. Kim, S.; Liu, Y.Y.; Johnson, F.M.; Parinussa, R.M.; Sharma, A. A global comparison of alternate AMSR2 soil moisture products: Why do they differ? Remote Sens. Environ. 2015, 161, 43–62. [Google Scholar] [CrossRef] [Scilit]
  88. Parinussa, R.M.; Meesters, A.G.C.A.; Liu, Y.Y.; Dorigo, W.; Wagner, W.; Jeu, R.A.M.d. Error Estimates for Near-Real-Time Satellite Soil Moisture as Derived From the Land Parameter Retrieval Model. IEEE Geosci. Remote Sens. Lett. 2011, 8, 779–783. [Google Scholar] [CrossRef] [Scilit]
Figure 1. A map of Texas, the study area for this research, includes various climate regions and selected in situ stations across the state (modified from [3]. * NRCS SCAN Stations; ** USCRN Stations. Note: No in situ soil moisture station was available within the Southern climatic region. Therefore, the nearest available station, Uvalde, located in the Edwards Plateau region, was used to represent this area in the analysis.
Remotesensing 18 00994 g001
Figure 2. Spatial variation in elevation, precipitation, and temperature of Texas.
Remotesensing 18 00994 g002
Figure 3. Analytical framework of the study.
Remotesensing 18 00994 g003
Figure 4. Comparison between SMAP satellite-derived soil moisture and in situ (SCAN/USCRN) soil moisture measurements at selected stations across Texas during the study period (2016–2024). (a) Urban area at PVAMU (East Texas—ET), (b) Pastureland at Riesel (North Central—NC), (c) Rangeland at Kingsville (South Central—SC), (d) Shrubland at Uvalde (Edwards Plateau—EP), (e) Shrubland Cover at Austin (Edwards Plateau—EP), (f) Grassland at Bronte (Low Rolling Plains—LRP), (g) Pastureland at Edinburg (Lower Valley—LV), (h) Grassland at Muleshoe (High Plains—HP), (i) Shrubland at Panther Junction (Trans Pecos—TP), (j) Deciduous Forest at Port Aransas (Upper Coast—UC).
Remotesensing 18 00994 g004
Figure 5. In situ soil moisture dynamics on different land cover and climate types across stations in Texas. (a) Soil moisture variations across major climate zones of Texas; (b) soil moisture variability under different land cover types.
Remotesensing 18 00994 g005
Figure 6. Mean monthly soil moisture of Texas simulated using the SMAP satellite.
Remotesensing 18 00994 g006
Figure 7. Scatter plot comparing daily soil moisture of USCRN and SCAN with SMAP soil moisture at different soil moisture stations in Texas (red dashed line is trendline). The legend shows the correlation and the RMSE.
Remotesensing 18 00994 g007
Figure 8. Comparison of measured (USCRN) and bias-corrected soil moisture at different stations across Texas (black dashed line is trendline).
Remotesensing 18 00994 g008
Figure 9. Comparison of the performance of QDM and ECDF bias correction methods in improving SMAP soil moisture data. Boxplots show the distribution of (a) correlation coefficient (r), (b) root mean squared error (RMSE), (c) unbiased RMSE (ubRMSE), and (d) absolute bias (Bias) in 10 stations. The p-values from Wilcoxon signed-rank tests (shown in each panel title) indicate the statistical significance of differences between the two methods in terms of the statistical metrics.
Remotesensing 18 00994 g009
Table 1. Natural Resources Conservation Service (NRCS) Soil Climate Analysis Network (SCAN) stations and US Climate Reference Network (USCRN) used in this study.
SNStationLatitude (°)Longitude (°)Elevation (m)SoilLand CoverClimate Zone
1PVAMU *30.08−95.9882Sandy LoamUrban areaEast Texas (ET)
2Riesel *31.48−96.88164ClayPastureNorth Central (NC)
3Kingsville *27.55−97.8820Sandy LoamRangelandSouth Central (SC)
4Uvalde *29.22−99.76279Clay LoamShrubEdwards Plateau (EP)
5Austin **30.62−98.08415Clay LoamShrubEdwards Plateau (EP)
6Bronte **32.04−100.25609Sandy LoamGrasslandLow Rolling Plains (LRP)
7Edinburg **26.53−98.0620Silty Clay Loam PastureLower Valley (LV)
8Muleshoe **33.96−102.771141LoamGrasslandHigh Plains (HP)
9Panther **29.35−103.211066Sandy LoamShrubTrans Pecos (TP)
10Port-Aransas **28.30−96.825SandDeciduous ForestUpper Coast (UC)
Notes: * NRCS SCAN Stations; ** USCRN Stations.
Table 2. Statistics among in situ and SMAP soil moisture observations (state of Texas).
SNStationR2RMSEMean (SMAP)Mean (In Situ)SD (SMAP)SD (In Situ)
1PVAMU *0.0410.4818.0320.245.7609.66
2Riesel *0.3515.3222.8731.369.1415.75
3Kingsville *0.1112.8927.1716.623.6207.76
4Uvalde *0.279.7725.2218.245.1207.88
5Austin **0.3311.2722.6328.324.3211.53
6Bronte **0.2710.7119.0909.415.1903.84
7Edinburg **0.268.7818.6810.974.6203.68
8Muleshoe **0.219.1620.8213.784.6506.29
9Panther **0.453.289.8508.733.9503.58
10Port-Aransas **0.1927.8837.8312.025.0711.71
Note: * = SCAN Station, ** = USCRN, R2 = Coefficient of Determination, RMSE = Root Mean Square Error, SD = Standard Deviation.
Table 3. The correlation (r), RMSE, Bias, and ubRMSE between soil moisture of observation and SMAP, QDM and ECDF.
Soil Moisture StationMethodr(−)RMSE (% vol)Bias (% vol)ubRMSE (% vol)
PantherSMAP0.5733.2880.6913.214
PantherQDM0.5743.248−1.1363.043
PantherECDF0.5773.23−1.1383.023
AustinSMAP0.5699.95−4.7088.766
AustinQDM0.64710.71−3.54910.105
AustinECDF0.6559.785−2.7669.386
UvaldeSMAP0.4159.8286.3697.485
UvaldeQDM0.43910.048−5.7858.215
UvaldeECDF0.4148.725−4.4417.511
KingsvilleSMAP0.31911.3348.7847.163
KingsvilleQDM0.32110.533−6.4048.362
KingsvilleECDF0.32110.514−6.3938.347
Port AransasSMAP0.67927.58326.1138.885
Port AransasQDM0.7259.3512.0219.13
Port AransasECDF0.7259.3181.9979.102
PVAMUSMAP0.27911.275−3.56910.695
PVAMUQDM0.31713.223−5.95111.808
PVAMUECDF0.30812.89−5.62711.597
Disclaimer/Publisher’s Note: The statements, opinions and data contained in all publications are solely those of the individual author(s) and contributor(s) and not of MDPI and/or the editor(s). MDPI and/or the editor(s) disclaim responsibility for any injury to people or property resulting from any ideas, methods, instructions or products referred to in the content.