


Highlights
What are the main findings?
- The performance of GPP models with varying levels of complexity differs substantially across different LAI levels and environmental stress conditions.
- The process-based FvCB model is more responsive to canopy structure and light distribution, and its resilience to environmental stress increases with LAI.
What are the implications of the main findings?
- Differences in model structures and in the representation of photosynthetic processes lead to substantial variability in GPP estimates.
- The 3D simulations provide a more realistic testing ground, and compared with the simplified LUE models, the FvCB model better captures differences in canopy sensitivity to environmental stress across LAI levels.
Abstract
Gross primary production (GPP) models are widely used to estimate carbon fluxes at local and global scales, and play a crucial role in understanding the dynamics of terrestrial carbon cycling. While numerous studies have compared the performance of various GPP models, most evaluations rely on in situ GPP derived from eddy covariance flux towers, which may be constrained by estimation uncertainties and limited spatial representativeness. In this study, we employed a three-dimensional (3D) simulation framework characterized by high accuracy and strong environmental controllability to evaluate the performance of GPP models of varying complexity (FvCB, MOD17, VPM, and MVPM) under different leaf area index (LAI) levels and environmental stress conditions. The results revealed significant differences among the models at both instantaneous and daily scales. Under high-temperature stress, the performance of VPM was most comparable to that of MOD17. FvCB and MOD17 exhibited strong consistency in their sensitivity to environmental variations, whereas MVPM generally produced lower GPP estimates but showed the highest responsiveness to environmental changes. The process-based FvCB model was the most sensitive to canopy structure and light distribution, and its resilience to environmental stress increased with LAI. These findings provide a novel methodological perspective for evaluating GPP models and offer important insights into the structural and mechanistic factors driving performance differences among the models.
1. Introduction
Gross primary production (GPP), the principal carbon cycle flux in terrestrial ecosystems, is defined as the total amount of carbon dioxide () fixed by plants through photosynthesis [1,2]. Terrestrial GPP is the largest global carbon flux, and it not only drives multiple vital ecosystem functions such as growth, but also provides social services such as food, fiber, and energy [2,3,4]. Moreover, GPP and respiration together constitute the main processes controlling the exchange of between the land and the atmosphere, enabling terrestrial ecosystems to mitigate anthropogenic emissions and promote carbon neutrality [3,5,6]. Therefore, accurately estimating GPP is crucial for assessing global carbon cycle dynamics, ensuring the robustness of terrestrial ecosystem services, and predicting future climate change.
Estimating GPP is challenging due to the lack of direct observations at local or global scales [2]. Currently, eddy covariance (EC) technique is the most widely applied method for measuring carbon exchange between terrestrial ecosystems and the atmosphere [7]. Net ecosystem exchange (NEE) obtained from EC flux towers can be partitioned into GPP and ecosystem respiration (Re), allowing indirect estimation of GPP [6,7]. However, the spatial coverage of these flux towers is limited [8]. The development of modeling approaches has substantially enhanced the flexibility and applicability of GPP estimation across temporal and spatial scales, enabling assessments beyond the limitations of site-level observations and facilitating broader and more continuous evaluations.
Existing GPP models can be broadly classified into four categories: statistical, sun-induced chlorophyll fluorescence (SIF)-based, process-based, and satellite-based approaches [2,9]. Statistical models primarily estimate GPP by establishing relationships among in situ flux observations, satellite remote sensing data, and climate variables, such as the near-infrared reflectance of vegetation () multiplied by incoming sunlight () and the kernel normalized difference vegetation index (kNDVI) [9,10,11]. Although these models can directly reveal the impacts of climate change on GPP, they often lack a theoretical foundation in physiological ecology [2]. SIF-based models represent a relatively new tool for remotely estimating photosynthesis [11]. SIF is an electromagnetic signal emitted by chlorophyll a molecules when exposed to sunlight, containing information on absorbed photosynthetically active radiation (APAR) and light use efficiency (LUE), both of which are highly correlated with GPP [12,13]. However, the relationship between SIF and GPP tends to weaken under environmental stress, which may reduce model accuracy [14,15].
In recent years, both process-based and satellite-based models have been widely used for GPP estimation, offering key insights into the factors driving GPP dynamics. Process-based models simulate the underlying ecological and physiological mechanisms of plant photosynthesis and carbon assimilation. Representative examples include the Breathing Earth System Simulator (BESS) [16,17] and ORganizing Carbon and Hydrology in Dynamic EcosystEms (ORCHIDEE) [18]. The core of many such models relies on enzyme kinetics theory, most notably the Farquhar, von Caemmerer, and Berry (FvCB) model for C3 photosynthesis [19] and its modification for C4 plants [9,20]. The FvCB model is a landmark model in photosynthesis research that links photosynthetic carbon assimilation with intercellular concentration at the leaf scale, providing a theoretical basis for many process-based GPP models [19,21,22].
Satellite-based models estimate GPP by multiplying APAR by the actual LUE that converts absorbed energy into photosynthetic carbon fixation. With rapid advances of remote sensing technology and the increasing availability of satellite data products in recent decades, satellite-based GPP models have undergone extensive development [2,23]. Notable examples include the Carnegie-Ames-Stanford approach (CASA) [24], the Global Production Efficiency Model (GLO-PEM) [25], the Moderate Resolution Imaging Spectroradiometer (MODIS) GPP product (MOD17) [26,27], the Vegetation Photosynthesis Model (VPM) [28,29], the Modified Vegetation Photosynthesis Model (MVPM) [30,31], and the ecosystem light-use-efficiency (eLUE) model [32].
Given the diversity of GPP models, comparing their performance has become a research hotspot. Numerous studies have evaluated various LUE models and have reported important findings [4,30,31]. For example, Yuan et al. (2014) evaluated seven LUE models and revealed that their performance varies across plant functional types (PFT), exhibiting markedly different responses to environmental stress [4]. Most of these evaluation efforts rely on in situ estimates derived from EC flux tower observations. However, because GPP is indirectly estimated through the partitioning of NEE rather than direct measurement, a degree of uncertainty may exist. Moreover, the gap-filling procedures used to address missing flux data may also introduce additional uncertainty [2,6,33]. Such uncertainties can propagate into the evaluation of GPP models and may ultimately affect the reliability of the analysis results.
Three-dimensional (3D) simulations based on radiative transfer models (RTMs) offer an effective approach to avoiding uncertainties in validation data. Compared to one-dimensional (1D) RTMs (e.g., SAIL) that assume a horizontally homogeneous canopy structure [34], 3D RTMs (e.g., DART [35] and Rayspread [36]) can realistically represent the complex interactions and radiative transfer processes among solar radiation, the atmosphere, vegetation canopies, and land surfaces [37,38]. By more accurately depicting tree architecture and effectively capturing multiple-scattering processes, 3D RTMs are particularly suitable for evaluating forest ecosystems with pronounced spatial heterogeneity [39,40]. Although 3D RTMs provide high accuracy and controllable environmental conditions, their potential for assessing GPP models has not been fully explored [39]. Recent advances in 3D RTM techniques and computational efficiency have offered a new platform for realistically simulating and systematically evaluating the performance of GPP models.
In this study, we employed a 3D RT model, large-scale remote sensing data, and image simulation framework (LESS) [40,41], to simulate and evaluate the performance of GPP models. The specific objectives are to (1) compare the performance of GPP models with varying levels of complexity across different time scales, environmental conditions, and LAI levels through simulation experiments, (2) elucidate the underlying mechanisms responsible for the different performance among these models, and (3) analyze the driving factors influencing changes in GPP.
2. Materials and Methods
2.1. Process-Based GPP Model
The Farquhar–von Caemmerer–Berry (FvCB) model is the standard mechanistic framework describing C3 leaf net photosynthetic assimilation as a function of intercellular concentration [42]. The primary biochemical parameters of this model include the maximum rate of Rubisco carboxylation (), the electron transport rate (J), and the non-photorespiratory evolution rate . The validity of the FvCB model has been extensively corroborated, and it has been incorporated into most crop and ecosystem simulation models [21]. For detailed equations and parameter definitions, refer to Farquhar et al. (1980) [19] and related references. In this study, instantaneous photosynthetic responses under different scenarios were simulated using the FvCB model integrated within LESS.
2.2. Satellite-Based GPP Models
We selected three commonly used LUE models, including MODIS GPP, VPM, and MVPM. In general, satellite-based models estimate GPP in the following form [2]:
where PAR, FPAR, and are downward photosynthetically active radiation, the fraction of PAR absorbed by the plant canopy, actual LUE, and the theoretical maximum LUE, respectively. is a function of environmental conditions that quantifies the impact of climatic factors such as temperature and vapor pressure deficit on LUE. APAR is the product of PAR and FPAR. In this study, APAR derived from LESS simulations was used as the APAR input required by the MOD17 model.
The Moderate Resolution Imaging Spectroradiometer (MODIS) GPP product (MOD17), developed by Running et al. (2004) [27], can estimate daily and annual total GPP and net primary production (NPP). The in the MOD17 model is calculated as:
where and are environmental stress factors influenced by the daily minimum air temperature () and , respectively. is the daily minimum temperature at which , is the daily minimum temperature at which , is the daylight average vapor pressure deficit at which , and is the daylight average vapor pressure deficit at which . The values of , , , , and are extracted from the Biome Properties Look-Up Table (BPLUT), with distinct values assigned to different vegetation types [43]. The corresponding values used in this study are provided in Table A1 of Appendix A.
The Vegetation Photosynthesis Model (VPM) [28] assumes that vegetation canopies are composed of photosynthetically active vegetation (PAV, mostly green leaves) and non-photosynthetically active vegetation (NPV, mostly senescent foliage, branches, and stems). The VPM has been used to estimate GPP in different ecosystems, such as evergreen needleleaf forests [28] and temperate deciduous forests [29]. The in the VPM is calculated as:
where is a scalar that represents the effects of temperature () on . , , and are the minimum, maximum, and optimal temperatures for photosynthetic activities, respectively. For evergreen needleleaf forests, we use 0 °C, 40 °Cand 20 °C for , , and [28]. quantifies the effect of water on plant photosynthesis and is calculated using the land surface water index (LSWI). is the maximum LSWI within the plant-growing season. represents the effect of leaf age on photosynthesis at the canopy level. In this study, we selected the maximum LSWI during the effective photosynthetic period of the simulated day as , and was set to 1 for evergreen needleleaf forests.
LSWI is calculated using near-infrared (NIR, 841–876 nm) and shortwave infrared (SWIR, 1628–1652 nm) bands of the MODIS sensor as follows:
The Modified Vegetation Photosynthesis Model (MVPM), proposed by Zhang et al. (2015), is an optimized version of the VPM [30]. Compared with the VPM, the MVPM is applicable to a broader range of ecosystem types. The in the MVPM is calculated as:
where , , and are the same as those in the VPM, and is a scalar close to in the MOD17 model. is set to 3 kPa [31].
In the VPM and MVPM, is estimated as a linear function of the enhanced vegetation index (EVI) [28,29]:
where a is a coefficient that takes a value of 1 in both models. The parameters are set as G = 2.5, = 6, = 7.5, and L = 1 [44]. In this study, narrow-band reflectance was first simulated using LESS and then integrated with the MODIS spectral response functions (SRFs) to obtain the corresponding broadband reflectance required for EVI calculation.
2.3. Three-Dimensional Forest Simulations
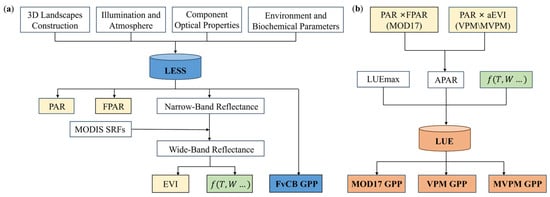
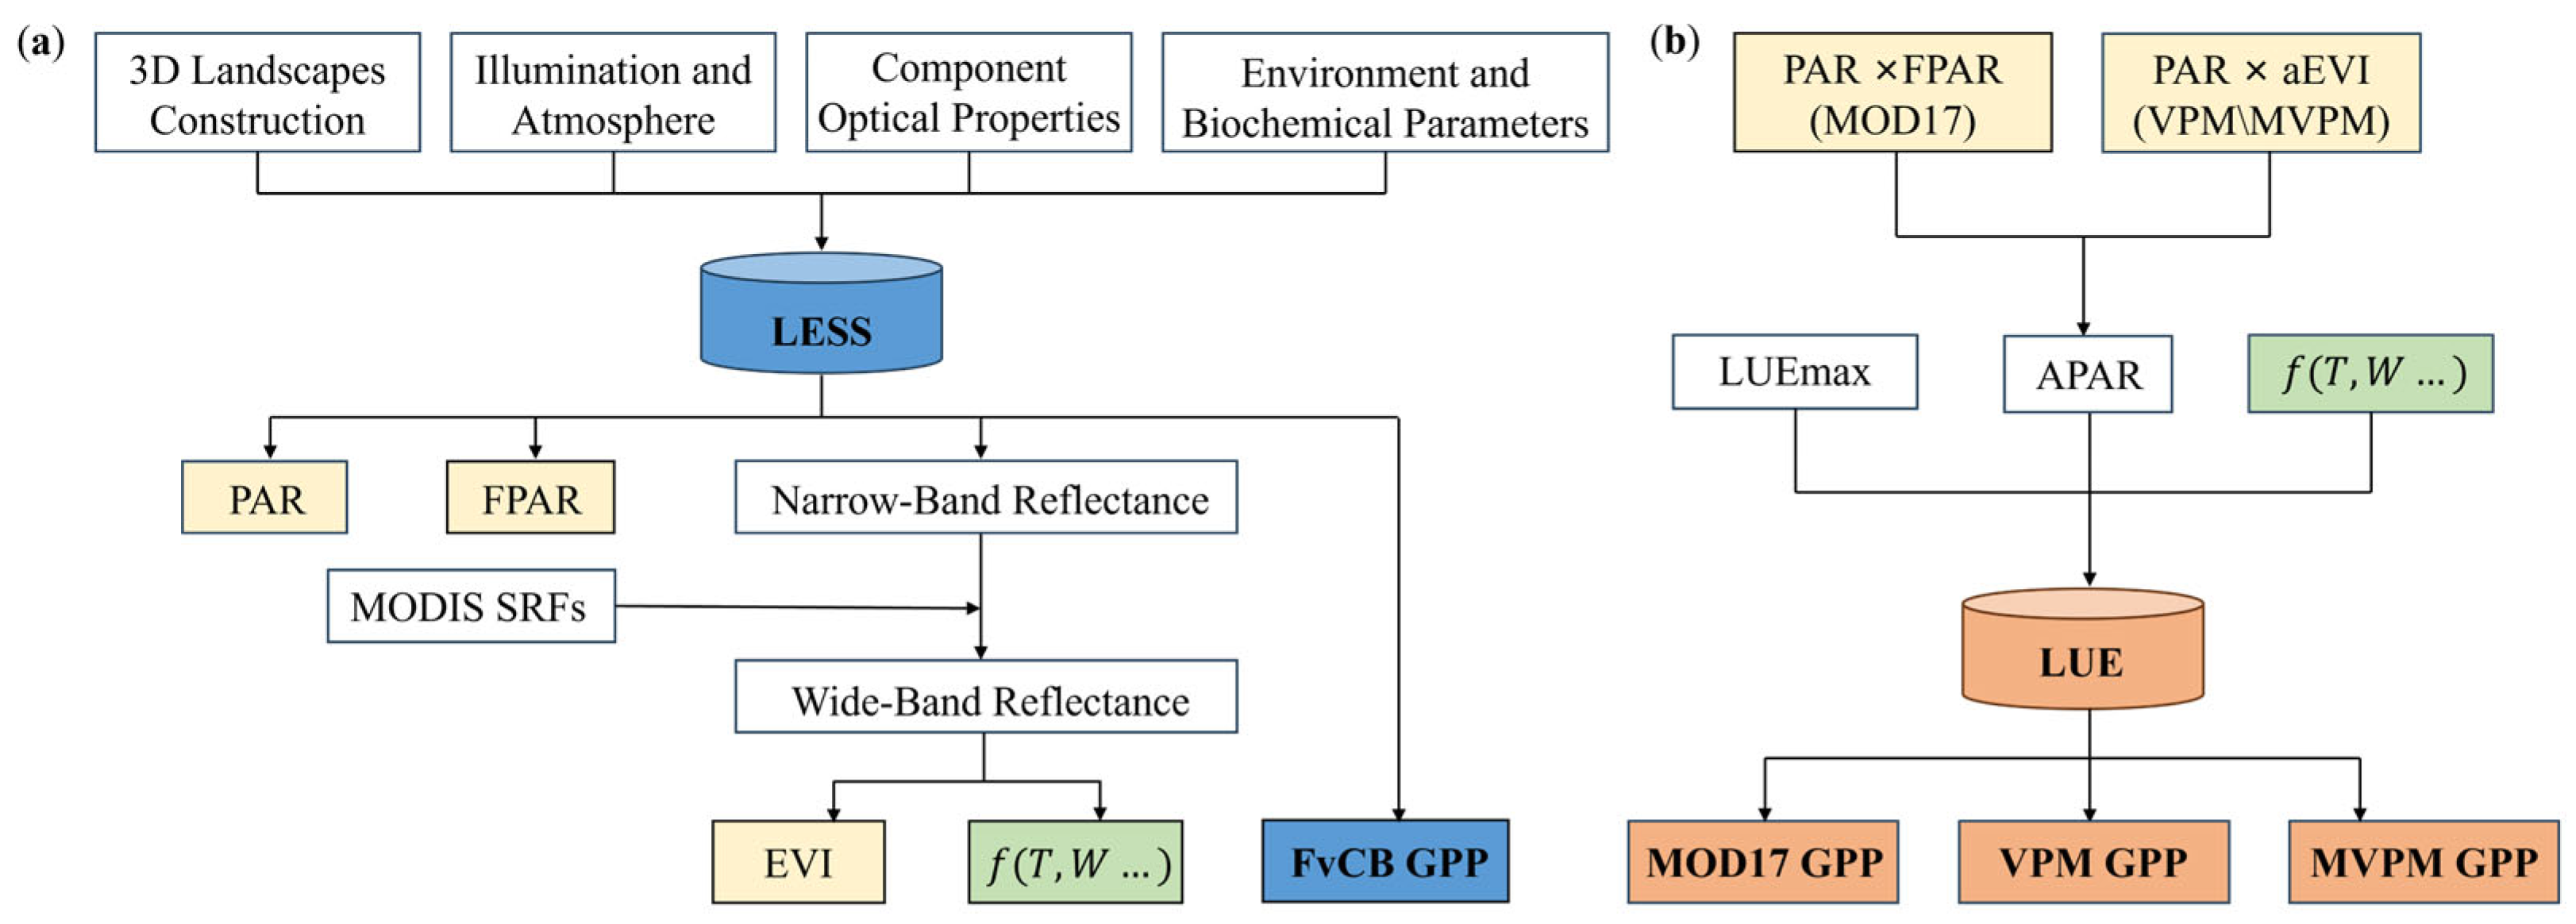
LESS is a ray-tracing-based 3D RT model that can accurately simulate multi-spectral, multi-angle images and radiation properties of complex, realistic landscapes [39,40]. Its accuracy has been well validated against ground-based observations and other models on the RAMI platform [41]. Owing to its high controllability of the environment and scene, LESS provides a robust platform for evaluating the performance of GPP models. Recently, a new module based on the FvCB model was introduced in LESS to directly simulate instantaneous net and gross photosynthesis at the canopy scale. The introduction of this module offers an excellent opportunity to evaluate the performance of GPP models with varying levels of complexity. More detailed information about LESS is available on the official website (http://lessrt.org/). The overall simulation and computation workflow of the different GPP models is shown in Figure 1.
Figure 1.
Flowchart of (a) the simulation experiments and (b) the LUE model calculations.
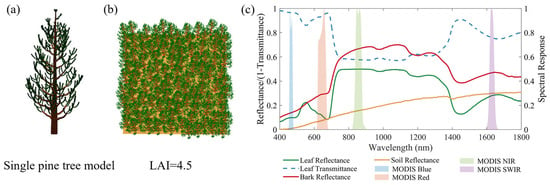
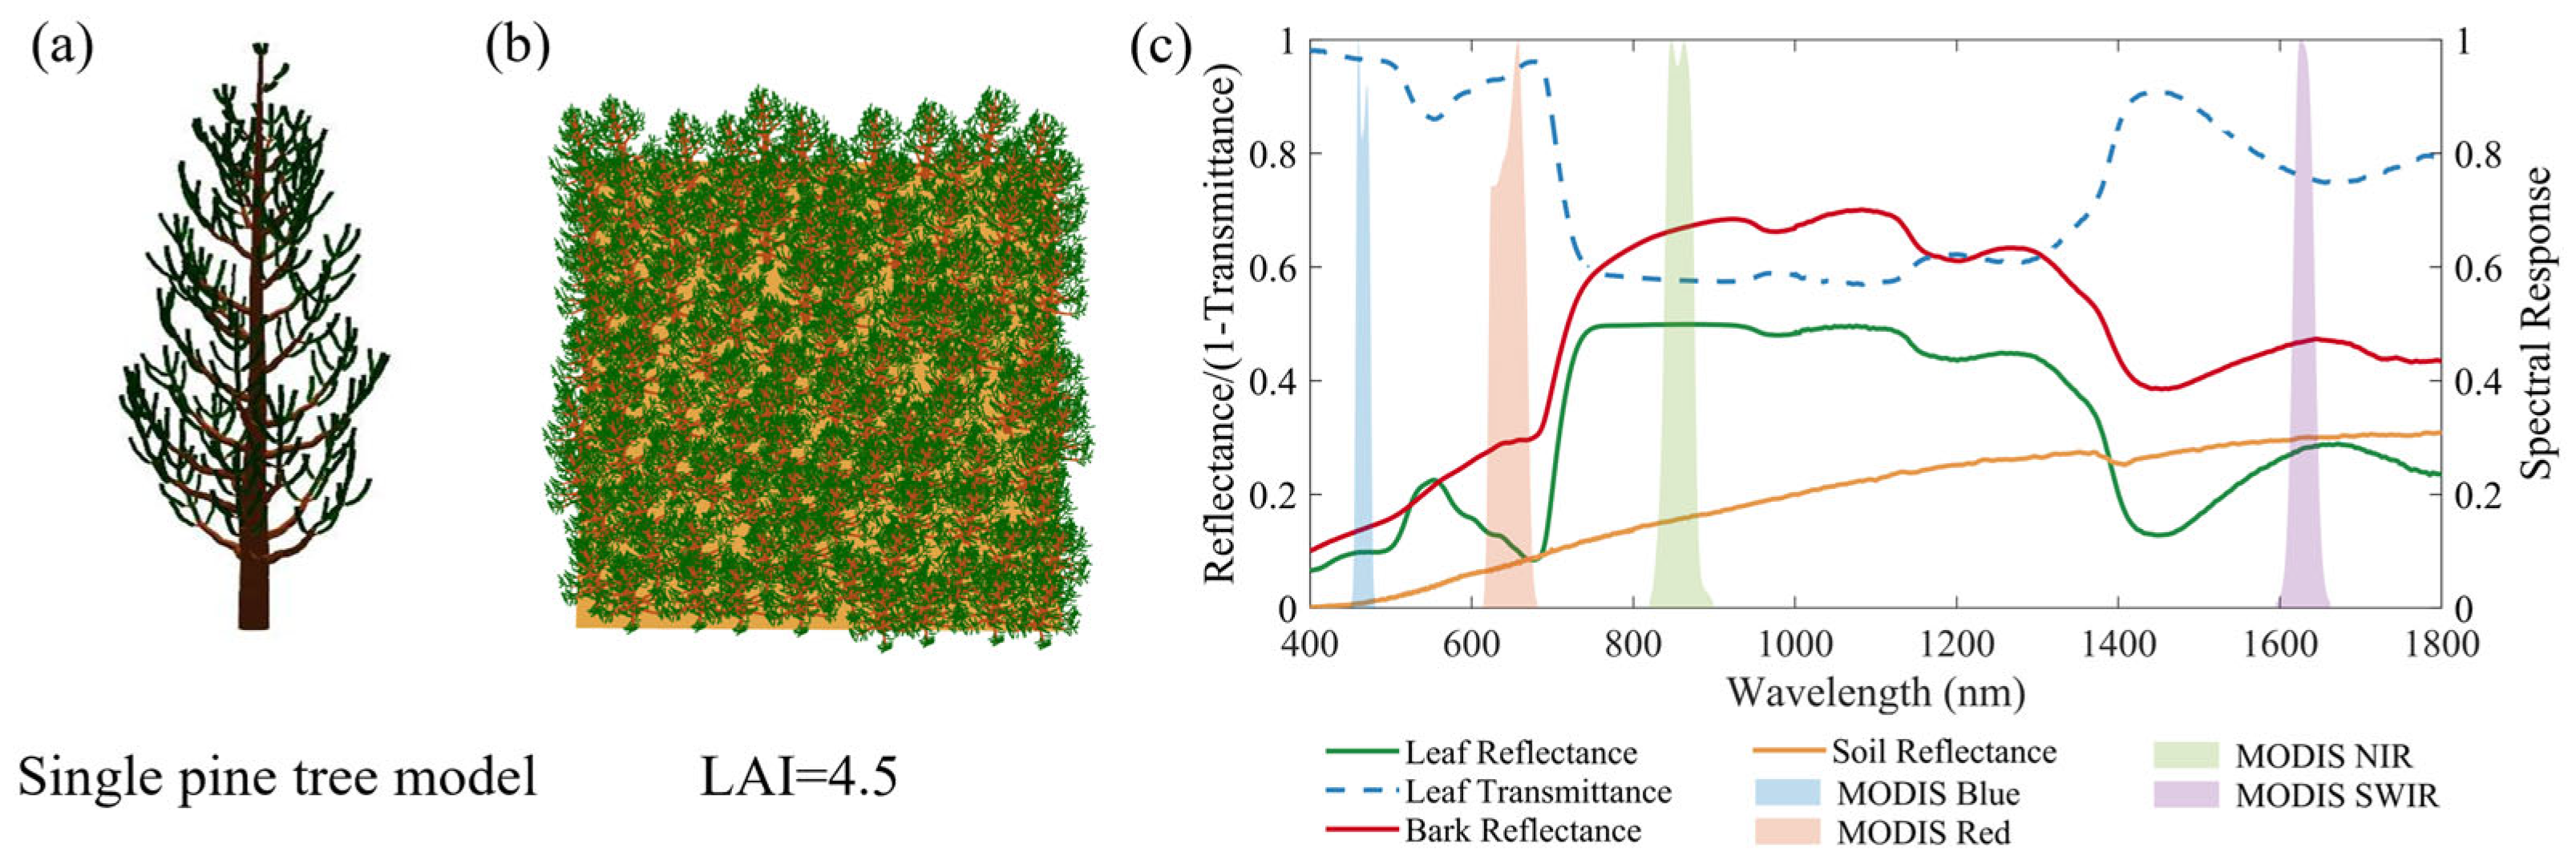
The simulation experiments were designed to compare the performance of different GPP models under varying environmental conditions. We selected the evergreen coniferous species Pinus sylvestris (abbreviated as Pine) for scenario construction. To generate realistic forest scenes, individual tree models were first built using the OnyxTREE software (v7.0) (https://www.onyxtree.com/) (Figure 2a). These models were then input into LESS to construct forest scenarios with randomly distributed LAI values ranging from 0.75 to 6.75 at intervals of 0.25 (Figure 2b). Bark and leaf spectra were obtained from a dataset consisting of multi-angular spectral libraries and auxiliary data at the tree, leaf, needle, and bark levels for three common European tree species [45] (Figure 2c). Soil spectra were selected from the soil spectral library in the ENVI software (v5.6) (https://www.nv5geospatialsoftware.com/) [39]. A total of 40 soil spectra were ranked from the brightest to darkest, and the mean values of the bottom 10% were used to represent dark soil in the simulation experiments (Figure 2c).
Figure 2.
Forest scenes constructed and the optical properties of leaves, bark and soil used in our experiments. (a) Individual tree model. (b) 3D forest scenes, showing a representative forest scene with LAI = 4.5. (c) Spectral characteristics of leaves, bark and soil, and the spectral response functions (SRFs) of the MODIS sensor.
Biochemical parameters of Pine were derived from Stinziano et al. (2019) [46] (e.g., maximum carboxylation rate of Rubisco at 25 °C () and dark respiration rate (Rd)). The detailed parameter values are provided in Table A2 of Appendix A. Environmental drivers were derived from August data (2001–2023) from ERA5 (temperature) [47], MERRA-2 (aerosol), and MERIT DEM (elevation) [48], extracted over an evergreen coniferous forest region in Europe. Saturation vapor pressure was computed following Alduchov et al. (1996) [49] and actual vapor pressure was obtained from the dew point temperature using the same formulation. In our simulation experiments, concentration was set to 400 ppm. Based on the long-term mean and standard deviation (SD), we defined five scenarios to compare model performance under environmental stress: baseline (Normal), moderate, and severe temperature stress (T + 1SD, T + 2SD), and moderate, and severe vapor pressure deficit stress (VP − 1SD, VP − 2SD). The detailed values are listed in Table A3 of Appendix A. When temperature stress scenarios were applied, vapor pressure deficit was held constant at its long-term mean; conversely, temperature was kept constant during vapor pressure deficit stress scenarios. Band reflectance for index calculation was obtained by integrating LESS-simulated narrowband reflectance with the MODIS spectral response functions (SRFs) (Figure 2c).
3. Results
3.1. Model Performance at the Instantaneous Scale
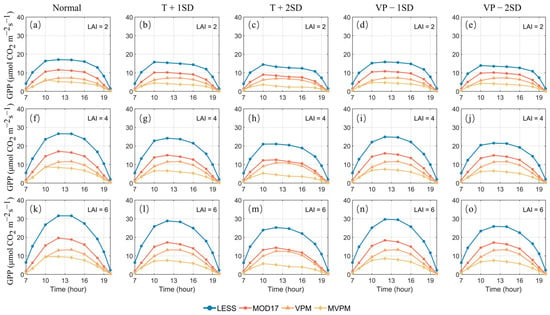
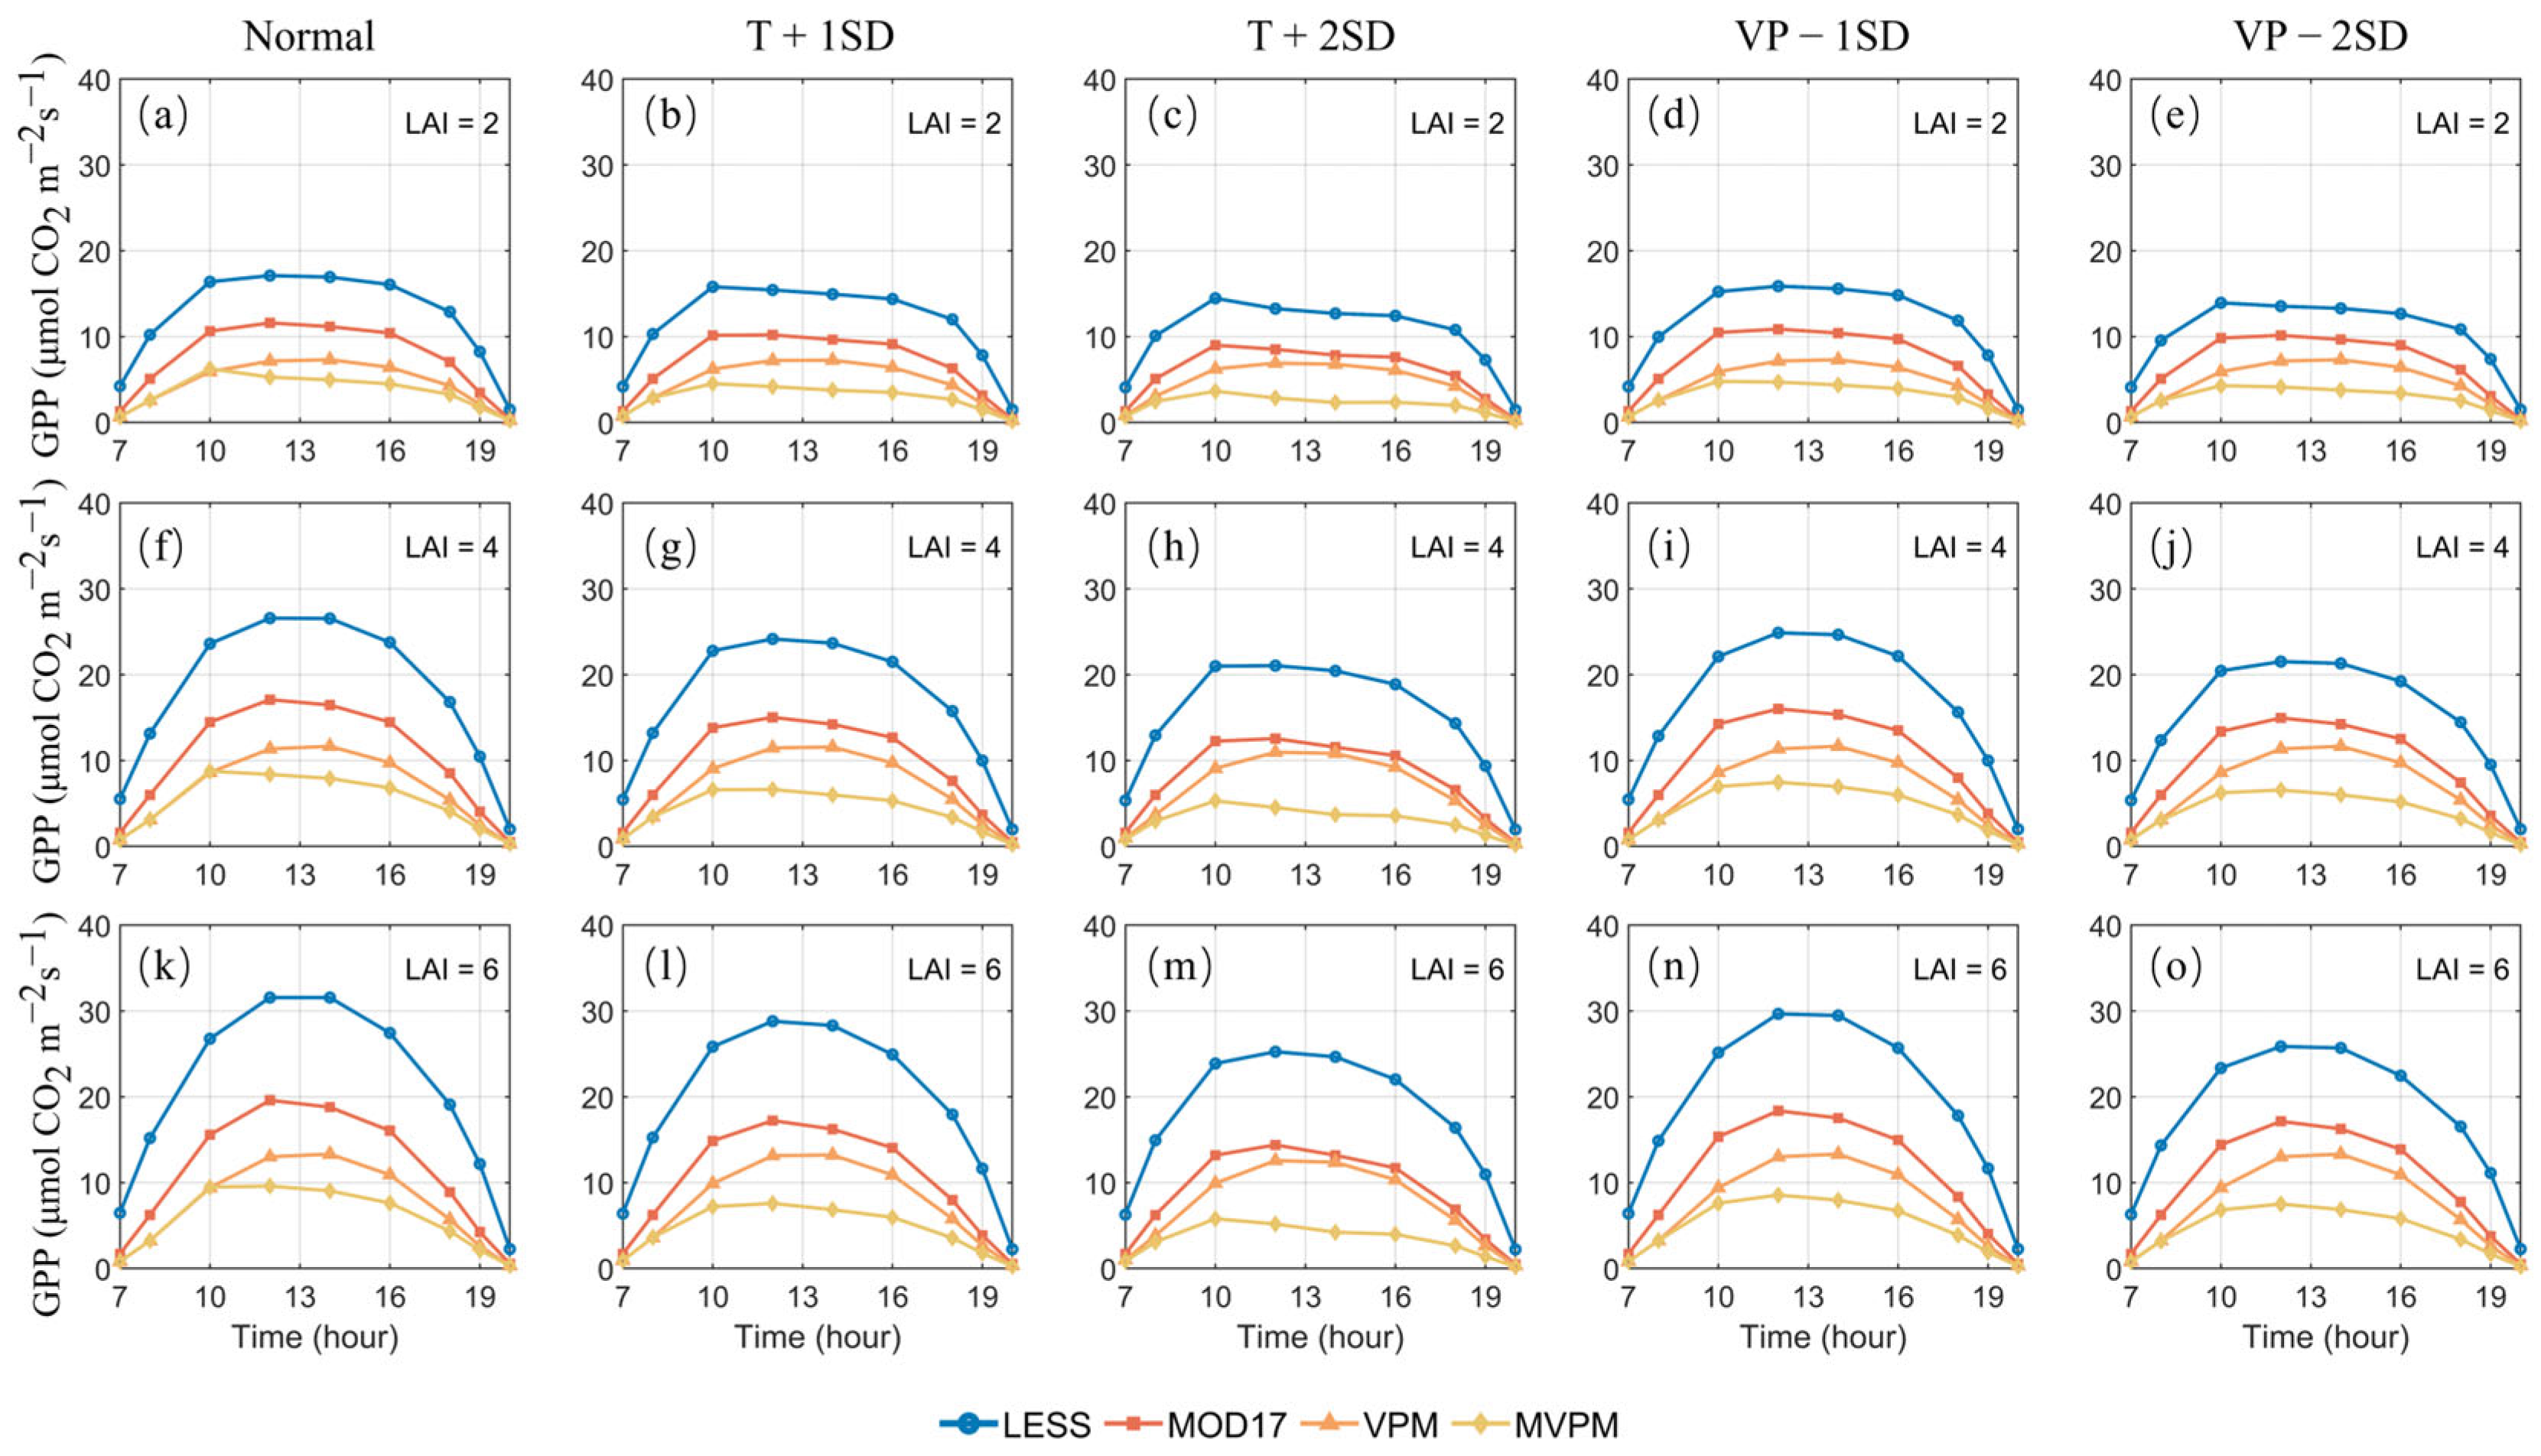
To assess model performance throughout the day, we compared the simulated instantaneous GPP of the four models. Figure 3 illustrates distinct differences in the daytime GPP patterns of the four models across scenarios, influenced by both environmental conditions and LAI levels. Overall, the process-based FvCB model produced higher estimates than the three LUE models, and the difference between the two model categories became more pronounced as LAI increased. The VPM and MVPMs showed similar results in the morning but exhibited significant differences at midday. Under T + 2SD conditions, the VPM estimates were close to those of MOD17, while the MVPM consistently produced lower GPP estimates. Under severe temperature stress, the GPP simulated by the MOD17 and MVPMs exhibited a midday decline, and the FvCB model showed a similar pattern under low LAI conditions, whereas no obvious decline was observed in the VPM. In addition, under the same environmental conditions, the daytime variation in GPP increases with increasing LAI. These instantaneous discrepancies may accumulate over time, potentially leading to notable differences in GPP estimates at daily, monthly, and even annual scales.
Figure 3.
Instantaneous GPP variations during the daytime under five environmental conditions and different LAI levels. Columns represent environmental scenarios, and rows correspond to LAI levels (2, 4, and 6). (a–o) show the temporal variations in instantaneous GPP of the canopy under the corresponding conditions.
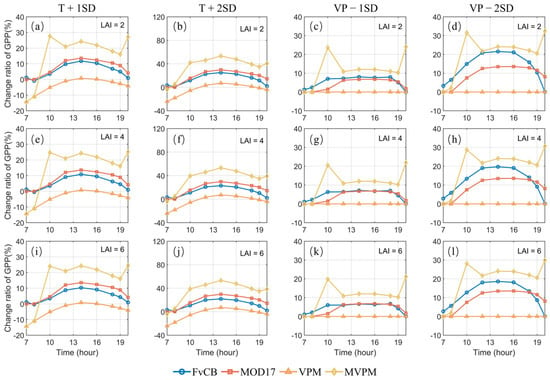
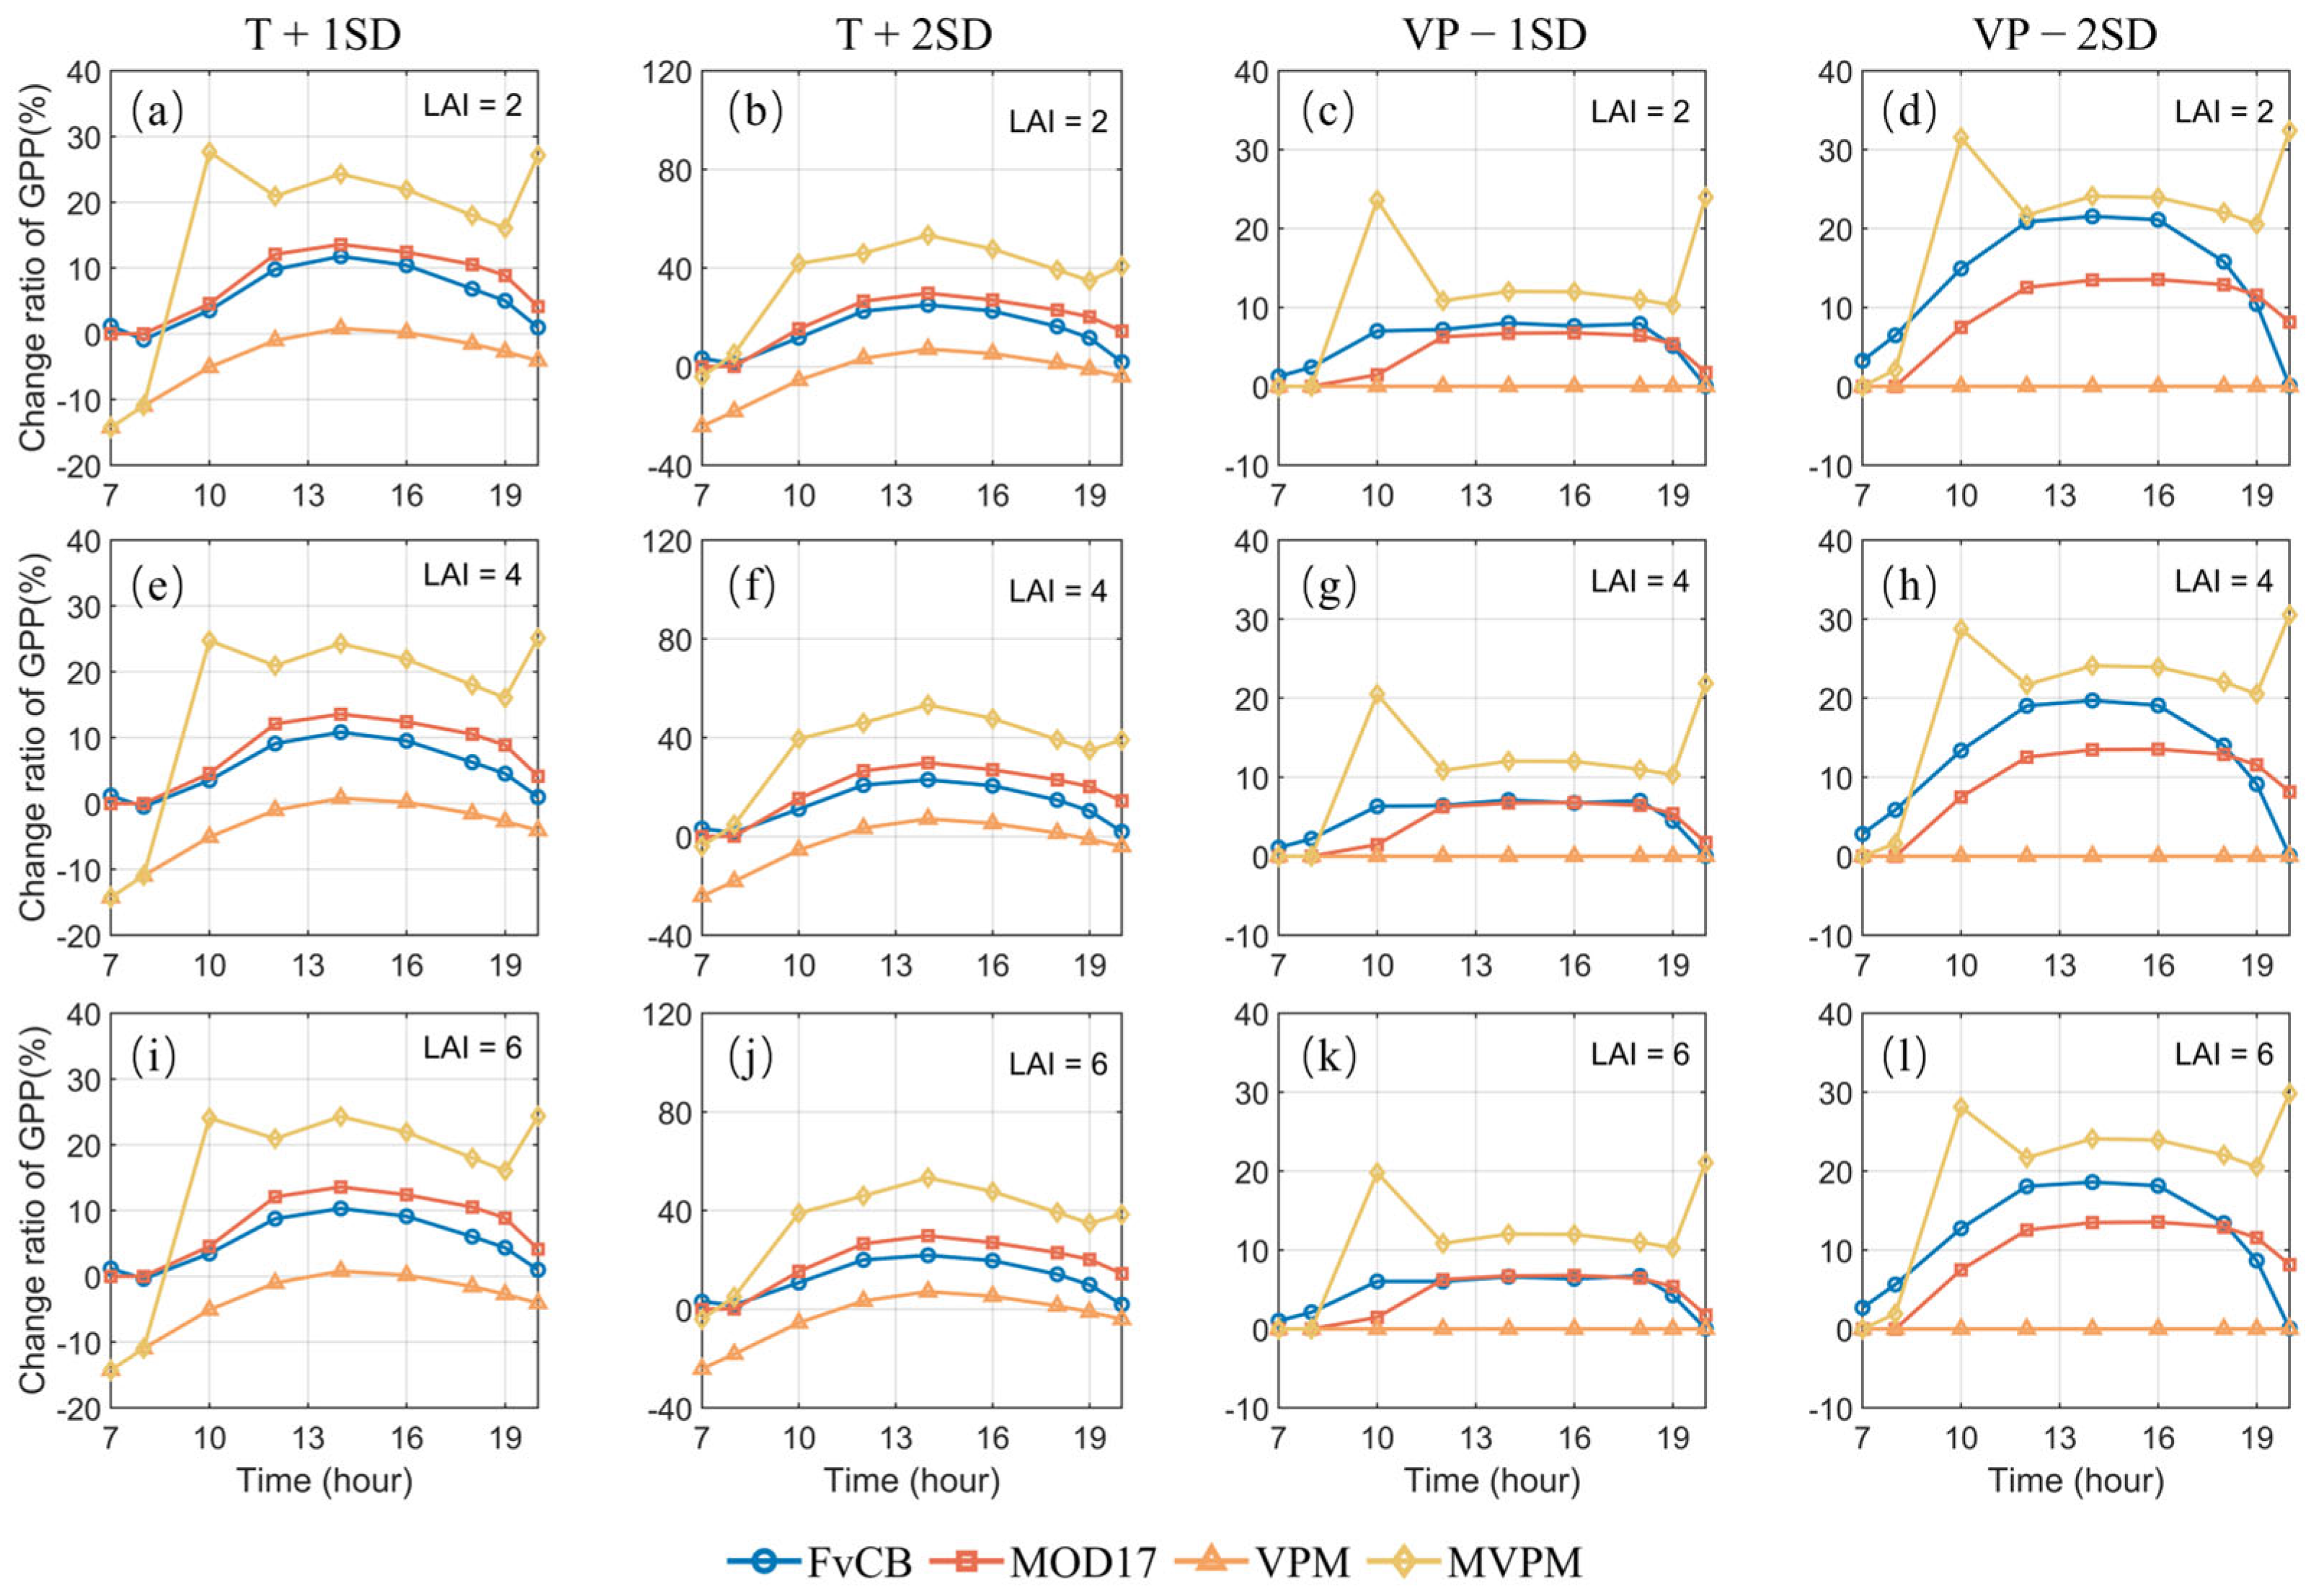
The relative change in GPP was calculated to quantify the sensitivity of the models to environmental changes. The results show that the four models exhibit different sensitivities at the instantaneous scale (Figure 4). Overall, the MVPM showed the highest sensitivity; under the T + 2SD condition, the GPP change ratio reached up to 53.27%. The sensitivity curves of the FvCB and MOD17 models were generally similar; however, a relatively large difference was observed under the VP − 2SD scenario when LAI = 2, with a maximum difference of 8.31%. For the VPM, the estimated GPP increased with rising temperature in the morning and evening, with the maximum change ratio reaching 24.17% in the morning, whereas the estimates at midday were lower than those under normal conditions. Compared with normal growth conditions, environmental stress generally reduced the GPP estimates of the FvCB, MOD17, and MVPMs. The sensitivities of the four models to environmental stresses did not show significant changes with increasing LAI.
Figure 4.
Relative changes in instantaneous GPP under environmental stresses compared with normal growth conditions. The change ratio was calculated as ( − )/. Positive values indicate a reduction in canopy GPP under environmental stress, whereas negative values indicate an increase. Columns represent different environmental scenarios, and rows correspond to LAI levels (2, 4, and 6). (a–l) show the temporal variations in the relative changes of instantaneous canopy GPP under the corresponding stresses conditions.
3.2. Model Performance at the Daily Scale
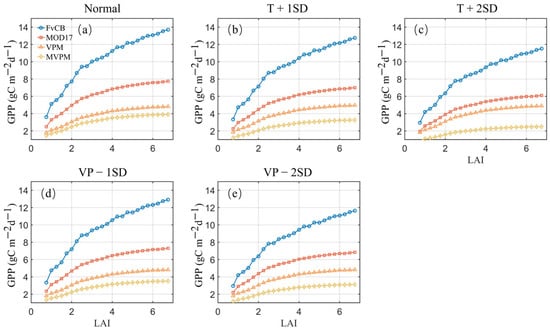
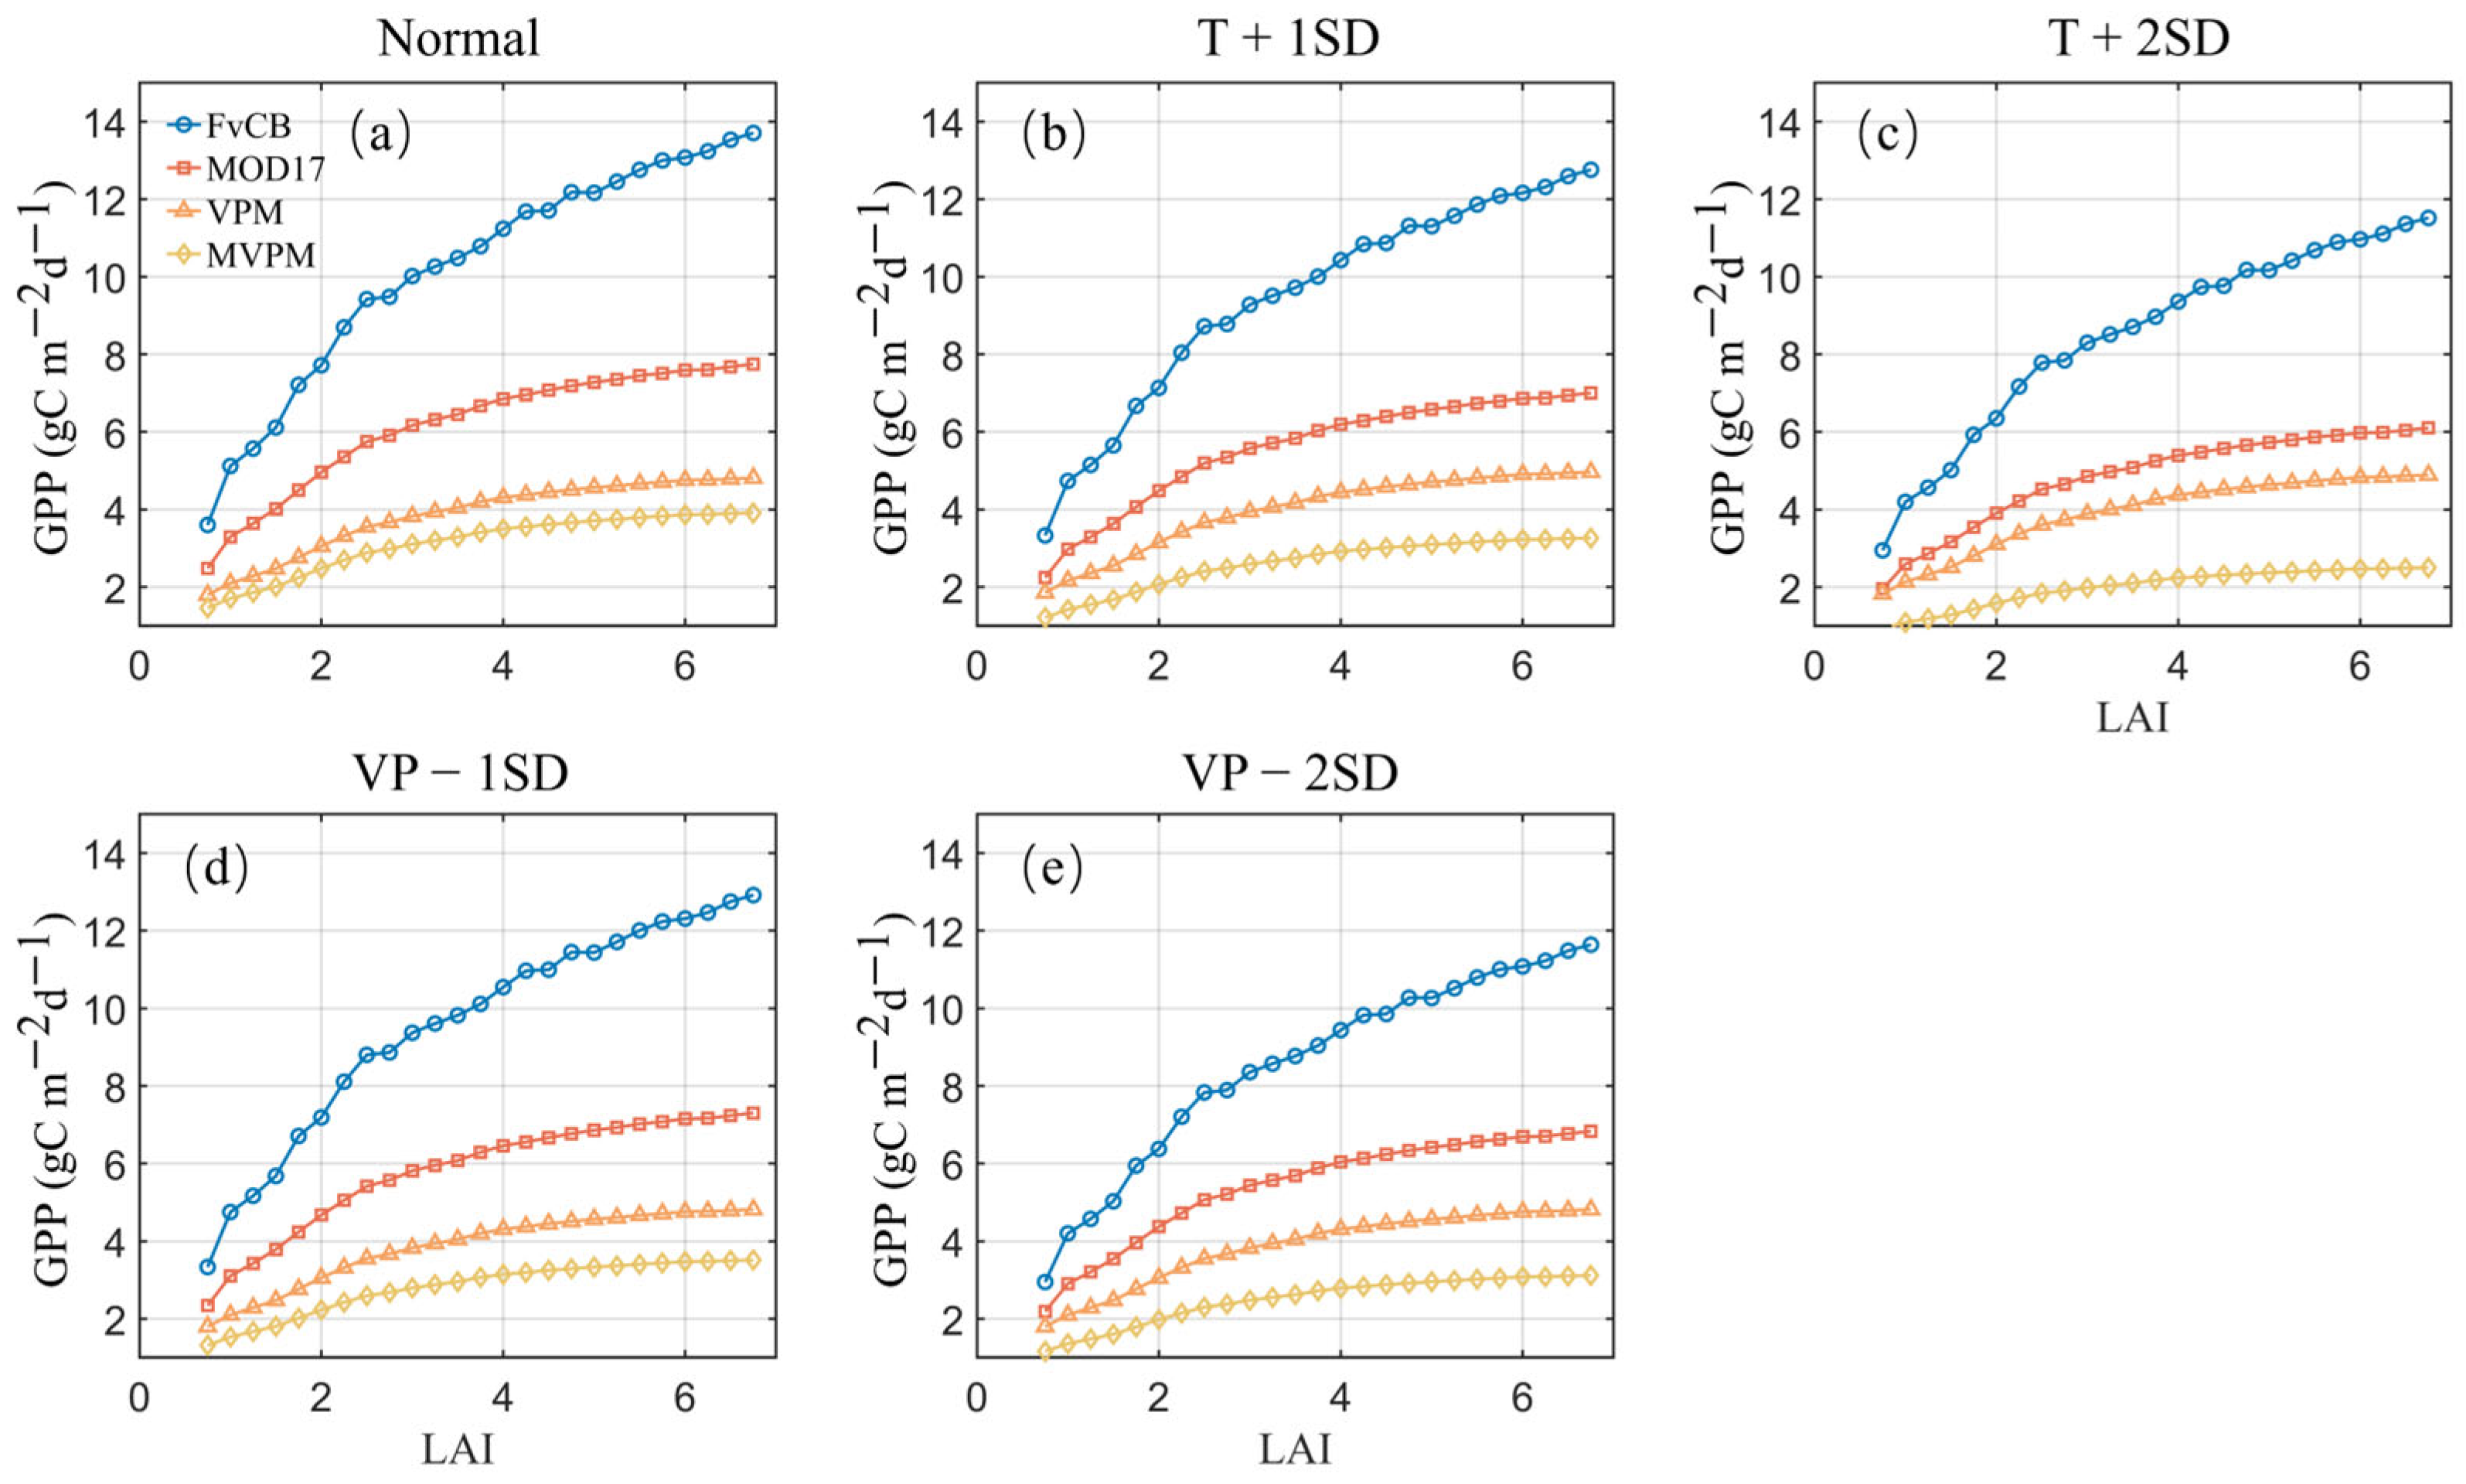
Daily GPP estimates were obtained by integrating instantaneous results over the simulated photosynthetic period. Figure 5 shows the variations in daily GPP with LAI simulated by the four models. The results indicate that the three satellite-based LUE models exhibited a pattern in which GPP increased with LAI and then gradually approached saturation. Notably, the daily GPP simulated by the process-based FvCB model was markedly higher than that of the other models, and this difference became more pronounced as LAI increased. In the study by Xiao et al. (2004) [28], flux tower observations showed that the daily GPP of evergreen coniferous forests in August ranged between 6.5 and 10 when LAI reached 5.3. In our results, the estimate from the MOD17 model fell within this range, whereas the FvCB model produced higher values and the VPM and MVPMs yielded lower values.
Figure 5.
Relationship between daily GPP and LAI. Panels (a–e) correspond to five environmental conditions.
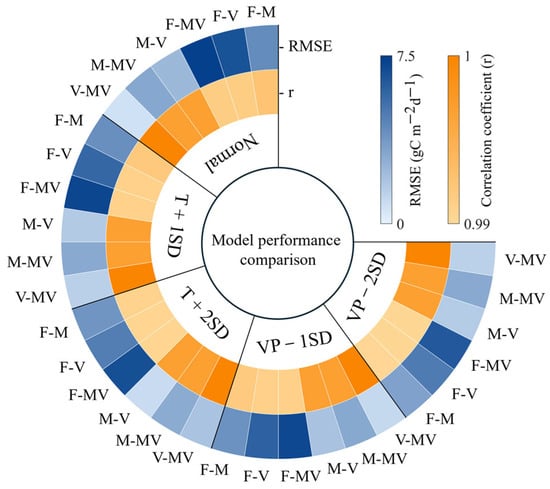
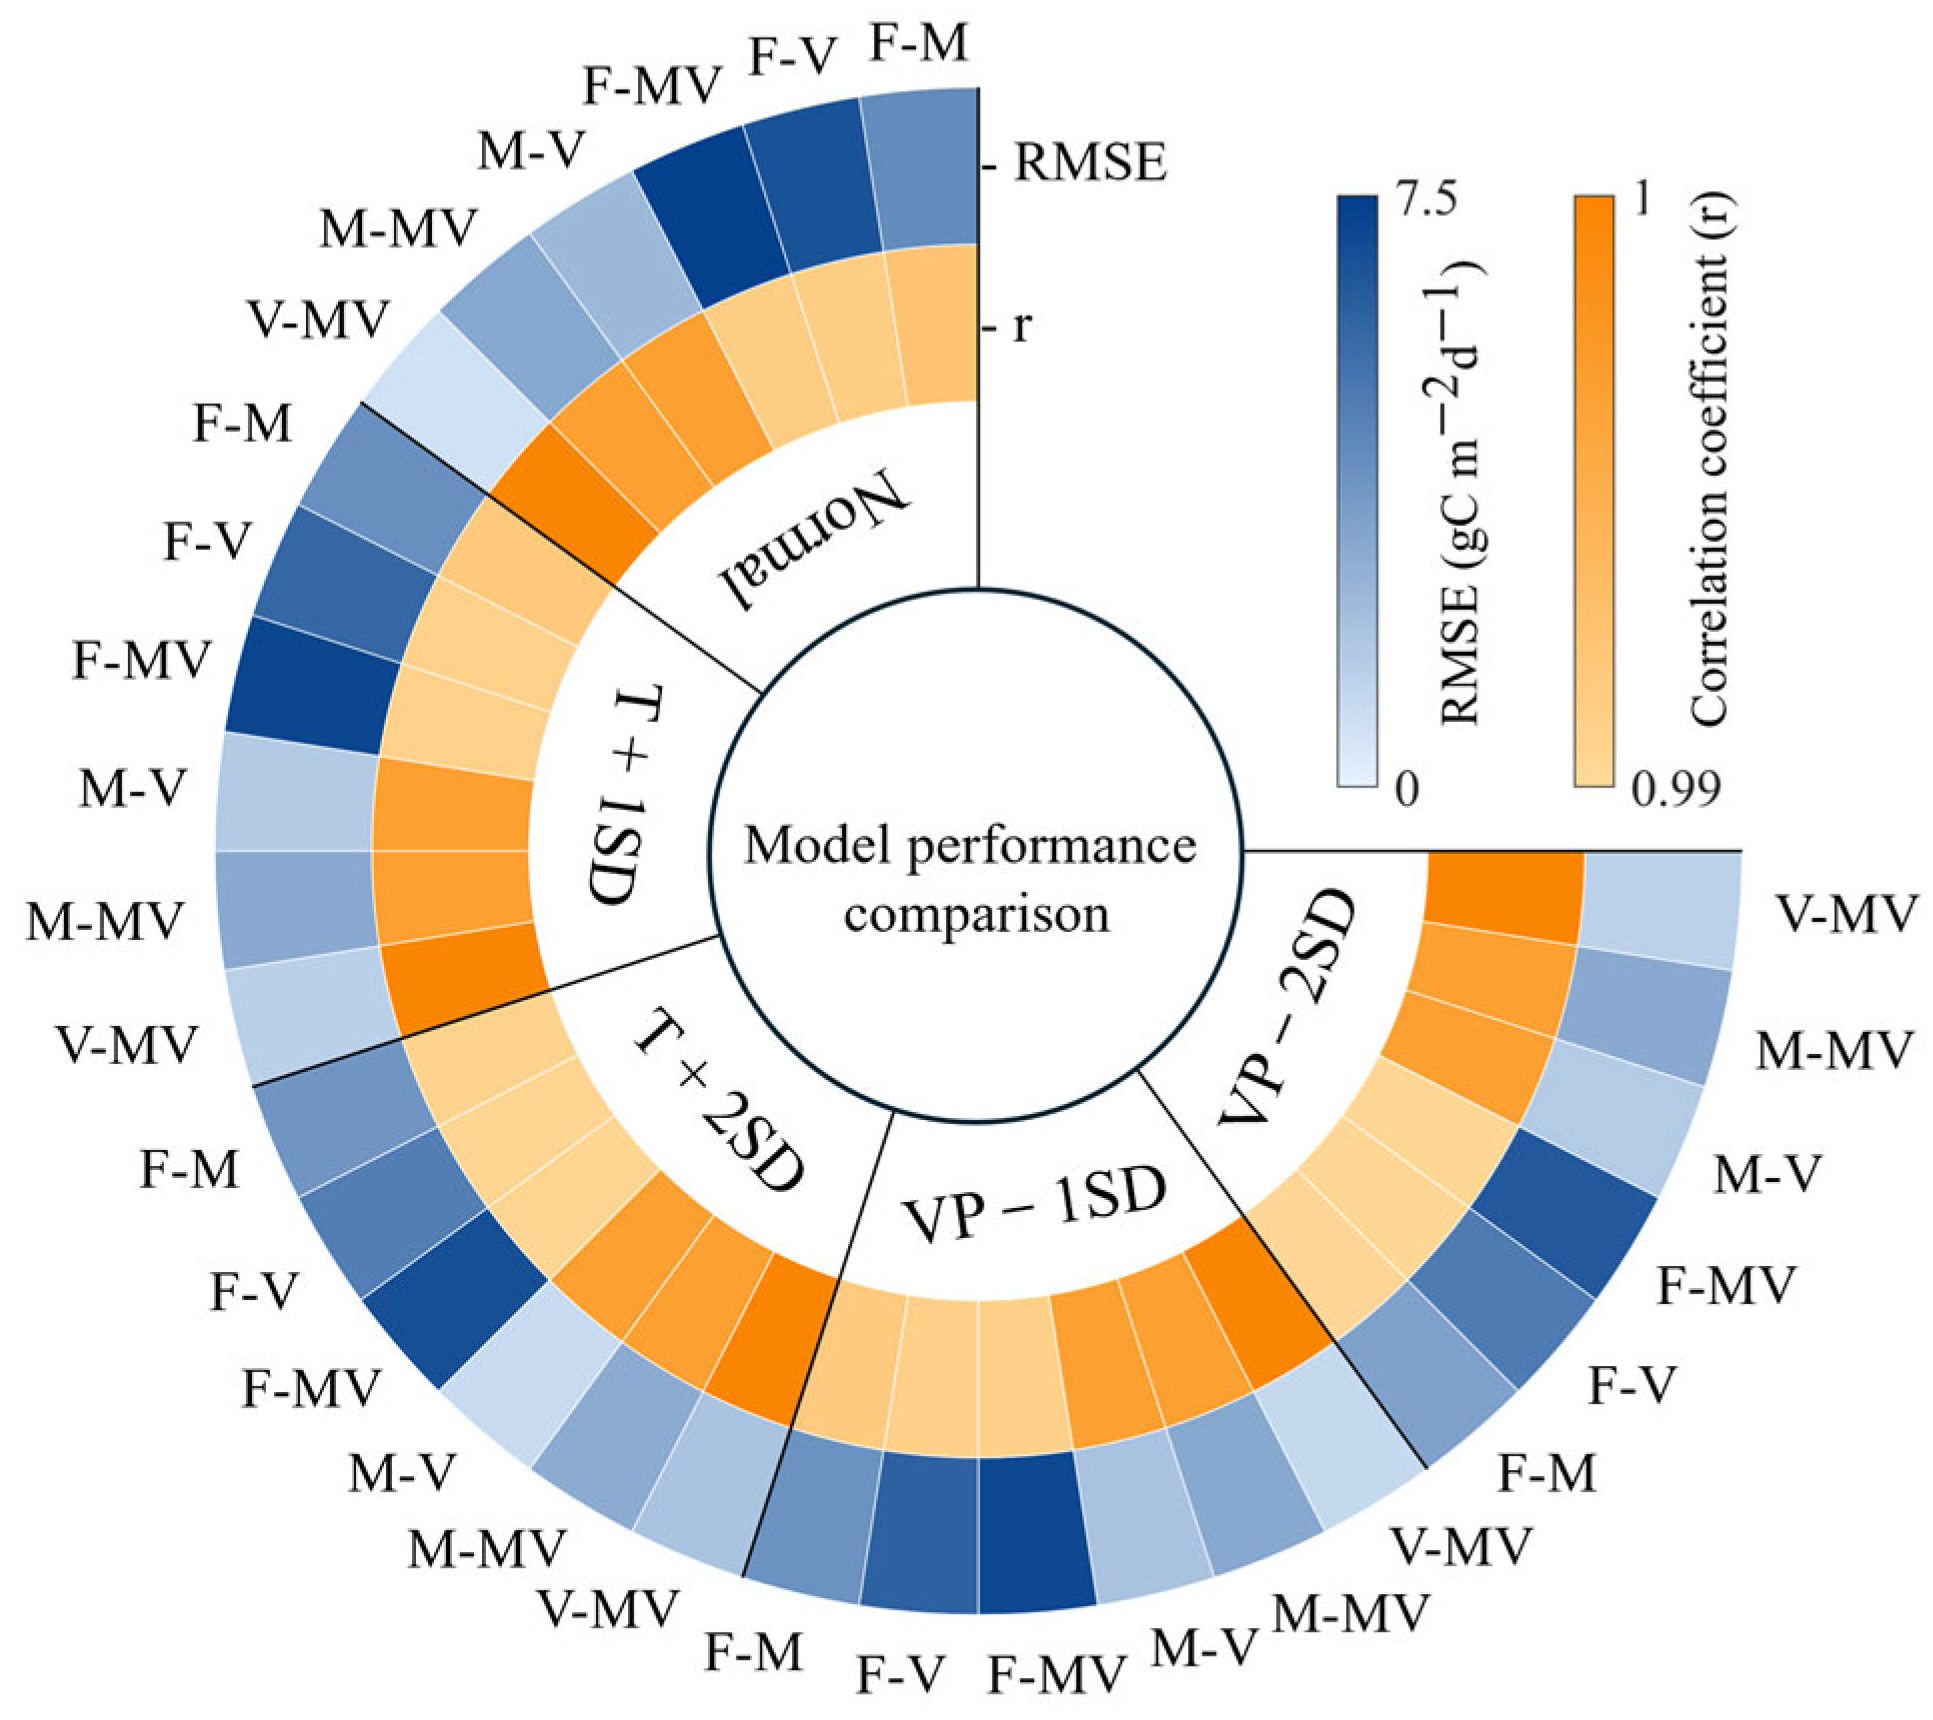
To further characterize the relationships in model behavior, pairwise correlation coefficients (r) and root mean square errors (RMSEs) were calculated among the four models. Figure 6 illustrates the correlations among the four GPP models at the daily scale. Overall, the models exhibited strong correlations with each other, with correlation coefficients generally exceeding 0.99. The FvCB-MVPM pair exhibited the largest RMSE, with even the minimum value reaching 6.35 . In contrast, the VPM-MVPM pair showed the smallest RMSE, with the maximum value being only 1.97
Figure 6.
Comparison of the performance of four GPP models under five environmental conditions. The orange and blue rings represent the correlation coefficient (r) and the root mean square error (RMSE) between model pairs, respectively. Darker colors indicate higher correlation coefficients or larger RMSE values. The unit of RMSE is . F, M, V, and MV denote the FvCB, MOD17, VPM, and MVPMs, respectively.
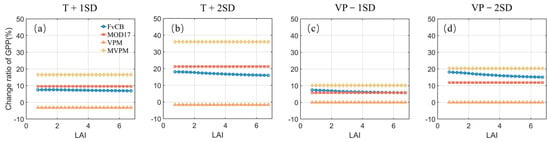
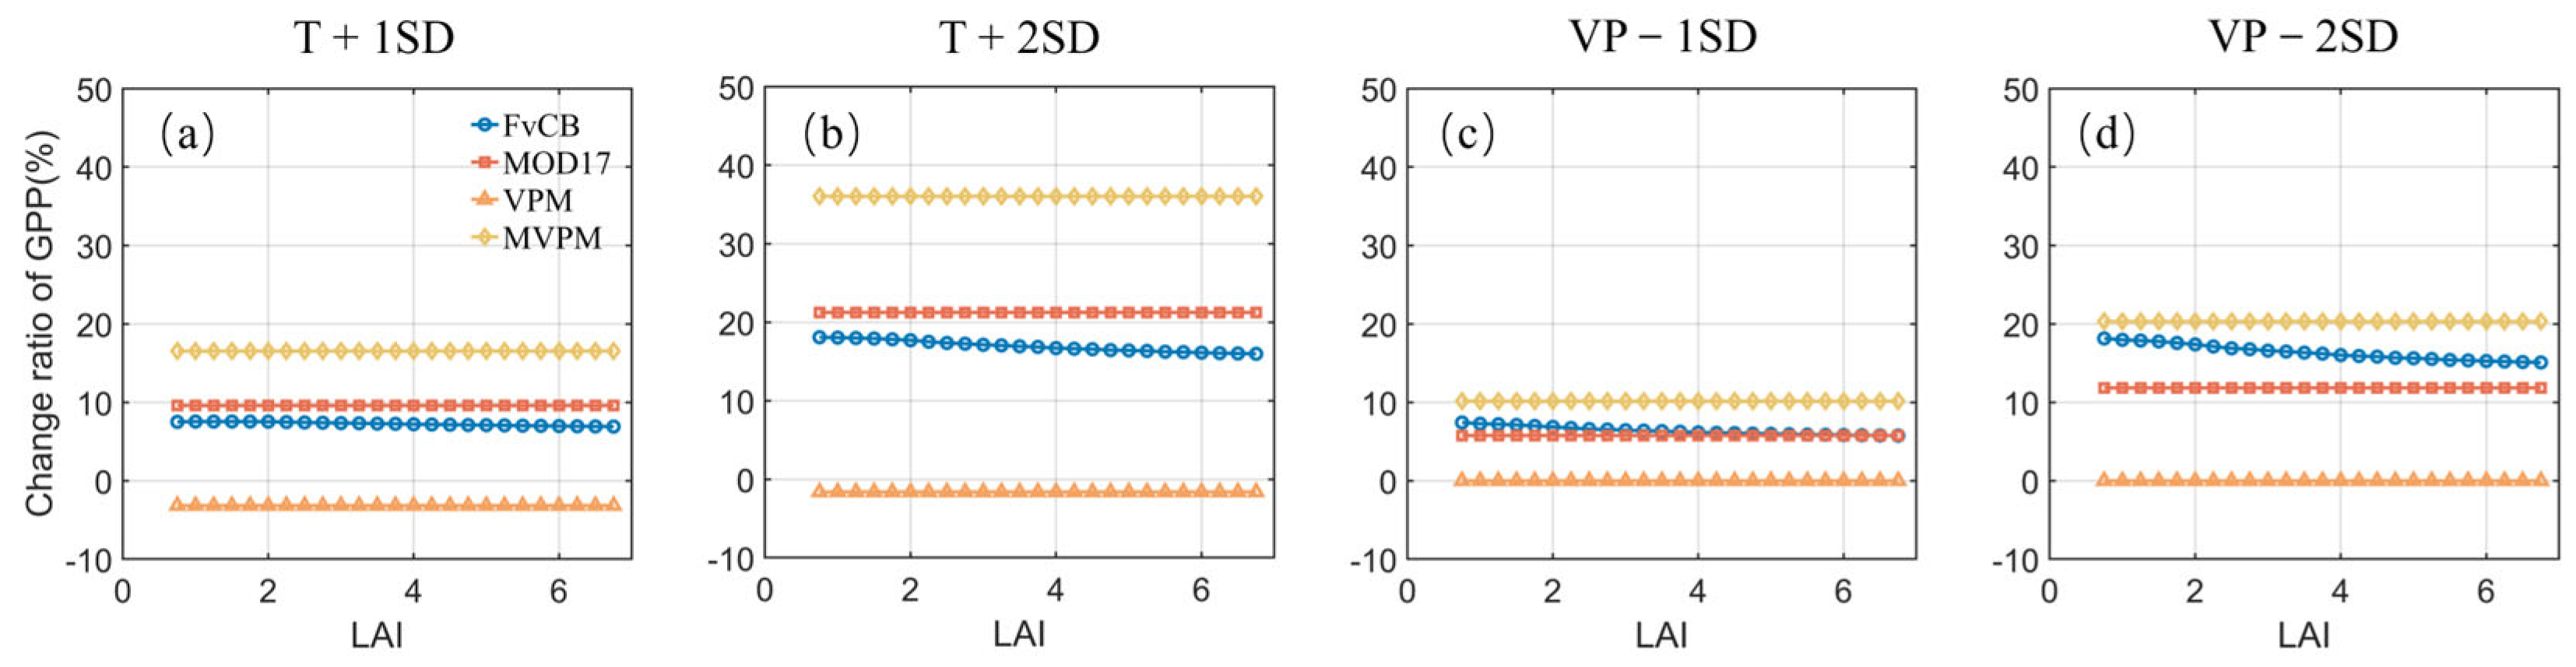
Similarly to the results at the instantaneous scale, differences were also observed among the models in their sensitivity to environmental factors at the daily scale (Figure 7). The occurrence and intensification of high-temperature and water-deficit stress generally reduced the daily GPP estimated by the FvCB, MOD17, and MVPMs. This effect was particularly pronounced under the T + 2SD condition, where the MVPM showed a GPP change ratio as high as 36.04%. In contrast, the GPP estimated by the VPM under high-temperature stress was higher than that under normal conditions, while no significant change was observed under water-deficit stress. In addition, the sensitivities of the three LUE models showed little variation with increasing LAI, whereas the sensitivity of the process-based FvCB model gradually decreased as LAI increased. This trend became more pronounced under stronger stress conditions.
Figure 7.
Relative changes in daily GPP under environmental stresses compared with normal growth conditions. The change ratio was calculated as ( − )/. Positive values indicate a reduction in canopy GPP under environmental stress, whereas negative values indicate an increase. (a–d) show the relative changes in daily canopy GPP under the corresponding stress conditions across different LAI levels.
4. Discussion
4.1. Differential Responses of the Models to Environmental Stressors
Temperature and moisture regulate enzyme activity, stomatal conductance, and chlorophyll synthesis, thereby influencing carbon assimilation. They serve as primary drivers of photosynthesis, respiration, and water use efficiency [8]. Vegetation typically exhibits an optimal photosynthetic temperature range; when temperatures exceed this optimum, Rubisco activity and electron transport capacity decline, reducing carbon assimilation rates and consequently slowing photosynthetic processes [50]. Water stress primarily affects photosynthesis by regulating leaf stomatal conductance [51].
This study imposed varying levels of heat and drought stress to compare the responses of different GPP models under contrasting environmental conditions. The results demonstrate substantial differences among models in both their performance and their sensitivity to environmental stressors. Relative to normal growth conditions, the proportional change in GPP simulated by the FvCB model decreased progressively with increasing LAI, indicating that environmental stress had a smaller impact on photosynthesis in canopies with higher LAI. This pattern may be related to the complex simulation mechanism of the FvCB model, which enables it to capture differences in canopy GPP across varying vegetation densities.
The sensitivity of the VPM to environmental stress is illustrated in Figure 4. This pattern is associated with the for photosynthesis embedded in the model structure. In this experiment, the for evergreen needleleaf forest was set to 20 °C (Section 2.2), while the temperature under normal conditions was generally lower than this optimum. When heat stress occurred, the increase in morning and evening temperatures reduced the difference from the , thereby alleviating temperature limitations on leaf photosynthesis and increasing canopy GPP. In contrast, midday temperatures could exceed the , which would constrain photosynthesis.
In addition, the VPM did not exhibit a response to water stress. This is because the water scalar in the model is determined solely by LSWI (Equation (8)), and variations in vapor pressure do not influence LSWI. Compared with the VPM, the MVPM introduces a VPD constraint factor, making it more sensitive to variations in atmospheric dryness and consequently more responsive to environmental changes.
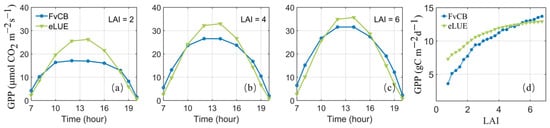
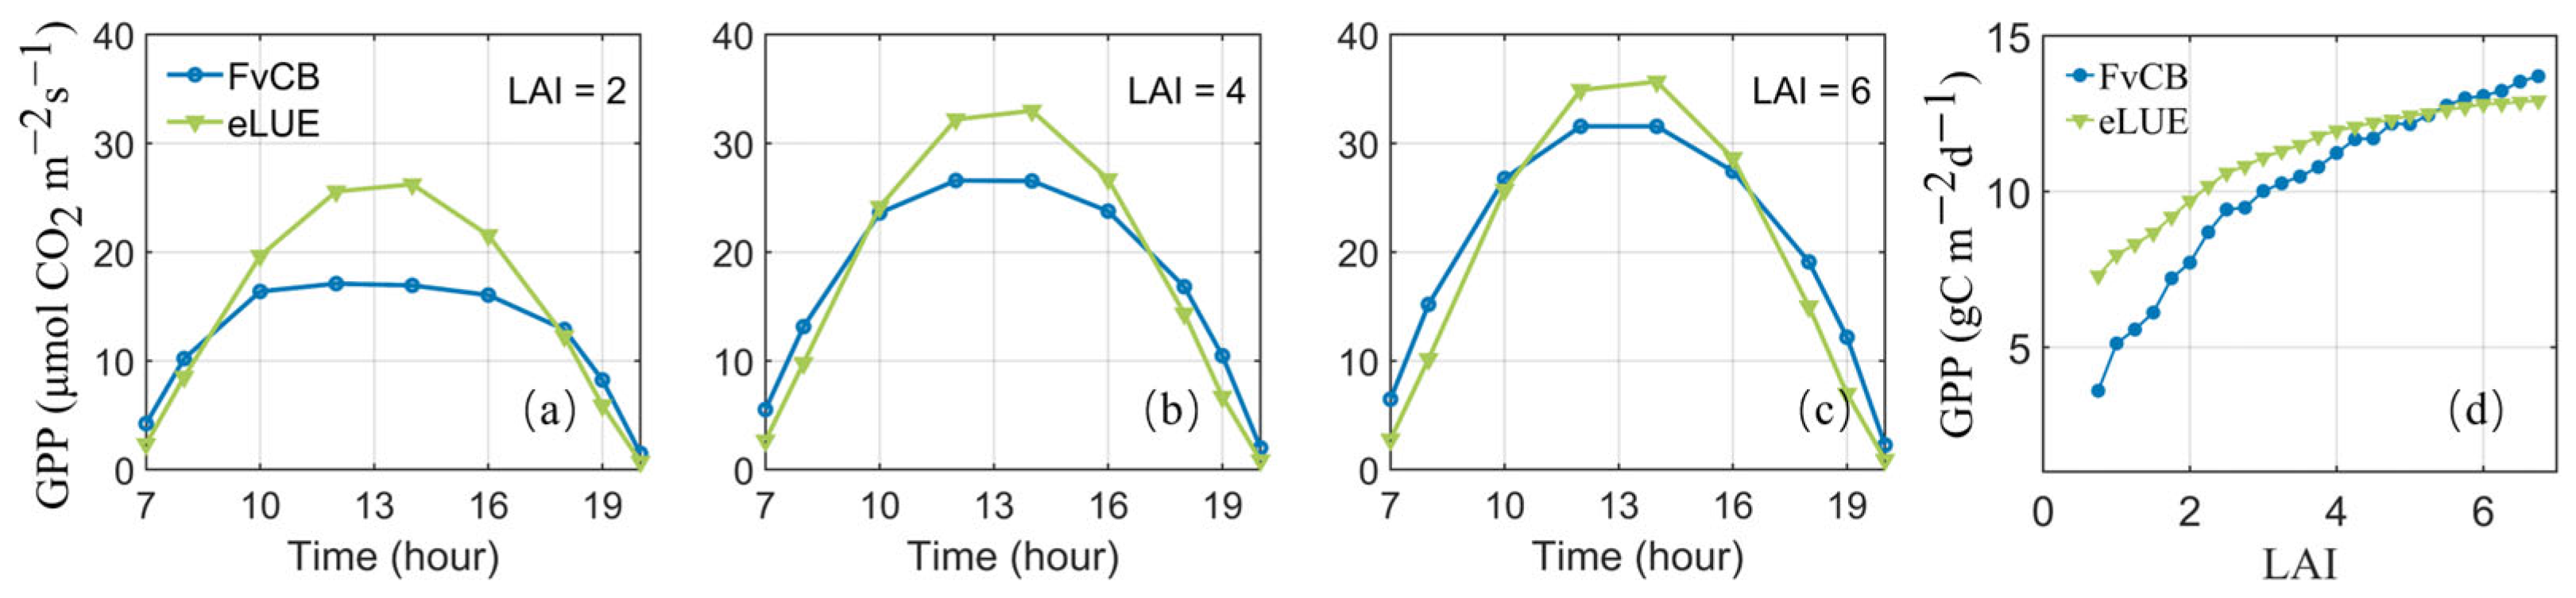
Recently, a simple and robust ecosystem light-use-efficiency (eLUE) model has been proposed. Unlike conventional LUE frameworks, this model does not require the explicit estimation of light use efficiency; instead, GPP is directly formulated as the product of eLUE and PAR, thereby reducing uncertainties introduced by meteorological inputs [32]. In this study, we compared its performance with that of the FvCB model and found strong consistency between the two models at both instantaneous and daily scales (Figure 8).
Figure 8.
Comparison of GPP simulated by the FvCB and eLUE models at both instantaneous and daily scales. Panels (a–c) show variations in GPP over the photosynthetic period at LAI = 2, 4, and 6, respectively, while panel (d) presents the relationship between daily GPP and LAI.
4.2. Effects of Light Structure on Instantaneous and Daily-Scale GPP
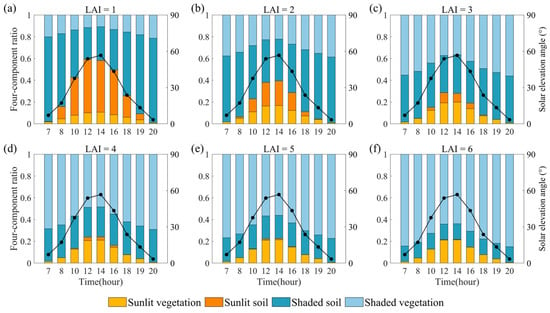
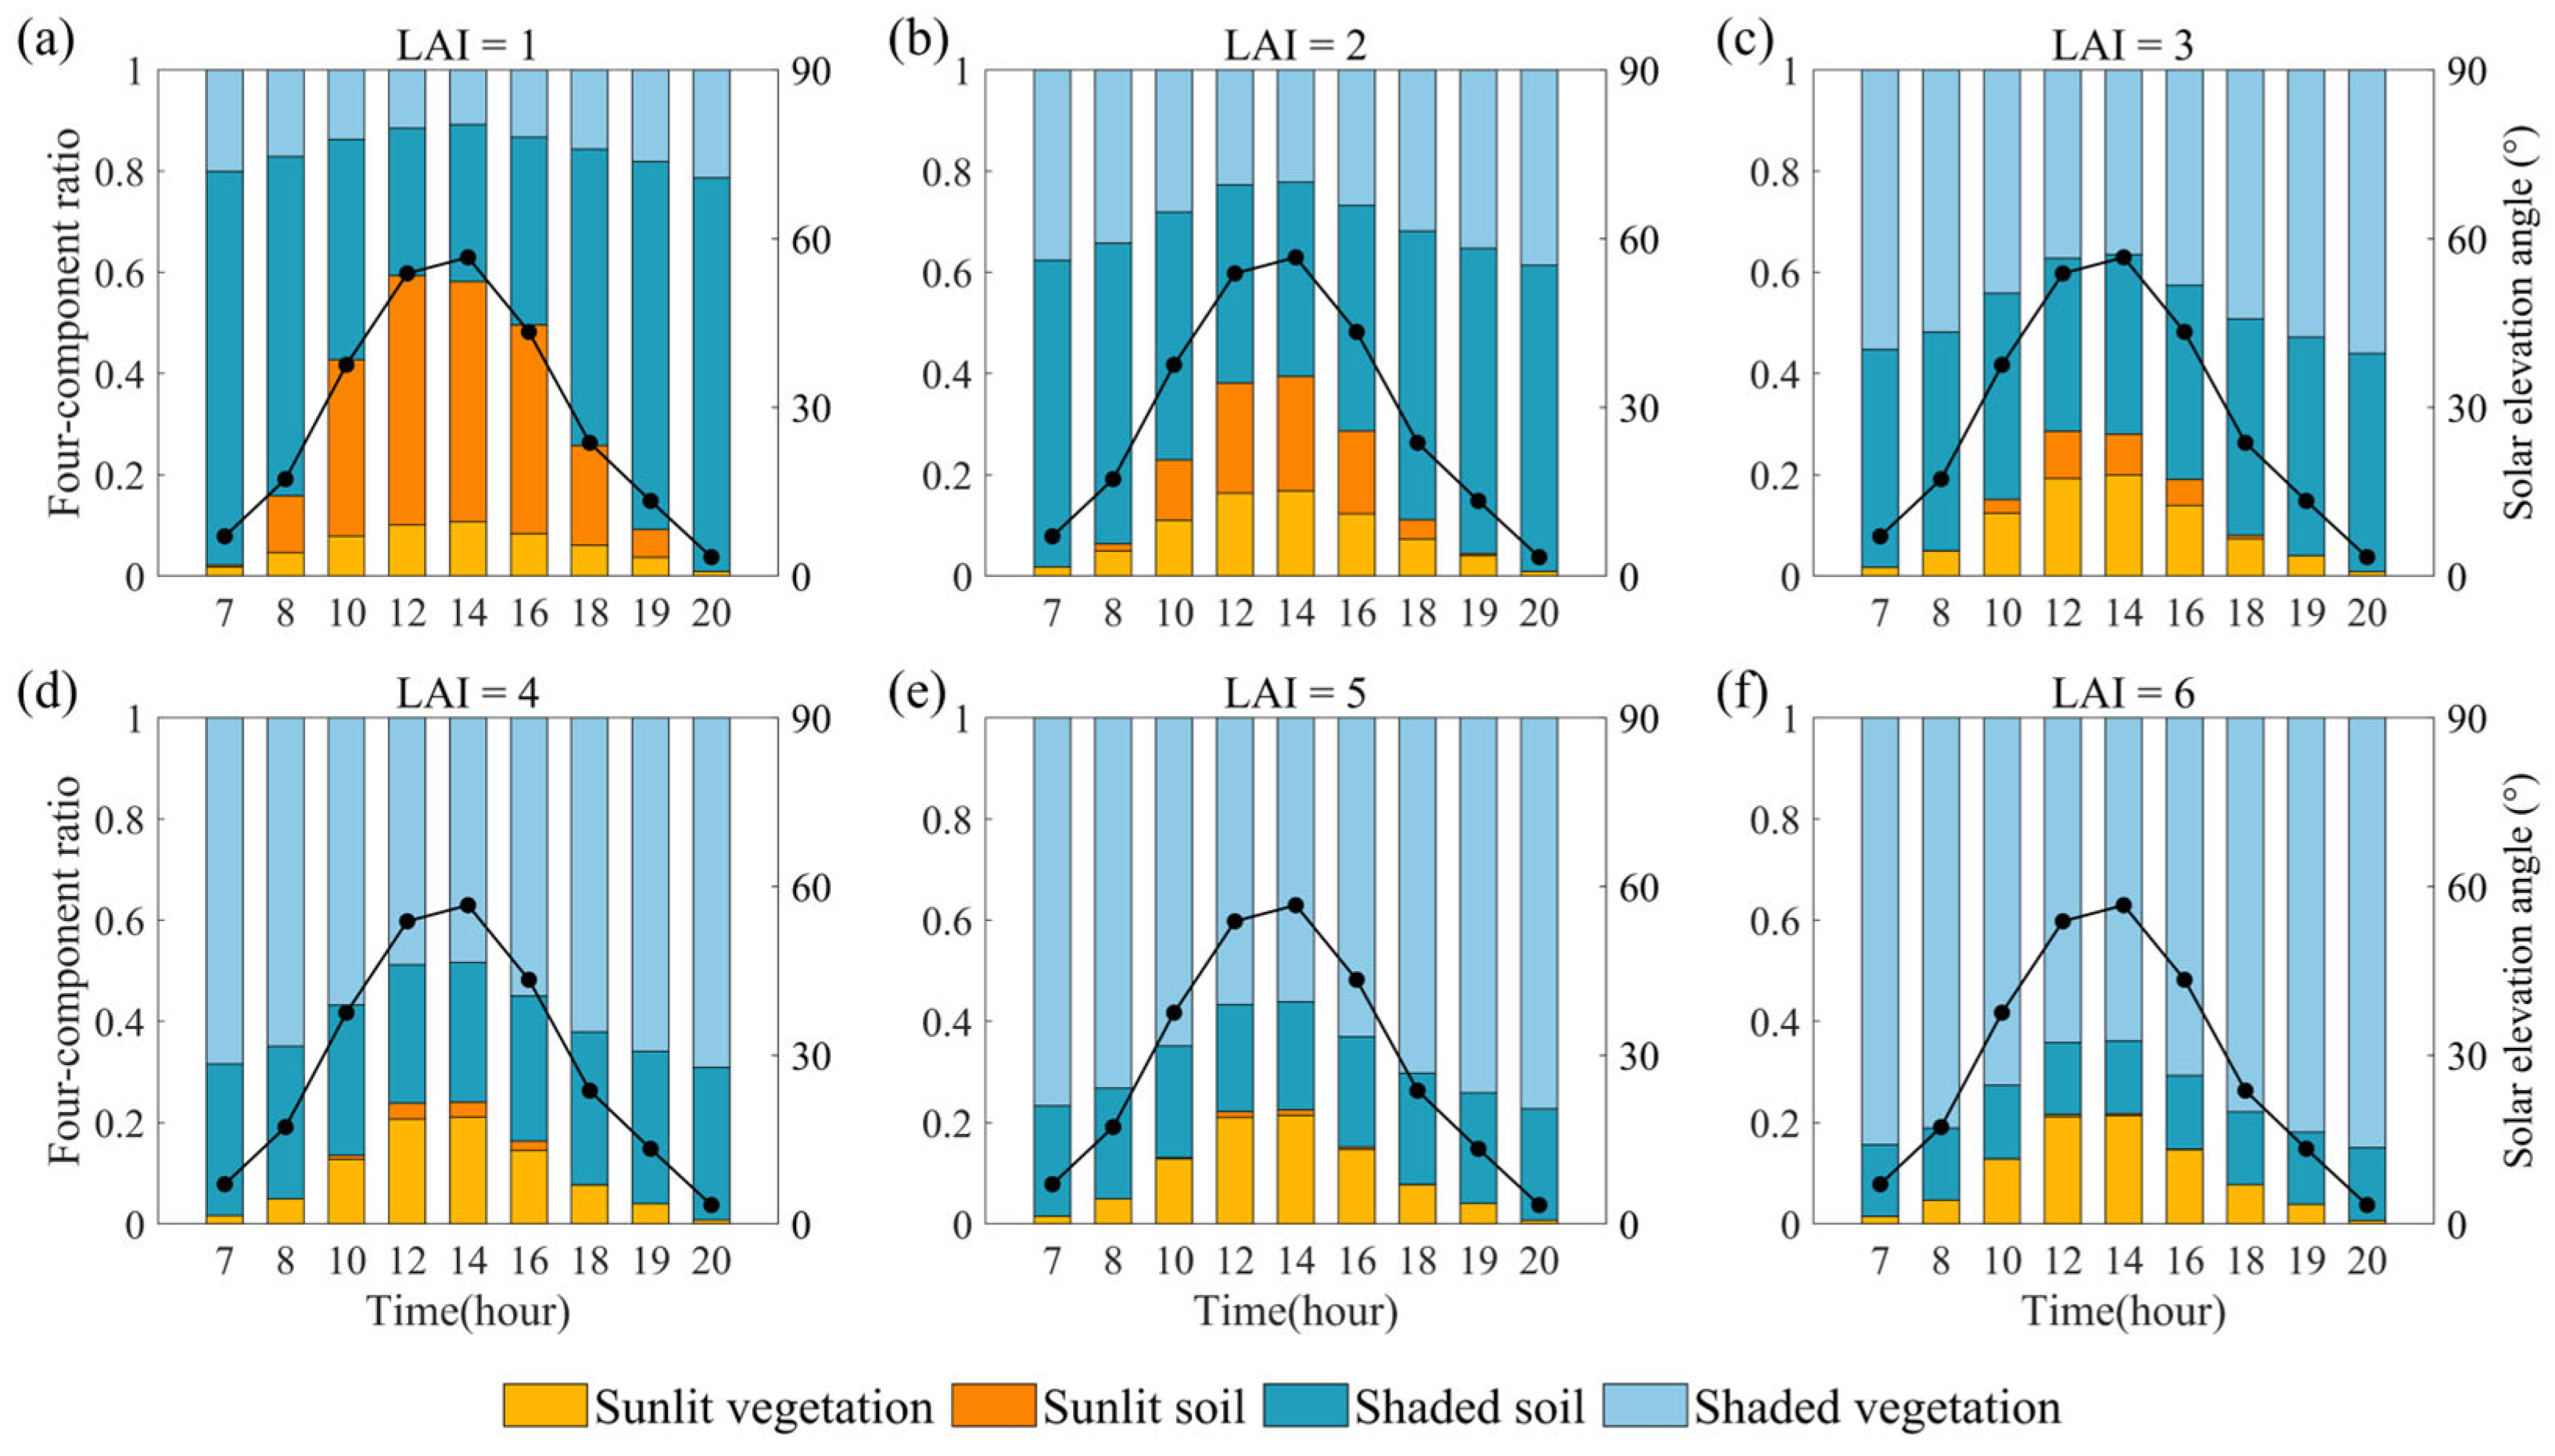
Photosynthetically active radiation (PAR) serves as the primary energy source driving vegetation photosynthesis. Under identical light conditions, varying LAI levels alter the light structure within the canopy [52]. To further investigate how light structure affects GPP, this study utilized LESS to simulate four components—sunlit vegetation, sunlit soil, shaded vegetation, and shaded soil—under forest scenarios with different LAI values. The proportion of sunlit vegetation was highly consistent with variations in the solar elevation angle (Figure 9). As LAI increased, this proportion initially increased before stabilizing.
Figure 9.
Daytime variations in the fractional contributions of sunlit vegetation, sunlit soil, shaded vegetation, and shaded soil, together with changes in solar elevation angle. Panels (a–f) represent different LAI levels in the forest scenes.
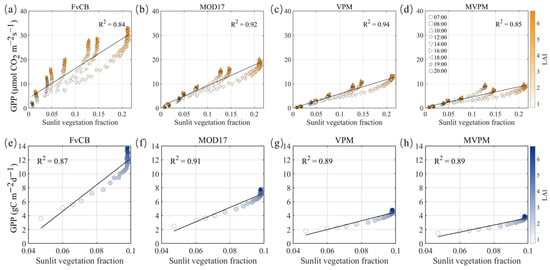
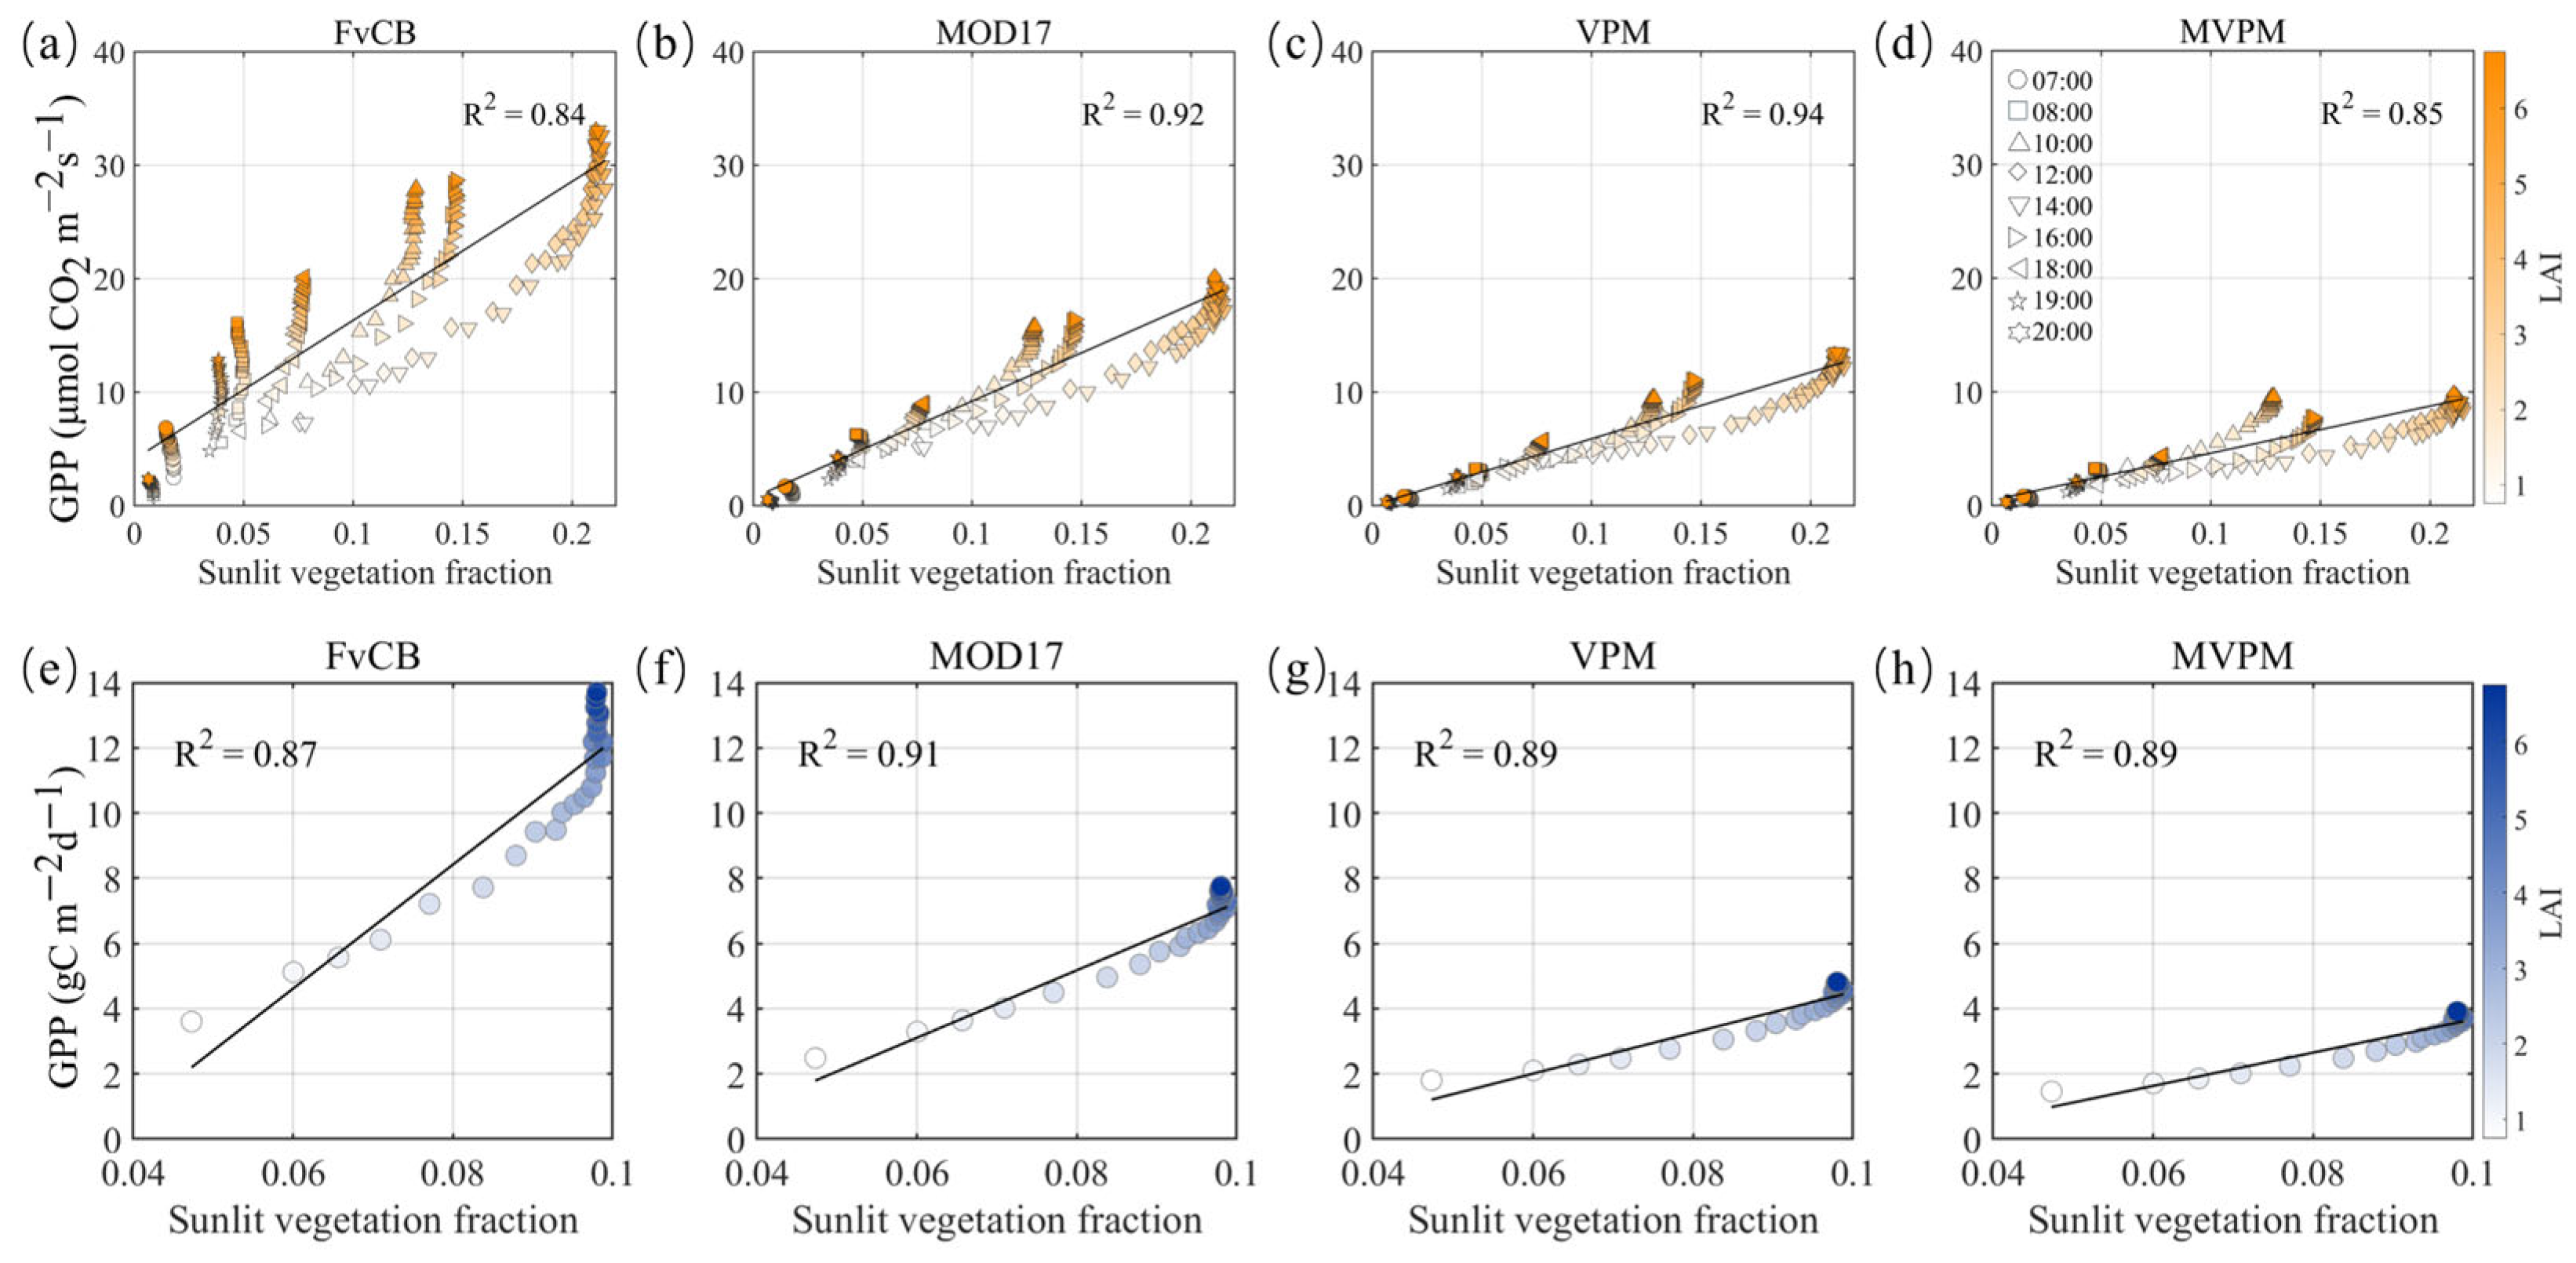
GPP shows strong correlations with the proportion of sunlit vegetation across temporal scales (Figure 10). To some extent, the sunlit vegetation fraction effectively reflects the spatiotemporal dynamics of photosynthesis. The fraction of sunlit vegetation increased progressively with LAI, but approached saturation once LAI exceeded a certain threshold, and even declined during the morning and late afternoon periods. This pattern was more pronounced in the FvCB model. This may be attributed to the enhanced self-shading effect within the canopy as LAI increases [53,54]. Nevertheless, canopy GPP still exhibited a noticeable increase under high LAI conditions.
Figure 10.
Relationship between GPP and the sunlit vegetation fraction. Panels (a–d) and (e–h) show the relationships between GPP and the sunlit vegetation fraction at instantaneous and daily time scales, respectively.
Tree canopies are composed of sunlit and shaded leaves, which receive markedly different amounts of direct and diffuse incident solar radiation [2]. Specifically, these two leaf types exhibit systematic differences in morphology, anatomical structure, physiological characteristics, and biochemical processes [55]. Compared with shaded leaves, sunlit leaves are typically smaller, contain higher chlorophyll content per unit leaf area, exhibit higher dark respiration rates, and possess higher photosynthetic light saturation points [56]. Consequently, sunlit and shaded leaves display distinct photosynthetic capacities. Such structural differences can be explicitly represented in process-based models such as FvCB, but are typically simplified in LUE-based models.
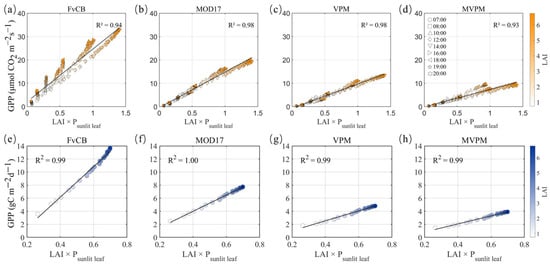
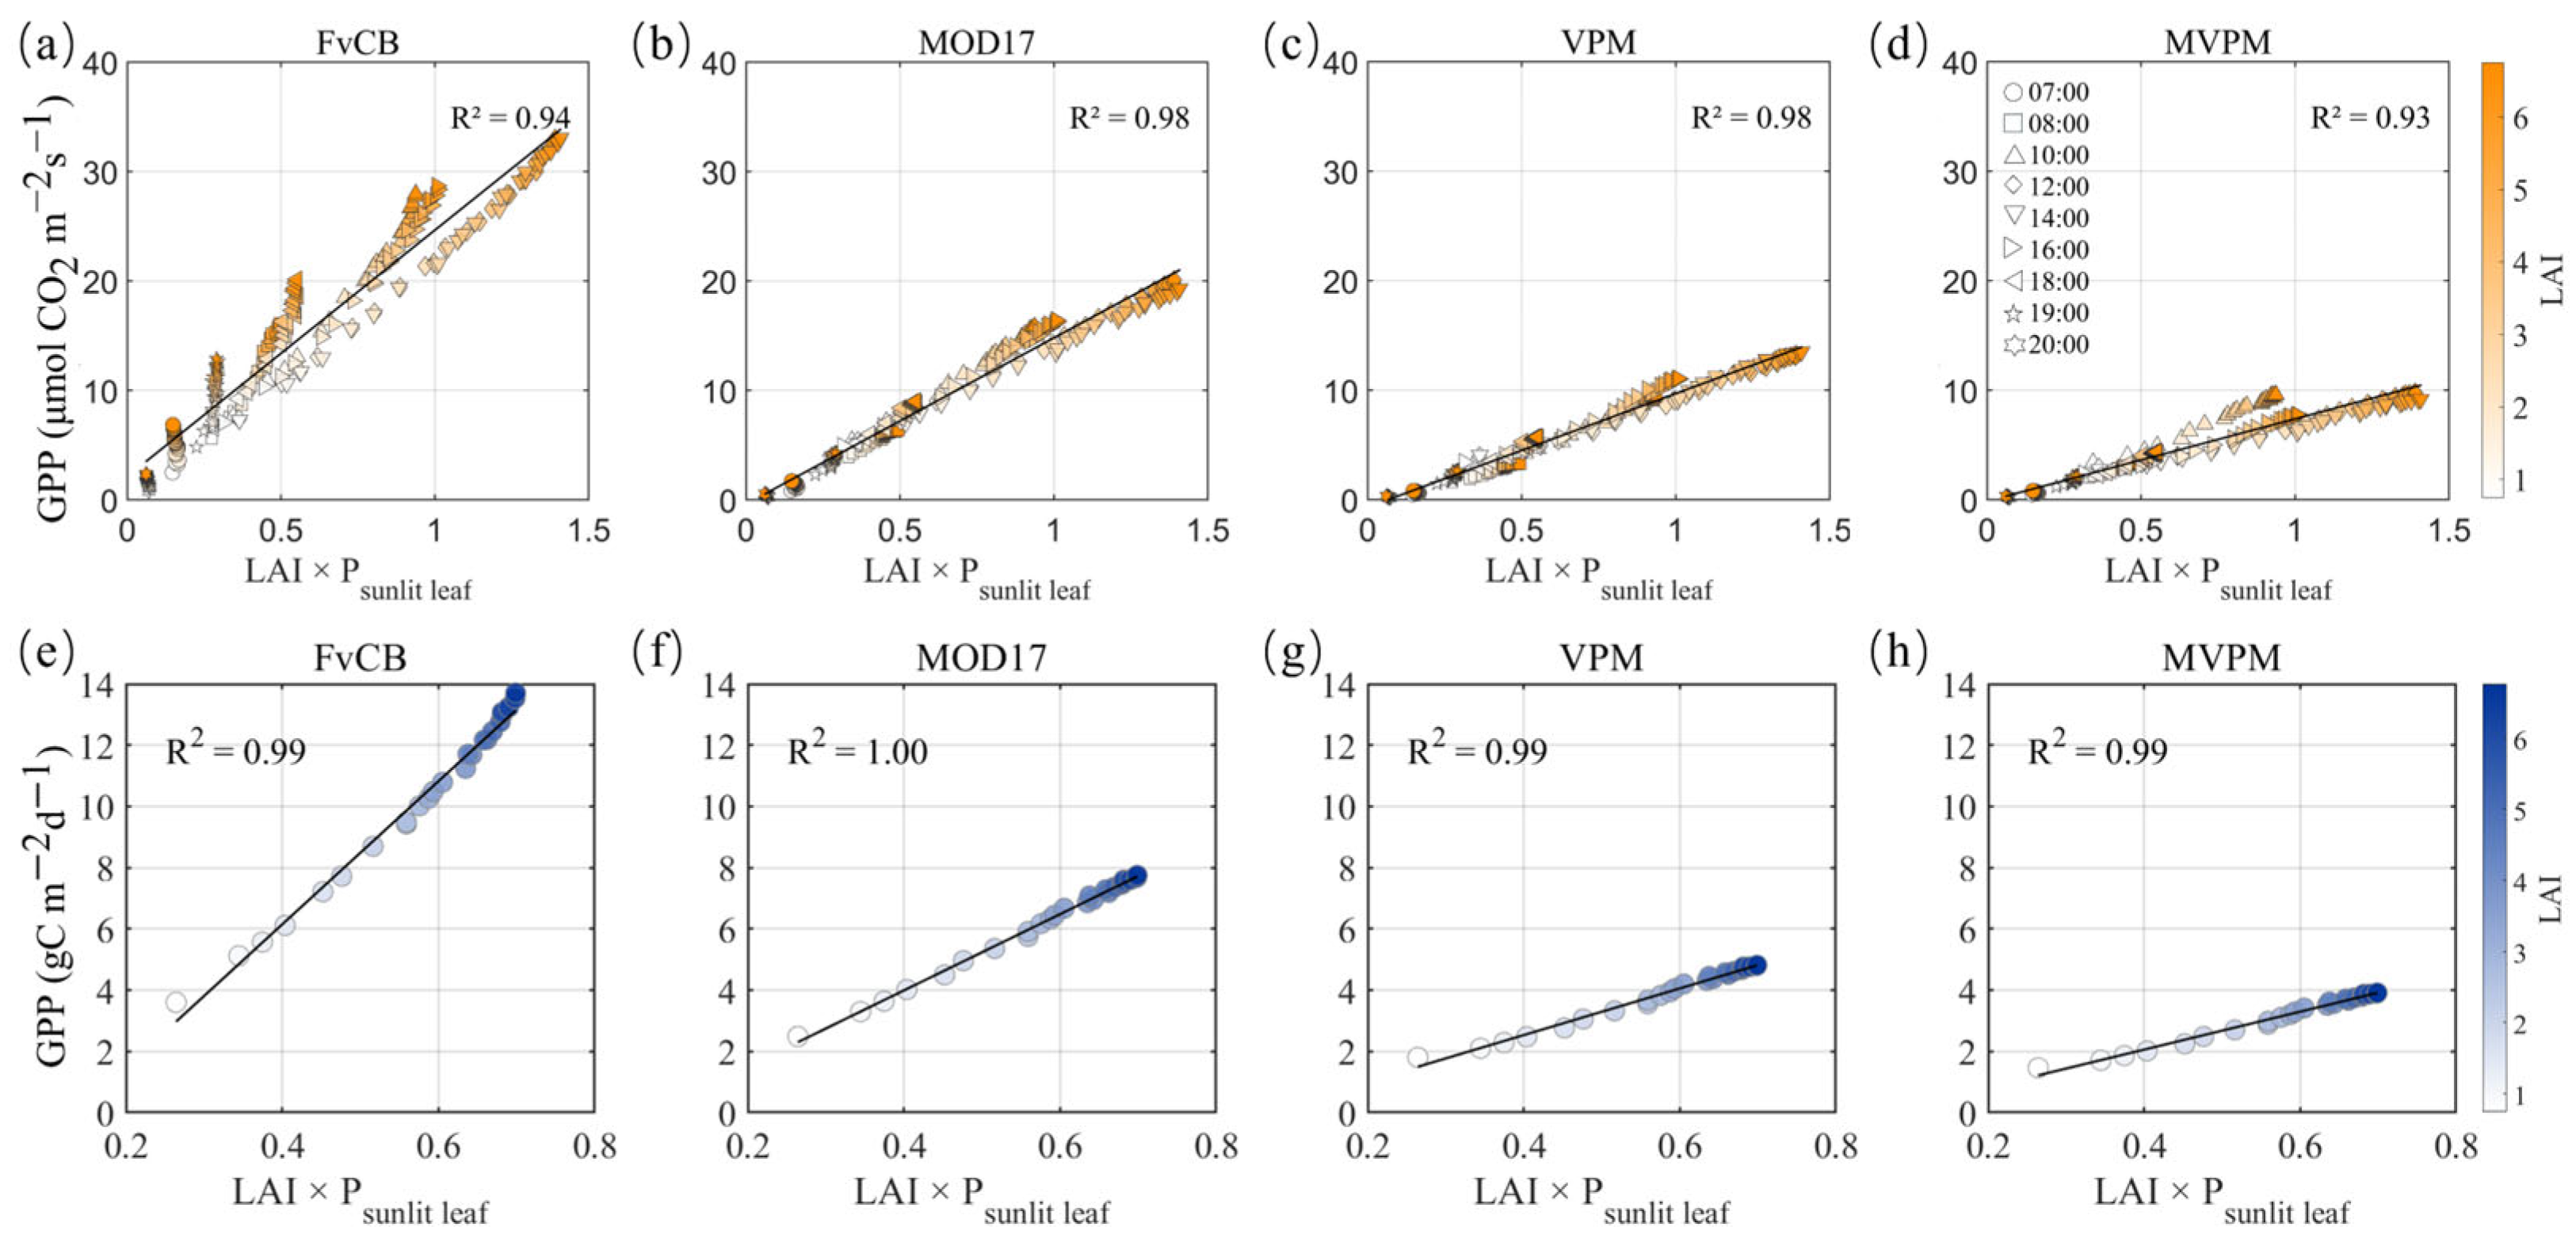
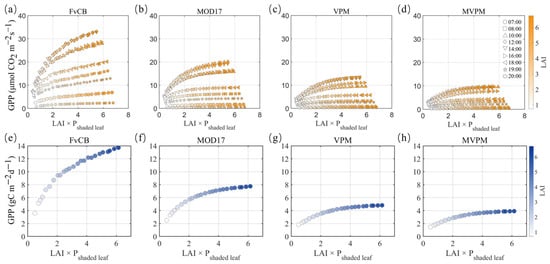
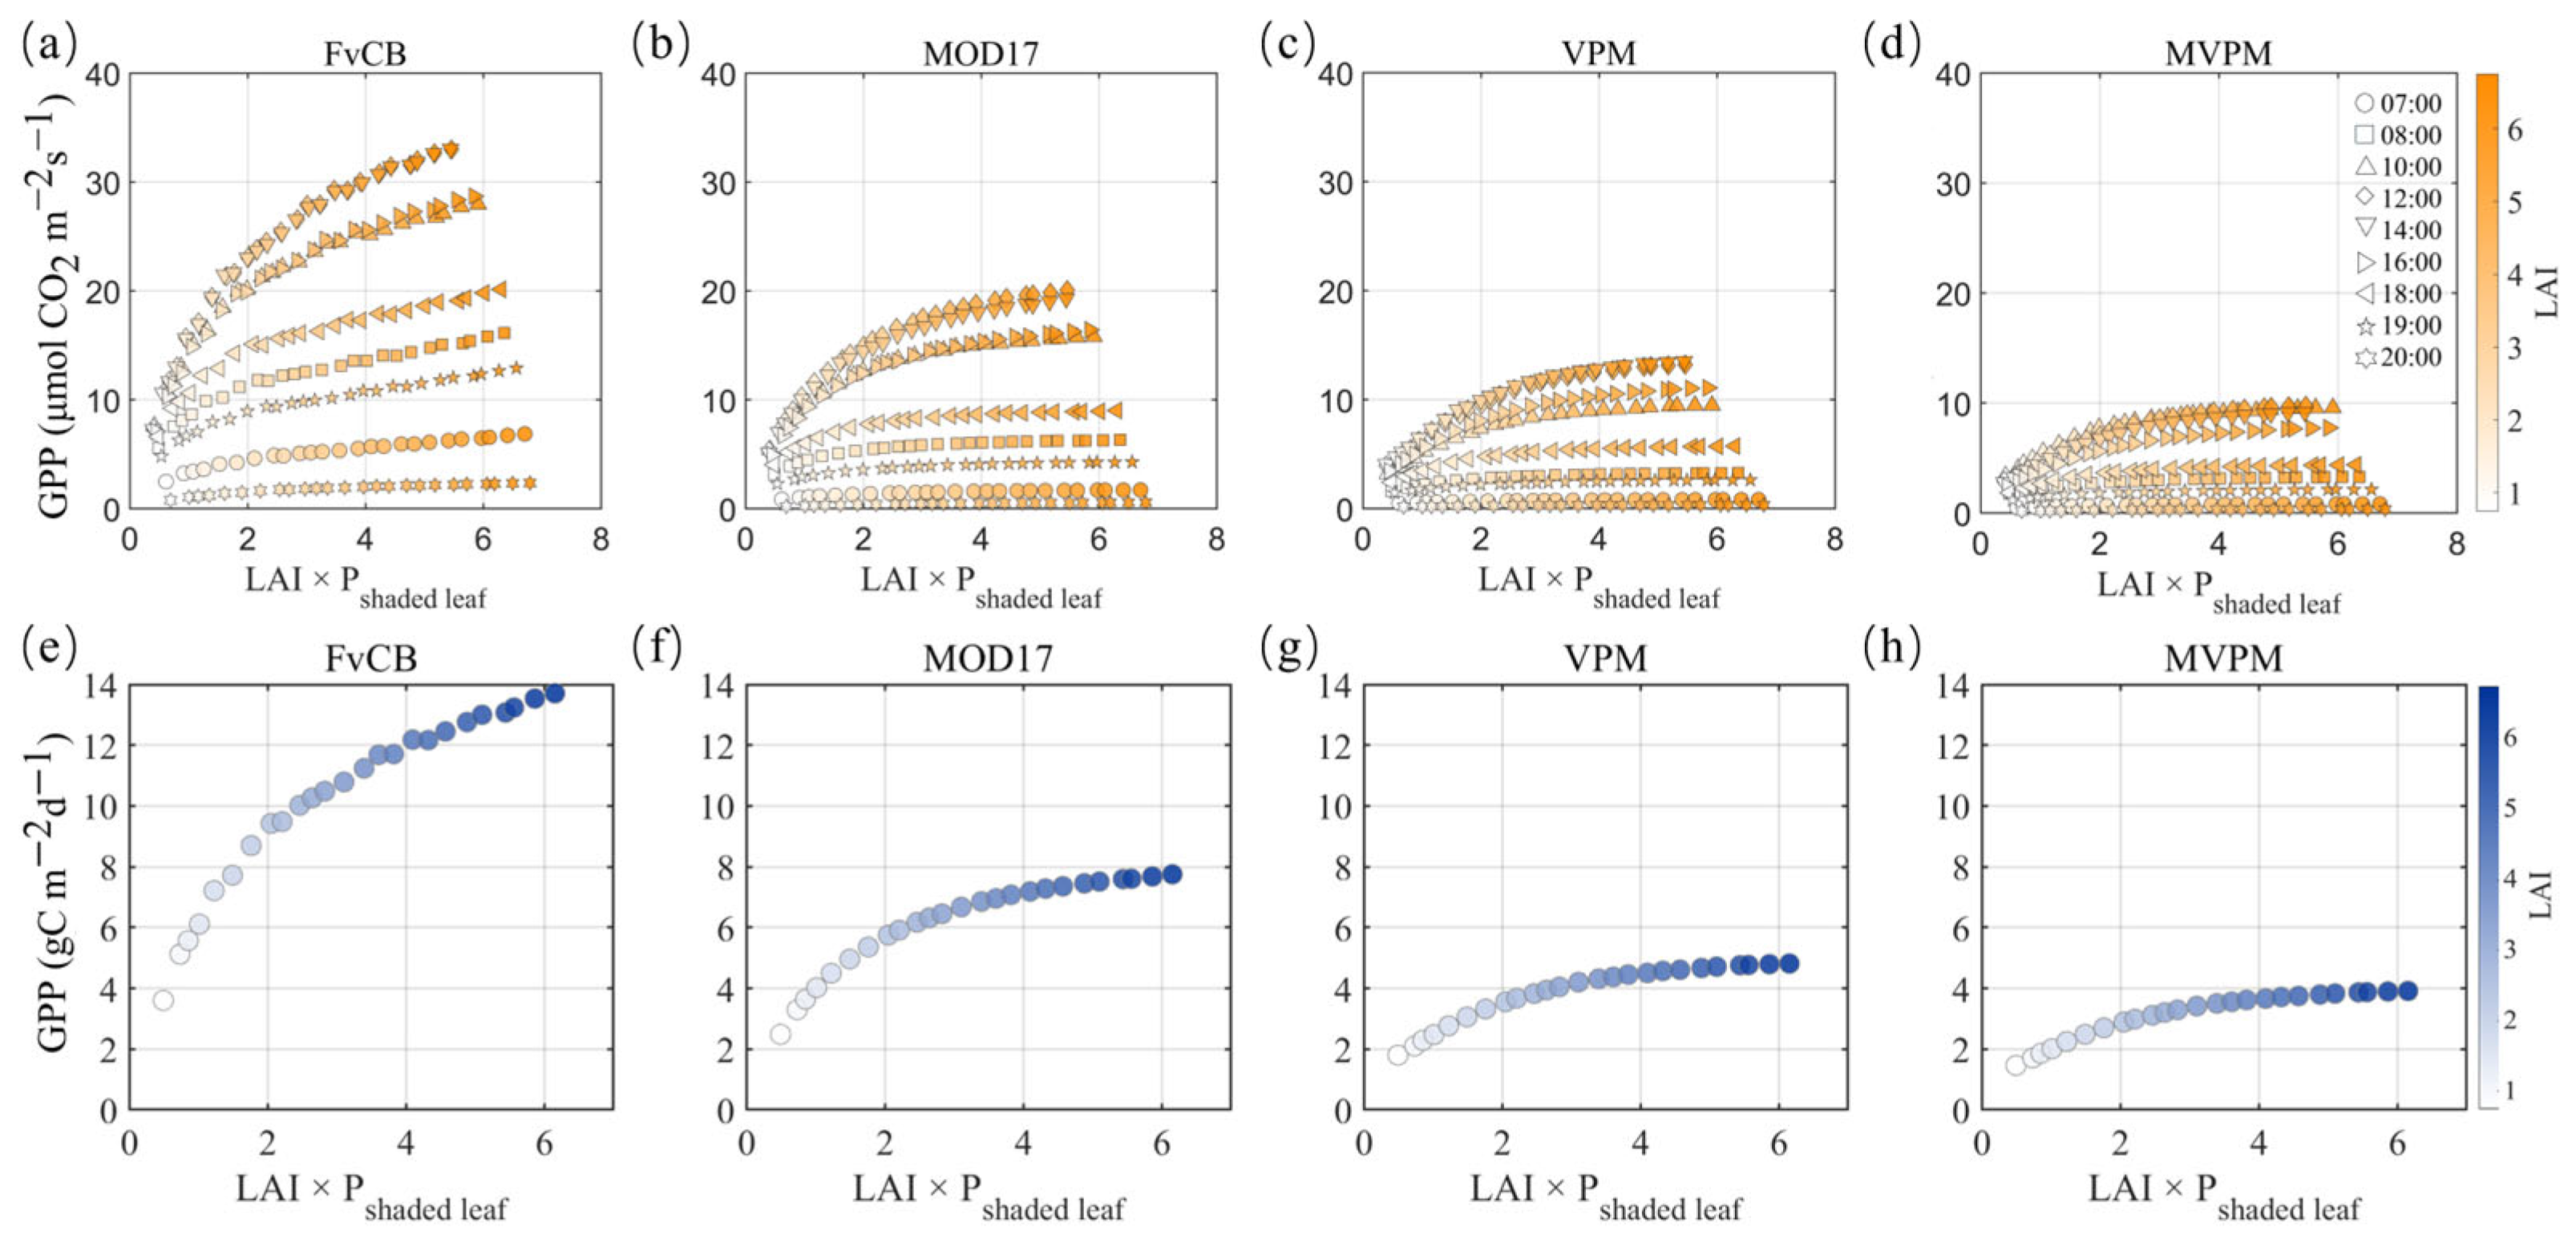
The study simulated the proportion of sunlit and shaded leaf area relative to total leaf area under different scenarios and used the product of these proportions and LAI to characterize the corresponding sunlit and shaded leaf area. The results show that GPP exhibits a significant correlation with sunlit leaf area at both instantaneous and daily scales (Figure 11). When the solar elevation angle was low, the sunlit leaf area did not increase markedly with increasing LAI. However, compared with the three LUE models, the FvCB model still showed a noticeable increase in GPP under high LAI conditions, consistent with the trend presented in Figure 10. A clear saturation pattern was observed in the relationship between GPP and shaded leaf area, which is also consistent with the daily GPP–LAI relationship described in Section 3.2 (Figure 12). In addition, increases in LAI were accompanied by rising maintenance respiration rates, while the shaded leaf area expanded much faster than the sunlit leaf area, which may constrain further increases in GPP [53]. The variation in shaded leaf area is a key factor explaining the relationship between daily GPP and LAI.
Figure 11.
Relationship between GPP and sunlit leaf area. Panels (a–d) and (e–h) show the relationships between GPP and sunlit leaf area at instantaneous and daily time scales, respectively.
Figure 12.
Relationship between GPP and shaded leaf area. Panels (a–d) and (e–h) show the relationships between GPP and shaded leaf area at instantaneous and daily time scales, respectively.
4.3. Limitations and Uncertainties
In this study, we employed a 3D simulation framework to evaluate the performance of GPP models with varying levels of complexity. Although the 3D forest simulations provided a realistic testing ground for our evaluation by accurately simulating light distribution and canopy light structure, several limitations remain.
The FvCB model, which is based on leaf physiological and biochemical processes, can achieve high accuracy. However, the model requires numerous input parameters, creating challenges for data collection. These parameters may be influenced by various factors, such as leaf age, light conditions, and nutrient availability, and play a key role in regulating vegetation photosynthesis [19,57]. In addition, biases may be introduced during parameter acquisition due to measurement errors or other causes, so this uncertainty should be considered when interpreting the results [58]. In this study, European evergreen coniferous species were selected because relatively comprehensive parameter information is available, enabling more reliable GPP estimation.
In recent years, satellite-based GPP models have advanced substantially. However, uncertainties persist due to differences in model structures and parameterizations, uncertainties in input and validation data, and scale mismatches [2,4,30]. The true LUE varies substantially at the instantaneous scale due to rapid fluctuations in solar radiation, temperature, and vapor pressure deficit [59]. However, when integrated over longer periods (e.g., daily or seasonal scales), these short-term fluctuations tend to average out, and LUE becomes relatively stable. The VPM and MVPM use EVI to characterize the FPAR of green leaves; this assumption may introduce uncertainty into GPP estimates [26]. In addition, LUE models were originally developed based on satellite observations, with their input parameters largely derived from remote sensing and meteorological data products [60,61]. Most currently available remotely sensed variables are still insufficient to fully capture photosynthetic processes—especially biochemical (carbon assimilation) reactions—thereby limiting their ability to accurately quantify actual photosynthesis [1,62]. Therefore, their performance within a 3D simulation framework may not be as favorable as reported in previous studies.
5. Conclusions
This study evaluated GPP models of varying complexity under different LAI levels and environmental stress conditions within a 3D simulation framework for evergreen coniferous forests. The results revealed significant differences among the models in estimating GPP at both instantaneous and daily scales. Overall, the FvCB and MOD17 models exhibited a high degree of consistency in their sensitivity to environmental variations. The performance of the VPM under the T + 2SD condition was most comparable to that of MOD17, whereas the MVPM generally produced lower GPP estimates but showed the highest sensitivity to environmental changes.
In addition, vegetation structure and its spatial distribution directly influence the distribution of incoming solar radiation within the canopy, thereby playing a critical role in regulating canopy GPP. Across all four models, GPP is strongly correlated with the fraction of sunlit leaf area and increases with LAI and shaded leaf area before gradually approaching saturation. Compared with the three LUE models, the process-based FvCB model is more sensitive to canopy structure and light distribution. The resilience of the FvCB model to the onset and intensification of environmental stress increases with LAI.
The results demonstrate differences in the performance of GPP models in evergreen coniferous forests, and these differences may vary with vegetation types. These findings highlight the importance of selecting appropriate GPP models to accurately estimate forest carbon fluxes under varying LAI, environmental conditions, and vegetation types. Moreover, the integration of a 3D simulation framework with GPP model evaluation provides a valuable methodological reference for future model optimization, assessment, and validation.
Author Contributions
Conceptualization, S.Z. and C.H.; methodology, S.G.; software, S.Z.; validation, J.Q. and X.M.; formal analysis, S.Z. and C.H.; investigation, S.Z.; resources, S.G.; data curation, S.Z.; writing—original draft preparation, S.Z. and C.H.; writing—review and editing, S.G., J.Q. and K.Y.; visualization, S.Z. and C.H.; supervision, K.Y.; project administration, K.Y.; funding acquisition, K.Y. All authors have read and agreed to the published version of the manuscript.
Funding
This work was supported by the National Natural Science Foundation of China (42271356) and the Fundamental and Interdisciplinary Disciplines Breakthrough Plan of the Ministry of Education of China (JYB2025XDXM905).
Data Availability Statement
The raw data supporting the conclusions of this article will be made available by the authors on request.
Acknowledgments
The authors sincerely thank the editor and the three anonymous reviewers for their valuable comments and constructive suggestions, which greatly helped improve the manuscript.
Conflicts of Interest
The authors declare no conflicts of interest.
Abbreviations
The following abbreviations are used in this manuscript:
| 3D | Three-dimensional |
| APAR | Absorbed photosynthetically active radiation |
| BPLUT | Biome properties look-up table |
| CASA | Carnegie-Ames-Stanford approach |
| Carbon dioxide | |
| EC | Eddy covariance |
| eLUE | Ecosystem light use efficiency |
| EVI | Enhanced vegetation index |
| Environmental conditions like air temperature and vapor pressure deficit | |
| Environmental stress factor influenced by daily minimum air temperature | |
| Environmental stress factor influenced by vapor pressure deficit | |
| FPAR | Fraction of absorbed photosynthetically active radiation |
| FvCB | Farquhar–von Caemmerer–Berry |
| GLO-PEM | Global Production Efficiency Model |
| GPP | Gross primary production |
| J | Electron transport rate |
| kNDVI | Kernel normalized difference vegetation index |
| LSWI | land surface water index |
| The maximum LSWI during the effective photosynthetic period of the simulated day | |
| LAI | Leaf area index |
| LESS | Large-scale remote sensing data and image simulation framework |
| LUE | Light use efficiency |
| MOD17 | Moderate Resolution Imaging Spectroradiometer (MODIS) GPP product |
| MVPM | Modified Vegetation Photosynthesis Model |
| NIR | Near-infrared |
| Near-infrared reflectance of vegetation | |
| Near-infrared reflectance of vegetation multiplied by incoming sunlight | |
| NEE | Net ecosystem exchange |
| NPP | Net primary production |
| NPV | Non-photosynthetically active vegetation |
| A scalar that represents the effect of leaf age on photosynthesis at canopy level | |
| PAR | Photosynthetically active radiation |
| PAV | Photosynthetically active vegetation |
| PFT | Plant functional types |
| Dark respiration rate | |
| Re | Ecosystem respiration |
| RTMs | Radiative transfer models |
| RAMI | Radiative Transfer Model Intercomparison |
| SIF | Sun-induced chlorophyll fluorescence |
| SWIR | Shortwave infrared |
| Maximum temperature for photosynthetic activities in VPM and MVPMs and daily maximum air temperature in MOD17 model. | |
| Minimum temperature for photosynthetic activities in VPM and MVPMs and daily minimum air temperature in MOD17 model. | |
| Daily minimum temperature at which the actual light-use-efficiency equals the theoretical maximum light-use-efficiency | |
| Daily minimum temperature at which the actual light-use-efficiency equals zero | |
| Optimal temperature for photosynthetic activities | |
| A scalar that represents the effects of temperature on the theoretical maximum light-use-efficiency. | |
| VPD | Vapor pressure deficit |
| Maximum vapor pressure deficit | |
| Minimum vapor pressure deficit | |
| Maximum rate of Rubisco carboxylation | |
| VPM | Vegetation Photosynthesis Model |
| Actual light-use-efficiency | |
| Theoretical maximum light-use-efficiency | |
| Near-infrared reflectance | |
| Shortwave infrared reflectance |
Appendix A
Table A1.
Biome-Property-Look-Up-Table (BPLUT) for evergreen needleleaf forest (ENF) in the MODIS GPP/NPP algorithm [43].
Table A2.
Biochemical parameters of Pinus sylvestris used in the 3D simulation [46]. and Rd denote the maximum carboxylation rate of Rubisco and the dark respiration rate at 25 °C, respectively. G1 and G0 denote the slope and intercept of the Ball–Berry model [63], respectively. Rdparam denotes the ratio of dark respiration rate to .
Table A3.
Specific temperature and vapor pressure settings for five growth environments, derived from ERA5 data [47] and calculated in this study. T and VP represent the temperature and vapor pressure under normal growth conditions, respectively. T + 1SD and VP − 1SD represent moderate heat stress and moderate water stress, respectively. T + 2SD and VP − 2SD represent severe heat stress and severe water stress, respectively.
References
- Zhu, W.; Xie, Z.; Zhao, C.; Zheng, Z.; Qiao, K.; Peng, D.; Fu, Y.H. Remote Sensing of Terrestrial Gross Primary Productivity: A Review of Advances in Theoretical Foundation, Key Parameters and Methods. GIScience Remote Sens. 2024, 61, 2318846. [Google Scholar] [CrossRef] [Scilit]
- Pei, Y.; Dong, J.; Zhang, Y.; Yuan, W.; Doughty, R.; Yang, J.; Zhou, D.; Zhang, L.; Xiao, X. Evolution of Light Use Efficiency Models: Improvement, Uncertainties, and Implications. Agric. For. Meteorol. 2022, 317, 108905. [Google Scholar] [CrossRef] [Scilit]
- Beer, C.; Reichstein, M.; Tomelleri, E.; Ciais, P.; Jung, M.; Carvalhais, N.; Rödenbeck, C.; Arain, M.A.; Baldocchi, D.; Bonan, G.B.; et al. Terrestrial Gross Carbon Dioxide Uptake: Global Distribution and Covariation with Climate. Science 2010, 329, 834–838. [Google Scholar] [CrossRef] [Scilit]
- Yuan, W.; Cai, W.; Xia, J.; Chen, J.; Liu, S.; Dong, W.; Merbold, L.; Law, B.; Arain, A.; Beringer, J.; et al. Global Comparison of Light Use Efficiency Models for Simulating Terrestrial Vegetation Gross Primary Production Based on the LaThuile Database. Agric. For. Meteorol. 2014, 192–193, 108–120. [Google Scholar] [CrossRef] [Scilit]
- Zhang, Y.; Hu, Z.; Wang, J.; Gao, X.; Yang, C.; Yang, F.; Wu, G. Temporal Upscaling of MODIS Instantaneous FAPAR Improves Forest Gross Primary Productivity (GPP) Simulation. Int. J. Appl. Earth Obs. Geoinf. 2023, 121, 103360. [Google Scholar] [CrossRef] [Scilit]
- Wang, X.; Che, T.; Xiao, J.; Wang, T.; Tan, J.; Zhang, Y.; Ren, Z.; Geng, L.; Wang, H.; Xu, Z.; et al. A Post-Processed Carbon Flux Dataset for 34 Eddy Covariance Flux Sites across the Heihe River Basin, China. Earth Syst. Sci. Data Discuss. 2024, 17, 1329–1346. [Google Scholar] [CrossRef] [Scilit]
- Baldocchi, D.; Falge, E.; Gu, L.; Olson, R.; Hollinger, D.; Running, S.; Anthoni, P.; Bernhofer, C.; Davis, K.; Evans, R.; et al. FLUXNET: A New Tool to Study the Temporal and Spatial Variability of Ecosystem–Scale Carbon Dioxide, Water Vapor, and Energy Flux Densities. Bull. Am. Meteorol. Soc. 2001, 82, 2415–2434. [Google Scholar] [CrossRef] [Scilit]
- Gong, E.; Zhang, J.; Wang, Z.; Hu, Q.; Bai, H.; Wang, J. Global Comparison of Temperature and Water Stress Representations in Light Use Efficiency Models for Gross Primary Productivity Estimation. ISPRS J. Photogramm. Remote Sens. 2025, 230, 275–288. [Google Scholar] [CrossRef] [Scilit]
- Zhang, Y.; Xiao, X.; Jin, C.; Dong, J.; Zhou, S.; Wagle, P.; Joiner, J.; Guanter, L.; Zhang, Y.; Zhang, G.; et al. Consistency between Sun-Induced Chlorophyll Fluorescence and Gross Primary Production of Vegetation in North America. Remote Sens. Environ. 2016, 183, 154–169. [Google Scholar] [CrossRef] [Scilit]
- Camps-Valls, G.; Campos-Taberner, M.; Moreno-Martínez, Á.; Walther, S.; Duveiller, G.; Cescatti, A.; Mahecha, M.D.; Muñoz-Marí, J.; García-Haro, F.J.; Guanter, L.; et al. A Unified Vegetation Index for Quantifying the Terrestrial Biosphere. Sci. Adv. 2021, 7, eabc7447. [Google Scholar] [CrossRef] [Scilit] [PubMed]
- Dechant, B.; Ryu, Y.; Badgley, G.; Köhler, P.; Rascher, U.; Migliavacca, M.; Zhang, Y.; Tagliabue, G.; Guan, K.; Rossini, M.; et al. NIRVP: A Robust Structural Proxy for Sun-Induced Chlorophyll Fluorescence and Photosynthesis across Scales. Remote Sens. Environ. 2022, 268, 112763. [Google Scholar] [CrossRef] [Scilit]
- Frankenberg, C.; Berry, J. Solar Induced Chlorophyll Fluorescence: Origins, Relation to Photosynthesis and Retrieval. In Comprehensive Remote Sensing; Elsevier: Amsterdam, The Netherlands, 2018; pp. 143–162. ISBN 978-0-12-803221-3. [Google Scholar]
- Yang, X.; Tang, J.; Mustard, J.F.; Lee, J.; Rossini, M.; Joiner, J.; Munger, J.W.; Kornfeld, A.; Richardson, A.D. Solar-induced Chlorophyll Fluorescence that Correlates with Canopy Photosynthesis on Diurnal and Seasonal Scales in a Temperate Deciduous Forest. Geophys. Res. Lett. 2015, 42, 2977–2987. [Google Scholar] [CrossRef] [Scilit]
- Helm, L.T.; Shi, H.; Lerdau, M.T.; Yang, X. Solar-induced Chlorophyll Fluorescence and Short-term Photosynthetic Response to Drought. Ecol. Appl. 2020, 30, e02101. [Google Scholar] [CrossRef] [Scilit]
- Guanter, L.; Zhang, Y.; Jung, M.; Joiner, J.; Voigt, M.; Berry, J.A.; Frankenberg, C.; Huete, A.R.; Zarco-Tejada, P.; Lee, J.-E.; et al. Global and Time-Resolved Monitoring of Crop Photosynthesis with Chlorophyll Fluorescence. Proc. Natl. Acad. Sci. USA 2014, 111, E1327–E1333. [Google Scholar] [CrossRef] [Scilit]
- Jiang, C.; Ryu, Y. Multi-Scale Evaluation of Global Gross Primary Productivity and Evapotranspiration Products Derived from Breathing Earth System Simulator (BESS). Remote Sens. Environ. 2016, 186, 528–547. [Google Scholar] [CrossRef] [Scilit]
- Ryu, Y.; Baldocchi, D.D.; Kobayashi, H.; Van Ingen, C.; Li, J.; Black, T.A.; Beringer, J.; Van Gorsel, E.; Knohl, A.; Law, B.E.; et al. Integration of MODIS Land and Atmosphere Products with a Coupled-Process Model to Estimate Gross Primary Productivity and Evapotranspiration from 1 Km to Global Scales: GLOBAL GPP and ET. Glob. Biogeochem. Cycles 2011, 25, GB4017. [Google Scholar] [CrossRef] [Scilit]
- Krinner, G.; Viovy, N.; De Noblet-Ducoudré, N.; Ogée, J.; Polcher, J.; Friedlingstein, P.; Ciais, P.; Sitch, S.; Prentice, I.C. A Dynamic Global Vegetation Model for Studies of the Coupled Atmosphere-biosphere System. Glob. Biogeochem. Cycles 2005, 19, 2003GB002199. [Google Scholar] [CrossRef] [Scilit]
- Farquhar, G.D.; Caemmerer, S.V.; Berry, J.A. A Biochemical Model of Photosynthetic CO2 Assimilation in Leaves of C3 Species. Planta 1980, 149, 78–90. [Google Scholar] [CrossRef] [Scilit]
- Collatz, G.J.; Ribas-Carbo, M.; Berry, J.A. Coupled Photosynthesis-Stomatal Conductance Model for Leaves of C4 Plants. Funct. Plant Biol. 1992, 19, 519–538. [Google Scholar] [CrossRef] [Scilit]
- Duanyang, W. Optimizing the Statistical Estimation of the Parameters of the Farquhar–von Caemmerer–Berry Model of Photosynthesis. New Phytol. 2007, 176, 402–414. [Google Scholar] [CrossRef] [Scilit]
- Ryu, Y.; Berry, J.A.; Baldocchi, D.D. What Is Global Photosynthesis? History, Uncertainties and Opportunities. Remote Sens. Environ. 2019, 223, 95–114. [Google Scholar] [CrossRef] [Scilit]
- Ma, Y.; Chen, S.; Ermon, S.; Lobell, D.B. Transfer Learning in Environmental Remote Sensing. Remote Sens. Environ. 2024, 301, 113924. [Google Scholar] [CrossRef] [Scilit]
- Potter, C.S.; Randerson, J.T.; Field, C.B.; Matson, P.A.; Vitousek, P.M.; Mooney, H.A.; Klooster, S.A. Terrestrial Ecosystem Production: A Process Model Based on Global Satellite and Surface Data. Glob. Biogeochem. Cycles 1993, 7, 811–841. [Google Scholar] [CrossRef] [Scilit]
- Prince, S.D.; Goward, S.N. Global Primary Production: A Remote Sensing Approach. J. Biogeogr. 1995, 22, 815. [Google Scholar] [CrossRef] [Scilit]
- Running, S.W.; Thornton, P.E.; Nemani, R.; Glassy, J.M. Global Terrestrial Gross and Net Primary Productivity from the Earth Observing System. In Methods in Ecosystem Science; Sala, O.E., Jackson, R.B., Mooney, H.A., Howarth, R.W., Eds.; Springer New York: New York, NY, USA, 2000; pp. 44–57. ISBN 978-0-387-98743-9. [Google Scholar]
- Running, S.W.; Nemani, R.R.; Heinsch, F.A.; Zhao, M.; Reeves, M.; Hashimoto, H. A Continuous Satellite-Derived Measure of Global Terrestrial Primary Production. BioScience 2004, 54, 547. [Google Scholar] [CrossRef] [Scilit]
- Xiao, X.; Hollinger, D.; Aber, J.; Goltz, M.; Davidson, E.A.; Zhang, Q.; Moore, B. Satellite-Based Modeling of Gross Primary Production in an Evergreen Needleleaf Forest. Remote Sens. Environ. 2004, 89, 519–534. [Google Scholar] [CrossRef] [Scilit]
- Xiao, X.; Zhang, Q.; Braswell, B.; Urbanski, S.; Boles, S.; Wofsy, S.; Iii, B.M.; Ojima, D. Modeling Gross Primary Production of Temperate Deciduous Broadleaf Forest Using Satellite Images and Climate Data. Remote Sens. Environ. 2004, 91, 256–270. [Google Scholar] [CrossRef]
- Zhang, L.-X.; Zhou, D.-C.; Fan, J.-W.; Hu, Z.-M. Comparison of Four Light Use Efficiency Models for Estimating Terrestrial Gross Primary Production. Ecol. Model. 2015, 300, 30–39. [Google Scholar] [CrossRef] [Scilit]
- Zhang, L.; Zhou, D.; Fan, J.; Guo, Q.; Chen, S.; Wang, R.; Li, Y. Contrasting the Performance of Eight Satellite-Based GPP Models in Water-Limited and Temperature-Limited Grassland Ecosystems. Remote Sens. 2019, 11, 1333. [Google Scholar] [CrossRef] [Scilit]
- Cao, C.; Ma, X.; Yang, W.; Yan, K.; Liu, F.; Wang, Y.; Huete, A. Global Upscaling of Gross Primary Productivity Using a Simple and Robust Modeling Scheme. IEEE Trans. Geosci. Remote Sens. 2025, 63, 4422013. [Google Scholar] [CrossRef] [Scilit]
- Reichstein, M.; Falge, E.; Baldocchi, D.; Papale, D.; Aubinet, M.; Berbigier, P.; Bernhofer, C.; Buchmann, N.; Gilmanov, T.; Granier, A.; et al. On the Separation of Net Ecosystem Exchange into Assimilation and Ecosystem Respiration: Review and Improved Algorithm. Glob. Change Biol. 2005, 11, 1424–1439. [Google Scholar] [CrossRef] [Scilit]
- Verhoef, W. Light Scattering by Leaf Layers with Application to Canopy Reflectance Modeling: The SAIL Model. Remote Sens. Environ. 1984, 16, 125–141. [Google Scholar] [CrossRef] [Scilit]
- Gastellu-Etchegorry, J.-P.; Demarez, V.; Pinel, V.; Zagolski, F. Modeling Radiative Transfer in Heterogeneous 3-D Vegetation Canopies. Remote Sens. Environ. 1996, 58, 131–156. [Google Scholar] [CrossRef] [Scilit]
- Graziani, F. (Ed.) Computational Methods in Transport: Granlibakken 2004; Lecture Notes in Computational Science and Engineering; Springer: Berlin/Heidelberg, Germany, 2006; ISBN 978-3-540-28122-1. [Google Scholar]
- Gao, S.; Yan, K.; Liu, J.; Pu, J.; Zou, D.; Qi, J.; Mu, X.; Yan, G. Assessment of Remote-Sensed Vegetation Indices for Estimating Forest Chlorophyll Concentration. Ecol. Indic. 2024, 162, 112001. [Google Scholar] [CrossRef] [Scilit]
- Gao, S.; Yan, K.; Yan, G.; Rautiainen, M.; Knyazikhin, Y.; Myneni, R.B. Rainfall-Caused Water Film on Canopy Surface Biases Remotely-Sensed Vegetation Greenness. Remote Sens. Environ. 2025, 324, 114747. [Google Scholar] [CrossRef] [Scilit]
- Gao, S.; Zhong, R.; Yan, K.; Ma, X.; Chen, X.; Pu, J.; Gao, S.; Qi, J.; Yin, G.; Myneni, R.B. Evaluating the Saturation Effect of Vegetation Indices in Forests Using 3D Radiative Transfer Simulations and Satellite Observations. Remote Sens. Environ. 2023, 295, 113665. [Google Scholar] [CrossRef] [Scilit]
- Qi, J.; Xie, D.; Yin, T.; Yan, G.; Gastellu-Etchegorry, J.-P.; Li, L.; Zhang, W.; Mu, X.; Norford, L.K. LESS: LargE-Scale Remote Sensing Data and Image Simulation Framework over Heterogeneous 3D Scenes. Remote Sens. Environ. 2019, 221, 695–706. [Google Scholar] [CrossRef] [Scilit]
- Qi, J.; Xie, D.; Guo, D.; Yan, G. A Large-Scale Emulation System for Realistic Three-Dimensional (3-D) Forest Simulation. IEEE J. Sel. Top. Appl. Earth Obs. Remote Sens. 2017, 10, 4834–4843. [Google Scholar] [CrossRef] [Scilit]
- Lochocki, E.B.; McGrath, J.M. Widely Used Variants of the Farquhar-von-Caemmerer-Berry Model Can Cause Errors in Parameter Estimation. Silico Plants 2025, 7, diaf014. [Google Scholar] [CrossRef] [Scilit]
- Running, S.W.; Zhao, M. User’s Guide: Daily GPP and Annual NPP (MOD17A2H/A3H) and Year-End Gap-Filled (MOD17A2HGF/A3HGF) Products (Collection 6); University of Montana: Missoula, MT, USA, 2019. [Google Scholar]
- Huete, A. A Comparison of Vegetation Indices over a Global Set of TM Images for EOS-MODIS. Remote Sens. Environ. 1997, 59, 440–451. [Google Scholar] [CrossRef] [Scilit]
- Hovi, A.; Forsström, P.R.; Ghielmetti, G.; Schaepman, M.E.; Rautiainen, M. A Dataset Composed of Multiangular Spectral Libraries and Auxiliary Data at Tree, Leaf, Needle, and Bark Level for Three Common European Tree Species. Data Brief 2021, 35, 106820. [Google Scholar] [CrossRef] [Scilit]
- Stinziano, J.R.; Bauerle, W.L.; Way, D.A. Modelled Net Carbon Gain Responses to Climate Change in Boreal Trees: Impacts of Photosynthetic Parameter Selection and Acclimation. Glob. Change Biol. 2019, 25, 1445–1465. [Google Scholar] [CrossRef] [Scilit]
- Muñoz Sabater, J. ERA5-Land Monthly Averaged Data from 1950 to Present. Available online: https://cds.climate.copernicus.eu/datasets/reanalysis-era5-land-monthly-means?tab=overview (accessed on 22 March 2026).
- Yamazaki, D.; Ikeshima, D.; Tawatari, R.; Yamaguchi, T.; O’Loughlin, F.; Neal, J.C.; Sampson, C.C.; Kanae, S.; Bates, P.D. A High-accuracy Map of Global Terrain Elevations. Geophys. Res. Lett. 2017, 44, 5844–5853. [Google Scholar] [CrossRef] [Scilit]
- Alduchov, O.A.; Eskridge, R.E. Improved Magnus Form Approximation of Saturation Vapor Pressure. J. Appl. Meteor. 1996, 35, 601–609. [Google Scholar] [CrossRef] [Scilit]
- Sage, R.F.; Kubien, D.S. The Temperature Response of C3 and C4 Photosynthesis. Plant Cell Environ. 2007, 30, 1086–1106. [Google Scholar] [CrossRef] [Scilit]
- Ocheltree, T.W.; Nippert, J.B.; Prasad, P.V.V. Stomatal Responses to Changes in Vapor Pressure Deficit Reflect Tissue-specific Differences in Hydraulic Conductance. Plant Cell Environ. 2014, 37, 132–139. [Google Scholar] [CrossRef] [Scilit] [PubMed]
- Mayanja, I.K.; Diepenbrock, C.H.; Vadez, V.; Lei, T.; Bailey, B.N. Practical Considerations and Limitations of Using Leaf and Canopy Temperature Measurements as a Stomatal Conductance Proxy: Sensitivity across Environmental Conditions, Scale, and Sample Size. Plant Phenomics 2024, 6, 0169. [Google Scholar] [CrossRef] [Scilit] [PubMed]
- Pan, N.; Wang, S.; Wei, F.; Shen, M.; Fu, B. Inconsistent Changes in NPP and LAI Determined from the Parabolic LAI versus NPP Relationship. Ecol. Indic. 2021, 131, 108134. [Google Scholar] [CrossRef] [Scilit]
- Street, L.E.; Shaver, G.R.; Williams, M.; Van Wijk, M.T. What Is the Relationship between Changes in Canopy Leaf Area and Changes in Photosynthetic CO2 Flux in Arctic Ecosystems? J. Ecol. 2007, 95, 139–150. [Google Scholar] [CrossRef] [Scilit]
- Dörken, V.M.; Lepetit, B. Morpho-anatomical and Physiological Differences between Sun and Shade Leaves in Abies alba Mill. (Pinaceae, Coniferales): A Combined Approach. Plant Cell Environ. 2018, 41, 1683–1697. [Google Scholar] [CrossRef] [Scilit]
- Lichtenthaler, H.K.; Buschmann, C.; Döll, M.; Fietz, H.-J.; Bach, T.; Kozel, U.; Meier, D.; Rahmsdorf, U. Photosynthetic Activity, Chloroplast Ultrastructure, and Leaf Characteristics of High-Light and Low-Light Plants and of Sun and Shade Leaves. Photosynth. Res. 1981, 2, 115–141. [Google Scholar] [CrossRef] [Scilit] [PubMed]
- Yang, X.; Tian, J.; Ciais, P.; Zhou, L.; Reich, P.B.; Wu, J.; Shang, J.; Chave, J.; Lamour, J.; Maréchaux, I.; et al. Amazon Rainforests Are Rejuvenating Their Canopies by Producing More Photosynthetically Efficient Young Leaves under Climate Change. Nat. Plants 2026, 12, 520–531. [Google Scholar] [CrossRef] [Scilit]
- Wullschleger, S.D. Biochemical Limitations to Carbon Assimilation in C3 Plants--A Retrospective Analysis of the A_Ci Curves from 109 Species. J. Exp. Bot. 1993, 44, 907–920. [Google Scholar] [CrossRef] [Scilit]
- Chen, J.; Shen, M.; Kato, T. Diurnal and Seasonal Variations in Light-Use Efficiency in an Alpine Meadow Ecosystem: Causes and Implications for Remote Sensing. J. Plant Ecol. 2009, 2, 173–185. [Google Scholar] [CrossRef] [Scilit]
- Cai, W.; Yuan, W.; Liang, S.; Liu, S.; Dong, W.; Chen, Y.; Liu, D.; Zhang, H. Large Differences in Terrestrial Vegetation Production Derived from Satellite-Based Light Use Efficiency Models. Remote Sens. 2014, 6, 8945–8965. [Google Scholar] [CrossRef] [Scilit]
- Zhao, M.; Running, S.W.; Nemani, R.R. Sensitivity of Moderate Resolution Imaging Spectroradiometer (MODIS) Terrestrial Primary Production to the Accuracy of Meteorological Reanalyses. J. Geophys. Res. 2006, 111, 2004JG000004. [Google Scholar] [CrossRef] [Scilit]
- Zhang, Y.; Guanter, L.; Berry, J.A.; Joiner, J.; Van Der Tol, C.; Huete, A.; Gitelson, A.; Voigt, M.; Köhler, P. Estimation of Vegetation Photosynthetic Capacity from Space-based Measurements of Chlorophyll Fluorescence for Terrestrial Biosphere Models. Glob. Change Biol. 2014, 20, 3727–3742. [Google Scholar] [CrossRef] [Scilit]
- Ball, J.T.; Woodrow, I.E.; Berry, J.A. A Model Predicting Stomatal Conductance and Its Contribution to the Control of Photosynthesis under Different Environmental Conditions. In Progress in Photosynthesis Research; Biggins, J., Ed.; Springer: Dordrecht, The Netherlands, 1987; pp. 221–224. ISBN 978-94-017-0521-9. [Google Scholar]
Disclaimer/Publisher’s Note: The statements, opinions and data contained in all publications are solely those of the individual author(s) and contributor(s) and not of MDPI and/or the editor(s). MDPI and/or the editor(s) disclaim responsibility for any injury to people or property resulting from any ideas, methods, instructions or products referred to in the content. |
© 2026 by the authors. Licensee MDPI, Basel, Switzerland. This article is an open access article distributed under the terms and conditions of the Creative Commons Attribution (CC BY) license.