


Highlights
What are the main findings?
- Sentinel-1 and Sentinel-2 time series have become the backbone of crop monitoring in Central Europe, enabling parcel-scale mapping, phenology analysis, and stress detection despite frequent cloud cover.
- The integration of LPIS/IACS parcel databases, machine learning methods, and multi-sensor remote sensing indicators improves crop classification accuracy and supports climate-related yield variability assessment.
What are the implications of the main findings?
- Multi-sensor remote sensing frameworks combining optical, SAR, and climate data enable scalable monitoring of agricultural systems across heterogeneous Central European landscapes.
- These integrated monitoring approaches enable operational applications, including agricultural policy oversight, verification of Common Agricultural Policy (CAP) compliance, and evidence-based farm management.
Abstract
Remote sensing has become a cornerstone of modern agricultural monitoring, addressing the dual challenges of increasing production while ensuring environmental sustainability. Based on a conceptual framework developed over the past decade, key application areas include yield estimation, phenology, stress assessment (e.g., drought), crop mapping, and land-use change detection. In Central Europe, regionally specific conditions such as fragmented land ownership, small and irregular plots, and high climate variability shape these applications. Annual field crops, such as cereals, oilseeds, maize, and forage crops dominate production and represent the primary focus of monitoring efforts. Optical data from Sentinel-2 are effective for mapping crop types and analyzing phenology, especially when dense time series are available. However, persistent cloud cover during critical growth phases limits the effectiveness of optical approaches, prompting the integration of radar data from Sentinel-1. Multi-sensor strategies increase the robustness of classification and temporal continuity, supporting monitoring under adverse conditions. Reliable reference data from systems such as the Land Parcel Identification System enables parcel-level validation and facilitates object-oriented analyses in line with management needs. Future developments will increasingly rely on advanced time-series analysis, machine learning, and the integration of agrometeorological and crop model data. As climate change intensifies drought frequency and yield variability, remote sensing will play a pivotal role in enabling near-real-time monitoring and decision support within the evolving landscape of digital agriculture ecosystems. The aim of this review article is to provide an overview of crop monitoring in the Central European region over approximately the past fifteen years, emphasizing trends in subsequent technological and procedural developments.
1. Introduction
Agriculture remains a key sector for food security, rural development, and economic stability worldwide. According to the World Bank [1], a large proportion of the world’s poorest populations depend directly on agricultural production. At the same time, agriculture faces increasing pressure from climate change, extreme weather events, and growing food demand associated with a projected global population of 10 billion by 2050. These factors increase the vulnerability of agricultural systems and amplify yield variability [2,3].
In this context, reliable spatial and temporal information on crop status has become essential for effective agricultural management. Traditional monitoring methods often fail to capture the spatial heterogeneity of agricultural landscapes and crop responses to environmental stressors [4]. Remote sensing (RS) provides a systematic and objective framework for monitoring crop conditions at multiple spatial and temporal scales. Satellite observations, including multispectral, hyperspectral, radar, and thermal measurements, enable the assessment of crop vigor, phenology, water status, and nutrient dynamics [5,6].
The increasing availability of freely accessible satellite data and advances in time-series analysis have significantly improved the capability to monitor crop development and detect early stress signals before irreversible yield losses occur [2,7].
In regions such as Central Europe, which are characterized by fragmented land parcels, diverse crop structures, and frequent cloud cover, the effectiveness of remote sensing applications depends strongly on region-specific adaptations of sensors, platforms, and analytical methods [2,8]. In parallel, rapid progress in unmanned aerial vehicles (UAV)-based monitoring and onboard analytics is extending remote sensing from regional surveillance toward field-scale and near-real-time decision support [9].
Given the structural complexity of Central European agriculture, particular attention should be given to the dominant annual crop groups that determine production patterns, management practices, and monitoring requirements across the region.
According to Eurostat statistics [10], cereals for grain represent the dominant crop group in Central Europe. Their area has been increasing since 2000 in almost all monitored countries (Austria, Czech Republic, Germany, Hungary, and Poland).
Other agricultural species with smaller representation, including permanent crops such as vineyards, orchards, and hops, further contribute to the fragmented and heterogeneous agricultural landscapes that challenge remote sensing–based monitoring.
Crop yield is influenced by multiple interacting factors, including topography and soil properties, agrotechnical practices, fertilization and current weather conditions during the growing season. This complexity underscores the need for a tailored approach to each prediction and subsequent evaluation of production [11,12,13,14]. Previous analyses [15,16] focused on the causes of crop yield losses. They found that abiotic factors account for half of these losses. These included high temperatures (20%), low temperatures (7%), drought (9%), salinity (10%) and other stressors (4%). The combination of multiple stressors (e.g., high temperatures and a lack of water) can cause irreversible damage. Therefore, when selecting a variety, it is crucial to consider local conditions and choose a cultivar that is sufficiently resistant to both abiotic and biotic influences [17].
Climate change is increasingly affecting agricultural production in Central Europe. Rising temperatures, more frequent droughts, extreme precipitation events, and shifts in phenological phases are already influencing crop productivity and stability [18,19,20,21]. These changes increase the need for reliable monitoring systems capable of detecting spatial variability in crop conditions and yield potential.
Central Europe exhibits considerable variability in cloud cover patterns due to its transitional position between oceanic and continental climate zones. Western regions, influenced by Atlantic air masses, experience more frequent cloud cover throughout the year. In contrast, eastern areas demonstrate a more continental character with greater seasonal variation in cloudiness. Changes in cloud cover distribution are higher in Eastern and Central Europe because of shifts in atmospheric circulation [22]. The west-to-east gradient in cloud frequency poses significant challenges for satellite-based remote sensing of agricultural lands because the average probability of obtaining cloud-free views in Europe ranges from only 0.2 to 0.4 [23], limiting the availability of optical imagery during critical crop growth stages, particularly from April to September, when timely monitoring is essential for precision agriculture applications. This problem can be addressed by using commercial products such as PlanetScope [24], or by implementing modern unmanned systems that can scan canopies more efficiently at an acceptable spectral resolution in the shortest possible time. The transition period in late October poses additional challenges for crop production. For specialty crops such as pome fruit (apples and pears), the harvest of premium winter storage varieties, those with the highest added value, coincides with an increased risks of sub-zero morning temperatures, frost phenomena, and fog formation. These meteorological conditions, particularly fog, which reduces visibility, and rapid changes in weather conditions, require careful operational planning for UAV and fixed-wing aircraft deployment [25], representing an important challenge for remote sensing monitoring during this critical harvest window.
The term Central Europe has no universally accepted definition. In this review, the region broadly includes the Visegrad countries together with neighboring Central European states, depending on the availability of relevant studies and datasets [24,26,27]. When the V4 countries and the Baltic republics joined the EU in 2004, they had a different agricultural policies and structures than the original EU countries. The most significant differences were the size of land blocks, which remained from the era of collectivization, and lower technical efficiency [28,29]. A typical feature is the high fragmentation of agriculture, with an emphasis on small farms and smaller land plots. The exceptions are the Czech Republic and Slovakia, where large agricultural companies or cooperatives operating on larger land plots still prevail [30]. Geographically, this is a very diverse area, ranging from lowlands to mountains, which strongly affects land use for agricultural purposes.
This review synthesizes recent advances in satellite-based remote sensing of crop production in Central Europe. It focuses particularly on Sentinel-era data, parcel-scale applications, and the integration of optical and SAR observations.
2. Remote Sensing Applications for Monitoring Agricultural Crops
In Central Europe, remote sensing applications have evolved into a tool for managing various crops, including common field crops such as cereals, oilseeds, and root crops, as well as hops, vineyards, orchards, and fruit trees [31]. Research activities have evolved over time from large-scale land mapping to health and nutrient diagnostics at the individual level (e.g., specific tree or plant) using modern tools such as artificial intelligence or machine learning.
When monitoring common field crops, specialty crops and orchards in Central Europe, several basic questions are usually addressed that determine how RS tools are used. These questions address spatial resolution, scanning frequency and spectral details in order to answer operational questions such as “How are crops spatially and temporally classified within the agricultural landscape?” [32,33], “What crop varieties are found here?” [34], “What is the health and nutrient status of crops at the individual or field scale?” [25] and “What is the expected yield?” [35]. Topics very frequently addressed that are taken into account and cited in the following overview include phenology and the temporal dynamics of its development at different locations and questions regarding the determination of stand structure and three-dimensional (3D) metrics of habitats. From a data processing standpoint, emphasis is placed on using platforms depending on the plot size and applying new data processing methods, such as machine learning, AI, and image preprocessing corrections.
When applying remote sensing to agriculture, it is crucial to consider the size and level of intensification of the surveyed plots. As Radlinska [30] states, gradual structural changes in agriculture are taking place in Central European countries. These changes are manifested, for example, by an increase in the economic size of agricultural farms. Over time, these countries adapt to trends in Western Europe. According to Foodnet [36] and Eurostat [29], the number of farms has decreased by approximately 37% over the past 15 years, with primarily small farms under 5 ha disappearing. This has led to the concentration of fields in larger farms, which often change the crop structure in favor of more economically advantageous crops, such as rapeseed and corn, thereby reducing crop diversity. At the same time, there has been a transition to specialization, meaning the decline of mixed farming combining crops and livestock production together and a decrease in demand for fodder crops and some traditional crops. Within orchards, it is necessary to distinguish between forms from intensive, high-density commercial blocks and smallholder and mixed agroforestry parcels. The average farm size in the EU was approximately 17.4 hectares according to the latest agricultural census (in 2020 [31]), with more recent Farm Structure Survey data indicating a continued increase, reflecting ongoing structural consolidation in agriculture. For example, in 2023 the average size of an agricultural holding in the Czech Republic was 106.2 ha (in 2023 [37]), in Germany approximately 60 ha (in 2024 [38]) and in Poland approximately 12 ha (in 2023 [39]). European statistics do not directly address the size of field blocks. However, field block size is an important parameter for the application of remote sensing data with the appropriate spatial resolution. To obtain information on field block size, national agricultural applications must be used, e.g., Land Parcel Identification System (LPIS), Common Agricultural Policy (CAP), Land Parcel Identification System/Integrated Administration and Control System (LPIS/IACS), Polish Agency for Restructuring and Modernization of Agriculture (ARiMr) [40]. LPIS/IACS databases are widely used as reference spatial masks (ground truth) for validating and calibrating satellite-derived products, especially for crop-type classification, land-use mapping, and field-scale phenological analyses.
According to these sources, the average size of partial soil blocks is as follows:
- ○
- The Czech Republic has the largest parcels (approximately 12 ha), reflecting its history of large-scale farming.
- ○
- Poland has the smallest parcels (approximately 5 ha), due to the dominance of small family farms.
- ○
- Slovakia (approximately 6–8 ha) with greater landscape fragmentation and Hungary (approximately 8–10 ha) are in the mid-range.
- ○
- Austria and Germany have moderate parcel sizes (approximately 3–5 ha), influenced by mixed terrain and farm structures.
Many authors (e.g., [41,42]) used data from Eurostat NUTS2/3 regions and the Corine Land Cover classification (Copernicus program) to obtain quality information, which allows one to examine types and forms of land cover, e.g., arable land, other agricultural areas, forests and others. The complexity of crop mask resolution is often mentioned, especially in areas with very small agricultural field, such as southern Poland.
Below, we present the main application areas, commonly used remote sensing platforms and methods, and representative examples from the scientific literature to provide an overview of the state of remote sensing use in Central Europe. Unless otherwise stated, this overview is based on the review framework described in Section 2.1, which included 32 scientific articles published between 2013 and 2025 and identified using the predefined search strategy, keywords, and selection criteria applied in this study. In a few cases, older studies were also included when they were considered methodologically relevant or historically important for understanding the development of remote sensing applications in the region. Recent reviews focusing on crop composition, including common field crops, fruit crops, and specialized orchards, have shown that although these issues are broadly similar across climate zones, local management practices, cultivar composition, and plot size strongly influence which platforms and sensor combinations are feasible in practice [43,44].
2.1. Mapping Land Use/Land Cover, Crop Types and Varieties
The following section summarizes representative studies addressing land-use/land-cover mapping and crop-type detection in Central Europe published over the last decade. As Kuemmerle et al. [45] already reported in 2013, remote sensing is a very effective and accessible tool for the creation of maps of land-use and landscape cover dynamics. In recent decades, the spatial, temporal and spectral resolutions of available data have significantly increased. At the same time, data archives can be used effectively to offer a link to the historical state of the landscape, thus ensuring continuity and consistency of monitoring across regions. This includes the possibility of evaluating even smaller plots. Changes in the landscape can also be monitored in the context of changing phenology, as well as atmospheric and topographical effects.
The most commonly used optical multispectral data, including the moderate resolution imaging spectroradiometer (MODIS), Landsat, Sentinel-2 (S2) and Sentinel-3 (S3), are often supplemented with synthetic aperture radar (SAR) data, primarily Sentinel-1 (S1), due to the frequent cloud cover over Central Europe in recent years. Cloud cover is a frequently mentioned problem in studies focusing on Central Europe.
Studies using LiDAR are less frequent, mainly due to the complexity of data processing and interpretation. Nevertheless, airborne laser scanning provides valuable structural information on vegetation and terrain that can complement satellite observations and support calibration and validation of remote sensing products [46].
Optical data are used continuously in both agriculture and forestry. Immitzer et al. [8] conducted two case studies using S2 optical data. In the first study, they monitored six crop varieties in Lower Austrian region. In the second, seven coniferous and deciduous varieties were mapped in Germany. They used classification methods, namely Random Forest classifier, for data processing. Accuracy of the calculations ranged from 65% for tree varieties to 76% for agricultural crops. The Red Edge, Swir and Blue spectral bands played a significant role in vegetation mapping. In a 2016 study, the authors emphasized the potential of using S2 data. Free Copernicus products were only used around 2015/2016. Until then, other commercial satellite data were used. Schuster et al. [47] stated that multispectral data, specifically the Red Edge spectral band, is a key source of information for land-use classifications. The authors used the Rapid Eye commercial satellite system, which has a high spatial resolution. Also, Heupel et al. [48] also used a combination of Rapid Eye, Landsat 7 and 8, and S2A data to monitor phenological stages and crop types in a region of northwestern Germany. Using multitemporal data during the growing seasons, they detected seven typical crops of Central Europe (wheat, rye, barley, rapeseed, potatoes, maize, and sugar beets) in different phenological stages. The classification results were applied in the 2015 and 2016 seasons. The overall classification accuracy was 89.49% in 2015 and 77.19% in 2016, with the lower accuracy in 2016 likely attributable to adverse weather conditions.
In their study, Bach and Mauser [49] addressed the sustainability of agriculture and the usability of S2 data for this purpose. They emphasized the importance of the S2 twin constellations for the timely availability of data in precision agriculture, including site-specific applications and their ecological and economic benefits. Similarly, Kolecka et al. [50] exploited the potential of S2 time series to map mowing frequency in the Aargau region of Switzerland. Since cloud cover is a significant issue in this region, they tested how missing data affects the ability to accurately detect and map grassland management activities. The highest mowing detection accuracy was achieved by using additional cloud masking and reducing plot size, allowing for the correct detection of 77% of mowing events. Additionally, they found that using only standard cloud masking leads to a significant overestimation of mowing events, and that detection based on sparse time series does not fully correspond to key events in the grass growing season.
As Griffiths et al. mentioned [32], many applications focused on dynamic processes on the Earth’s surface require a temporal frequency of observations that cannot easily be achieved using data from a single optical sensor due to frequent cloud cover. In their study, therefore, they combined Sentinel-2 and Landsat satellite images of Germany. These images provide data with similar properties and can be effectively combined to map larger areas. Their results showed that the most common crops—cereals, rapeseed and maize—were mapped very well. However, the classes “vines and forests” showed lower accuracy. The authors again highlighted the higher accuracy of the model when Red Edge bands were used. The multi-sensor approach is also addressed in the study by Fritz et al. [51], who aimed to reviewed eight major global and regional agricultural monitoring systems, which are also based on remote sensing data. Although the spatial resolution of the images entering the models has improved in recent years, fundamental gaps in the system still make using the data somewhat difficult. This study discussed and presented the main gaps in data and methods, including recommendations for gradually improving methods, new and novel data inputs, and the continuous sharing of an ever-increasing volume of data.
The same satellite data sources—S2 and Landsat—were also used by Meier et al. [52] to evaluate the effect of spatial resolution ranging from 10 to 50 m.px−1 on identifying agricultural fields for digital agricultural services in Central and Western Europe. Three different regions were deliberately selected to represent various cultivated landscapes from extensive agricultural properties to small family farms. Thus, a significant portion of the agricultural diversity in Central and Western Europe was covered. This study showed the most significant raise in the area covered with a spatial resolution between 20 and 10 m, because it was possible to cover the majority of fields with non-specialized crops with this resolution. The authors also considered increasing the spatial resolution from 10 m of S2 to the planned 5 m, which would be much more effective for small farmers’ practical use.
As discussed above, frequent cloud cover over Central Europe makes using optical data considerably more difficult. Preidl et al. [53] presented a new composition and classification method that can effectively use dense satellite time series in areas with frequent cloud cover. This improvement enables more detailed monitoring of land cover in smaller regions.
With access to free Copernicus data, the demand for accurate analyses also increased. Rußwurm and Körner [54] compared deep learning models for crop-type classification on raw and pre-processed S2 data.
In the 2020s, it was quite common practice to work with all available Copernicus products, with an emphasis on removing the influence of cloud cover. Ghassemi et al. [55] addressed the availability and acquisition of accurate data for land-use/land cover (LULC) derivation. Using S2 data, they created a detailed LULC map with 19 crop-type classes and two broad categories for forests, shrubs and grasslands. They discussed a comparison of the results achieved with those of a similar study using S1 data. The comparison indicated that S2 produced slightly better results; however, its spatial coverage was somewhat reduced due to data gaps caused by cloud cover. In contrast, Gallo et al. [34] focused on crop mapping using only S2 time series to determine “where and when” crops are grown. They developed a solution called “class activation interval” that helped to determine in which time interval of the input time series a given class is probable to occur. The accuracy reached up to 93%. According to the authors of this study, their results had a dual significance: (1) they demonstrated that the network can accurately interpret the studied physical processes, including bare soil conditions, plant growth, senescence, and harvesting, in relation to specific cultivated varieties, and (2) they provided the end users with additional information (e.g., crop presence and its temporal dynamics). This information may also have an impact on control aspects at the government level. Henits et al. [56] used S2 images as a data source for a Hungarian pilot project to monitor agricultural subsidies. The study aimed to develop a solution based on open-source components and to evaluate the main strengths and limitations of S2 within a complex set of tasks. These tasks included verifying basic grasslands and arable land cultivation and compliance with ecological area criteria. Crop classification achieved accuracy 88% for 22 vegetation classes. As is typical for Central Europe, the main limitation was the size of the fields. Thus, 4% of mainly small plots had to be excluded. The authors also discussed improving the S1 data integration system to achieve better temporal resolution, given the frequent cloud cover.
As part of the development of the Green Deal policy, Marcinkowski and Szporak-Wasilewska [57] investigated the dynamics of soil erosion on agricultural land in Poland on a monthly scale using the revised universal soil loss equation model (RUSLE). These models use satellite images, with Terra Aqua data being mentioned in the study, which is affected by cloud cover. The normalized difference vegetation index (NDVI) was derived from the data.
Fusing or combining S1 and S2 data appears to be a promising solution for improving the temporal resolution of images, particularly given the frequent cloud cover over Central Europe. However, some authors also mention the complexity of processing and interpreting SAR data.
As early as 2017, Bargiel [58] presented in his study a newly developed multitemporal classification approach based on S1 data. This approach includes knowledge of phenological changes in arable land and identifies phenological sequence patterns (PSP) of crop varieties based on a dense S1 dataset and precise plant phenology information. The performance of the developed methodology was tested over two different growing seasons using more than 200 terrestrial data fields located in north of Germany. This author showed that the intense time series of S1 images enabled the highly accurate classification of grassland, maize, rapeseed, sugar beets, and potato using both PSP and the standard classification method (Random Forest and Maximum Likelihood). This approach also did better than standard methods for cereals, particularly for spring barley, as well as for winter barley, rye, and oats. The PSP approach showed greater sensitivity to subtle variations, such as changes in the proportion of weeds in the field.
Hütt et al. [59] in their study underlined the complexity of using SAR data but also discussed its potential applications. The study presented a case study of crop classification from S1 SAR data. Validation showed a high accuracy of up to 96.7% when classifying crops into 11 categories using freely available solutions.
Holtgrave et al. [60] used S1 and S2 data at 22 test sites in Lower Saxony, Germany, covering approximately 35,000 ha of four different major European agricultural land-use types, namely grassland, maize, spring barley and winter wheat. We examined the relationship between S1 and S2 indices across different land-use types and three phenophases (growing, green, and senescent). Despite the fundamentally different signal generation mechanisms, clear relationships emerged between optical and SAR indices that were largely independent of environmental variables. However, these relationships could be stratified by land-use type and phenophase and showed consistent patterns across the study sites. Their strength could be further improved through regional landscape clustering.
This approach was further explored by Asam et al. [61], who classified 17 crop types across Germany in 2018 at 10 m spatial resolution. Using Random Forest models with monthly statistics derived from S1 and S2 time series reduced data volume and preprocessing requirements while preserving key phenological information essential for crop discrimination. The integration of optical and SAR data improved overall classification accuracy by 6–9% compared to single-sensor approaches.
Similarly, Blickensdörfer et al. [33] developed a method for mapping 24 agricultural land-cover classes in Germany over the period 2017–2019, characterized by substantial interannual meteorological variability. Despite contrasting conditions, including drought and non-drought years, the method achieved high overall and class-specific accuracies for dominant crops. The resulting maps showed strong spatial consistency and accurate field delineation. Combining optical, SAR, and environmental data increased overall accuracy by 6–10% relative to single-sensor approaches, with optical data outperforming SAR. Overall accuracy ranged from 78% to 80%, and mapped areas corresponded well with regional and national agricultural statistics.
Snevajs et al. [62] developed a methodology for the supervised classification of time series data from S2 and S1 satellites. They compared accuracy based on different sources of datasets and examined how classification accuracy evolves over the season. They used data from unified Land Parcel Identification System (LPIS) in the Czech Republic, as an official data source.
Jensch et al. [63] investigated a classification algorithm combining field data, satellite imagery from multiple optical sensors (S2 and Landsat), and S1 SAR data to map intermediate crops in Brandenburg, Germany. The most accurate classification was based on a combination of all input features, achieving an overall accuracy of 92.9%. The results underscore the importance of adequate optical data coverage in the fall and winter for precise intermediate crops mapping and demonstrate the capacity of SAR data to enhance classification accuracy.
The current study (published in 2026) by Rynkiewicz et al. [64] uses S2 satellite data and spectral indices to detect land cover changes and vegetation loss using the Random Forest machine learning model in the Łódź province, Poland. The method combines bi-temporal analysis of satellite images, which serves to create reference training data and allows monitoring vegetation changes in the years 2018–2021. The results show very high change detection accuracy (OA > 0.97; Kappa = 0.95) and confirm that the model is transferable over time, which can make long-term monitoring of land cover changes more efficient.
Accurate maps of orchard extent and crop type are essential for regional monitoring programs, including inventory, yield forecasting, and environmental impact assessments. Multitemporal, medium-resolution satellites (S2 MSI) have proven useful for discriminating orchards from other vegetation when exploiting phenological information is rather than a single image [65,66]. Zhou et al. demonstrate that constructing month-by-month indices (single-month vegetation indices, accumulated indices, or adjacent-month differences) increases classification robustness across complex phenologies [65]. Similarly, hybrid approaches that fuse S1 (SAR) and S2 time series improve separability when spectral signals are confounded (e.g., orchards vs. artificial forests or other orchards) as SAR adds structure and geometric information insensitive to clouds [67,68]. Object-oriented segmentation rather than pixel-based further improves species-level discrimination when combined with optimized feature sets (e.g., spectral, phenological, texture, and Red Edge metrics) and machine learning classifiers such as Random Forests [68,69].
Beyond individual case studies, several reviews on fruit crops summarize how remote sensing and Geographic Information System (GIS) are used to map fruit-growing areas, assess the expansion or decline of orchards, and delineate management zones [43,44]. These syntheses emphasize that while S2 provides an operational foundation, wall-to-wall mapping of orchards frequently requires integration of cadastral data, existing land-cover maps, and high-resolution imagery, especially in fragmented, peri-urban or mixed-use landscapes, which resemble many Central European regions.
Another line of research focuses on mapping individual trees or species-level in orchards. A recent review on identifying individual fruit trees across climatic zones highlights that crown delineation, tree counting, and species discrimination can be achieved through spaceborne, airborne, and terrestrial remote sensing when appropriate segmentation and classification workflows are employed [70]. These methods are directly relevant when Central European authorities seek to distinguish apples, pears, cherries and nuts for subsidy schemes, pest-risk zoning, and carbon accounting.
Practical implications for Central Europe include using multi-season S2 stacks (spring bloom, mid-season, late summer/early fall) processed on cloud platforms (e.g., Google Earth Engine) to derive robust and repeatable orchard masks. When parcels are small and mixed, it is generally necessary to supplement with high-resolution UAV or aerial imagery for parcel-level accuracy [66,67,70].
Over the last decade, crop-type and land-use mapping in Central Europe has evolved from single-image classification toward dense multitemporal satellite time-series analysis. Operational monitoring now relies mostly on S2 optical observations combined with S1 SAR data, which provide both spectral information and cloud-independent observations. Recent studies increasingly employ machine learning and deep learning approaches applied to satellite time series, often supported by parcel-level reference datasets such as LPIS/IACS. The availability of Red Edge spectral bands, cloud-computing platforms, and large satellite archives has significantly improved classification accuracy and enabled operational parcel-scale crop mapping. The most robust technological pathway today therefore combines multi-sensor time-series analysis (e.g., S1, S2, Landsat), machine learning algorithms, and parcel databases, allowing reliable crop classification even under fragmented agricultural landscapes and frequent cloud cover typical of Central Europe.
Despite these technological advances, several limitations remain in the application of remote sensing for agricultural monitoring in Central Europe. One of the main constraints is frequent cloud cover during the growing season, which often limits the availability of optical satellite imagery at key phenological stages. This has led to an increasing use of radar data and multi-sensor approaches combining optical, SAR, and UAV observations. Additional challenges include fragmented field structures typical of Central European landscapes and the need for reliable training and reference datasets when applying machine learning methods. Furthermore, strong year-to-year weather variability is a characteristic feature of agriculture in this region, highlighting the importance of multi-year observations and region-specific methodological approaches.
2.2. Phenology and Temporal Analysis
The phenology and dynamics of crop growth over time is another very frequently addressed issue in the Central European region, representing 16 of selected studies in our contribution. Accurate classification and determination of crop phenology is crucial for collecting agricultural statistics, effectively managing, controlling biodiversity, ensuring food security, and setting the right agricultural policy. Agricultural crops undergo significant changes during the growing season, particularly in terms of phenology. This information can be crucial for capturing the variability of vegetation cover, but only if suitable data are available, e.g., due to a much-discussed cloudiness.
The study [71] proposed and tested an efficient hierarchical classification algorithm based on multitemporal Landsat satellite images for mapping crop types in fields within the basin of a large lowland river in Germany. As is typical for the Central European region, emphasis was placed on data availability in terms of both temporal and spatial resolution. The authors asked themselves what the optimal time is to take images with respect to the phenological growth phase. They stated that crop phenology can differ significantly depending on the region and agro-climatic conditions of cultivation. These regional differences can be explicitly considered when mapping crop types over large areas. One approach to addressing these issues is normalizing temporal profiles of reflectance or phenological parameters according to seasonal meteorological conditions.
Bartoszek’s paper [72] focused on assessing the usefulness of optical satellite data and vegetation indices obtained from MODIS data for determining the growth and development of winter oilseed rape (Brassica napus L.) in Central European climatic conditions. The analysis is based on using five vegetation indices from the period preceding the measurements and field observations to predict these two stand characteristics. In the case of rapeseed plant height after flowering and the beginning of ripening, however, no statistically significant correlation was found.
Similarly, Domínguez et al. [73] addressed how data from a medium spatial resolution Landsat satellite can be used to derive a growth model based on the most commonly used vegetation index NDVI. Using the Biologische Bundesanstalt, Bundessortenamt, und Chemische Industrie (BBCH) scale, the growth model predicted the phenological development of winter wheat (Triticum aestivum) and winter oilseed rape (Brassica napus L.) in an 11.5 ha field in the Czech Republic. Images for analysis were selected from the entire growing season of both crops, from sowing to harvest. The results showed that, after proper preprocessing, Landsat images can be reliably used to predict the growth models of selected crops. The authors stated that the advantage of the presented method is the ample availability of satellite images and their easy use in deriving a prediction model from the vegetation index.
In contrast, Bargiel [58] addressed how knowledge about phenological changes in general can be applied on agricultural land. He developed a new multitemporal classification approach based on a large amount of data in the northern German region. Additionally, Heupel et al. [48] presented a classification algorithm identifying crop types resulting from phenological development and reflectance properties of the stand of a multitemporal series of satellite images taken in Germany using Landsat 7 and 8, S2A, and Rapid Eye.
Vreugdenhil et al. [74] emphasized the high usability of European Space Agency—ESA’s Copernicus products, especially the S1 satellite. This satellite has high spatial and temporal resolution and features making it well-suited for monitoring oilseed rape, maize, and winter cereals in Germany. Their study demonstrated the high potential of SAR data for monitoring water content and crop phenology development. They explained 97% and 63% of the variability in vegetation water content in maize and winter cereals, respectively. However, the results varied considerably depending on the analyzed period, suggesting that incorporating meteorological data into account is crucial for achieving higher accuracy.
Kyere et al. [75] investigated this issue using multitemporal and multi-sensor data, in this case a combination of S2 and Landsat images, with complementary information on phenological metrics and topography. They found that this aggregated information can accurately discriminate different crop-types in a heterogeneous agricultural landscape. In this study, 13 major crops in northern Hesse, Germany were addressed. The presented hypothesis was addressed by answering the following specific questions: Which combination of predictors from multisource data leads to the best model for crop type discrimination? What is the contribution of phenological metrics and topographic information to a crop discrimination model?
Tůma et al. [76] employed a multitemporal and multi-sensor approach to monitor winter wheat and rapeseed as the most important crops in Czech agriculture. The authors emphasized the importance of SAR data (S1) especially given frequent cloudiness. However, they also incorporated known information from the interpretation of optical data in their analysis NDVI calculated from S2. The study showed that the temporal evolution of the radar vegetation index (RVI) derived from S1 is influenced by noise, primarily due to the combination of images from different relative orbits. Separating images by relative orbit produced time series that aligned more closely with the phenological curve. Simple linear regression between NDVI and RVI further indicated that accounting for relative orbit slightly improved the coefficient of determination. Specifically, selecting an appropriate relative orbit increased the coefficient of determination from 0.281 to 0.387 for wheat and from 0.233 to 0.316 for rapeseed.
On the other hand, Schulz et al. [77] only used optical data (S2, from 2016 to 2019) to calculate NDVI and monitor and detect catch crops at the field level in 4 federal states in Germany. They developed a new machine learning method based on determining characteristic temporal patterns and 19 descriptions for automatic forecast. They trained 15 Random Forest classifiers for different regions and years, then performed multi-level validation. The RF classifier outperformed other models, achieving an average prediction accuracy of 84% for the two evaluated classes: catch crops and non-catch crops. Under optimal annual meteorological conditions, they achieved an accuracy of up to 90%. Decreased prediction accuracy was caused by meteorological and climatic influences, especially heat waves and early frosts, which are phenomena that are also often observed in this period in the Central European region, especially in connection with climate change. Despite the inaccuracies, the newly developed method appeared to be satisfactory for, for example, winter crops, such as cereals, grasslands and fallow. However, it was ineffective for different groups of catch crops due to their very similar phenological profiles.
Also, Tomíček et al. [78] proposed a two-step procedure for harmonizing S2 MSI and Landsat Operational Land Imager (OLI) spectral data to detect leaf area and water content using derived indices for dominant crops grown in the Czech Republic, including winter wheat, spring barley, winter rapeseed, alfalfa, sugar beet, and maize. There was very strong agreement between leaf area index (LAI) estimates from S2 MSI and Landsat OLI data, as well as between these estimates and independent ground measurements (r between 0.7 and 0.98). The authors concluded that using data from all currently available S2 (A/B) and Landsat (8/9) satellites, one can create a dense, harmonized LAI time series with high potential for use in precision agriculture.
Crop phenology characterized using multitemporal indices calculated from S1 SAR data was investigated by Woźniak et al. [79]. They developed and tested an object classification based on 16 crops for Poland as a whole. Their analysis revealed that the general regional accuracy ranged from 86.36% to 89.13% in 2019 and from 85.95% to 89.81% in 2020. These results demonstrated the effectiveness of the method and its robustness to environmental conditions across Poland.
The authors Harfenmeister et al. [80] monitored the phenological development of winter wheat and winter barley in Germany using time-series analysis of S1 SAR and S2 optical data (NDVI). They investigated the sensitivity to individual phenological phases. Local minima, maxima and turning points in the time series were identified and compared with the dates of the onset of phenological stages. Some phases, such as the beginning of tillering and tillering, could be reliably detected from both radar and optical parameters, while other phases were less clear. The results show that the combination of radar and optical data allows for the monitoring of the phenological development of crops and is transferable between locations and years, with differences mainly caused by meteorological conditions.
Monitoring catch crops appears to be an important area of investigation, primarily because of their ability to fix carbon and prevent nitrogen leaching during the winter. Selvaraj et al. [81] addressed this topic. These authors noted that the growing season of catch crops in Germany is often characterized by dense cloud cover. Therefore, using dense time series of S1 SAR data to monitor catch crops appeared to be a promising option. However, understanding the temporal behavior of radar parameters in relation to catch crops remains largely unexplored. The results showed that catch crops have a unique temporal pattern compared to main crops and each of these extracted parameters has a different sensitivity to catch crops. The monitored polarization parameters VV and VH are sensitive to phenological stages and crop structure. On the other hand, VH/VV and dpRVI were shown to be highly sensitive to crop biomass. Coherence can be used to detect sowing and harvesting events. The authors also monitored the most commonly grown crops, which are wheat and winter rapeseed.
Research is also directed at less studied specialty crops, such as hops, as discussed in the paper by Řeřicha et al. [82]. Hops play an important role in beer production in the Czech Republic and Germany. This study evaluated the development of hop stands in terms of yield and production quality. During the different phenological phases, the stands were evaluated using a multispectral camera mounted on a UAV. Five vegetation indices were used to evaluate the stand, which were used as indirect indicators for determining vitality, health, and structure to predict yield and quality parameters (alpha acid content in hop cones). Statistical analysis revealed that spectral indices can explain up to 61% of hop yields, with better results being achieved in later stages. However, spectral indices could explain a maximum of 18% of the qualitative parameters. In contrast, the best results were achieved in the early stages of stand development.
Recent study of Löw et al. [83] from 2026 proposed a framework for monitoring crop phenology in north-eastern Germany’s Mecklenburg-Western Pomerania region using radar time series from the Sentinel-1 satellite (SAR), which includes backscatter parameters, interferometric coherence and polarimetric characteristics. Phenological phases were identified using breakpoints in backscatter intensity or interferometric coherence in the SAR data series and normalization by Growing Degree Days (GDD), which allows monitoring crop development even with limited field data. The results showed that the combination of multiple SAR parameters and the S1 orbit allows for reliable monitoring of crop phenology at field level, which has potential for use in precision agriculture and agricultural production monitoring.
Similarly, a study by Shojaeezadeh et al. [84] used S1 and S2 satellite data in combination with high-resolution climate data to predict crop phenological stages using the LightGBM machine learning model. The model was trained on data from the German Phenology Network (2017–2021) and allows predicting 13 phenological stages of eight major crops at a resolution of 20 m. The results showed good prediction accuracy (R2 > 0.43; average error of about 6 days) and confirm that the combination of radar satellite data and climate information is suitable for phenological monitoring and decision support in agriculture.
A study by Flores et al. [85] evaluated the use of S1 (SAR) data for monitoring phenological characteristics of wheat and maize using dense time series of VH, VV signals and their VH/VV ratio. Phenological phases were derived from the processed time series using inflection point and curvature change analysis and subsequently compared with field observations and reference phenological data. The results show that SAR data can reliably detect crop growth phases (deviation of approximately 4–6 days for wheat and 2–10 days for maize) and allow the creation of spatial maps of phenology, which supports applications in precision agriculture and improves yield estimates.
Also, a recent study by Prikaziuk et al. [86] evaluated the use of S2 satellite data and the Copernicus Land Monitoring Service, the pan-European High-Resolution Vegetation Phenology and Productivity product suite for monitoring crop phenology based on indicators of the beginning and end of the growing season. The validation was performed on 164 growing seasons, 14 crop types and fields in 10 European countries including Central Europe and the results were compared with field sowing and harvesting data. The satellite phenology indicators showed good correlation with real sowing (r = 0.75) and harvesting (r = 0.56) data, although the accuracy varies between spring and winter crops. The study shows that satellite products can effectively support crop phenology monitoring and agricultural decision-making, but it is necessary to carefully select the appropriate indicators and methodologies for a specific crop type.
Phenological metrics, such as dates of budburst, flowering, leaf-on/leaf-off, and fruiting, extracted from time series imagery, can be used for classification and monitoring of orchard tree condition. Chabalala et al. [66] used optimized S2 phenological metrics to classify fruit tree types in smallholder orchards and demonstrated that selecting the optimal months substantially improves classification performance [66]. Time-series approaches also allow for the detection of abnormal phenological shifts, such as early or late leaf-out, and premature senescence, which may indicate stress, late frost damage, or disease outbreaks. This is highly relevant in climate-sensitive Central European orchards.
In the broader literature on fruit crops, temporal metrics derived from multitemporal imagery are consistently highlighted as key predictors of orchard extent and condition, particularly when combined with terrain and soil information in GIS environments [43,44]. In Central Europe, where late frost events and spring droughts often impact budburst and flowering, phenology-aware RS workflows are crucial for classification and risk assessment.
Technological progress in crop phenology monitoring has shifted toward high-frequency satellite time-series analysis integrating optical and radar observations. S2 and Landsat provide spectral indicators such as NDVI, LAI, and other vegetation metrics, while S1 SAR ensures continuous monitoring of crop structural changes during cloudy periods. Recent research increasingly combines satellite time series, phenological metrics, meteorological normalization, and machine learning models to detect crop growth stages and seasonal anomalies. Advances in time-series smoothing algorithms, phenological feature extraction, and cloud-based processing platforms further improve monitoring capabilities. The most effective technological approach therefore involves harmonized multi-sensor time series (S1, S2, Landsat) combined with machine learning and phenological modeling, enabling robust monitoring of crop development across heterogeneous Central European agricultural landscapes.
2.3. Stand Structure, Individuals’ Detection and Delineation, 3D Metrics, Topography
3D metrics include both monitoring and reconstructing the structure of agricultural crops and trees, i.e., creating surface and 3D terrain models. Information on slope of the relief and the water runoff accumulation is important for determining nutrient distribution efficiency and erosion risks.
In a study published in 2008, Ehlert et al. [87] mentioned that information on site-specific crop parameters, such as plant height, coverage and biomass density, is important for optimizing crop management and harvesting processes. They characterized the laser rangefinder as sufficiently accurate, reliable, and cost-effective. Their study focused on the design and implementation of a triangulation-based laser system to measure crop biomass density under field conditions during the 2005 growing season. Measurements were taken on rapeseed, winter rye and wheat. The coefficient of determination between crop biomass density relative to fresh and dry matter and the average height of the laser reflection point ranged from 0.93 to 0.99. For grasslands, however, the coefficient of determination decreased due to variable morphological characteristics, ranging from 0.88 to 0.94.
Similarly, Hoffmeister et al. [88] used a ground-based laser scanner to determine sugar beet parameters in a multitemporal approach during the 2008 growing season. They are georeferenced, cropped, and compared the resulting point cloud with official elevation data. The estimated plant parameters included (i) surface model comparisons between different crop surfaces, (ii) crop volumes, and (iii) soil roughness parameters. In the following report [89], they extended the study to include winter barley, which was also scanned in 2008. High-resolution crop surface models (0.30 m grid) were created for each survey date. Thanks to their precise georeferencing, these models could be visualized as plant growth maps and combined with other data. Overall, the observed spatial variability found was consistent with findings from other sensors, e.g., satellite images and digital orthophotos, manual measurements.
In their paper, Grenzdörffer and Niemeyer [90] described a photogrammetric workflow to determine the anisotropic reflectance properties of a given surface. In this case, the surface was that of winter wheat. They propose a multi-camera system designed specifically for micro-UAVs with a minimum payload of 1 kg.
Kumhálová et al. [91] evaluated the suitability of airborne laser scanning data as an additional data source for creating topographic characteristics on an 11.5 ha field in the Czech Republic with regard to the needs of precision agriculture. The study derived models of elevation, slope, and flow accumulation and determined the correlation between yield and topography over a seven-year period in relation to precipitation and temperature. The suitability of ALS data was demonstrated, though with some limitations. The flow accumulation model derived from the original ALS data indicated the correct trend, albeit less clearly than other models. In drier years, the correlation coefficients between flow accumulation and yield were 60–70%.
This study was expanded by Kumhálová et al. [91] to include more derived models, including digital elevation, slope and flow accumulation models, which stemmed from 8-directions single flow algorithm and/or 8-directions multiple flow algorithm from three different data sources on a large experimental plot spanning 11.5 ha. Topographic attributes were derived from two RTK-GPS and ALS datasets. They demonstrated that all three data origins could be employed to create topographic attributes for precision agriculture. Also, common GIS software could be used to evaluate flow accumulation. They did not find any significant difference between flow accumulation models created using the single and multiple flow direction algorithms. From an agronomic perspective, the effect of field topography on yield of wheat, winter rapeseed, and oats was found to be more pronounced in drier and warmer years.
Geipel et al. [92] also focused on predicting crop yields, but they used a combination of different data sources. Specifically, they used a combination of vegetation index maps and detailed 3D crop surface models. Their study employed UAVs and RGB images to predict corn yield at three growth stages. Three linear regression models were tested according to crop height. The results showed that combining spectral and spatial modeling, based on aerial imagery and crop surface models (CSM) is a suitable method for predicting corn yield in the mid-season, especially at the end of stem elongation.
Similarly, Bending et al. [93] combined vegetation indices and plant height information to estimate the biomass of 18 barley varieties grown in Germany. For the measurements, they used a hyperspectral camera mounted on a UAV. Plant height was also derived from a CSM based on UAV images. The best results were obtained by comparing the relationship between plant height and biomass. Plant height with vegetation indices proved to be a reliable method for estimating biomass in summer barley. Furthermore, vegetation indices derived from the visible part of the spectrum appeared useful for complementing biomass estimation. However, the main limitation was that visible band VIs only worked for the early growth stages of summer barley.
3D modeling is also useful for monitoring specialty crops. Starý et al. [94] quantified canopy volume and surface area of hop gardens to assess crop condition and predict yield potential. They used two types of UAVs to acquire visible (RGB) and multispectral images. Seven commonly used RGB indices were derived from these images. The results revealed significant variations in the area in hop garden areas based on camera specifications, particularly the wavelength centers, as well as the design and flight parameters of two UAVs types. Comparing the different indices showed that the (ExG) and the Triangular Greenness Index (TGI), exhibited the greatest agreement among the estimated vegetation indices in the area of hop gardens using both cameras. Further processing with the Fuzzy Overlay tool demonstrated high accuracy of estimating the green cover area for the ExG and TGI vegetation indices.
For per-tree management in orchards, pruning planning and per-tree treatments, delineating crowns and estimating height and volume are essential. UAV imagery (RGB and multispectral), UAV-borne LiDAR and photogrammetric point clouds are widely applied to derive crown polygons, height models, and crown area metrics. These metrics correlate with canopy vigor and potential yield. Though many recent studies come from non-European sites, the methodology is directly transferable. Segmentation methods range from object-based image analysis (OBIA) to instance segmentation by deep networks (e.g., Mask R-CNN and SAM) on very-high-resolution UAV orthomosaics. These tree-level metrics support site-specific interventions (e.g., selective thinning and variable-rate inputs) and bridge the gap between remote sensing and precision orchard operations [67,68].
Survey papers dedicated to UAV-based orchard management provide an overview of how low-altitude platforms, equipped with RGB, multispectral, thermal or LiDAR sensors are used to derive tree height, canopy volume, structural indices, and digital surface models at the scale of an orchard [95,96]. Their results show that tree-geometry products are now routinely integrated into pruning decision support, sprayer calibration, and assessment of planting uniformity. A separate systematic review focusing on UAVs and neural networks in orchards summarizes recent progress in automated tree and crown detection, instance segmentation, and 3D reconstruction from multi-view imagery [97].
For Central European orchards, these results imply that UAV-based 3D products can provide the structural reference layer needed to interpret satellite-based signals, such as linking crown volume and density to S2 reflectance and SAR backscatter. These products can also be used for design per-tree management interventions aligned with local labor and machinery constraints.
Recent technological progress in structural crop monitoring has been driven by the integration of high-resolution 3D sensing technologies, including LiDAR, UAV photogrammetry, and terrestrial laser scanning. These technologies allow detailed reconstruction of crop canopy structure, plant height, plant density, and terrain characteristics, which are essential for understanding biomass variability and field-scale productivity patterns. Recent studies increasingly combine UAV-derived structure-from-motion models with multispectral imagery and satellite observations, enabling simultaneous analysis of structural and spectral crop properties. Advances in computer vision and deep learning methods for plant detection and segmentation further support automated identification of crop structures and individual plants. The most promising technological pathway therefore integrates UAV-based high-resolution 3D modeling with satellite-derived spectral indicators, enabling multi-scale monitoring of crop structure from individual plants to field scale.
2.4. Vitality, Health, Nutrients and Stress Monitoring
Monitoring the vitality, health and nutrient content in the context of crops is a very frequently discussed topic in precision agriculture. It plays an important role in the derivation of application maps and other useful information. Defining the current state of crops is closely related to detecting and quantifying stress of any kind. There has also been a gradual transition from satellites to UAVs, which can monitor with greater detail, but are more practical for smaller plots.
Leaf area monitoring is a common method for assessing the health of a stand and predicting subsequent yield based on photosynthesis. Vuolo et al. [98] used a multi-time series data from DEIMOS-1 satellite sensors to calculate LAI in an agricultural region in eastern Austria. For their analysis, they derived a Weighted Difference Vegetation Index (WDVI) from RED and NIR bands.
Harfenmeister et al. [99] investigated the use of SAR S1 for detecting vegetation variability in Germany. Using the temporal profiles of SAR backscatter in VH and VV polarizations, and their VH/VV ratio, they imaged barley and wheat in 2017 and 2018. Parameters including wet and dry biomass, absolute and relative vegetation water content, LAI, and plant height were assessed and correlated with SAR data using the coefficient of determination. While some fields achieved coefficient of determination values above 0.9, the authors stated that formulating clear rules can be challenging. It is due to the many affecting factors, uncertainties, and lack of agreement that ultimately characterize SAR data.
Tanda and Chiarabini [100] examined the use of remote sensing in precision viticulture. They scanned vineyards in Burgenland, Austria, using both aerial and proximal sensing techniques. UAV images were used to calculate the NDVI, which was also supplemented by proximal thermal imaging and the Crop Water Stress Index. Vitality maps showing the presence of canopies at different levels of vegetation characteristics within a given plot were derived. These results provided a range of information useful for choosing optimal vineyard management strategies.
Jełowicki et al. [101] used a Sequoia multispectral sensor also mounted on a UAV to assess winter damage to rapeseed, specifically frost damage. Four vegetation indices were calculated to classify the identified damaged areas of the stands. The tests carried out showed that detection using multispectral data from UAVs to detect damage can be a successful alternative to direct field measurements for estimating the area of affected by winterkills. The best results were achieved in a study of damage detection using Optimal Soil Adjusted Vegetation Index and NDVI indices and images with a ground sampling distance of 10 cm, achieving an overall classification accuracy of 95%. Results from other approaches with different flight settings and vegetation indices were also promising.
In contrast, Ayalew [102] used multitemporal data from Landsat 7, Landsat 8, and S2 data from 2013 to 2016, combined with high-resolution agricultural land-use data from the Integrated Administration and Control System from the Uckermark district in northeastern Germany, to quantify the influence of biophysical variables such as slope shape, erodibility, and crop growth stage variation, on soil erosion. The authors derived NDVI to capture spatiotemporal variations and determine a coverage factor for erosion prediction at a larger landscape scale.
Janoušek et al. [103] presented an alternative, more detailed approach to estimating the correct harvest time for corn. This approach is based on UAV monitoring with a multispectral camera to derive vegetation indices. This method focuses on the relationship between maturity data obtained by photogrammetry and parameters obtained by the chemical analysis of corn. They evaluated statistically significant linear relationships between vegetation indices, specifically the normalized difference Red Edge index (NDRE) and NDVI, as well as nutritional values such as dry matter, starch, and crude protein. Their goal was to suggest different aspects and paths to predict the optimal harvest time. The results were discussed in terms of the actual limitations of the method, the benefits for agricultural practice and planned research.
Soil tillage and its effect on wheat varieties were monitored by Balážová et al. [12]. They evaluated the effect of various soil tillage technologies on the growth of the old Khorasan wheat variety compared to the modern spring wheat variety Kabot (Triticum aestivum). The experiment was conducted on six small plots in the Czech Republic, making it possible to use a UAV equipped with a multispectral and thermal camera. Flight missions were supplemented with GreenSeeker handheld sensor measurements and plant and soil analysis. The results showed that the ancient Khorasan wheat was better suited to conventional tillage conditions. These conditions are characterized by low bulk density and high total soil porosity. They generally increased the nutritional value of the yield in this experimental plot. At the same time, it was found that this ancient wheat does not deplete the soil. The results also showed that the sensors used in this study are good indicators of micronutrients content in plants and grains. An inexpensive RGB camera can provide relevant results, particularly when more precise equipment is unavailable. The results obtained from it did not differ from those obtained using more expensive multispectral cameras.
Csajbók et al. [104] carried out an experiment in Debrecen, Hungary during the 2020/2021 period. The experiment was based on a series of field measurements and aerial surveys and investigated how oats respond to foliar treatments with silicon and sulfur. They monitored the effects of these treatments on physiology, production and stress tolerance. Simultaneously using in situ (e.g., elevation, soil pH, NDVI, SPAD, and chlorophyll content) and aerial (NDVI and NDRE) surveys, including UAVs, provided a diverse data source for the evaluation. The authors emphasized the use of UAVs for field measurements.
Mezera et al. [105] compared optical measurements and vegetation assessments to diagnose plant nutritional status on a farm in the Czech Republic from 2017 to 2020 within the framework of specific crop management. They used S2 to derive six vegetation indices and compared them with the proximal measurement from the ISARIA system. The results confirmed that the sensitivity of proximal and remote crop sensing is similar and has applicability for diagnosing crop status. They also confirmed their usefulness for implementing variable nitrogen fertilizer application during the growing season. Therefore, the main difference between these two sensing methods remained in their practical use.
Jędrejek et al. [106] presented an analysis of the impact of drought on winter wheat yields in two pilot regions in Poland’s West Pomeranian Voivodeship (NUTS-2 region PL42), the area most affected by agricultural drought. They indicated the difference between “potential drought”, resulting from meteorological and soil conditions, and actual losses, which are also influenced by agrotechnical factors. The agricultural drought monitoring system was further developed to create a method for estimating the impact of drought on crops based on unambiguous criteria using high resolution temporal and spatial remote sensing data.
Dobosz et al. [107] evaluated the effectiveness of using UAV data, specifically a digital surface model based on RGB imagery and NDVI derived from multispectral image. to assess damage to maize caused by wild animals, especially wild boars, at two stages of maize growth. The accuracy of crop damage assessment was significantly lower for smaller, such as the width of a single maize row, or very narrow areas. Digital surface model proved to be more useful than the NDVI in detecting crop damage because it can be applied at any stage of maize growth.
Jędrejek et al. [108] presented the concept of using S2 multispectral satellite images to create detailed representation of the available soil and agricultural maps at a scale of 1:25,000. The following research hypothesis was formulated in the presented work: Spatial and temporal analysis of high-resolution satellite images can improve the quality of the archival soil and agricultural maps at larger scales. The results were the first step toward developing a general remote-sensing based model for a detailed representation of the soil and agricultural map of Poland. This model will significantly improve the accuracy of the drought monitoring system developed by the Poland’s Institute of Soil Science and Plant Breeding. Compared to the other mentioned reports, this contribution dealt with a comprehensive assessment of Poland as a whole. Therefore, the satellite approach (S2) was preferred.
Széles et al. [109] used new precision agriculture technologies to monitor maize yields through various field trials in eastern Hungary. Specifically, they used UAV-based SPAD and NDVI measurements to monitor maize yield in irrigated and rainfed experimental facilities with different nitrogen treatments in Hungary in 2022. The authors concluded that precision agriculture technology helps farmers make informed decisions about fertilization strategies and timing, which subsequently maximizes yield and minimizes risk.
Balážová et al. [25] processed and evaluated UAV images over the course of four growing seasons on small plots in the Czech Republic. They assessed the growth of two spring wheat varieties, the old variety Khorasan and the modern variety Kabot, and how they responded to meteorological conditions. They also evaluated their ability to withstand drought and higher temperatures in relation to specific soil conditions under conventional, minimum and no-till systems.
Láznička et al. [14] investigated the feasibility of using SAR S1 to evaluate the variability of winter wheat within frost-damaged winter wheat plots in the Czech Republic. They noted that optical surveying is often limited in Central Europe due to cloud cover, therefore SAR data are increasingly being used. However, these data are limited by their more difficult interpretation, especially due to the effect of speckles. The results showed that areas with the lowest production potential and the greatest crop damage corresponded to the lowest RVI values. Additionally, the highest values for VH and VV polarizations corresponded to areas with the lowest crop quality. The study also demonstrated that modern statistical methods could be used to mitigate speckle-related issues in radar images for practical purposes.
Monitoring crop vitality and stress has evolved from simple vegetation index analysis toward multi-sensor physiological diagnostics integrating spectral, thermal, radar, and hyperspectral observations. Satellite platforms, particularly S2, provide regional-scale monitoring of vegetation indices related to chlorophyll content, biomass, and canopy vigor, while UAV platforms enable very-high-resolution multispectral and thermal monitoring for detecting nutrient deficiencies, frost damage, drought stress, and disease outbreaks. Recent studies increasingly apply hyperspectral sensing and machine learning algorithms to estimate biochemical crop parameters such as nitrogen concentration and chlorophyll content. The most effective technological approach therefore combines satellite-based regional monitoring with UAV-based detailed diagnostics, supported by vegetation indices, thermal stress indicators, and AI-based data interpretation.
Thermal Stress, Drought Monitoring, and Irrigation
Vuolo et al. [110] examined the costs and benefits using Landsat 8 and DEIMOS-1 satellite imagery for irrigation management in Lower Austria. Since publishing their study in 2015, the authors have also examined cost calculations for using the upcoming S2 satellite constellation.
Following up on the previous article, Tamás et al. [111] presented the existing state of the satellite irrigation advisory system on a devoted webGIS for farmers and district managers in three different agricultural systems and environments, including Austria. Information on crop heterogeneity captured in the images was also used for crop assessment.
The same authors [111] developed a process that provides information for the efficient estimation of relevant drought indices and drought-related yield losses from remotely sensed spectral data. This process also determines the agreement between data derived from spectral data and field measurements. Their paper discussed a new calculation method that provides timely information on the physical implementation of drought risk levels.
Lyubenova Raeva et al. [112] used a UAV equipped with multispectral and thermal sensors to scan corn and barley crops grown in western Bohemia. They calculated three vegetation indices and derived two heat maps to illustrate the relationship between vegetation and soil temperature.
Żelazny and Lukáš [113] detected drought stress in two rapeseed varieties using hyperspectral imaging.
Potopová et al. [114] addressed the question of which regions in the Danube basin, including Central Europe, respond to changes in evapotranspiration rates and soil moisture, as well as the extent to which corn production affected by these changes. They calculated indices—the Enhanced Vegetation Index (EVI2), the Evaporative Stress Index (ESI), and the Relative Water Availability (AWR) from MODIS satellite images.
Pintér and Nagy [115] used a UAV equipped with thermal and RGB sensors to create an integrated system for evaluating experiments on small-plot field and developing an energy balance model.
Kowalski et al. [116] quantified the spatiotemporal sensitivity of grasslands to drought by using a new set of Landsat/S2 images alongside climate reanalysis data. They quantified annual grassland vitality at fine spatial scales and at the Germany national level from 1985 to 2021. They also analyzed the sensitivity of grasslands to drought by testing statistically robust relationships between grassland vitality and common drought indices, as well as the spatiotemporal variability of drought sensitivity among 12 grassland habitat types due to their different biotic and abiotic properties. This study provided the first large-scale, long-term and spatially explicit evidence of the increasing sensitivity of Central European grasslands to drought.
Spectral indices and hyperspectral techniques are used to infer leaf chlorophyll and nitrogen status and detect biotic and abiotic stresses. A growing body of literature summarizes inversion approaches for nitrogen in fruit trees including hyperspectral indices, derivative spectra, continuum removal, and machine-learning regressors. This literature emphasizes the sensitivity of nitrogen retrievals to phenological stage, canopy background, e.g., soil and grass, and shadows [117]. Xi et al. [117] synthesize these algorithms and recommend multi-platform strategies, such as UAV hyperspectral for canopy calibration and satellite upscaling, to create operational nitrogen maps across orchards. Case studies in apple orchards demonstrated that, when combined with careful ground sampling, UAV hyperspectral or close-range imaging provides the spectral detail necessary to accurately estimate leaf biochemical traits [118].
Water status is a parallel dimension of tree health. A recent review on continuous plant-based and remote sensing methods for assessing fruit trees’ water status, highlights how proximal sensors including stem/leaf water potential, sap flow, and dendrometers, and RS indicators including thermal indices, water-related VIs, and sun-induced fluorescence, can be combined to schedule irrigation and detect drought stress [119]. In fruit orchards, thermal UAV imagery and high-resolution multispectral data can thus be used to map spatial patterns of water deficit, complementing nitrogen and chlorophyll diagnostics.
For Central European orchards, practical application requires the following: (1) selecting phenologically stable sampling windows, e.g., full leaf expansion but before senescence, (2) correcting for the influence of understory and soil e.g., spectral unmixing and masking, and (3) validating UAV-derived models against laboratory leaf chemistry and water status measurements across local varieties and rootstocks [117,118,119].
Technological developments in drought and irrigation monitoring increasingly rely on thermal remote sensing and evapotranspiration-based indicators derived from satellite observations. Optical and thermal sensors on satellites such as Landsat, MODIS, and Sentinel enable the calculation of drought indices and crop water stress indicators, while UAV-mounted thermal cameras provide detailed maps of field-scale water stress. Recent research integrates remote sensing with agrometeorological data, soil moisture information, and crop modeling approaches to quantify drought impacts and irrigation requirements. The most promising technological pathway therefore combines thermal satellite observations, UAV thermal sensing, and climate-informed modeling approaches, enabling near-real-time drought monitoring and irrigation decision support.
2.5. Yield Estimation and Fruit Counting
Yield prediction is closely related to monitoring stand vitality, health, and nutrient content in the stand, as well as stress detection. Although fruit counting is a topic that belongs to horticulture, it is also important for yield prediction.
For example, Bognár et al. [120] investigated yield prediction for cereals such as corn and wheat several weeks prior to harvest. Their approach relied on data from the Advanced Very High-Resolution Radiometer instruments aboard National Oceanic and Atmospheric Administration polar-orbiting environmental satellites. The method was implemented in Hungary between 1996 and 2000. Predicted yields were generally within a 5% confidence interval of actual values obtained by conventional (non-satellite) methods and reported by the Hungarian Statistical Office, except in 1997, when the absolute error reached approximately 8%.
As reported by Kumhálová et al. [121], crop yield can also be assessed in terms of the influence of topography and water distribution in the field. They assessed the suitability of vegetation indices derived from data acquired by the Landsat 5 Thematic Mapper (TM) in relation to crop yield, together with topographic attributes such as curvature and the topographic wetness index, within a relatively small 11.5 ha field in the Czech Republic. The study examined oats in 2006 and 2010, as well as winter wheat in 2005 and 2011. Satellite images from June were used to capture the vegetation during the same phenological phase. During the flowering phase in a dry year with limited rainfall distribution, the correlation coefficient reached values of up to 0.816 between vegetation indices, yield, and topographic attributes.
Spitkó et al. [122] addressed the following questions: Which phenophase is best for predicting yield? How do values recorded at different times correlate with yield? Does the strength of this correlation increase or decrease as harvest approaches? Can yield be estimated at flowering or even at earlier phenophases? The authors measured the photosynthetic pigment content in leaves using the NDVI, which was calculated by the GreenSeekerTM instrument on corn stands. The best results were also achieved during the survey during the flowering phenological phase.
Kumhálová and Matějková [123] employed various sensors and data sources to estimate yields. This report evaluates the use of medium (Landsat satellite data) and very high (QuickBird and WorldView-2 satellite data) spatial resolution satellite images, together with the GreenSeeker handheld crop sensor, can be used to estimate the yield and growth variability of winter barley in 2007 and 2015 and winter wheat in 2009 and 2011. The stands were assessed using NDVI. Better results compared to crop yield were obtained with images taken at later phenological stages.
Nagy et al. [42] examined early yield forecasts for wheat and maize. They evaluate the absolute differences between the predicted yields derived from MODIS NDVI and their reported counterparts. They also assessed the significant differences between predicted and observed yield values within different yield ranges. In addition to examining overall forecast accuracy, they also investigated the conditions under which the prediction model performed best or worst, such as drought effects or high rainfall distribution.
Lussem et al. [124] monitored permanent grasslands, where nitrogen fertilizers were regularly applied for precision agriculture and yield estimation purposes. To this end, they used a UAV equipped with a low-cost RGB camera to derive RGB vegetation indices. The paper primarily aimed to test and evaluate the robustness of RGB of these indices for estimating forage dry matter yield in an experimental grassland in Germany. Additionally, RGB VIs were compared with indices calculated from the Yara N-Sensor. The results showed a good determination of forage yield with RGB VI up to R2 = 0.62.
Nagy et al. [42] monitored wheat and maize production in the Tisza River basin in the Carpathian basin and emphasized the importance of this area also for producing these crops in Central and Eastern Europe. In this study, they developed and evaluated a freely available methodology for forecasting wheat and maize yields based on MODIS NDVI satellite data to estimate yield losses due to drought. The authors found that potential yield losses could be reliably predicted 6–8 weeks before harvest using MODIS NDVI. They also noted that simple threshold values can be applied to map these losses. However, the accuracy of the forecasts may be compromised under conditions of extreme drought or excessive precipitation, potentially resulting in overestimation or underestimation.
Jelínek et al. [125] examined how Landsat 8 and SPOT 7 and S2 satellite images, as well as the derived NDVI could be used during the growing season alongside combine harvester yield data to predict yield and assess the productivity of specific zones in individual locations in the Czech Republic. The study also focused on the accuracy of these systems in estimating field productivity. The research was carried out on a 24.7 ha field where winter wheat, spring barley, and winter rapeseed are traditionally grown using conventional methods. Yields and NDVI frequency maps were modeled. The results showed that the yield frequency map for cereals is the best model for crop yield estimation, explaining 44% of the yield variability on average for all selected years. The NDVI frequency map at a 10 m spatial resolution from S2 imagery from all years appears to be the best model for crop condition estimation. This model explains 96% of the winter wheat crop structure and 38% of all selected NDVI imagery. The models were more significant for cereals and in drier and warmer years.
Panek and Grozdowski [41] investigated the relationship between NDVI and cereal yield in selected regions of four Central European countries: Poland, Germany, the Czech Republic, and Slovakia. The research was based on images from the MODIS satellite Terra (NASA) covering March to June 2012–2016. Unlike other studies, theirs demonstrates the effectiveness of yield prediction already at the start of the main growing season.
Panek et al. [126] derived several indices based on the RED and NIR bands from S2 to compare grain yield and the number of ears per square meter in winter wheat and triticale. The selected vegetation indices exhibited behavior like that of commonly used NDVI. The authors conducted an experiment at three locations in Poland over 2 growing seasons. Their results revealed that grain yield is a more significant parameter than the number of ears per square meter. Generally, the relationship between NDVI values and grain yield was stronger at more advanced growth stages, depending on the region of Poland: late April in southeastern Poland, late May in northeastern Poland and late June in central Poland.
Jelínek et al. [17] evaluated the effectiveness of freely available satellite images from S2 and Landsat 5, 7 and 8 for predicting the growth and yield of five spring and winter wheat varieties. They derived NDVI from images taken at later phenological stages (BBCH 55–70) and compared it with total water index, crop yields, and yield frequency maps. The distribution of precipitation and water on the plot significantly impacted the timing of the imaging and the accuracy of the results.
The study by Vallentin et al. [127] analyzed the relationship between satellite data and crop yield with the aim of improving the use of remote sensing in precision agriculture. A long-term time series of 13 years was used, which included 947 harvester yield datasets and 755 satellite images from six optical sensors (e.g., S2, RapidEye, Landsat). The authors investigated the correlation between satellite indicators, soil and relief parameters and actual yields of cereals and oilseed rape in Germany. The highest correlation was found when the timing of the images was correct with respect to the phenological phase of the crop and in spatially heterogeneous fields. The results also showed that satellites with higher spatial resolution (RapidEye, S2) and the Red Edge band provide more accurate yield estimates, especially for cereals.
Marszalek et al. [128] mapped winter wheat yields and addressed precise field-level predictions in Upper Bavaria and in Upper Palatinate, both in southern Germany. They used S2 time series, and derived indices, daily water requirements, and climatological data. The experiment was carried out from 2016 to 2018.
Panek and Grozdowski [129] analyzed the relationship between NDVI calculated from MODIS data and the grain yield of all cereals, wheat, and barley at the country level in Central Europe, including Czech Republic, Germany, Hungary, Latvia, Lithuania, Poland, and Slovakia. These countries, along with Croatia, showed very strong correlations in early spring. This analysis was conducted from 2010 to 2018 across 20 European countries.
Rataj et al. [13] compared the yield potential of control traffic farming and standard technologies of random traffic farming. They obtained yield maps from a combination of harvester and satellite images (Landsat and S2). The experiment was carried out in Slovakia, on a 16 ha field. Cereal yields were compared across seven selected years within the 2009–2021 period. The results showed that control traffic farming technology was advantageous in dry years.
Bojanowski et al. [130] presented an operational crop yield forecasting system for Poland that uses freely available satellite and agrometeorological products provided by the Copernicus program. The crop yield predictors consist of the following: (1) daily vegetation status indicators from Sentinel-3 OLCI (optical) and SLSTR (thermal) imagery, (2) back-propagation of S3 data (before 2018), which is derived from cross-calibrated MODIS data, and (3) air temperature, precipitation, surface radiation, and soil moisture derived from the ERA-5 climate reanalysis generated by the European Centre for Medium-Range Weather Forecasts. The system is designed to be easily applicable to other regions and easily adaptable to cloud computing environments such as Data and Information Access Services (DIAS) or Amazon AWS, where Copernicus datasets are directly accessible.
Ronchetti et al. [131] proposed a comparative analysis of crop masks to spatially aggregate remote sensing indicators and improve the predictability of crop yields in Europe at the regional level. The authors examined how the explanatory power of satellite-derived yield indicators varies when moving from time-stable arable land masks to masks tailored to annual crop groups. The study utilized MODIS-derived NDVI data across all EU member states. Regional NDVI profiles were generated by averaging the time series of individual pixels according to five types of crop masks: generic arable land masks, static crop-group-specific masks that separate winter and spring crops from summer crops, and annual crop-group-specific masks that both distinguish between these crop groups and change over time. The model fits best for grain maize and soft wheat in Central and Eastern Europe.
Harsányi et al. [132] investigated the performance of four algorithms for corn yield prediction based on four different input scenarios. They concluded that the implementation of machine learning for corn yield prediction is still limited in Central Europe, and especially in Hungary.
Panek-Chwastyk et al. [133] compared remotely sensed data with in situ data using the AquaCrop simulation model to accurately monitor growing conditions and predict grassland biomass in the northeastern and central-western regions of Poland from 2020 to 2022. Overall, the results obtained from S2 data were comparable to in situ measurements and in some cases even provided better results.
Stettmer et al. [134] compared four methods for estimating winter wheat yield in precision agriculture, including approaches using satellite data. Yield was determined using a combine harvester with yield mapping, S2 satellite data used in the PROMET growth model, and a tractor-mounted multispectral sensor, with reference values provided by a field combine harvester (ground truth). The analysis was performed on heterogeneous fields in three locations in Germany, and the accuracy of the methods was assessed using statistical indicators and correlation analysis. The highest agreement with the reference data was recorded for the tractor sensor data (R2 ≈ 0.71–0.75), while yield estimates from Sentinel-2 satellite data showed a medium correlation (R2 ≈ 0.53–0.68) and larger deviations in absolute yield. The study shows that satellite data can be used to estimate spatial yield variability, but further optimization of methods and models is necessary for more accurate quantification.
Reuß et al. [35] assessed the extent to which the variability of spring barley yields can be explained by a commonly used model and global products and surface soil moisture (SSM) derived from ERA5 SWVL1 and H SAF satellites. They used a feedforward neural network, SSM time series, and reference yield data are to predict spring barley yield at the Nomenclature of Territorial Units for Statistics (NUTS) level for Austria, the Czech Republic, and Germany. Spring barley was chosen as a crop that has not yet been explored, unlike maize and wheat, for which these methods were already used.
Fruit detection models use on high-resolution UAV RGB or multispectral imagery to detect fruit. Regression models link fruit counts or fruit-pixel areas to mass to provide orchard-scale pre-harvest yield estimates. Deep learning detectors (e.g., YOLO and Faster R-CNN variants) that are trained on UAV image frames have been successfully applied in apple orchards. However, shadowing, occlusions, and variable fruit color complicate detection and necessitate season- and site-specific training datasets. UAV-based dense point clouds (structure-from-motion) combined with fruit detection, can further estimate the volume or mass of fruit per tree, as summarized by recent UAV surveys and systematic reviews [95,97].
For Central Europe, multi-date campaigns (to sample different light and phenology conditions) and robust augmentation strategies in the training set are recommended to reduce false negatives under variable illumination. Reviews on remote sensing in fruit crops emphasize that combining fruit-counting models with structural metrics (e.g., crown size and planting density) and management metadata (e.g., variety and pruning regime) greatly improves the stability of yield predictions across years [43,44].
Yield estimation has evolved from simple correlations with vegetation indices toward integrated predictive systems combining satellite observations, crop models, climate data, and machine learning algorithms. Multitemporal satellite observations from MODIS, Landsat, and S2 enable early-season yield forecasting based on vegetation indices and phenological indicators, while UAV imagery allows detailed analysis of canopy structure and fruit density. Recent approaches increasingly employ deep learning models and data fusion techniques integrating spectral indicators, meteorological data, and soil moisture information to improve yield prediction accuracy. The most advanced technological approaches therefore combine multi-sensor satellite time series, meteorological data assimilation, and machine learning models, with UAV observations used for calibration and high-resolution yield assessment.
2.6. Integration and Upscaling: Ground-Based Measurements, Unmanned Vehicles vs. Satellites
In the context of measuring health and vitality, as well as yield prediction, studies have already been mentioned that describe the use of UAVs for monitoring stands, especially in smaller fields. However, satellite imaging still plays a key role, particularly because of its versatility. The freely available Landsat and S1 and 2 satellite images are very often used. As has been mentioned many times, cloudiness and weather in general often prevent the use of optical data in Central Europe. Therefore, SAR solutions are increasingly used. Nevertheless, UAVs are becoming a reliable and robust tool for obtaining data with very high spatial resolution data year after year. As some studies have shown, there is no significant difference between the results obtained from different sensors.
Wojtowicz et al. [135] reviewed a range of remote sensing methods aimed at enhancing the profitability of agricultural crop production while minimizing environmental impact. It presented examples of how remote sensing data can be applied to predict crop yields, evaluate plant nutritional and soil nutrient status, determine water requirements, and manage weed control.
Gozdowski et al. [136] examined the use of NDVI derived from different sensing platforms in crop production. They noted that NDVI data can be obtained from several sources, including ground-based sensors, unmanned aerial vehicles, airborne sensors, and satellite sensors, which differ in spatial resolution, sensor design, and spectral characteristics. Their study evaluated whether NDVI values derived from an active optical sensor used on the farm and from Landsat 8 were directly comparable across seven winter wheat fields representing different regions and soil conditions in Poland. The results showed that the relationship between these two NDVI sources may be field- and year-specific and can vary even between adjacent fields observed on the same date. Therefore, absolute NDVI values from ground and satellite measurements should not be considered universally interchangeable. At the same time, this does not necessarily contradict earlier studies reporting no significant differences among sensors, because such agreement may depend on the specific sensor types, calibration procedures, crop conditions, spatial scale, and the intended use of the data. In practice, although NDVI maps derived from different sources may show similar spatial patterns, the conversion of NDVI values between platforms remains context dependent, and the development of a universal conversion equation is still an open research question.
Szewczak et al. [137] used MODIS data and considered its integration with values determined using ground-based measurements. Their paper presented the results of comparing the climatic water balance index obtained from ground-based data with the results obtained from potential evapotranspiration using the MODIS spectrometer.
Vrchota et al. [138] evaluated the practical use of precision agriculture technologies in agricultural enterprises in the Czech Republic. Their research was based on a questionnaire survey in which 131 farms participated. The results showed that precision agriculture technologies are used more frequently in crop production than in livestock production. Specifically, 58.02% of enterprises use smart weather stations, 89.31% use unmanned vehicles, and 61.83% use navigation and optimization systems for route optimization. These technologies are the most widely used and are closely related to autonomous driving and robotics in agriculture.
Several authors advocate a two-tier approach. First, use UAV or close-range hyperspectral data to develop and calibrate models. Then, upscale these models to Sentinel satellite footprints through spectral unmixing or transfer learning. Specifically, Xu at al. [67] demonstrate that combining S1 SAR and S2 optical time series can improve regional orchard mapping. This provides a scalable pathway to link field-level measurements with regional monitoring. Observations of nitrogen inversion recommend exactly this same multi-platform upscaling to achieve country- or regional-level nutrient maps [117].
Similar multi-scale workflows have been evaluated in nut orchards where tree spacing is regular, and canopy closure is high. These workflows use satellites to provide temporal coverage and UAVs or manned aircraft to deliver structural and biochemical detail [94]. These experiences can be directly transferred to Central European walnut and hazelnut plantations.
As can be seen from research development in recent years, research is increasingly focused on the use of multi-sensor data in precision agriculture. For example, a study from 2025 [139] dealt with the creation of management zones in precision agriculture to optimize fertilizer application. The authors combined time series of vegetation data from the Sentinel-2 satellite with soil data from proximal multi-sensor instruments. To define the zones, they used a multi-step clustering approach based on hierarchical and consensus clustering. They tested four data input scenarios (full time series of satellite images, phenologically selected images, soil data only, and a combination of vegetation and soil data). The best results were achieved by a model based on the full time series of Sentinel-2, which allowed for the efficient definition of management zones for a single field in Germany.
A major technological trend in agricultural remote sensing is the development of multi-scale monitoring frameworks integrating satellite, UAV, and ground-based sensing systems. Satellite platforms provide continuous regional coverage, while UAV and proximal sensors deliver high-resolution measurements necessary for model calibration and validation. Recent studies increasingly rely on cloud computing platforms, data fusion techniques, and transfer-learning approaches to upscale UAV observations to satellite-based monitoring systems. The most effective technological route therefore involves hierarchical monitoring frameworks in which UAV and field sensors calibrate models that are subsequently applied to Sentinel satellite time series, enabling scalable monitoring from field to regional and national levels. Integration of UAVs and satellites for crop monitoring can be seen in Figure 1, which was created with the help of AI.
Figure 1.
Integration of UAVs and satellites for crop monitoring.
2.7. Machine Learning, Deep Learning, Feature Engineering, and Corrections
Schuster et al. [140] investigated the usefulness of data for classifying grassland habitats in a nature reserve area in northeastern Germany. The study employed intra-annual time series comprising 21 observations, derived from a multispectral satellite system (RapidEye) and SAR data (TerraSAR-X), to classify seven grassland types using a Support Vector Machine (SVM) classifier. Classification accuracy was assessed and compared based on the type of multispectral sensor or radar used, as well as the number of acquisitions. Results indicated that very dense time series allowed for exceptionally high classification accuracy (>90%) of vegetation types at fine spatial scales. While classification with TerraSAR-X achieved accuracy comparable to RapidEye, it required substantially more acquisitions. This research introduced a novel approach for small-scale grassland habitat monitoring and provided guidance on the amount of data necessary for operational surveys.
Vuolo et al. [110] assessed Landsat Climate Data Record products using a set of Landsat and DEIMOS-1 images processed with the standard ATCOR-2 atmospheric correction algorithm, achieving high accuracy. Results from a semi-arid test site in Austria indicate that automated atmospheric correction methods, such as those implemented in the Landsat Ecosystem Disturbance Adaptive Processing System, provide sufficient accuracy for land monitoring applications that require consistent multitemporal surface reflectance data.
Reuß et al. [141] assessed the performance of two widely used algorithms—Long Short-Term Memory networks and Random Forest—for crop classification using Sentinel-1 time series combined with meteorological data across extensive spatial and temporal scales. Various scenarios were established, differing in spatial and temporal resolution, based on data from Austria, the Netherlands, and France covering the period 2015–2019.
Hejmanowska et al. [142] analyzed the potential use of a limited number of S2 and S1 satellites to verify the veracity of crop declarations submission from EU farmers for subsidies. They used two datasets, training and testing. Supervised classification of individual images and their combinations was performed based on the training set using the algorithm Random Forest in SNAP (ESA) and their own Python scripts.
Classic machine learning models (e.g., Random Forest, SVM, and GBDT) and increasingly deep models (CNNs and DNNs) are applied to various tasks, including classification, crown segmentation, and yield estimation. Feature engineering remains central, and the most informative inputs include time series VIs (NDVI, GNDVI, PSRI, and Red Edge indices), texture metrics, polarization features (for SAR), and phenological derivatives [65,68]. Object-oriented segmentation combined with Random Forest still provides strong baselines for species mapping, while deep networks are powerful but require extensive labeled data [68,143].
Recent surveys that focus specifically on UAVs and neural networks in orchards provide detailed comparisons of architectures for object detection, semantic and instance segmentation, and condition assessment [95,97]. These surveys underscore the importance of carefully designed datasets, including viewing geometries, illumination, and phenological stage. They also highlight the need for open, shared benchmarks to accelerate progressing more general fruit-crop RS reviews [43,44].
Recent advances in agricultural remote sensing have been strongly driven by machine learning and deep learning approaches applied to dense satellite time series. Traditional classifiers such as RF and SVM remain widely used due to their robustness, while deep neural networks increasingly enable automated extraction of spatial and temporal features from complex datasets. Progress in feature engineering, atmospheric correction, and multi-sensor data fusion further improves classification accuracy and reduces preprocessing requirements. Recent studies also increasingly exploit cloud computing platforms and large satellite archives for large-scale agricultural monitoring. The most promising technological approach therefore combines multi-sensor satellite time series (S1, S2, Landsat) with machine learning or deep learning models and automated processing pipelines, enabling operational monitoring of agricultural systems at regional and continental scales.
2.8. Central European Varieties
Winter cereals, particularly winter wheat, generally have higher yield potential and are thus more significant than spring cereals. Depending on the region, winter cereals are typically sown from late September to early October, while spring cereals are sown in late March or early April. Maize is usually planted in late April. Most cereals reach full maturity by July, whereas maize matures later, in late September or October. Due to the high importance of national breeding societies, most cereals varieties grown in different countries differ. However, the genetic yield potential of cultivars in different countries is similar, as evidenced by variety evaluation results in each country. These results can be downloaded from the websites of national variety testing organizations in Czech Republic [143], Germany [144], Poland [145], and Slovakia [146]. This issue was solved by Panek and Gozdowski [41].
From a Central European perspective, the dominant categories of orchard, those containing pome fruits (apples and pears), stone fruits (cherries, plums, apricots, and peaches) and nuts (walnuts and hazelnuts), pose slightly different RS challenges and opportunities. Apples and pears, for example, are usually grown in high-density training systems with relatively uniform canopy height. While this favors automated crown delineation and fruit counting, it also increases within-orchard shading and occlusion effects. These effects must be addressed through multi-view UAV flights and careful selection of viewing geometry [95,97]. Work focusing on apples shows that flowering and early leaf expansion are critical windows for discriminating against orchards from surrounding vegetation [69], a finding that is directly applicable to major apple-growing regions in Central Europe.
Stone-fruit orchards often have more heterogeneous structure, with older trees, variable pruning, and mixed cultivars, as well as more pronounced alternate bearing. For these crops, 3D metrics (e.g., tree height and crown volume) and phenology-based indicators (e.g., onset of flowering and duration of fruit growth) may be more informative for yield estimation and risk assessment than single-date spectral features. Additionally, cherries and plums are susceptible to spring frost and fungal diseases, which makes time-series analysis of phenology and stress indices particularly relevant in Central European climates [117,119].
Nut orchards, especially those with walnuts and hazelnuts, tend to have wider spacing between trees and, in some areas, partial understory vegetation. Reviews of nut crops indicate that SAR backscatter and LiDAR/photogrammetric structure are especially useful for characterizing canopy architecture and assessing the degree of closure [96]. In Central Europe, these methods can help distinguish intensively managed, fully closed nut orchards from mixed agroforestry systems or scattered trees. They can also provide the structural baseline for scaling up nut-yield and nutrient-status models from UAV to Sentinel footprints [67,117].
Overall, the Central European crop mix implies that RS workflows should be calibrated not only at the “generic fruit-tree” level but also for dominant fruit groups and leading cultivars. Dedicated sampling protocols should be developed for apples, cherries and nuts where economic relevance justifies more intensive monitoring.
3. Main Challenges and Recommendations for Central Europe
Remote sensing has become an integral component of modern agricultural monitoring, driven by the need to balance increasing production demands with environmental sustainability. A widely accepted conceptual framework for agricultural remote sensing applications was formulated by [2], who identified key domains in which satellite observations provide critical added value. These domains include yield and biomass estimation, monitoring of vegetation vitality and drought stress, phenological assessment, crop area mapping, and detection of land-use and land cover changes. These application domains remain highly relevant and continue to shape both research and operational monitoring systems. In Central Europe, the implementation of these concepts is strongly influenced by region-specific characteristics, such as the dominance of annual field crops, heterogeneous crop rotations, fragmented land ownership, and pronounced interannual climatic variability.
Field crops that are not permanent, such as cereals, oilseeds, maize, and forage crops, represent the core of agricultural production in the region. Therefore, they are a primary focus of remote sensing-based monitoring efforts. One of the main challenges of monitoring field crops in Central Europe is the relatively small size and irregular shape of agricultural parcels, which makes it difficult to use coarse-resolution satellite products and limits the transferability of methods developed for large-scale farming systems. Medium-resolution optical data from the S2 constellation is suitable for mapping crop types and conducting phenological analyses under these conditions, particularly when dense multitemporal time series are used [56,61]. However, frequent cloud cover during critical stages of the growing season remains a persistent limitation. To mitigate this, there has been increasing attention to integrating optical and radar data. Combining the S1 and S2 time series has been shown to enhance classification robustness, improve temporal continuity, and support monitoring of field crops even under adverse weather conditions [61]. This multi-sensor strategy directly supports the application areas highlighted by [2], especially in relation to phenology, drought stress, and crop area mapping.
Beyond annual field crops, a distinct set of challenges and methodological requirements emerges for permanent agricultural systems. In these systems, long-term canopy structure, interannual stability, and management legacy fundamentally shape the interpretation and applicability of remote sensing observations.
Another general critical issue for Central Europe is the lack of reliable reference data for validating and calibrating satellite-derived products. National and European agricultural information systems, such as LPIS and IACS, enable parcel-level analyses and provide essential ground truth for field crop monitoring. Integrating these systems with satellite observations facilitates a shift from pixel-based approaches to object- and parcel-oriented analyses, which are more closely aligned with agricultural management and policy needs. From a forward-looking perspective, climate change-related pressures, particularly increasing drought frequency and yield variability, are expected to amplify the importance of remote sensing for field crops in Central Europe. Several studies have already demonstrated the potential of satellite time series to detect yield anomalies, stress patterns, and spatial variability at regional to national scales [2,55,146]. Addressing these challenges will require continued methodological development, including advanced time-series analysis, machine learning, and integrating remote sensing with agrometeorological and crop model data.
To summarize the technological approaches described above, Table 1 presents the most suitable sensor and platform combinations for key agricultural monitoring tasks in Central Europe.
Table 1.
Recommended sensor–platform combinations for key agricultural monitoring tasks in Central Europe.
4. Conclusions and Future Perspectives: Remote Sensing as a Cornerstone of Integrated Digital Agriculture
Remote sensing has evolved into a unifying observational framework applicable to the full spectrum of agricultural production systems, including annual field crops, permanent crops, grasslands, and specialized agricultural systems. Although crop groups vary greatly in their structural characteristics, phenological dynamics, and management practices, satellite- and UAV-based observations offer a consistent data foundation for monitoring vegetation health, productivity, stress responses, and land-use dynamics at various spatial and temporal scales.
Remote sensing has proven particularly effective in capturing short-term phenological transitions, yield variability, and stress events driven by weather extremes in annual field crops. Time-series analyses based on optical and radar data allow to assess crop development, the impact of droughts, and spatial heterogeneity within and across growing seasons. In contrast, approaches for permanent crops, including orchards and other woody systems, must account for long-term canopy structure, interannual stability, and management legacy effects. Existing studies on fruit trees demonstrate that remote sensing can capture the structural and physiological attributes of perennial canopies when the appropriate temporal windows, spatial resolutions, and validation strategies are applied.
A key limiting factor across all crop types remains the integration of heterogeneous data sources. Remote sensing observations alone rarely provide sufficient context for actionable decision-making. They realize their full potential only when combined with in situ measurements, agrometeorological data, soil information, management records, and official agricultural databases. National parcel-based systems, such as LPIS/IACS, are critical links between remotely sensed observations and real-world management units. These systems enable consistent validation, calibration, and interpretation across crop types and regions.
Looking ahead, a growing abundance of dense, multi-sensor satellite time series, UAV data, proximal sensing, and on-farm monitoring systems is swiftly turning agricultural remote sensing into a bona fide big data domain. The volume, velocity, and variety of these data streams exceed the capacity of traditional analytical approaches, necessitating the systematic adoption of advanced data-driven methods. Machine learning and artificial intelligence techniques are therefore central to extracting meaningful information and enabling automated pattern recognition, anomaly detection, yield forecasting, and early-warning systems across diverse cropping systems. A key future direction is transition from retrospective analysis to near-real-time monitoring and online signaling. Integrated processing chains that combine remote sensing, meteorological forecasts, and field-level data can support the timely detection of stress, disease risk, or yield anomalies and translate these signals into targeted management recommendations. Such systems are particularly relevant in the context of increasing climatic uncertainty, where rapid response and adaptive management are essential.
Ultimately, remote sensing should be viewed as a core component of emerging digital farming ecosystems, not as an isolated monitoring tool. In this framework, satellite and UAV observations are integrated in platforms that support decision-making and guide precision interventions, autonomous and ultra-precise machinery operations, and resource-efficient management strategies. The digital farms of the future will depend on continuous data flows, intelligent algorithms, and the seamless integration between observation, analysis, and action. Within this framework, remote sensing data form an indispensable observational layer that enables the scalable, objective, and repeatable assessment of agricultural systems. This assessment supports both farm-level decision-making and broader policy and sustainability goals.
Author Contributions
Conceptualization, J.K., J.S. and F.K.; methodology, J.K., J.S. and F.K.; software, J.M., M.K. and V.V.; validation, J.K., J.S., V.V., J.M., M.K., P.N. and F.K.; formal analysis, J.K., F.K. and V.V.; resources, V.V., J.M., J.K. and F.K.; data curation, J.M., V.V., M.K. and J.K.; writing—original draft preparation, J.K., J.S. and F.K.; writing—review and editing, J.K., J.S., F.K., V.V. and P.N.; visualization, J.S. and J.K.; supervision, J.K., J.S. and F.K.; project administration, J.K., F.K. and J.S. All authors have read and agreed to the published version of the manuscript.
Funding
This research was supported by HORIZON-CL6-2022-FARM2FORK project Guardians (GA Number: 101084468) and by HORIZON-CL6-2024-CLIMATE-01 project BioClima (GA Number: 101181408).
Data Availability Statement
Data available in a publicly accessible repository https://data.narodni-repozitar.cz/general/datasets/draft/mwd02-msm38 (accessed on 30 March 2026).
Conflicts of Interest
Author Jiří Sedlák was employed by the company Research and Breeding Institute of Pomology Holovousy Ltd. The remaining authors declare that the research was conducted in the absence of any commercial or financial relationships that could be construed as a potential conflict of interest.
Abbreviations
The following abbreviations are used in this manuscript:
| ATCOR-2 | Standard Atmospheric Correction Algorithm |
| AI | Artificial Intelligence |
| ALS | Airborne Laser Scanning |
| AriMr | Agency for Restructuring and Modernisation of Agriculture |
| AT, CH, CZ, DE, HU, PL, SK, SL | Commonly used two-letter international country codes according to the ISO3166-1 alpha-2 standard (Austria, Switzerland, Czech Republic, Germany, Hungary, Poland, Slovakia, Slovenia) |
| AWR | Relative Water Availability |
| BBCH | Biologische scale Bundesanstalt, Bundessortenamt and Chemische Industrie |
| CAP | Common Agricultural Policy |
| CSM | Crop Surface Models |
| DIAS | Data and Information Access Services |
| ExG | Excess Green Index |
| ESA | European Space Agency |
| ESI | Evaporative Stress Index |
| EU | European Union |
| EVI | Enhanced Vegetation Index |
| GBDT | Gradient Boosted Decision Trees |
| GIS | Geographic Information System |
| GNDVI | Green Normalized Difference Vegetation Index |
| GSD | Ground Sampling Distance |
| LAI | Leaf Area Index |
| LiDAR | Light Detecting and Ranging |
| LPIS | Land Parcel Identification System |
| LULC | Land Use/Land Cover |
| IACS | Integrated Administration and Control System |
| MODIS | Moderate Resolution Imaging Spectroradiometer |
| ML | Machine Learning |
| MSI | Multispectral Instrument |
| N | Nitrogen |
| NASA | National Aeronautics and Space Administration |
| NDVI | Normalized Difference Vegetation Index |
| NDRE | Normalized Difference Red Edge Index |
| NUTS | Nomenclature of Territorial Units for Statistics |
| OBIA | Object-Based Image Analysis |
| OLI | Operational Land Imager |
| PSP | Phenological Sequence Patterns |
| PSRI | Plant Senescence Reflectance Index |
| RF | Random Forest |
| RGB | Red–Green–Blue—image in visible part of spectra |
| RS | Remote Sensing |
| RTF | Random Traffic Farming |
| RTK-GPS | Real-Time Kinematic Global Positioning System |
| RUSLE | Revised Universal Soil Loss Equation Model |
| RVI | Radar Vegetation Index |
| S1 | Sentinel-1 |
| S2 | Sentinel-2 |
| S3 | Sentinel-3 |
| SAR | Synthetic Aperture Radar |
| SSM | Surface Soil Moisture |
| SVM | Support Vector Machine |
| TGI | Triangular Greenness Index |
| UAV | Unmanned Aerial Vehicle |
| VI | Vegetation Index |
| VV/VH | Polarization of SAR data (Vertical; Horizontal) |
| WDVI | Weighted Difference Vegetation Index |
References
- Overview. Available online: https://www.worldbank.org/en/topic/agriculture/overview (accessed on 21 February 2026).
- Atzberger, C. Advances in Remote Sensing of Agriculture: Context Description, Existing Operational Monitoring Systems and Major Information Needs. Remote Sens. 2013, 5, 949–981. [Google Scholar] [CrossRef] [Scilit]
- Weiss, M.; Jacob, F.; Duveiller, G. Remote Sensing for Agricultural Applications: A Meta-Review. Remote Sens. Environ. 2020, 236, 111402. [Google Scholar] [CrossRef] [Scilit]
- Cao, R. An Overview of Within-Season Agricultural Monitoring from Remotely Sensed Data. Remote Sens. 2024, 16, 4706. [Google Scholar] [CrossRef] [Scilit]
- Verrelst, J.; Camps-Valls, G.; Muñoz-Marí, J.; Rivera, J.P.; Veroustraete, F.; Clevers, J.G.P.W.; Moreno, J. Optical Remote Sensing and the Retrieval of Terrestrial Vegetation Bio-Geophysical Properties—A Review. ISPRS J. Photogramm. Remote Sens. 2015, 108, 273–290. [Google Scholar] [CrossRef] [Scilit]
- Xie, Y.; Sha, Z.; Yu, M. Remote Sensing Imagery in Vegetation Mapping: A Review. J. Plant Ecol. 2008, 1, 9–23. [Google Scholar] [CrossRef] [Scilit]
- Omia, E.; Bae, H.; Park, E.; Kim, M.S.; Baek, I.; Kabenge, I.; Cho, B.K. Remote Sensing in Field Crop Monitoring: A Comprehensive Review of Sensor Systems, Data Analyses and Recent Advances. Remote Sens. 2023, 15, 354. [Google Scholar] [CrossRef] [Scilit]
- Immitzer, M.; Vuolo, F.; Atzberger, C.; Sarathi Roy, P.; Thenkabail, P.S. First Experience with Sentinel-2 Data for Crop and Tree Species Classifications in Central Europe. Remote Sens. 2016, 8, 166. [Google Scholar] [CrossRef] [Scilit]
- Liu, J.; Xiang, J.; Jin, Y.; Liu, R.; Yan, J.; Wang, L. Boost Precision Agriculture with Unmanned Aerial Vehicle Remote Sensing and Edge Intelligence: A Survey. Remote Sens. 2021, 13, 4387. [Google Scholar] [CrossRef] [Scilit]
- Home—Eurostat. Available online: https://ec.europa.eu/eurostat (accessed on 21 March 2026).
- Kumhálová, J.; Kumhála, F.; Kroulík, M.; Matějková, Š. The Impact of Topography on Soil Properties and Yield and the Effects of Weather Conditions. Precis. Agric. 2011, 12, 813–830. [Google Scholar] [CrossRef] [Scilit]
- Balážová, K.; Chyba, J.; Kumhálová, J.; Mašek, J.; Petrásek, S. Monitoring of Khorasan (Triticum Turgidum Ssp. Turanicum) and Modern Kabot Spring wheat (Triticum aestivum) Varieties by UAV and Sensor Technologies under Different Soil Tillage. Agronomy 2021, 11, 1348. [Google Scholar] [CrossRef] [Scilit]
- Rataj, V.; Kumhálová, J.; Macák, M.; Barát, M.; Galambošová, J.; Chyba, J.; Kumhála, F. Long-Term Monitoring of Different Field Traffic Management Practices in Cereals Production with Support of Satellite Images and Yield Data in Context of Climate Change. Agronomy 2022, 12, 128. [Google Scholar] [CrossRef] [Scilit]
- Láznička, M.; Tůma, L.; Vandírková, V.; Wohlmuthová, M.; Kotek, M.; Kumhála, F.; Kumhálová, J. Monitoring of Winter Wheat Growth in Categories of Frost Damage and Production Potential Using SAR and Optical Images. Int. Agrophys. 2025, 39, 99–111. [Google Scholar] [CrossRef] [Scilit] [PubMed]
- Thielert, W. A Unique Product: The Story of the Imidacloprid Stress Shield. Pflanzenschutz-Nachr. Bayer. 2006, 59, 73–86. [Google Scholar]
- Kajla, M.; Kumar Yadav, V.; Khokhar, J.; Singh, S.; Chhokar, R.S.; Meena, R.P.; Sharma, R.K. Increase in Wheat Production through Management of Abiotic Stresses: A Review. J. Appl. Nat. Sci. 2015, 7, 1070–1080. [Google Scholar] [CrossRef] [Scilit]
- Jelínek, Z.; Kumhálová, J.; Chyba, J.; Wohlmuthová, M.; Madaras, M.; Kumhála, F. Landsat and Sentinel-2 Images as a Tool for the Effective Estimation of Winter and Spring Cultivar Growth and Yield Prediction in the Czech Republic. Int. Agrophys. 2020, 34, 391–406. [Google Scholar] [CrossRef] [Scilit]
- Paeth, H.; Schönbein, D.; Keupp, L.; Abel, D.; Bangelesa, F.; Baumann, M.; Büdel, C.; Hartmann, C.; Kneisel, C.; Kobs, K.; et al. Climate Change Information Tailored to the Agricultural Sector in Central Europe, Exemplified on the Region of Lower Franconia. Clim. Change 2023, 176, 136. [Google Scholar] [CrossRef] [Scilit]
- IPCC. Climate Change 2021: The Physical Science Basis|Climate Change 2021: The Physical Science Basis; IPCC: Geneva, Switzerland, 2021. [Google Scholar]
- IPCC. Climate Change 2022: Impacts, Adaptation and Vulnerability|Climate Change 2022: Impacts, Adaptation and Vulnerability; IPCC: Geneva, Switzerland, 2022. [Google Scholar]
- Paeth, H.; Hetzel, J.; Mannig, B. Uncertainties in the Assessment of Future Temperature and Precipitation Extremes in Central Europe. Erdkunde 2015, 69, 247–265. [Google Scholar] [CrossRef] [Scilit]
- Sfîcă, L.; Beck, C.; Nita, A.-I.; Voiculescu, M.; Birsan, M.-V.; Philipp, A. Cloud Cover Changes Driven by Atmospheric Circulation in Europe during the Last Decades. Int. J. Climatol. 2021, 41, E2211–E2230. [Google Scholar] [CrossRef] [Scilit]
- Whitcraft, A.K.; Becker-Reshef, I.; Killough, B.D.; Justice, C.O. Meeting Earth Observation Requirements for Global Agricultural Monitoring: An Evaluation of the Revisit Capabilities of Current and Planned Moderate Resolution Optical Earth Observing Missions. Remote Sens. 2015, 7, 1482–1503. [Google Scholar] [CrossRef] [Scilit]
- PlanetScope|Copernicus Data Space Ecosystem. Available online: https://dataspace.copernicus.eu/explore-data/data-collections/copernicus-contributing-missions/planetscope (accessed on 29 January 2026).
- Balážová, K.; Kumhálová, J.; Chyba, J. Unmanned-Aerial-Vehicle Data as an Effective Tool for the Evaluation of Ancient Khorasan and Modern Kabot Spring Wheat Varieties under Different Tillage Systems. Agronomy 2024, 14, 147. [Google Scholar] [CrossRef] [Scilit]
- Institute of International Relations Prague. Central Europe|Institute of International Relations Prague—Expertise to Impact; Institute of International Relations Prague: Prague, Czechia, 2025. [Google Scholar]
- Geografické Rozhledy—Střední Evropa—Nakladatelství P3K. Available online: https://www.p3k.cz/2021/08/geograficke-rozhledy-stredni-evropa (accessed on 19 January 2026).
- Csaki, C.; Jambor, A. Convergence or Divergence—Transition in Agriculture of Central and Eastern Europe and Commonwealth of Independent States Revisited. Agric. Econ. 2019, 65, 160–174. [Google Scholar] [CrossRef] [Scilit]
- Fan, Y.; Guoyong, W.; Riaz, N.; Radlińska, K. Technical Efficiency and Farm Size in the Context of Sustainable Agriculture. Agric. Econ. 2024, 70, 446–456. [Google Scholar] [CrossRef] [Scilit]
- Radlińska, K. Changes in the Structure of Agriculture in Central and Eastern Europe in the Light of the European Green Deal. Sustainability 2025, 17, 104. [Google Scholar] [CrossRef] [Scilit]
- Annual Activity Report 2022—Eurostat—European Commission. Available online: https://commission.europa.eu/publications/annual-activity-report-2022-eurostat_en (accessed on 29 January 2026).
- Griffiths, P.; Nendel, C.; Hostert, P. Intra-Annual Reflectance Composites from Sentinel-2 and Landsat for National-Scale Crop and Land Cover Mapping. Remote Sens. Environ. 2019, 220, 135–151. [Google Scholar] [CrossRef] [Scilit]
- Blickensdörfer, L.; Schwieder, M.; Pflugmacher, D.; Nendel, C.; Erasmi, S.; Hostert, P. Mapping of Crop Types and Crop Sequences with Combined Time Series of Sentinel-1, Sentinel-2 and Landsat 8 Data for Germany. Remote Sens. Environ. 2022, 269, 112831. [Google Scholar] [CrossRef] [Scilit]
- Gallo, I.; La Grassa, R.; Landro, N.; Boschetti, M. Sentinel 2 Time Series Analysis with 3D Feature Pyramid Network and Time Domain Class Activation Intervals for Crop Mapping. ISPRS Int. J. Geo-Inf. 2021, 10, 483. [Google Scholar] [CrossRef] [Scilit]
- Reuß, F.; Vreugdenhil, M.; Bueechi, E.; Wagner, W. Comparing Satellite-Derived and Model-Based Surface Soil Moisture for Spring Barley Yield Prediction in Central Europe. Remote Sens. 2025, 17, 1394. [Google Scholar] [CrossRef] [Scilit]
- Podle Evropského Statistického Úřadu v Posledních Patnácti Letech Klesl Počet Zemědělských Podniků a Navýšily Se Obraty Potravinářského Průmyslu—Foodnet. Available online: https://www.foodnet.cz/cs/newsletter/5432-podle-evropskeho-statistickeho-uradu-v-poslednich-patnacti-letech-klesl-pocet-zemedelskych-podniku-a-navysily-se-obraty-potravinarskeho-prumyslu (accessed on 29 January 2026).
- Summary and Structural Data. Available online: https://csu.gov.cz/summary-and-structural-data (accessed on 21 March 2026).
- Agricultural Holdings and Utilised Agricultural Area by Size of the Utilised Agricultural Area. Available online: https://www.destatis.de/EN/Themes/Economic-Sectors-Enterprises/Agriculture-Forestry-Fisheries/Agricultural-Holdings/Tables/agricultural-holdings-and-utilised-agricultural-areaby-size-of-the-utilised-agricultural-area.html (accessed on 21 March 2026).
- GUS Characteristics of Agricultural Holdings in 2023. Available online: https://stat.gov.pl/en/topics/agriculture-forestry/agriculture/characteristics-of-agricultural-holdings-in-2023,8,1.html (accessed on 21 March 2026).
- Managing Payments—Agriculture and Rural Development—European Commission. Available online: https://agriculture.ec.europa.eu/common-agricultural-policy/financing-cap/assurance-and-audit/managing-payments_en (accessed on 29 January 2026).
- Panek, E.; Gozdowski, D. Analysis of Relationship between Cereal Yield and NDVI for Selected Regions of Central Europe Based on MODIS Satellite Data. Remote Sens. Appl. Soc. Environ. 2020, 17, 100286. [Google Scholar] [CrossRef] [Scilit]
- Nagy, A.; Fehér, J.; Tamás, J. Wheat and Maize Yield Forecasting for the Tisza River Catchment Using MODIS NDVI Time Series and Reported Crop Statistics. Comput. Electron. Agric. 2018, 151, 41–49. [Google Scholar] [CrossRef] [Scilit]
- Sharma, S.; Sharma, G.; Tiwari, S.; Kumar, A.; Singh, D.; Abhaykumar, V.N.; Sundouri, A.S.; Attri, D.; Choudhary, R. Potential Application of Remote Sensing in Fruit Crops: A Review. Int. J. Adv. Biochem. Res. 2025, 9, 615–623. [Google Scholar] [CrossRef] [Scilit]
- Pal, S.; Krishi, J.N.; Vidyalaya, V. Applications of Remote Sensing and GIS in Fruit Crops: A Review. Pharma Innov. 2022, 11, 186–191. [Google Scholar]
- Kuemmerle, T.; Erb, K.; Meyfroidt, P.; Müller, D.; Verburg, P.H.; Estel, S.; Haberl, H.; Hostert, P.; Jepsen, M.R.; Kastner, T.; et al. Challenges and Opportunities in Mapping Land Use Intensity Globally. Curr. Opin. Environ. Sustain. 2013, 5, 484–493. [Google Scholar] [CrossRef] [Scilit] [PubMed]
- Zlinszky, A.; Deák, B.; Kania, A.; Schroiff, A.; Pfeifer, N.; Heilmeier, H.; Balzter, H.; Höfle, B.; Thenkabail, P.S. Mapping Natura 2000 Habitat Conservation Status in a Pannonic Salt Steppe with Airborne Laser Scanning. Remote Sens. 2015, 7, 2991–3019. [Google Scholar] [CrossRef] [Scilit]
- Schuster, C.; Förster, M.; Kleinschmit, B. Testing the Red Edge Channel for Improving Land-Use Classifications Based on High-Resolution Multi-Spectral Satellite Data. Int. J. Remote Sens. 2012, 33, 5583–5599. [Google Scholar] [CrossRef] [Scilit]
- Heupel, K.; Spengler, D.; Itzerott, S. A Progressive Crop-Type Classification Using Multitemporal Remote Sensing Data and Phenological Information. PFG–J. Photogramm. Remote Sens. Geoinf. Sci. 2018, 86, 53–69. [Google Scholar] [CrossRef] [Scilit]
- Bach, H.; Mauser, W. Sustainable Agriculture and Smart Farming. Earth Obs. Open Sci. Innov. 2018, 15, 261–269. [Google Scholar] [CrossRef] [Scilit]
- Kolecka, N.; Ginzler, C.; Pazur, R.; Price, B.; Verburg, P.H. Regional Scale Mapping of Grassland Mowing Frequency with Sentinel-2 Time Series. Remote Sens. 2018, 10, 1221. [Google Scholar] [CrossRef] [Scilit]
- Fritz, S.; See, L.; Bayas, J.C.L.; Waldner, F.; Jacques, D.; Becker-Reshef, I.; Whitcraft, A.; Baruth, B.; Bonifacio, R.; Crutchfield, J.; et al. A Comparison of Global Agricultural Monitoring Systems and Current Gaps. Agric. Syst. 2019, 168, 258–272. [Google Scholar] [CrossRef] [Scilit]
- Meier, J.; Mauser, W.; Hank, T.; Bach, H. Assessments on the Impact of High-Resolution-Sensor Pixel Sizes for Common Agricultural Policy and Smart Farming Services in European Regions. Comput. Electron. Agric. 2020, 169, 105205. [Google Scholar] [CrossRef] [Scilit]
- Preidl, S.; Lange, M.; Doktor, D. Introducing APiC for Regionalised Land Cover Mapping on the National Scale Using Sentinel-2A Imagery. Remote Sens. Environ. 2020, 240, 111673. [Google Scholar] [CrossRef] [Scilit]
- Rußwurm, M.; Körner, M. Self-Attention for Raw Optical Satellite Time Series Classification. ISPRS J. Photogramm. Remote Sens. 2020, 169, 421–435. [Google Scholar] [CrossRef] [Scilit]
- Ghassemi, B.; Dujakovic, A.; Żółtak, M.; Immitzer, M.; Atzberger, C.; Vuolo, F. Designing a European-Wide Crop Type Mapping Approach Based on Machine Learning Algorithms Using LUCAS Field Survey and Sentinel-2 Data. Remote Sens. 2022, 14, 541. [Google Scholar] [CrossRef] [Scilit]
- Henits, L.; Szerletics, Á.; Szokol, D.; Szlovák, G.; Gojdár, E.; Zlinszky, A. Sentinel-2 Enables Nationwide Monitoring of Single Area Payment Scheme and Greening Agricultural Subsidies in Hungary. Remote Sens. 2022, 14, 3917. [Google Scholar] [CrossRef] [Scilit]
- Marcinkowski, P.; Szporak-Wasilewska, S. Assessing Monthly Dynamics of Agricultural Soil Erosion Risk in Poland. Geoderma Reg. 2024, 39, e00864. [Google Scholar] [CrossRef] [Scilit]
- Bargiel, D. A New Method for Crop Classification Combining Time Series of Radar Images and Crop Phenology Information. Remote Sens. Environ. 2017, 198, 369–383. [Google Scholar] [CrossRef] [Scilit]
- Hütt, C.; Waldhoff, G.; Bareth, G. Fusion of Sentinel-1 with Official Topographic and Cadastral Geodata for Crop-Type Enriched LULC Mapping Using FOSS and Open Data. ISPRS Int. J. Geo-Inf. 2020, 9, 120. [Google Scholar] [CrossRef] [Scilit]
- Holtgrave, A.K.; Röder, N.; Ackermann, A.; Erasmi, S.; Kleinschmit, B. Comparing Sentinel-1 and -2 Data and Indices for Agricultural Land Use Monitoring. Remote Sens. 2020, 12, 2919. [Google Scholar] [CrossRef] [Scilit]
- Asam, S.; Gessner, U.; González, R.A.; Wenzl, M.; Kriese, J.; Kuenzer, C. Mapping Crop Types of Germany by Combining Temporal Statistical Metrics of Sentinel-1 and Sentinel-2 Time Series with LPIS Data. Remote Sens. 2022, 14, 2981. [Google Scholar] [CrossRef] [Scilit]
- Snevajs, H.; Charvat, K.; Onckelet, V.; Kvapil, J.; Zadrazil, F.; Kubickova, H.; Seidlova, J.; Bartlova, I. Crop Detection Using Time Series of Sentinel-2 and Sentinel-1 and Existing Land Parcel Information Systems. Remote Sens. 2022, 14, 1095. [Google Scholar] [CrossRef] [Scilit]
- Jensch, K.; Ghazaryan, G.; Ernst, S.; Hostert, P.; Nendel, C. Integrating Landsat, Sentinel-2 and Sentinel-1 Time Series for Mapping Intermediate Crops. Eur. J. Remote Sens. 2025, 58, 2507738. [Google Scholar] [CrossRef] [Scilit]
- Rynkiewicz, A.; Hościło, A.; Aune-Lundberg, L.; Nilsen, A.B.; Lewandowska, A. Detection and Quantification of Vegetation Losses with Sentinel-2 Images Using Bi-Temporal Analysis of Spectral Indices and Transferable Random Forest Model. Remote Sens. 2025, 17, 979. [Google Scholar] [CrossRef] [Scilit]
- Zhou, X.X.; Li, Y.Y.; Luo, Y.K.; Sun, Y.W.; Su, Y.J.; Tan, C.W.; Liu, Y.J. Research on Remote Sensing Classification of Fruit Trees Based on Sentinel-2 Multi-Temporal Imageries. Sci. Rep. 2022, 12, 11549. [Google Scholar] [CrossRef] [Scilit]
- Chabalala, Y.; Adam, E.; Kganyago, M. Mapping Fruit Tree Dynamics Using Phenological Metrics from Optimal Sentinel-2 Data and Deep Neural Network. CABI Agric. Biosci. 2023, 4, 51. [Google Scholar] [CrossRef] [Scilit]
- Xu, W.; Li, Z.; Lin, H.; Shao, G.; Zhao, F.; Wang, H.; Cheng, J.; Lei, L.; Chen, R.; Han, S.; et al. Mapping Fruit-Tree Plantation Using Sentinel-1/2 Time Series Images with Multi-Index Entropy Weighting Dynamic Time Warping Method. Remote Sens. 2024, 16, 3390. [Google Scholar] [CrossRef] [Scilit]
- Liang, J.; Sawut, M.; Cui, J.; Hu, X.; Xue, Z.; Zhao, M.; Zhang, X.; Rouzi, A.; Ye, X.; Xilike, A. Object-Oriented Multi-Scale Segmentation and Multi-Feature Fusion-Based Method for Identifying Typical Fruit Trees in Arid Regions Using Sentinel-1/2 Satellite Images. Sci. Rep. 2024, 14, 18230. [Google Scholar] [CrossRef] [Scilit] [PubMed]
- Yan, Y.; Tang, X.; Zhu, X.; Yu, X. Optimal Time Phase Identification for Apple Orchard Land Recognition and Spatial Analysis Using Multitemporal Sentinel-2 Images and Random Forest Classification. Sustainability 2023, 15, 4695. [Google Scholar] [CrossRef] [Scilit]
- Ozdarici-Ok, A.; Ok, A.O. Using Remote Sensing to Identify Individual Tree Species in Orchards: A Review. Sci. Hortic. 2023, 321, 112333. [Google Scholar] [CrossRef] [Scilit]
- Foerster, S.; Kaden, K.; Foerster, M.; Itzerott, S. Crop Type Mapping Using Spectral–Temporal Profiles and Phenological Information. Comput. Electron. Agric. 2012, 89, 30–40. [Google Scholar] [CrossRef] [Scilit]
- Bartoszek, K. Usefulness of MODIS Data for Assessment of the Growth and Development of Winter Oilseed Rape. Zemdirbyste 2014, 101, 445–452. [Google Scholar] [CrossRef] [Scilit]
- Domínguez, J.A.; Kumhálová, J.; Novák, P. Winter Oilseed Rape and Winter Wheat Growth Prediction Using Remote Sensing Methods. Plant Soil. Environ. 2015, 61, 410–416. [Google Scholar] [CrossRef] [Scilit]
- Vreugdenhil, M.; Wagner, W.; Bauer-Marschallinger, B.; Pfeil, I.; Teubner, I.; Rüdiger, C.; Strauss, P. Sensitivity of Sentinel-1 Backscatter to Vegetation Dynamics: An Austrian Case Study. Remote Sens. 2018, 10, 1396. [Google Scholar] [CrossRef] [Scilit]
- Kyere, I.; Astor, T.; Graß, R.; Wachendorf, M. Agricultural Crop Discrimination in a Heterogeneous Low-Mountain Range Region Based on Multi-Temporal and Multi-Sensor Satellite Data. Comput. Electron. Agric. 2020, 179, 105864. [Google Scholar] [CrossRef] [Scilit]
- Tůma, L.; Kumhálová, J.; Kumhála, F.; Krepl, V. The Noise-Reduction Potential of Radar Vegetation Index for Crop Management in the Czech Republic. Precis. Agric. 2022, 23, 450–469. [Google Scholar] [CrossRef] [Scilit]
- Schulz, C.; Holtgrave, A.K.; Kleinschmit, B. Large-Scale Winter Catch Crop Monitoring with Sentinel-2 Time Series and Machine Learning–An Alternative to on-Site Controls? Comput. Electron. Agric. 2021, 186, 106173. [Google Scholar] [CrossRef] [Scilit]
- Tomíček, J.; Mišurec, J.; Lukeš, P.; Potůčková, M. Retrieval of Harmonized LAI Product of Agricultural Crops from Landsat OLI and Sentinel-2 MSI Time Series. Agriculture 2022, 12, 2080. [Google Scholar] [CrossRef] [Scilit]
- Woźniak, E.; Rybicki, M.; Kofman, W.; Aleksandrowicz, S.; Wojtkowski, C.; Lewiński, S.; Bojanowski, J.; Musiał, J.; Milewski, T.; Slesiński, P.; et al. Multi-Temporal Phenological Indices Derived from Time Series Sentinel-1 Images to Country-Wide Crop Classification. Int. J. Appl. Earth Obs. Geoinf. 2022, 107, 102683. [Google Scholar] [CrossRef] [Scilit]
- Harfenmeister, K.; Itzerott, S.; Weltzien, C.; Spengler, D. Detecting Phenological Development of Winter Wheat and Winter Barley Using Time Series of Sentinel-1 and Sentinel-2. Remote Sens. 2021, 13, 5036. [Google Scholar] [CrossRef] [Scilit]
- Selvaraj, S.; Bargiel, D.; Htitiou, A.; Gerighausen, H. Analyzing Temporal Characteristics of Winter Catch Crops Using Sentinel-1 Time Series. Remote Sens. 2024, 16, 3737. [Google Scholar] [CrossRef] [Scilit]
- Řeřicha, J.; Kohútek, M.; Vandírková, V.; Krofta, K.; Kumhála, F.; Kumhálová, J. Assessment of UAV Imageries for Estimating Growth Vitality, Yield and Quality of Hop (Humulus lupulus L.) Crops. Remote Sens. 2025, 17, 970. [Google Scholar] [CrossRef] [Scilit]
- Löw, J.; Conrad, C.; Hill, S.; Thiel, M.; Ullmann, T.; Otte, I. A Novel Approach to Assessing the Tracking Accuracy of Crop Phenology for Multi-Orbit and Multi-Feature Sentinel-1 Time Series. Sci. Remote Sens. 2026, 13, 100370. [Google Scholar] [CrossRef] [Scilit]
- Shojaeezadeh, S.A.; Elnashar, A.; David Weber, T.K. A Novel Fusion of Sentinel-1 and Sentinel-2 with Climate Data for Crop Phenology Estimation Using Machine Learning. Sci. Remote Sens. 2025, 11, 100227. [Google Scholar] [CrossRef] [Scilit]
- Flores, L.; Nendel, C.; Bookhagen, B.; Oviedo Reyes, J.A.; Smith, T.; Ghazaryan, G. The Potential of Sentinel-1 Time Series for Large-Scale Assessment of Maize and Wheat Phenology across Germany. GIScience Remote Sens. 2025, 62, 2531593. [Google Scholar] [CrossRef] [Scilit]
- Prikaziuk, E.; Silva, C.F.; Koren, G.; Cai, Z.; Berger, K.; Belda, S.; Graf, L.V.; Tomelleri, E.; Verrelst, J.; Segarra, J.; et al. Evaluation and Improvement of Copernicus HR-VPP Product for Crop Phenology Monitoring. Comput. Electron. Agric. 2025, 233, 110136. [Google Scholar] [CrossRef] [Scilit]
- Ehlert, D.; Horn, H.J.; Adamek, R. Measuring Crop Biomass Density by Laser Triangulation. Comput. Electron. Agric. 2008, 61, 117–125. [Google Scholar] [CrossRef] [Scilit]
- Hoffmeister, D.; Bolten, A.; Curdt, C.; Waldhoff, G.; Bareth, G. High-Resolution Crop Surface Models (CSM) and Crop Volume Models (CVM) on Field Level by Terrestrial Laser Scanning. In Proceedings of the Sixth International Symposium on Digital Earth: Models, Algorithms, and Virtual Reality, Beijing, China, 9–12 September 2009. [Google Scholar] [CrossRef] [Scilit]
- Hoffmeister, D.; Waldhoff, G.; Curdt, C.; Tilly, N.; Bendig, J.; Bareth, G. Spatial Variability Detection of Crop Height in a Single Field by Terrestrial Laser Scanning. In Proceedings of the Precision Agriculture ’13; Stafford, J.V., Ed.; Wageningen Acad Publ: Wageningen, The Netherlands, 2013; pp. 267–274. [Google Scholar]
- Grenzdörffer, G.J.; Niemeyer, F. UAV BASED BRDF-MEASUREMENTS OF AGRICULTURAL SURFACES WITH PFIFFIKUS. Int. Arch. Photogramm. Remote Sens. Spat. Inf. Sci. 2012, 38, 229–234. [Google Scholar] [CrossRef] [Scilit]
- Kumhálová, J.; Moudrý, V. Topographical Characteristics for Precision Agriculture in Conditions of the Czech Republic. Appl. Geogr. 2014, 50, 90–98. [Google Scholar] [CrossRef] [Scilit]
- Geipel, J.; Link, J.; Claupein, W.; Lucieer, A.; Zarco-Tejada, P.J.; Rascher, U.; Bareth, G.; Thenkabail, P.S. Combined Spectral and Spatial Modeling of Corn Yield Based on Aerial Images and Crop Surface Models Acquired with an Unmanned Aircraft System. Remote Sens. 2014, 6, 10335–10355. [Google Scholar] [CrossRef] [Scilit]
- Bendig, J.; Yu, K.; Aasen, H.; Bolten, A.; Bennertz, S.; Broscheit, J.; Gnyp, M.L.; Bareth, G. Combining UAV-Based Plant Height from Crop Surface Models, Visible, and near Infrared Vegetation Indices for Biomass Monitoring in Barley. Int. J. Appl. Earth Obs. Geoinf. 2015, 39, 79–87. [Google Scholar] [CrossRef] [Scilit]
- Starý, K.; Jelínek, Z.; Kumhálová, J.; Chyba, J.; Balážová, K. Comparing RGB-Based Vegetation Indices from UAV Imageries to Estimate Hops Canopy Area. Agron. Res. 2020, 18, 2592–2601. [Google Scholar] [CrossRef]
- Zhang, C.; Valente, J.; Kooistra, L.; Guo, L.; Wang, W. Orchard Management with Small Unmanned Aerial Vehicles: A Survey of Sensing and Analysis Approaches. Precis. Agric. 2021, 22, 2007–2052. [Google Scholar] [CrossRef] [Scilit]
- Jafarbiglu, H.; Pourreza, A. A Comprehensive Review of Remote Sensing Platforms, Sensors, and Applications in Nut Crops. Comput. Electron. Agric. 2022, 197, 106844. [Google Scholar] [CrossRef] [Scilit]
- Popescu, D.; Ichim, L.; Stoican, F. Orchard Monitoring Based on Unmanned Aerial Vehicles and Image Processing by Artificial Neural Networks: A Systematic Review. Front. Plant Sci. 2023, 14. [Google Scholar] [CrossRef] [Scilit]
- Vuolo, F.; Neugebauer, N.; Bolognesi, S.F.; Atzberger, C.; D’Urso, G. Estimation of Leaf Area Index Using DEIMOS-1 Data: Application and Transferability of a Semi-Empirical Relationship between Two Agricultural Areas. Remote Sens. 2013, 5, 1274–1291. [Google Scholar] [CrossRef] [Scilit]
- Harfenmeister, K.; Spengler, D.; Weltzien, C. Analyzing Temporal and Spatial Characteristics of Crop Parameters Using Sentinel-1 Backscatter Data. Remote Sens. 2019, 11, 1569. [Google Scholar] [CrossRef] [Scilit]
- Tanda, G.; Chiarabini, V. Use of Multispectral and Thermal Imagery in Precision Viticulture; Institute of Physics Publishing: Bristol, UK, 2019; Volume 1224. [Google Scholar]
- Jełowicki, Ł.; Sosnowicz, K.; Ostrowski, W.; Osińska-Skotak, K.; Bakuła, K. Evaluation of Rapeseed Winter Crop Damage Using UAV-Based Multispectral Imagery. Remote Sens. 2020, 12, 2618. [Google Scholar] [CrossRef] [Scilit]
- Ayalew, D.A.; Deumlich, D.; Šarapatka, B.; Doktor, D. Quantifying the Sensitivity of NDVI-Based C Factor Estimation and Potential Soil Erosion Prediction Using Spaceborne Earth Observation Data. Remote Sens. 2020, 12, 1136. [Google Scholar] [CrossRef] [Scilit]
- Janoušek, J.; Jambor, V.; Marcoň, P.; Marcoň, M.; Dohnal, P.; Synková, H.; Fiala, P.; Carvajal-Ramírez, F.; Agüera-Vega, F.; Martínez-Carricondo, P. Using UAV-Based Photogrammetry to Obtain Correlation between the Vegetation Indices and Chemical Analysis of Agricultural Crops. Remote Sens. 2021, 13, 1878. [Google Scholar] [CrossRef] [Scilit]
- Csajbók, J.; Buday-Bódi, E.; Nagy, A.; Fehér, Z.Z.; Tamás, A.; Virág, I.C.; Bojtor, C.; Forgács, F.; Vad, A.M.; Kutasy, E. Multispectral Analysis of Small Plots Based on Field and Remote Sensing Surveys—A Comparative Evaluation. Sustainability 2022, 14, 3339. [Google Scholar] [CrossRef] [Scilit]
- Mezera, J.; Lukas, V.; Horniaček, I.; Smutný, V.; Elbl, J. Comparison of Proximal and Remote Sensing for the Diagnosis of Crop Status in Site-Specific Crop Management. Sensors 2022, 22, 19. [Google Scholar] [CrossRef] [Scilit] [PubMed]
- Jędrejek, A.; Koza, P.; Doroszewski, A.; Pudełko, R. Agricultural Drought Monitoring System in Poland—Farmers’ Assessments vs. Monitoring Results (2021). Agriculture 2022, 12, 536. [Google Scholar] [CrossRef] [Scilit]
- Dobosz, B.; Gozdowski, D.; Koronczok, J.; Žukovskis, J.; Wójcik-Gront, E. Evaluation of Maize Crop Damage Using UAV-Based RGB and Multispectral Imagery. Agriculture 2023, 13, 1627. [Google Scholar] [CrossRef] [Scilit]
- Jędrejek, A.; Jadczyszyn, J.; Pudełko, R. Increasing Accuracy of the Soil-Agricultural Map by Sentinel-2 Images Analysis—Case Study of Maize Cultivation under Drought Conditions. Remote Sens. 2023, 15, 1281. [Google Scholar] [CrossRef] [Scilit]
- Széles, A.; Huzsvai, L.; Mohammed, S.; Nyéki, A.; Zagyi, P.; Horváth, É.; Simon, K.; Arshad, S.; Tamás, A. Precision Agricultural Technology for Advanced Monitoring of Maize Yield under Different Fertilization and Irrigation Regimes: A Case Study in Eastern Hungary (Debrecen). J. Agric. Food Res. 2024, 15, 100967. [Google Scholar] [CrossRef] [Scilit]
- Vuolo, F.; Essl, L.; Atzberger, C. Costs and Benefits of Satellite-Based Tools for Irrigation Management. Front. Environ. Sci. 2015, 3, 150471. [Google Scholar] [CrossRef] [Scilit]
- Tamás, J.; Nagy, A.; Fehér, J. Agricultural Biomass Monitoring on Watersheds Based on Remotely Sensed Data. Water Sci. Technol. 2015, 72, 2212–2220. [Google Scholar] [CrossRef] [Scilit]
- Raeva, P.L.; Šedina, J.; Dlesk, A. Monitoring of Crop Fields Using Multispectral and Thermal Imagery from UAV. Eur. J. Remote Sens. 2019, 52, 192–201. [Google Scholar] [CrossRef] [Scilit]
- Żelazny, W.R.; Lukáš, J. Drought Stress Detection in Juvenile Oilseed Rape Using Hyperspectral Imaging with a Focus on Spectra Variability. Remote Sens. 2020, 12, 3462. [Google Scholar] [CrossRef] [Scilit]
- Potopová, V.; Trifan, T.; Trnka, M.; De Michele, C.; Semerádová, D.; Fischer, M.; Meitner, J.; Musiolková, M.; Muntean, N.; Clothier, B. Copulas Modelling of Maize Yield Losses—Drought Compound Events Using the Multiple Remote Sensing Indices over the Danube River Basin. Agric. Water Manag. 2023, 280, 108217. [Google Scholar] [CrossRef] [Scilit]
- Pintér, K.; Nagy, Z. Building a UAV Based System to Acquire High Spatial Resolution Thermal Imagery for Energy Balance Modelling. Sensors 2022, 22, 3251. [Google Scholar] [CrossRef] [Scilit]
- Kowalski, K.; Senf, C.; Okujeni, A.; Hostert, P. Large-Scale Remote Sensing Analysis Reveals an Increasing Coupling of Grassland Vitality to Atmospheric Water Demand. Glob. Change Biol. 2024, 30, e17315. [Google Scholar] [CrossRef] [Scilit] [PubMed]
- Xi, R.; Gu, Y.; Zhang, X.; Ren, Z. Nitrogen Monitoring and Inversion Algorithms of Fruit Trees Based on Spectral Remote Sensing: A Deep Review. Front. Plant Sci. 2024, 15, 1489151. [Google Scholar] [CrossRef] [Scilit]
- Hou, K.; Bai, T.; Li, X.; Shi, Z.; Li, S. Inversion Study of Nitrogen Content of Hyperspectral Apple Canopy Leaves Using Optimized Least Squares Support Vector Machine Approach. Forests 2024, 15, 268. [Google Scholar] [CrossRef] [Scilit]
- Carella, A.; Bulacio Fischer, P.T.; Massenti, R.; Lo Bianco, R. Continuous Plant-Based and Remote Sensing for Determination of Fruit Tree Water Status. Horticulturae 2024, 10, 516. [Google Scholar] [CrossRef] [Scilit]
- Bognár, P.; Ferencz, C.; Pásztor, S.Z.; Molnár, G.; Timár, G.; Hamar, D.; Lichtenberger, J.; Székely, B.; Steinbach, P.; Ferencz, O.E. Yield Forecasting for Wheat and Corn in Hungary by Satellite Remote Sensing. Int. J. Remote Sens. 2011, 32, 4759–4767. [Google Scholar] [CrossRef] [Scilit]
- Kumhalova, J.; Zemek, F.; Novak, P.; Brovkina, O.; Mayerova, M. Use of Landsat Images for Yield Evaluation within a Small Plot. Plant Soil. Environ. 2014, 60, 501–506. [Google Scholar] [CrossRef] [Scilit]
- Spitkó, T.; Nagy, Z.; Zsubori, Z.T.; Szőke, C.; Berzy, T.; Pintér, J.; Marton, C.L. Connection between Normalized Difference Vegetation Index and Yield in Maize. Plant Soil Environ. 2016, 62, 293–298. [Google Scholar] [CrossRef] [Scilit]
- Kumhálová, J.; Matějková, Š. Yield Variability Prediction by Remote Sensing Sensors with Different Spatial Resolution. Int. Agrophys. 2017, 31, 195–202. [Google Scholar] [CrossRef] [Scilit]
- Lussem, U.; Bolten, A.; Gnyp, M.L.; Jasper, J.; Bareth, G. Evaluation of RGB-Based Vegetation Indices from UAV Imagery to Estimate Forage Yield in Grassland. Int. Soc. Photogramm. Remote Sens. 2018, 42, 1215–1219. [Google Scholar] [CrossRef] [Scilit]
- Jelínek, Z.; Starý, K.; Kumhálová, J. Assessment of Production Zones Modelling Accuracy Based on Satellite Imaging and Yield Measurement of Selected Agriculture Plot. Agron. Res. 2019, 17, 447–455. [Google Scholar] [CrossRef]
- Panek, E.; Gozdowski, D.; Stępień, M.; Samborski, S.; Ruciński, D.; Buszke, B. Within-Field Relationships between Satellite-Derived Vegetation Indices, Grain Yield and Spike Number of Winter Wheat and Triticale. Agronomy 2020, 10, 1842. [Google Scholar] [CrossRef] [Scilit]
- Vallentin, C.; Harfenmeister, K.; Itzerott, S.; Kleinschmit, B.; Conrad, C.; Spengler, D. Suitability of Satellite Remote Sensing Data for Yield Estimation in Northeast Germany. Precis. Agric. 2022, 23, 52–82. [Google Scholar] [CrossRef] [Scilit]
- Marszalek, M.; Körner, M.; Schmidhalter, U. Prediction of Multi-Year Winter Wheat Yields at the Field Level with Satellite and Climatological Data. Comput. Electron. Agric. 2022, 194, 106777. [Google Scholar] [CrossRef] [Scilit]
- Panek, E.; Gozdowski, D. Relationship between MODIS Derived NDVI and Yield of Cereals for Selected European Countries. Agronomy 2021, 11, 340. [Google Scholar] [CrossRef] [Scilit]
- Bojanowski, J.S.; Sikora, S.; Musiał, J.P.; Woźniak, E.; Dąbrowska-Zielińska, K.; Slesiński, P.; Milewski, T.; Łączyński, A. Integration of Sentinel-3 and MODIS Vegetation Indices with ERA-5 Agro-Meteorological Indicators for Operational Crop Yield Forecasting. Remote Sens. 2022, 14, 1238. [Google Scholar] [CrossRef] [Scilit]
- Ronchetti, G.; Manfron, G.; Weissteiner, C.J.; Seguini, L.; Nisini Scacchiafichi, L.; Panarello, L.; Baruth, B. Remote Sensing Crop Group-Specific Indicators to Support Regional Yield Forecasting in Europe. Comput. Electron. Agric. 2023, 205, 107633. [Google Scholar] [CrossRef] [Scilit]
- Harsányi, E.; Bashir, B.; Arshad, S.; Ocwa, A.; Vad, A.; Alsalman, A.; Bácskai, I.; Rátonyi, T.; Hijazi, O.; Széles, A.; et al. Data Mining and Machine Learning Algorithms for Optimizing Maize Yield Forecasting in Central Europe. Agronomy 2023, 13, 1297. [Google Scholar] [CrossRef] [Scilit]
- Panek-Chwastyk, E.; Ozbilge, C.N.; Dąbrowska-Zielińska, K.; Wróblewski, K. Assessment of Grassland Biomass Prediction Using AquaCrop Model: Integrating Sentinel-2 Data and Ground Measurements in Wielkopolska and Podlasie Regions, Poland. Agriculture 2024, 14, 837. [Google Scholar] [CrossRef] [Scilit]
- Stettmer, M.; Mittermayer, M.; Maidl, F.-X.; Schwarzensteiner, J.; Hülsbergen, K.-J.; Bernhardt, H. Three Methods of Site-Specific Yield Mapping as a Data Source for the Delineation of Management Zones in Winter Wheat. Agriculture 2022, 12, 1128. [Google Scholar] [CrossRef] [Scilit]
- Wójtowicz, M.; Wójtowicz, A. Application of Remote Sensing Methods in Agriculture. CBCS 2016, 11, 31–50. [Google Scholar]
- Gozdowski, D.; Stępień, M.; Panek, E.; Varghese, J.; Bodecka, E.; Rozbicki, J.; Samborski, S. Comparison of Winter Wheat NDVI Data Derived from Landsat 8 and Active Optical Sensor at Field Scale. Remote Sens. Appl. Soc. Environ. 2020, 20, 100409. [Google Scholar] [CrossRef] [Scilit]
- Szewczak, K.; Łoś, H.; Pudełko, R.; Doroszewski, A.; Gluba, Ł.; Łukowski, M.; Rafalska-Przysucha, A.; Słomiński, J.; Usowicz, B. Agricultural Drought Monitoring by MODIS Potential Evapotranspiration Remote Sensing Data Application. Remote Sens. 2020, 12, 3411. [Google Scholar] [CrossRef] [Scilit]
- Yuan, J.; Ji, W.; Feng, Q.; Vrchota, J.; Pech, M.; Švepešová, I. Precision Agriculture Technologies for Crop and Livestock Production in the Czech Republic. Agriculture 2022, 12, 1080. [Google Scholar] [CrossRef] [Scilit]
- Torney, L.; Weltzien, C.; Herold, M.; Vogel, S.; Voß, S. Improving Agricultural Management Zoning Involving Sentinel-2 Timeseries, Crop’s Phenology Stages and Proximal Soil Sensing Data. Discov. Agric. 2025, 3, 113. [Google Scholar] [CrossRef] [Scilit]
- Schuster, C.; Schmidt, T.; Conrad, C.; Kleinschmit, B.; Förster, M. Grassland Habitat Mapping by Intra-Annual Time Series Analysis—Comparison of RapidEye and TerraSAR-X Satellite Data. Int. J. Appl. Earth Obs. Geoinf. 2015, 34, 25–34. [Google Scholar] [CrossRef] [Scilit]
- Reuß, F.; Greimeister-Pfeil, I.; Vreugdenhil, M.; Wagner, W. Comparison of Long Short-Term Memory Networks and Random Forest for Sentinel-1 Time Series Based Large Scale Crop Classification. Remote Sens. 2021, 13, 5000. [Google Scholar] [CrossRef] [Scilit]
- Hejmanowska, B.; Kramarczyk, P.; Głowienka, E.; Mikrut, S. Reliable Crops Classification Using Limited Number of Sentinel-2 and Sentinel-1 Images. Remote Sens. 2021, 13, 3176. [Google Scholar] [CrossRef] [Scilit]
- ÚKZÚZ. Available online: https://ukzuz.gov.cz/public/portal/ukzuz/en (accessed on 29 January 2026).
- Bundessortenamt: Start. Available online: https://www.bundessortenamt.de/bsa/ (accessed on 29 January 2026).
- COBORU. Available online: https://www.coboru.gov.pl/index_en (accessed on 29 January 2026).
- VURV: PPRC. Available online: https://www.vurv.sk/en/ (accessed on 29 January 2026).
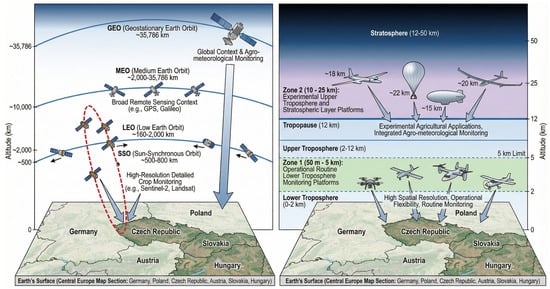
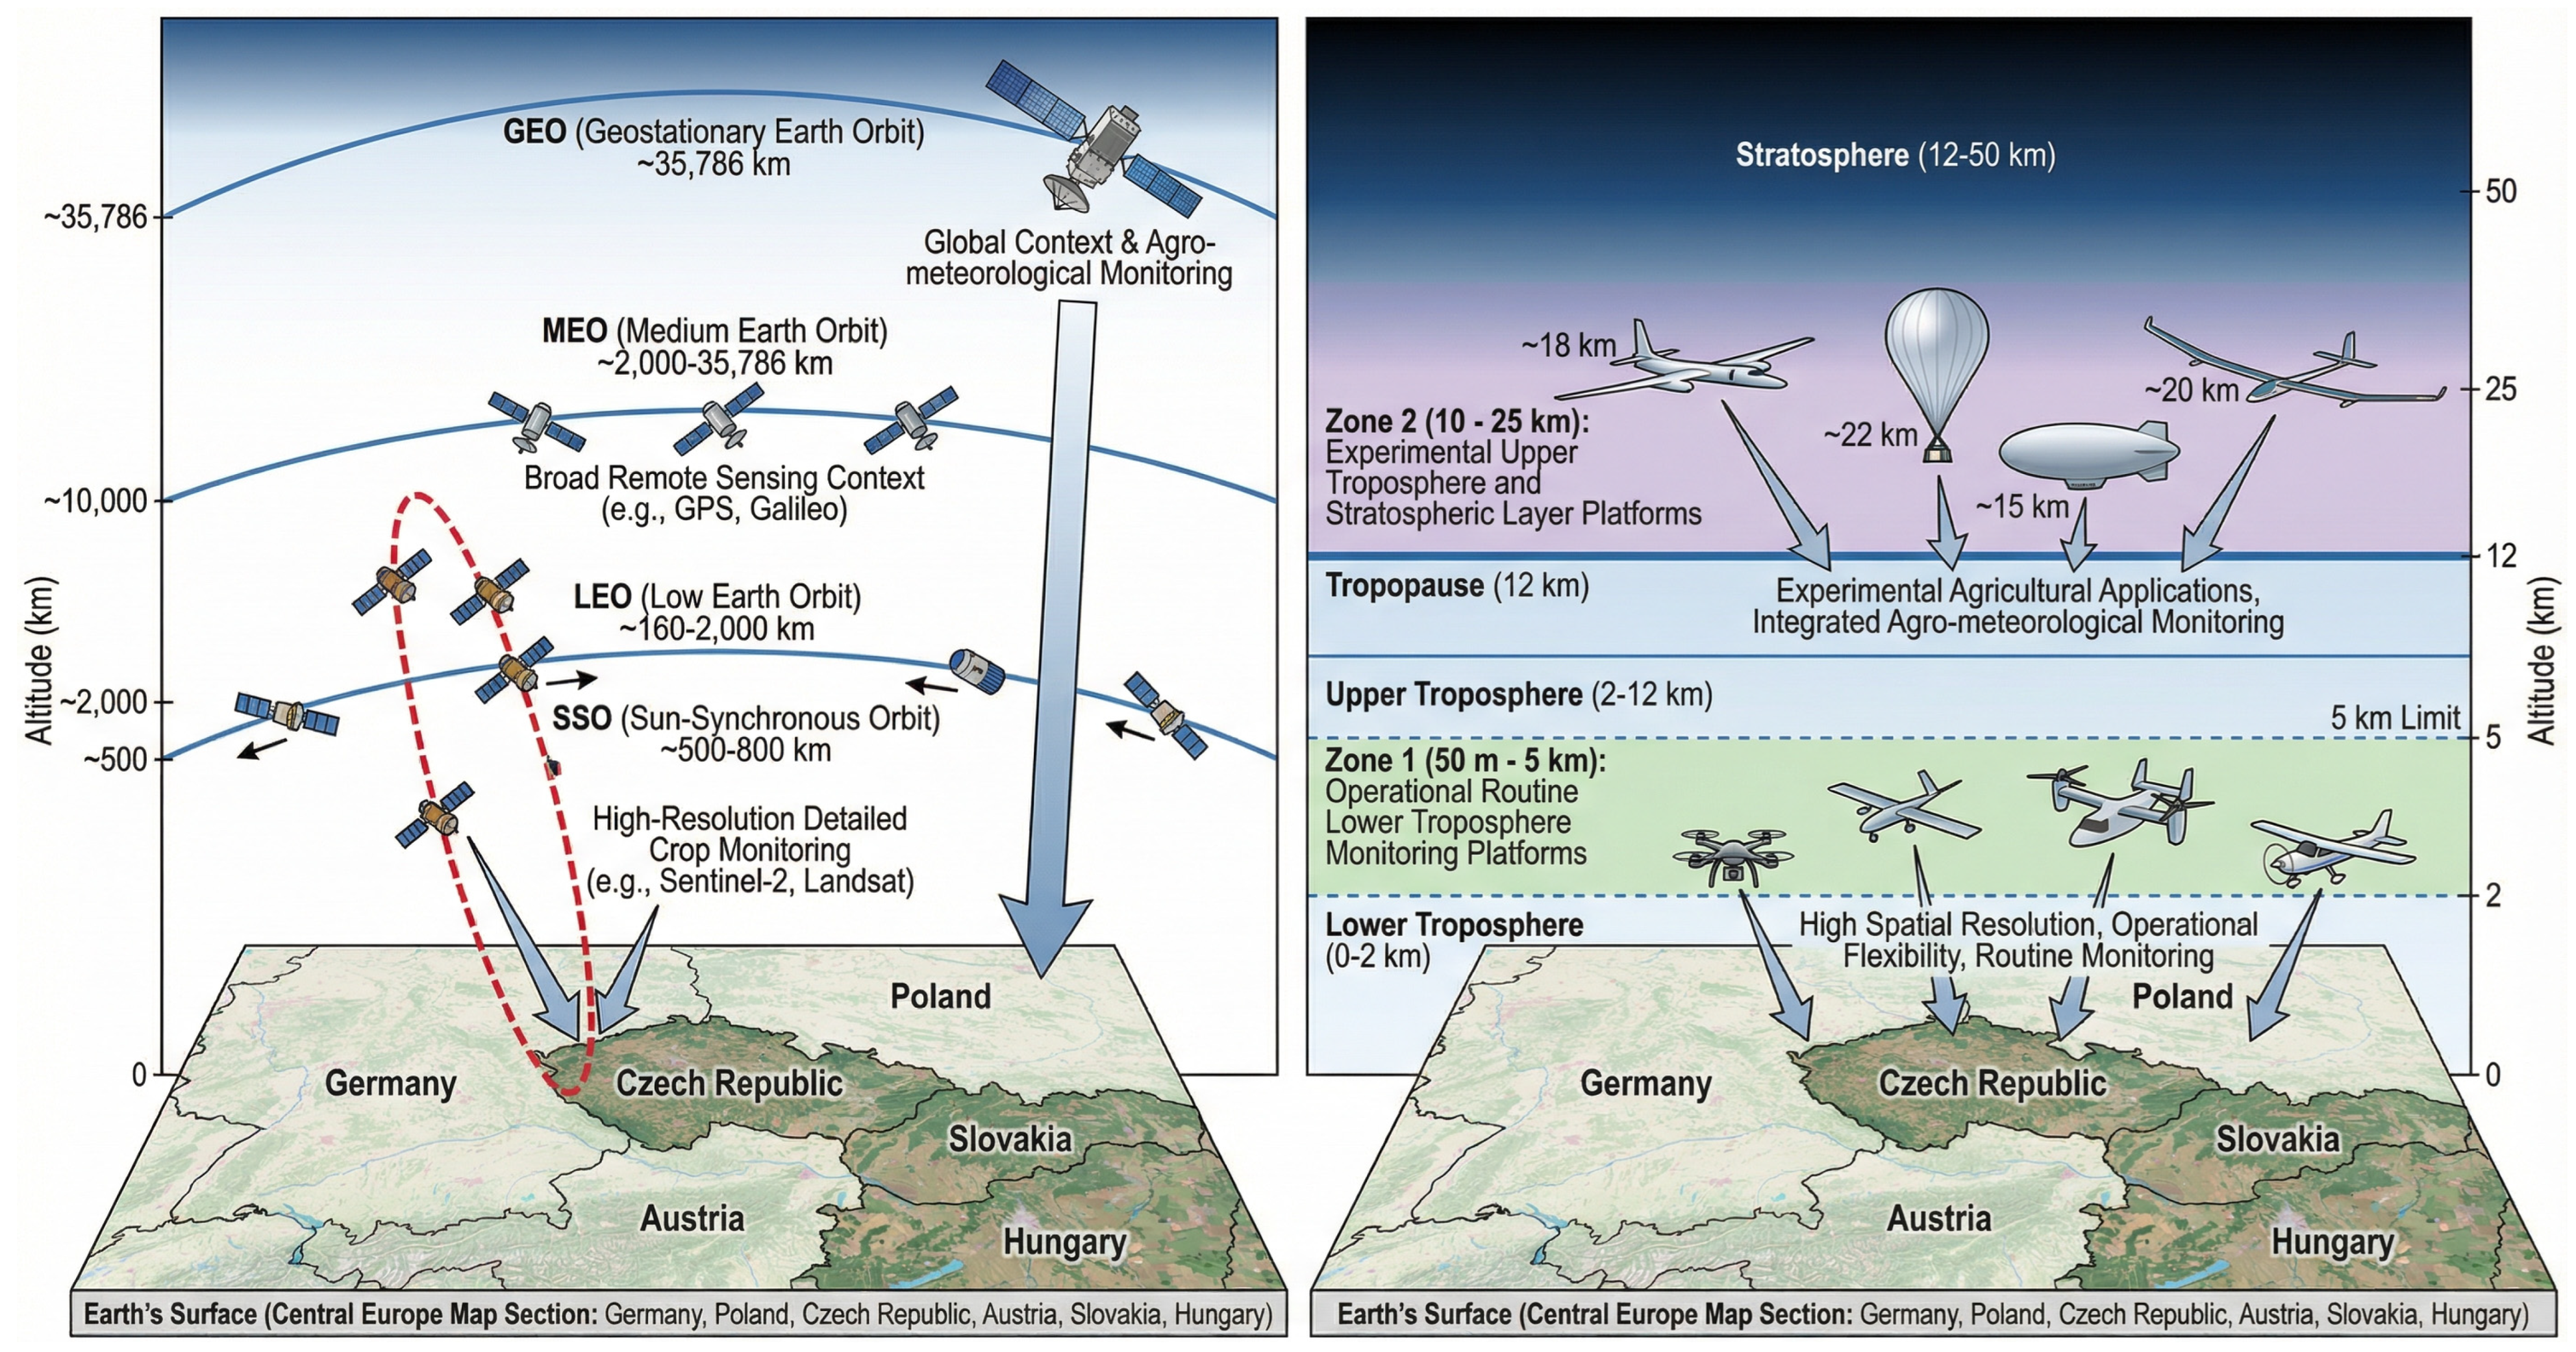

Disclaimer/Publisher’s Note: The statements, opinions and data contained in all publications are solely those of the individual author(s) and contributor(s) and not of MDPI and/or the editor(s). MDPI and/or the editor(s) disclaim responsibility for any injury to people or property resulting from any ideas, methods, instructions or products referred to in the content. |
© 2026 by the authors. Licensee MDPI, Basel, Switzerland. This article is an open access article distributed under the terms and conditions of the Creative Commons Attribution (CC BY) license.