


Highlights
What are the main findings?
- FY-3E/VASS temperature and humidity profile products exhibit pronounced height-dependent and station-dependent error characteristics over North China in summer.
- Cloudy conditions substantially amplify retrieval errors, with the boundary-layer humidity mean bias nearly doubling compared with clear-sky conditions.
What are the implications of the main findings?
- The results highlight the need to carefully consider altitude range and weather conditions when applying FY-3E/VASS profile products in regional studies.
- The identified error patterns provide practical references for improving retrieval algorithms and background field constraints under cloudy conditions.
Abstract
Based on summer ground-based microwave radiometer (MWR) observations over North China, this study systematically evaluates the accuracy of temperature and humidity profile products derived from the Vertical Atmospheric Sounding System (VASS) onboard the FY-3E satellite. The VASS products are compared with the numerical weather prediction (NWP) background fields as well as the ERA5 and CMA-RA 1.5 (CRA) reanalysis datasets. The results show that both ERA5 and CRA exhibit stable and reliable performance in representing temperature and humidity fields under both clear and cloudy conditions over North China. The temperature root mean square error (RMSE) generally ranges from 1.6 K to 2.6 K at different height levels (from 0 km to 10 km), while the RMSE of absolute humidity is approximately 0.4–2.7 g/m3. These results further confirm the reliability of CRA under both clear and cloudy conditions in this region. In contrast, the errors of the VASS products show pronounced variations with height, station, and weather conditions. A clear systematic underestimation of temperature is found at 1–3 km, with a mean bias of about −3.44 K. Humidity is also significantly underestimated in the boundary layer, with a mean bias of approximately −5.91 g/m3. Both temperature and humidity errors decrease rapidly with increasing height. Clear inter-station differences are also identified. Temperature errors show boundary-layer overestimation in Beijing, while Xingtai and Dingzhou exhibit systematic underestimation throughout most of the profile, with mean biases reaching −4.1 K and −3.3 K, respectively. Boundary-layer humidity underestimation is more pronounced in Xingtai and Dingzhou (approximately −6.6 g/m3) than in Beijing (−4.0 g/m3). Weather-based analysis indicates that clouds have a significant impact on the accuracy of the VASS products. Under cloudy conditions, the near-surface temperature mean bias shifts from overestimation under clear skies to underestimation. The magnitude of humidity underestimation under cloudy conditions is approximately twice that under clear conditions. Further comparison shows that the error characteristics of the NWP background fields in the lower and middle troposphere are partly similar to those of the VASS products. This suggests that the current retrieval algorithm still has limited capability to correct background field biases under complex weather conditions. These results provide scientific support for the selection of application scenarios and the optimization of retrieval algorithms for FY-3E/VASS temperature and humidity profile products, and they also support the reliable use of domestic reanalysis datasets in regional studies.
1. Introduction
Atmospheric temperature and humidity vertical profiles are fundamental for characterizing atmospheric thermodynamic and dynamical processes, driving numerical weather prediction models, and understanding the energy and water cycles of the climate system [1]. In recent years, advances in remote sensing technologies and data assimilation methods have expanded atmospheric profile observations beyond traditional radiosonde measurements to include satellite remote sensing and reanalysis datasets [2].
The Fengyun-3E (FY-3E) satellite, launched in 2021, is the world’s first civilian meteorological satellite operating in an early-morning orbit [3]. The Vertical Atmospheric Sounding System (VASS) onboard FY-3E integrates an infrared hyperspectral atmospheric sounder (HIRAS) with a new-generation microwave temperature and humidity sounder (MWHS and MWTS), providing global atmospheric temperature and humidity profile data. As a key payload designed to fill the observational gap between afternoon- and morning-orbit satellites and to support a complete three-orbit observing constellation, FY-3E plays an important role in improving the quality of initial conditions for global numerical weather prediction [4,5]. It is particularly valuable for monitoring meteorological phenomena active during dawn and dusk, including sea fog, diurnal variations in cloud cover, and convective initiation, which are critical for model initialization in numerical weather prediction systems [6]. Previous studies have shown that FY-3E observations effectively extend the global coverage of microwave temperature and humidity sounding. When assimilated, these observations produce stable positive impacts on tropical cyclone track and intensity forecasts, as well as on global medium-range forecast skill [7,8], highlighting their potential for operational applications. For example, Liu et al. [9] assessed the assimilation of FY-3E HIRAS-II radiances in the CMA-GFS system and found positive impacts on global temperature analyses. Zou et al. [10] evaluated HIRAS retrievals over East China using ERA5 as reference, reporting RMSE values of approximately 2.50 K in the lower troposphere under cloudy conditions. Huang et al. [11] examined the long-wave temperature sounding channels of HIRAS-II. For microwave instruments, Fang et al. [12] and Zhang et al. [13] evaluated the assimilation of MWHS-2 and MWTS-3 data for typhoon forecasting, showing benefits for track and intensity prediction.
The studies above focus on Level-1 radiance data or assimilation impacts. Recent studies have begun to evaluate FY-3E VASS Level-2 retrieval products. For example, Liu et al. [14] assessed the global performance of these products using collocated radiosonde observations. However, systematic regional validation using ground-based microwave radiometer observations remains limited, particularly for North China. FY-3E/VASS combines hyperspectral and microwave observations using physical inversion algorithms to retrieve temperature and humidity profiles. The accuracy of these profiles depends strongly on the retrieval methodology and the quality of the background fields. Systematic evaluations of accuracy, stability, and applicability across different regions and weather conditions are therefore required prior to operational use [15]. Such evaluations are standard practice for satellite temperature and humidity profile products [16].
The China Meteorological Administration global atmospheric reanalysis product (CMA-RA V 1.5, hereafter referred to as CRA) is an important dataset independently developed in China. Building upon the first-generation product, CRA has been substantially improved in terms of spatiotemporal resolution and data quality and has been widely applied in recent studies [17]. Its performance therefore needs to be benchmarked against the internationally recognized ERA5 reanalysis. Quantitative evaluation critically depends on reliable reference data. Ground-based microwave radiometers (MWRs) provide continuous point observations with high temporal resolution and have distinct advantages for boundary-layer sounding [18]. As a result, MWR observations serve as a robust reference for validating satellite retrievals and reanalysis products [19,20].
To clarify the quantitative accuracy of VASS in a representative region, this study focuses on summer conditions over North China and uses ground-based microwave radiometer observations to evaluate temperature and humidity profiles derived from the VASS retrieval products. The VASS results are further compared with the numerical weather prediction (NWP) background field employed in the retrievals, as well as with the ERA5 and CRA reanalysis datasets. Accuracy differences across altitudes and weather conditions are examined. These results provide practical references for dataset application and scientific support for the operational use and retrieval algorithm optimization of FY-3E atmospheric temperature and humidity profile products.
2. Data and Method
2.1. Data
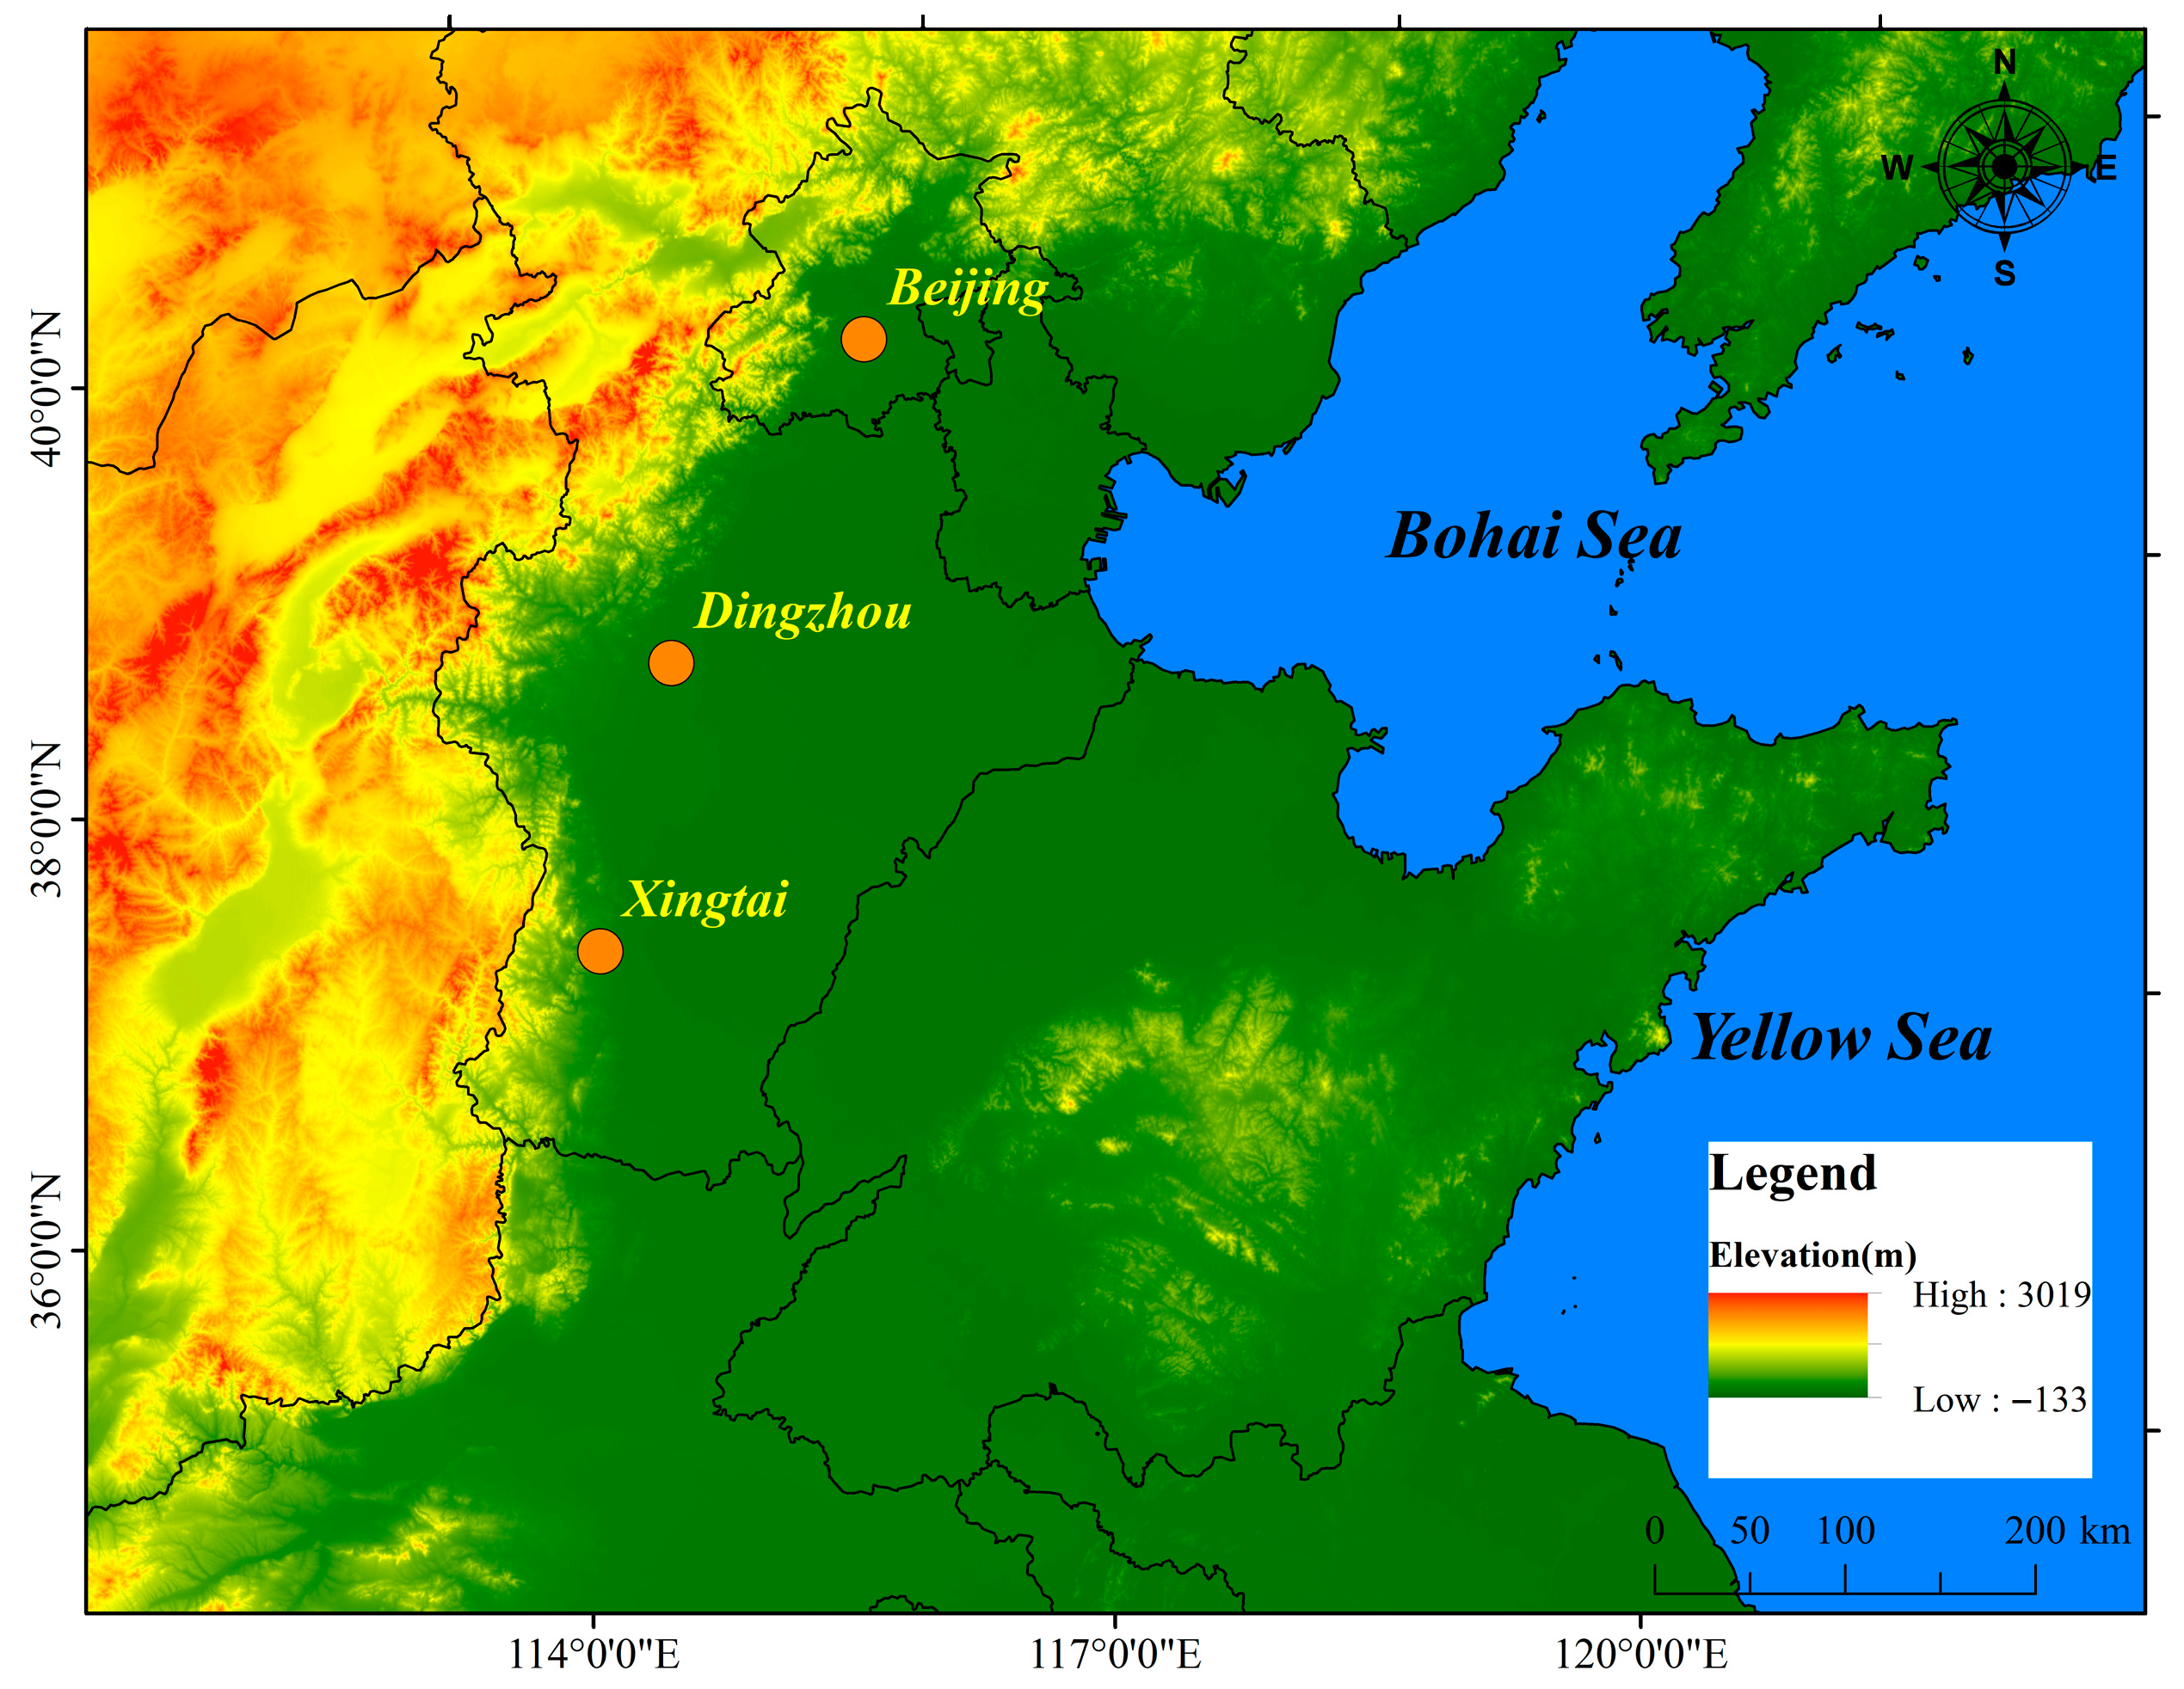
This study focuses on the summer period from 1 July to 31 August 2024 over North China, and uses observations from three representative sites located along the eastern foothills of the Taihang Mountains. These sites include an RPG-HATPRO-G5 ground-based microwave radiometer (RPG Radiometer Physics GmbH, Munich, Germany) deployed in the megacity of Beijing, as well as QFW6000 microwave radiometers (China Electronics Technology Group Corporation, 22nd Research Institute, Qingdao, China) in Dingzhou, a typical city on the central Hebei Plain, and Xingtai, a piedmont plain city at the front of the Taihang Mountains. The spatial distribution of the three sites is shown in Figure 1, and the site configuration covers regions with distinct levels of urbanization and terrain conditions. The microwave radiometer (MWR) data have undergone rigorous quality control procedures, including physical extreme-value checks and consistency tests. These data provide continuous temperature and humidity profile observations with high temporal resolution. Previous studies have demonstrated that MWR observations serve as a reliable reference for validating satellite-retrieved atmospheric temperature and humidity profiles, particularly in the boundary layer [19,21]. Accordingly, ground-based microwave radiometer observations are adopted as the reference truth for evaluating temperature and humidity profiles in this study.
Figure 1.
Locations of the ground-based microwave radiometer (MWR) stations over North China.
Fengyun-3E (FY-3E) is an early-morning-orbit satellite of China’s second-generation polar-orbiting meteorological satellite series, providing global coverage with a spatial resolution of 14 km and a revisit frequency of approximately 90 min. This study uses ascending and descending orbit data from the Level-2 atmospheric temperature and humidity profile products provided by the National Satellite Meteorological Center. These products include global temperature and humidity profiles retrieved from spectral observations of the FY-3E Vertical Atmospheric Sounding System (VASS), as well as numerical weather prediction (NWP) background profiles that provide initial guesses and physical constraints for the retrievals. The NWP backgrounds are 6 h forecasts from the GRAPES system (Global/Regional Assimilation and PrEdiction System), the operational global NWP system of the China Meteorological Administration. They provide temperature, humidity, and surface pressure fields at the same spatial resolution (14 km) as the VASS retrievals. According to the FY-3E official product user manual, only data with quality flags of 1–3 are retained to ensure high reliability. Weather conditions were classified based on FY-3E cloud detection results. Two categories were considered: clear and cloudy. It should be noted that the cloudy category includes both precipitating and non-precipitating conditions. This simplification allows a general assessment of cloud effects. However, precipitation introduces additional scattering and absorption processes. These processes may further influence retrieval accuracy.
The ERA5 reanalysis provides continuous global meteorological fields at an hourly temporal resolution since 1950, with a spatial resolution of 0.25° × 0.25° (approximately 31 km) [22]. To complement the evaluation framework and assess the performance of regional reanalysis products, this study also employs the newly developed CRA reanalysis product independently produced in China. CRA reproduces the global three-dimensional atmospheric state from the surface up to 55 km since 1979, with an hourly horizontal resolution of 10 km, allowing a more detailed depiction of the evolution of atmospheric structures [15]. Geopotential height, temperature, relative humidity, and specific humidity from both ERA5 and CRA are used in this study. These reanalysis products are not treated as reference truth, but are used for comparative analysis to examine differences in the error structures and stability of the satellite retrieval results.
2.2. Analysis Methods
FY-3E is a polar-orbiting satellite operating in an early-morning/late-evening orbit, and effective observations over the study region occur only during approximately two daily overpasses (Figure S1). An instantaneous matching and statistical evaluation approach is therefore adopted. To ensure comparability among datasets from different sources in both temporal and spatial dimensions, strict spatiotemporal collocation is applied. For temporal matching, the FY-3E overpass time is taken as the reference. MWR observations are matched using a 30 min sliding average centered on the satellite overpass, while CRA and ERA5 reanalysis data are selected as the nearest hourly records within ±30 min of the target time. For spatial matching, reanalysis data are interpolated from grid points to station coordinates using bilinear interpolation. FY-3E satellite data are processed using a spatial window averaging method, in which all observations within a 0.5° × 0.5° window centered on the station are averaged. If fewer than 10 valid observations are available, the window is expanded to 1° × 1° to maintain sample size. It should be noted that this expansion may reduce spatial representativeness in areas with strong heterogeneity, although such cases were relatively rare during our study period. Owing to the strict quality control applied to both FY-3E and MWR data, only 169 valid matched cases are obtained during the two-month summer period in 2024. All matched samples are of high reliability and sufficient to support subsequent quantitative evaluation and analysis. Considering the vertical coverage of all datasets and the variability of meteorological variables at different heights, a non-uniform geopotential height sequence Z_std (units: geopotential kilometers) was defined. In the lower levels (0–3 km), a finer resolution (0.1–0.2 km intervals) is used to capture the strong vertical gradients associated with boundary layer processes. In the middle and upper levels (3–10 km), where vertical variations are smoother, a coarser resolution (0.5 km intervals) is sufficient to represent the large-scale thermodynamic structure. This common grid also facilitates consistent interpolation among datasets with different native vertical resolutions (MWR, FY-3E, ERA5, and CRA). The full Z_std sequence is as follows: [0, 0.1, 0.2, 0.3, 0.4, 0.5, 0.6, 0.7, 0.8, 0.9, 1.0, 1.2, 1.4, 1.6, 1.8, 2.0, 2.2, 2.4, 2.6, 2.8, 3.0, 3.5, 4.0, 4.5, 5.0, 5.5, 6.0, 6.5, 7.0, 7.5, 8.0, 8.5, 9.0, 9.5, 10.0]. Temperature profiles from all datasets are linearly interpolated onto Z_std, while humidity profiles are interpolated in logarithmic space. Samples with more than three missing levels (out of 34 in Z_std) were excluded, ensuring that all retained samples have valid observations in every layer. All statistics in the following sections are therefore based on the same 169 collocated samples. Specific humidity and relative humidity from the reanalysis datasets are converted to absolute humidity using standard formulas to ensure consistency with satellite retrievals and MWR observations.
Absolute humidity (AH) can be derived from specific humidity (q) and air temperature (T) through a two-step calculation. First, the vapor pressure (e) is computed from specific humidity (q) and air pressure (p):
Then, absolute humidity (AH) is obtained by applying the vapor pressure (e) to the ideal gas law:
where AH is absolute humidity (kg/m3), e is vapor pressure (Pa), q is specific humidity (kg/kg), p is air pressure (Pa), T is air temperature (K), Mw = 0.01801528 kg/mol is the molar mass of water, and R = 8.314 J/(mol·K) is the universal gas constant [23].
To systematically evaluate the accuracy characteristics of the FY-3E, CRA, and ERA5 temperature and humidity profile products relative to MWR observations, this study quantifies the mean bias and root-mean-square error (RMSE) at different heights and under different weather conditions [24]. The evaluation is conducted from three perspectives: the overall vertical structure, inter-station differences, and weather-related modulation. These metrics are used to characterize systematic errors and the degree of dispersion, respectively [16].
The vertical layers are defined based on typical atmospheric structure: 0–1 km represents the boundary layer, where surface fluxes and turbulent mixing dominate; 1–3 km corresponds to the lower troposphere, often influenced by boundary layer processes and low-level jets; 3–6 km represents the middle troposphere, where synoptic-scale dynamics become more important; and 6–10 km corresponds to the upper troposphere, near the tropopause level.
Weather conditions are classified based on cloud detection results, with only two categories considered: clear and cloudy. The cloudy category includes both precipitating and non-precipitating processes. This classification is intended to characterize the overall modulation effect of clouds on retrieval error characteristics.
3. Results and Discussion
3.1. Overall Accuracy and Vertical Structure of Multi-Source Temperature and Humidity Profiles
Taking 26–28 July 2024 as an example, Supplementary Figures S2–S7 illustrate the three-dimensional spatiotemporal evolution of temperature and humidity. FY-3E is not included in these figures because its limited overpass frequency (twice daily) does not allow for continuous spatiotemporal evolution analysis. Ground-based microwave radiometer (MWR) observations, owing to their high temporal resolution, continuously capture the rapid evolution of temperature and humidity structures within the boundary layer. In contrast, the ERA5 and CRA reanalysis datasets exhibit relatively smooth near-surface variations and show noticeable differences from the MWR observations in fine-scale structural details [25]. This comparison indicates that MWR has a distinct advantage in characterizing boundary-layer thermodynamic and moisture variations and further highlights the necessity of using continuous ground-based observations for quantitative validation.
Based on the statistical analysis of all matched samples (N = 169), these differences are quantitatively characterized (see Table 1 and Table 2). For each layer, the mean values are calculated using all available height levels within that layer. All statistics are based on the same 169 samples. The error distributions of the different products exhibit clear vertical stratification, and distinct performance differences among the products are evident.
Table 1.
Statistical evaluation of temperature profile errors for FY-3E/VASS, FY-3E/NWP, ERA5, and CRA relative to ground-based microwave radiometer observations over North China during summer.
Table 2.
Statistical evaluation of humidity profile errors for FY-3E/VASS, FY-3E/NWP, ERA5, and CRA relative to ground-based microwave radiometer observations over North China during summer.
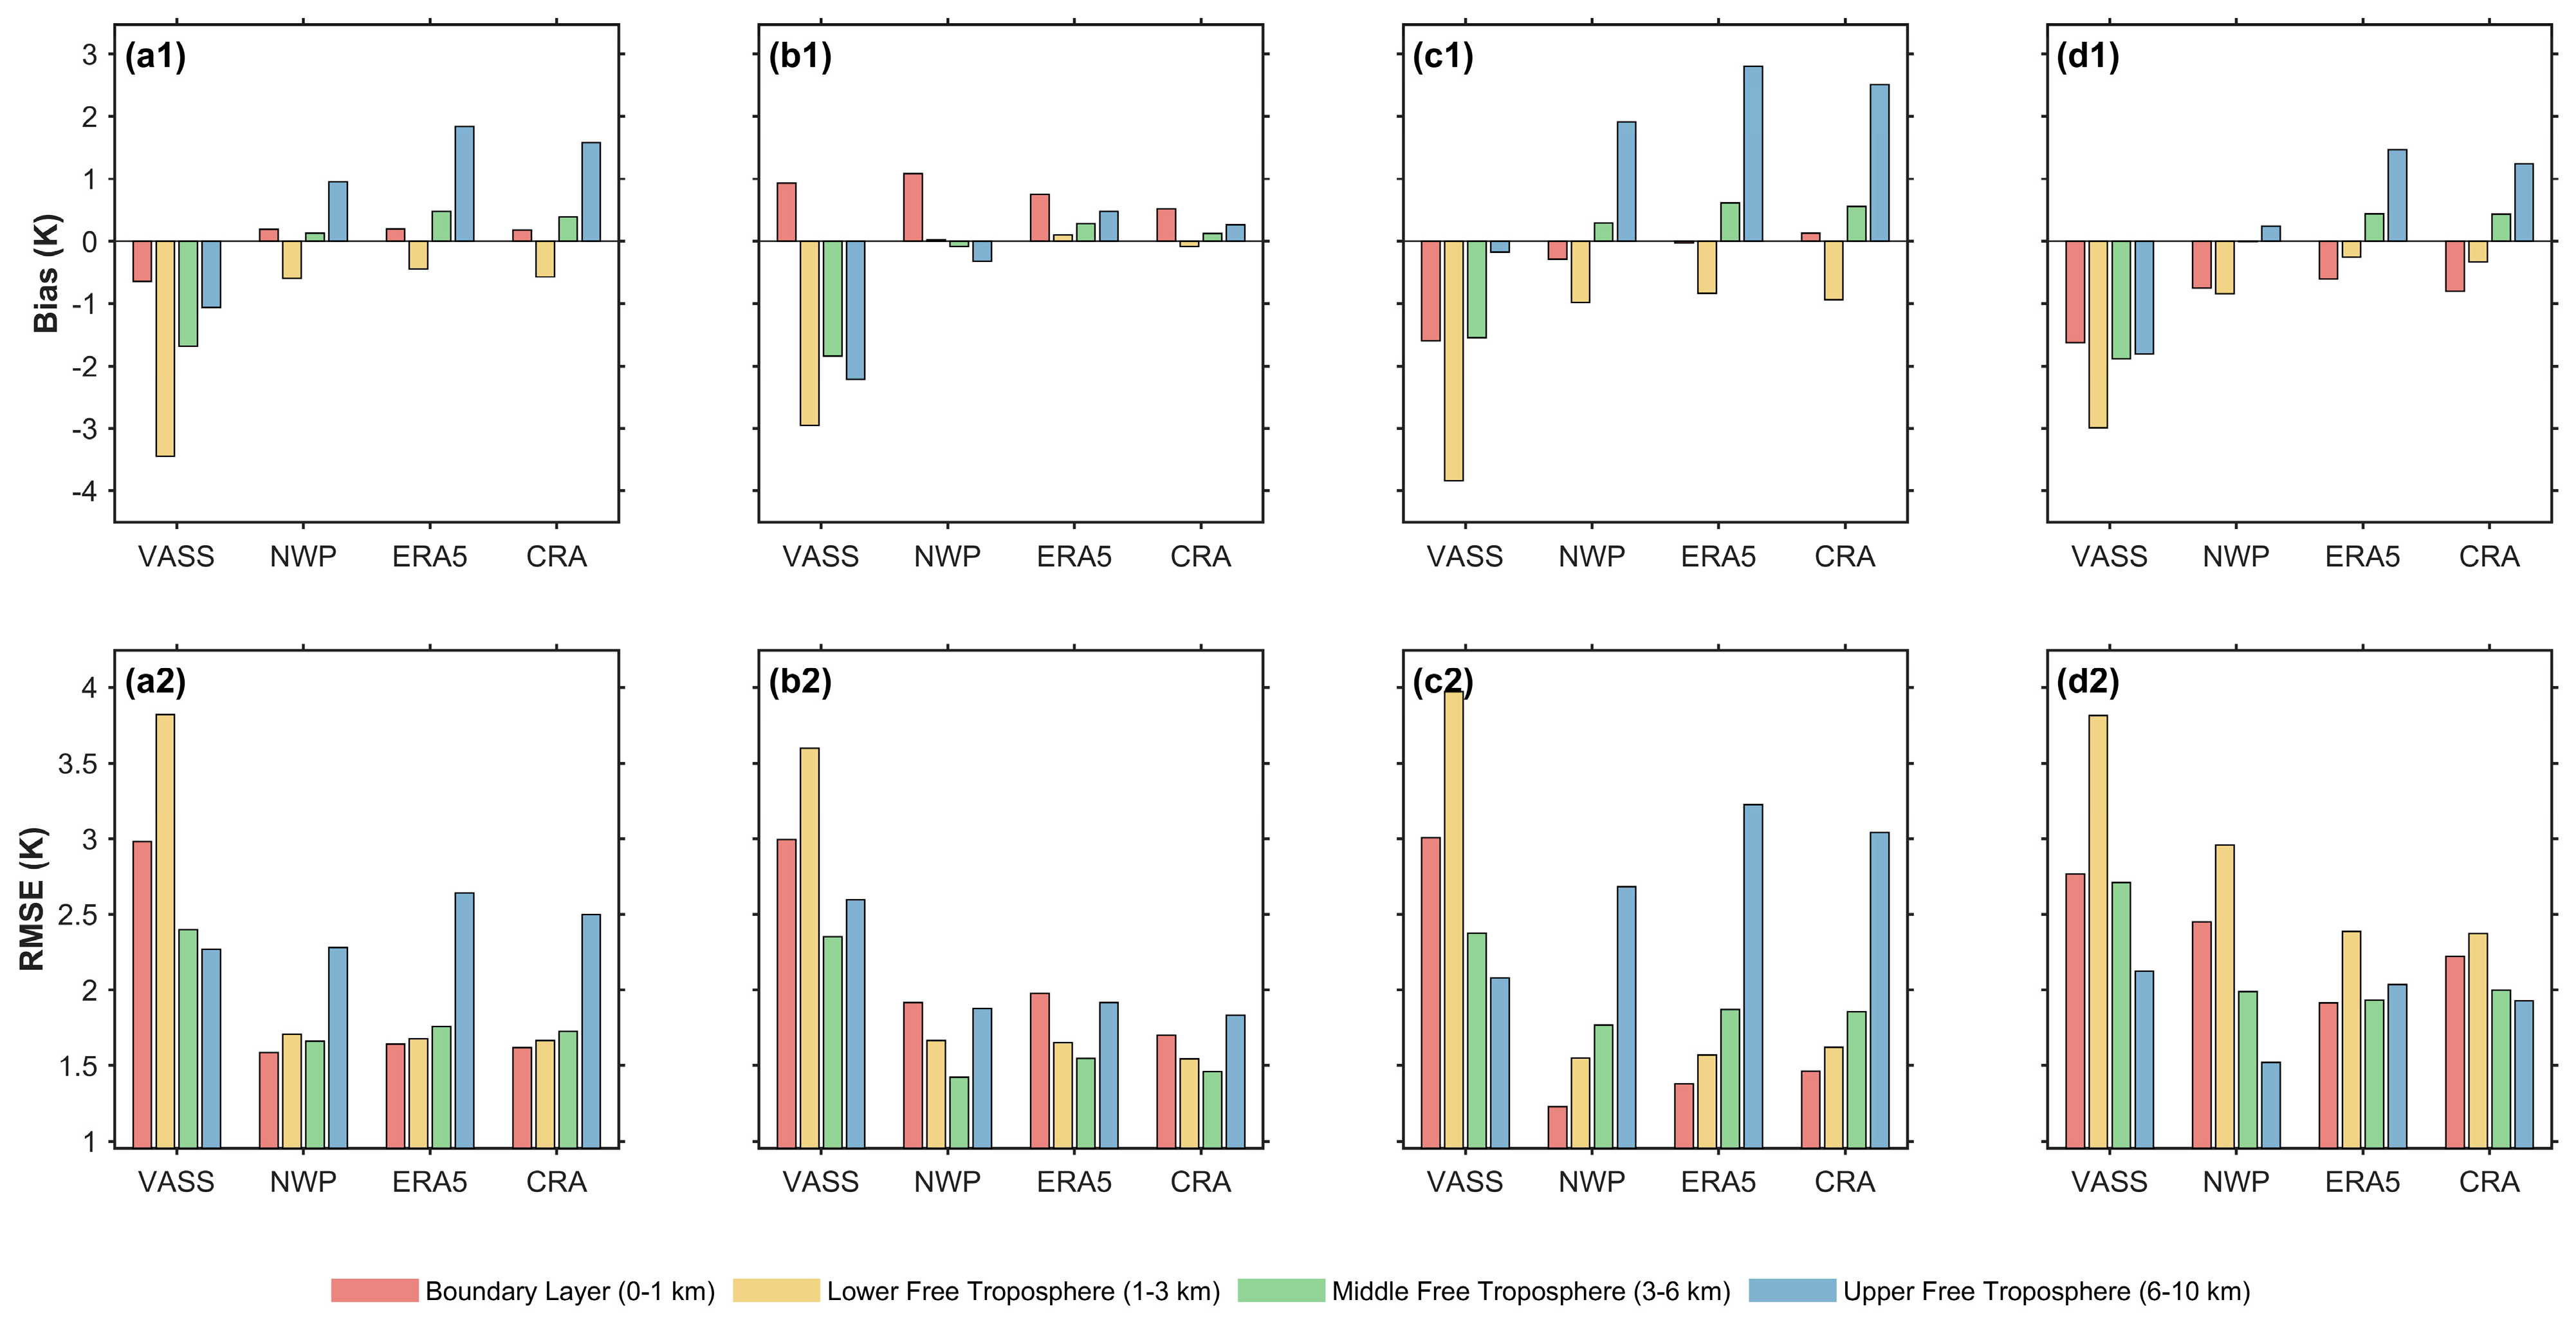
The temperature statistics in Table 1 show that VASS exhibits a pronounced systematic underestimation in the 1–3 km layer, with a mean bias of −3.44 K and an RMSE of 3.82 K. These values are substantially larger than those of the other products and represent the primary source of temperature error in this layer. In the near-surface layer (0–1 km), the VASS bias is −0.65 K. In contrast, the biases of the NWP background, ERA5, and CRA are small (0.19 K, 0.20 K, and 0.18 K, respectively), with RMSE values remaining stable between 1.59 and 1.65 K. In the middle layer (3–6 km), the NWP background, ERA5, and CRA transition from underestimation to overestimation. In the upper layer (6–10 km), ERA5 shows an overestimation of 1.84 K, CRA shows 1.58 K, and NWP shows 0.95 K. Notably, the domestically developed CRA reanalysis displays bias and RMSE values that are highly consistent with those of ERA5 across all height ranges. In particular, within the critical 1–3 km layer, the RMSE difference between the two datasets is only 0.01 K, confirming the reliability of CRA for applications involving the temperature field over North China.
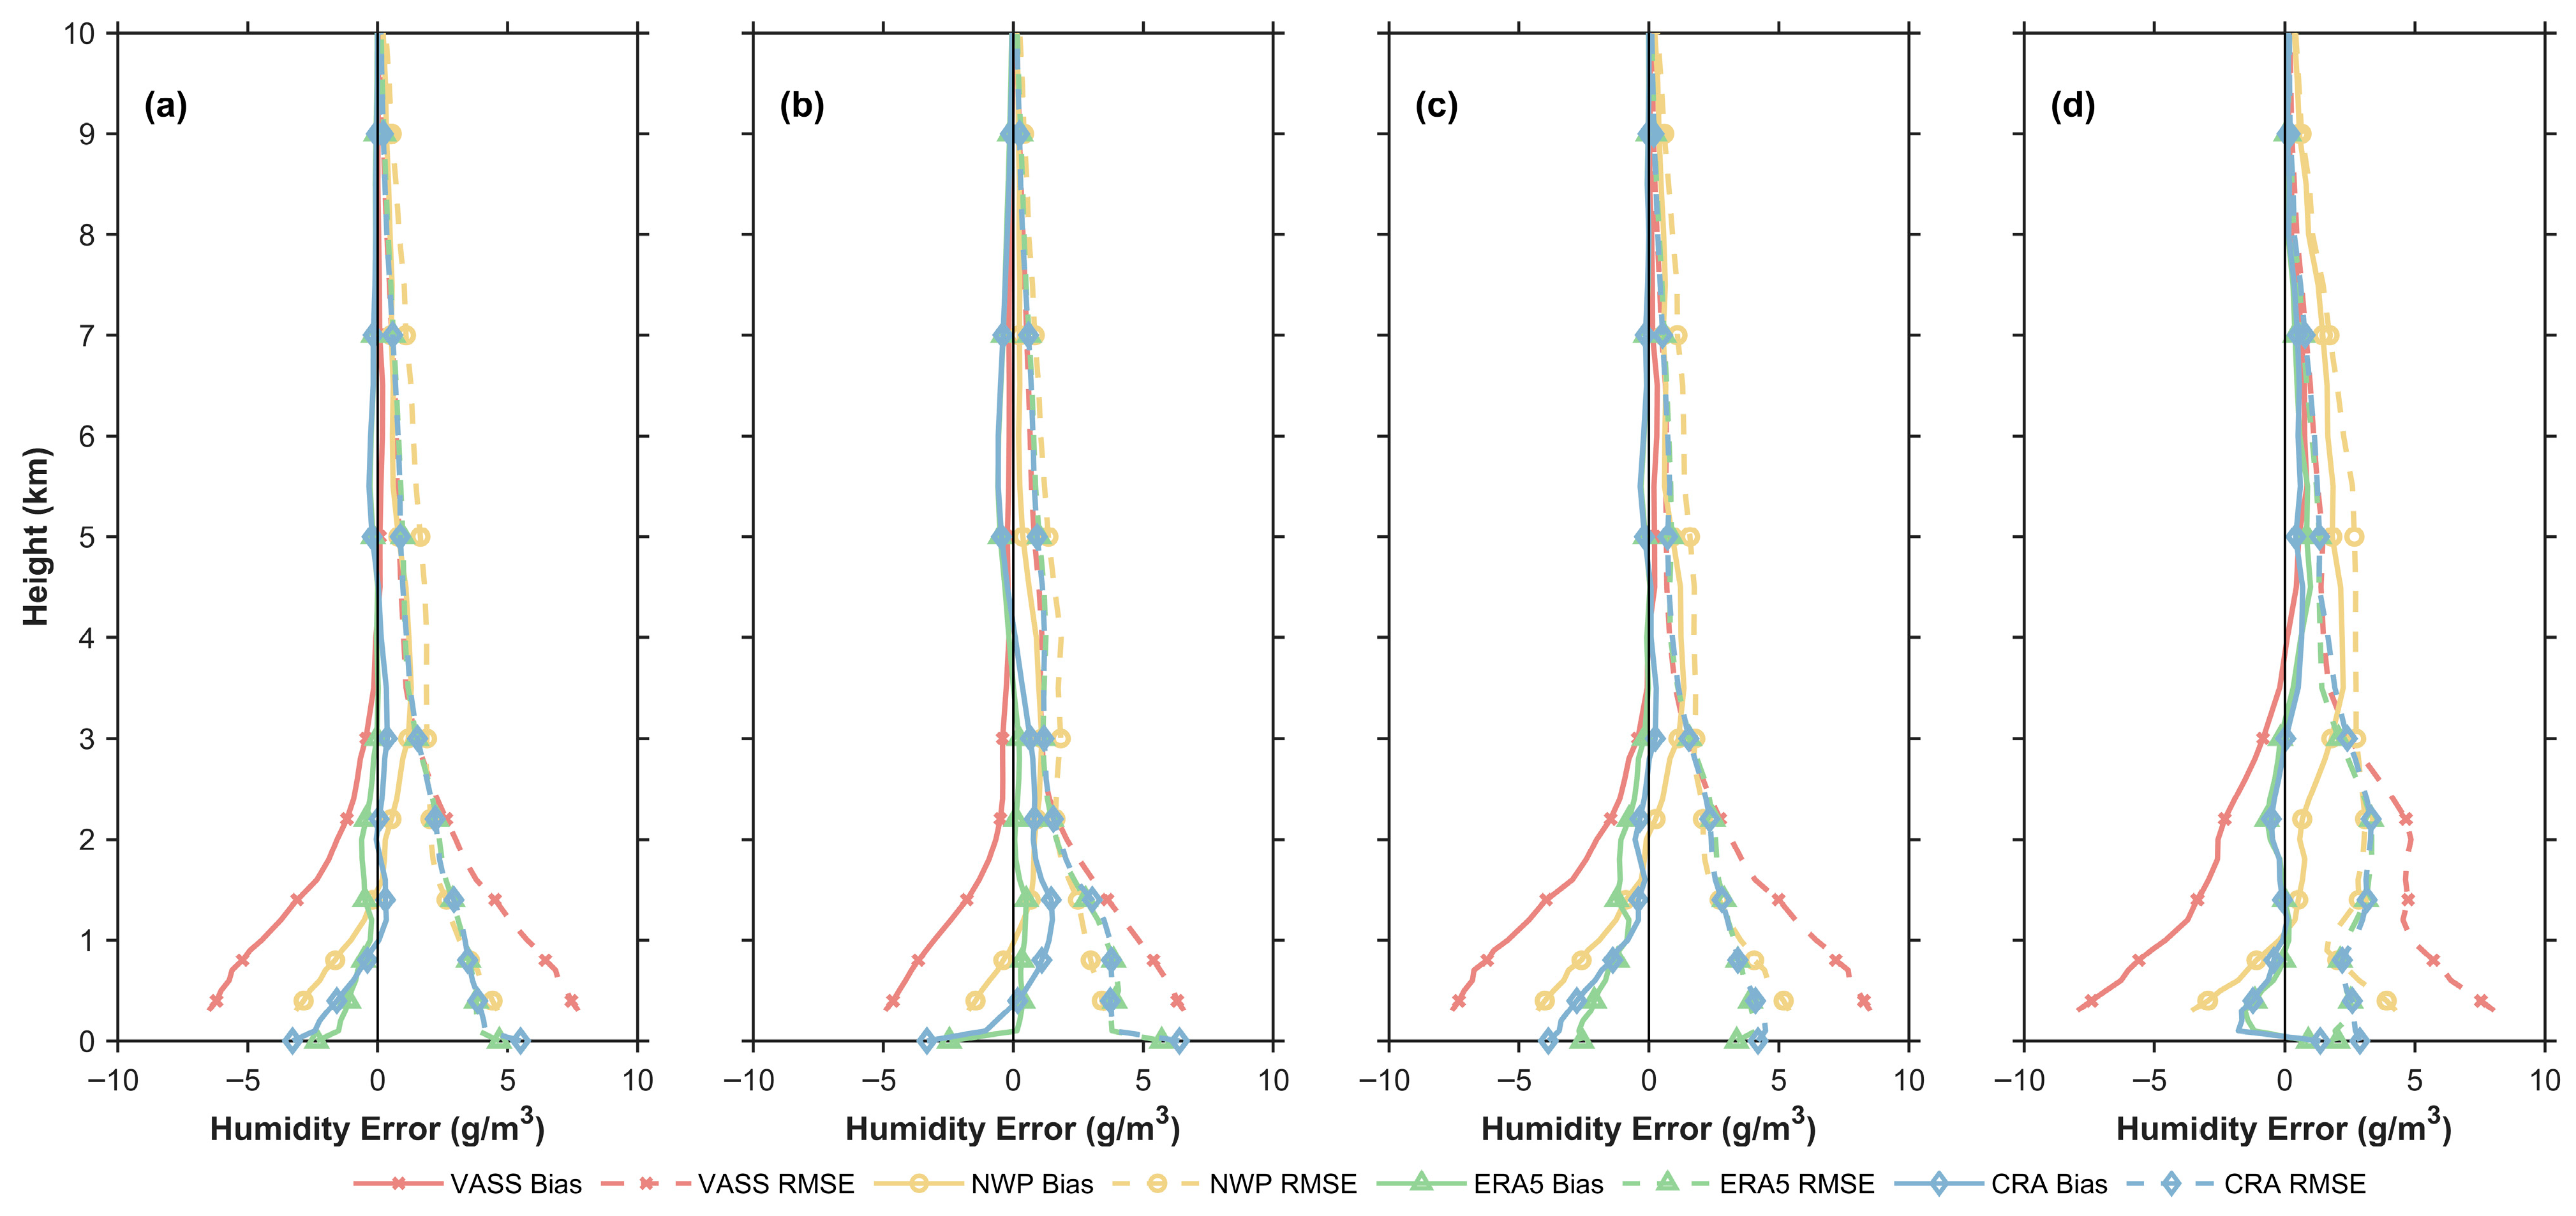
The humidity statistics in Table 2 show that VASS exhibits a pronounced systematic underestimation in the boundary layer (0–1 km), with a mean bias of −5.91 g/m3 and an RMSE of 5.82 g/m3. These errors are considerably larger than those of the other products, indicating reduced retrieval accuracy in this layer. With increasing height, humidity errors for all datasets decrease rapidly; in the upper layer (6–10 km), the RMSE values of all products fall below 0.75 g/m3, suggesting relatively good performance of humidity retrievals at higher altitudes. Consistent with the temperature results, ERA5 and CRA exhibit small biases throughout the entire atmospheric column.
By synthesizing the error characteristics of both temperature and humidity, it is evident that the dominant systematic errors of VASS are mainly concentrated in the lower and middle troposphere. Temperature errors are more pronounced in the 1–3 km layer than at other altitudes, while humidity errors are primarily confined to the boundary layer, with magnitudes reaching −5.91 g/m3. VASS exhibits persistent systematic underestimation of both temperature and humidity in the lower and middle troposphere over North China during summer.
3.2. Differences in Errors Among Different Stations
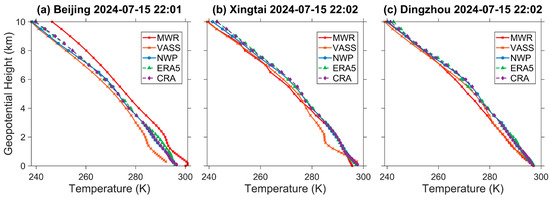
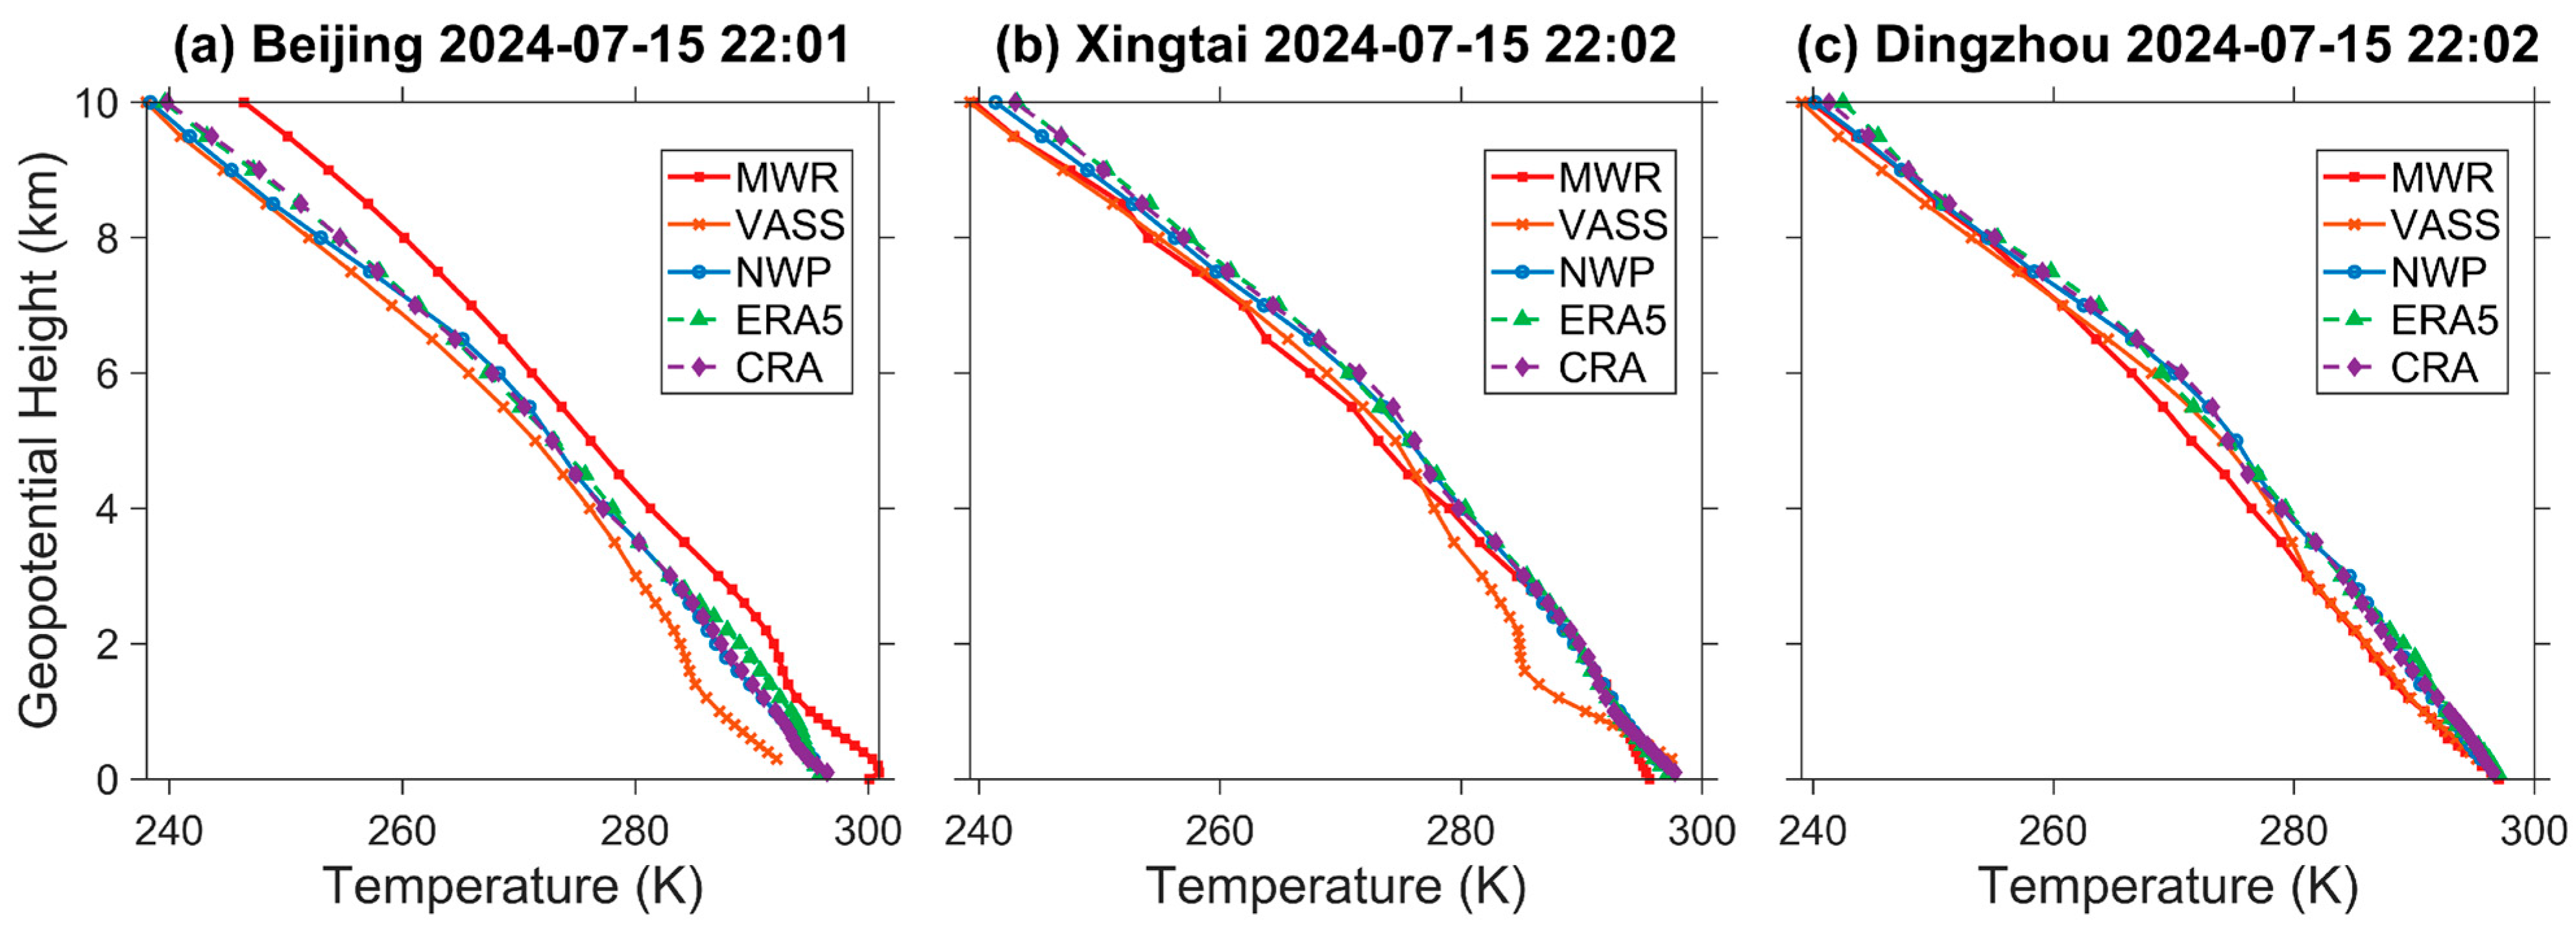
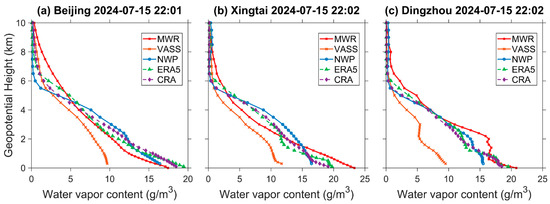
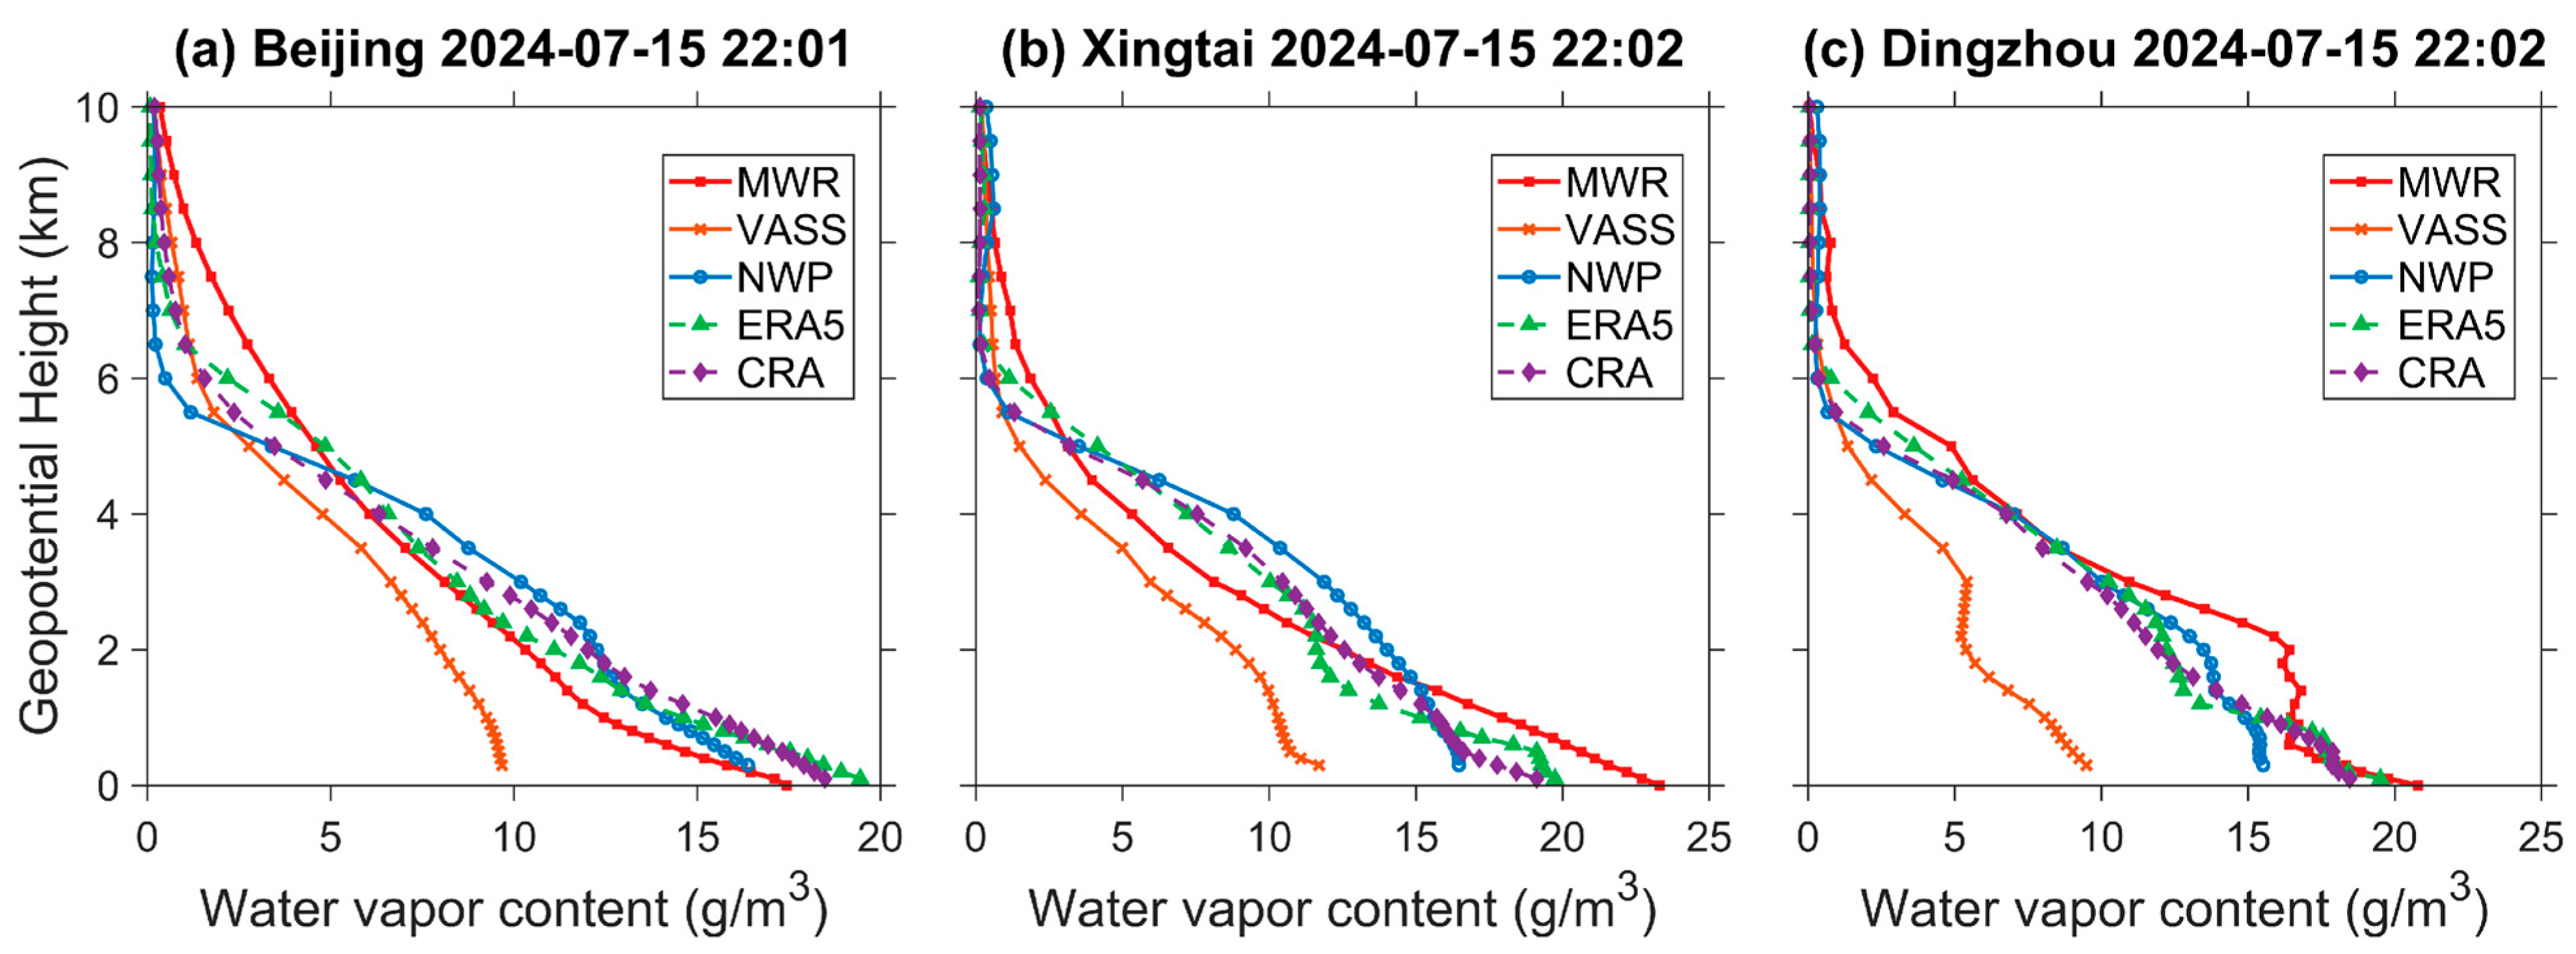
Although the overall statistics reveal pronounced vertical error structures, the accuracy of VASS also exhibits clear spatial variability among different stations. Taking instantaneous profiles from a representative FY-3E overpass around 22:00 on 15 July 2024 as an example, Figure 2 and Figure 3 illustrate the complexity of retrieval errors and their station-dependent characteristics. At the Xingtai site, the VASS temperature profile is substantially lower than the MWR observations in the 1–3 km layer, whereas the other datasets show relatively good agreement with the MWR measurements. In contrast, the bias structures at the Beijing and Dingzhou sites differ markedly from those at Xingtai, and the humidity profiles also display evident inter-station differences. These results indicate that VASS errors are characterized not only by pronounced vertical structures but also by significant station-to-station variability, which is likely influenced by factors such as geographic location, local climatic conditions, and the degree of urbanization.
Figure 2.
Comparison of temperature profiles observed by the ground-based microwave radiometer (MWR), FY-3E/VASS, FY-3E/NWP, ERA5, and CRA during a representative satellite overpass: (a) Beijing, (b) Xingtai, and (c) Dingzhou.
Figure 3.
Comparison of humidity profiles observed by the ground-based microwave radiometer (MWR), FY-3E/VASS, FY-3E/NWP, ERA5, and CRA during a representative satellite overpass: (a) Beijing, (b) Xingtai, and (c) Dingzhou.
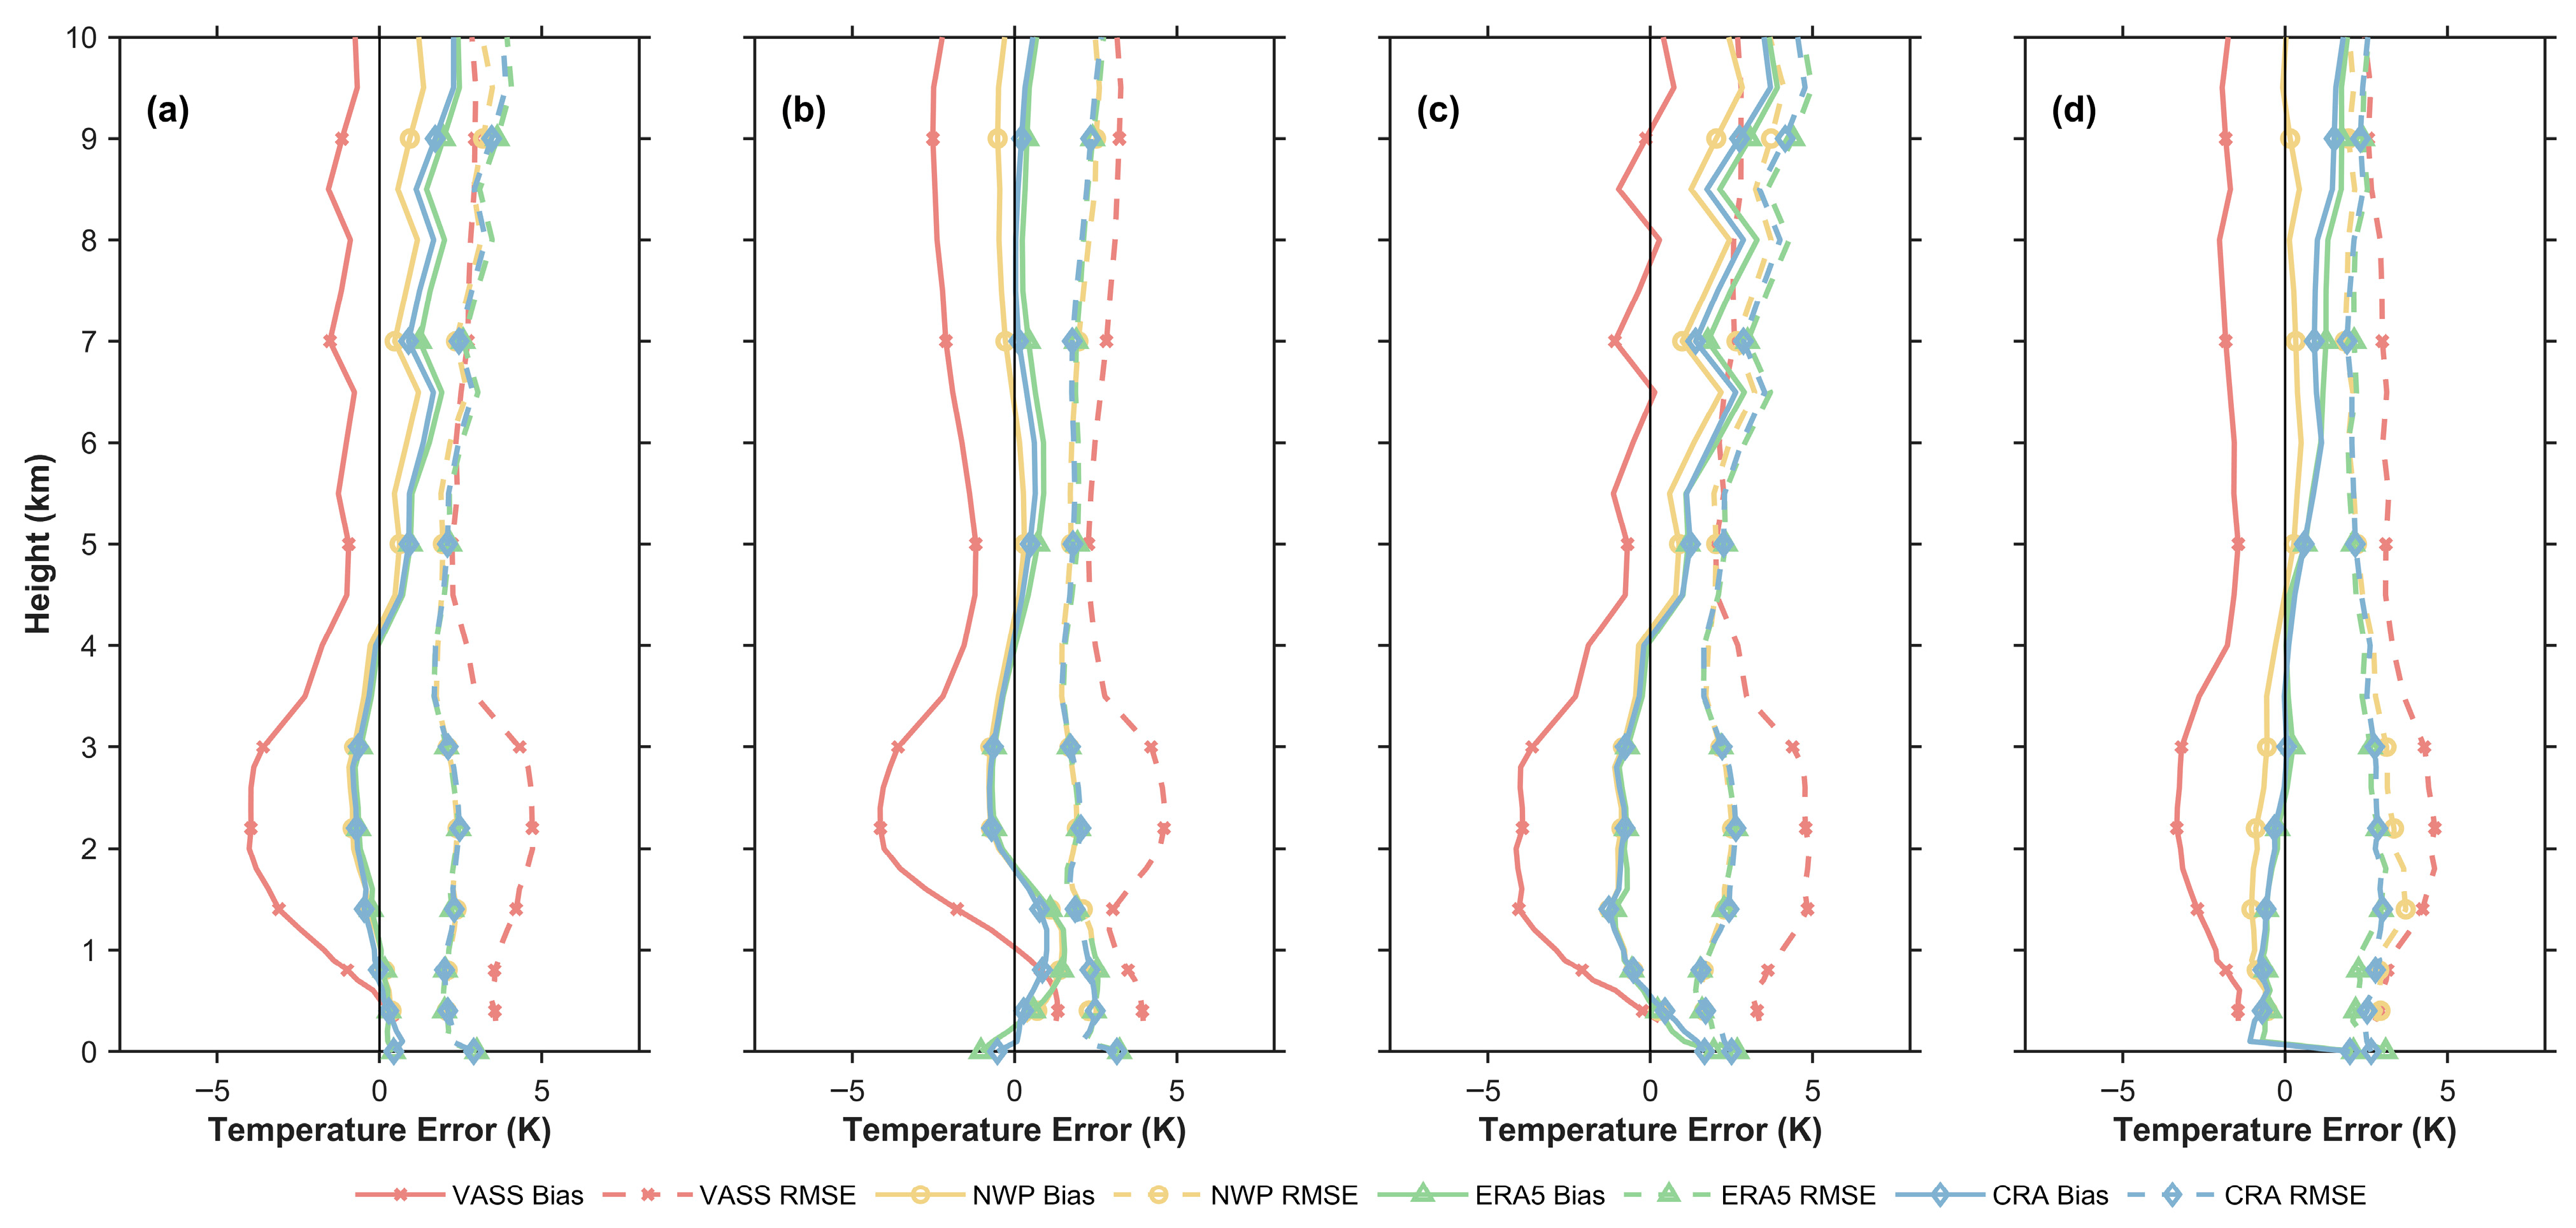
To further examine this inference, Figure 4, Figure 5, Figure 6 and Figure 7 quantify the vertical distributions of errors at the three stations. The results confirm that VASS error characteristics exhibit pronounced station-dependent differences. At the Beijing site, temperature errors show a distinctive S-shaped vertical structure, characterized by near-surface overestimation of approximately 1.3 K and a transition to significant underestimation between 1.5 and 4 km, with a minimum mean bias of about −4.1 K. In contrast, temperature errors at the Xingtai and Dingzhou sites are dominated by systematic underestimation throughout most of the lower and middle troposphere, with mean biases reaching −4.1 K and −3.3 K, respectively.
Figure 4.
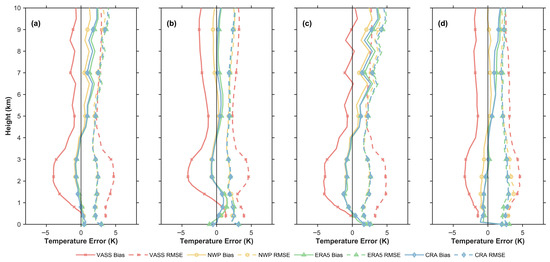
Vertical distributions of temperature mean bias and root-mean-square error (RMSE) for FY-3E/VASS, FY-3E/NWP, ERA5, and CRA relative to MWR observations over North China: (a) all stations, (b) Beijing, (c) Xingtai, and (d) Dingzhou.
Figure 5.
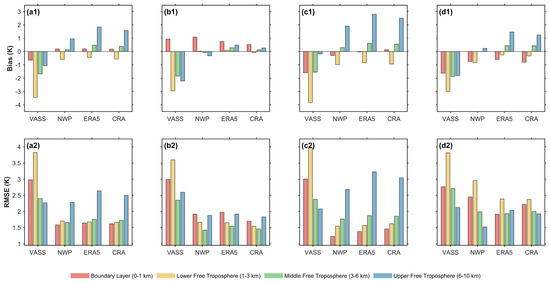
Layer-averaged statistics of temperature bias and RMSE for FY-3E/VASS, FY-3E/NWP, ERA5, and CRA relative to MWR observations over North China: (a1,a2) all stations, (b1,b2) Beijing, (c1,c2) Xingtai, and (d1,d2) Dingzhou. In each group of four bars, the colors from left to right represent BL, LFT, MFT, and UFT, respectively.
Figure 6.
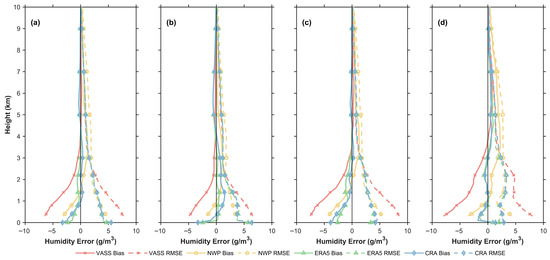
Vertical distributions of humidity mean bias and root-mean-square error (RMSE) for FY-3E/VASS, FY-3E/NWP, ERA5, and CRA relative to MWR observations over North China: (a) all stations, (b) Beijing, (c) Xingtai, and (d) Dingzhou.
Figure 7.
Layer-averaged statistics of humidity bias and RMSE for FY-3E/VASS, FY-3E/NWP, ERA5, and CRA relative to MWR observations over North China: (a1,a2) all stations, (b1,b2) Beijing, (c1,c2) Xingtai, and (d1,d2) Dingzhou. In each group of four bars, the colors from left to right represent BL, LFT, MFT, and UFT, respectively.
The humidity error analysis reveals comparable spatial variability, which is most pronounced within the boundary layer (<1 km). The magnitude of underestimation at the Xingtai and Dingzhou sites, with a mean bias of approximately −6.6 g/m3, is substantially larger than that at the Beijing site (−4.0 g/m3).
3.3. Differences in Errors Under Different Weather Conditions
According to the FY-3E/VASS product documentation, the retrieval algorithm adopts different physical pathways for clear and cloudy conditions following cloud detection, indicating that clouds constitute a key external factor influencing product accuracy. All samples from the three stations were combined and divided into two groups based on weather condition: clear and cloudy. The quantitative analyses presented in Figure 8, Figure 9, Figure 10 and Figure 11 demonstrate the complex modulation of weather conditions on the errors of atmospheric temperature and humidity profile products and provide useful insights for further optimization of the retrieval algorithm.
Figure 8.
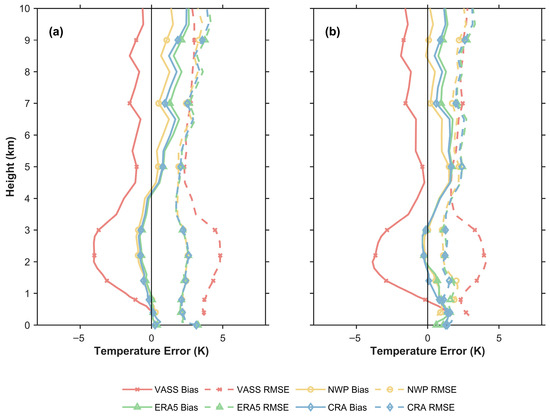
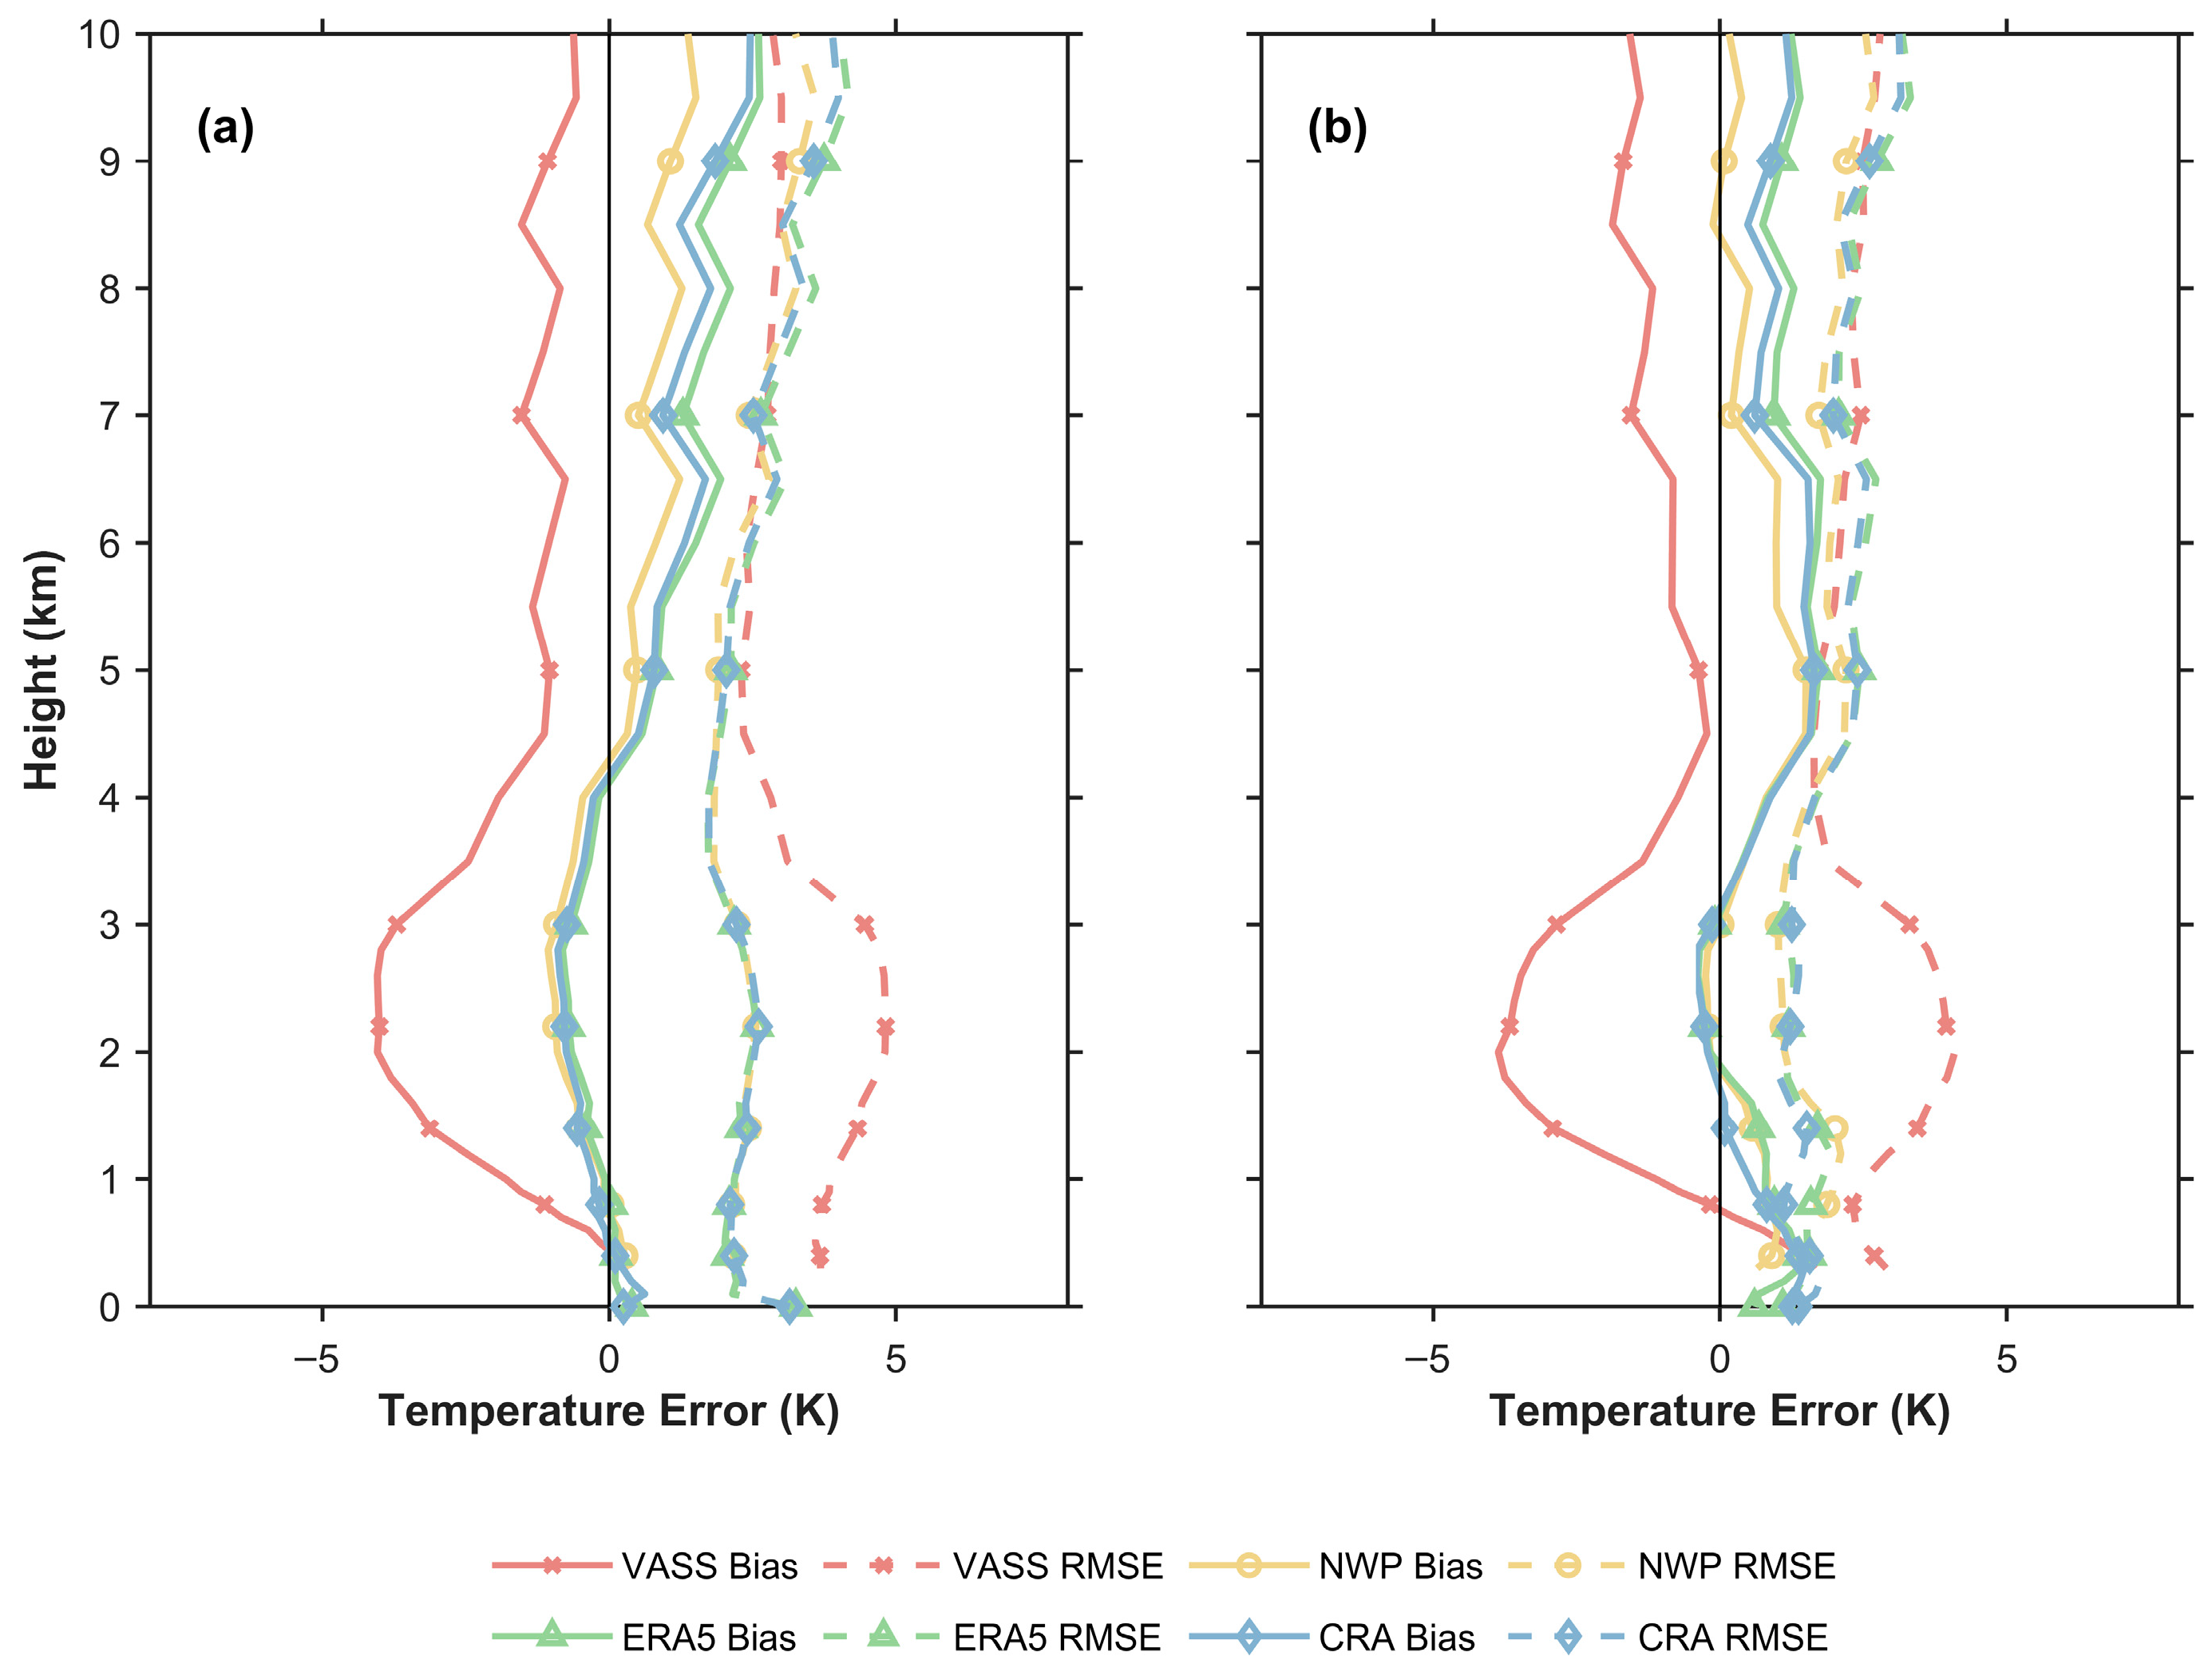
Vertical distributions of temperature mean bias and RMSE for FY-3E/VASS, FY-3E/NWP, ERA5, and CRA relative to MWR observations under different weather conditions: (a) cloudy conditions and (b) clear conditions.
Figure 9.
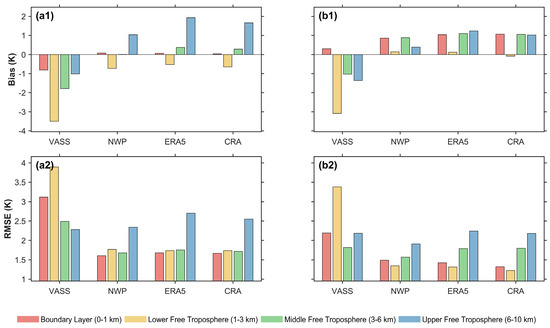
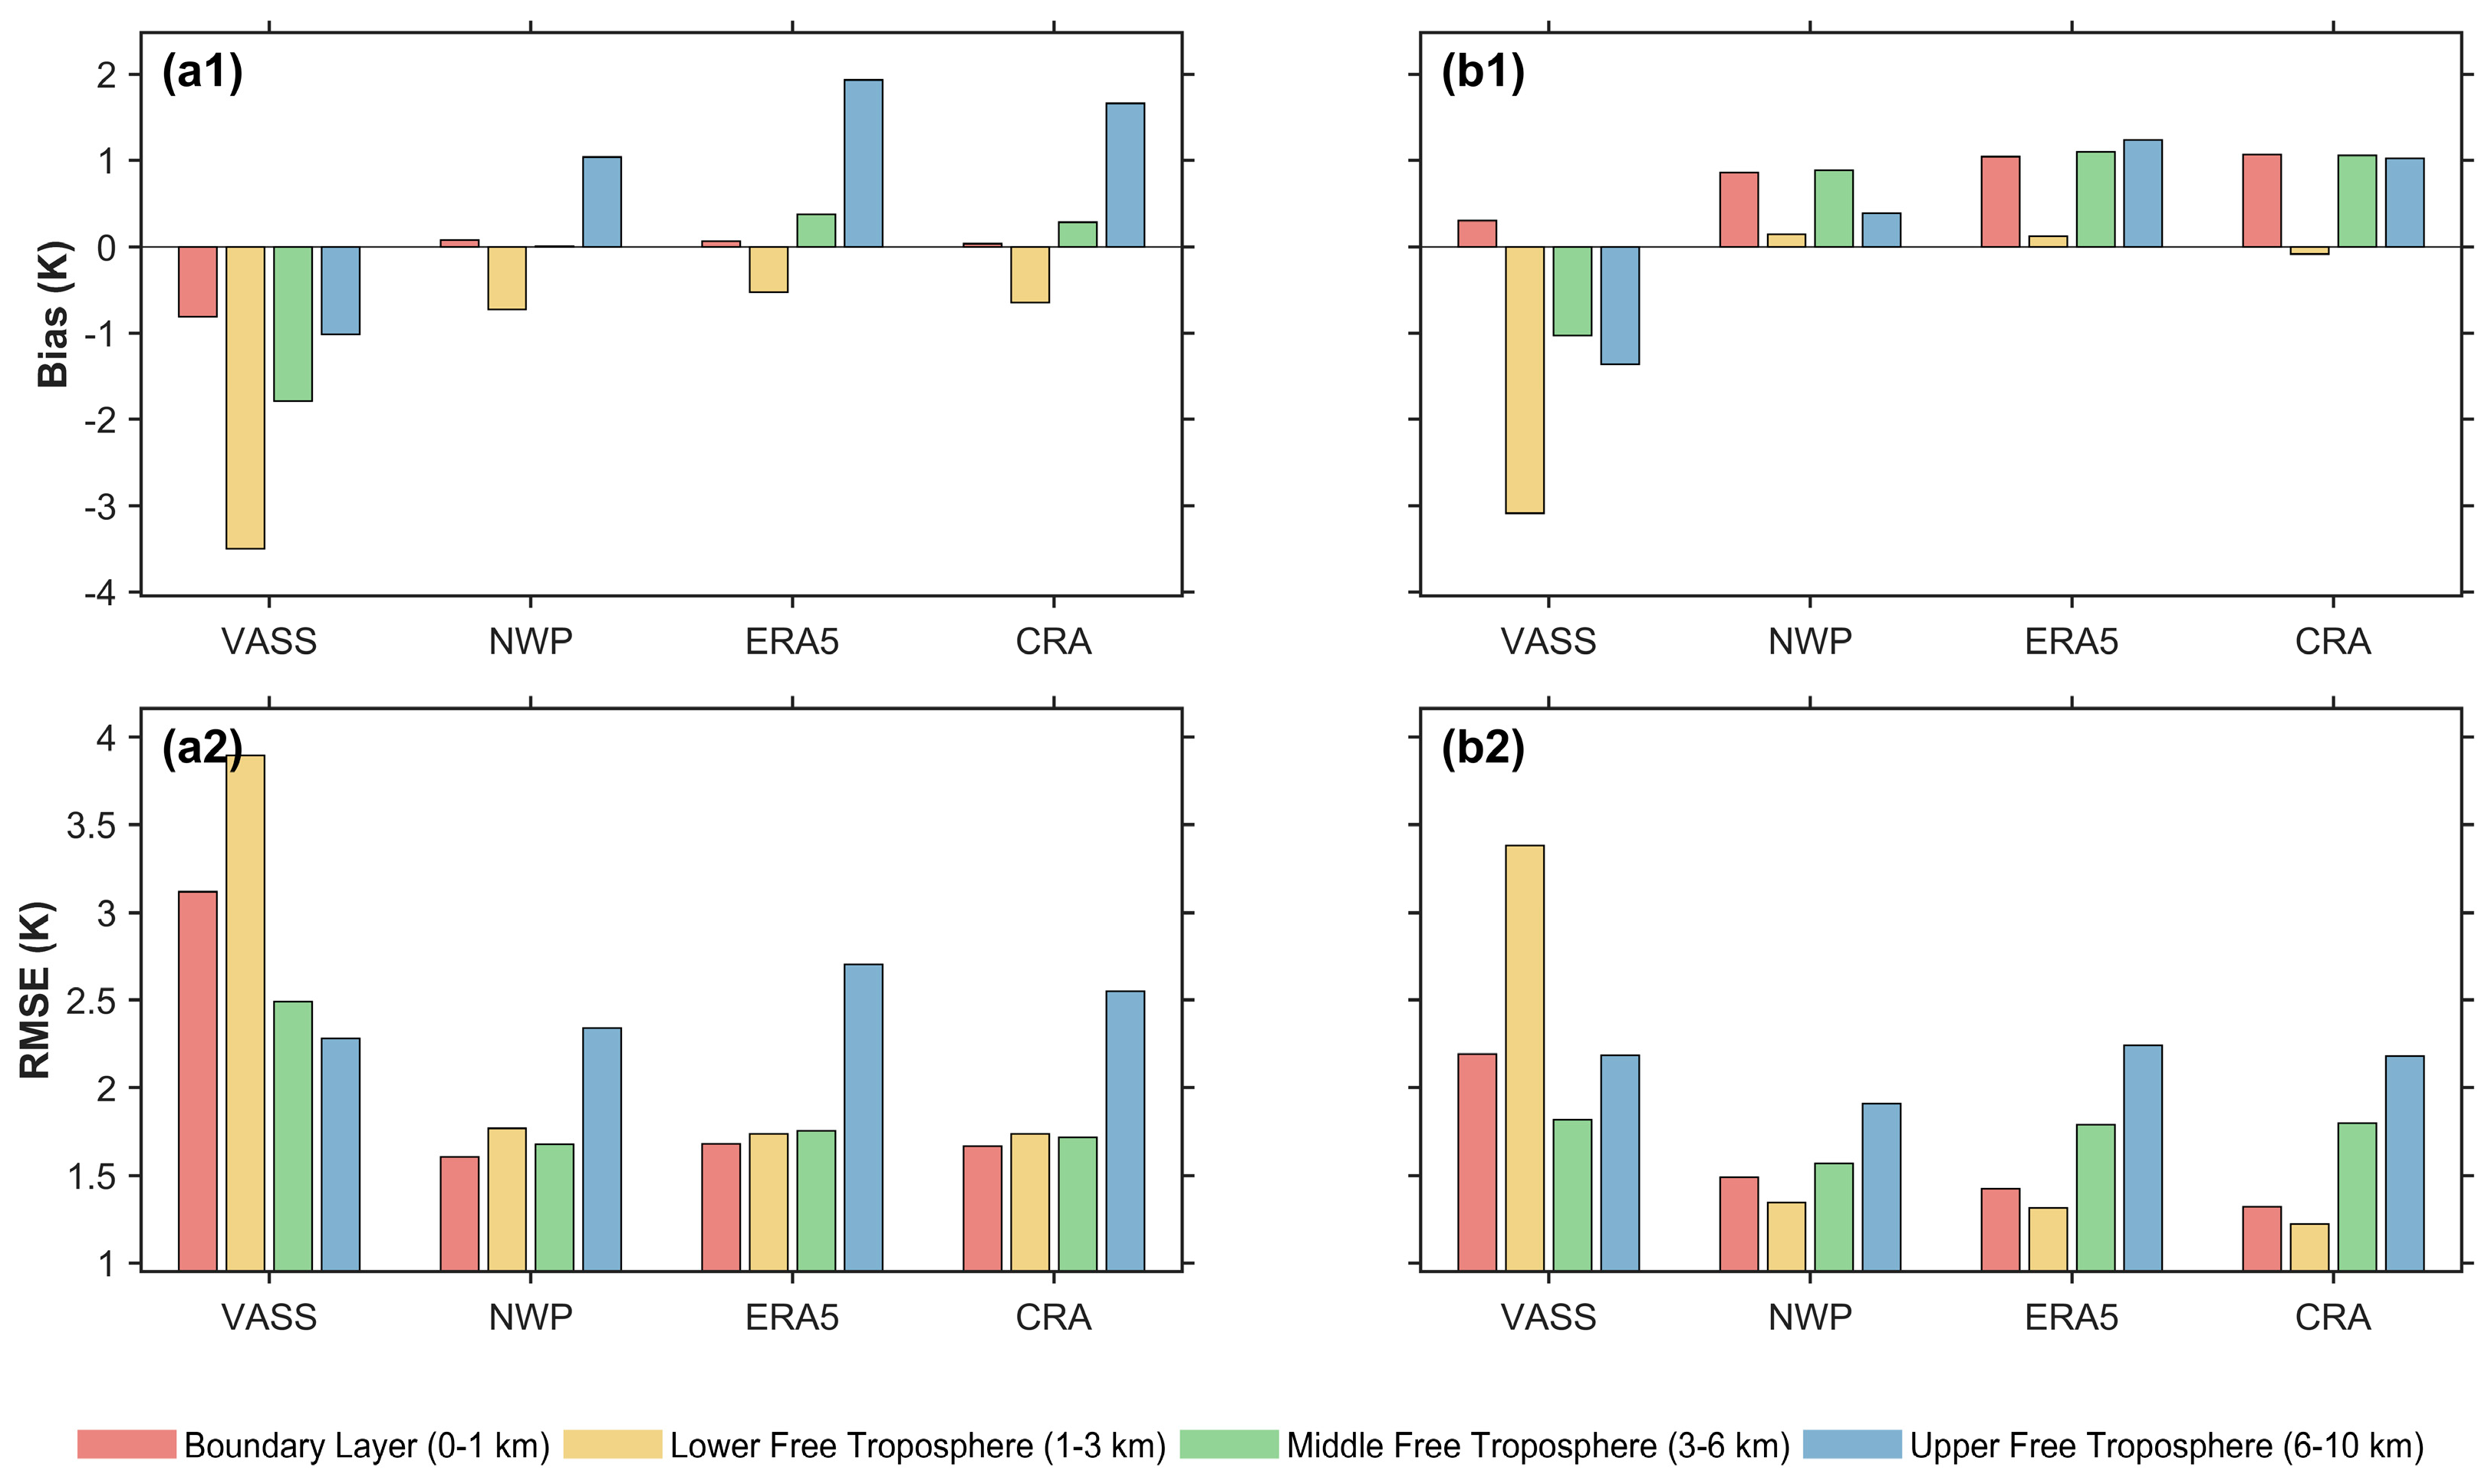
Layer-averaged statistics of temperature mean bias and RMSE for FY-3E/VASS, FY-3E/NWP, ERA5, and CRA relative to MWR observations under different weather conditions: (a1,a2) cloudy conditions and (b1,b2) clear conditions. In each group of four bars, the colors from left to right represent BL, LFT, MFT, and UFT, respectively.
Figure 10.
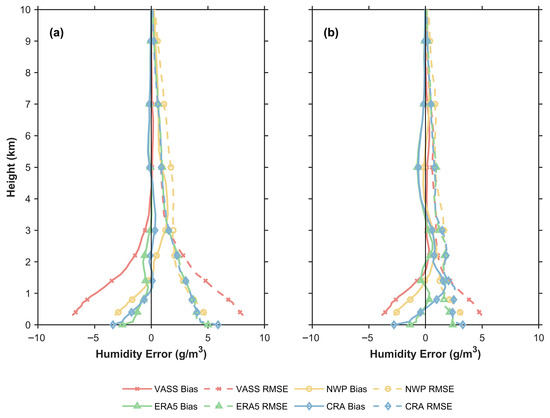
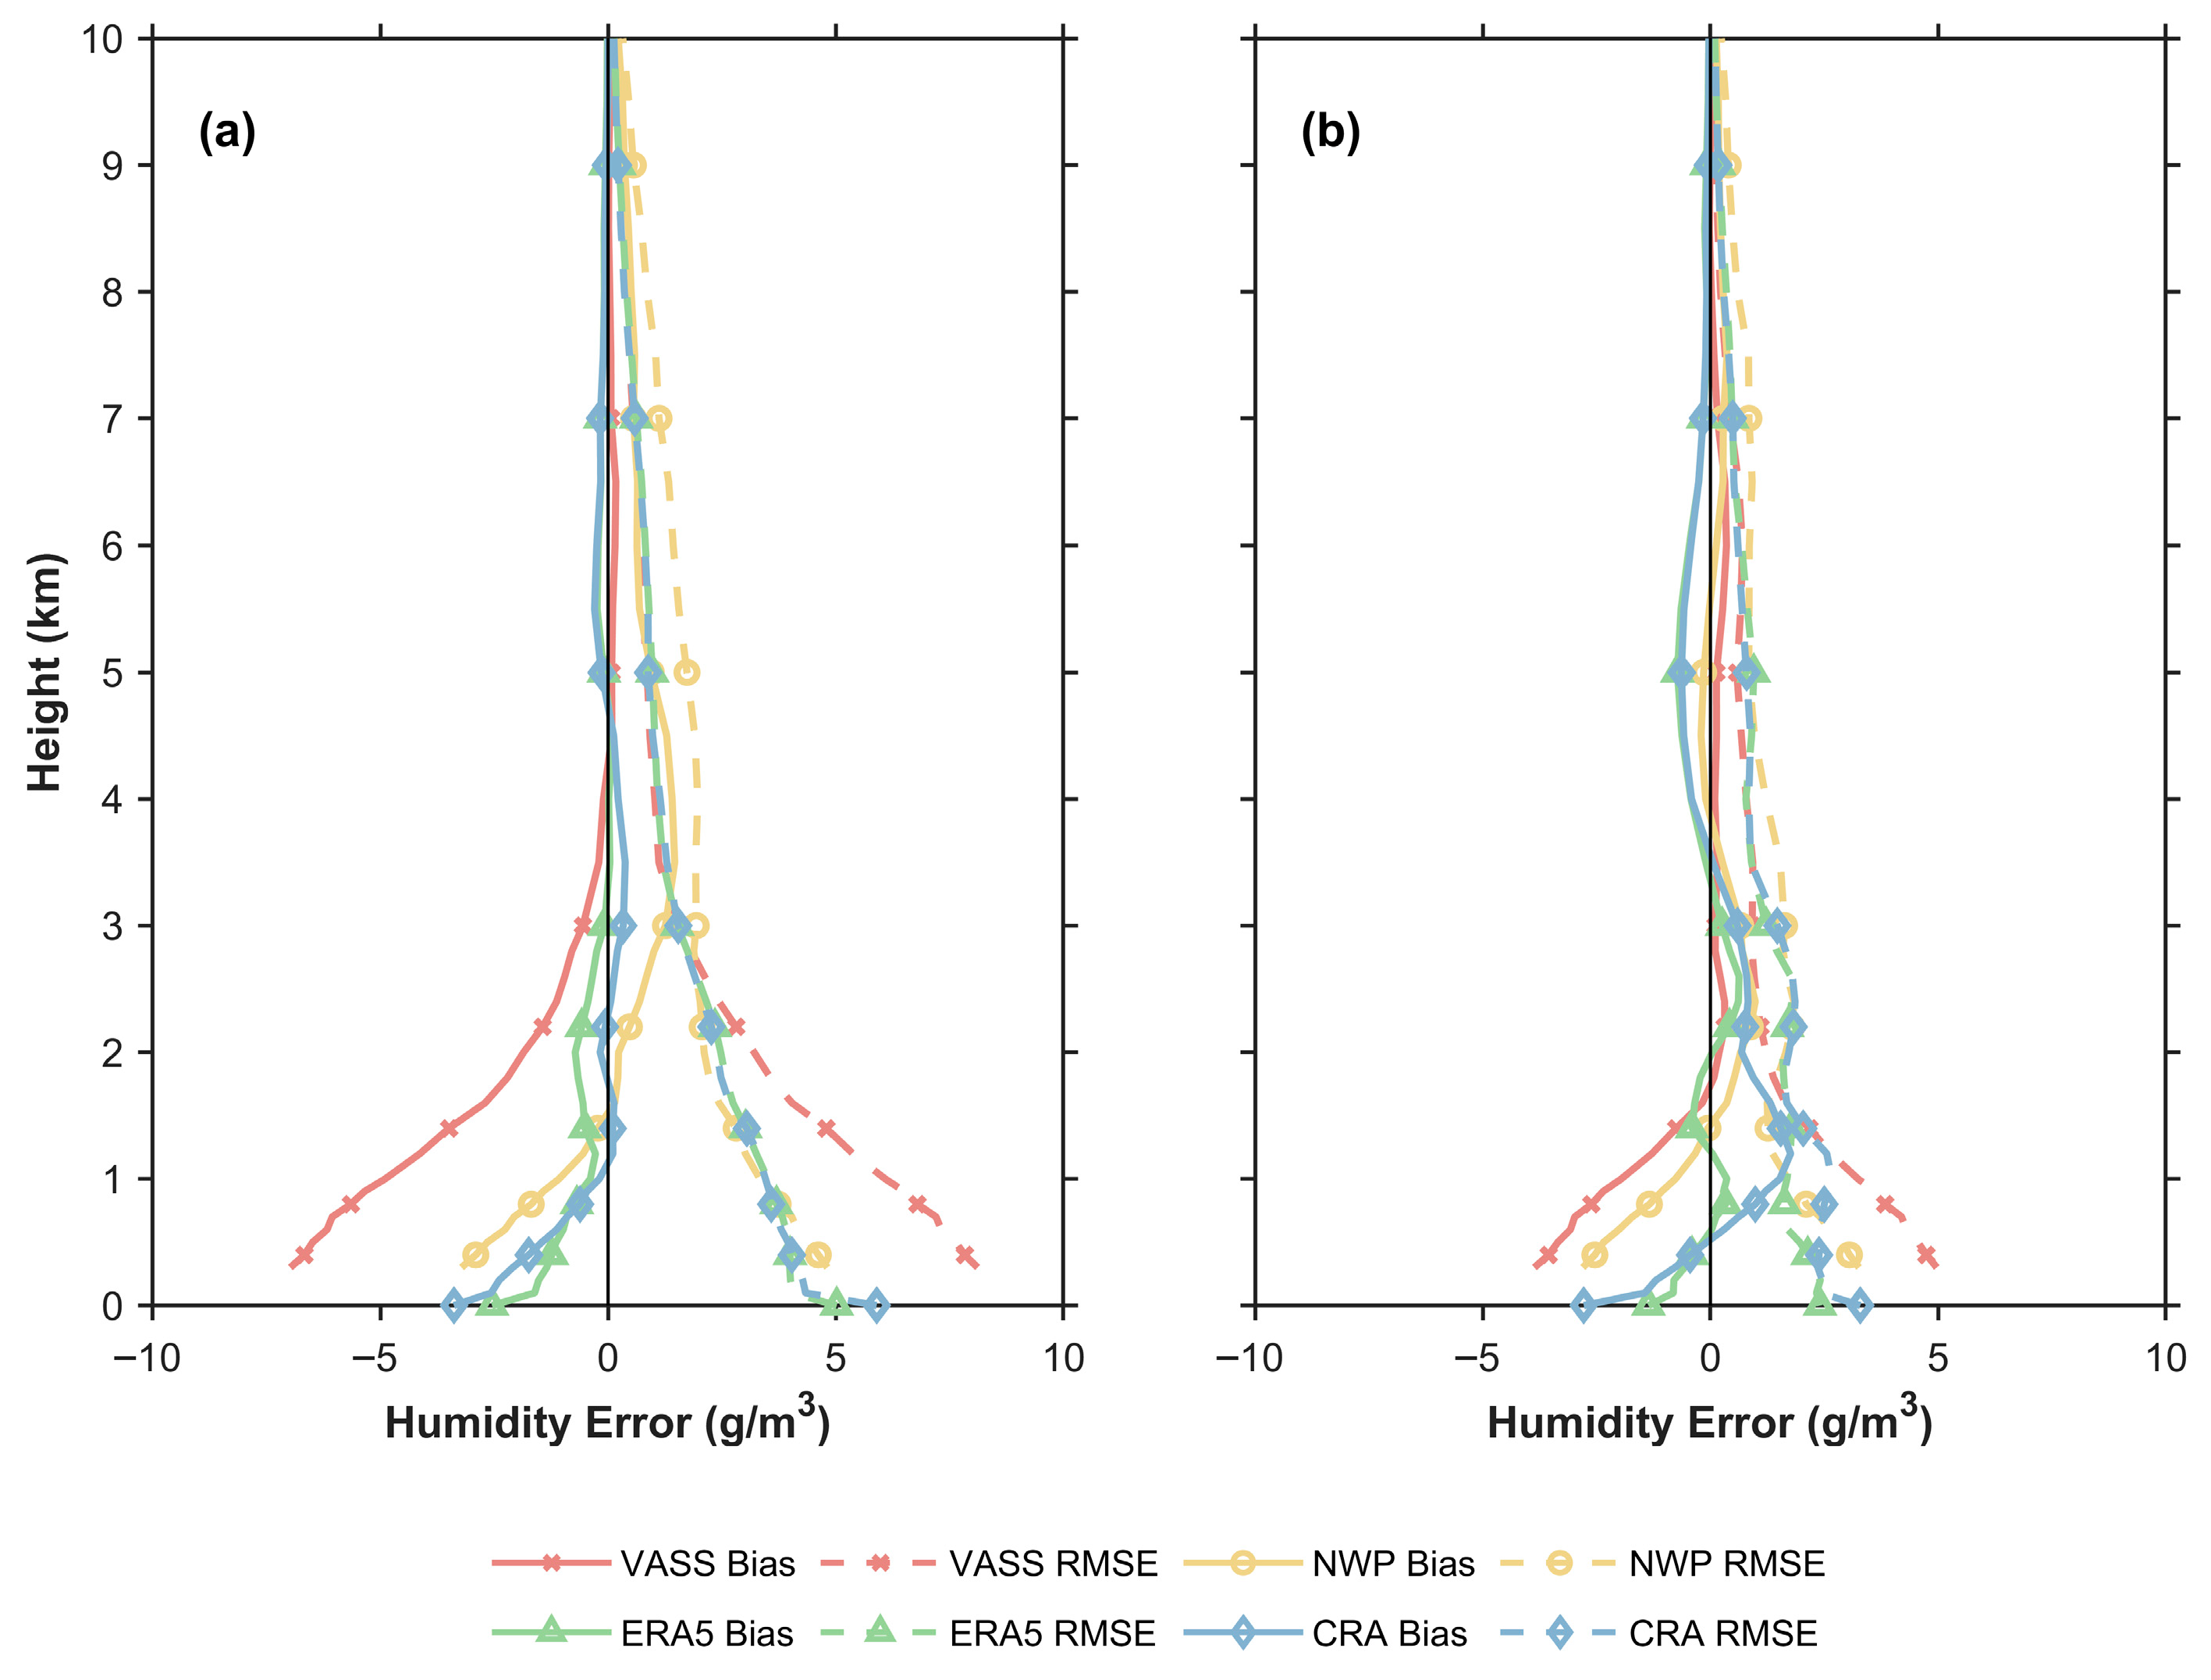
Vertical distributions of humidity mean bias and RMSE for FY-3E/VASS, FY-3E/NWP, ERA5, and CRA relative to MWR observations under different weather conditions: (a) cloudy conditions and (b) clear conditions.
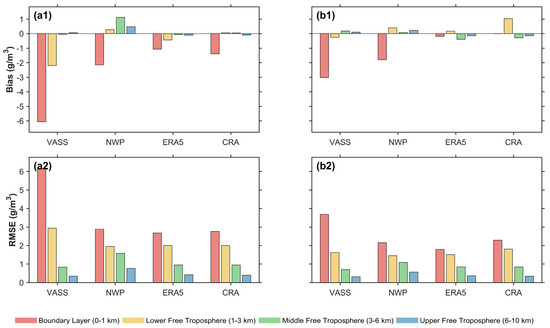
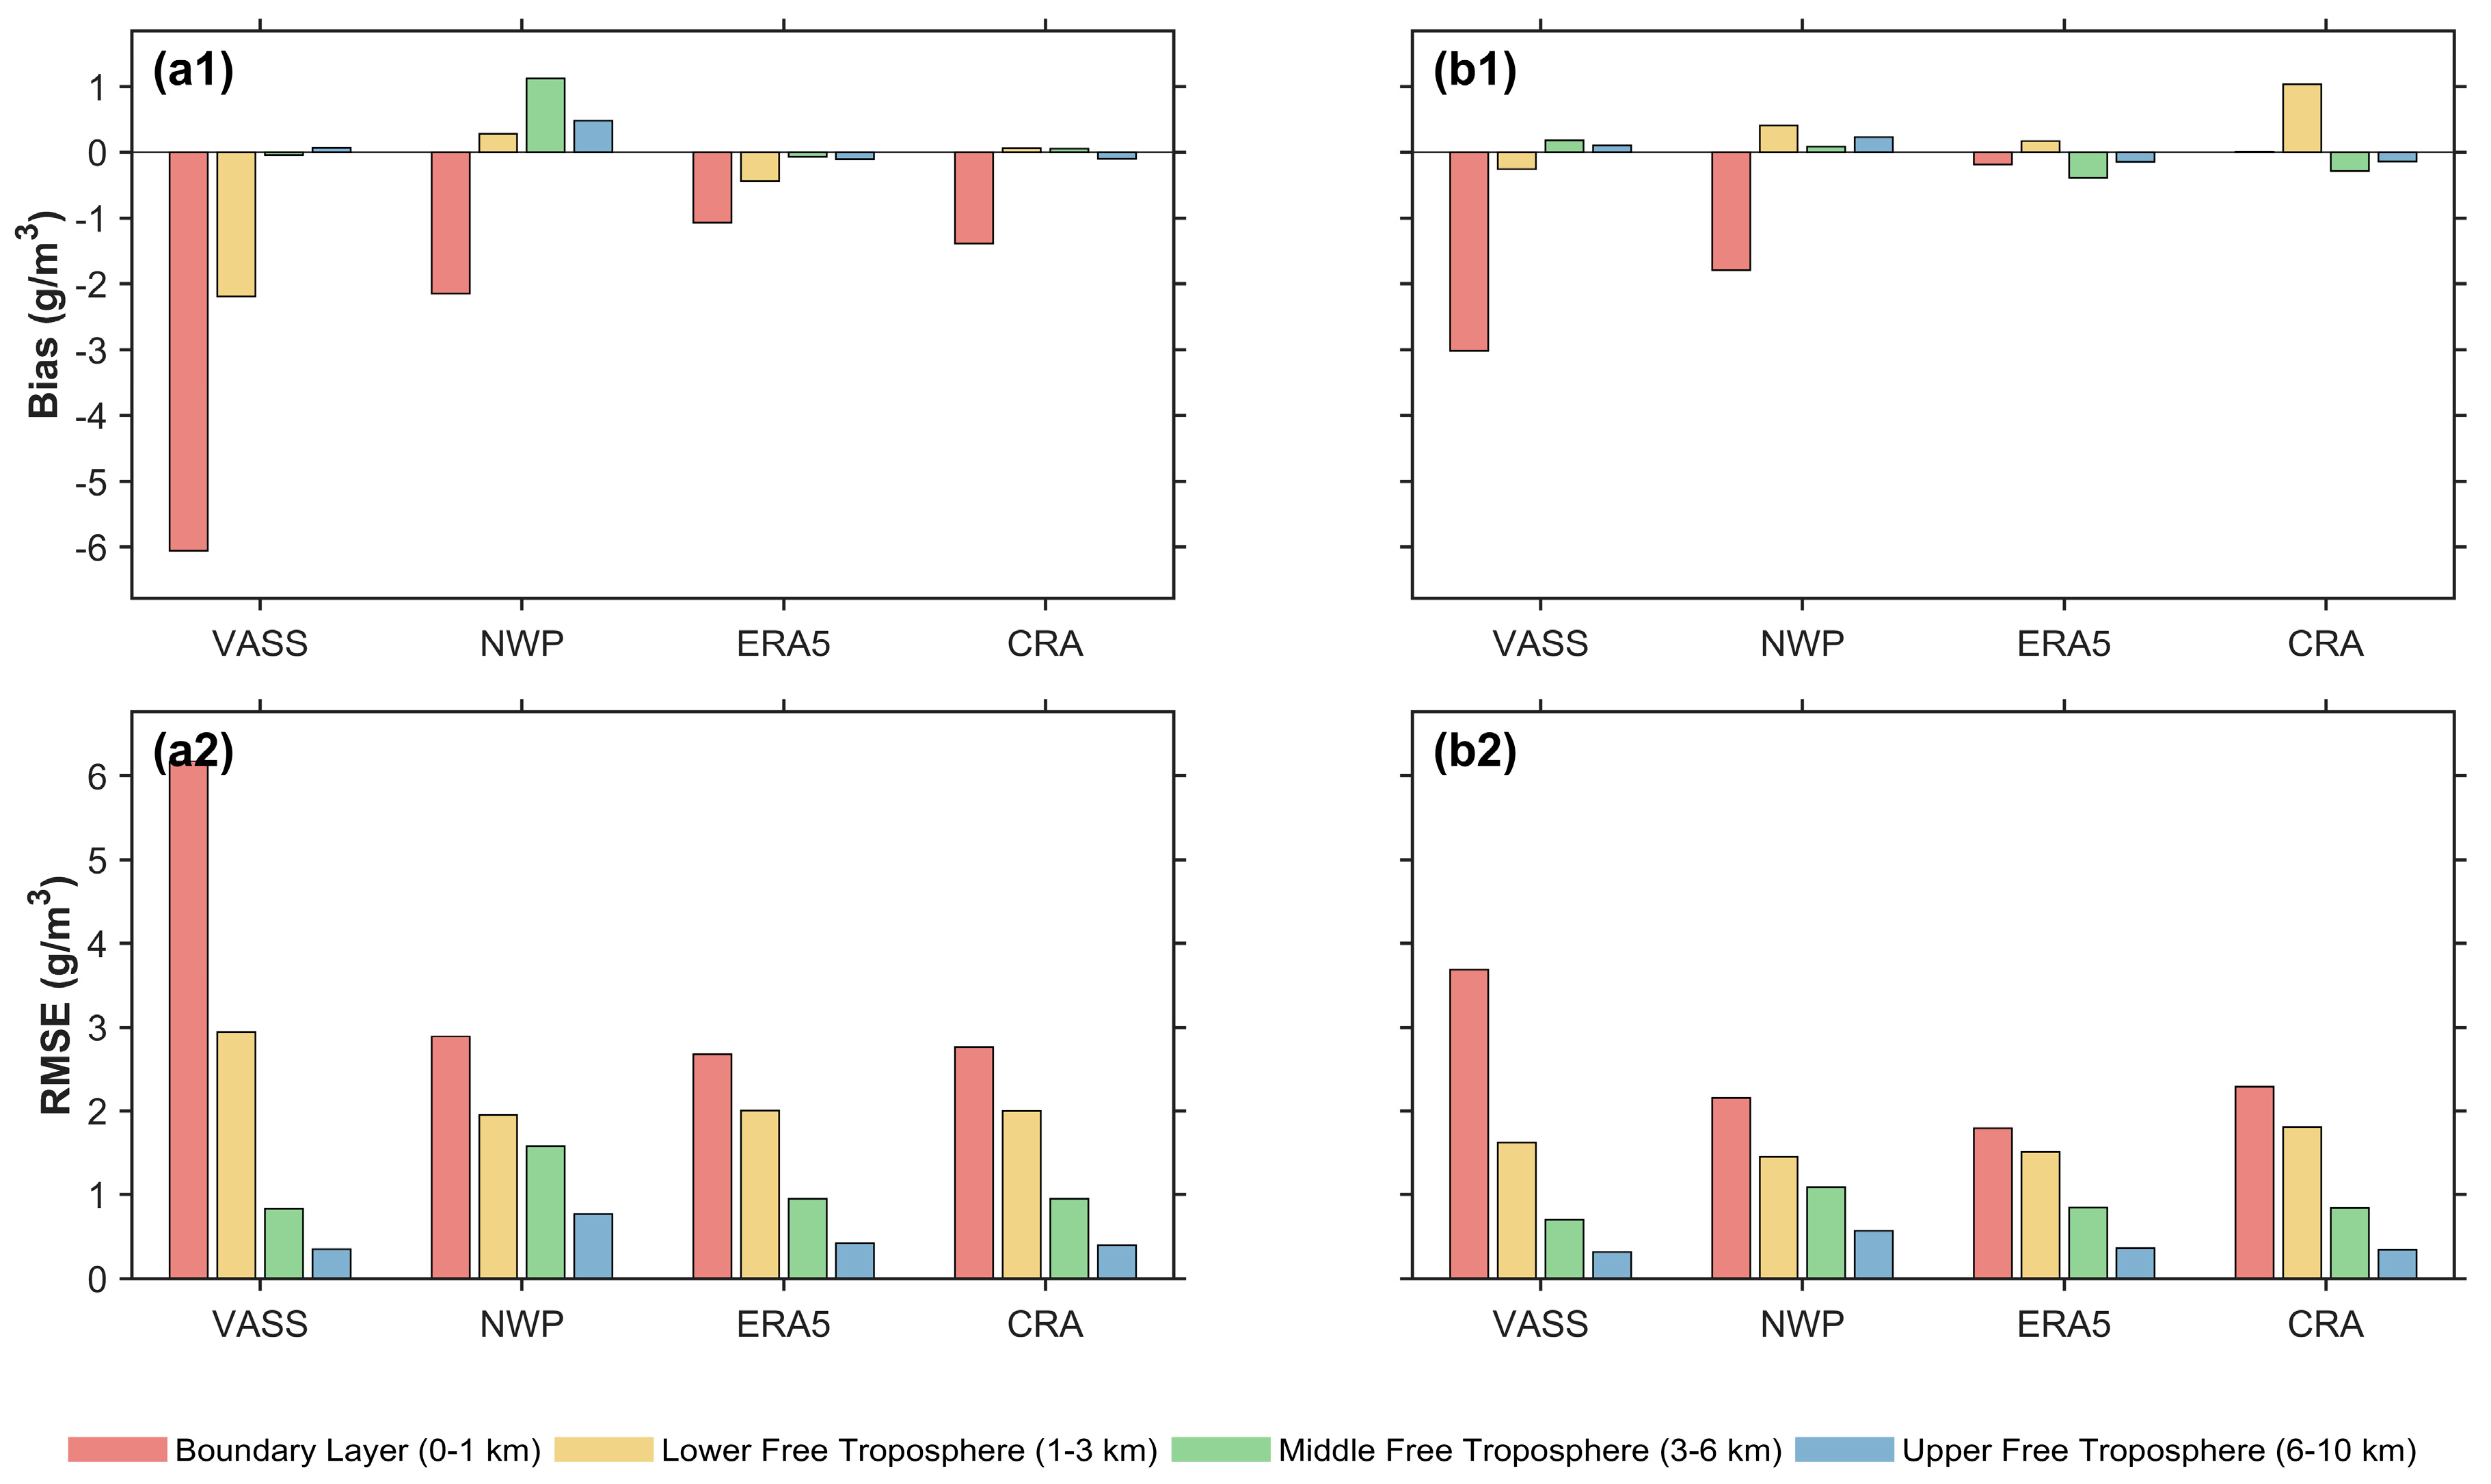
Figure 11.
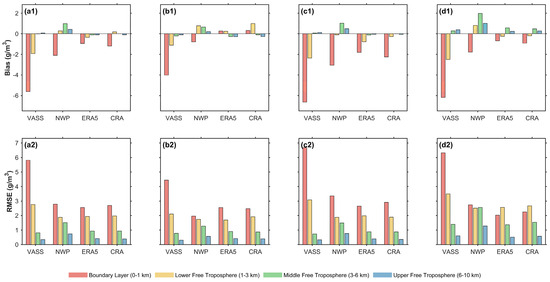
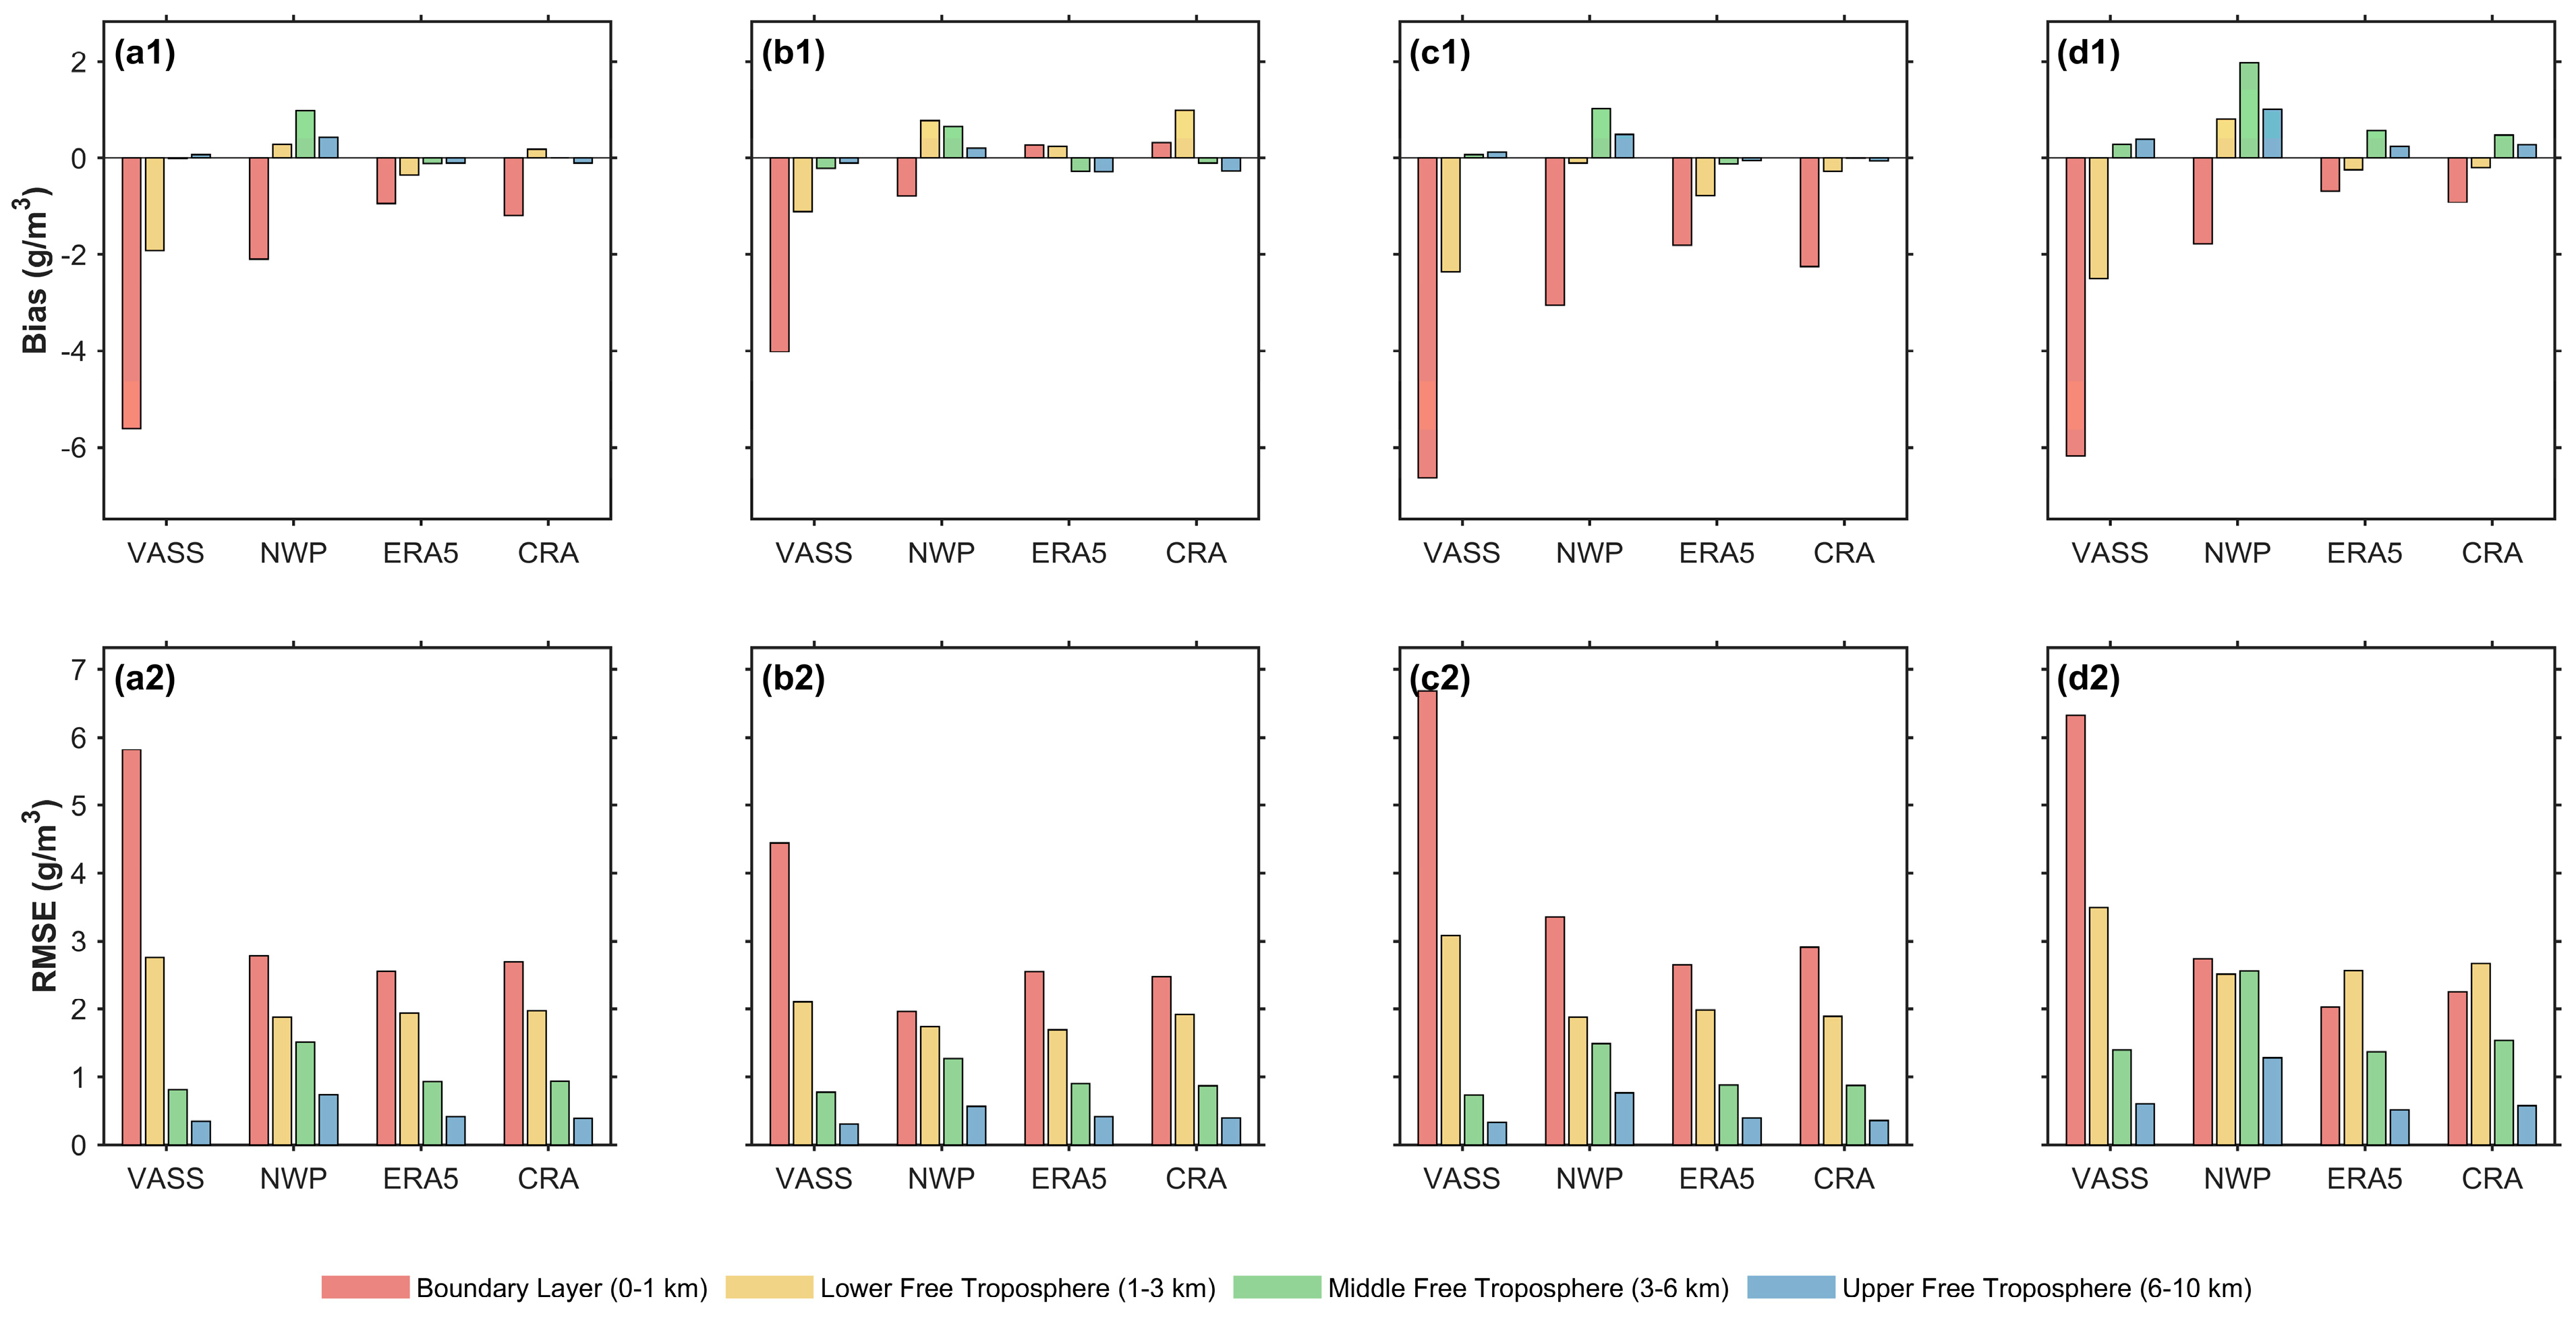
Layer-averaged statistics of humidity mean bias and RMSE for FY-3E/VASS, FY-3E/NWP, ERA5, and CRA relative to MWR observations under different weather conditions: (a1,a2) cloudy conditions and (b1,b2) clear conditions. In each group of four bars, the colors from left to right represent BL, LFT, MFT, and UFT, respectively.
For temperature (Figure 8 and Figure 9), the modulation effect of clouds exhibits nonlinear behavior and strong height dependence. In the near-surface layer (0–1 km), VASS temperature errors are strongly modulated by weather conditions. Under clear conditions, temperature is slightly overestimated, with a mean bias of about 0.3 K, which is consistent with the typical contribution of infrared channels over clear land surfaces. Under cloudy conditions, the mean bias shifts from overestimation to an average underestimation of 0.8 K. This behavior helps explain why differences in the proportion of clear and cloudy samples among stations may contribute to the sign differences in low-level errors at different sites. In the core 1–3 km layer, the influence of clouds is particularly pronounced, with the magnitude of the mean bias increasing from −3.1 K under clear conditions to −3.5 K under cloudy conditions. At higher levels (>6 km) under cloudy conditions, the error trends among different datasets diverge markedly. The reanalysis products generally exhibit overestimations of about 1.7–1.9 K, whereas VASS maintains an underestimation of approximately 1.0 K. This contrast suggests substantial differences between satellite retrievals and reanalysis datasets in constraining the thermodynamic structure above cloud tops when deep cloud systems are present.
The humidity analysis (Figure 10 and Figure 11) indicates that the modulation effect of clouds is mainly manifested as a pronounced amplification of errors, while the vertical structure remains largely unchanged. Within the boundary layer, VASS exhibits systematic underestimation under both weather conditions. However, the magnitude of underestimation is substantially larger under cloudy conditions, with a mean bias reaching −6.1 g/m3, approximately twice that under clear conditions (−3.0 g/m3). The RMSE also reaches its maximum under cloudy conditions. Similar to the behavior observed for temperature, the humidity errors of CRA and ERA5 increase under cloudy conditions, but the magnitude of this increase is considerably smaller than that of VASS.
These observed error patterns are further interpreted in the following discussion.
4. Discussion
4.1. Physical Interpretation of FY-3E/VASS Error Sources
The observed error characteristics can be interpreted from a retrieval physics perspective. The FY-3E microwave temperature sounder has limited vertical resolution. Its information content is generally lower in the lower troposphere due to broad weighting functions and surface contamination. These are common limitations for both ground-based and spaceborne microwave observations [26]. With limited observational information, the retrieval relies more on the NWP background to constrain the solution. This explains the similarity between VASS and NWP error structures in the 1–3 km layer. It also explains why the largest temperature errors occur in this layer (Table 1), where VASS shows a mean bias of −3.44 K and an RMSE of 3.82 K (substantially larger than the other products). The influence of surface contamination and broad weighting functions is also evident in the station-dependent results. At Beijing, where urbanization is high, surface heterogeneity is strong. This likely contributes to the near-surface overestimation (approximately 1.3 K) and the distinctive S-shaped error structure seen in Figure 4b.
For humidity [27], the boundary layer exhibits the largest variability and strongest vertical gradients. These features are difficult to capture with the limited vertical resolution of satellite sounding. This directly corresponds to the large humidity underestimation in the boundary layer (mean bias −5.91 g/m3, Table 2). Under cloudy conditions, scattering and absorption reduce the sensitivity of microwave observations to the thermodynamic state [28], further decreasing information content and increasing retrieval uncertainty. This explains why the boundary-layer humidity mean bias nearly doubles under cloudy conditions (from −3.0 g/m3 under clear skies to −6.1 g/m3, Figure 11). It also explains the shift in near-surface temperature bias from overestimation under clear skies to underestimation under clouds (Figure 9).
The error characteristics of VASS are influenced not only by satellite viewing geometry and algorithmic limitations, but also by geographic settings, local climatic conditions, and the degree of urbanization at individual stations. These factors jointly contribute to the pronounced spatial variability observed in the retrieval errors. The station-dependent differences observed in Section 3.2 may be related to local surface and atmospheric conditions [29]. Beijing, as a highly urbanized megacity, is strongly influenced by the urban heat island effect [30], which may contribute to its distinctive S-shaped temperature error structure and near-surface overestimation. For humidity, the larger underestimation at Xingtai and Dingzhou compared to Beijing may be associated with variations in local moisture sources, vegetation cover, and surface conditions [31]. Environmental factors surrounding the stations, including vegetation cover, soil moisture, and nearby water bodies, can exert a strong influence on the near-surface humidity field. In contrast, the relatively drier urban environment around the Beijing site may partly explain the smaller magnitude of humidity underestimation. However, these interpretations regarding the inter-station differences in retrieval errors remain hypotheses rather than demonstrated causal relationships. These interpretations require further verification with more stations and longer time series.
4.2. Comparison of FY-3E/VASS with Previous and International Studies
The results of this study differ from previous validation results reported at global or other regional scales [15], indicating that regional characteristics and the complex structure of the summer boundary layer exert a strong influence on retrieval performance. These results confirm the capability of satellite microwave remote sensing to effectively capture upper-tropospheric thermodynamic structures. At the same time, they highlight remaining limitations of current retrieval algorithms in the lower atmosphere, where surface heterogeneity and boundary-layer processes are more complex. In contrast, the ERA5 and CRA reanalysis datasets exhibit relatively stable performance throughout the entire vertical column [22].
The weather-dependent error analysis of temperature and humidity profiles indicates that the presence of clouds amplifies the systematic biases of VASS in the lower and middle troposphere, particularly within the boundary layer and the lower troposphere. Previous studies using other instruments have shown that cloud effects can substantially increase retrieval errors [32]. This study provides quantitative evidence that, under summer cloudy conditions over North China, the boundary-layer humidity mean bias of VASS is nearly doubled compared with clear conditions, reaching −6.1 g/m3. The near-surface temperature mean bias shifts from overestimation under clear conditions to underestimation under cloudy conditions. To our knowledge, such behavior has not been reported in previous studies. Our findings extend the current understanding of retrieval uncertainties under cloudy conditions [33]. Further analysis examines FY-3E/VASS errors relative to the NWP background under cloudy conditions. The results indicate that VASS has a substantially weakened ability to correct background field biases in the presence of clouds. In some layers, particularly at higher levels for temperature, the VASS mean biases are even larger than those of the NWP background and show trends opposite to those of the reanalysis datasets. This result suggests that the error sources are not solely related to the quality of the background field, but are also associated with limitations of the retrieval algorithm under complex weather conditions.
To contextualize the performance of FY-3E/VASS within the international landscape, we compare its retrieval accuracy with that of the Cross-track Infrared Microwave Sounding Suite (CrIMSS) onboard the NOAA-20 satellite (JPSS-1). Recent validation studies indicate that CrIMSS temperature retrievals achieve RMSE values of approximately 1.5–2.0 K in the lower troposphere under clear skies [34]. In comparison, FY-3E/VASS shows temperature RMSE of 1.6–2.6 K in the same layer (Table 1). For humidity, a direct quantitative comparison is complicated by differences in units and validation approaches. The boundary-layer humidity errors of FY-3E/VASS (approximately 5–6 g/m3) are presented here as a qualitative reference.
4.3. Limitations of This Study and Future Directions for FY-3E/VASS Applications
Different weather processes within the cloudy category may introduce varying levels of uncertainty. For example, precipitation can cause additional scattering effects on microwave observations, while deep convective clouds may lead to more complex error structures in temperature and humidity retrievals. Although our dataset does not contain sufficient cases of these specific processes due to the limited study period, studies have shown that these processes are important sources of uncertainty [35].
It should be noted that precipitating and non-precipitating cloudy conditions are not distinguished in this study. This is a limitation of the present study. Therefore, the enhanced errors observed under cloudy conditions may partly reflect the combined effects of cloud radiative impacts and precipitation-related scattering. These two processes involve different physical mechanisms, and merging them may mask important differences in retrieval performance.
Besides cloud effects, other meteorological factors, such as pressure and wind speed, may also affect retrieval errors. This influence is likely to be more pronounced during periods of atmospheric instability or strong convection, when satellite observations can be modulated by local climatic factors [36].
Given the limited sample size and the small number of stations considered in this study, the proposed mechanisms regarding station-dependent errors require further verification using observations over larger spatial domains.
Future studies should aim to separate precipitating and non-precipitating cloudy conditions, as well as other specific weather processes such as stratiform clouds, convective clouds, and precipitation, for a more nuanced understanding of weather-dependent uncertainties in FY-3E/VASS products. Geographic information, urbanization indicators, and local climate characteristics could be incorporated into retrieval algorithm optimization and background field selection to reduce inter-station differences. Other meteorological factors, including pressure and wind speed, may also be considered to improve retrieval performance under complex weather conditions. In addition, constructing multi-source atmospheric profile datasets that include both thermal and dynamic variables would support more comprehensive applications.
5. Conclusions
This study uses ground-based microwave radiometer observations over North China in summer to evaluate the accuracy and applicability of FY-3E/VASS temperature and humidity profile products. The products are compared with the associated NWP background fields and reanalysis datasets. Results show that VASS errors vary significantly with height, station, and weather condition. The main uncertainties occur in the lower atmosphere. Temperature is systematically underestimated by about 3.4 K in the 1–3 km layer. Humidity is underestimated by approximately −5.91 g/m3 in the boundary layer. For both variables, mean biases decrease rapidly with increasing height. Clear inter-station differences are also found. Temperature errors show near-surface overestimation in Beijing. In contrast, Xingtai and Dingzhou exhibit systematic underestimation throughout most of the profile, with mean biases reaching −4.1 K and −3.3 K, respectively. Humidity underestimation in the boundary layer is also larger in Xingtai and Dingzhou (approximately −6.6 g/m3) than in Beijing (−4.0 g/m3). These differences may be related to surface conditions and local atmospheric structures. Under cloudy conditions, both the magnitude and vertical structure of the errors change markedly. Boundary-layer humidity underestimation under cloudy conditions is approximately twice that under clear conditions. Such behavior indicates the modulation of the retrieval process by cloud radiative effects. Further analysis shows that the error structures of VASS in the lower and middle troposphere are similar to those of the NWP background fields. The retrievals therefore retain, to some extent, the state-dependent characteristics of the background fields.
This study is based on three MWR stations in North China. While these sites represent different urbanization levels and terrain conditions, the conclusions are most robust for areas with similar climatic and surface characteristics. The balanced diurnal distribution and systematic patterns across stations and weather conditions support the robustness of the findings despite the limited sample size. Future work with more stations will help verify the broader applicability.
From an application perspective, VASS products are more suitable for upper-atmosphere analyses, while reanalysis datasets such as ERA5 or CRA may be preferred for applications requiring high vertical stability. These findings provide guidance for the appropriate use of FY-3E/VASS products in different applications and highlight directions for future retrieval improvements.
Supplementary Materials
The following supporting information can be downloaded at: https://www.mdpi.com/article/10.3390/rs18071058/s1, Figure S1: Global daily scanning coverage of the FY-3E satellite. Shaded areas indicate the effective observation coverage within 24 h, with dark blue shading highlighting the two overpasses over North China. Triangles denote the locations of the three ground-based MWR sites; Figure S2: Time–height cross sections of air temperature observed by ground-based microwave radiometers (MWR) at (a) Beijing, (b) Xingtai, and (c) Dingzhou during 26–28 July 2024; Figure S3: Time–height cross sections of air temperature from ERA5 reanalysis at (a) Beijing, (b) Xingtai, and (c) Dingzhou during 26–28 July 2024; Figure S4: Time–height cross sections of air temperature from the CMA-RA 1.5 (CRA) reanalysis at (a) Beijing, (b) Xingtai, and (c) Dingzhou during 26–28 July 2024; Figure S5: Time–height cross sections of absolute humidity observed by ground-based microwave radiometers (MWR) at (a) Beijing, (b) Xingtai, and (c) Dingzhou during 26–28 July 2024; Figure S6: Time–height cross sections of absolute humidity from ERA5 reanalysis at (a) Beijing, (b) Xingtai, and (c) Dingzhou during 26–28 July 2024; Figure S7: Time–height cross sections of absolute humidity from the CMA-RA 1.5 (CRA) reanalysis at (a) Beijing, (b) Xingtai, and (c) Dingzhou during 26–28 July 2024.
Author Contributions
Conceptualization, J.X. and Y.Y.; methodology, Y.C. and J.X.; software, Y.C.; validation, Y.M., X.R. and Y.Z.; formal analysis, Y.C. and R.L.; investigation, Y.C.; resources, J.X. and Y.Y.; data curation, Y.H., X.L. and J.X.; writing—original draft preparation, Y.C.; writing—review and editing, X.R., Y.M., Y.Z. and J.X.; visualization, Y.C.; supervision, Y.Z. and Y.M.; project administration, J.X.; funding acquisition, J.X. All authors have read and agreed to the published version of the manuscript.
Funding
This study was supported by the CAS Strategic Priority Research Program (XDB0760102), National Natural Science Foundation of China (42475180), National Key Research and Development Program of China (NO. 2024YFF1308202), and Fengyun Satellite Application Pioneer Program (FY-APP-2024.0106).
Data Availability Statement
The ground-based microwave radiometer (MWR) data underlying this article will be shared upon reasonable request to the corresponding author. These data are not publicly available due to intellectual property protection. The FY-3E, ERA5, and CRA reanalysis data are publicly accessible from the sources listed in the Acknowledgments.
Acknowledgments
We acknowledge the Fengyun Satellite Remote Sensing Data Centre for sharing the FY-3E dataset (https://data.nsmc.org.cn/DataPortal/cn/data/structure.html, accessed on 30 January 2025), the National Meteorological Information Center for sharing the CMA-RA V1.5 reanalysis dataset (https://data.cma.cn, accessed on 23 October 2025), and the European Centre for Medium-Range Weather Forecasts for sharing the ERA5 dataset (https://cds.climate.copernicus.eu/datasets, accessed on 27 September 2025).
Conflicts of Interest
The authors declare no conflicts of interest.
References
- Bauer, P.; Thorpe, A.; Brunet, G. The Quiet Revolution of Numerical Weather Prediction. Nature 2015, 525, 47–55. [Google Scholar] [CrossRef] [Scilit]
- Xu, G. A Review of Remote Sensing of Atmospheric Profiles and Cloud Properties by Ground-Based Microwave Radiometers in Central China. Remote Sens. 2024, 16, 966. [Google Scholar] [CrossRef] [Scilit]
- Zhang, P.; Hu, X.; Lu, Q.; Zhu, A.; Lin, M.; Sun, L.; Chen, L.; Xu, N. FY-3E: The First Operational Meteorological Satellite Mission in an Early Morning Orbit. Adv. Atmos. Sci. 2022, 39, 1–8. [Google Scholar] [CrossRef] [Scilit]
- Li, J.; Qin, Z.; Liu, G.; Huang, J. Added Benefit of the Early-Morning-Orbit Satellite Fengyun-3E on the Global Microwave Sounding of the Three-Orbit Constellation. Adv. Atmos. Sci. 2024, 41, 39–52. [Google Scholar] [CrossRef] [Scilit]
- Zhang, P.; Hu, X.; Sun, L.; Xu, N.; Chen, L.; Zhu, A.; Lin, M.; Lu, Q.; Yang, Z.; Yang, J.; et al. The On-Orbit Performance of FY-3E in an Early Morning Orbit. Bull. Am. Meteorol. Soc. 2024, 105, E144–E175. [Google Scholar] [CrossRef] [Scilit]
- Xiao, H.; Han, W.; Zhang, P.; Bai, Y. Assimilation of Data from the MWHS-II Onboard the First Early Morning Satellite FY-3E into the CMA Global 4D-Var System. Meteorol. Appl. 2023, 30, e2133. [Google Scholar] [CrossRef] [Scilit]
- Huang, Y.; Li, J.; Qin, Z. Evaluation of the FY-3E Microwave Temperature Sounding Data Assimilation on Forecasting Typhoon Chanthu (2021). Meteorol. Atmos. Phys. 2023, 135, 54. [Google Scholar] [CrossRef] [Scilit]
- Li, S.; Xu, T.; Jiang, N.; Xu, Y.; Yang, H.; Bastos, L. Assessment of the Atmosphere Profiles and Derived Parameters from Fresh FengYun-3E and Other Common Occultation Systems. Measurement 2024, 228, 114367. [Google Scholar] [CrossRef] [Scilit]
- Liu, R.; Lu, Q.; Wu, C.; Ni, Z.; Wang, F. Assimilation of Hyperspectral Infrared Atmospheric Sounder Data of FengYun-3E Satellite and Assessment of Its Impact on Analyses and Forecasts. Remote Sens. 2024, 16, 908. [Google Scholar] [CrossRef] [Scilit]
- Zou, Y.; Wu, Y.; Ma, J.; Huang, Y.; Ning, J.; Fu, Q. Neural Network Inversion Method for Atmospheric Temperature and Relative Humidity Profiles Based on FY-3E/HIRAS. Laser Optoelectron. Prog. 2025, 62, 0701001. [Google Scholar] [CrossRef] [Scilit]
- Huang, J.; Ma, G.; Liu, G.; Li, J.; Zhang, H. The Evaluation of FY-3E Hyperspectral Infrared Atmospheric Sounder-II Long-Wave Temperature Sounding Channels. Remote Sens. 2023, 15, 5525. [Google Scholar] [CrossRef] [Scilit]
- Fang, D.; Chen, G.; Xu, X.; Zhao, Y.; Wang, Z. Evaluating Clear-Sky Assimilation of FengYun-3E Microwave Radiance Data in Predicting Multiple Tropical Cyclones over the Western North Pacific. Atmos. Res. 2025, 320, 108025. [Google Scholar] [CrossRef] [Scilit]
- Zhang, L.; Niu, Z.; Weng, F.; Huang, W. Direct Assimilation of FY-3E Microwave Sounding Channel Data in a Regional Model to Improve Typhoon Forecasts. In Proceedings of the European Geosciences Union General Assembly 2025 (EGU25), Vienna, Austria, 27 April–2 May 2025. [Google Scholar]
- Liu, S.; Xu, J.; Chen, L.; Liu, H.; Wang, W.; He, J.; Zhu, S.; Shi, J. Comprehensive Validation of Temperature and Humidity Profile Retrievals from FengYun-3E. IEEE Trans. Geosci. Remote Sens. 2026, 64, 4102214. [Google Scholar] [CrossRef] [Scilit]
- He, Q.; Li, J.; Zhang, R.; Jia, J.; Guo, X. Research on Validation Method on Retrieval of Atmospheric Temperature and Humidity Profile Using a Microwave Sounder. Atmosphere 2024, 15, 760. [Google Scholar] [CrossRef] [Scilit]
- Song, Z.; Bai, W.; Zhang, Y.; Wang, Y.; Xu, X.; Xin, J. Evaluation of Satellite-Derived Atmospheric Temperature and Humidity Profiles and Their Application as Precursors to Severe Convective Precipitation. Remote Sens. 2024, 16, 4638. [Google Scholar] [CrossRef] [Scilit]
- Hu, J.; Wang, Z.; Luo, J.-J.; Li, X.; Wang, R. Significantly Improved Representation of the Stratospheric Quasi-Biennial Oscillation in the CMA-RA V1.5 Reanalysis Dataset. Atmos. Ocean. Sci. Lett. 2025; in press. [CrossRef] [Scilit]
- Turner, D.D.; Löhnert, U. Ground-Based Temperature and Humidity Profiling: Combining Active and Passive Remote Sensors. Atmos. Meas. Tech. 2021, 14, 3033–3048. [Google Scholar] [CrossRef] [Scilit]
- Pakkattil, A.; Parde, A.N.; Wagh, S.; Lonkar, P.; Ghude, S.D. Wintertime Intercomparison of Specific Humidity and Temperature Profiles Measured by Microwave Radiometer (MWR), Radiosonde, and INSAT-3DR Sounder Over Delhi, India. J. Geophys. Res. Atmos. 2025, 130, e2025JD044462. [Google Scholar] [CrossRef] [Scilit]
- Leena, P.P.; Dani, K.K.; Nath, A.; Sanap, S.D.; Pandithurai, G.; Anil Kumar, V. Validation of Ground-Based Microwave Radiometer Data and Its Application in Verifying Atmospheric Stability over Mahbubnagar during 2011 Monsoon and Post-Monsoon Seasons. Int. J. Remote Sens. 2015, 36, 2920–2933. [Google Scholar] [CrossRef] [Scilit]
- Chen, H.; Guan, L. A Bias Correction Scheme for FY-3E/HIRAS-II Observation Data Assimilation. Atmos. Meas. Tech. 2025, 18, 5591–5606. [Google Scholar] [CrossRef] [Scilit]
- Hersbach, H.; Bell, B.; Berrisford, P.; Hirahara, S.; Horányi, A.; Muñoz-Sabater, J.; Nicolas, J.; Peubey, C.; Radu, R.; Schepers, D.; et al. The ERA5 Global Reanalysis. Q. J. R. Meteorol. Soc. 2020, 146, 1999–2049. [Google Scholar] [CrossRef] [Scilit]
- Bolton, D. The Computation of Equivalent Potential Temperature. Mon. Weather Rev. 1980, 108, 1046–1053. [Google Scholar] [CrossRef] [Scilit]
- Nalli, N.R.; Barnet, C.D.; Reale, A.; Tobin, D.; Gambacorta, A.; Maddy, E.S.; Joseph, E.; Sun, B.; Borg, L.; Mollner, A.K.; et al. Validation of Satellite Sounder Environmental Data Records: Application to the Cross-Track Infrared Microwave Sounder Suite. J. Geophys. Res. Atmos. 2013, 118, 13628–13643. [Google Scholar] [CrossRef] [Scilit]
- Wei, Y.; Peng, K.; Ma, Y.; Sun, Y.; Zhao, D.; Ren, X.; Yang, S.; Ahmad, M.; Pan, X.; Wang, Z.; et al. Validation of ERA5 Boundary Layer Meteorological Variables by Remote-Sensing Measurements in the Southeast China Mountains. Remote Sens. 2024, 16, 548. [Google Scholar] [CrossRef] [Scilit]
- Wang, K.-N. Characterize Temperature and Water Vapor Structure in PBL with Joint GNSS Radio Occultation (GNSS-RO) and Passive Microwave Radiometer (MWR) Retrieval. In Proceedings of the 104th Annual AMS Meeting 2024, Baltimore, MD, USA, 28 January–1 February 2024. [Google Scholar]
- Weng, F. Passive Microwave Remote Sensing of the Earth; WILEY-VCH: Berlin, Germany, 2017. [Google Scholar]
- Deeter, M.N.; Vivekanandan, J. AMSU-B Observations of Mixed-Phase Clouds over Land. J. Appl. Meteorol. Climatol. 2005, 44, 72–85. [Google Scholar] [CrossRef] [Scilit]
- Zhao, L.; Lee, X.; Smith, R.B.; Oleson, K. Strong Contributions of Local Background Climate to Urban Heat Islands. Nature 2014, 511, 216–219. [Google Scholar] [CrossRef] [Scilit]
- Zargari, M.; Mofidi, A.; Entezari, A.; Baaghideh, M. Climatic Comparison of Surface Urban Heat Island Using Satellite Remote Sensing in Tehran and Suburbs. Sci. Rep. 2024, 14, 643. [Google Scholar] [CrossRef] [Scilit]
- Miralles, D.G.; Vilà-Guerau De Arellano, J.; McVicar, T.R.; Mahecha, M.D. Vegetation–Climate Feedbacks across Scales. Ann. N. Y. Acad. Sci. 2025, 1544, 27–41. [Google Scholar] [CrossRef] [Scilit]
- Li, Q.; Wei, M.; Wang, Z.; Jiang, S.; Chu, Y. Improving the Retrieval of Cloudy Atmospheric Profiles from Brightness Temperatures Observed with a Ground-Based Microwave Radiometer. Atmosphere 2021, 12, 648. [Google Scholar] [CrossRef] [Scilit]
- Bulgin, C.E.; Merchant, C.J.; Ghent, D.; Klüser, L.; Popp, T.; Poulsen, C.; Sogacheva, L. Quantifying Uncertainty in Satellite-Retrieved Land Surface Temperature from Cloud Detection Errors. Remote Sens. 2018, 10, 616. [Google Scholar] [CrossRef] [Scilit]
- Smith, N.; Barnet, C.D. CLIMCAPS—A NASA Long-Term Product for Infrared + Microwave Atmospheric Soundings. Earth Space Sci. 2023, 10, e2022EA002701. [Google Scholar] [CrossRef] [Scilit]
- Feng, Y.; He, J.; Ma, G.; Huang, J.; Li, J.; Guo, Y.; Liu, G.; Zhang, P.; Gong, J. Consistent Assessment of Microwave Scattering and Vertical Dynamic Characteristics in the Precipitation Environment Over Oceans. IEEE J. Sel. Top. Appl. Earth Obs. Remote Sens. 2024, 17, 12408–12420. [Google Scholar] [CrossRef] [Scilit]
- Zhang, Y.; Hu, H.; Weng, F. The Potential of Satellite Sounding Observations for Deriving Atmospheric Wind in All-Weather Conditions. Remote Sens. 2021, 13, 2947. [Google Scholar] [CrossRef] [Scilit]

Disclaimer/Publisher’s Note: The statements, opinions and data contained in all publications are solely those of the individual author(s) and contributor(s) and not of MDPI and/or the editor(s). MDPI and/or the editor(s) disclaim responsibility for any injury to people or property resulting from any ideas, methods, instructions or products referred to in the content. |
© 2026 by the authors. Licensee MDPI, Basel, Switzerland. This article is an open access article distributed under the terms and conditions of the Creative Commons Attribution (CC BY) license.