Article

Variable Frequency Phase Modulation on Time-Modulated Metasurface for SAR Feature Reconstruction

Key Laboratory of Complex Electromagnetic Environment Effects on Electronics and Information System, College of Electronic Science and Technology, National University of Defense Technology, Changsha 410073, China
*
Author to whom correspondence should be addressed.
Remote Sens. 2026, 18(7), 1060; https://doi.org/10.3390/rs18071060
Submission received: 7 February 2026 / Revised: 23 March 2026 / Accepted: 27 March 2026 / Published: 1 April 2026

Highlights

What are the main findings?
  • A SAR feature reconstruction method based on variable frequency phase modulation is proposed, enabling a single metasurface to modulate multiple scattering centers in both range and azimuth dimensions.
  • An analytical inverse model is established to link modulation parameters with the spatial coordinates and amplitudes of generated scattering centers, allowing for the simultaneous reconstruction of target features through independent design of modulation duration and frequency.
What are the implications of the main findings?
  • This study marks the first systematic application of variable frequency-modulation techniques to SAR feature reconstruction, breaking through the inherent limitations of traditional one-to-one mapping. It provides a novel technical solution for achieving efficient, flexible, and high-fidelity simulation of complex target electromagnetic characteristics.
  • An inverse analytical expression has been established between the target electromagnetic scattering characteristics and the time-domain modulation parameters of the metasurface. Through independent design of the modulation duration and modulation frequency, simultaneous reconstruction of the position and amplitude information of the generated scattering points is achieved.

Abstract

Time-modulated metasurfaces offer a novel technical approach for actively modulating and reconstructing radar target characteristics through their dynamic control of electromagnetic waves. However, existing SAR feature reconstruction methods based on metasurfaces are typically constrained by a one-to-one mapping mechanism where “a single metasurface unit corresponds to a single scattering center”. This results in low reconstruction efficiency and limited flexibility, hindering high-fidelity simulation of complex multi-scatterer targets. Therefore, this paper proposes a variable frequency-phase modulation method on time-modulated metasurfaces for SAR feature reconstruction. The core concept of this method involves decomposing complex targets into discrete scattering centers. By employing a “frequency-modulated continuous-phase modulation” strategy, a tailored modulation scheme is designed for each time-modulated metasurface, generating multiple adjustable false scattering center arrays in both the range and elevation dimensions of SAR imagery. Experimental results demonstrate that this method can effectively reconstruct SAR signatures highly similar to the original target, with similarity metrics exceeding 0.9. This study marks the first systematic application of frequency-modulation techniques to SAR signature reconstruction, breaking through the inherent limitations of traditional one-to-one mapping. It provides a novel theoretical framework and technical solution for achieving efficient, flexible, and high-fidelity simulation of complex target electromagnetic signatures, holding significant application value in fields such as radar countermeasures and signature camouflage.

1. Introduction

Synthetic aperture radar (SAR) [1,2] offers advantages such as all-weather, all-time operation and high-resolution imaging [3,4,5], making it a core sensor in fields like target recognition and remote sensing imaging. Correspondingly, SAR feature manipulation techniques aimed at enhancing target survivability have rapidly evolved. Their core principle involves actively altering or falsifying a target’s electromagnetic scattering characteristics to modulate SAR echo signals, thereby fabricating or concealing features within radar imagery.
Currently, widely used SAR signature modulation techniques can be categorized into active and passive methods. Active techniques primarily employ active jammers to intercept and analyze SAR transmission signals, subsequently synthesizing them with pre-set high-fidelity target templates before relaying the processed data to the SAR system. This ultimately generates predetermined false scatter points or false scenes within the imaging area [6,7,8,9,10]. However, such systems are complex, costly, and prone to exposure as active radiation sources. Traditional passive techniques [11,12,13,14,15] deploy passive device arrays within designated areas to simulate radar echoes and reconstruct radar signatures, creating highly realistic false targets in radar imagery. However, their electromagnetic scattering characteristics are fixed and difficult to flexibly adjust.
Electromagnetically tunable materials consist of subwavelength-scale units arranged in periodic or aperiodic patterns. By integrating tunable elements within these units, electromagnetic waves can be manipulated in real time under external stimuli such as bias voltage or optical fields, effectively altering radar target characteristics. As the flexibility and functional diversity of electromagnetic tunable materials continue to increase, radar signature control technologies based on these materials now possess the capability to regulate multiple dimensions, including the amplitude, phase, polarization, and beam direction of incident electromagnetic waves [16,17,18,19,20,21,22,23,24,25]. They can introduce a series of controllable harmonic components into the echo spectrum to disrupt or mimic target features [26,27,28], thereby reducing the detectability of radar targets and beam direction. They can introduce controllable harmonic components into the echo spectrum to disrupt or mimic target signatures, thereby reducing the probability of detection or identification. These techniques offer advantages such as rapid response, low detectability, and flexible modulation. From a materials perspective [29,30], researchers have progressively developed wide-angle, flexible, and conformable electromagnetic materials better suited to practical demands. Regarding modulation techniques, digitally encoded metasurfaces and time-controlled metasurfaces bridge the gap between physical materials and digital coding, enabling direct loading of encoded information onto the spatial and frequency spectrum characteristics of electromagnetic waves.
In recent years, research on time-modulated metasurfaces in the SAR domain has also experienced rapid development. However, research on directly reconstructing the physical characteristics of radar targets using deep learning [31,32] is still in its infancy. Not only is the relevant literature scarce, but there are also significant challenges in transitioning from high-level digital image generation to low-level hardware coding and control. Existing typical methods, such as SPM, typically require full knowledge of the internal structure and weight parameters of the adversary’s radar recognition neural network (i.e., “white-box” conditions) to generate adversarial features in the physical domain. Other methods, such as MIGAA, have addressed the reliance on prior white-box knowledge, but their core relies heavily on heuristic optimization algorithms. Such algorithms typically require tens or even hundreds of black-box queries and iterations to converge, resulting in slow response times that make it difficult to meet real-time requirements. In the field of SAR interference mitigation, ref. [33] investigated imaging characteristic modulation methods based on active selective surfaces. By employing non-periodic amplitude coding to control harmonic spectrum distribution, they generated continuous Doppler spectra. Ref. [34] proposed SAR feature modulation methods based on time-modulated corner reflectors and flexible conformal multifunctional time-varying metasurfaces, generating multiple discrete false targets on SAR images by applying periodic coded waveforms. Ref. [35] combined sine phase modulation and segmented phase modulation to propose a composite phase modulation model, which was applied to a time-modulated metasurface to generate multiple discrete false moving targets. SAR feature reconstruction techniques achieve radar deception by dynamically adjusting or fabricating the electromagnetic scattering characteristics of targets, thereby preventing radar detection systems from accurately identifying or tracking them. Ref. [36] proposes a passive deception method guided by an electromagnetic scattering center model. By extracting the scattering center characteristics of deceptive targets, it designs the time-domain modulation strategy for metasurfaces, thereby faithfully reconstructing predetermined deceptive target features in SAR images. Ref. [37] proposes a SAR feature reconstruction method based on pulse time-offset periodic phase modulation. By dynamically controlling electromagnetic scattering characteristics via metasurfaces and integrating a dual-algorithm cooperative optimization system, it achieves programmable reconstruction of SAR imaging features for multipoint targets for the first time. This approach supports flexible adjustment of target size, position, and orientation while preserving geometric consistency.
Although the aforementioned studies have proposed corresponding methods for SAR feature reconstruction, the existing research paradigm still faces two core bottlenecks in terms of reconstruction fidelity and system implementation efficiency, which urgently require breakthroughs. Regarding fidelity, current research generally focuses on reproducing the spatial positions of scatter points through electromagnetic control yet neglects the simultaneous modulation of amplitude information for each scatter point. Regarding implementation efficiency, all current approaches employ a “one-to-one” mapping mechanism (where a single metasurface maps to a single scatterer). For complex targets with numerous scatterers, existing methods incur dramatically increased hardware costs and system complexity, posing significant challenges for array integration and real-time control.
This paper proposes a SAR feature reconstruction method based on frequency-modulated continuous-phase modulation. Building upon the SAR modulation model of frequency-modulated continuous-phase modulated metasurfaces, it analyzes the influence mechanism of different modulation parameters on the modulation model and establishes the mathematical expression of SAR images under this modulation model. Building upon this foundation, inverse formulas are defined for the modulation parameters of the modulation array and the position and amplitude of the generated electromagnetic scattering center, based on the location and energy requirements of complex target scattering points. This enables an electromagnetic scattering center generation method based on the frequency-modulated phase modulation model. Concurrently, SAR feature reconstruction experiments conducted using real measurement data and the MSTAR dataset further validate the effectiveness of the proposed method.
In summary, the main contributions of this paper are as follows:
(1)
An SAR feature reconstruction method based on variable frequency-phase modulation is proposed. By employing segmented frequency-modulation techniques, a single metasurface achieves simultaneous modulation simulation of multiple scattering centers in both range and azimuth directions. To our knowledge, this is the first paper exploring frequency-modulation applications in SAR feature simulation, overcoming the one-to-one mapping constraint between metasurfaces and scattering points in existing reconstruction techniques.
(2)
Establishes an inverse relationship between the modulation parameters of the metasurface modulation array and the position/amplitude of generated electromagnetic scattering centers. By independently designing modulation duration and modulation frequency, simultaneous reconstruction of both positional and amplitude information for generated scattering points is achieved.
The remainder of this paper is organized as follows. Section 2 elaborates on the principle of SAR feature reconstruction based on time-modulated metasurfaces. Section 3 establishes the fundamental control theory for the frequency-shifted phase modulation model and analyzes the impact of different modulation parameters on harmonic spectrum distribution. Section 4 proposes a SAR feature reconstruction method based on the frequency-shifted phase-modulation model. Section 5 conducts SAR feature reconstruction experiments using real SAR measurements and the MSTAR dataset. The reconstruction performance is evaluated based on similarity metrics, validating the effectiveness of the proposed method. Section 6 discusses the experimental results, while Section 7 presents the conclusions, summarizing our proposed approach.

2. Principles of SAR Feature Reconstruction Based on Time-Modulated Metasurfaces

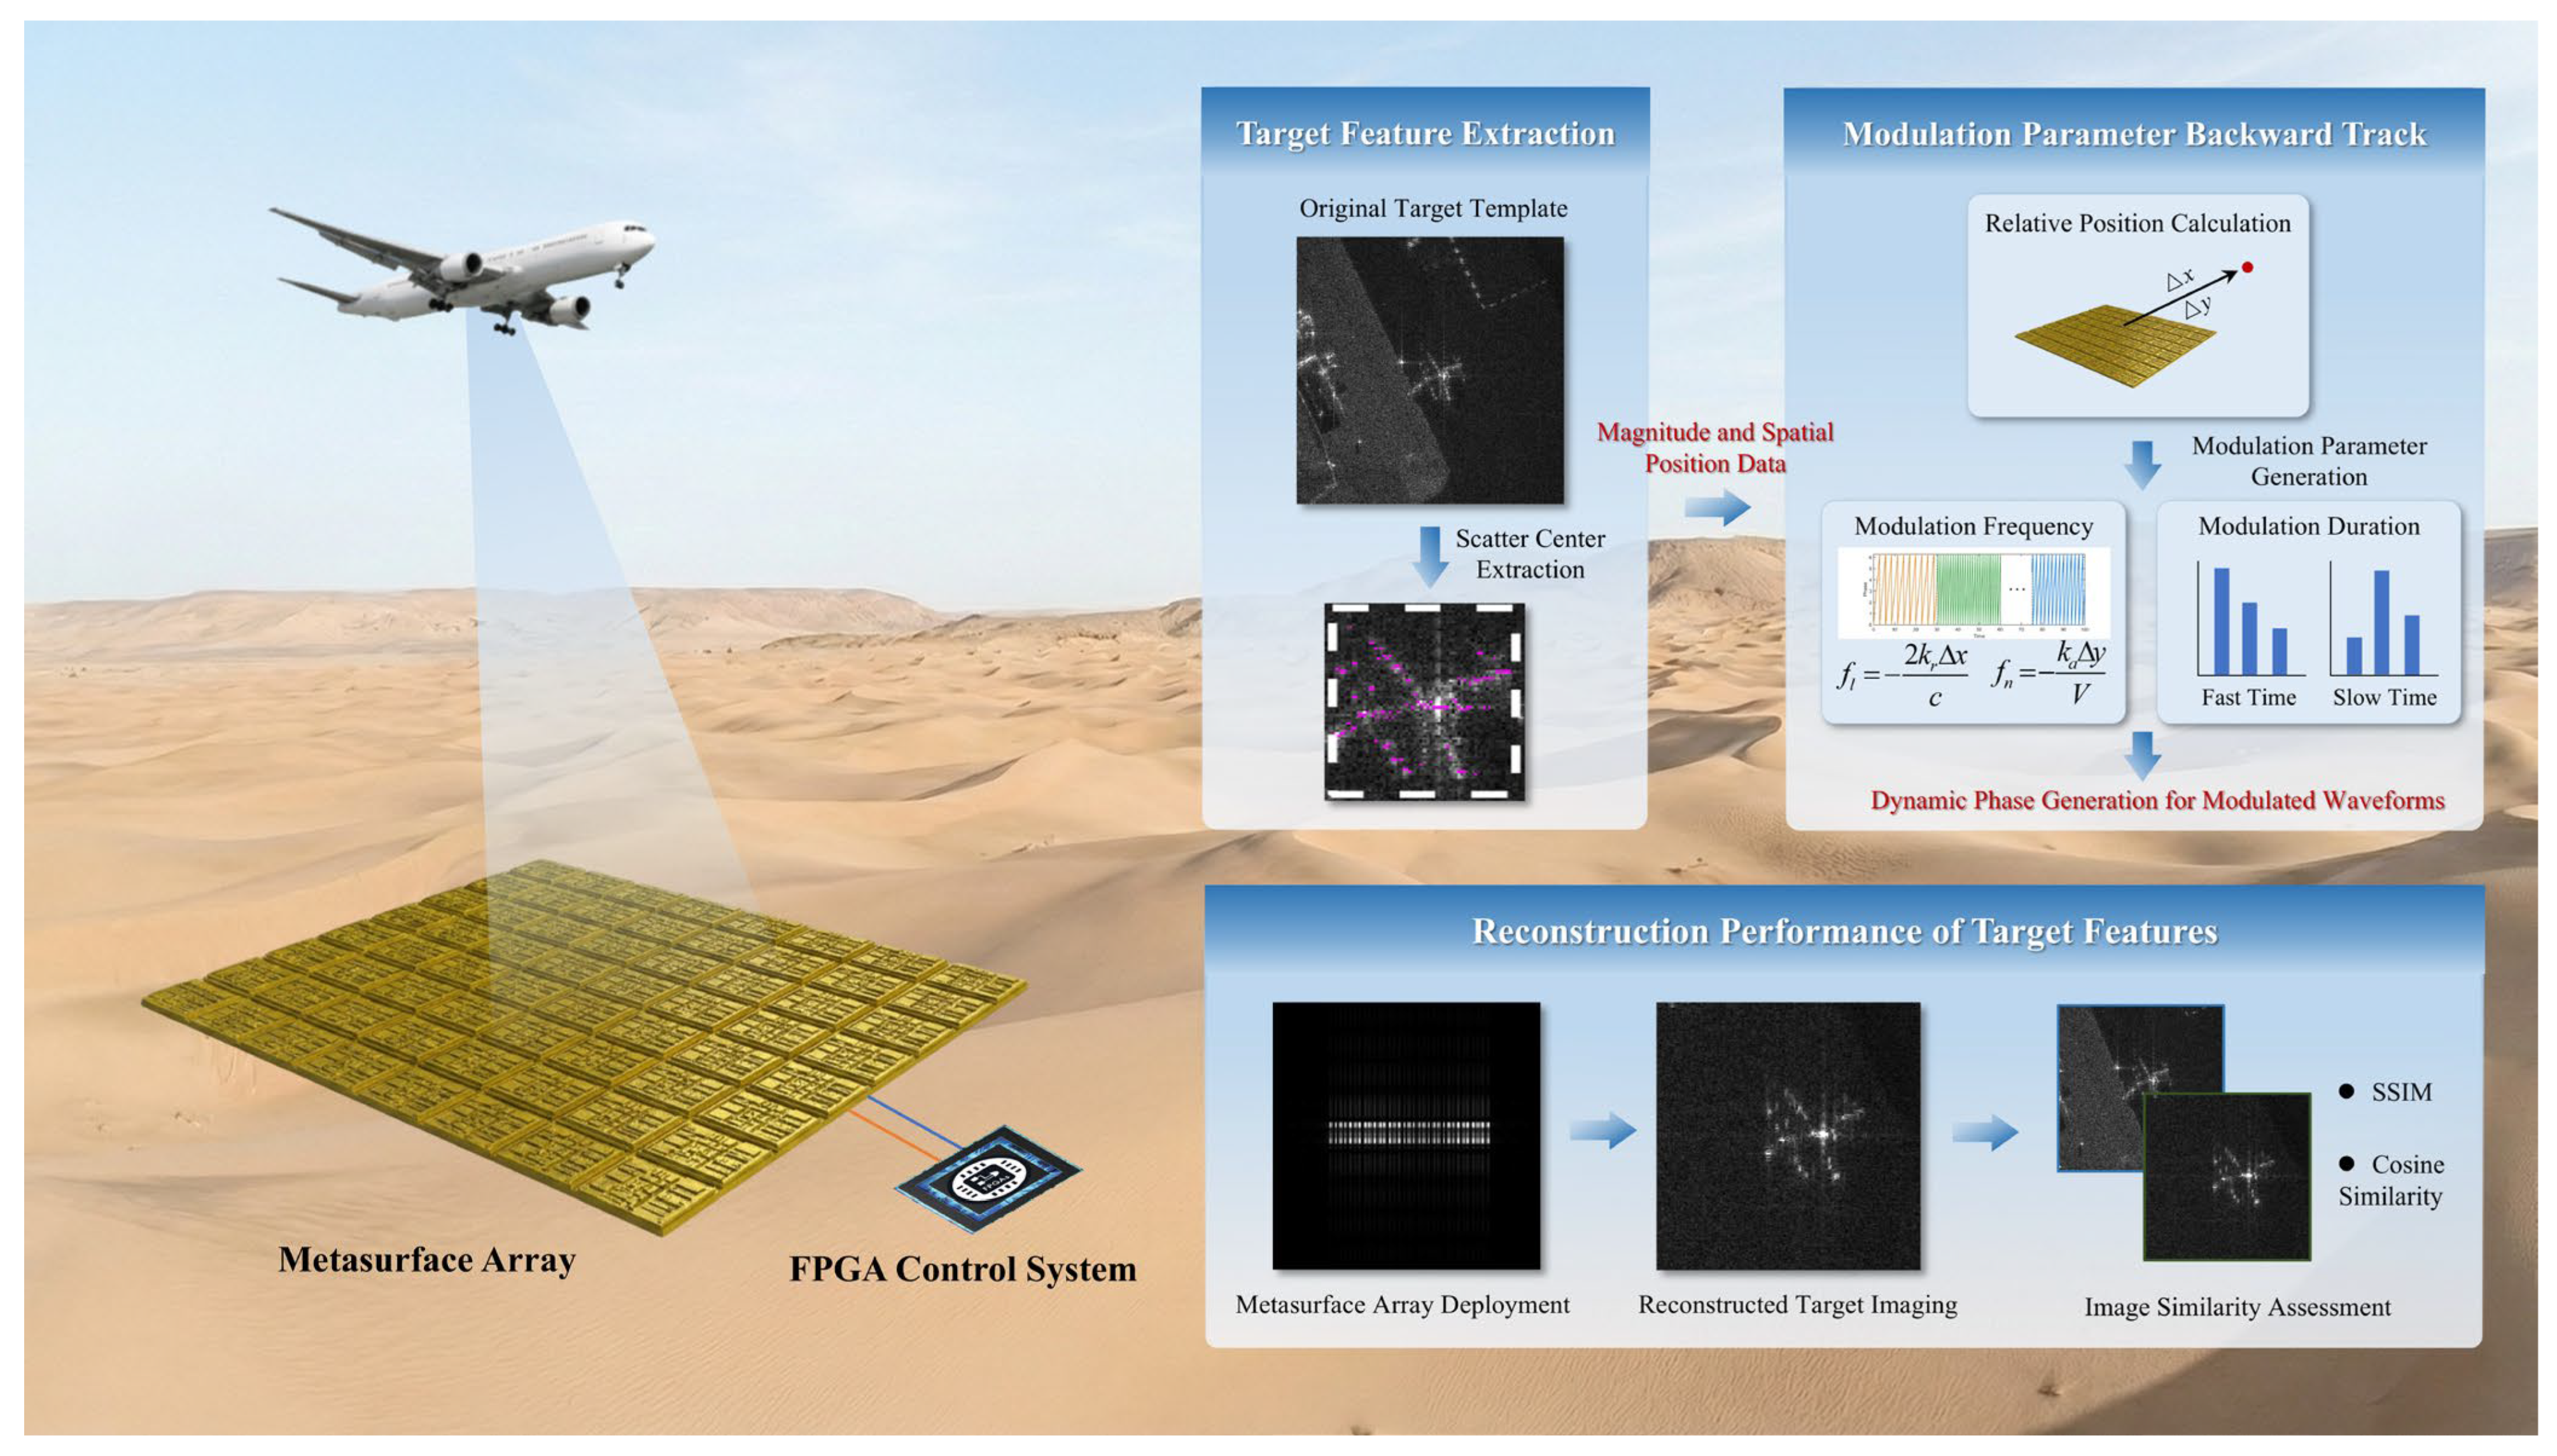
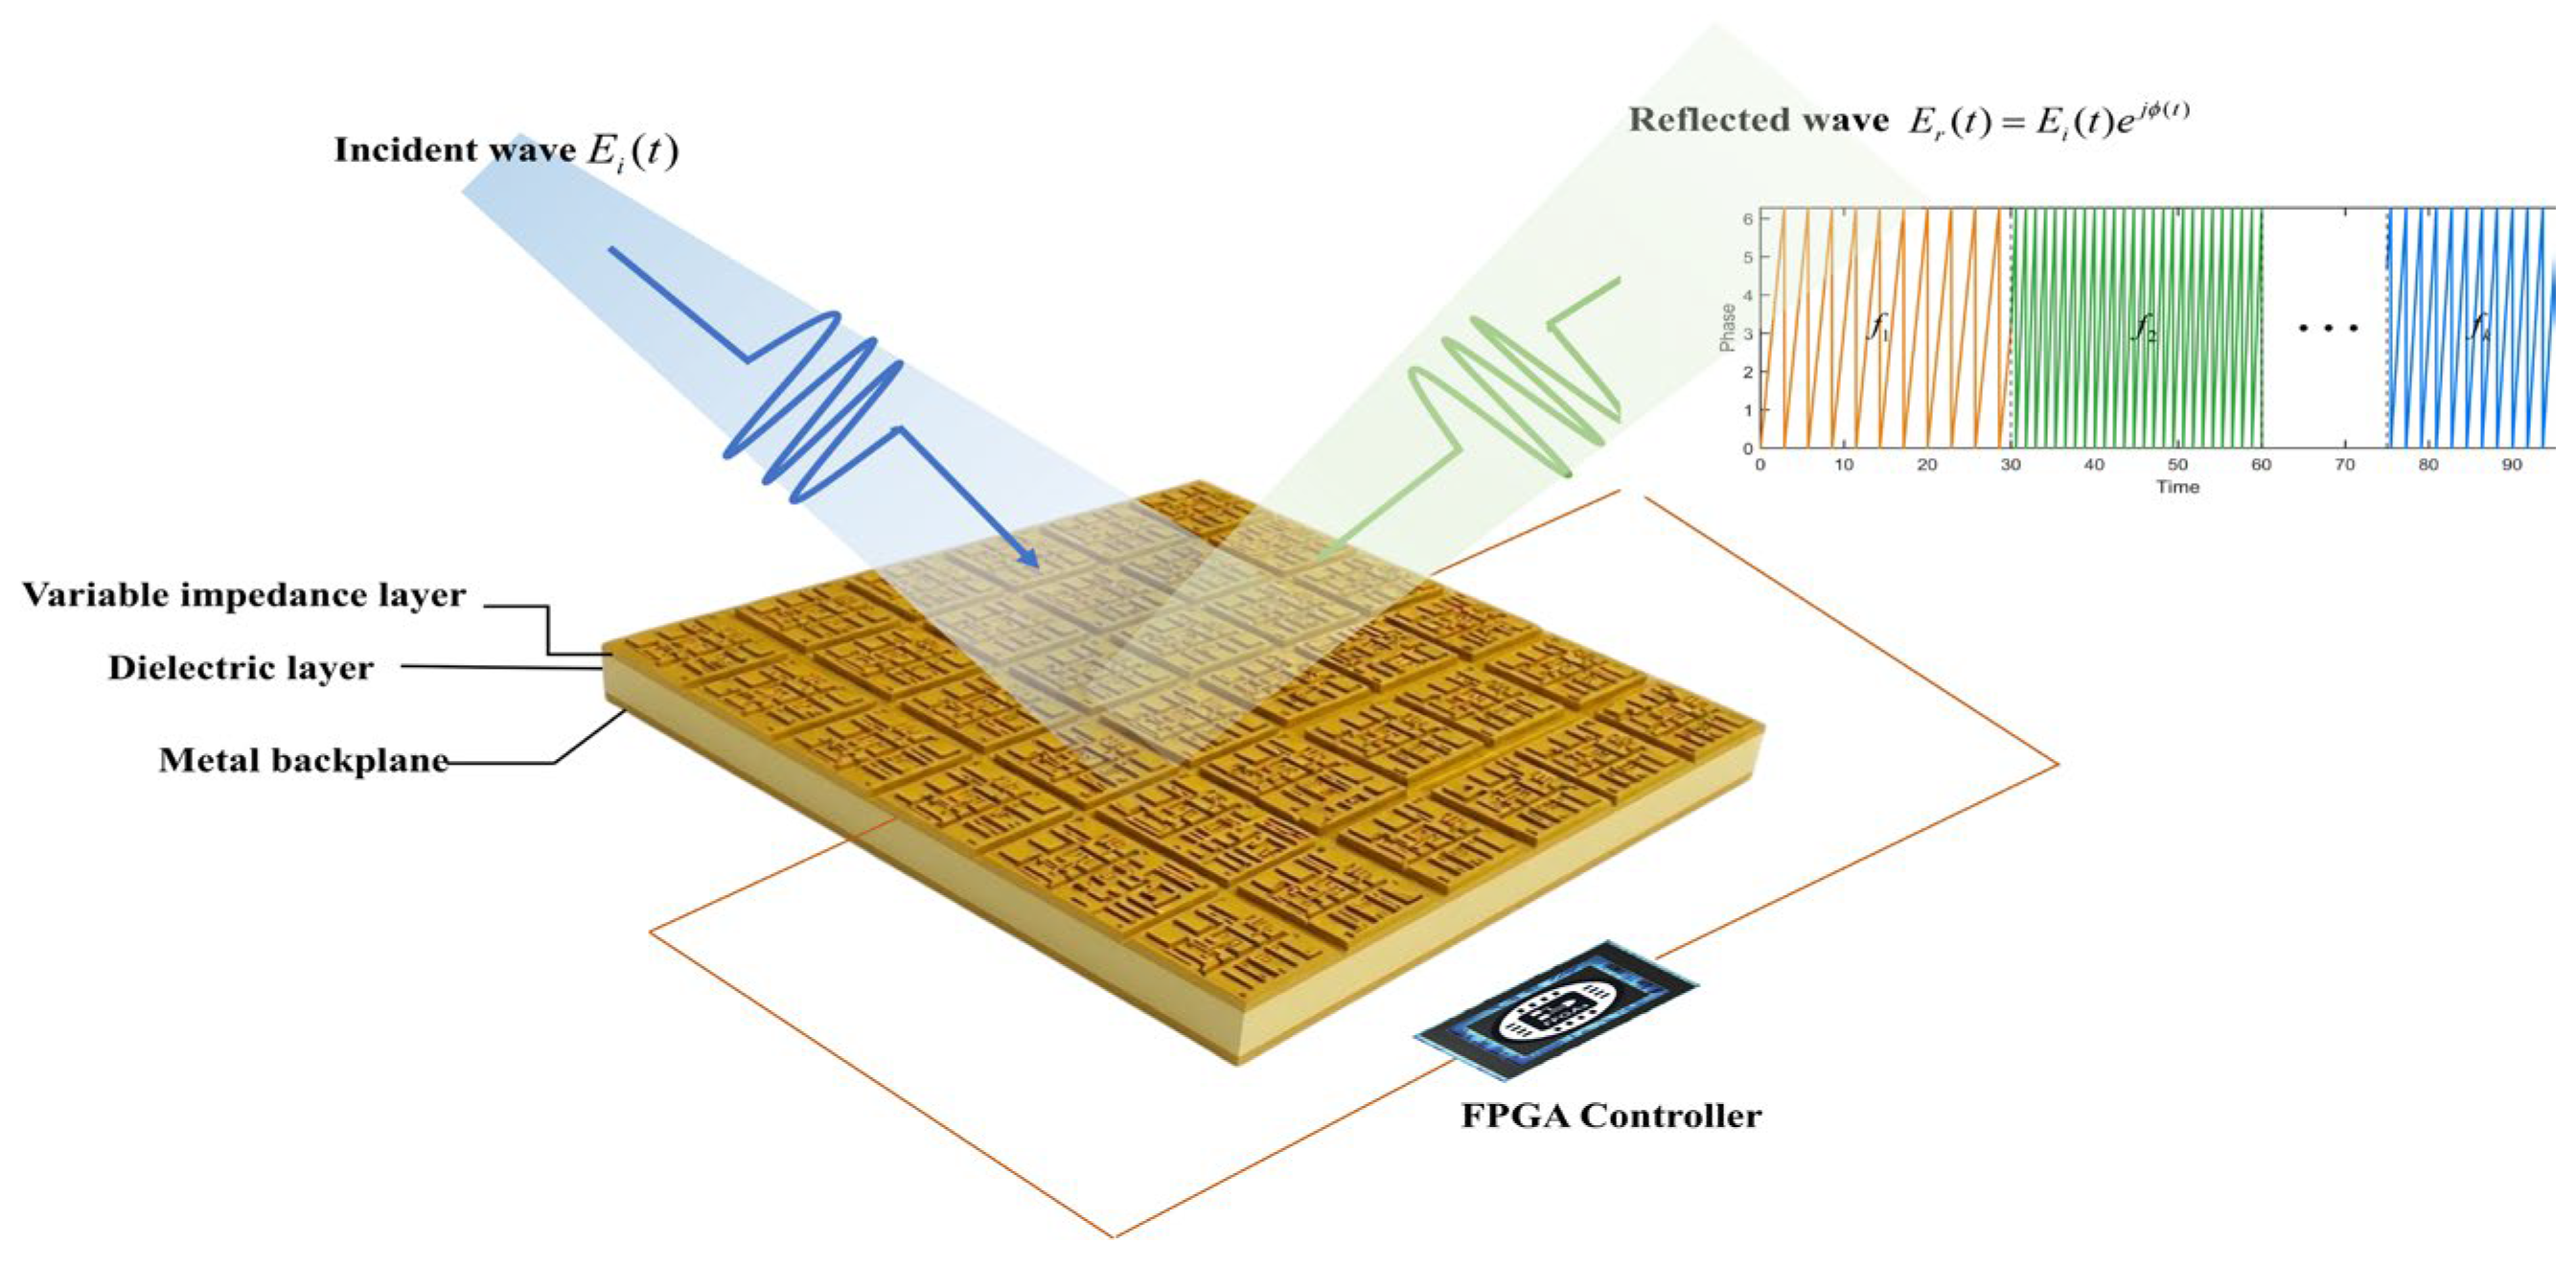
This paper proposes a frequency-modulated phase-modulation method based on time-modulated metasurfaces for SAR feature reconstruction. Figure 1 illustrates the overall schematic of this approach. First, the target feature-extraction module obtains the spatial coordinates and relative amplitudes of scattering centers from the raw SAR image template, serving as reference data for feature reconstruction. Next, a “frequency-modulated continuous phase modulation model” is established to describe the correspondence between target scattering characteristics and the time-domain modulation parameters of the metasurface. The position of the scattering center to be reconstructed is mapped to a specific modulated frequency sequence required for the hypersurface reflection phase. The relative amplitude information is mapped to the modulation duration corresponding to each frequency, enabling the precise calculation of a set of time-domain modulation parameters necessary to achieve the target feature. The calculated time-domain parameters are then converted by the host computer into a specific coding sequence and transmitted to the FPGA controller. The FPGA generates voltage control signals based on these parameters, driving the time-modulated metasurface units to rapidly switch between different reflection states. This generates a modulated echo signal with predefined multi-scatter point characteristics. Finally, imaging processing is applied to the modulated echo to obtain the reconstructed image. Quantitative evaluation of its consistency with the original template in terms of structural similarity (SSIM) and energy distribution confirms the effectiveness of this method for reconstructing complex target features.

3. Theory of Frequency-Modulated Phase Control Based on Time-Modulated Metasurfaces

This section first introduces the principles of phase modulation, then analyzes the frequency-shifting mechanism based on continuous phase modulation and finally establishes the variable-frequency phase-modulated signal model proposed in this paper. This lays the theoretical foundation for subsequent research on SAR feature reconstruction methods.
Time-modulated metasurfaces are artificial electromagnetic surfaces capable of dynamically manipulating incident electromagnetic waves in the time domain. Active devices such as PIN diodes or varactor diodes are embedded within spatially periodic subwavelength units, dynamically adjusting the electromagnetic response parameters of these units through externally applied time-varying control voltages. In an electromagnetic controllable surface, when electromagnetic waves impact a metasurface, the reflected signal can be expressed as the product of the incident signal and the time-varying reflection coefficient Γ ( t ) :
E r ( t ) = E i ( t ) Γ ( t ) ,
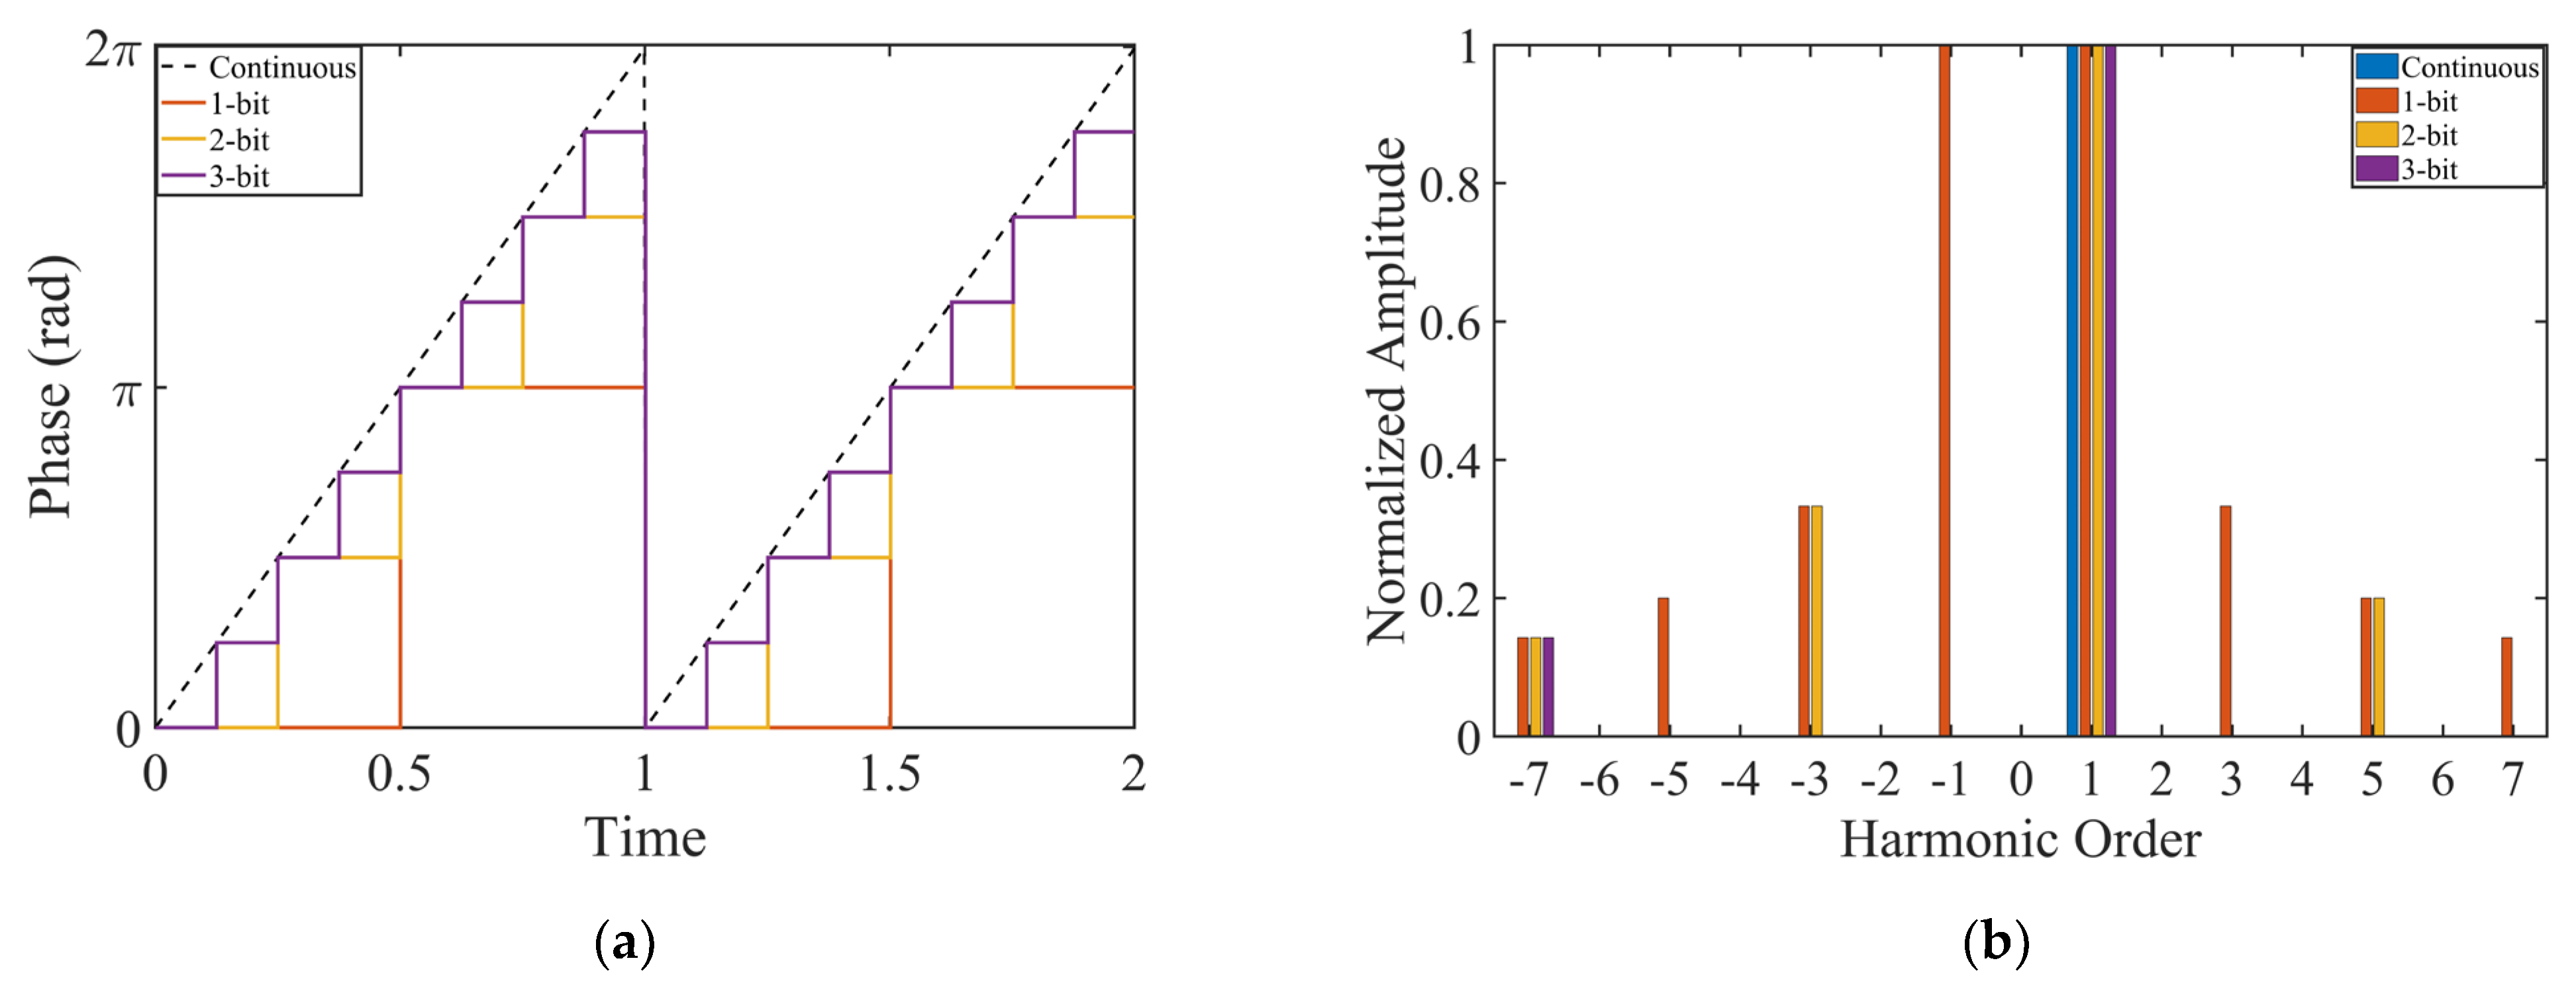
Among these, the reflection coefficient Γ ( t ) is a complex function varying with time, typically expressed in terms of amplitude A ( t ) and phase ϕ ( t ) . Different types of time-modulated metasurfaces can realize distinct electromagnetic control models. Common phase-modulated metasurfaces achieve phase-shifting effects. As shown in Figure 2, depending on the loaded device, time-modulated metasurfaces can achieve phase-quantization control at varying precision levels. The simplest 1-bit modulation can only switch between two states: 0 and π (equivalent to total reflection and total transmission, i.e., +1 and −1). To achieve more flexible modulation, multi-bit and continuous phase control mechanisms require investigation. By carefully designing varactor diodes within the unit cell structure, the hardware system can provide multi-level discrete control of the reflection phase over the 0-to-2π range, enabling the time-varying reflection coefficient to approximate an ideal continuous phase waveform.

3.1. Principle of Frequency Shift Based on Continuous Phase Modulation

The ideal phase-modulation mode primarily controls the phase response of the unit while maintaining a constant amplitude response. Through precise programming of the bias voltage, continuous or discrete regulation of the reflection phase ϕ ( t ) within the range of 0 to 2 π can be achieved. This temporal phase freedom forms the foundation for realizing electromagnetic spectrum shifting and harmonic control. Continuous linear phase modulation serves as an efficient frequency synthesis method. By introducing the linear phase ϕ ( t ) = 2 π f s t , the reflection coefficient Γ ( t ) = e j 2 π f s t is defined. To thoroughly analyze its spectral characteristics, we treat the reflection coefficient as a time-varying function with period T = 1 / f s and expand it into a sum of harmonic components using a Fourier series. The theoretical expression for the spectral function P ( f ) is:
P ( f ) = k = + j 1 e j ( 1 k ) 2 π ( 1 k ) 2 π δ ( f k f s ) ,
From Equation (2), it is evident that for all non-first-order harmonics, the energy conversion efficiency remains zero. This implies that under ideal continuous-phase modulation, all higher-order harmonics are completely suppressed except for the first-order target frequency. For the first-order harmonic, the energy-conversion efficiency converges to 1, meaning the energy of the reflected signal is entirely shifted to point f s . In the frequency domain, this manifests as ideal single-sideband modulation. However, in practical hardware implementation, constrained by the bit depth of digital control circuits, it is often difficult to generate a perfect continuous linear-phase modulation waveform. Instead, quantized discrete phases are commonly used as approximations. Figure 3 illustrates the spectral changes as the phase-quantization bit depth increases from 1 bit toward the ideal continuous linear phase. When low-precision quantization is employed, significant undesirable high-order harmonic components appear in the spectrum. As quantization precision increases, higher-order harmonics gradually disappear, ultimately converging to a single first-order spectral line.

3.2. Variable Frequency Continuous Phase Modulation Signal Model

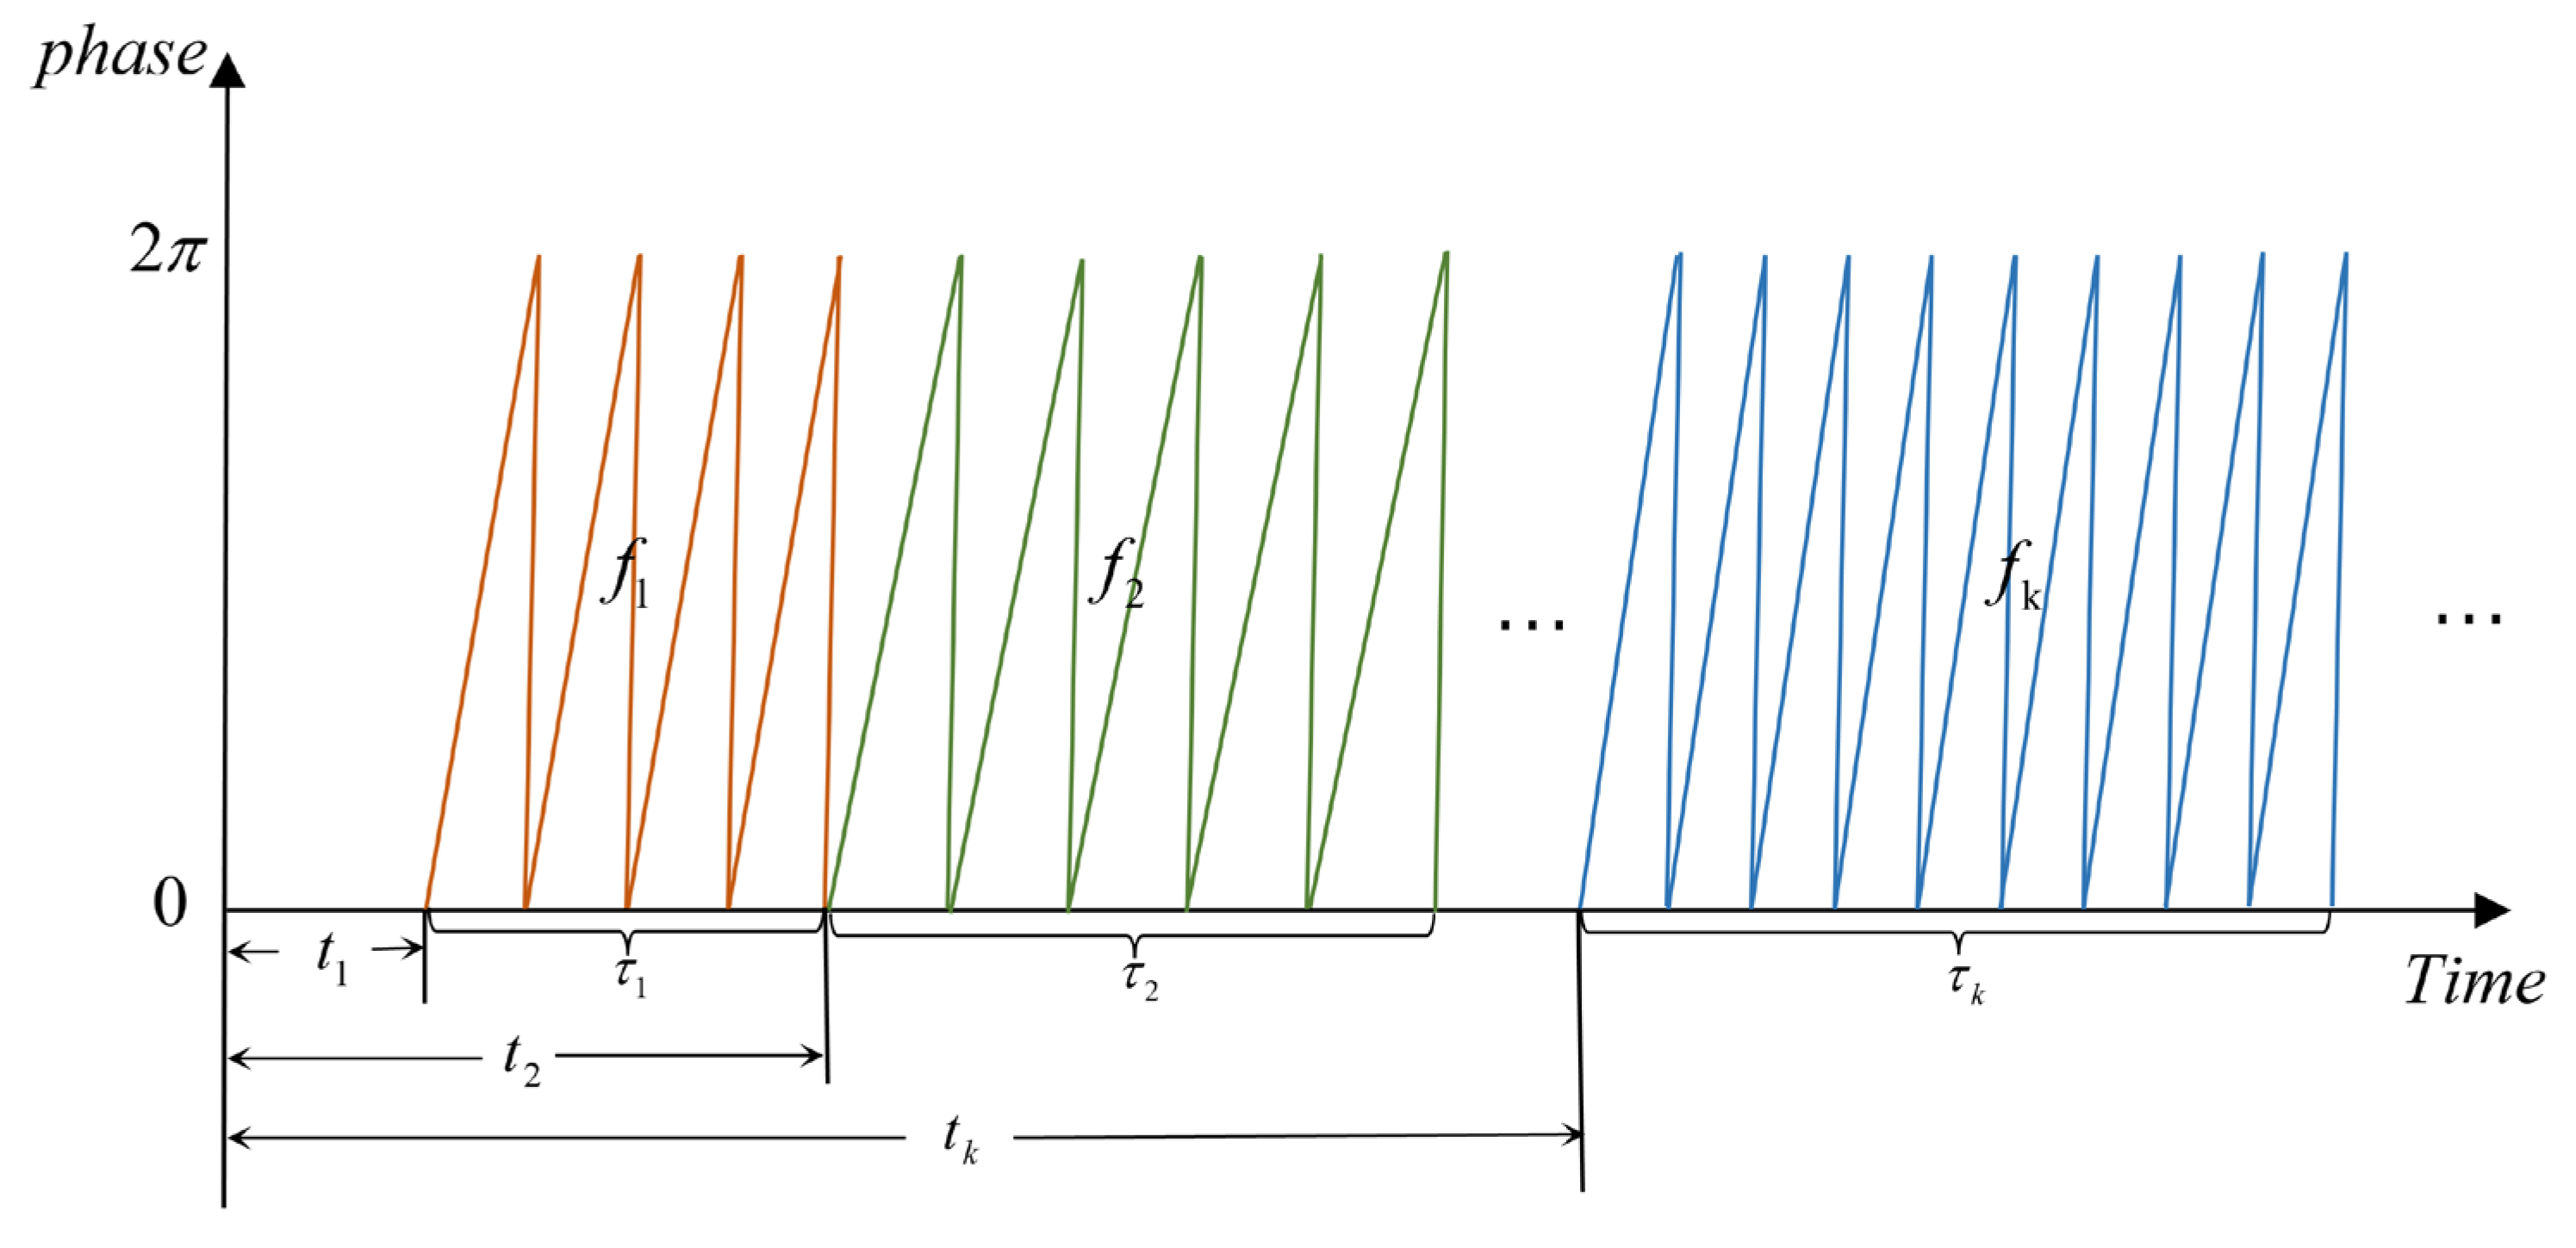
For LFM signals, strong coupling exists between the time and frequency domains. In matched filtering processing, frequency shifts introduced by phase modulation cause Doppler mismatch. This frequency-domain mismatch maps to a time-domain offset after pulse compression. Therefore, applying continuous linear-phase modulation to time-modulated metasurfaces constitutes a controlled Doppler frequency shift process. Based on this characteristic and combined with variable frequency-modulation mechanisms, a segmented frequency-conversion continuous phase-modulation model was established, as shown in Figure 4.
Divide the time axis into K modulation subintervals, where k is the segment index (k = 1,2,…,K). Each modulation subinterval corresponds to the following modulation parameters: modulation frequency f k , modulation duration τ k , and start time t k . The time-domain expression for the segmented frequency-modulated continuous phase-modulation signal is:
g t = k = 1 K r e c t ( t t k τ k ) exp ( j 2 π f k ( t t k ) ) ,
Among these, r e c t ( · ) is a rectangular pulse signal with a value of 1 when 0 < t / τ < 1 is active. Performing a Fourier transform on the above equation yields the frequency-domain expression for the modulated model signal:
G ( f ) = k = 1 K τ k sin c ( τ k ( f f k ) ) exp ( j π ( f f k ) ( 2 t k + τ k ) ) ,
The signal in Equation (4) is formed by the linear superposition of K sinc functions with distinct center frequencies, amplitudes, and phase characteristics. Observing the sinc function terms reveals that the main energy beam of the kth spectral component is strictly concentrated around frequency f = f k . Simultaneously, the peak amplitude of the kth spectral component is proportional to the duration τ k of that segment. This implies that, while preserving the conservation of total energy, the relative amplitude of each spectral component can be flexibly customized by redistributing the time proportions of each segment.
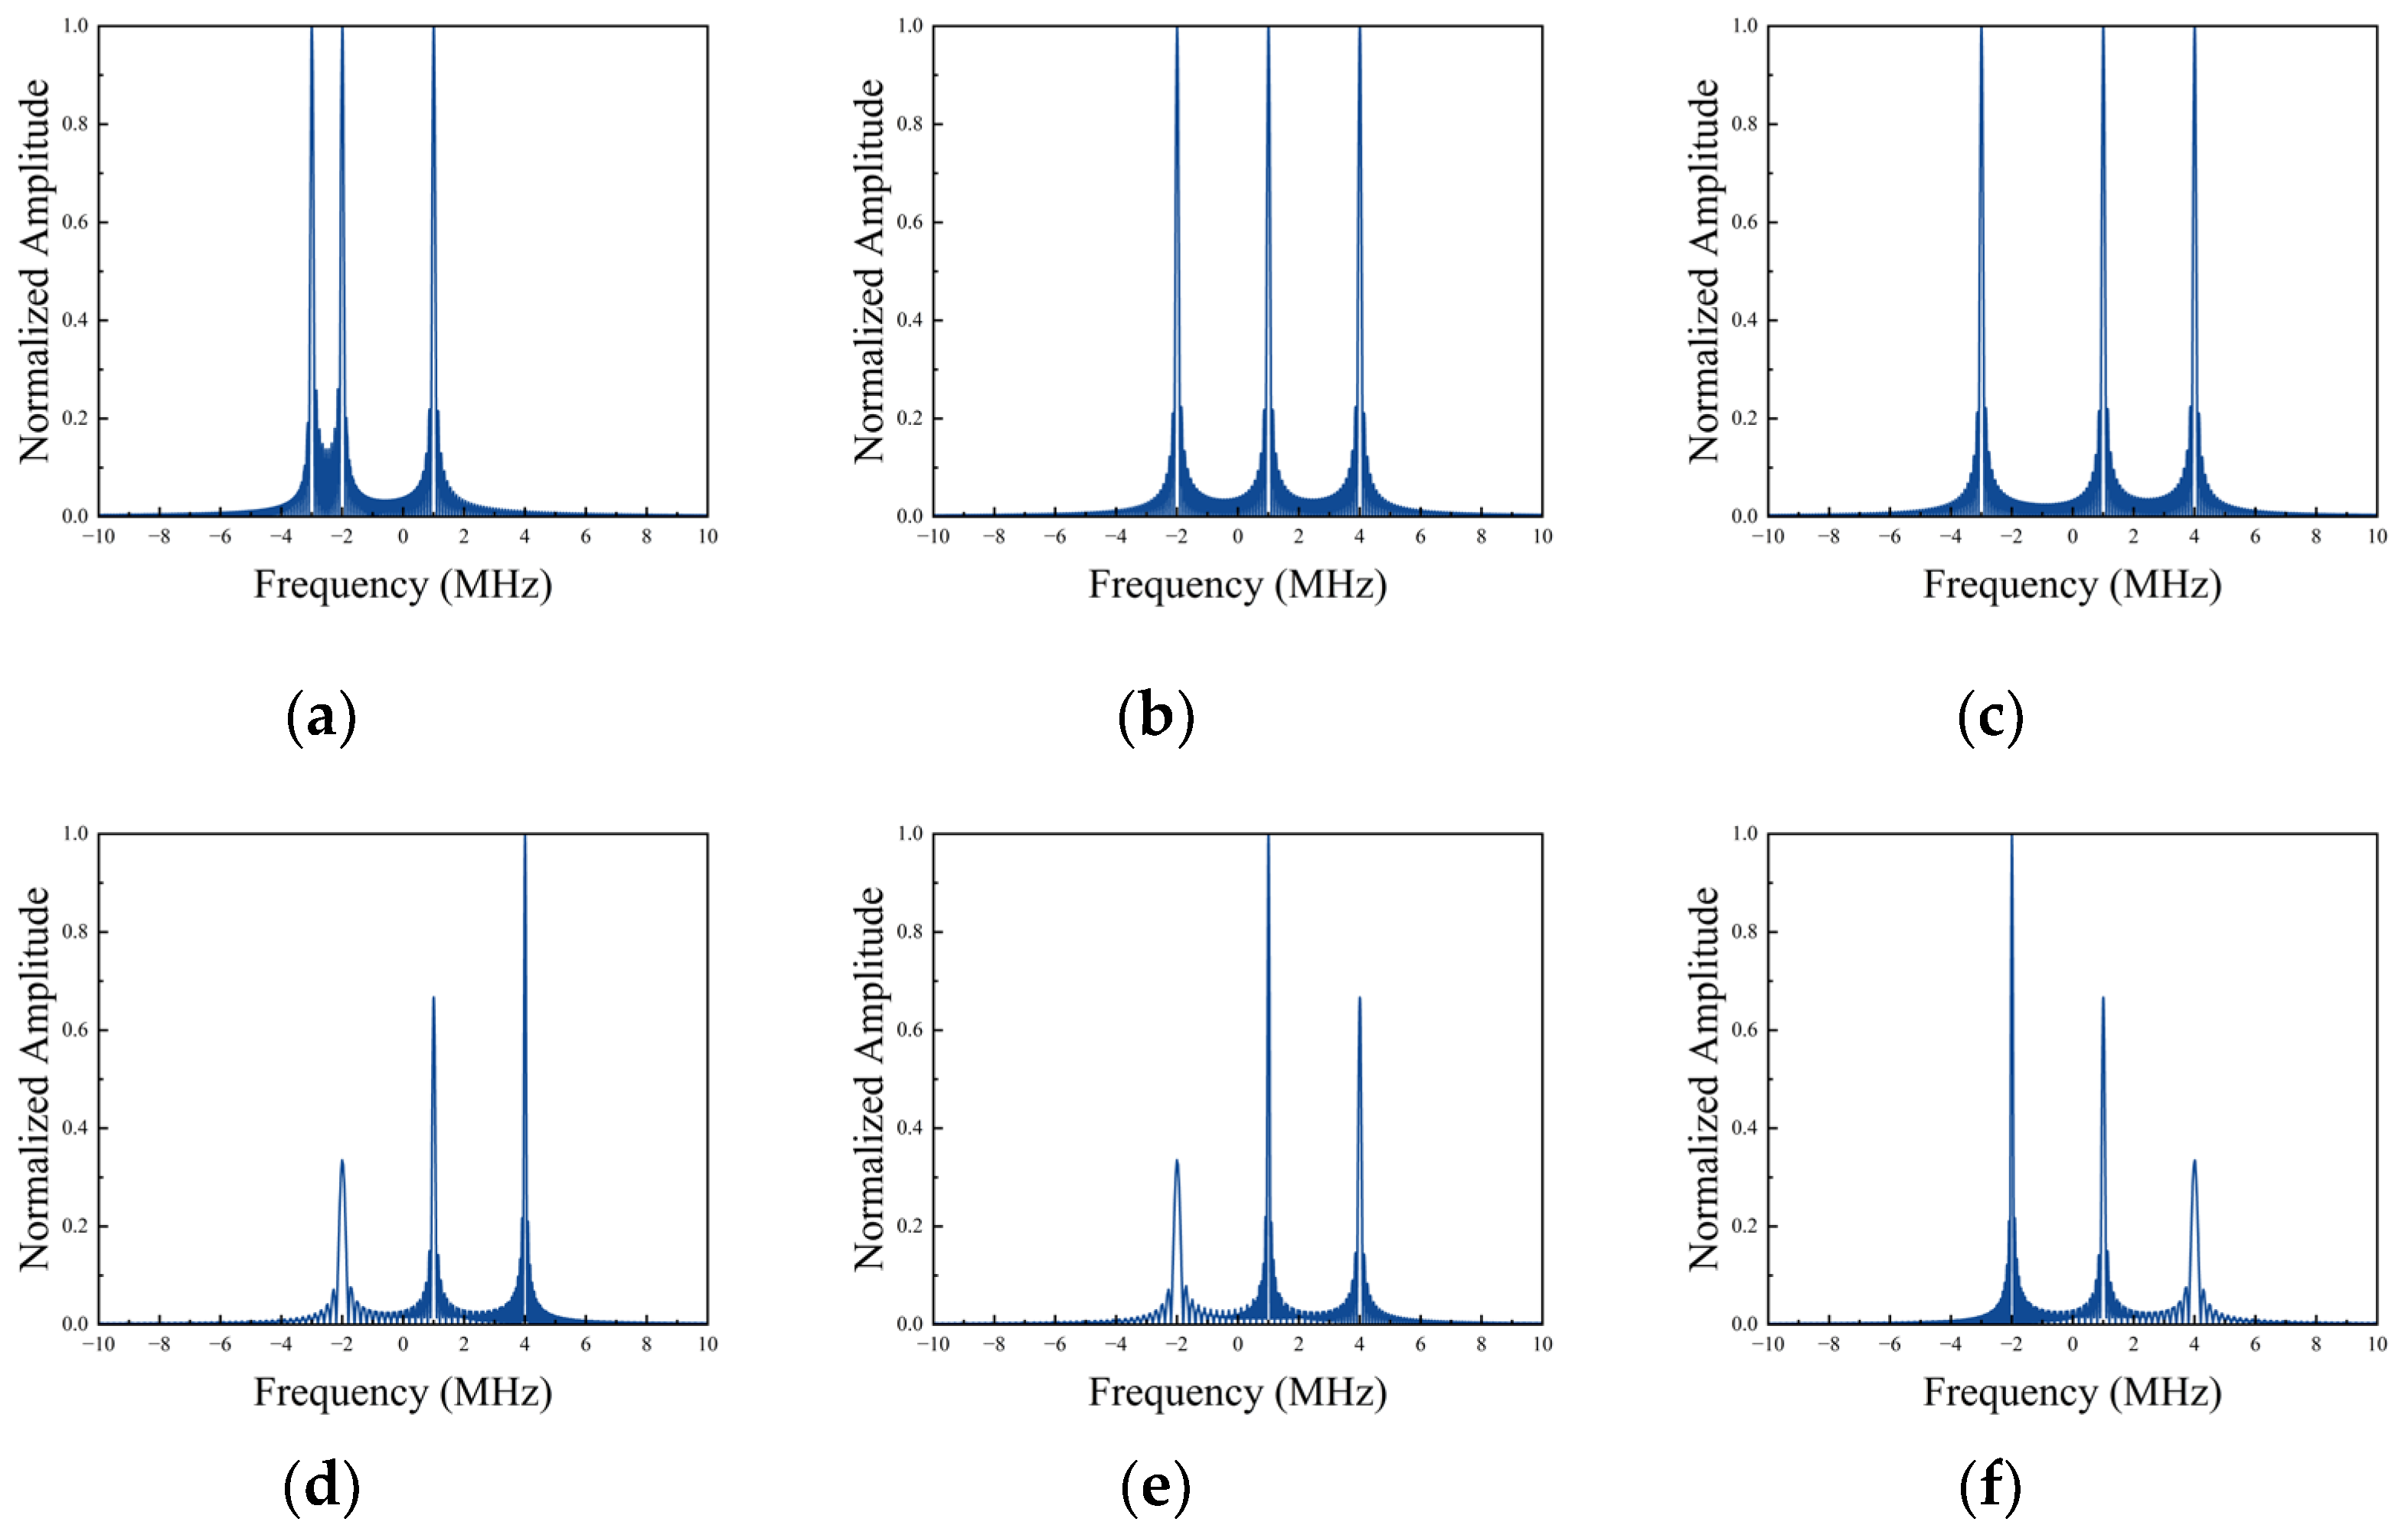
To visually validate the effectiveness of the aforementioned theoretical analysis, this paper designed two sets of simulation experiments to verify the effects of modulation frequency and modulation duration on the modulation signal waveform and spectral distribution. With a fixed number of segments, K = 3 and total modulation time T = 30 μ s , Figure 5a–c present results for a modulation duration ratio of 1:1:1 and a modulation frequency of f k 2 , 3 , 1 , 4 MHz . More densely packed waveforms indicate higher modulation frequencies. The spectral distribution plots in the right column clearly show three distinct Sinc main peaks emerging in the spectrum. The frequency positions of these main peaks correspond one-to-one with the set modulation frequency parameters. Figure 5d–f analyze results with modulation frequency f k = 2 , 1 , 4 MHz and modulation duration ratios 1:2:3, 1:3:2, and 3:2:1, respectively. The right-hand spectral distribution plots reveal that the frequencies of the three spectral peaks remain constant, while their normalized amplitudes are proportional to the set duration ratios. This demonstrates that by adjusting the segmented modulation duration, the relative amplitudes of each frequency component can be flexibly modified without altering their frequency positions.

4. SAR Feature Reconstruction Method Based on Variable-Frequency Phase Modulation Model

This section combines the variable frequency phase-modulation model with fundamental SAR imaging theory to derive the mathematical expression for SAR images under this model. It analyzes the influence of different modulation parameters on the position and amplitude of generated electromagnetic scattering centers. Subsequently, based on the position and energy requirements of complex target scattering points, it derives the modulation parameters of the modulation array to achieve an electromagnetic scattering center generation method based on the variable frequency phase-modulation model.

4.1. Variable Frequency Phase-Modulated Echo and SAR Imaging

Taking the operation mode of a side-looking strip SAR system as an example, the airborne platform flies at a constant speed along a predetermined track and transmits a large-time-width LFM signal with a fixed pulse-repetition frequency toward the side-down direction. The transmitted LFM signal can be expressed as:
s i t ^ = rect t ^ T p exp j 2 π f c t ^ + 1 2 k r t ^ 2 ,
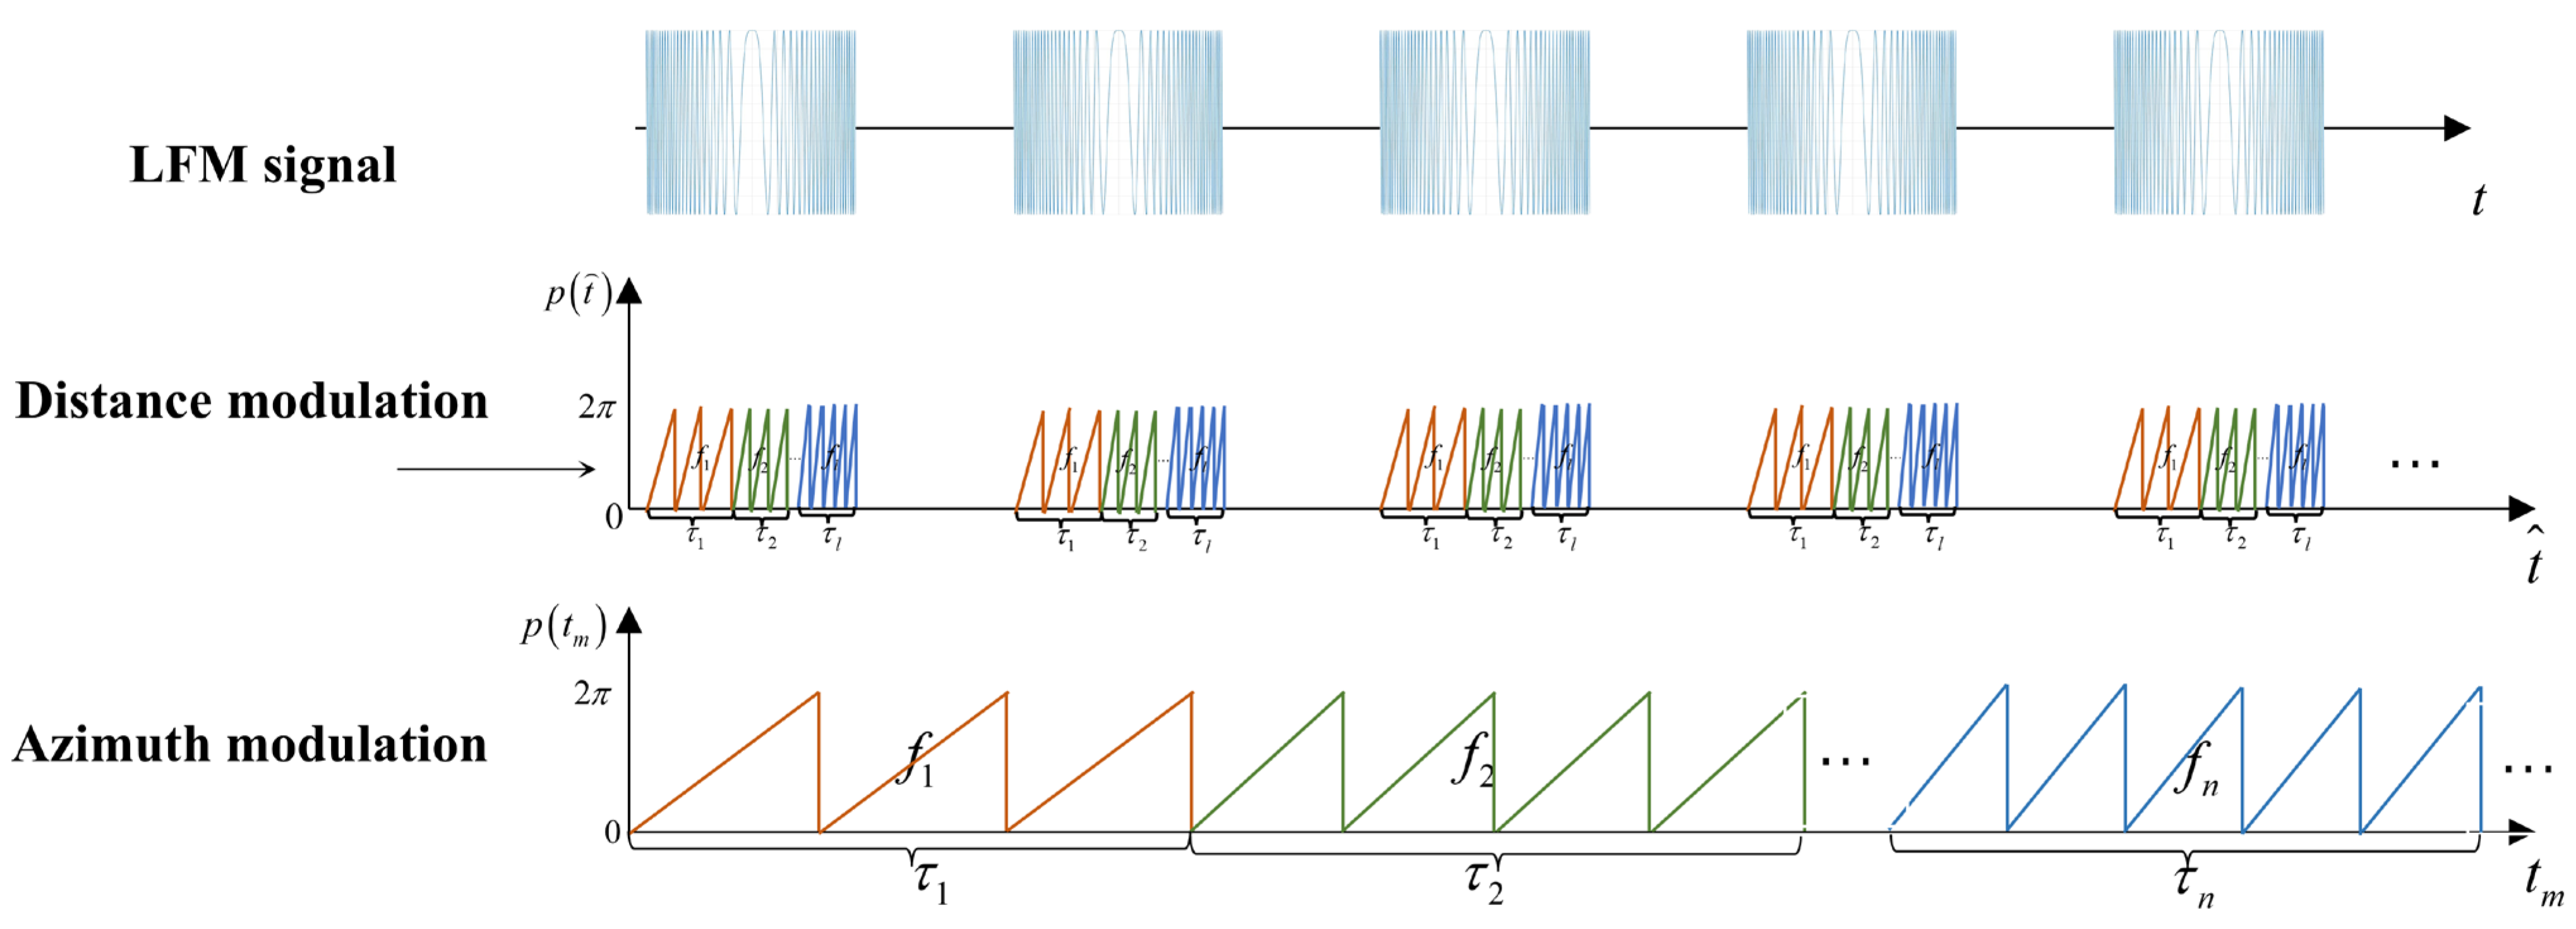
t ^ represents the fast time axis, f c is the signal carrier frequency, Tp is the signal pulse width, k r = B / T p denotes the distance-modulated frequency, and B indicates the signal bandwidth. To manipulate the two-dimensional position and relative amplitude of each scatterer point on the SAR image, the frequency-time modulation model requires designing time-domain modulation schemes across different modulation frequencies and modulation durations on fast and slow timescales. As shown in Figure 6, the intra-pulse modulation signal is divided into L segments within the time interval Tp, while the inter-pulse modulation signal is divided into N segments within the synthetic aperture time Ta. The modulation signal can be expressed as:
p 1 t ^ = l = 1 L r e c t ( t ^ t l τ l ) exp ( j 2 π f l ( t ^ t l ) ) ,
p 2 t m = n = 1 N r e c t ( t m t n τ n ) exp ( j 2 π f n ( t m t n ) ) ,
The radar echo reflected by a time-modulated metasurface can be regarded as the result of the time-domain convolution between the LFM signal transmitted by the radar and a segmented frequency-modulated phase-modulated signal, namely:
s r t ^ , t m = s i t ^ τ ( t m ) p 1 t ^ p 2 t m ,
Here, τ ( t m ) = 2 R t m / c denotes the two-way delay time between the radar and the metasurface. Assuming the platform’s initial coordinates are ( 0 , 0 , H ) and its velocity is V, with the target coordinates being ( x i , y i , 0 ) , the instantaneous slant range between the target and the platform can be approximated as a binomial expansion using Taylor series expansion under small slant angles:
R ( t m ) = x i 2 + ( V t m y i ) 2 + H 2 R 0 + V 2 2 R 0 t m 2 ,
After receiving the radar echo, the radar receiver performs mixing and de-carrier processing to obtain the modulated baseband echo signal, which is expressed as:
s j t ^ , t m = rect t ^ τ ( t m ) T p r e c t t m T a exp j π k r ( t ^ τ ( t m ) ) 2 · exp j 4 π λ R t m p 1 t ^ p 2 t m ,
After performing a fast Fourier transform on the fast-time signal and multiplying it by the frequency-domain expression of the matched filter function, the frequency-domain expression of the distance-compressed signal is obtained as
S r c ( f r , t m ) = l = 1 L r e c t ( f r f l k r t l B l ) exp ( j π 1 k r ( f l + k r t l ) 2 ) · exp ( j 2 π f r f l k r ) exp j 4 π λ R t m exp j 2 π f r τ ( t m ) p 2 t m ,
Here, B l = k r τ l denotes the bandwidth of the lth modulation. Since platform movement causes distance unit drift, correction is required. The frequency domain signal after distance drift correction can be expressed as:
S r c m c f r , f a = l = 1 L r e c t ( f r f l k r t l B l ) exp ( j π 1 k r ( f l + k r t l ) 2 ) · exp ( j 2 π f r f l k r ) exp j 4 π λ R t m exp ( j 4 π f r c R 0 ) ,
Similarly, after performing matching filter processing on the azimuth component, the frequency-domain expression of the compressed azimuth component of the modulated signal is obtained as:
S a c ( f r , f a ) = l = 1 L r e c t ( f r f l k r t l B l ) exp ( j π 1 k r ( f l + k r t l ) 2 ) n = 1 N r e c t ( f a f n + k a t n B n ) exp ( j π 1 k a ( f n + k a t n ) 2 ) exp ( j 2 π f r f l k r ) exp ( j 2 π f a f n k a ) exp ( j 4 π f r c R 0 ) ,
k a = 2 V 2 / λ R 0 represents the phase-modulation frequency, where B n = k a τ n denotes the bandwidth of the nth modulation. Performing a two-dimensional inverse Fourier transform on the fast time axis t ^ and slow time axis t m , the resulting SAR image can be expressed as:
I r e c o n ( x , y ) = l = 1 L n = 1 N A ( l , n ) sin c 2 B l c x R 0 + c f l 2 k r · sin c B n V y y i V f n k a ,
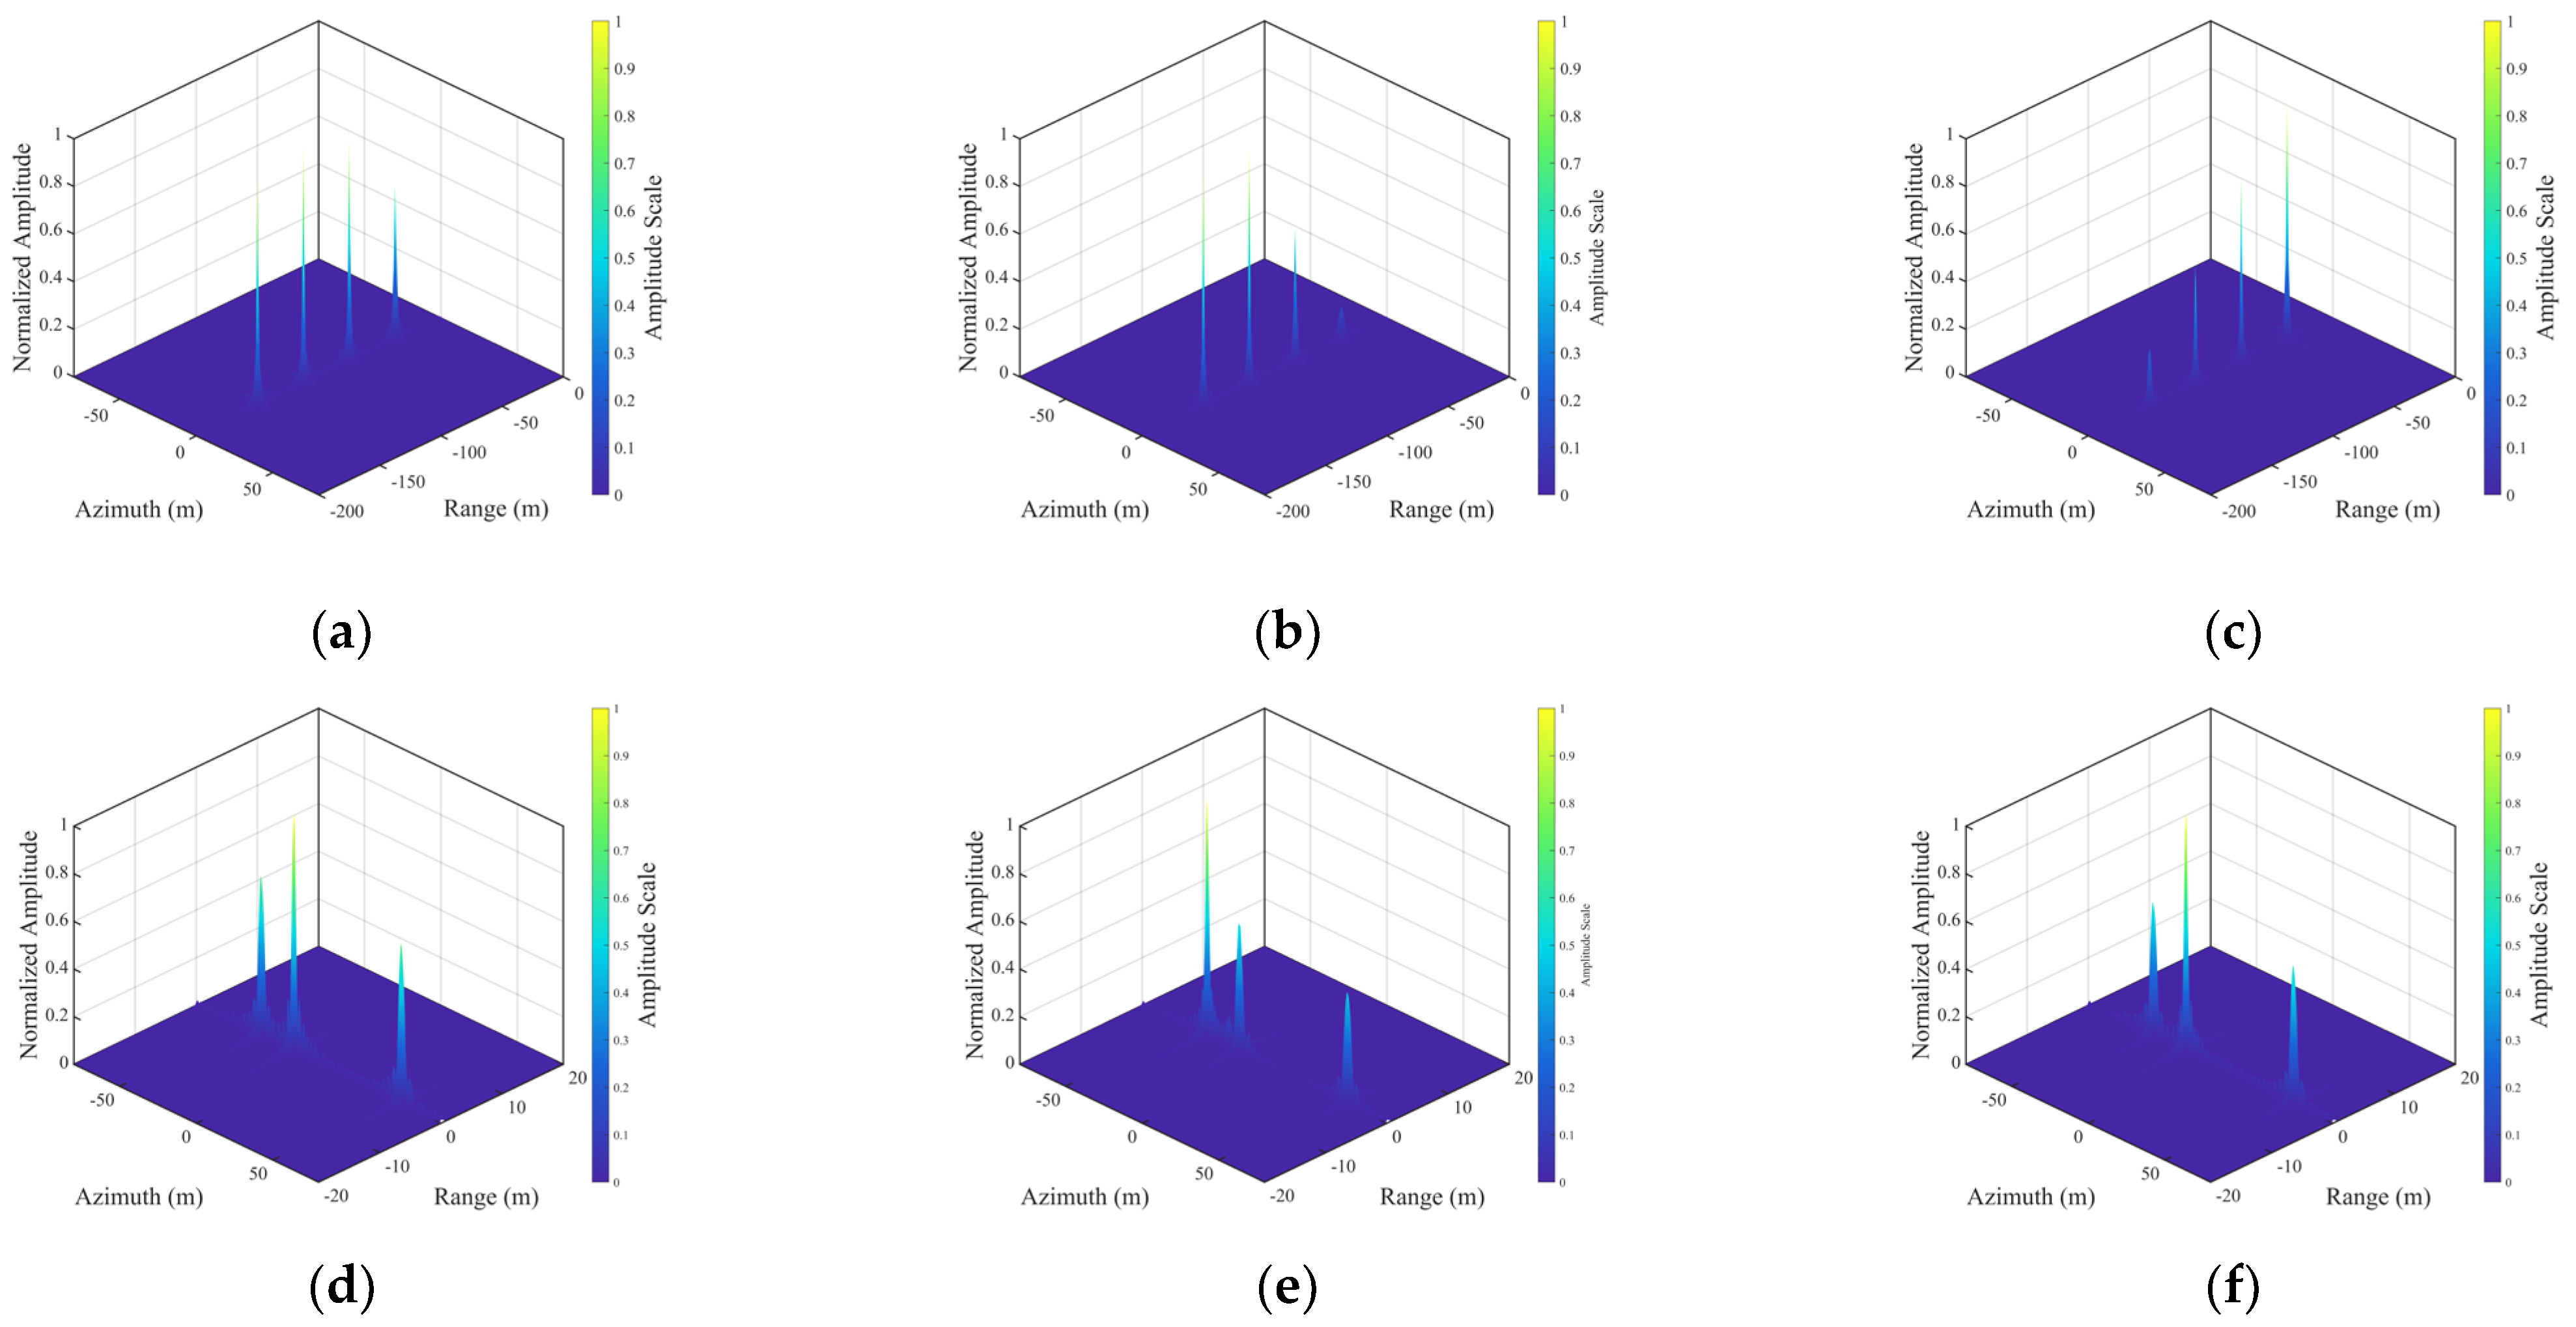
A ( l , n ) = B l B n exp ( j 2 π ( f l + k r t l ) ) exp ( j 2 π ( f n + k a t n ) ) . After segmented frequency modulation, the original single metasurface splits into an L*N scattering point array in the final SAR image. The in-pulse modulation frequency determines the distance displacement of scattering points (Equation (15)), while the inter-pulse modulation frequency determines the azimuthal displacement of the scatterer points (Equation (16)). Each scatterer point manifests as a two-dimensional sinc function in the image, with its intensity proportional to τ l τ n . The following section conducts simulation experiments on the SAR feature modulation effects of three modulation patterns: intra-pulse modulation, inter-pulse modulation, and two-dimensional combined modulation. Experimental parameters are set as follows: platform altitude 2000 m, flight velocity 300 m/s, carrier frequency 10 GHz, pulse width 5 µs, bandwidth 500 MHz, and pulse-repetition frequency 1200 Hz. The metasurface target is positioned at (0, 0). Sets of intra-pulse modulation frequencies and modulation durations are defined, with a total modulation duration of Tp. The values of modulation frequency and duration satisfy Equation (17). As shown in Figure 7, when the modulation frequency f l   >   0 , the scattering point position moves along the distance axis in the negative direction relative to the metasurface position. The generated scattering centers are distributed along the distance axis, with the number of scattering points determined by the number of intra-pulse modulation segments. The distance-axis displacement calculated by Equation (15) is essentially consistent with the displacement of the distance-axis profile. The normalized amplitude ratio of the scattering points is essentially proportional to the distance-axis modulation duration. B a = 300 H z , T a = 0.2693 s set the inter-pulse modulation frequency set and modulation duration set, with the total modulation duration being B. The values of modulation frequency and modulation duration satisfy Equation (18). When the modulation frequency f n   >   0 , the scattering point position moves positively along the azimuth direction relative to the metasurface position; when the modulation frequency f n   <   0 , the scattering point position moves negatively along the azimuth direction relative to the metasurface position. The generated scattering points are distributed in the azimuthal direction. The number of scattering points is determined by the number of inter-pulse modulation segments. The azimuthal displacement calculated by Equation (16) is essentially consistent with the displacement of the azimuthal profile. The normalized amplitude ratio of the scattering points is roughly proportional to the azimuthal modulation duration.
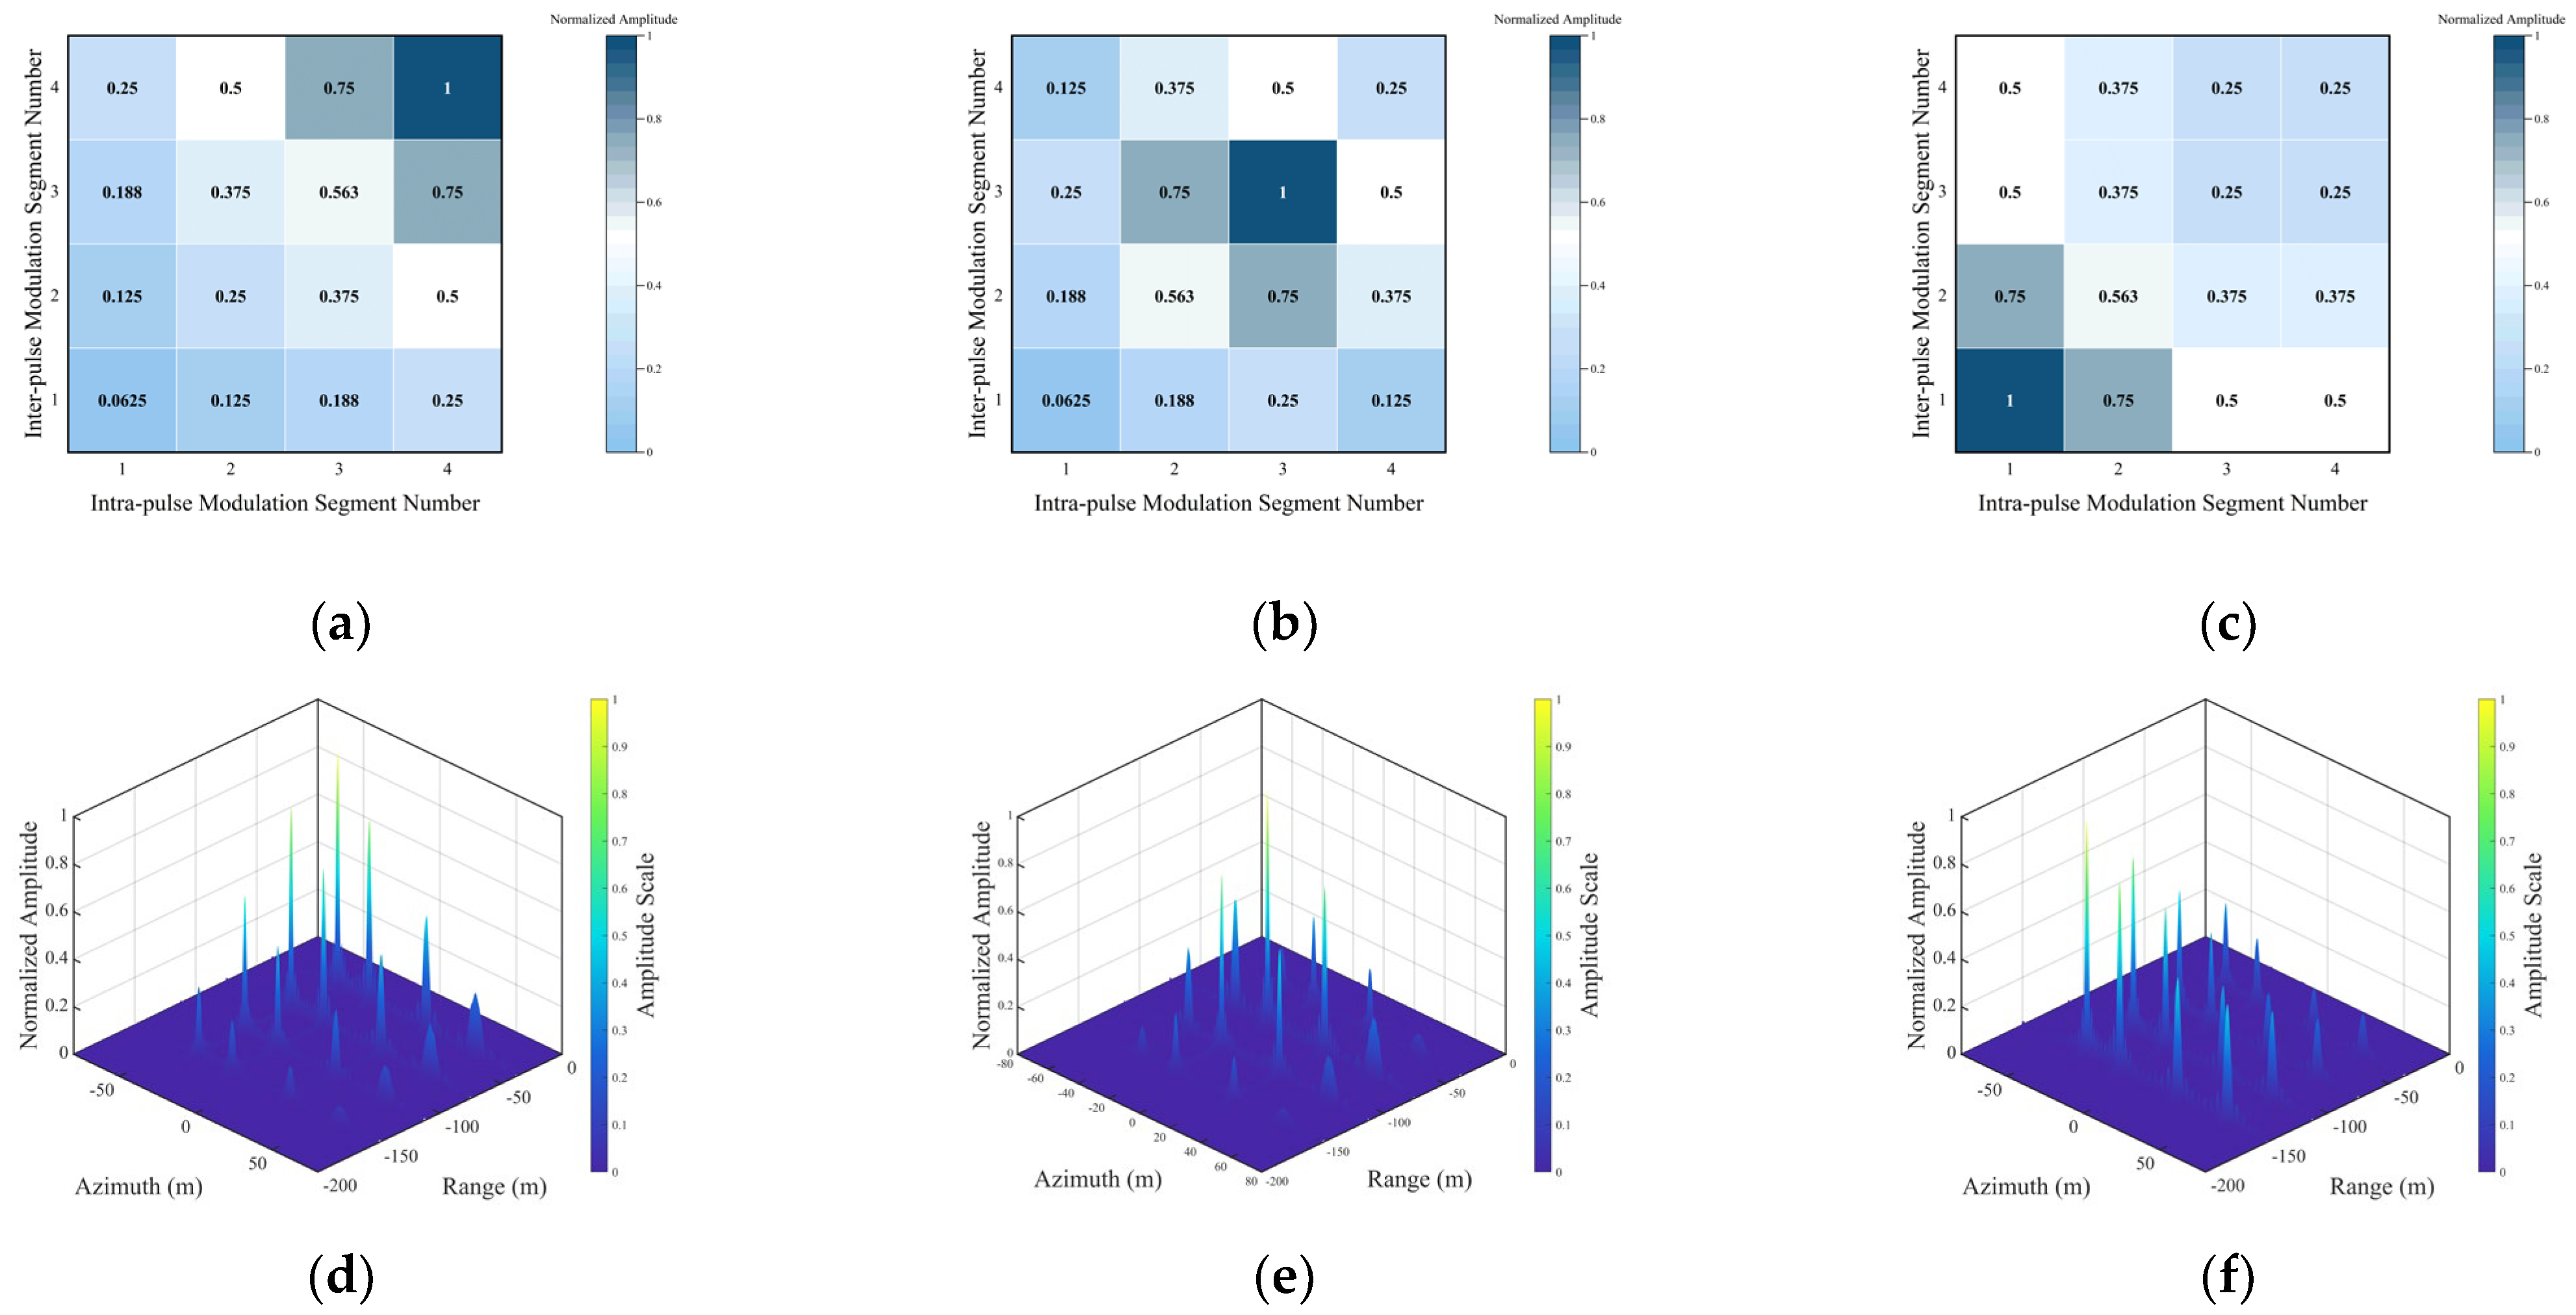
The following describes the combined intra-pulse and inter-pulse modulation, as shown in Figure 8. With fixed modulation frequencies f l = [ 100 , 75 , 50 , 25 ] MHz and f n = [ 140 , 60 , 80 , 200 ] Hz , according to Equations (15) and (16), intra-pulse modulation generates false targets at distances (−150 m, −112.5 m, −75 m, −37.5 m), while inter-pulse modulation generates scatter points at azimuths (−37.7 m, −16.2 m, 21.5 m, 53.8 m). Under combined modulation, 16 scatter points were generated after RD algorithm imaging, with L*N = 16, consistent with theory. These 16 scatterers were numbered bottom-to-top and left-to-right. Modulation duration ratios of 1:2:3:4, 1:3:4:2, and 4:3:2:2 were applied for both intra-pulse and inter-pulse modulation. Observing Figure 8d–f, the actual peak amplitudes of each scatterer generally align with the ideal amplitude factor distribution trends shown in Figure 8a–c.

4.2. SAR Feature Reconstruction Method Based on Variable Frequency-Phase Modulation

The scattering center reflects the primary scattering characteristics of radar targets in the high-frequency range. The ideal point scatterer model approximates a real target with large physical dimensions and complex structure as a collection of multiple independent, idealized “point scatterers”. Each point scatterer possesses distinct spatial coordinates, and its own dimensions are considered infinitesimal. According to Reference [34], the SAR image corresponding to the electromagnetic scattering model can be obtained by performing a two-dimensional inverse Fourier transform on the point scatterer model. The image can be represented by a 2D point spread function:
I o r i g ( x , y ) = B a v 2 B r c n = 1 N A n exp ( j 2 k c ( x x n ) ) sin c [ 2 B r c ( x x n ) ] sin c [ B a v ( y y n ) ]
Therefore, reconstructing SAR features for complex targets essentially involves constructing phase-modulated metasurface arrays, dynamically generating modulation strategies, and precisely reconstructing the positions and energy of these scattering points. The number of generated scatter points is jointly determined by the number of segments within pulses (L) and between pulses (N). Comparing Equations (14) and (15), the distance offset and azimuth offset of scatter points relative to the actual hypersurface positions, along with the corresponding amplitude coefficients and their expressions in terms of modulation parameters, are as follows:
f l = 2 k r Δ x c ,
f n = k a Δ y V ,
C l , n = B l B n ,
To ensure all newly generated scatter points remain within the filter’s passband, the sum of the total frequency offset generated by modulation and its own bandwidth must be strictly confined within the system’s effective processing bandwidth requirements. Equations (19) and (20) illustrate the constraint relationship between modulation frequency and modulation duration.
f l + k r ( t l T p 2 ) + k r τ l 2 < B r 2 ,
f n k a ( t n T a 2 ) + k a τ n 2 < B a 2 ,
For the generated two-dimensional scatter points, their resolution is inversely proportional to the modulation duration. This implies that generating scatter points with greater positional displacement necessitates compressing the modulation duration for that segment. While dividing time into excessive fine segments enables multiple scatter points, it reduces the energy accumulation time per point, broadens the main lobe, and blurs the scatter points. The range resolution and azimuth resolution after variable frequency phase modulation can be expressed as:
ρ r = c 2 K r τ l ,
ρ a = v k a τ n ,
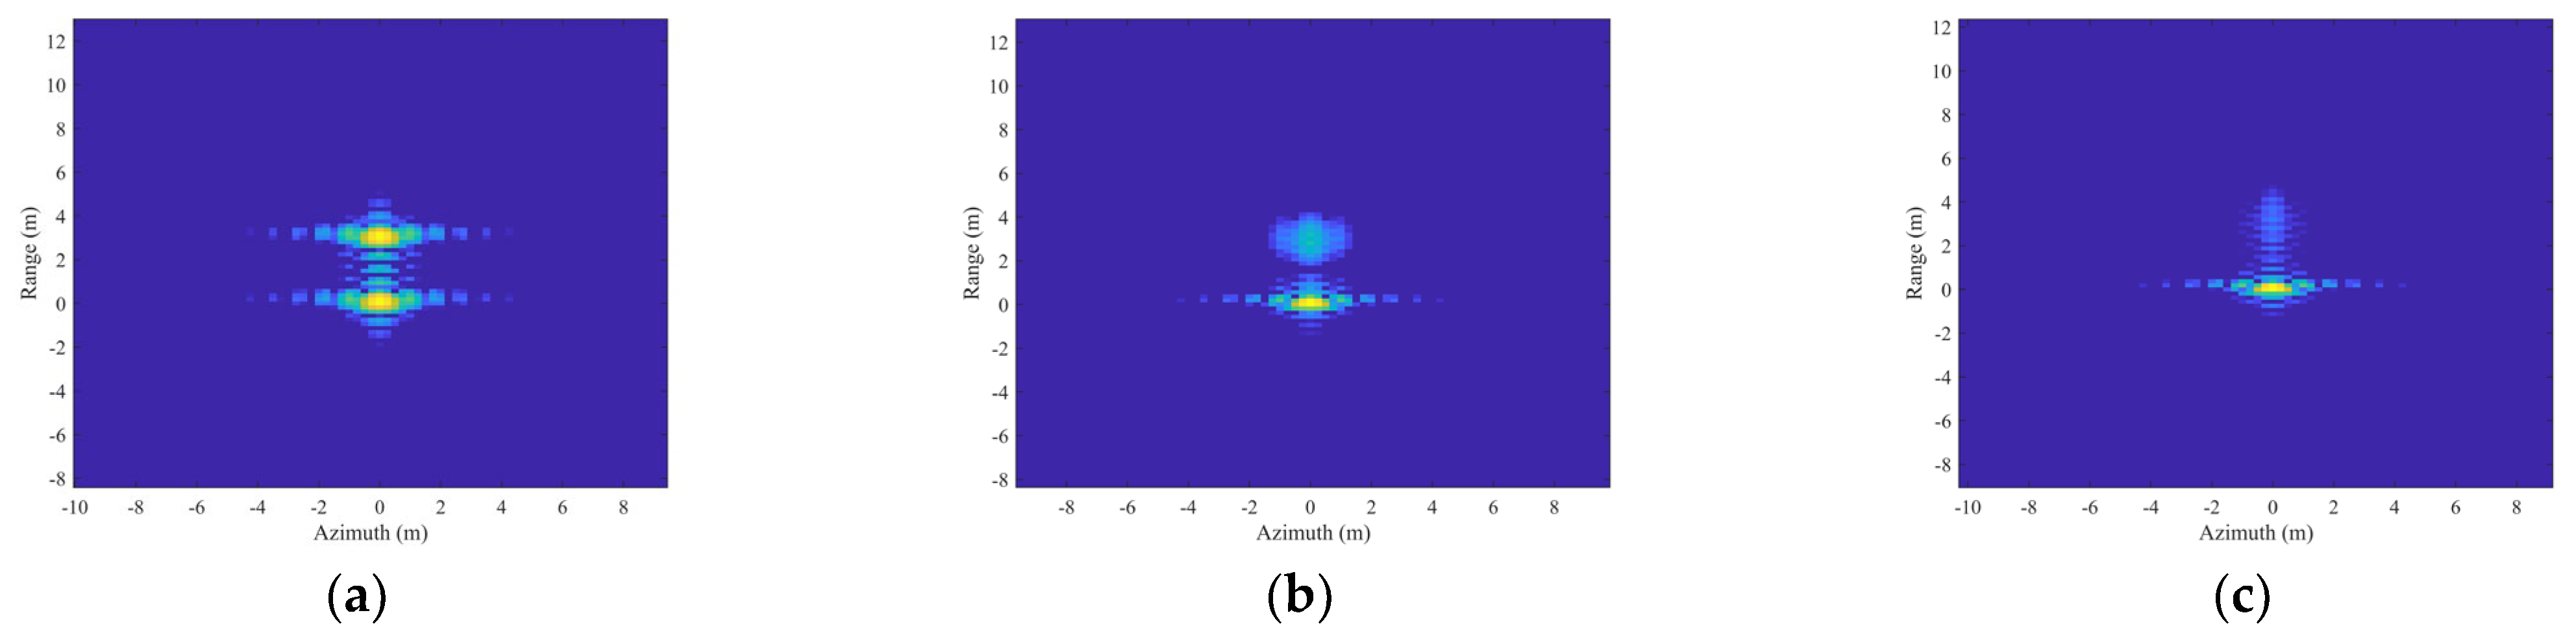
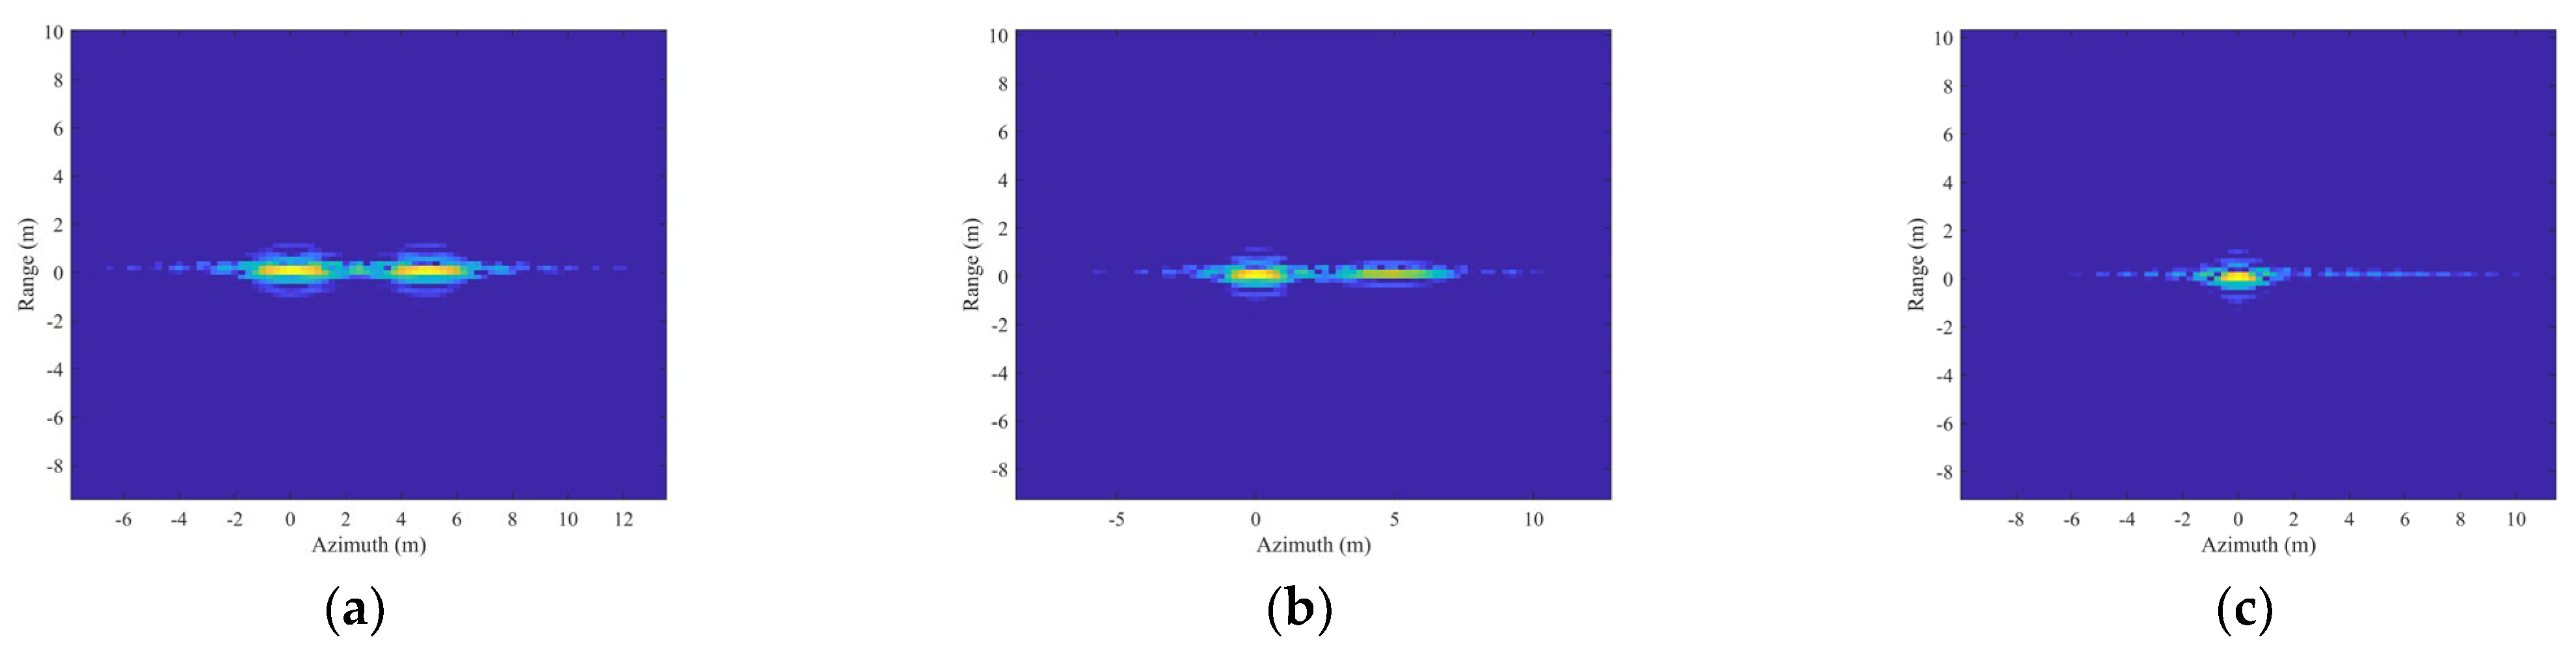
The reconstruction resolution of a single scatterer center is inversely proportional to its allocated modulation duration. When the synthetic aperture time Ta and pulse width Tp are fixed, increasing the number of generated false scatterer centers inevitably shortens the modulation duration of each segment. This reduces the corresponding effective bandwidth, degrades resolution, and diminishes the quality of the generated scatterer centers. The following simulation analysis examines how modulation duration affects the range and azimuth resolution of generated scatter points. Experimental parameters are set as follows: platform altitude 2000 m, flight velocity 300 m/s, carrier frequency 10 GHz, pulse width 5 µs, bandwidth 500 MHz, and pulse repetition frequency 1200 Hz. The metasurface target is positioned at (0, 0). When the modulation frequency is set, the center of the modulated scattering is located at (0, 3), with modulation durations of Tp/2, Tp/5, and Tp/8, respectively. As shown in Figure 9a–c, as the modulation duration τ l decreases, the range resolution of the modulated scattering center deteriorates, gradually becoming defocused.
Set the azimuth direction modulation frequency f n = 18.57 Hz . The center of the modulated scattering is located at (5, 0), with modulation durations of Ta/2, Ta/3, and Ta/8. As shown in Figure 10a–c, as the modulation duration τ n decreases, the azimuth resolution of the modulated scattering center deteriorates and gradually becomes defocused.
Therefore, practical parameter design requires balancing the number of scatter points against their resolution. According to the Nyquist constraint, the analytical expression for the maximum achievable azimuth offset is:
Δ y max = λ R 0 P R F 4 v ,
Based on the principle of energy conservation, distributing the energy from a single metasurface across multiple scattering points inevitably leads to a substantial reduction in energy per generated point. Theoretically, in the frequency-shifted segmented modulation scheme, the equivalent amplitude of the (l,n)th scattering point is proportional to its allocated modulation time. Consequently, its energy is affected by an “energy loss”. Therefore, the energy of the (l,n)th scattered point is proportional to the square of the product of the intra-pulse modulation ratio and the inter-pulse modulation ratio.
Indeed, if the number of segments L and N is excessively large, the reconstructed weak scattering points risk being drowned out by background noise. Therefore, in practical applications, we should effectively increase the scattering energy of the metasurface while avoiding excessive modulation segments in both range and azimuth directions.
To evaluate the similarity of reconstruction targets, a similarity metric as shown in Equation (24) is designed.
S h = α Cos i n e ( I o r i g , I r e c o n ) + ( 1 α ) S S I M ( I o r i g , I r e c o n ) ,
I o r i g  denotes the original SAR image template, I r e c o n denotes the reconstructed SAR image template, and α represents the weighting factor. This metric combines the cosine similarity coefficient with the structural similarity index measure (SSIM), where cosine similarity primarily measures the correlation between the energy variation trends of the two images, while SSIM focuses on evaluating structural similarity across three dimensions—brightness, contrast, and structure—emphasizing the spatial layout, local morphology, and overall contour of reconstructed scatter points. Combining both metrics with equal weighting (α = 0.5) effectively overcomes the limitations of relying on a single indicator. This fusion strategy reflects both energy accuracy and structural similarity. Given the inherently high dynamic range of SAR images, direct calculations on a linear amplitude scale readily obscure weak scatterer features. Therefore, all similarity metrics in this paper are uniformly computed on a logarithmic (dB) scale.
In summary, as shown in Figure 1, the SAR feature modulation method based on the frequency-modulated phase modulation model can be summarized in the following steps:
First, determine the number and spatial relationships of phase-modulated metasurface arrays based on the extracted position and amplitude information of strong scatterers simulating real targets, associating metasurface indices with corresponding generated scatterers.
Second, calculate the relative positions between the hypersurface and real scatterers. Using Equations (16) and (17), infer the intra-pulse and inter-pulse modulation frequencies. Based on the amplitude ratios of real scatterers, determine the segmented modulation durations within and between pulses to generate a two-dimensional modulation signal.
Finally, under identical imaging conditions, the two-dimensional modulated signal is applied to the phase-modulated metasurface for control. The radar platform processes the received echoes and performs imaging to reconstruct the target image. Design similarity metrics are employed to assess the reconstruction quality.

5. Experiments and Results

The method proposed in this paper demonstrates broad adaptability for simulating various types of targets. In this section, two sets of simulation experiments were designed based on actual aircraft measurement data and the MSTAR dataset, respectively, to validate the effectiveness of the SAR feature reconstruction method based on the frequency-modulated continuous phase modulation model.

5.1. Experiment 1

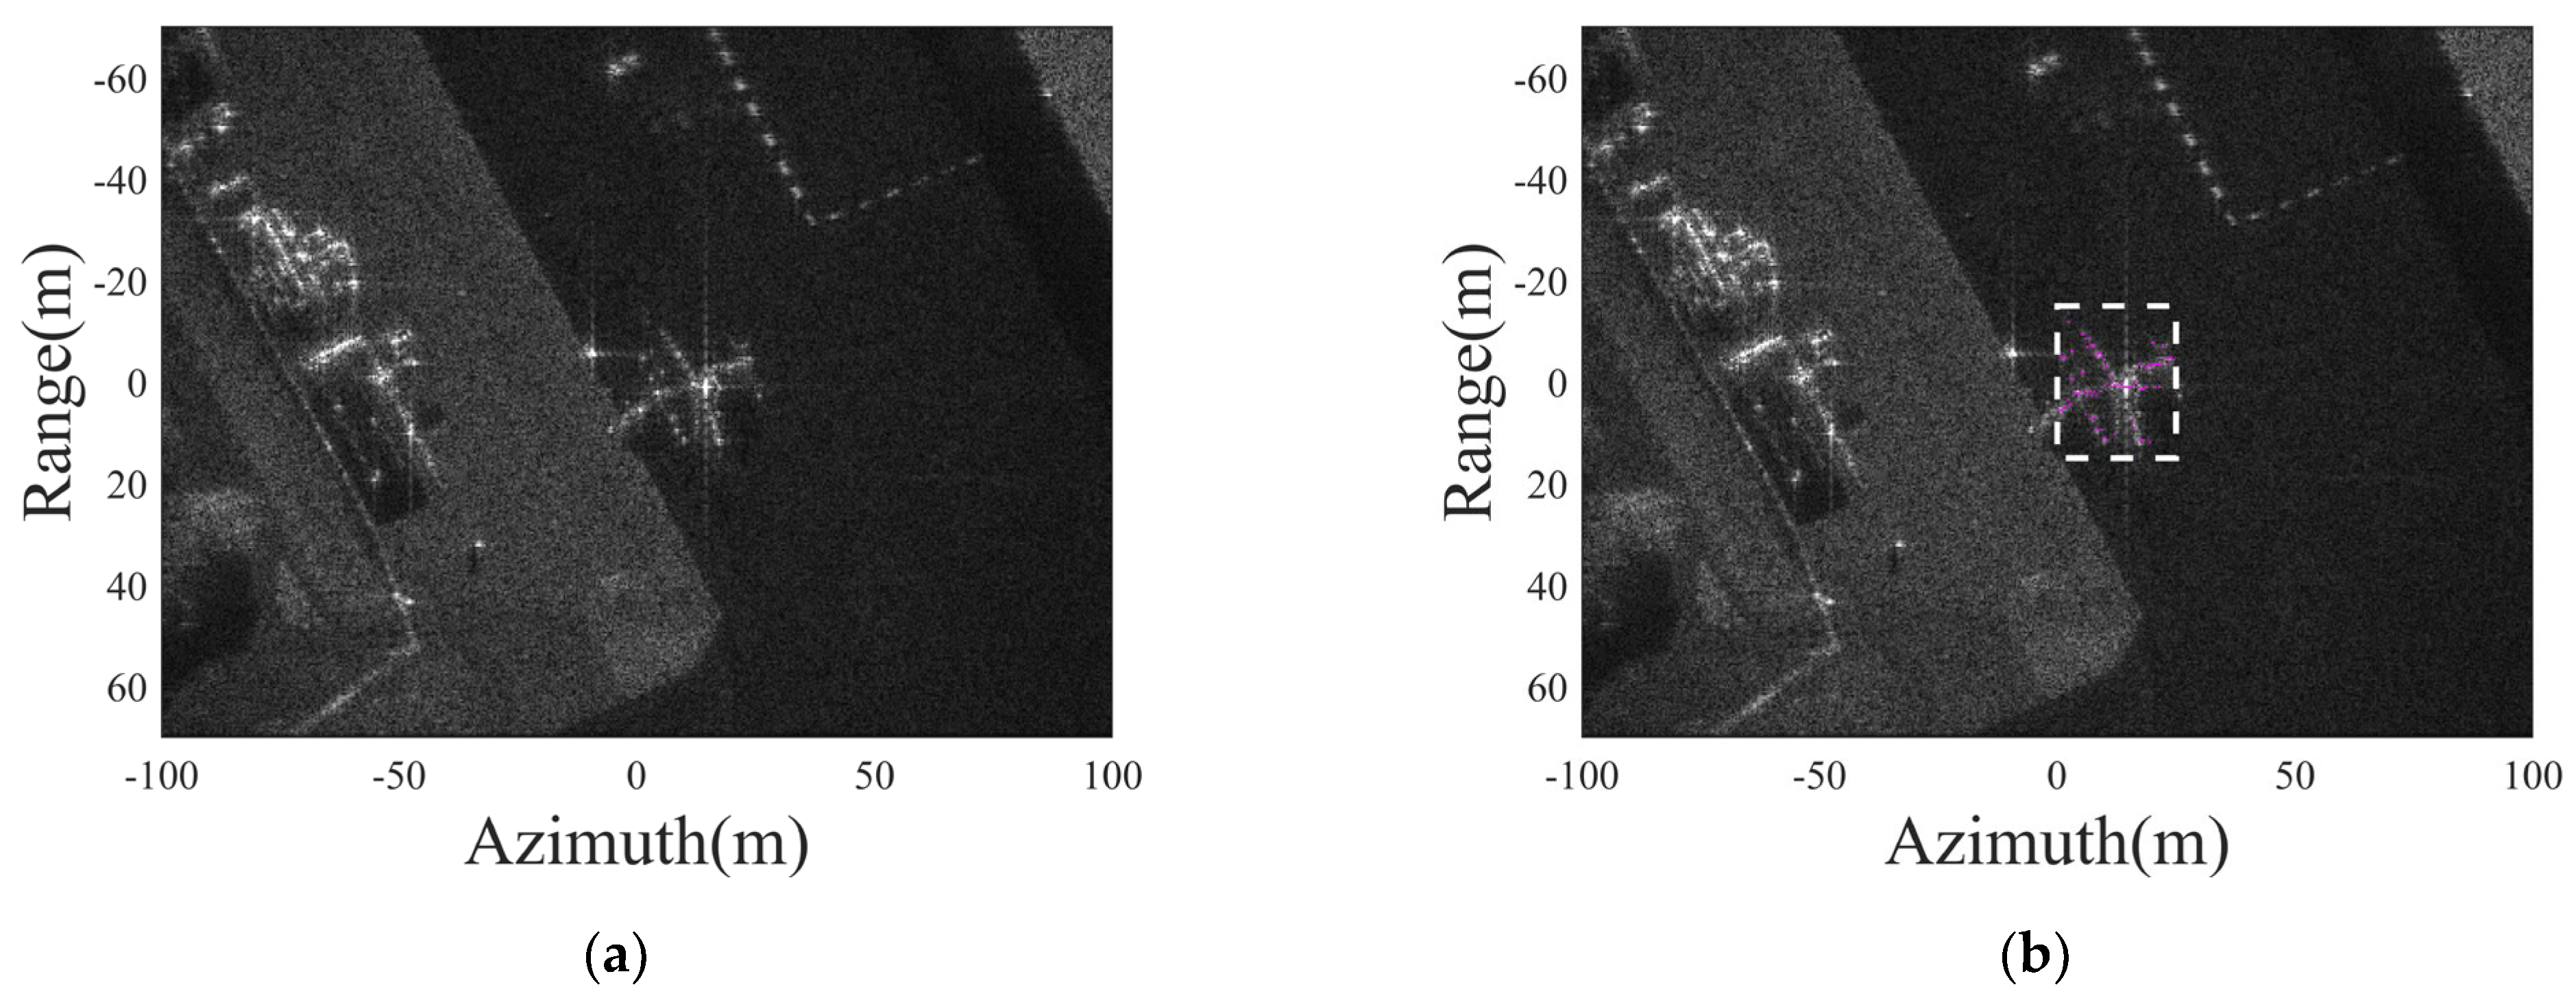
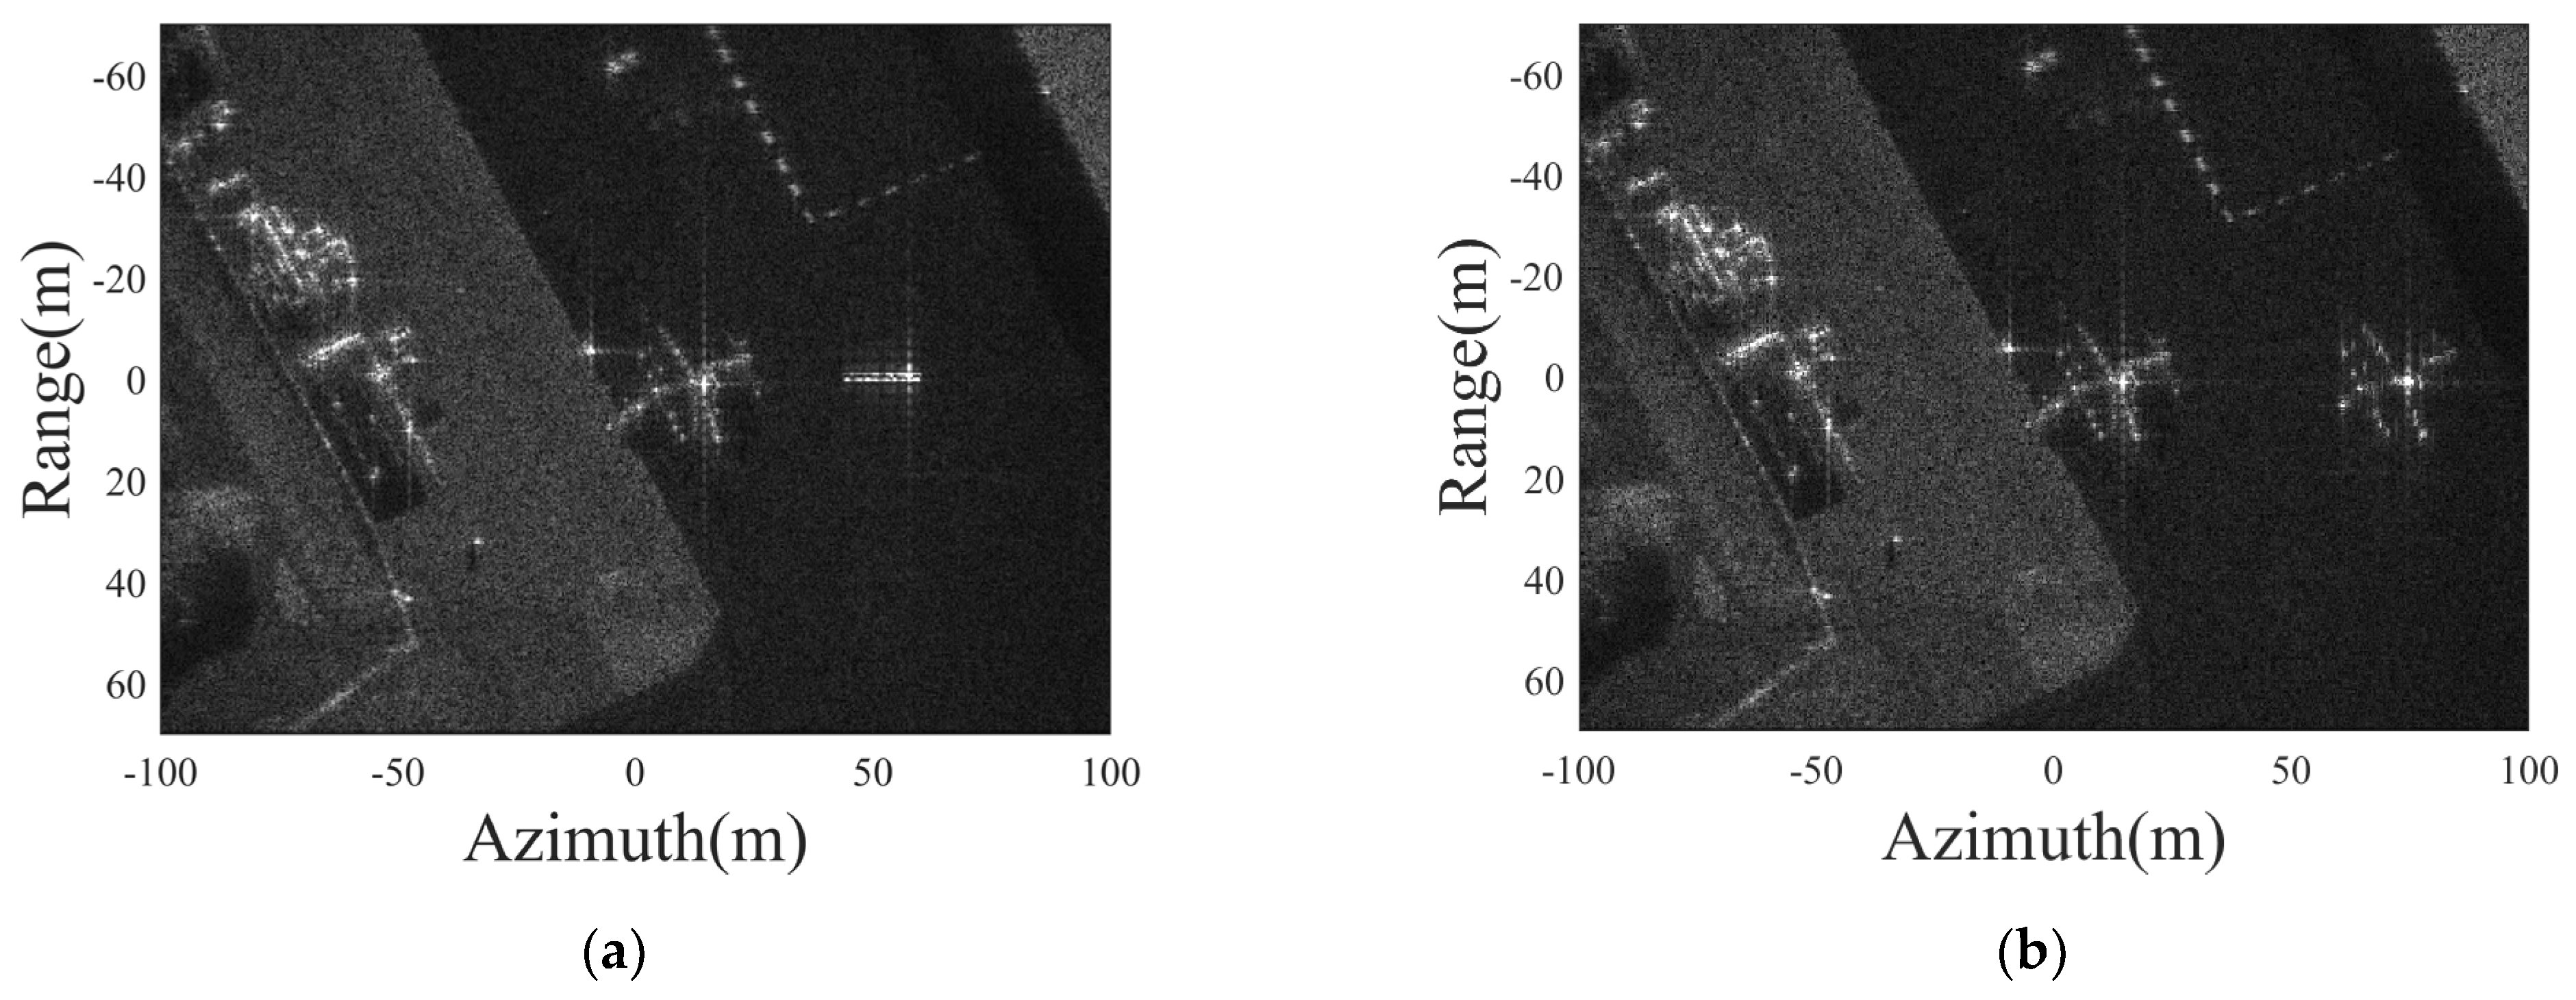
Using SAR measurement data from Sandia National Laboratories in the United States as an example, the radar operates at a carrier frequency of 9 GHz in the scenario. The LFM signal has a bandwidth B = 300 MHz, a frequency modulation rate Kr = 1.5 × 10¹⁴ Hz/s, and a pulse width TP = 2 μs. The azimuth frequency modulation rate Ka = 90 Hz/s, the platform velocity v = 180 m/s, and the scene imaging employs the RD imaging algorithm. An aircraft, serving as the protected target, is positioned at the center of the scene. Its length in the range and azimuth directions is 25 m and 30 m, respectively. The region of interest (ROI) is defined as the range [−15 m, 15 m] and azimuth [0 m, 25 m]. A total of 109 strong scatterers were extracted within this ROI. The raw imaging results and the scatterers extracted from the ROI are shown in Figure 11. Parameters extracted for a subset of these scatterers are listed in Table 1, where x denotes the azimuth component and y denotes the range component.
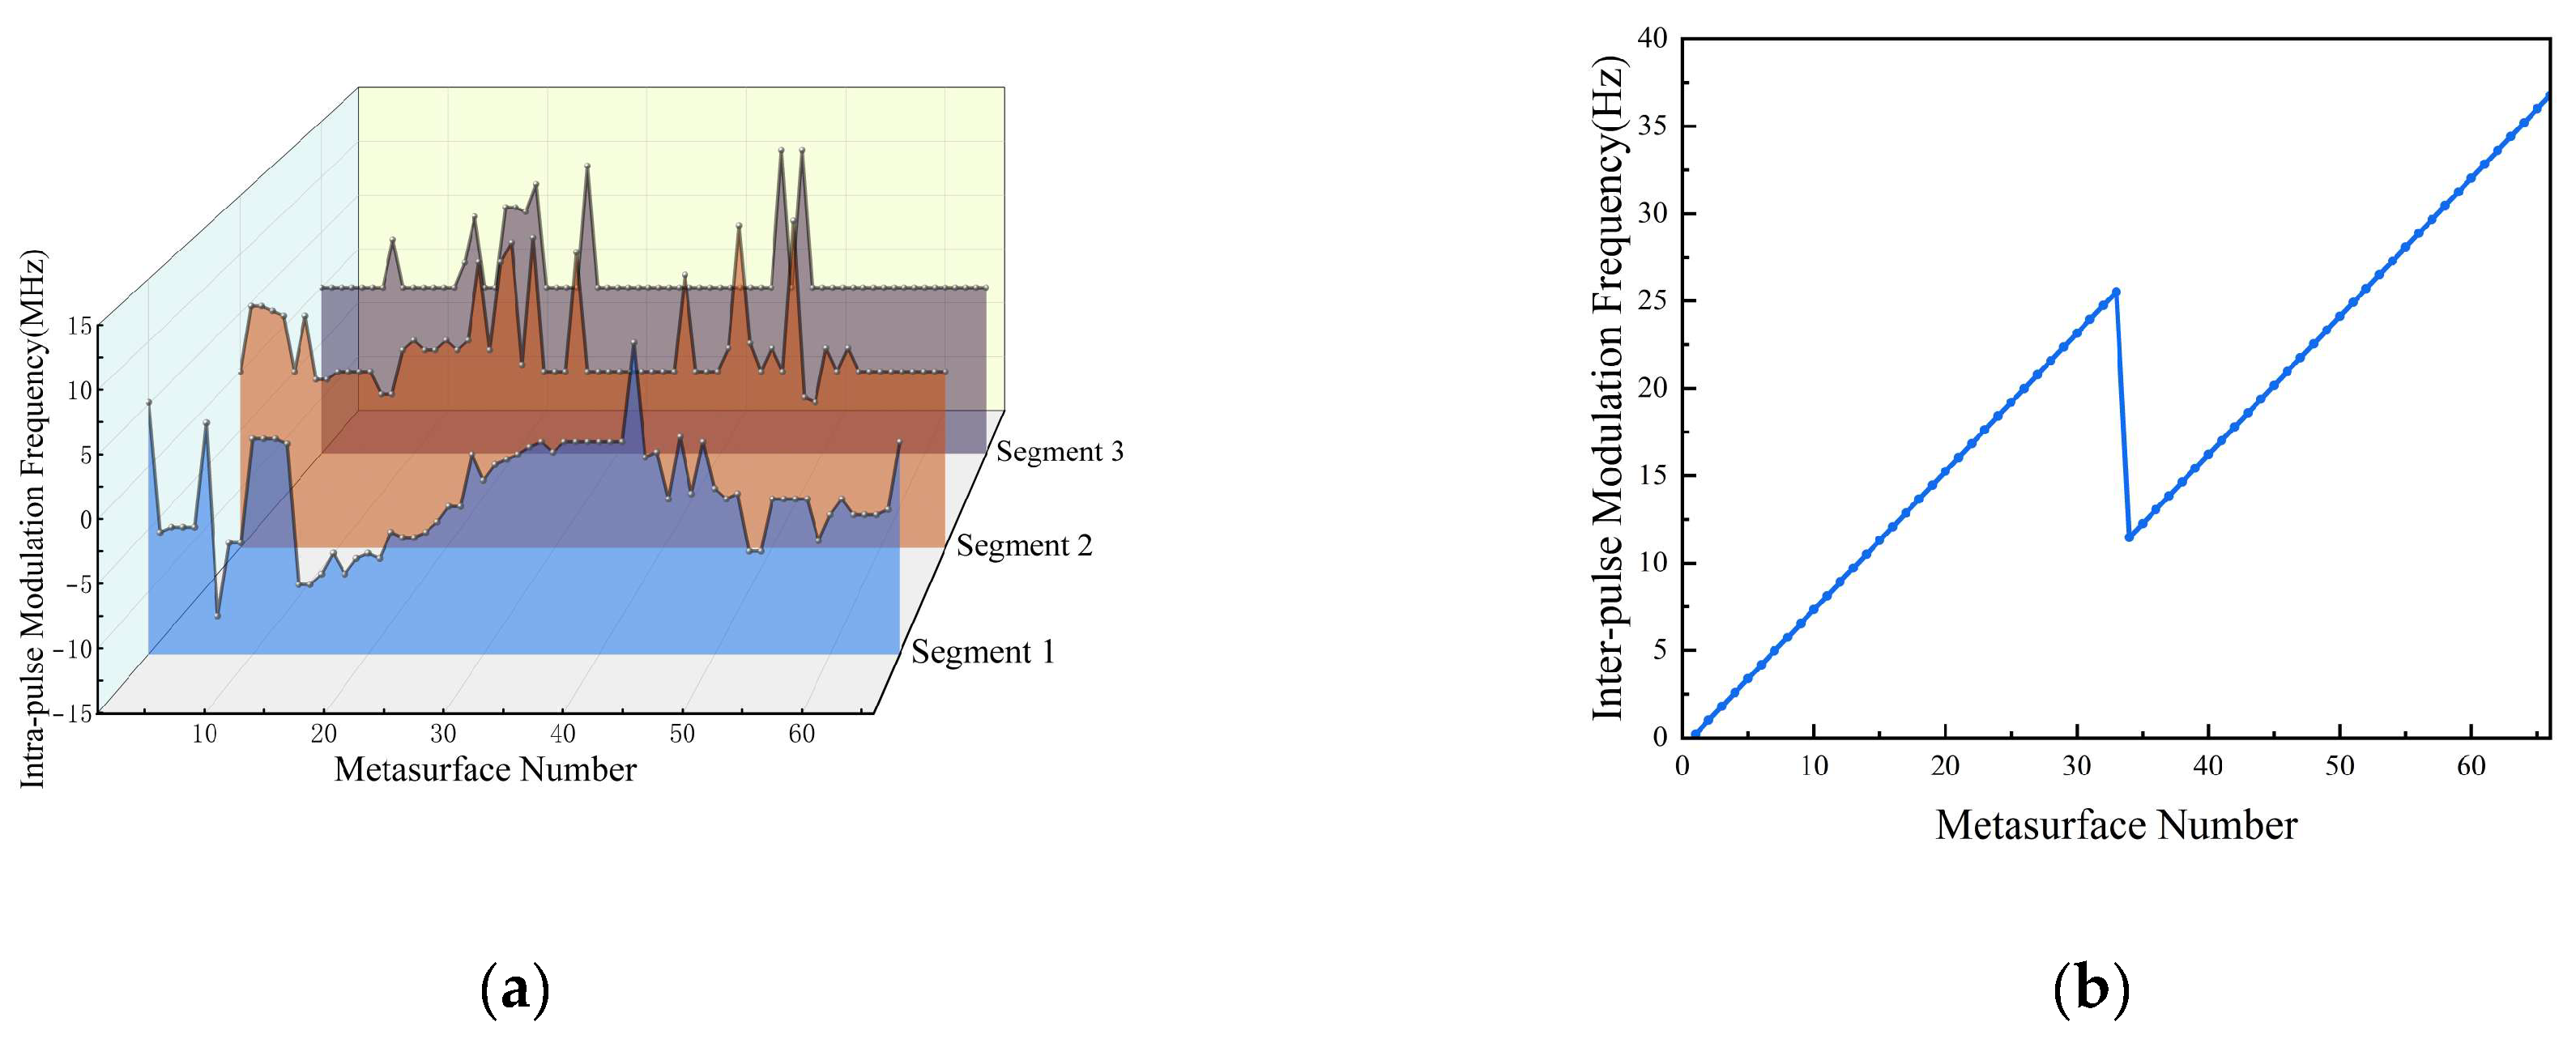
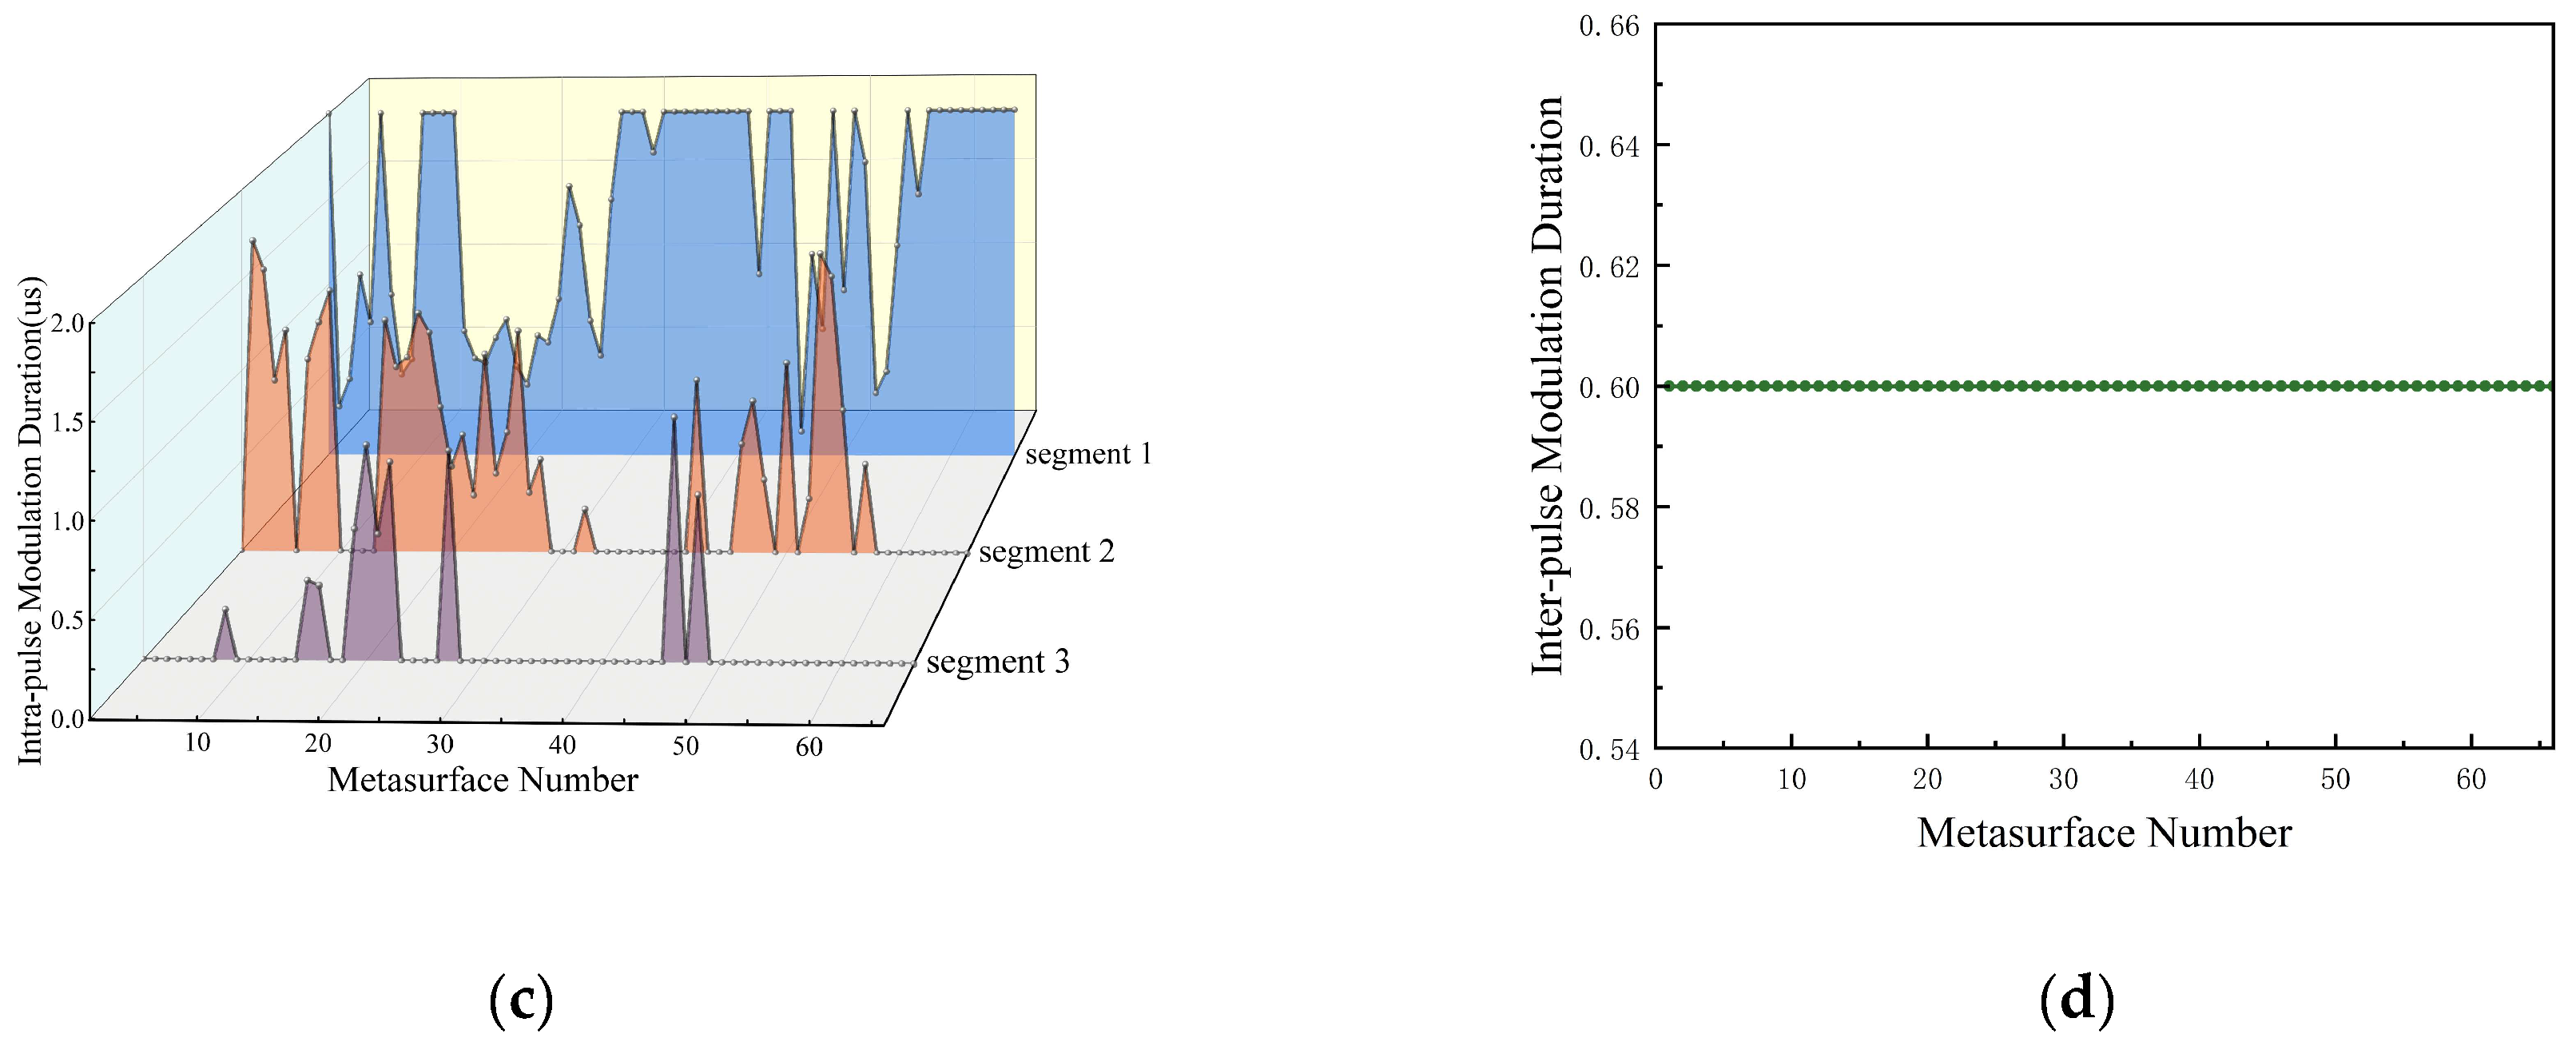
The reconstruction process then commenced. Sixty-six phase-modulated metasurfaces were placed at azimuth 60 m and range 0, arranged in two rows with 0.5 m spacing between each metasurface. Based on the amplitude ratio of extracted strong scatter points and the theoretical formula derived in Section 4, this experimental group allocated intra-pulse modulation time for each metasurface and independently designed intra-pulse and inter-pulse modulation frequencies. The modulation parameters of the metasurfaces are shown in Figure 12. Since this experiment did not employ interpulse segmentation, the interpulse modulation duration was uniformly set to T a . The pre-modulation and modulated reconstructed aircraft images of the metasurface array after RD imaging are depicted in Figure 13. From the elevation perspective, the extracted scatterers are located to the right of the metasurface placement positions, indicating that f n should be negative, consistent with simulation results. The sign of f l relates to the relative position of the scatterer along the range axis. If the scatterer moves toward the hypersurface along the range axis, f l < 0; if the scattering point moves toward the super surface in the distance direction, f l > 0. Substituting the experimental data yields a similarity of 0.9299 between the reconstructed aircraft target and the original target, indicating strong correlation between the reconstructed and original images.

5.2. Experiment 2

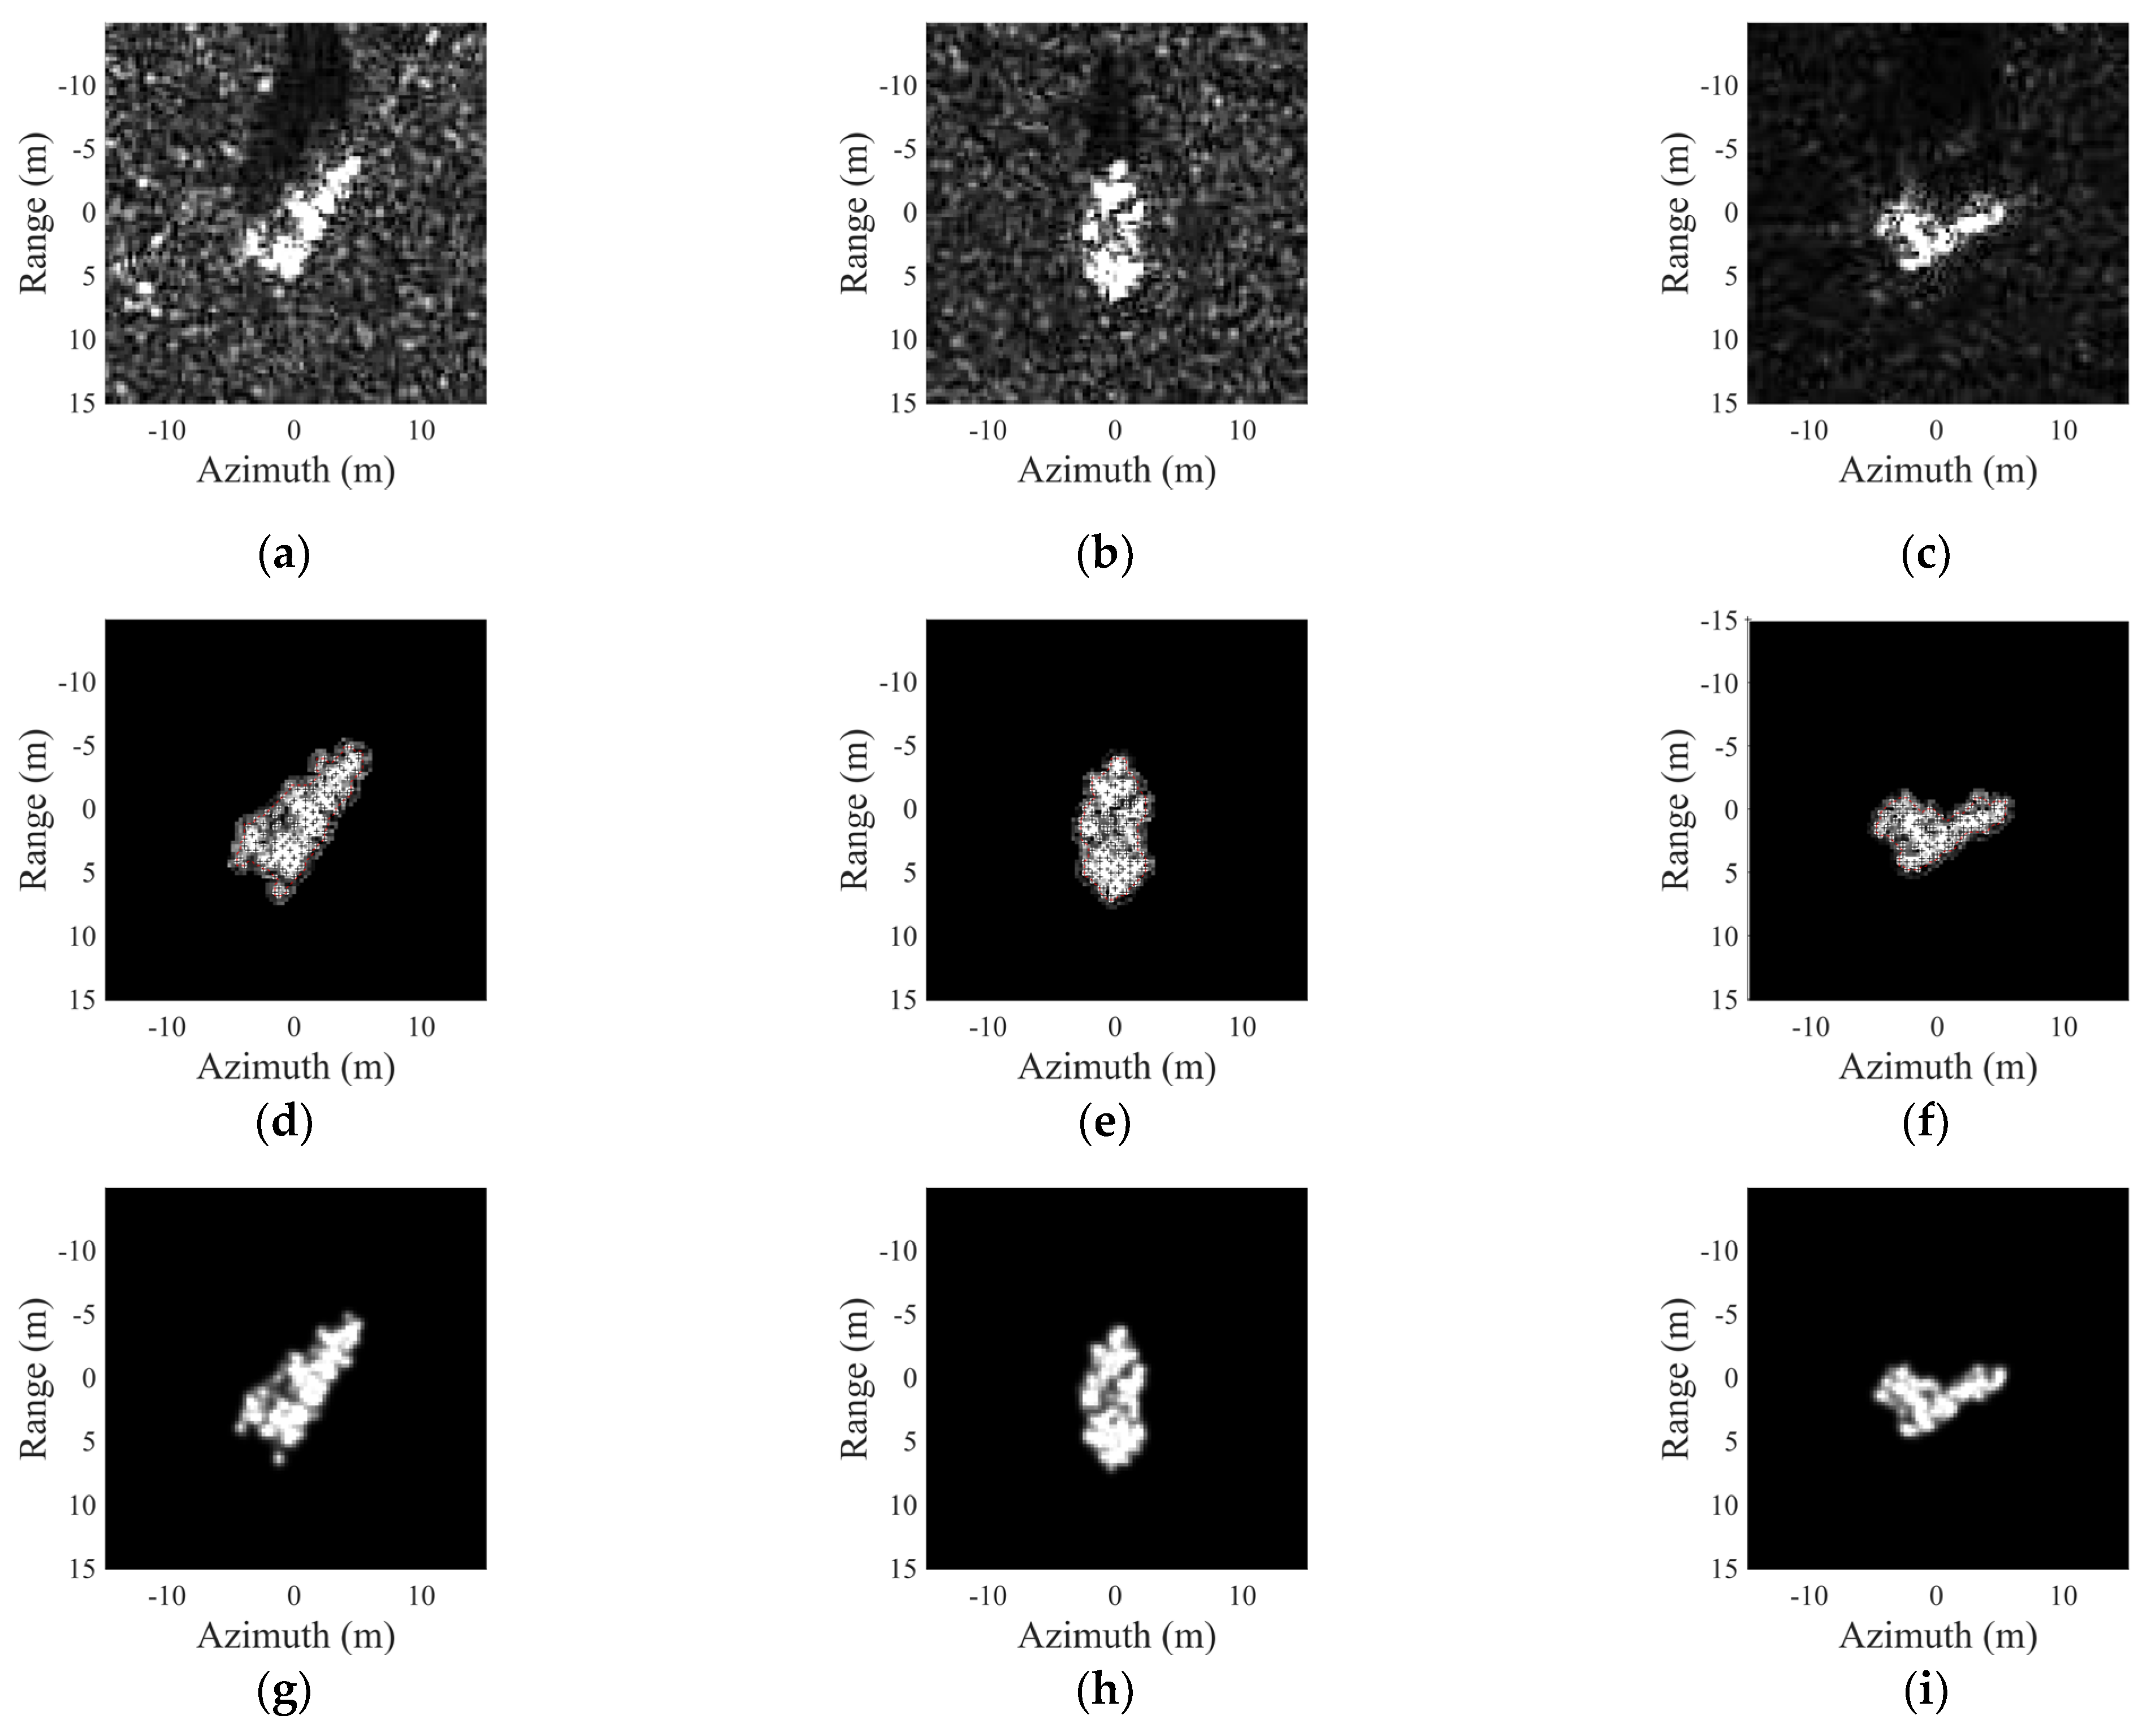
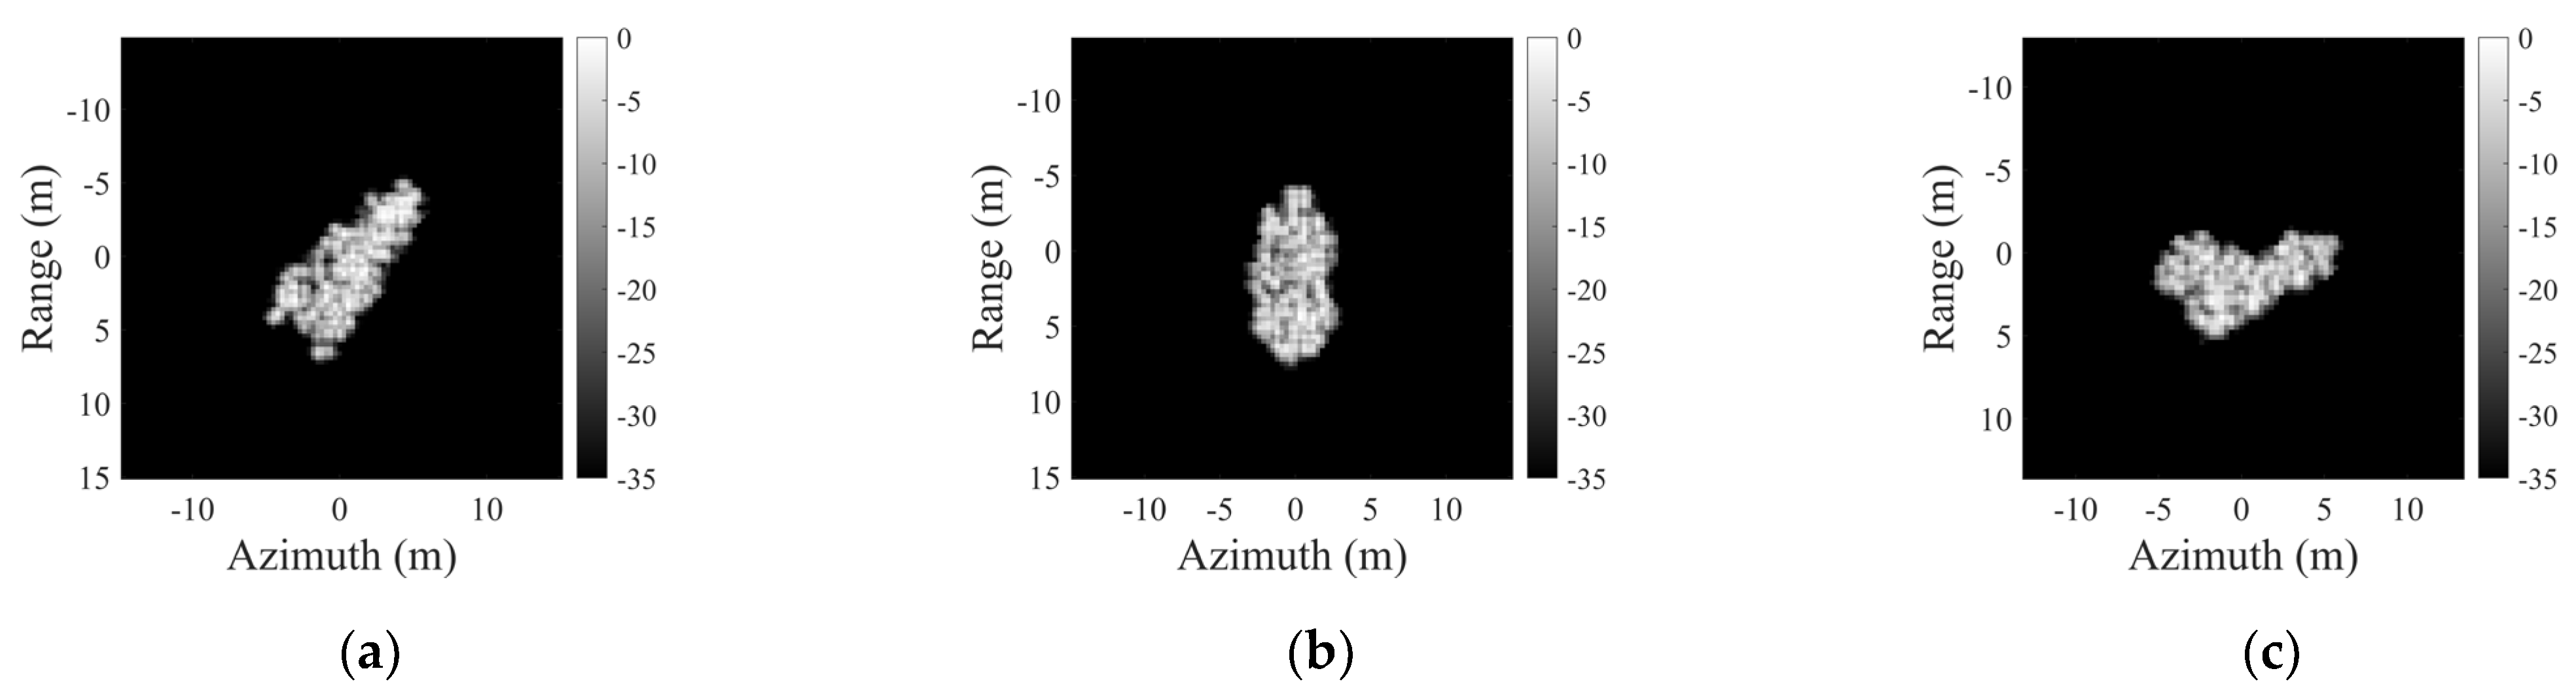
The MSTAR dataset is a ground-based stationary target dataset released by Sandia National Laboratories in the United States. The MSTAR dataset contains 10 distinct vehicle target models. This section conducts reconstruction experiments on three target types: 2S1, BTR60, and ZSU234. Figure 14a–c displays example raw SAR images of these three target categories. These images achieve a resolution of 0.3 m × 0.3 m, enabling direct observation of local scattering phenomena. After sequentially extracting scatter point parameters, reconstructed images undergo similarity assessment to demonstrate the effectiveness of scatter point extraction. As shown in Figure 14d–i, the number of extracted scatter points for the three target types is 107, 108, and 107, respectively. The similarity of the rebuilt SAR images exceeds 0.93, indicating that the extracted scatter points can effectively describe the scattering characteristics of the targets.
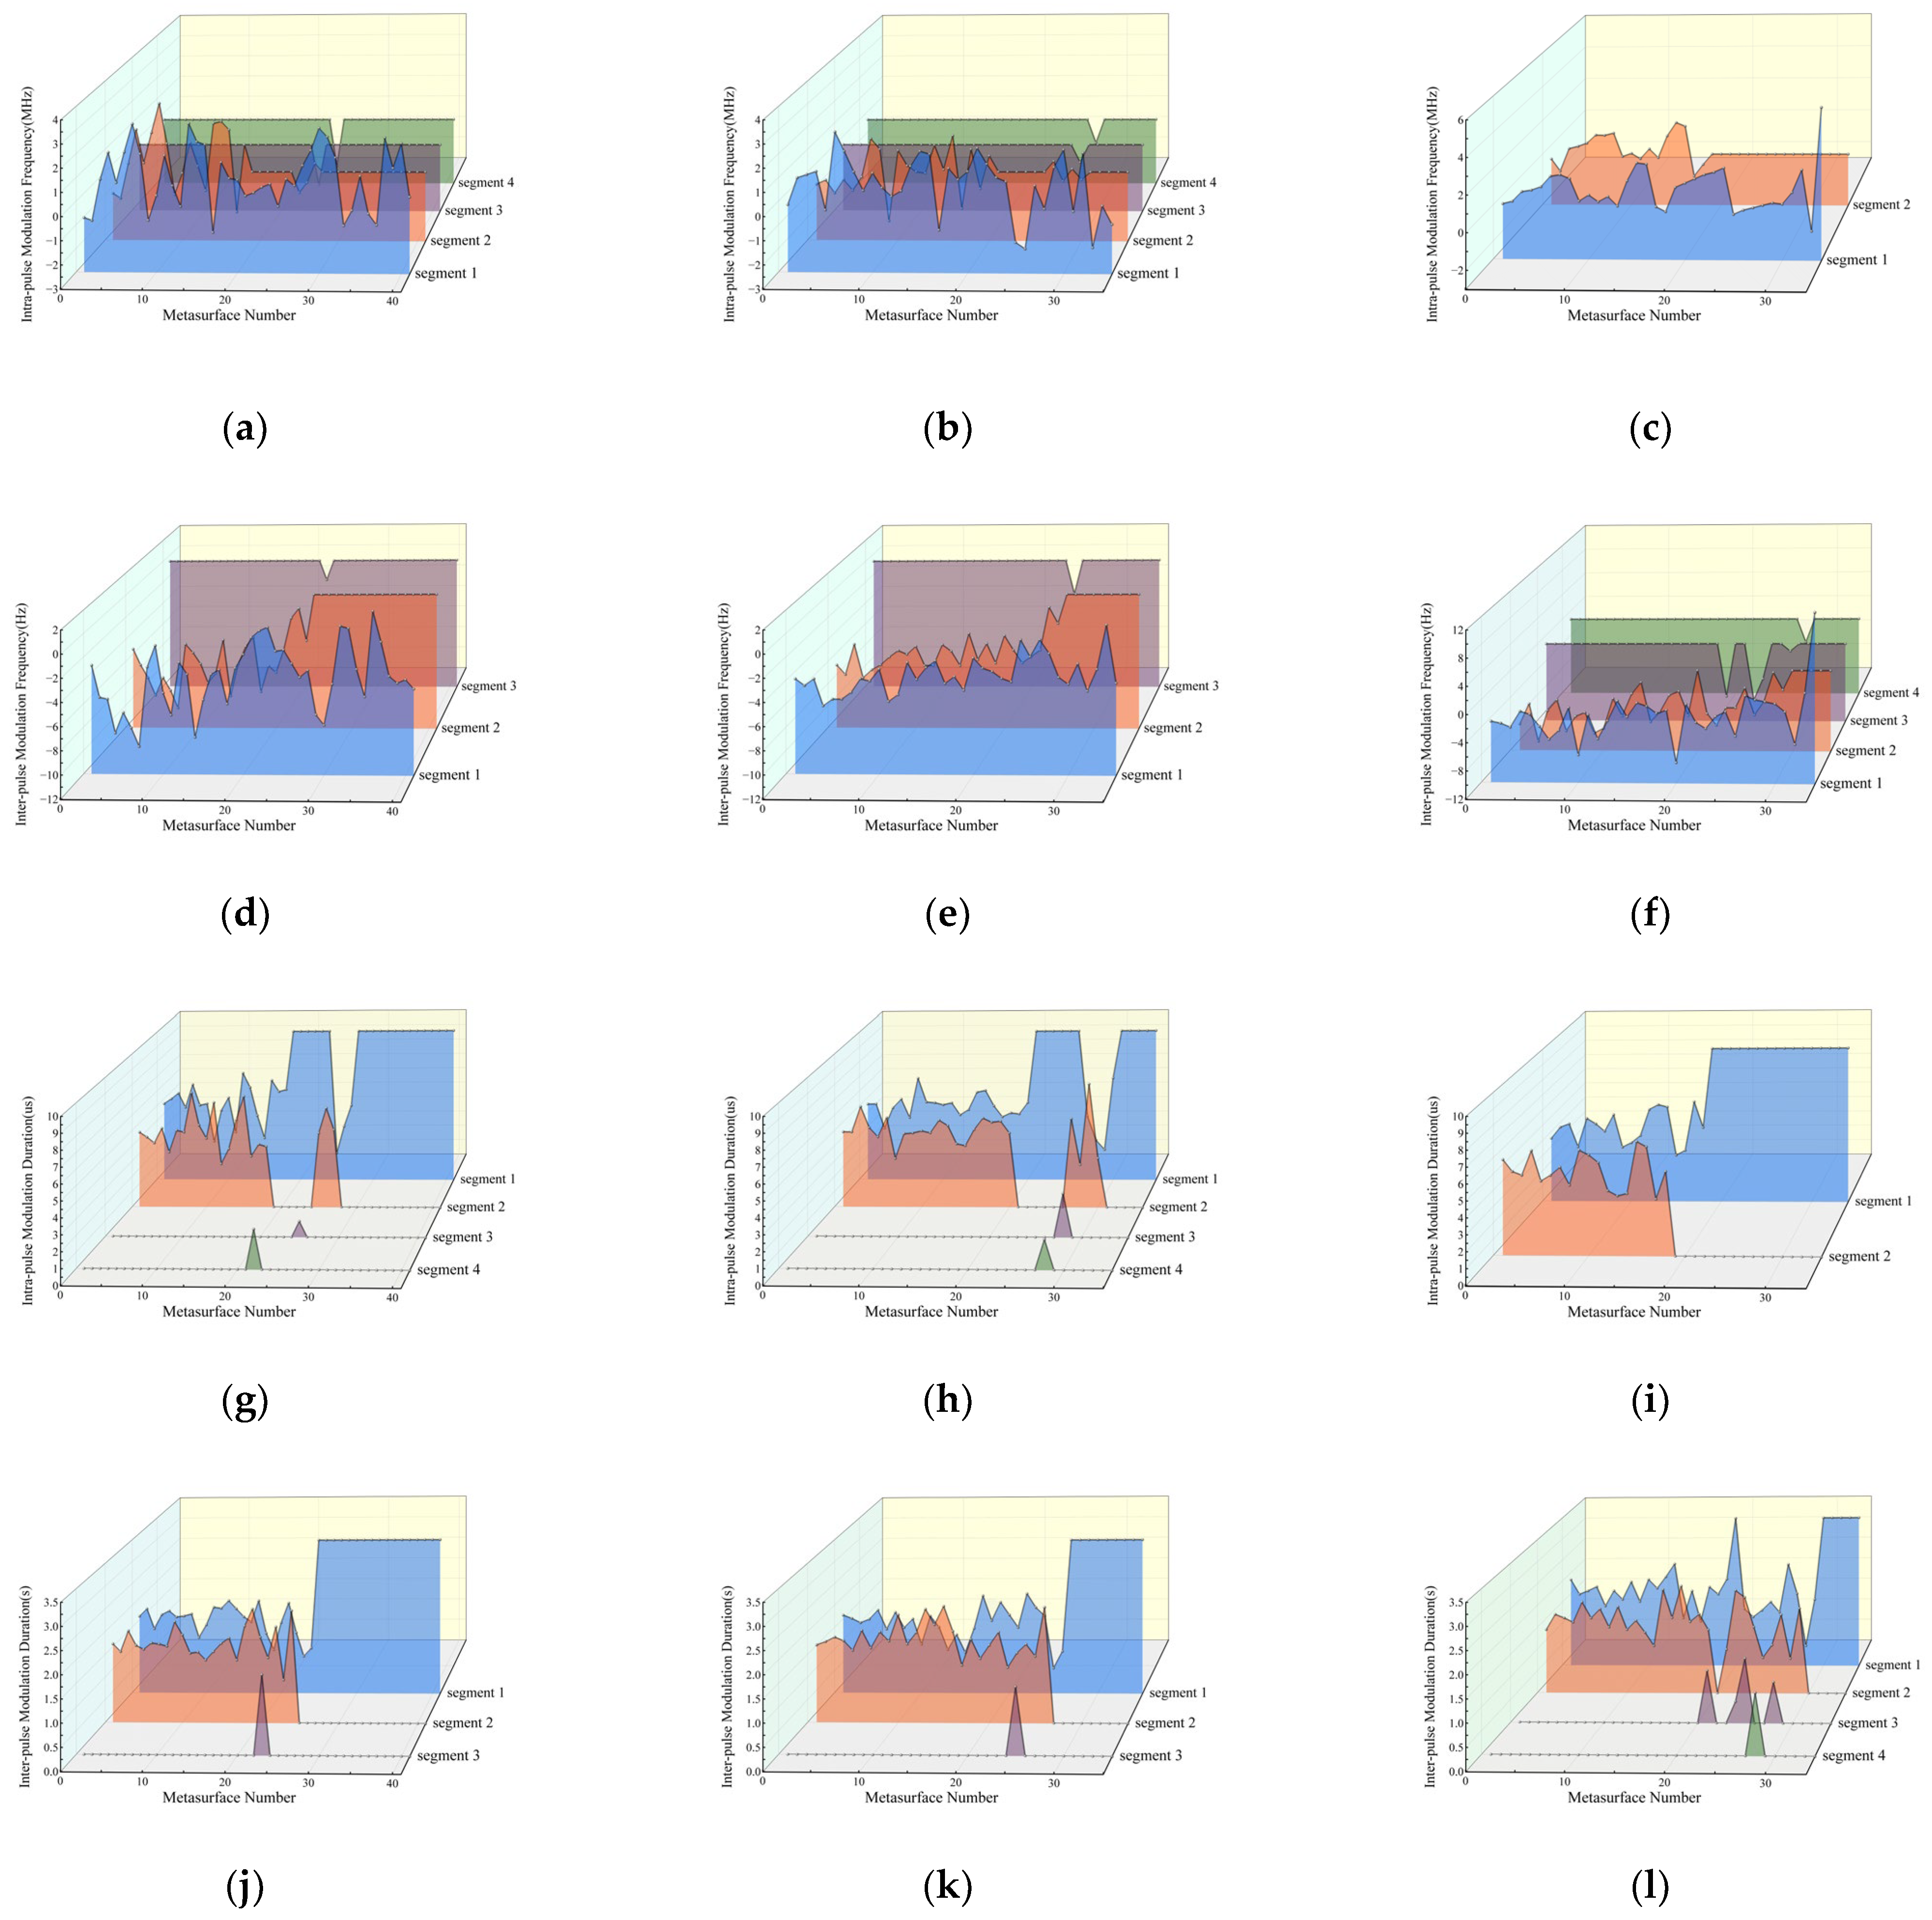
Since the spatial positions of target scatter points are not entirely regular, the extracted scatter points must be grouped into grid groups (2 × 2), range line groups, elevation line groups, and isolated point groups. Grid groups employ a modulation scheme with equal segmentation both intra-pulse and inter-pulse. In practical processing, we performed approximate handling of pixel positions and amplitudes to form a grid. Range-line groups refer to scatter points within the same range cell, using intra-pulse non-segmented and inter-pulse equally segmented modulation. Azimuth-line groups refer to scatter points within the same azimuth cell, employing intra-pulse segmented and inter-pulse non-segmented modulation. Isolated point groups employ a modulation scheme with no segmentation within or between pulses. Table 2 illustrates the grouping of these three scatterer categories. Additionally, the metasurface array is deployed starting from (−6.0 m, 0 m), following the rule of eight elements per column with a spacing of 1 m. The modulation frequency and modulation duration assigned to each segment of the metasurface are calculated using Equations (16)–(18), as shown in Figure 15.
Based on the calculated modulation parameters, two-dimensional modulation signals for the metasurface array were generated. After RD imaging, reconstructed SAR images were obtained, as shown in Figure 16. By calculating the similarity with the original images, the similarity values for these three target types were determined to be 0.9547, 0.9509, and 0.9533, respectively. This indicates that the reconstructed SAR images exhibit strong correlation with the original SAR images.

6. Discussion

The experimental results in Table 1 and Table 2, along with Figure 11, Figure 12, Figure 13, Figure 14, Figure 15 and Figure 16, confirm the following conclusions:
  • Diversity and Flexibility in Target Feature Reconstruction: As demonstrated by the aircraft target reconstruction results in Figure 11 and Figure 12, and the imaging results of three vehicle targets (2S1, BTR60, ZSU234) in Figure 14 and Figure 16, the metasurface array successfully reconstructs distinct SAR features by switching different modulation parameter sets to precisely simulate complex scatter center distributions. This demonstrates that the proposed frequency-shifted phase modulation method effectively conceals the physical characteristics of the original metasurface array while revealing predefined target features.
  • Observing Table 2 and Figure 15 reveals that our method achieved reconstruction of 107, 108, and 107 scatter points using 41, 35, and 34 metasurfaces, respectively. This breaks through the one-to-one mapping mechanism (“one metasurface unit corresponds to one scatter center”) in existing reconstruction techniques. Through the segmented frequency-shifted phase-modulation model, a single metasurface can simultaneously generate multiple scatter centers in the range-azimuth plane. This modulation capability significantly reduces system complexity and deployment costs while maintaining reconstruction accuracy.
  • High Fidelity and Precise Spatial Reconstruction Capability: The imaging results in Figure 11 and Figure 14, combined with similarity metrics, further validate the high fidelity of reconstructed features. Through the decoupled design of modulation frequency and duration parameters, precise control over the spatial distribution and energy trends of reconstructed targets is achievable. In Experiment 1, the aircraft target achieved a structural similarity of 0.9299, while in Experiment 2, the correlation between the three vehicle target categories and the original template remained above 0.90.
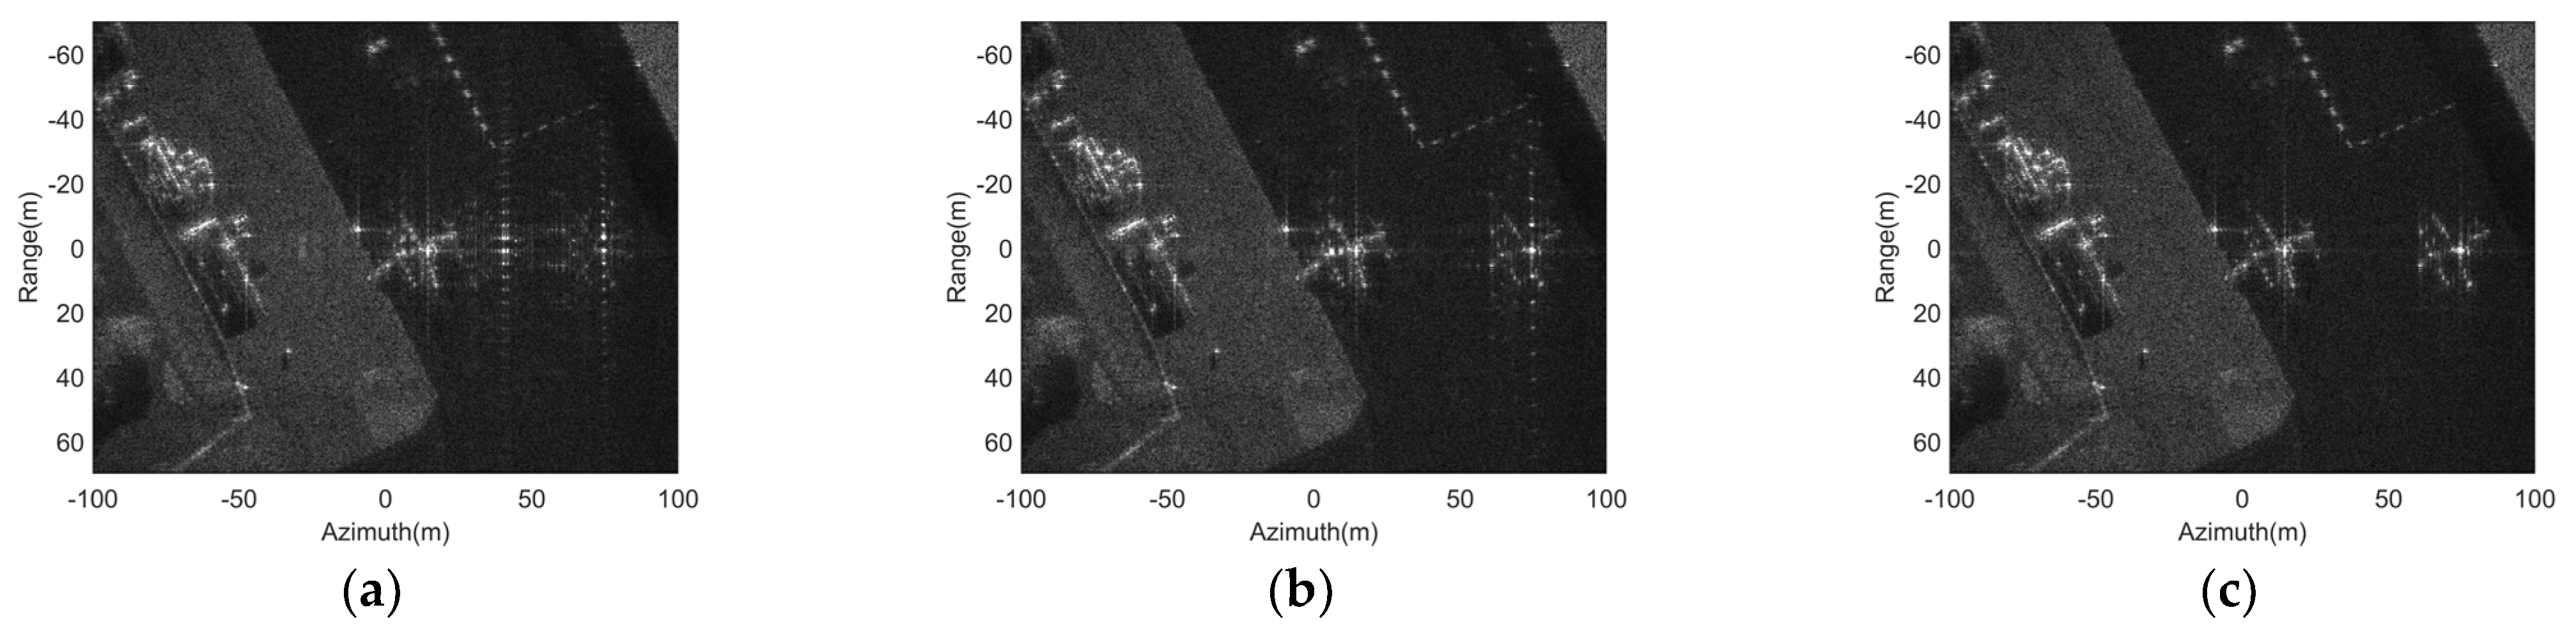
Furthermore, we conducted an in-depth analysis of how quantization harmonics affect reconstruction similarity. Low-bit quantization generates higher-order harmonic components in the frequency domain. In SAR imaging processing, these higher-order harmonics are mapped to unwanted scatter centers in the spatial domain, degrading reconstruction quality. Taking Experiment 1 as an example, regardless of whether low-bit quantization or continuous-phase modulation is employed, the +1st harmonic component is utilized to reconstruct the scattering center of the real target. Therefore, the modulation parameters of the metasurface array remain unchanged. Figure 17 presents a comparative analysis of synthetic aperture radar images between the reconstructed aircraft target and the original aircraft target under 1-bit, 2-bit, and continuous phase-modulation conditions. During 1-bit quantization, the reconstructed target exhibits low energy, resulting in two reconstructed aircraft targets appearing in the imaging scene. The higher-order harmonic reconstructed target is nearly invisible in the radar image due to insufficient energy. Under 2-bit quantization, the reconstructed target energy improves compared to 1-bit quantization. The similarity evaluation metrics for the three modulation modes are 0.8644, 0.89, and 0.9299, respectively.
Therefore, in actual engineering deployments, we need to pay attention to the following three aspects:
  • Extremely low quantization (e.g., 1-bit) inevitably leads to severe high-order harmonic interference and a drastic decline in reconstruction performance. As demonstrated by the spectral analysis results in Figure 3 and Figure 3-bit phase modulation already achieves an exceptionally clean spectrum. Therefore, in real-world applications, using 3-bit or higher quantization bit depth can achieve high-fidelity continuous phase modulation effects.
  • We further emphasize: In practical parameter design, the number of modulation segments for both range and azimuth dimensions imposes strict physical limits. Excessive segmentation directly degrades the resolution of generated discrete scattering centers, thereby compromising the overall quality of the final SAR image.
  • When reconstructing multiple scatter points using a single metasurface, the conservation of energy principle dictates that the energy per generated point will inevitably decrease substantially. Therefore, in practical applications, we must avoid excessive modulation segments in both the distance and azimuth directions while effectively enhancing the scattering energy of the metasurface.
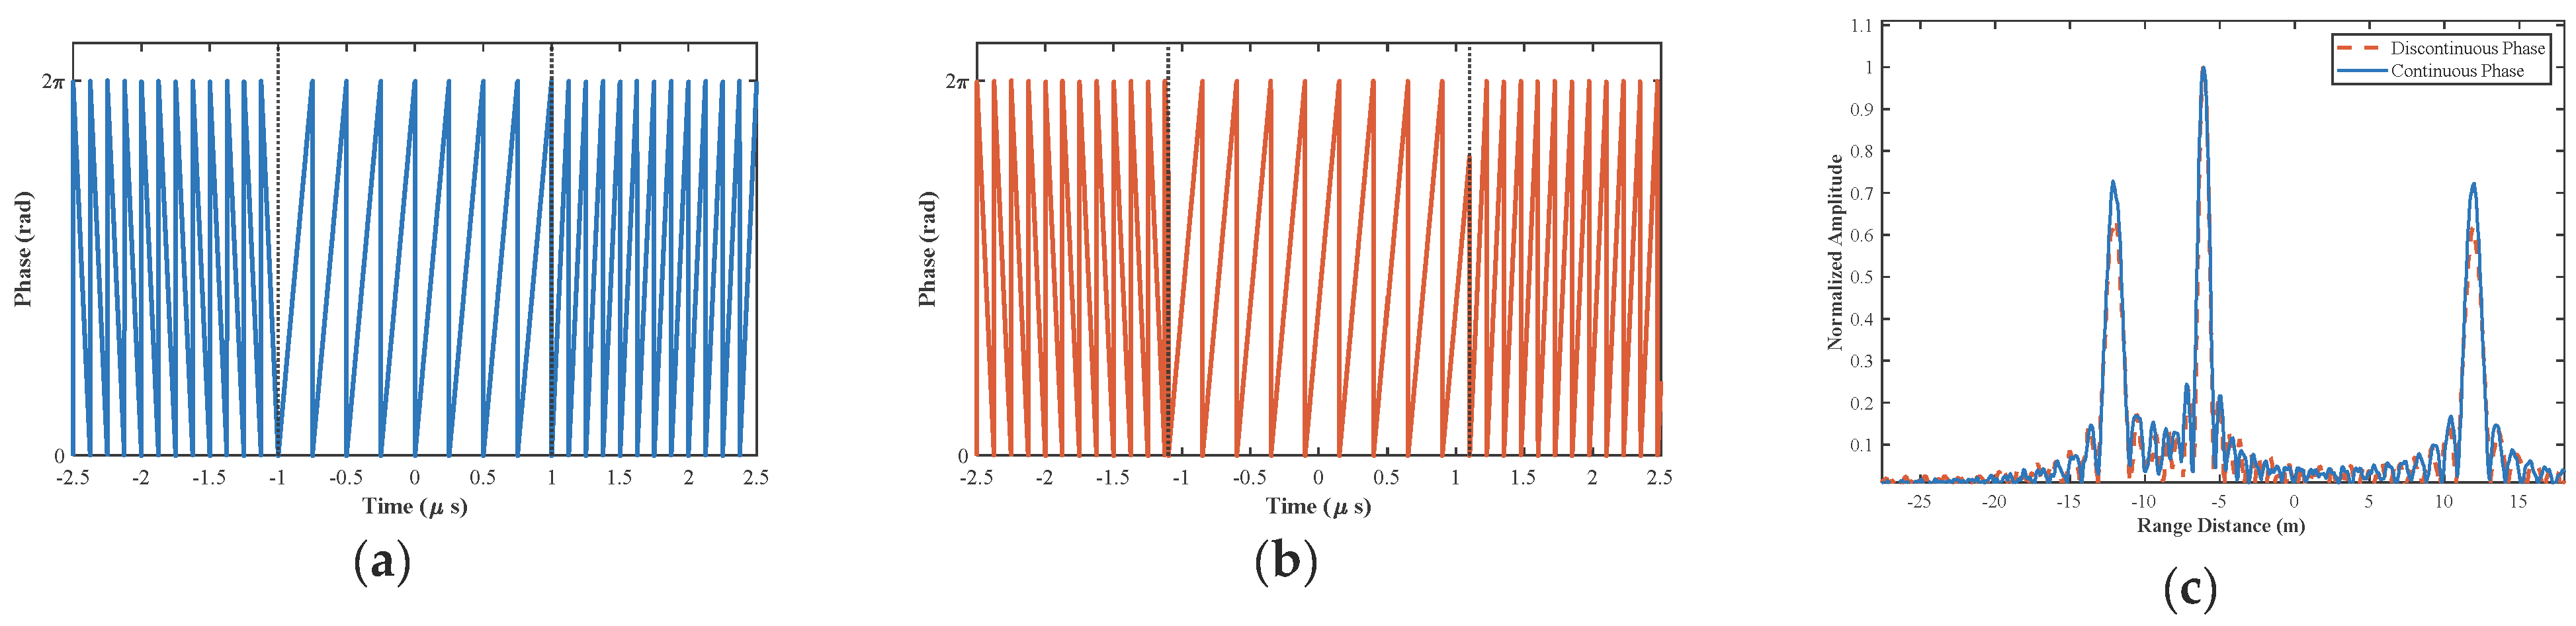
In the SAR feature reconstruction method proposed in this paper, phase discontinuities do indeed occur at the junctions between adjacent modulators; however, this does not affect the theoretical derivations or experimental results presented here, for the following reasons: First, from a mathematical perspective, the frequency-domain expression in Equation (4) is obtained by linearly summing the results of independent Fourier transforms applied to each modulation sub-interval. The linearity of the Fourier transform ensures that this derivation does not require phase continuity between segments; therefore, Equation (4) and the subsequent analytical SAR imaging expression (Equation (14)) are strictly valid. Second, phase discontinuities occur at extremely brief transition junctions between different modulation segments. In SAR signal processing, these instantaneously generated spurious frequencies cannot undergo coherent accumulation and thus do not effectively influence the generation of false targets; finally, all simulations in this paper are directly based on a segmented modulation model incorporating phase jumps, with experimental similarities exceeding 0.9. These results themselves sufficiently demonstrate that the impact of phase jumps on the final SAR image reconstruction is negligible. To illustrate this, we analyze the effects on range and elevation profiles under both continuous (blue line) and discontinuous modulation-phase conditions (orange line) through simulation experiments. The SAR system parameters are set as follows: Carrier frequency fc = 10 GHz, bandwidth B = 500 MHz, pulse width Tp = 5 μs, platform velocity v = 300 m/s, synthetic aperture time Ta = 1 s, and fixed modulation segment K = 3. Distance-modulated frequencies are −8 MHz, 4 MHz, and 8 MHz. During continuous-phase modulation, the modulation durations are 1.5 μs, 2.0 μs, and 1.5 μs, respectively. During phase discontinuity, the modulation durations are 1.4 μs, 2.2 μs, and 1.4 μs. As shown in Figure 18a–c, the resulting range profile shows consistent scattering center distribution, with amplitude ratios proportional to modulation duration.
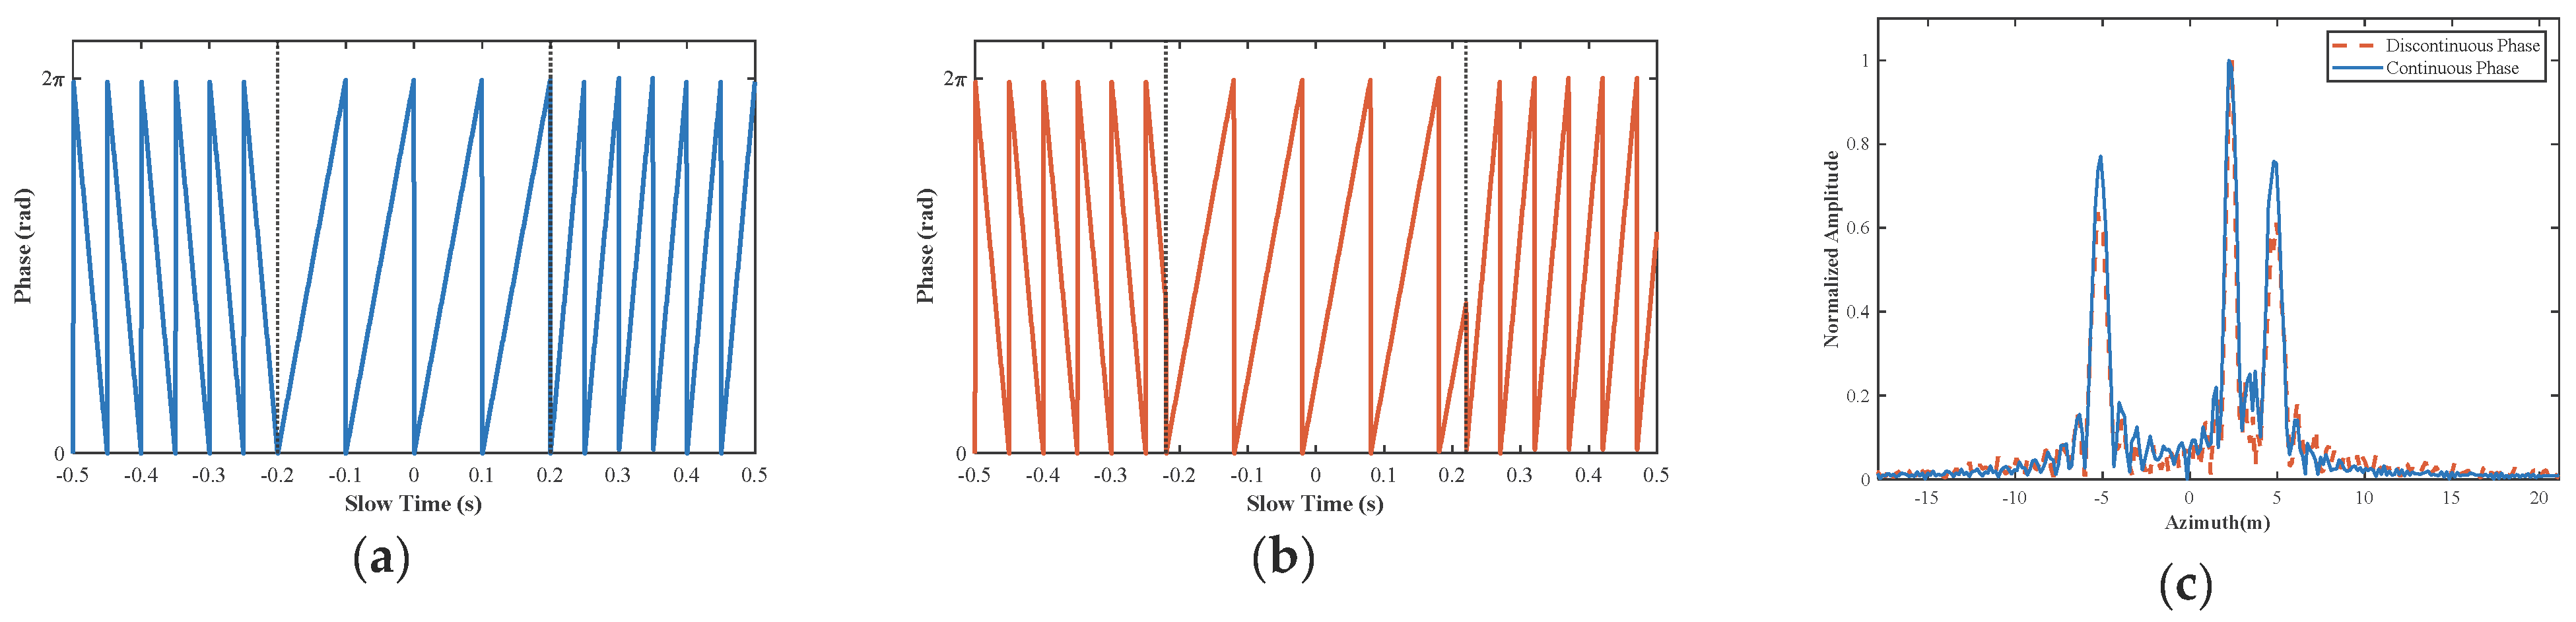
For the fixed modulation segment with K = 3, the azimuth modulation frequencies are −20 Hz, 10 Hz, and 20 Hz. The modulation durations for continuous phase are 0.3 s, 0.4 s, and 0.3 s, respectively. When phase is discontinuous, the modulation durations are 0.28 s, 0.44 s, and 0.28 s, respectively. As shown in Figure 19a–c, in the resulting azimuthal cross-section, the distribution positions of the generated scattering centers are consistent, and their amplitude ratios are proportional to the modulation durations.

7. Conclusions

This paper addresses the issues of rigid mapping mechanisms and lack of amplitude control in existing SAR feature-reconstruction techniques based on metasurfaces. It proposes and validates a novel time-modulated metasurface method based on frequency-shifted phase modulation. The study first establishes a theoretical model for SAR echo modulation, systematically elucidating the intrinsic relationship between modulation parameters and generated false scatterer characteristics, and derives a closed-form mathematical expression in the SAR image domain. Building upon this foundation, an inverse analytical model is constructed that maps target scattering center parameters (position and amplitude) to metasurface modulation commands, enabling high-fidelity, programmable reconstruction of arbitrarily complex target features. Simultaneously, SAR feature reconstruction experiments based on real measurement data demonstrated a similarity exceeding 0.9 between reconstructed and original target features, validating the proposed method’s effectiveness.
Although the analytical mapping method proposed in this paper offers highly efficient physical interpretability, there is still room for optimization under complex hardware constraints. Future research will incorporate optimization algorithms to further improve reconstruction fidelity. Additionally, due to engineering bottlenecks related to the phase-modulated surface and the FPGA control chain, experimental validation is not yet feasible. In the next phase, we will focus on developing a high-performance electromagnetic surface prototype and its corresponding control system and conduct physical tests in an anechoic chamber and in the field to further validate the effectiveness of the method.
All in all, this work not only breaks through the inherent limitations of traditional “one-to-one” mapping by achieving efficient “one-to-many” feature simulation with simultaneous amplitude-position control for the first time but also provides a new theoretical framework and technical pathway for passive electromagnetic camouflage technology targeting complex scenarios in the future.

Author Contributions

Conceptualization, Y.F., J.W. and G.S.; methodology, Y.F.; software, Y.F.; validation, Y.F. and G.S.; investigation, Y.F. and G.S.; resources, J.W. and D.F.; data curation, Y.F.; writing—original draft preparation, Y.F.; writing—review and editing, J.W., G.S. and D.F.; visualization, Y.F.; supervision, J.W. and D.F.; project administration, J.W. and D.F.; funding acquisition, J.W. and D.F. All authors have read and agreed to the published version of the manuscript.

Funding

This research was funded in part by the National Natural Science Foundation of China (NSFC), grant number 62371455 and grant number 62571534, and in part by the Hunan Provincial Natural Science Foundation of China, grant number 2025JJ40058 and in part by China Postdoctoral Science Foundation, grant number 2025M784457.

Data Availability Statement

The original MSTAR data presented in the study are openly available at https://www.sdms.afil.af.mil/index.php?collection=mstar (accessed on 15 December 2025).

Conflicts of Interest

The authors declare no conflicts of interest. The funders had no role in the design of the study; in the collection, analyses, or interpretation of data; in the writing of the manuscript; or in the decision to publish the results.

References

  1. Yamaguchi, Y.; Moriyama, T.; Ishido, M.; Yamada, H. Four-component scattering model for polarimetric SAR image decomposition. IEEE Trans. Geosci. Remote Sens. 2005, 43, 1699–1706. [Google Scholar] [CrossRef] [Scilit]
  2. Cumming, I.G.; Wong, F.H. Digital Processing of Synthetic Aperture Radar Data: Algorithms and Implementation; Artech House: Boston, MA, USA, 2005. [Google Scholar]
  3. Song, S.; Dai, Y.; Sun, S.; Jin, T. Efficient Image Reconstruction Methods Based on Structured Sparsity for Short-Range Radar. IEEE Trans. Geosci. Remote Sens. 2024, 62, 1–15. [Google Scholar] [CrossRef] [Scilit]
  4. Song, S.; Dai, Y.; Song, Y.; Jin, T.; Zhou, Z. Efficient near-field radar microwave imaging based on joint constraints of low-rank and structured sparsity at low snr. IEEE Trans. Microw. Theory Techn. 2025, 73, 2962–2977. [Google Scholar] [CrossRef] [Scilit]
  5. Song, J.; Kim, D.; Hwang, J.H.; Kim, H.; Li, C.; Han, S.; Kim, J. Effective Vessel Recognition in High Resolution SAR Images Using Quantitative and Qualitative Training Data Enhancement From Target Velocity Phase Refocusing. IEEE Trans. Geosci. Remote Sens. 2024, 62, 1–14. [Google Scholar] [CrossRef] [Scilit]
  6. Lang, S.; Li, G.; Liu, Y.; Lu, W.; Zhang, Q.; Chao, K. A GAN-Based Augmentation Scheme for SAR Deceptive Jamming Templates with Shadows. Remote Sens. 2023, 15, 4756. [Google Scholar] [CrossRef] [Scilit]
  7. Yang, K.; Ye, W.; Ma, F.; Li, G.; Tong, Q. A Large-Scene Deceptive Jamming Method for Space-Borne SAR Based on Time-Delay and Frequency-Shift with Template Segmentation. Remote Sens. 2019, 12, 53. [Google Scholar] [CrossRef] [Scilit]
  8. Chang, X.; Dong, C.; Tang, Z.; Dong, Y.Y. Mosaic scene deception jamming based on 2D separation modulation against SAR. IET Radar Sonar Navig. 2019, 13, 310–315. [Google Scholar] [CrossRef] [Scilit]
  9. Yang, K.; Ma, F.; Ran, D. Fast generation of deceptive jamming signal against spaceborne SAR based on spatial frequency domain interpolation. IEEE Trans. Geosci. Remote Sens. 2021, 60, 4701015. [Google Scholar] [CrossRef] [Scilit]
  10. Li, X.; Liu, P.; Guo, G. Fast Generation of SAR Deceptive Jamming Signal Based on Inverse Range Doppler Algorithm. In Proceedings of the IET International Radar Conference 2013, Xi’an, China, 14–16 April 2013. [Google Scholar]
  11. He, Y.; He, H.; Hu, C.; Yin, J.; Yang, J. Polarization Analysis of Trihedral Corner Reflector With High-Frequency Approximation. IEEE Trans. Antennas Propag. 2022, 70, 9607–9620. [Google Scholar] [CrossRef] [Scilit]
  12. Nadi, M.; Cheldavi, A.; Sedighy, S.H. Beam Steering Toward Multibeam Radiation by Time-Coding Metasurface Antennas. IEEE Trans. Antennas Propag. 2024, 72, 4829–4838. [Google Scholar] [CrossRef] [Scilit]
  13. Luo, Y.; Guo, L.; Zuo, Y.; Liu, W. Time-Domain Scattering Characteristics and Jamming Effectiveness in Corner Reflectors. IEEE Access 2021, 9, 15696–15707. [Google Scholar] [CrossRef] [Scilit]
  14. Jiang, T.; Luo, J.; Yu, Z. Research on Corner Reflector Array Fitting Method for Ship Scattering Characteristics; Marine Design & Research Institute of China: Shanghai, China, 2023. [Google Scholar]
  15. Zhang, K.; Zhang, J.; Li, C.; Li, S.; Lan, C. Combined Jamming Method of Chaff and Corner Reflector Against Anti-Ship Missiles; Systems Engineering Research Institute: Beijing, China, 2024. [Google Scholar]
  16. Ma, Q.; Xiao, Q.; Hong, Q.R.; Gao, X.; Galdi, V.; Cui, T.J. Digital Coding Metasurfaces: From Theory to Applications. IEEE Antennas Propag. Mag. 2022, 64, 2–15. [Google Scholar] [CrossRef] [Scilit]
  17. Ding, C.; Mu, H.; Meng, Y.; Zhao, M.; Zhang, Y.; Cai, T.; Meng, F.; Wang, J. Time-Modulated Metasurface-Assisted Moving Target Jamming for Synthetic Aperture Radar. IEEE Trans. Microw. Theory Techn. 2025, 73, 4191–4203. [Google Scholar] [CrossRef] [Scilit]
  18. Ramaccia, D.; Sounas, D.L.; Alu, A.; Toscano, A.; Bilotti, F. Phase-Induced Frequency Conversion and Doppler Effect With Time-Modulated Metasurfaces. IEEE Trans. Antennas Propag. 2020, 68, 1607–1617. [Google Scholar] [CrossRef] [Scilit]
  19. Huang, C.; Zhao, B.; Song, J.; Guan, C.; Luo, X. Active Transmission/Absorption Frequency Selective Surface With Dynamical Modulation of Amplitude. IEEE Trans. Antennas Propag. 2020, 69, 3593–3598. [Google Scholar] [CrossRef] [Scilit]
  20. Zhao, B.; Huang, C.; Yang, J.; Song, J.; Guan, C.; Luo, X. Broadband Polarization-Insensitive Tunable Absorber Using Active Frequency Selective Surface. IEEE Antennas Wirel. Propag. Lett. 2020, 19, 982–986. [Google Scholar] [CrossRef] [Scilit]
  21. Chen, L.; Wang, J.; Ma, Y.; Wu, J.; Feng, D.; Liu, X. High-Degree-of-Freedom Range-Doppler Modulation via Optimized Pseudo-Random Coding Metasurface. IEEE Trans. Antennas Propag. 2026. [Google Scholar] [CrossRef] [Scilit]
  22. Ding, C.; Mu, H.; Shi, Y.; Wu, Z.; Fu, X.; Zhu, R.; Cai, T.; Meng, F.; Wang, J. Dual-polarized and Conformal Time-Modulated Metasurface Based Two-Dimensional Jamming Against SAR Imaging System. IEEE Trans. Antennas Propag. 2025, 73, 7752–7764. [Google Scholar] [CrossRef] [Scilit]
  23. Chen, L.; Wang, J.; Liu, X.; Feng, D.; Sun, G. A Flexible Range-Doppler Modulation Method for Pulse-Doppler Radar Using Phase-Switched Screen. IEEE Trans. Antennas Propag. 2025, 73, 6774–6787. [Google Scholar] [CrossRef] [Scilit]
  24. Xu, Z.; Zheng, Y.; Zeng, Y.; Yang, Z.; Zhang, Y.; Wu, Q.; Ai, X. Measurement and Calibration Methods for Full-Polarization Characteristics of Radar Targets at Sub-Terahertz Frequencies. IEEE Trans. Antennas Propag. 2026, 1. [Google Scholar] [CrossRef] [Scilit]
  25. Wu, Q.; Wang, Y.; Liu, X.; Gu, Z.; Xu, Z.; Xiao, S. ISAR Image Transform via Joint Intra pulse and Inter pulse Periodic coded Phase Modulation. IEEE Sens. J. 2025, 25, 28788–28799. [Google Scholar] [CrossRef] [Scilit]
  26. Zhang, L.; Wang, Z.X.; Shao, R.W.; Shen, J.L.; Chen, X.Q.; Wan, X.; Cheng, Q.; Cui, T.J. Dynamically Realizing Arbitrary Multi-Bit Programmable Phases Using a 2-Bit Time-Domain Coding Metasurface. IEEE Trans. Antennas Propag. 2020, 68, 2984–2992. [Google Scholar] [CrossRef] [Scilit]
  27. Yu, S.J.; Guan, D.F.; Gu, Z.Y.; Guo, J.X.; Liu, Z.; Liu, Y.X. Radar Target Complex High-Resolution Range Profile Modulation by External Time Coding Metasurface. IEEE Trans. Microw. Theory Tech. 2024, 72, 6083–6093. [Google Scholar] [CrossRef] [Scilit]
  28. Fang, X.; Li, M.; Li, S.; Ramaccia, D.; Toscano, A.; Bilotti, F.; Ding, D. Diverse Frequency Time Modulation for Passive False Target Spoofing: Design and Experiment. IEEE Trans. Microw. Theory Tech. 2024, 72, 1932–1942. [Google Scholar] [CrossRef] [Scilit]
  29. Wang, Y.D.; Shi, H.Y.; Wang, L.Y.; Chen, J.; Chen, X.M.; Yi, J.J.; Zhang, A.X.; Xu, Z. Dual-Band Metasurface With Extreme Angular-Asymmetric Transmission and Frequency Selection Based on Resonant Coupling Effect. IEEE Trans. Antennas Propag. 2023, 71, 7656–7660. [Google Scholar] [CrossRef] [Scilit]
  30. Wu, R.; Dong, J.; Xiao, C.; Dou, H.; Zhang, S.; Zhang, C.; Tian, M. An Optically Transparent Broadband Metamaterial Absorber for Passive Radiation Jamming. IEEE Trans. Microw. Theory Techn. 2025, 73, 8607–8618. [Google Scholar] [CrossRef] [Scilit]
  31. Hou, J.; Deng, F.; Yao, G.; Lin, H.; Chen, X.; Chen, L.; Tian, Y.; Han, Q. Adversarial Attack Method Against SAR ATR Based on Superimposed Phase Modulation. IEEE Trans. Antennas Propag. 2026, 74, 995–1006. [Google Scholar] [CrossRef] [Scilit]
  32. Xie, J.; Peng, B.; Lu, Z.; Zhou, J.; Peng, B. MIGAA: A Physical Adversarial Attack Method against SAR Recognition Models. In Proceedings of the 2024 9th International Conference on Computer and Communication Systems (ICCCS), Xi’an, China, 19–22 April 2024; IEEE: New York, NY, USA, 2024; pp. 309–314. [Google Scholar] [CrossRef] [Scilit]
  33. Wang, J.; Feng, D.; Xu, Z.; Wu, Q.; Hu, W. Time-Domain Digital-Coding Active Frequency Selective Surface Absorber/Reflector and Its Imaging Characteristics. IEEE Trans. Antennas Propag. 2021, 69, 3322–3331. [Google Scholar] [CrossRef] [Scilit]
  34. Sun, G.; Wang, J.; Xing, S.; Huang, D.; Feng, D.; Wang, X. A Flexible Conformal Multifunctional Time-Modulated Metasurface for Radar Characteristics Manipulation. IEEE Trans. Microw. Theory Tech. 2024, 72, 4294–4308. [Google Scholar] [CrossRef] [Scilit]
  35. Mu, H.; Ding, C.; Guan, C.; Zhang, Y.; Cai, T.; Meng, F.; Wang, J. Subsection-Shift-Doppler-Frequency Jamming Based on Phase-Tunable Metasurface Against SAR Imaging. IEEE Trans. Geosci. Remote Sens. 2024, 62, 1–15. [Google Scholar] [CrossRef] [Scilit]
  36. Fang, X.; Li, M.; Wang, S.; Ai, X.; Wang, W.; Liu, J.; Ding, D. EM Scattering Center Model-Guided Passive SAR Deception Using Diverse Frequency Time-Modulation. IEEE Trans. Geosci. Remote Sens. 2024, 62, 1–13. [Google Scholar] [CrossRef] [Scilit]
  37. Zhu, L.; Wang, J.; Feng, D. An Approach for SAR Feature Reconfiguring Based on Periodic Phase Modulation with Inter-Pulse Time Bias. Remote Sens. 2025, 17, 991. [Google Scholar] [CrossRef] [Scilit]
Figure 1. Principles of SAR Feature Reconstruction Based on Time-Modulated Metasurfaces.
Remotesensing 18 01060 g001
Figure 2. Time-Modulated Metasurface Phase-Modulation Principle.
Remotesensing 18 01060 g002
Figure 3. Comparison of 1-bit, 2-bit, 3-bit, and continuous linear-phase modulation. (a) Modulation waveforms; (b) Harmonic order and normalized amplitude.
Remotesensing 18 01060 g003
Figure 4. Segmented variable frequency modulation continuous phase-modulation signal.
Remotesensing 18 01060 g004
Figure 5. The effects of modulation frequency and modulation duration on the spectral distribution of modulated signals. (ac) Spectral plots with a fixed modulation duration ratio of 1:1:1 and modulation frequencies of f k = 2 , 3 , 1 MHz , f k = 2 , 1 , 4 MHz and f k = 3 , 1 , 4 MHz ; (df) Spectral plots with a fixed modulation frequency of f k = 2 , 1 , 4 MHz ; and modulation duration ratios of 1:2:3, 1:3:2, and 3:2:1, respectively.
Remotesensing 18 01060 g005
Figure 6. Two-dimensional segmented variable-frequency modulation continuous phase-modulation model.
Remotesensing 18 01060 g006
Figure 7. (ac) SAR imaging results with a fixed intra-pulse modulation frequency of f l = 100 , 75 , 50 , 25 MHz , and modulation duration ratios of 1:1:1:1, 3:3:2:1, and 1:2:3:5; (df) SAR imaging results with a fixed inter-pulse modulation frequency of f n = 140 , 60 , 200 Hz , and modulation duration ratios of 3:4:3, 2:1:1, and 2:3:2.
Remotesensing 18 01060 g007
Figure 8. Results of SAR feature modulation under intra-pulse and inter-pulse modulation with fixed modulation frequency of f l = [ 100 , 75 , 50 , 25 ] MHz and f n = 140 , 60 , 200 Hz . The intra-pulse and inter-pulse modulation duration ratios are 1:2:3:4, 1:3:4:2, and 4:3:2:2. (ac) Ideal amplitude coefficients for scatterers 1–16; (df) generated SAR images.
Remotesensing 18 01060 g008
Figure 9. The effect of distance modulation duration on distance resolution. (a). distance modulation durations of Tp/2; (b) distance modulation durations of Tp/5; (c) distance modulation durations of Tp/8.
Remotesensing 18 01060 g009
Figure 10. The effect of azimuth modulation duration on azimuth resolution. (a). azimuth modulation durations of Ta/2; (b) azimuth modulation durations of Ta/3; (c) azimuth modulation durations of Ta/8.
Remotesensing 18 01060 g010
Figure 11. (a) Original Aircraft Imaging Results; (b) Extraction of Regions of Interest and Strong Scatter Points.
Remotesensing 18 01060 g011
Figure 12. (a) Intra-pulse modulation frequency in metasurface array design; (b) Inter-pulse modulation frequency in metasurface array design; (c) Intra-pulse modulation duration in metasurface array design; (d) Inter-pulse modulation duration in metasurface array design.
Remotesensing 18 01060 g012aRemotesensing 18 01060 g012b
Figure 13. (a) Image of metasurface array before modulation; (b) Reconstructed aircraft target versus original target.
Remotesensing 18 01060 g013
Figure 14. (a,d,g) Raw SAR image of the 2S1 vehicle target, schematic diagram of extracted scatter points, and rebuilt target image; (b,e,h) Raw SAR image of the BTR60 vehicle target, schematic diagram of extracted scatter points, and rebuilt target image; (c,f,i) Raw SAR image of the ZSU234 vehicle target, schematic diagram of extracted scatter points, and rebuilt target image.
Remotesensing 18 01060 g014
Figure 15. (a,d,g,j) Intra-pulse and inter-pulse modulation frequency and modulation duration for the metasurface array design targeting the 2S1 vehicle; (b,e,h,k) Intra-pulse and inter-pulse modulation frequency and modulation duration for the metasurface array design targeting the BTR60 vehicle; (c,f,i,l) Intra-pulse inter-pulse modulation frequency and modulation duration for the ZSU234 vehicle target in the metasurface array design.
Remotesensing 18 01060 g015
Figure 16. Reconstructed SAR images of three vehicle targets generated by the modulated metasurface array.(a) 2S1 vehicle; (b) BTR60 vehicle; (c) ZSU234 vehicle.
Remotesensing 18 01060 g016
Figure 17. Comparison of SAR images of the reconstructed aircraft target and the original aircraft target under different phase quantization bits. (a) 1-bit; (b) 2-bit; (c) continuous phase modulation.
Remotesensing 18 01060 g017
Figure 18. (a) Encoded waveform when the range modulation phase is continuous; (b) Encoded waveform when the range modulation phase is discontinuous; (c) Comparison of range profiles in the two cases.
Remotesensing 18 01060 g018
Figure 19. (a) Encoded waveform when the azimuth modulation phase is continuous; (b) Encoded waveform when the azimuth modulation phase is discontinuous; (c) Comparison of azimuth profiles in the two cases.
Remotesensing 18 01060 g019
Table 1. Parameters for Extracting Partial Scatter Points from Original Aircraft Targets.
Scatter Point NumberPositionMagnitude
1(1.0009, −4.8333)1.4197
2(1.7584, 4.7500)1.6617
3(2.5160, 4.7500)0.7878
4(2.8948, −0.6667)3.2204
5(4.0312, 2.2500)3.8855
6(5.5463, −1.9167)2.6209
7(14.2584, 1.0000)33.6444
8(16.9100, 0.1677)2.3178
9(16.9100, −3.5833)1.0259
10(20.6978, −4.8333)2.9458
Table 2. Scatter Point Grouping for Three Categories of Vehicle Target Images.
CategoryGridRange LineAzimuth LineIsolated Point
2S1186314
BTR6020645
ZSU234181105
Disclaimer/Publisher’s Note: The statements, opinions and data contained in all publications are solely those of the individual author(s) and contributor(s) and not of MDPI and/or the editor(s). MDPI and/or the editor(s) disclaim responsibility for any injury to people or property resulting from any ideas, methods, instructions or products referred to in the content.