


Highlights
What are the main findings?
- A Ka-band pulse-Doppler SAR system is developed for multi-rotor UAVs with low power consumption and lightweight design.
- The proposed error correction and predistortion methods achieve high-resolution imaging better than 0.3 m.
What are the implications of the main findings?
- The system realizes pulse-Doppler SAR application on lightweight multi-rotor UAVs under tight payload and power constraints.
- It supports high-precision, flexible ground observation missions for small multi-rotor UAV platforms.
Abstract
Lightweight multi-rotor unmanned aerial vehicles (UAVs) have shown great potential in flexible Earth observation, but they impose strict restrictions on payload, volume, and power consumption. Traditional pulse-Doppler synthetic aperture radar (SAR) systems offer high imaging performance but suffer from high peak power and large volume, making them unsuitable for lightweight UAV platforms. To meet the low-power demand, most existing lightweight UAV SAR systems adopt frequency-modulated continuous-wave (FMCW) schemes, which are compact and low cost yet limited by a low range resolution, poor anti-interference ability, and single imaging modes. Therefore, it is urgent to develop an SAR system that combines the high performance of pulse radar with the lightweight advantage of FMCW radar. To this end, this paper proposes a compact, low-power Ka-band pulse-Doppler SAR system for multi-rotor UAVs. With 1.2 GHz bandwidth and highly integrated RF and antenna design, the system achieves miniaturization and low power consumption while maintaining high-resolution imaging capability. Furthermore, two-step waveform error correction and a signal predistortion method are presented to compensate amplitude and phase errors and improve the purity of the transmitted signal. Experimental results show that the proposed system can obtain clear SAR images with a resolution better than 0.3 m, providing a practical high-performance pulse-SAR solution for lightweight UAV platforms.
1. Introduction
Synthetic Aperture Radar (SAR), as an active microwave radar system, enables all-day and all-weather Earth observation, playing an irreplaceable role in natural resource monitoring, geological disaster early warning, maritime management, land surveying, and other fields [1,2,3,4,5,6]. In recent years, multi-rotor unmanned aerial vehicles (UAVs) have become ideal platforms for SAR systems due to their advantages of flexible deployment, low cost, and no requirement for dedicated runways, leading to widespread attention and rapid development of UAV-borne SAR [7,8,9,10,11].
However, multi-rotor UAVs have limited payload capacity and constrained power supply, imposing stringent restrictions on the volume, weight, and power consumption of radar systems [12]. Most existing UAV-borne SAR systems adopt the frequency-modulated continuous-wave (FMCW) architecture [13,14]. Although this architecture can meet the requirements of miniaturization and low power consumption, it suffers from inherent drawbacks such as low range resolution, weak anti-interference capability against complex electromagnetic clutter, and a single imaging mode, making it difficult to satisfy high-precision observation demands in scenarios like fine geological exploration or small target detection.
In contrast, pulsed SAR systems exhibit significant advantages in resolution, swath width, anti-interference performance, and flexibility of operating modes (including spotlight, scan, and hybrid modes), serving as an ideal solution for high-performance imaging [15,16]. Nevertheless, traditional pulsed SAR systems feature high peak power, complex architecture with multiple discrete components, and large volume/power consumption, which hinder their direct application on multi-rotor UAV platforms. How to retain the high performance of the pulsed architecture while achieving system lightweight and low power consumption has become a critical technical challenge urgently requiring resolution in the field of UAV-borne SAR.
To achieve high resolution in pulsed SAR systems, the core lies in adopting wideband signals—range resolution is inversely proportional to signal bandwidth, which is a fundamental principle for SAR high-resolution imaging. Linear Frequency Modulated (LFM) signals, due to their simple structure, excellent Doppler tolerance, and easy implementation of wideband modulation, represent the most mature wideband signal solution in current SAR systems [17,18], and are widely used in typical systems such as TerraSAR-X, RADARSAT, and Gaofen-3. The resolution of SAR images directly depends on the bandwidth, quality, and phase error level of LFM signals—higher frequency bands (e.g., Ka-band vs. X/C-band) can support larger bandwidths while reducing antenna size (antenna gain is proportional to the square of frequency for the same aperture), which provides the possibility for lightweight design.
In traditional SAR signal generation structures, a multi-stage frequency conversion scheme of “Baseband–Intermediate Frequency–Radio Frequency (BB-IF-RF)” is usually adopted: a Field-Programmable Gate Array (FPGA) controls a Digital-to-Analog Converter (DAC) to generate I/Q dual-channel baseband signals, which then undergo low-pass filtering (with cutoff frequency matching the signal bandwidth), quadrature modulation to intermediate frequency, up-conversion to carrier frequency via a mixer, and power amplification to meet transmission requirements, ultimately forming the radio frequency (RF) transmitted signal. Scholars worldwide have conducted extensive research on LFM signal generation. Z. Zhu realized an LFM signal with a center frequency of 750 MHz and a bandwidth of 400 MHz based on Direct Digital Synthesis (DDS) technology [19]. C. Dai developed an X-band LFM signal with a bandwidth of 1 GHz using a Phase-Locked Loop (PLL) [20]. T. Jiang proposed a digital predistortion method based on Direct Digital Waveform Synthesis (DDWS) to improve signal quality [21] and the Institute of Electronics, Chinese Academy of Sciences, has carried out in-depth research on nonlinear frequency modulated (NLFM) signal generation [22,23].
For UAV platforms, however, complex real-time LFM signal generation and multi-stage frequency conversion architectures increase system volume, power consumption, and the risk of error introduction—especially I/Q imbalance caused by quadrature modulation, which degrades signal quality. With the advancement of DAC device performance, including higher sampling rates, better linearity, and integrated modulation functions, adopting a simplified system architecture with direct intermediate frequency generation has become a superior choice. This scheme not only suppresses I/Q quadrature errors by reducing modulation stages but also further reduces volume and power consumption by eliminating redundant mixers and filters, which is highly compatible with UAV platform constraints.
This paper selects the Ka band as the carrier frequency. Its short wavelength characteristic can support a large bandwidth of 1.2 GHz, and at the same time achieve lightweight antenna design. A lightweight Ka-band pulse-Doppler SAR system for multi-rotor UAVs is developed. Through the collaborative optimization of Ka-band selection, simplified architecture, highly integrated electronic devices and lightweight transceiver antennas, the system successfully achieves low power consumption and miniaturization while retaining the advantages of the pulse system such as high resolution and strong anti-interference capability. The developed system achieves an imaging resolution better than 0.3 m, which can fully meet the requirements of high-precision Earth observation missions.
The performance of the system is verified through comprehensive tests including simulations, ground experiments, and flight experiments. Simulations cover electromagnetic propagation and signal processing processes; ground experiments focus on static target imaging and LFM signal quality testing; flight experiments are conducted with the UAV platform to verify practical imaging performance. The remainder of this paper is organized as follows: Section 2 introduces the overall system design and hardware architecture; Section 3 analyzes the signal generation and error compensation methods, and presents detailed antenna test results including gain, bandwidth, and radiation pattern; Section 4 demonstrates the flight experiment process and imaging results; Section 5 discusses the technical solution proposed in this paper and Section 6 summarizes the research work and draws conclusions.
2. Design of UAV Pulse-Doppler SAR System
To address the challenge of balancing high performance and lightweight design for UAV-borne SAR under payload/power constraints, this chapter presents a targeted system design:
- 1.
- Achieving sub-0.3 m resolution via 1.2 GHz bandwidth Linear Frequency Modulated (LFM) signals, enabled by a pulse-based architecture that transmits LFM waveforms within single pulses and leverages matched filtering in the fast-time domain and Doppler processing in the azimuth slow-time domain for dual high resolution;
- 2.
- Ensuring UAV compatibility through integrated modular design—merging traditional discrete subsystems into RF and digital components, and adopting a lightweight waveguide slot antenna—to optimize volume, weight, and power consumption;
- 3.
- Simplifying the architecture by replacing the traditional BB-IF-RF three-stage conversion with direct intermediate frequency (IF-LFM) generation, mitigating I/Q quadrature errors and integration complexity.
Subsequent sections elaborate on the overall architecture, signal processing, component integration, and lightweight antenna design to fully realize these objectives.
2.1. Introduction of Traditional SAR Systems
In the design architecture of traditional SAR systems, each functional unit is independently designed to ensure system transmit power, sensitivity, and imaging swath width. This approach guarantees equipment reliability and reduces electromagnetic interference (EMI) and signal crosstalk between electronic devices. However, it inevitably leads to a significant increase in the weight and volume of SAR system equipment, which fundamentally limits its compatibility with lightweight UAV platforms.
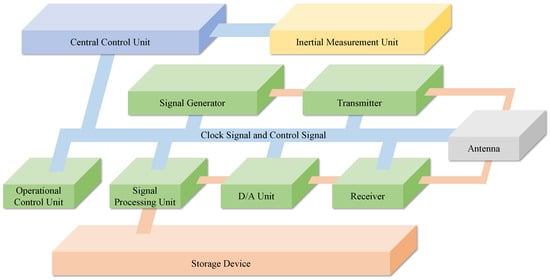
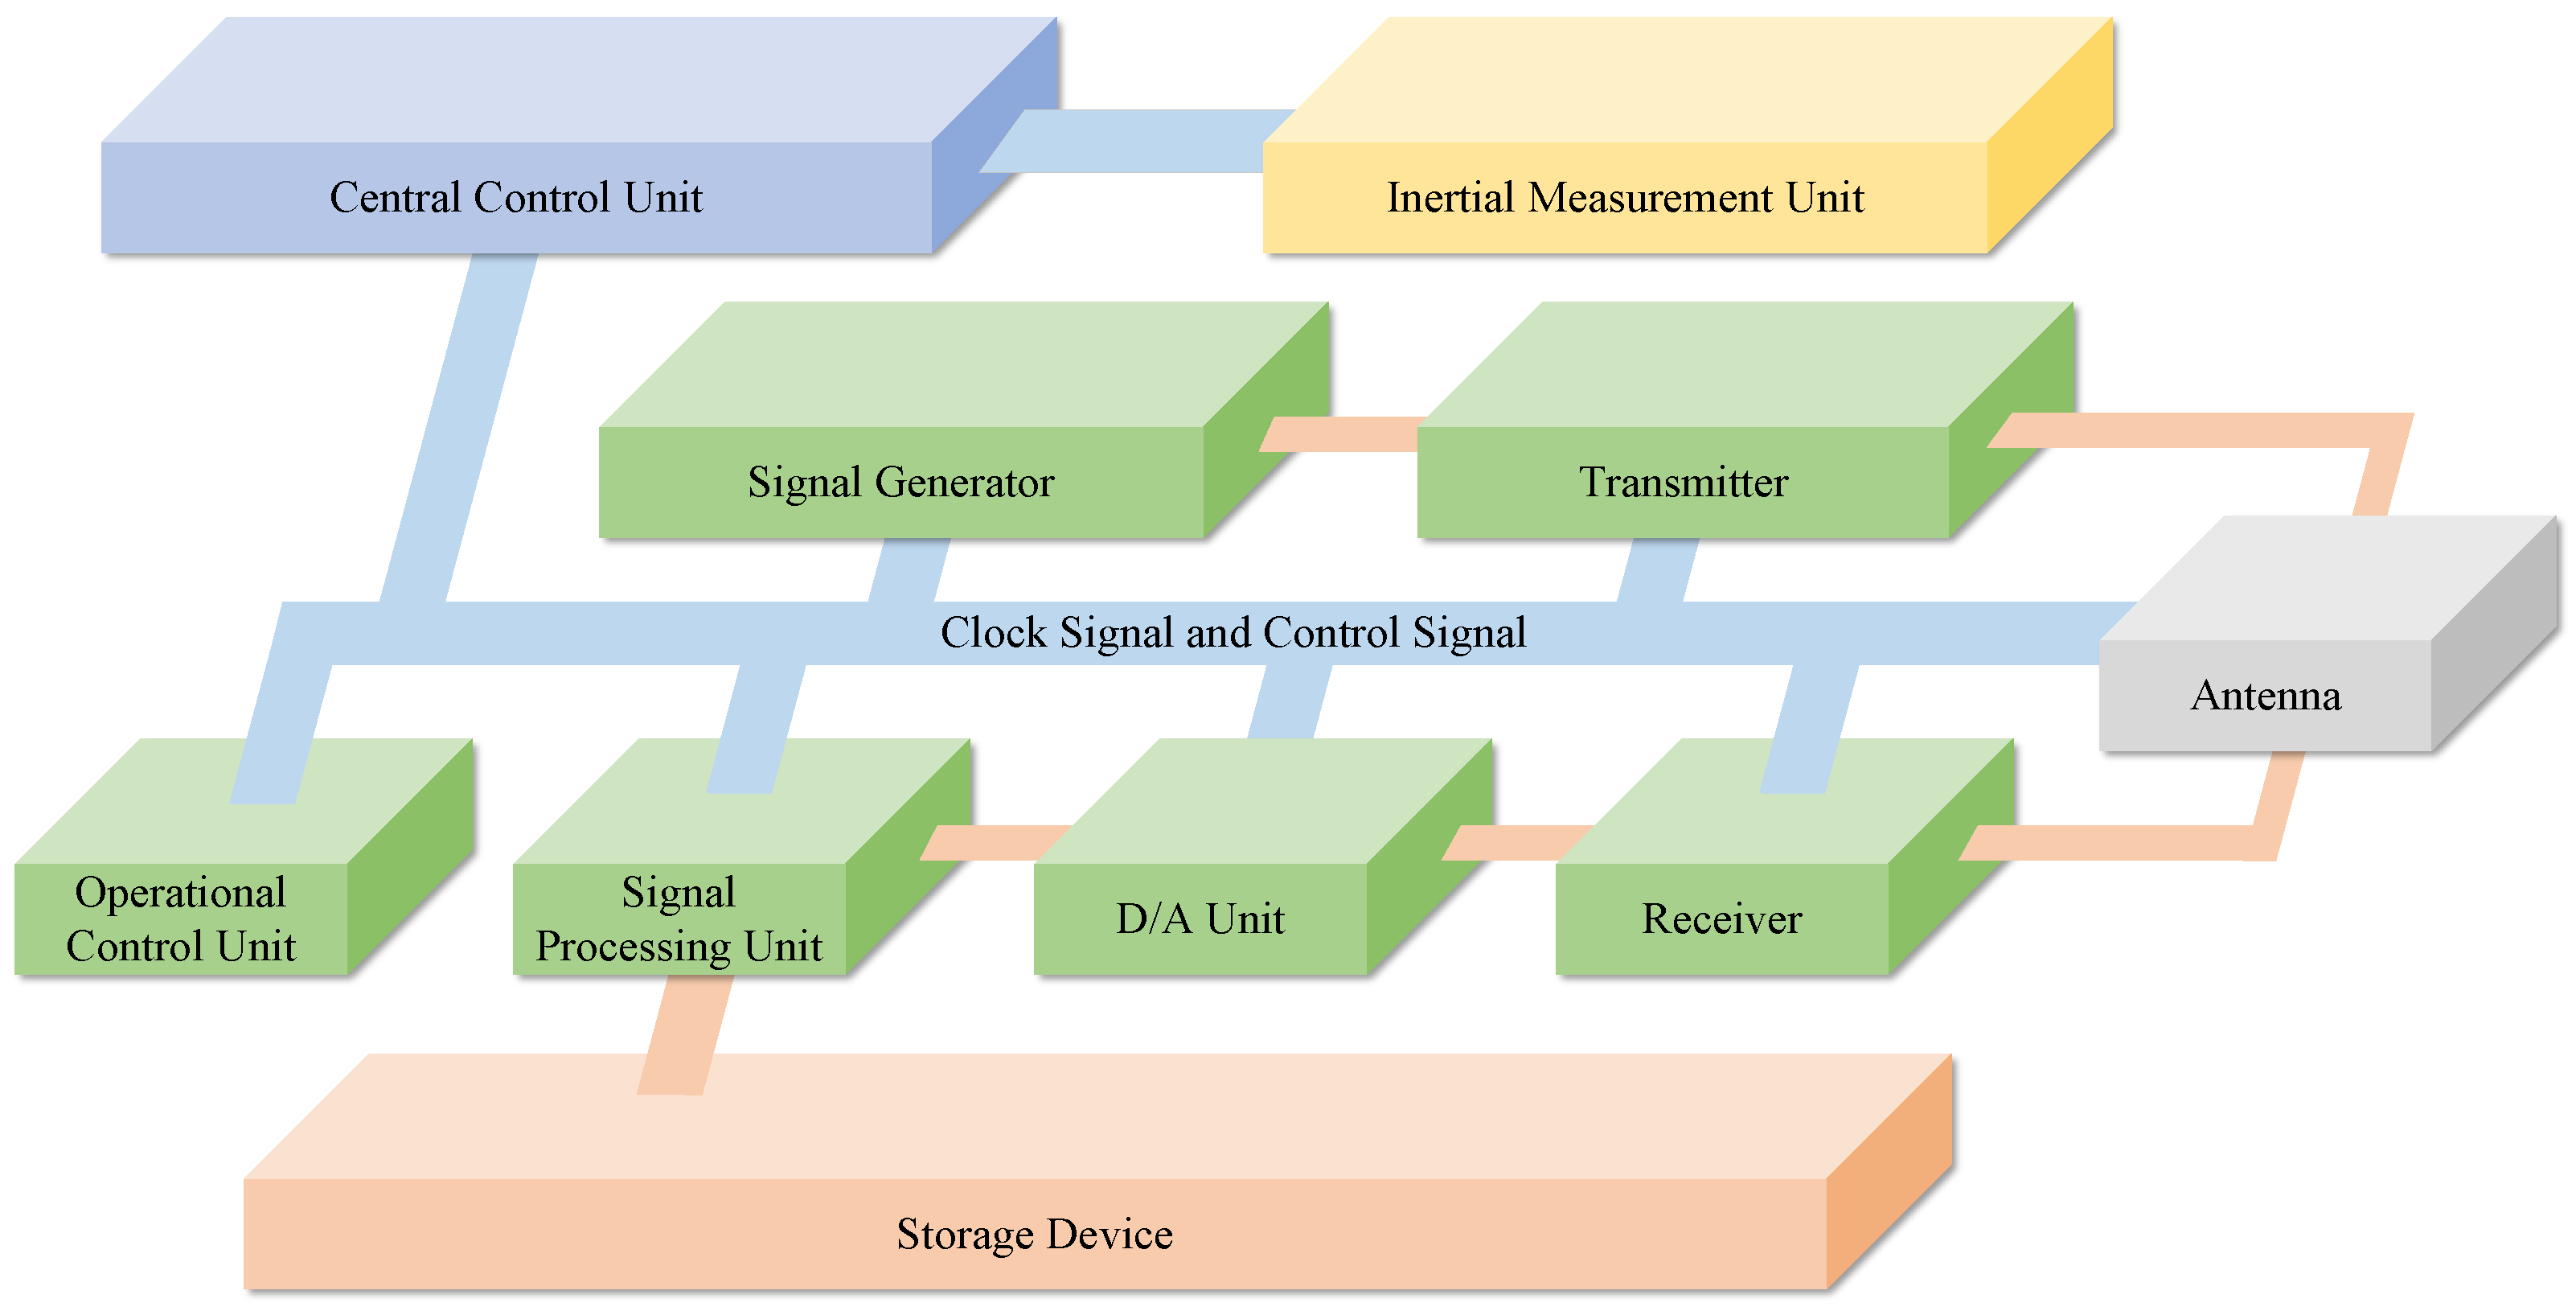
Figure 1 illustrates the composition of a traditional airborne SAR system, which consists of ten major subsystems: an Inertial Measurement Unit (IMU), a central control unit, a signal generator, a transmitter, an antenna, a receiver, an analog-to-digital conversion unit, a signal processing unit, operation control equipment, and storage equipment. Each radar subsystem operates independently, resulting in a very large system during closed-loop operation that requires professional operators on board, making it unfriendly for executing increasingly flexible and diverse observation missions in the remote sensing field. Similarly, spaceborne SAR systems must employ high-reliability aerospace-grade components for each functional unit to adapt to extreme space environments such as vacuum, high-low temperature cycling, and radiation exposure, while also requiring complex thermal control, telemetry and control, and power supply systems to ensure stable operation. These design requirements often lead to high design costs, thereby limiting the deployment quantity and application scope of spaceborne SAR systems.
Figure 1.
Traditional airborne/spaceborne SAR system architecture.
Therefore, to adapt to flexible and diverse remote sensing requirements and better leverage the application value of SAR, SAR systems with lower costs and more convenient operation are needed. In view of this, this paper proposes a pulse-Doppler SAR system suitable for lightweight and small-sized UAV platforms, with an architecture similar to traditional airborne/spaceborne SAR systems, which can execute flexible ground remote sensing missions.
2.2. Overview of the UAV SAR System
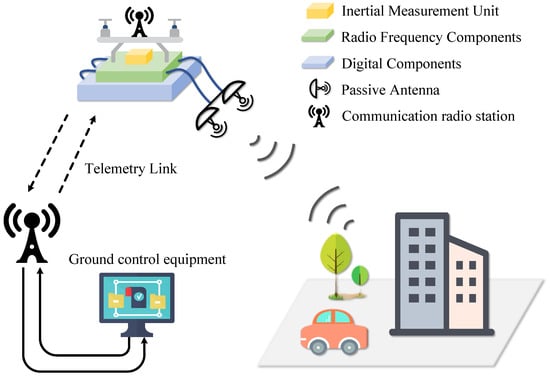
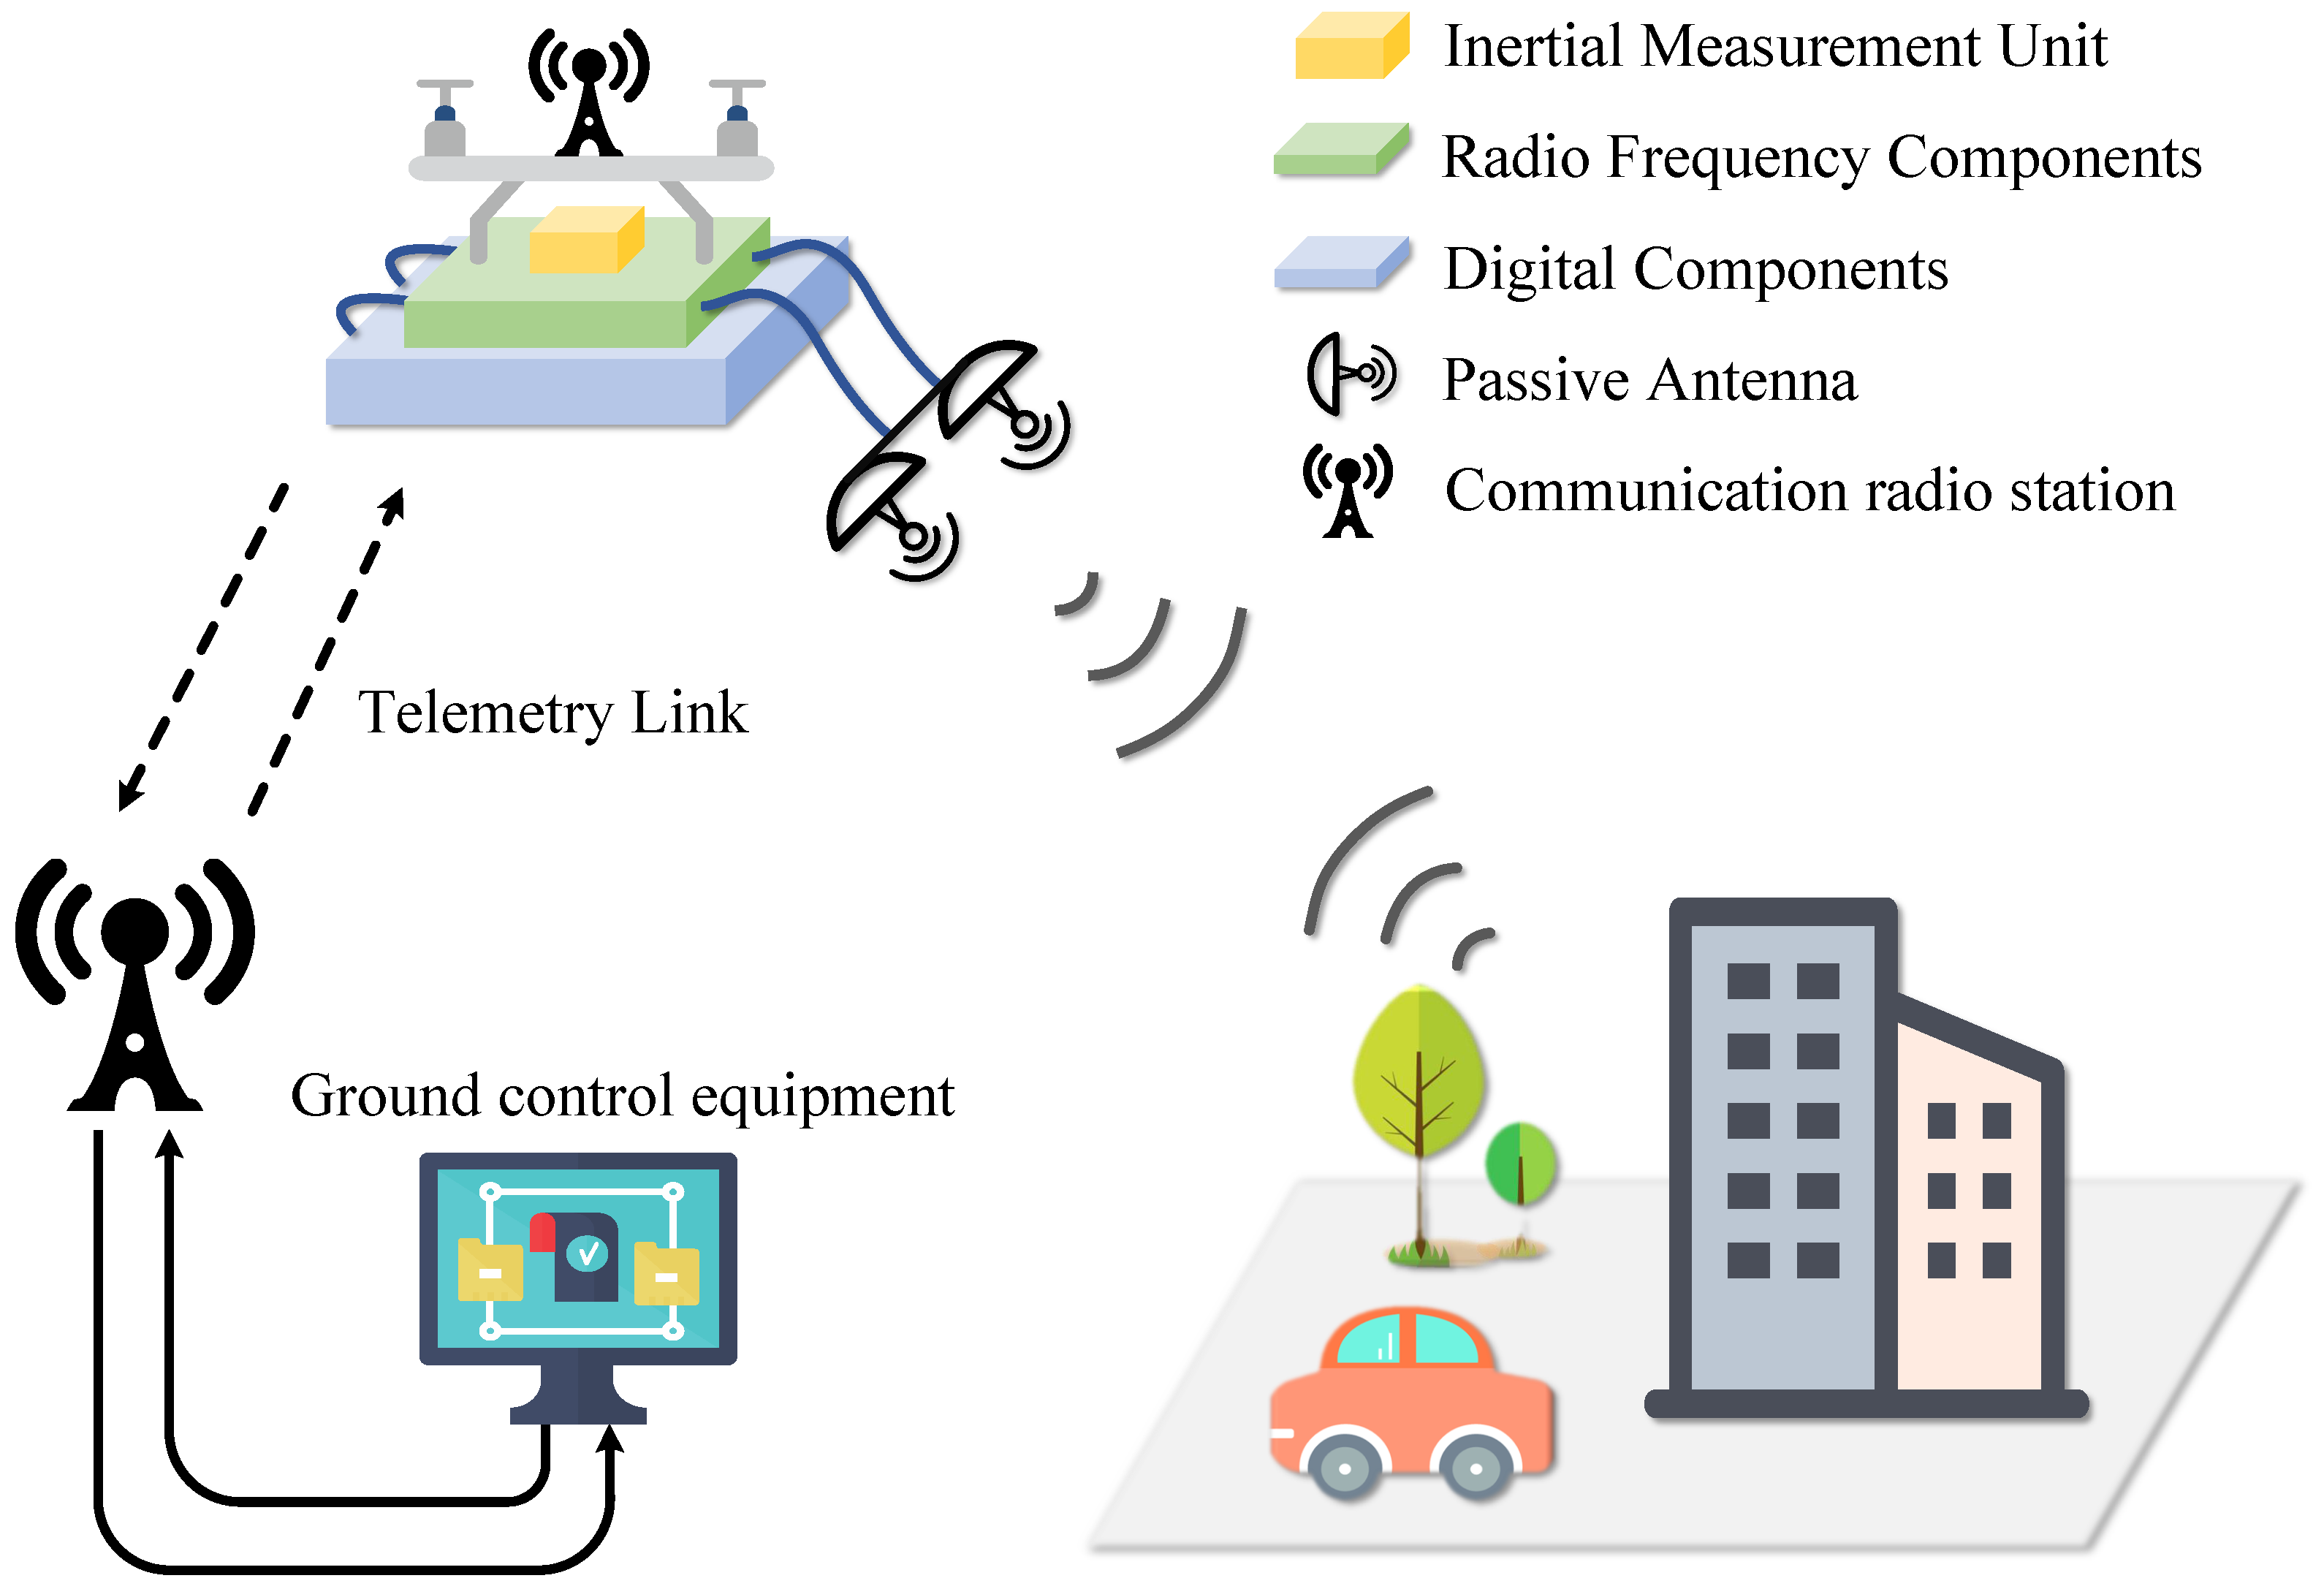
As shown in Figure 2, the SAR system proposed in this paper adopts a lightweight integrated design approach, mounted on a lightweight multi-rotor UAV platform. This platform features maneuverability, flexible deployment, and cost-effectiveness, meeting the requirements of multi-scenario, high-timeliness remote sensing missions. The entire remote sensing mission system consists of three core components: ground control equipment, airborne platform equipment, and the imaging scene. These three components work collaboratively through data links to form a complete “control–acquisition–imaging” closed loop. Specifically, the ground control equipment comprises a ground computer and a communication radio, which establish real-time communication with the airborne SAR system via telemetry links to issue control commands and dynamically acquire operational status parameters of the airborne equipment. The SAR system mounted on the UAV platform, through highly integrated and lightweight design, simplifies the complex SAR system into five components: an Inertial Measurement Unit (IMU), an RF component, a digital component, a wireless antenna, and an airborne radio dedicated to ground communication. All components work collaboratively during missions.
Figure 2.
Schematic diagram of the unmanned aerial vehicle SAR system.
When the UAV reaches the preset imaging area, the ground control equipment sends an activation command through the telemetry link, triggering the SAR system into operational state. At this point, the digital component generates LFM pulse signals based on mission planning parameters, which are transmitted in real-time to the RF component. After the RF component completes up-conversion and power amplification of the signals, the antenna directionally radiates them toward ground targets. The signals scattered by the ground targets form echo signals that are captured by the system’s receiving antenna and then transmitted to the RF component for down-conversion and signal conditioning. The processed analog signals are fed into the digital component, which performs high-speed analog-to-digital conversion (ADC), converting the analog signals into digital signals and completing storage recording to achieve reliable buffering of raw echo data. Simultaneously, the IMU synchronously records the real-time position and attitude information of the UAV platform with high precision. These data serve as the core basis for motion compensation in subsequent imaging processing and directly affect the resolution quality of the final imagery. Throughout the entire imaging process, the system’s telemetry information is transmitted back to the ground control equipment in real-time through the link, enabling continuous monitoring of the SAR system’s operational status and ensuring stable system operation during the mission.
2.3. Signal Generation and Processing
To achieve the targeted 1.2 GHz bandwidth and sub-0.3 m imaging resolution under the strict size, weight, and power (SWaP) constraints of UAV platforms, this work adopts a simplified direct IF-LFM signal generation architecture, which eliminates the complex multi-stage frequency conversion of traditional SAR systems. However, this lightweight, highly integrated design inherently concentrates amplitude and phase distortions introduced by component nonlinearities, temperature drift, and signal chain imperfections. Such distortions directly degrade the pulse compression performance, particularly the peak-to-sidelobe ratio (PSLR), and thus become the primary bottleneck limiting the achievable imaging resolution. Therefore, a dedicated two-step error correction algorithm is proposed herein to precisely compensate for these deterministic errors. This solution ensures the integrity of the LFM signal without compromising the system’s lightweight design, laying a critical foundation for realizing high-resolution imaging in practical UAV operations.
Owing to the development of DAC devices, the IF-LFM (Intermediate Frequency Linear Frequency Modulation) signal adopted in this paper is generated directly at the intermediate frequency. Typically, the characteristics of an IF-LFM signal are defined by the time duration T and bandwidth B. The expression of the IF-LFM signal is shown in Equation (1) below.
represents the center frequency, while k denotes the chirp rate of the LFM signal. The chirp rate is defined as the ratio of the bandwidth B to the time width T, as shown in Equation (2).
In SAR systems, due to the operating characteristics of various electronic components, errors exist throughout the system link. The errors from individual components accumulate through the cascaded stages of the system, which can significantly impact the final output signal and degrade the quality of the acquired SAR images. Therefore, predistortion compensation is required for the output signal to counteract the effects of system link errors on the output signal quality, thereby ensuring the accuracy of the output signal. Accordingly, the SAR system proposed in this paper employs a two-step error correction method to achieve precise error compensation.
- A.
- Amplitude Error Compensation
Errors are primarily categorized into phase errors and amplitude errors. Since the RF module drives the DAC output signal to saturation for transmission, amplitude error compensation in the transmit chain can be neglected. However, as the designed RF unit integrates both transmit and receive functions, during the down-conversion process, temperature variations and system noise can cause amplitude distortion, which in turn leads to phase distortion, resulting in errors in the pulse compression results. Therefore, amplitude error compensation in the receive chain is necessary to improve signal quality.
Due to the precisely controllable amplitude-frequency characteristic and inherent linear phase advantage of FIR filters, by properly designing the FIR filter coefficients, the amplitude-frequency response of the filter can be made complementary to the amplitude distortion characteristics of the receive chain, thereby inversely correcting the amplitude deviation of the baseband signal after digital down-conversion. Meanwhile, the linear phase characteristic can avoid introducing new phase distortion during the compensation process, ensuring signal integrity. Therefore, for amplitude compensation, a complex FIR filter is set in the receive chain, and the baseband signal after digital down-conversion is filtered through the FIR filter to achieve amplitude compensation. The key to this method lies in obtaining the FIR filter coefficients that contain the system chain.
In the experiment, echo data from the SAR radar operating at maximum bandwidth over a period of time were collected. The echo signal in the time domain can be expressed as:
where is the echo signal, the subscript n represents the current echo number, is the amplitude error, is the phase error, t is the time variable, and is the echo delay time. The multiple echoes in the aforementioned raw data are averaged in the azimuth direction. The equation is as follows:
where is the echo signal after averaging in the azimuth direction, and N is the total number of echoes. For the actual data, the implementation process of the above equation is to sum the corresponding sampling points of multiple pulses in the azimuth direction and then take the average. After Fourier transform, the spectral characteristics of the above echo can be written as:
where is the frequency-domain representation of , is the spectrum of the ideal linear frequency modulated (LFM) signal, is the system’s inherent error transfer function, and is the system’s random additive noise. A windowed matched filtering algorithm is adopted, where is multiplied by the conjugate of the ideal LFM signal , and then the resulting signal is windowed in the time domain. The equation for this process is as follows:
where is the system amplitude error, is the system phase error, and is the window function used for windowing processing. Based on the amplitude and phase error information, a complex-coefficient FIR filter is designed using the Remez algorithm [24,25]. Extracting its primary phase can be expressed by the equation:
where is the frequency-domain representation of the filter, N is the filter order, and is the angular frequency. Applying Euler’s equation, when N is an even number, Equation (7) can be transformed to obtain:
with
The basis functions of Equation (8) can be expressed as:
When N is an odd number, Equation (7) can be transformed to obtain:
with
The basis functions of Equation (11) can be expressed as:
Taking N as an even number as an example, the FIR filter design process is described. First, the error function is defined as:
where is the error weighting function, is the system amplitude-phase error characteristic, and is the filter’s amplitude-phase characteristic. Substituting Equation (8) into (14) and expanding, and letting , the initial frequency point set is uniformly selected on the frequency axis as the initial point set, which can be expressed as the following system of equations:
After solving the system of Equation (15), the approximation error corresponding to the initial point set is obtained according to Equation (14). Extrema are then found on the error curve, and points are selected from these extrema as the new frequency point set. The rules for selecting extrema are as follows: priority is given to selecting extrema within the passband, and at least one extremum must exist outside both stopbands; priority is also given to selecting extrema with larger errors; and two extrema that are too close to each other should be avoided. The above steps are repeated until the point set no longer changes. According to the solution , of the system of equations, can be obtained from Equation (9), which is the complex-coefficient FIR filter coefficient .
Furthermore, to suppress the in-band ripple of the above filter, time-domain windowing is applied, which can be expressed as:
where is the filter coefficient, is the window function, and is an adjustable parameter whose value can be changed to adjust the shape of the window function and optimize the compensation effect. After compensating the echo with the complex-coefficient FIR filter obtained above, the residual compensation error is extracted. The equation for this process is as follows:
where is the frequency-domain representation of . After that, the residual error is extracted, and the error weighting function in the Remez algorithm is updated based on the residual error. The Remez algorithm is then used again to design an FIR filter for iterative echo compensation until an inflection point appears in the performance index. The error weighting function in Equation (15) is updated according to the residual error, and the equation is as follows:
where is the updated error weighting function, is the initial error weighting function, and represents the relationship between the error function in the angular frequency domain and E in the frequency domain, where is the residual error calculated in the -th iteration. After updating the error weighting function, the FIR filter is redesigned, yielding a new set of complex-coefficient FIR filter coefficients. The residual error is then recalculated, and pulse compression processing is performed. If the performance index after pulse compression is optimized, the weighting function is updated and the iteration continues. If the performance index after pulse compression deteriorates, the algorithm terminates.
- B.
- Phase Error Compensation
Phase error is caused by the combined effects of multiple factors in the entire system link, such as temperature variations, cable loss, signal delay, and signal processing filtering, and can be expressed as:
where represents the original signal phase acquired by the DAC through closed-loop experiments. This original phase is mathematically expressed as the sum of the ideal signal phase and the phase error introduced by the system link. Therefore, by comparing with the standard signal, the error phase can be extracted. During signal generation, the error phase is subtracted from the standard signal phase to generate the pre-distorted signal phase , which can be expressed as:
The phase of the pre-distorted signal is the standard signal phase minus the phase variation caused by system link errors. When transmitting the pre-distorted signal, after the signal passes through the system link, the system link error phase that was subtracted from the pre-distorted signal phase will be reintroduced. Finally, the recorded signal is a standard signal free of phase errors. Therefore, it is crucial to obtain the phase error of the system. The piecewise linear fitting method can balance the system resource consumption and the fitting accuracy of the error.
During phase error compensation, the original signal with errors after passing through the entire system link is first acquired. The original signal phase is then compared with the ideal error-free reference signal phase generated by the computer to extract the phase error curve between the original signal and the reference signal, which can be expressed as:
Subsequently, the error curve is divided into L segments. Assuming each segment contains N points, linear fitting is performed on each sub-segment to obtain the intercept and slope of each sub-segment. The expression of the segmented phase error curve can be expressed as:
where represents the phase error value, and n represents the number of sampling points. For each sub-segment, the phase error compensation within that segment is first calculated through integration. Since the error of each sub-segment is obtained through linear fitting, for each sub-segment, it can be expressed by a linear equation:
where and are the slope and intercept of the i-th sub-segment, respectively, t is time (or the sequence number of sampling points), and and represent the start and end times of that segment, respectively. Since the phase error introduced by the system link is additive, the signal phase after pre-distortion compensation can be obtained by subtracting the phase error obtained through integration from the original phase, as shown in Equation (20).
This method of improving signal quality through phase error compensation can effectively reduce the phase error introduced by system link errors, thereby improving the resolution and quality of the final SAR image. It should be noted that since the UAV-SAR system proposed in this paper is flexible and lightweight, it adopts a pre-stored waveform approach for transmission. The advantage of this strategy is that waveforms can be flexibly programmed according to mission requirements. During phase error compensation, the error signal can be extracted point by point, i.e., , which enables the most accurate compensation for phase errors and avoids errors caused by insufficient fitting accuracy in the linear fitting process.
2.4. Signal Chain Component Design
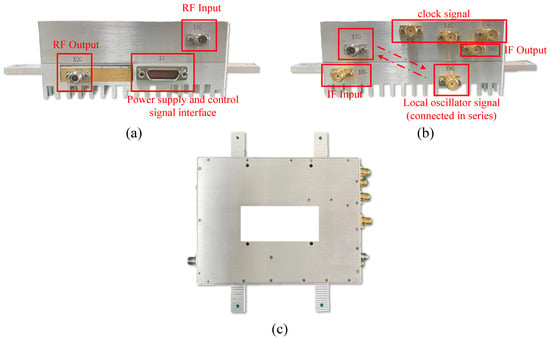
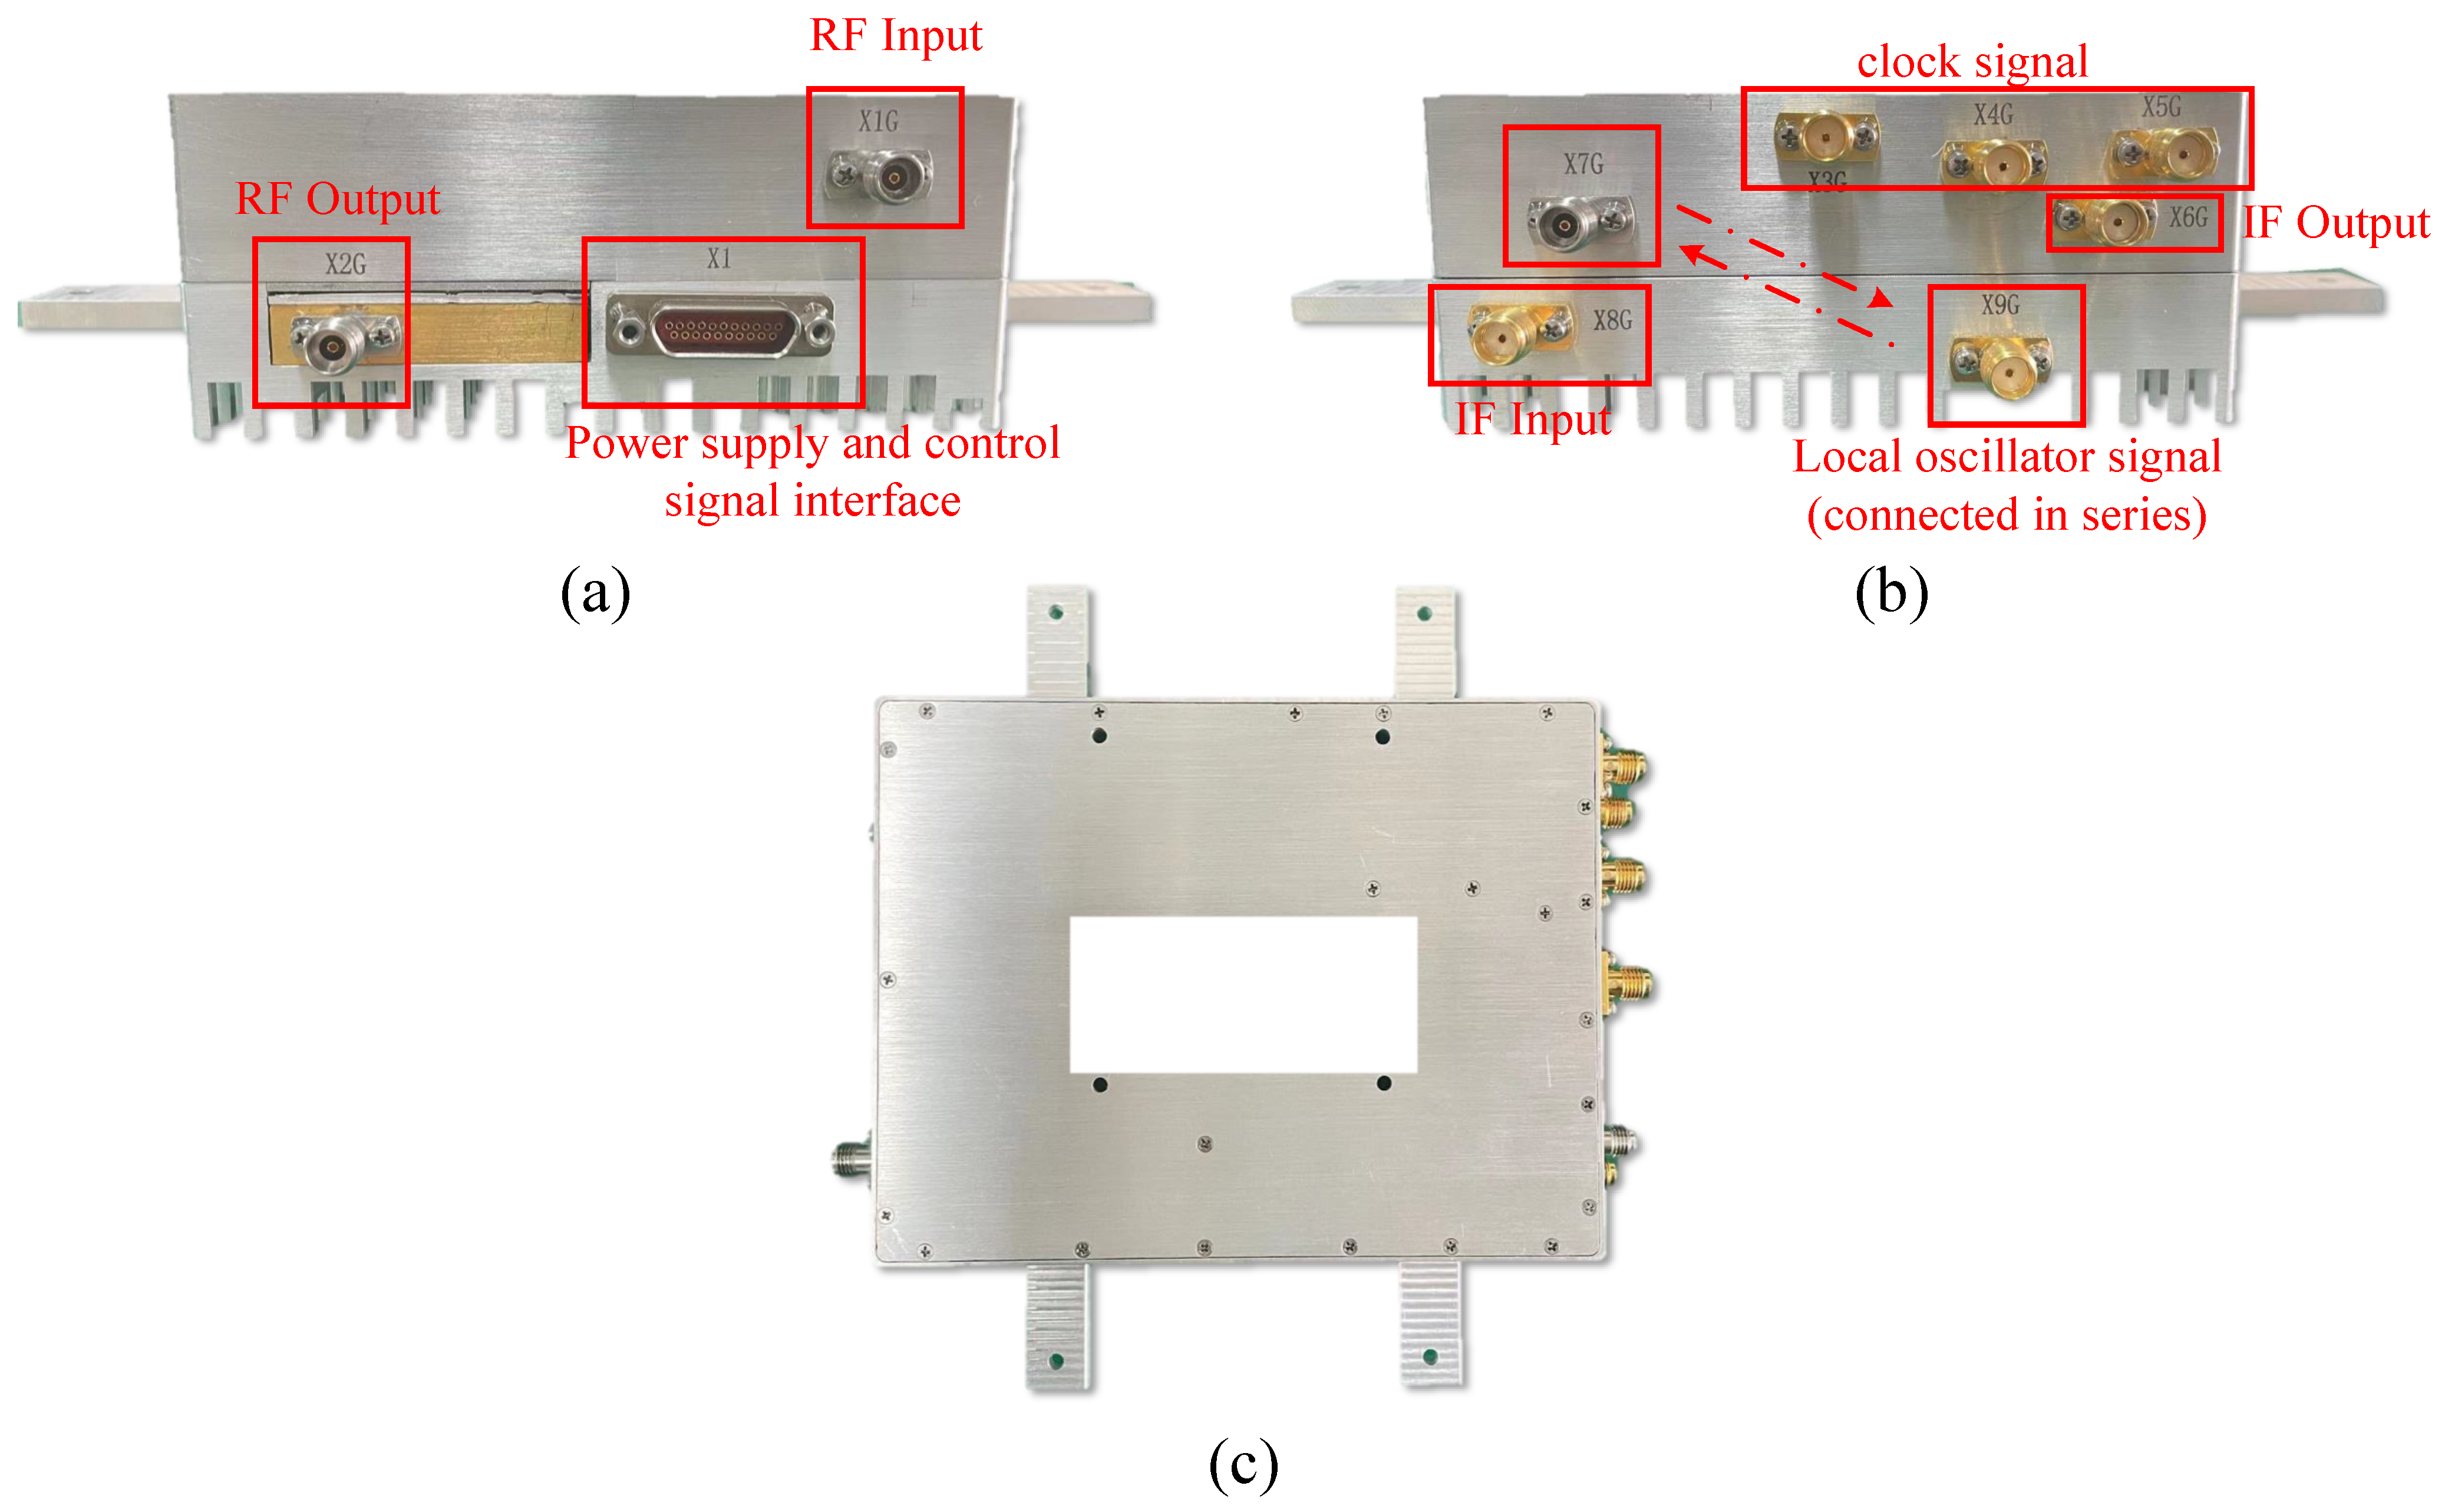
As shown in Figure 3, to simplify the SAR system, the traditional signal transmitter and receiver are integrated into a single RF component. This RF module integrates multiple functions including the SAR system clock, signal up-conversion, down-conversion, signal amplification, and signal attenuation. As shown in Figure 3b, the X7G and X9G interfaces are the local oscillator (LO) signal output and input interfaces, respectively, and are connected to each other. The X3G, X4G, and X5G interfaces provide reference signal sources to the digital component, enabling the SAR system to operate properly. The X6G and X8G interfaces are connected to the IF signal input and output DAC and ADC interfaces on the digital board, respectively, for transmitting the output IF-LFM signal. Similarly, as shown in Figure 3a, the X1G and X2G interfaces are used to connect the antenna for signal transmission and reception, while the X1 interface integrates power supply and signal control functions.
Figure 3.
The designed RF component: (a) left view of the RF component, (b) right view of the RF component, (c) top view of the RF component.
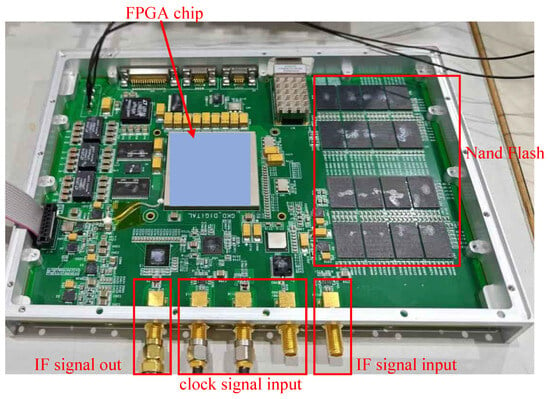
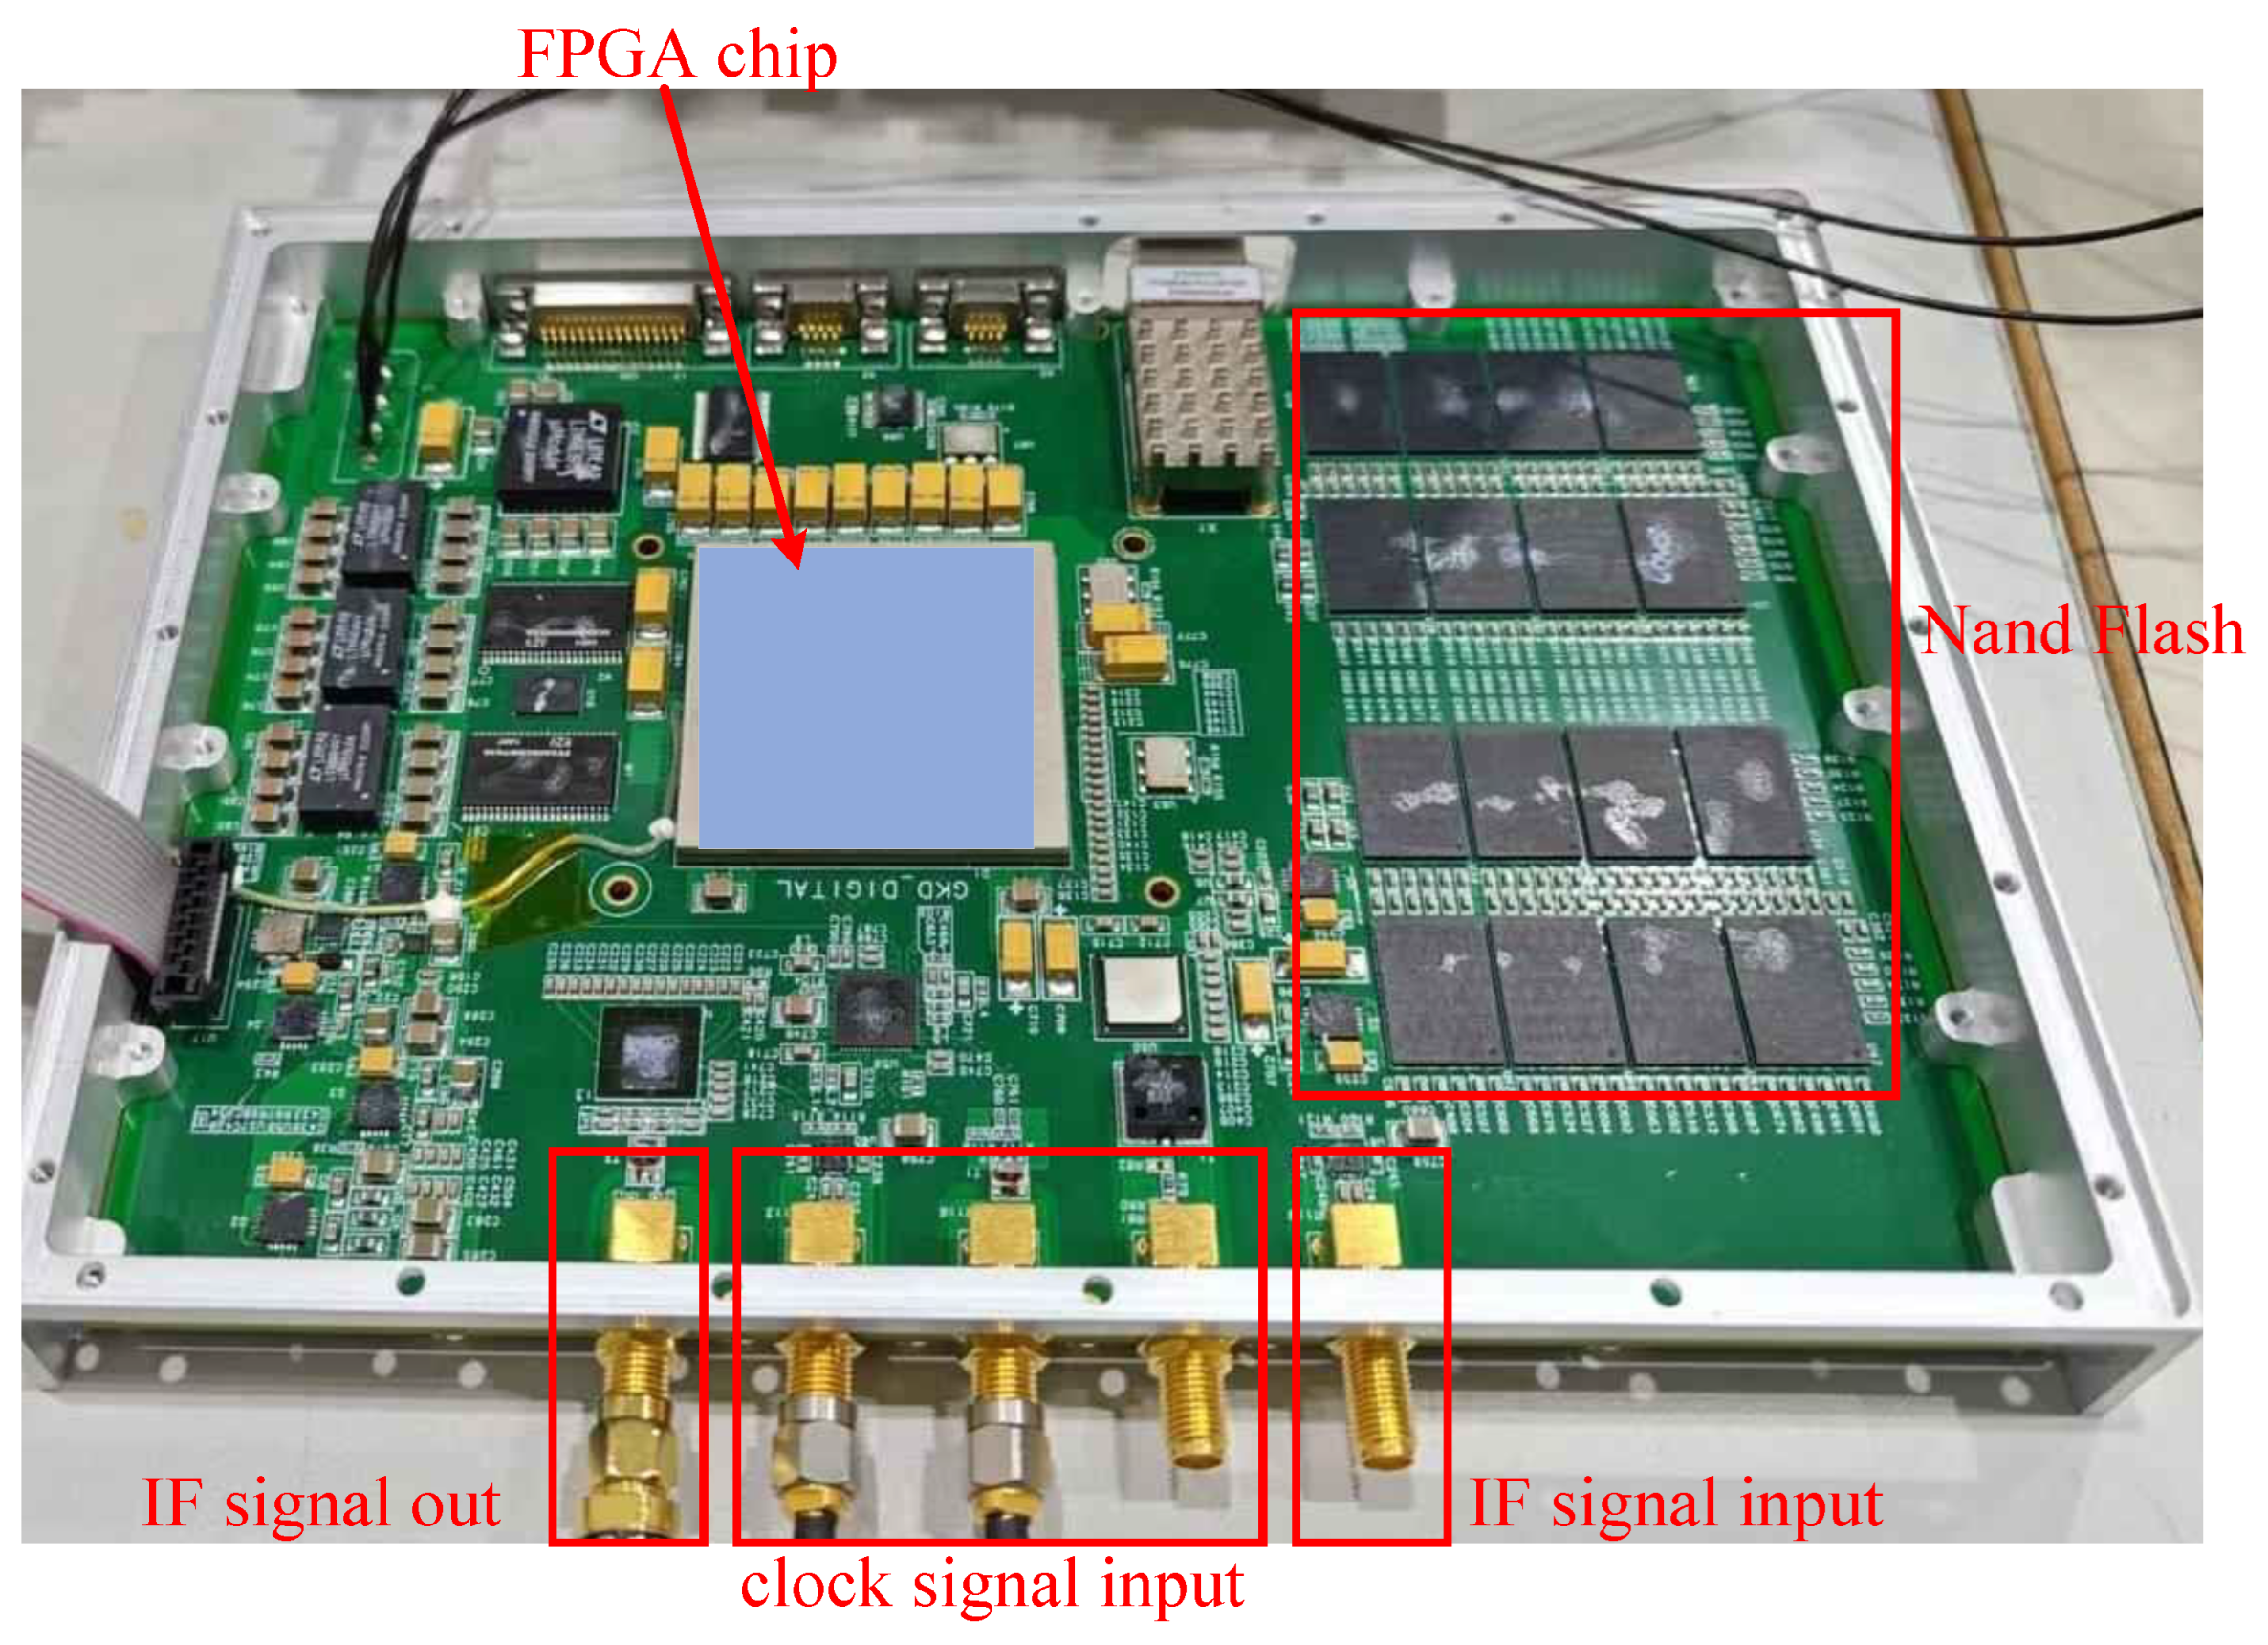
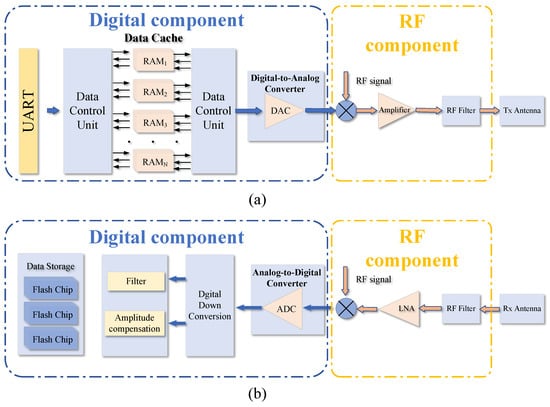
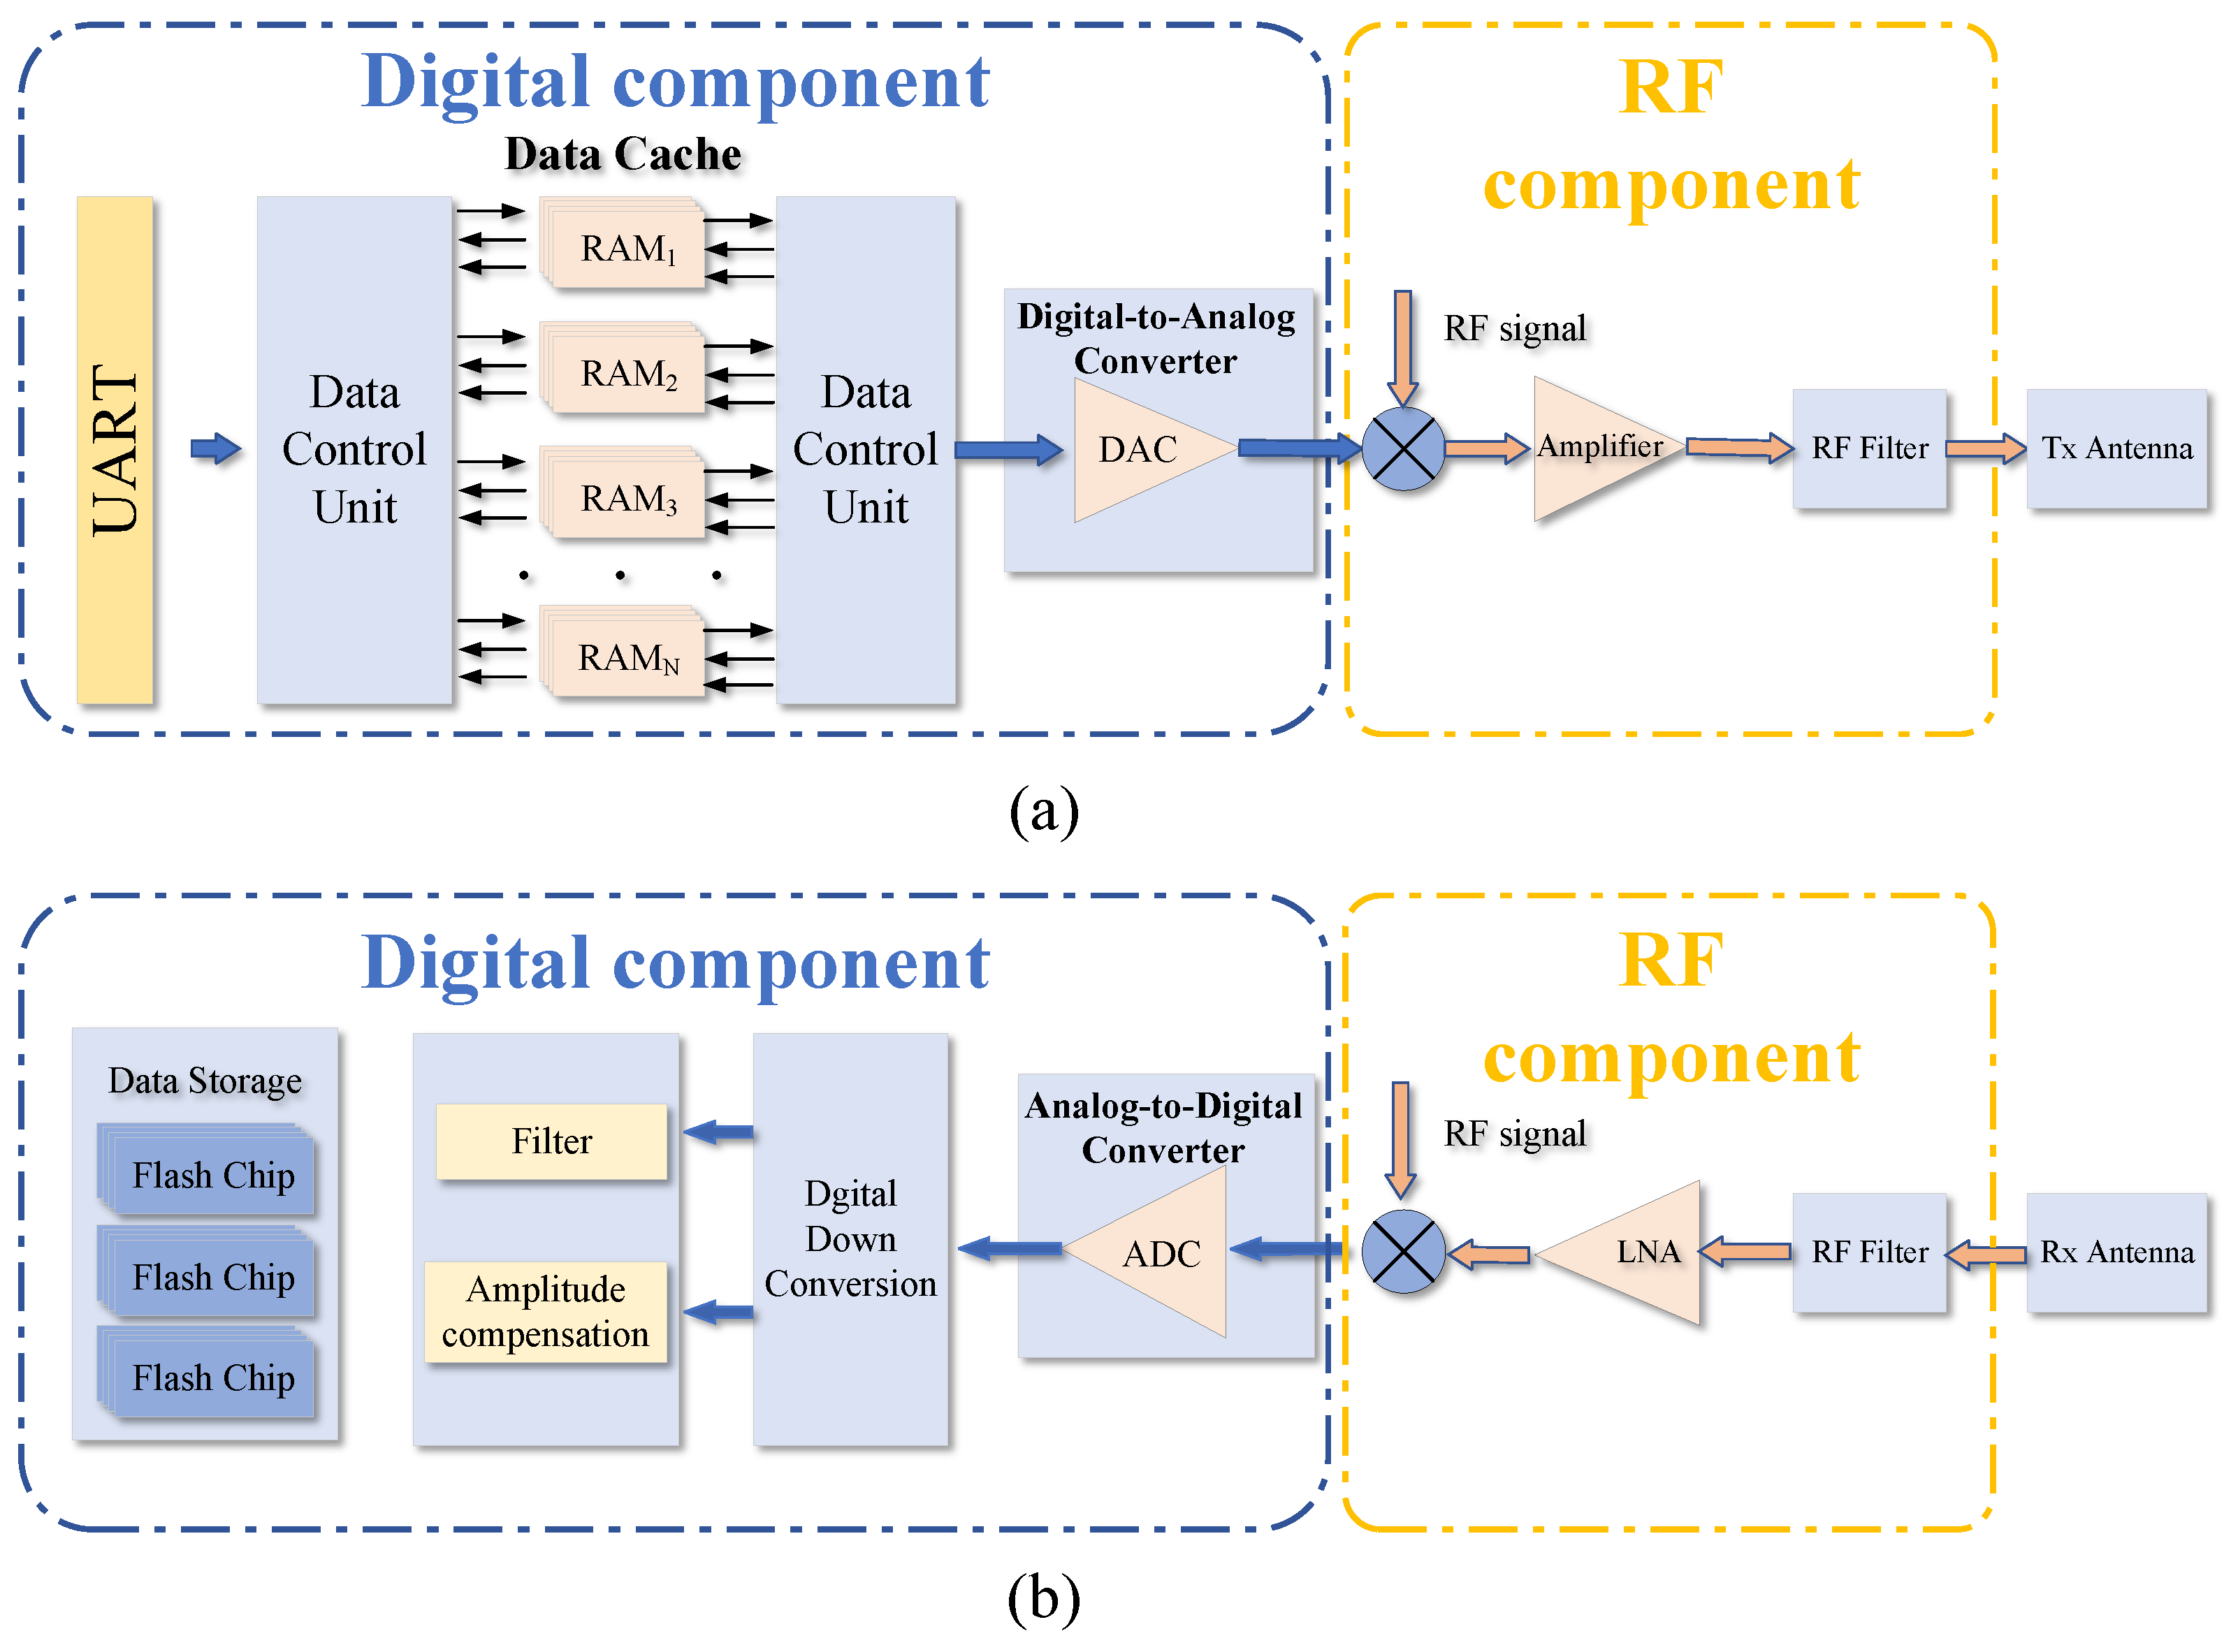
The digital component designed in this paper is shown in Figure 4. It is also used for generating nonlinear frequency modulation signals [23]. This component integrates multiple functions including SAR system control, telemetry information transmission, signal generation, signal output, signal input, and signal storage. The signal transceiver chain of the UAVSAR system is shown in Figure 5. Control commands are transmitted wirelessly between the transceiver radio stations. The digital component begins to execute the mission upon receiving commands. According to the control commands, the IF-LFM signal stored in RAM is read, and under the synchronization of the control system, one signal path is split into sixteen parallel signals conforming to the JESD204B format and sent to the DAC. The DAC outputs the IF-LFM signal to control the RF component operation, and the telemetry information is transmitted back through the radio station. After waiting for the 2.4 GHz intermediate frequency signal output from the digital component, it is up-converted to the Ka-band by the RF component, then amplified by an amplifier to 10 W and output to the antenna. The output signal has a center frequency of 35 GHz, a peak power greater than 40 dBm, and a maximum bandwidth of 1200 MHz.
Figure 4.
The designed digital component [23].
Figure 5.
Schematic diagram of the signal transceiver chain: (a) Signal transmission chain; (b) signal reception chain.
After the FPGA of the digital component sets the system’s sampling delay and echo window length according to the uplink command, when the echo is received, it passes through a low noise amplifier (LNA) and is then down-converted to 2.4 GHz by the down-conversion circuit and output to the digital module. The signal is then sampled by the ADC and stored in the NAND Flash storage array on the board.
It is worth noting that the digital component developed in this paper integrates waveform generation, system control, waveform acquisition and storage into a single FPGA chip. As shown in Table 1, the utilization rates of the main resource types do not exceed 30%. Therefore, the remaining idle resources of the FPGA can support the Ka-band SAR system to perform other complex tasks beyond its basic functions, such as real-time imaging and BAQ compression.
Table 1.
FPGA Resource Utilization.
2.5. Design of a Lightweight and Compact Antenna for UAV-SAR
With the increasingly stringent requirements for lightweight, highly integrated antennas on UAV platforms—including high efficiency, structural robustness, and effective thermal management—and the rapidly growing demand for millimeter-wave technology in UAV SAR systems, waveguide antennas have become one of the most active research directions in the field of UAV antennas. Waveguide slot antennas can integrate guided-wave transformation, transmission, and radiation within a compact structure, offering high efficiency, large power-handling capacity, and excellent structural strength. These features make them particularly suitable for UAV platforms, which impose strict constraints on weight, size, and reliability.
- A.
- Design of Antenna Radiation Elements
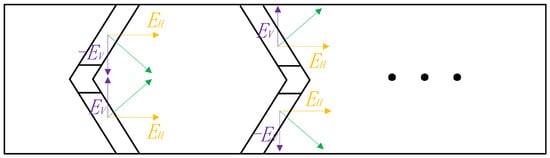
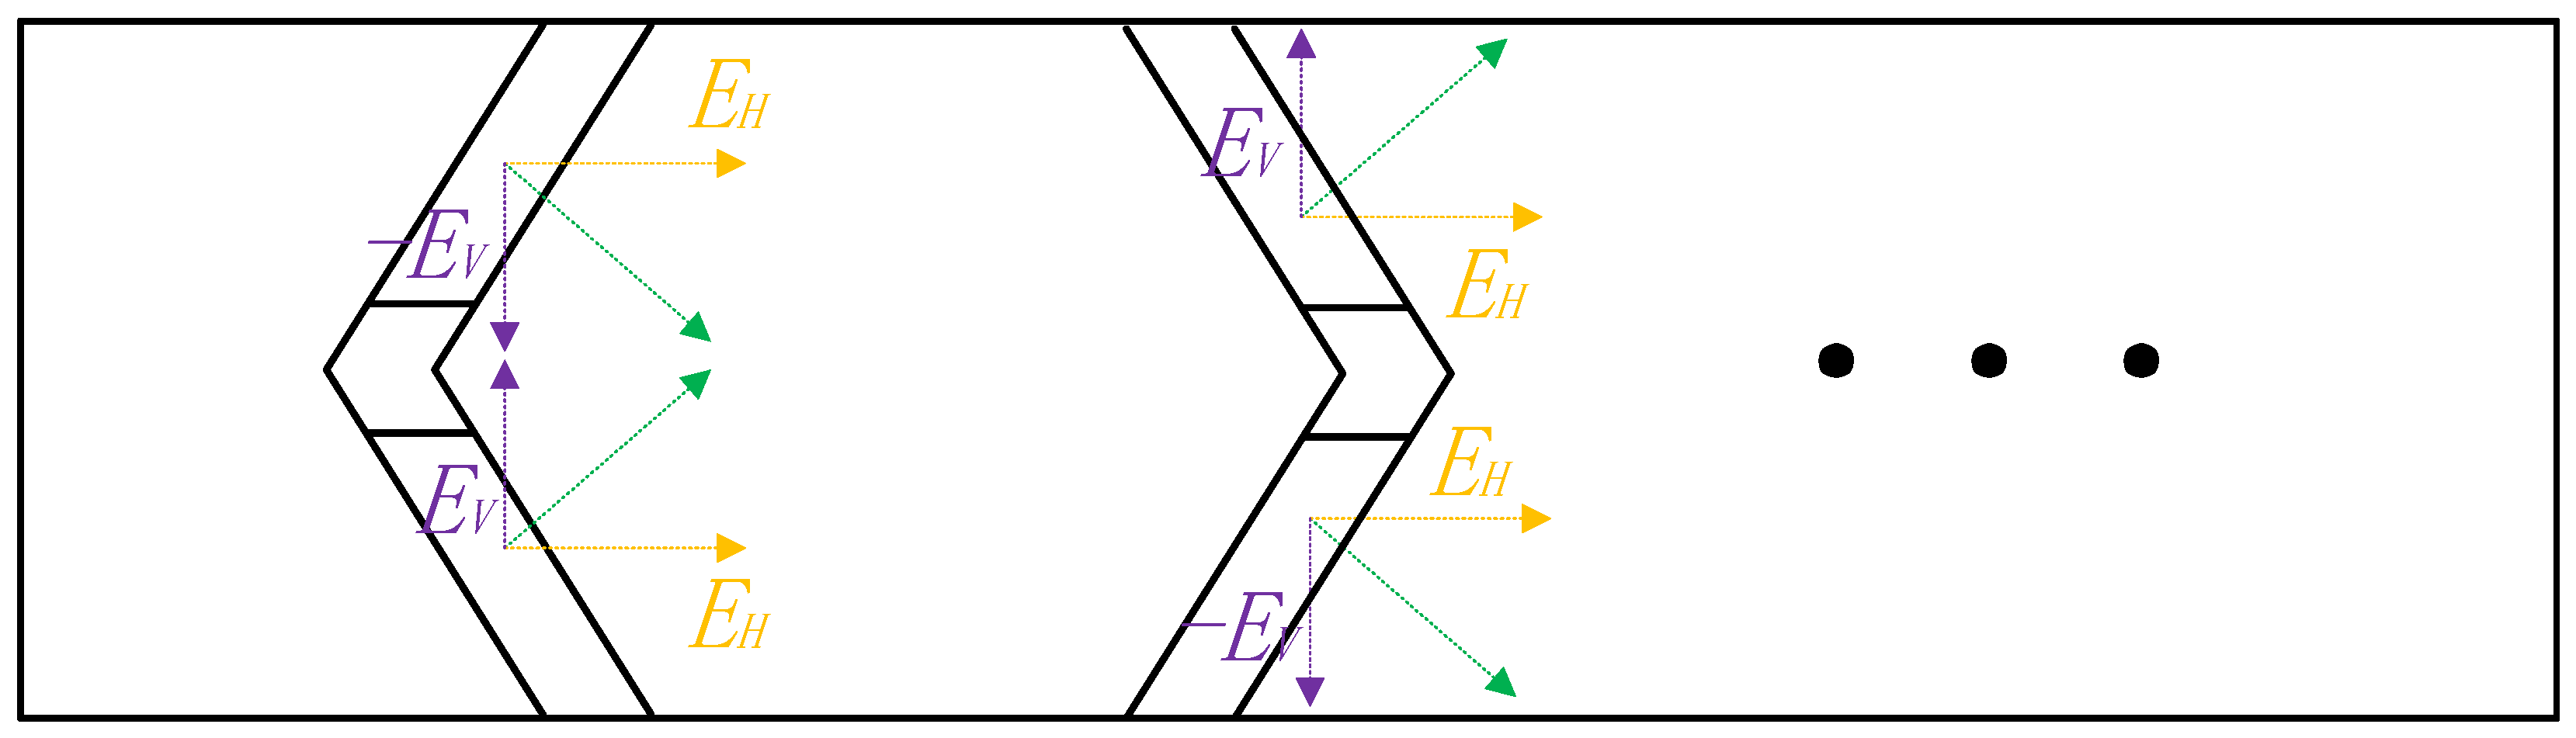
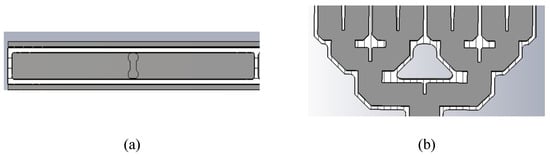
The parameters of the SAR antenna are listed in Table 2. The designed antenna operates at a center frequency of 35 GHz with a bandwidth of ≥1200 MHz and adopts HH polarization. The required azimuth beamwidth is 4.4°, and the required range beamwidth is 8.46°. The antenna aperture size is 100 mm × 52 mm (azimuth × range). With an azimuth element spacing of 6.25 mm and a range element spacing of 6.5 mm, the antenna array consists of 16 radiating elements in the azimuth direction and 8 elements in the range direction, which also facilitates the design of the subsequent power division network. According to the polarization and bandwidth requirements of the SAR system, a rectangular symmetric ridged waveguide loaded with a V-shaped slot is adopted to achieve the desired radiation characteristics. The V-shaped slot is composed of two symmetrically inclined segments, as shown in Figure 6. For either segment, the tangential electric field can be decomposed into a horizontal component and a vertical component . Due to the structural symmetry, the horizontal components of the two segments have the same direction and phase, resulting in in-phase superposition in the far field and thus enhancing the main polarization radiation. In contrast, the vertical components of the two segments have opposite directions but the same phase, leading to mutual cancellation during radiation and effectively suppressing the cross-polarization component.
Table 2.
Design Parameters of UAV-SAR Passive Waveguide Slot Antenna.
Figure 6.
Schematic of the antenna V-shaped slot structure.
- B.
- Design of the Waveguide Power Divider
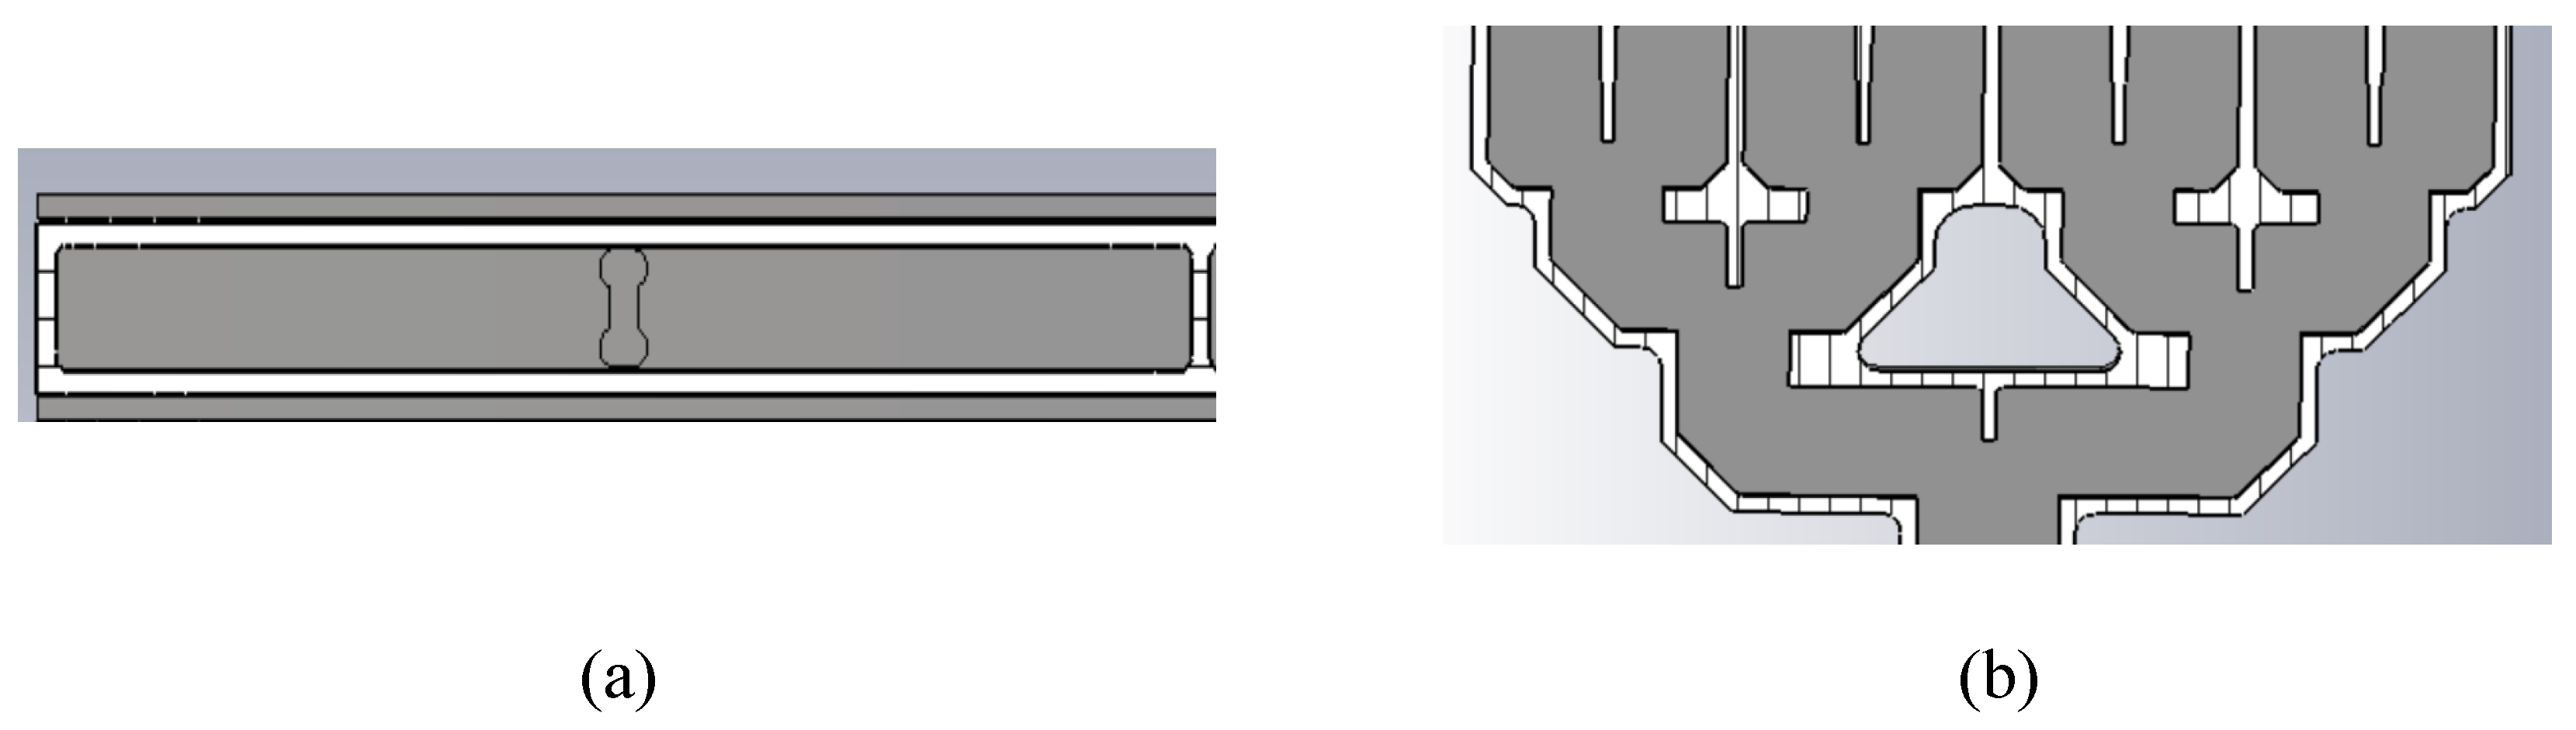
To achieve efficient energy coupling between the feeding waveguide and the radiating waveguide, the antenna design employs an H-shaped slot coupling structure. This slot is etched on the common wall of the two waveguides and has an overall shape resembling the letter “H”, as shown in Figure 7a. When the dominant mode (TE10 mode) in the feeding waveguide propagates to the H-shaped slot region, the slot interrupts the surface current on the waveguide wall, thereby exciting a tangential electric field at the slot. This electric field can penetrate the common wall and excite the same propagating mode in the upper radiating waveguide, enabling effective energy transfer from the feeding waveguide to the radiating waveguide.
Figure 7.
Structure Diagram of H-Shaped Waveguide and T-Junction Power Divider. (a) Schematic diagram of the H-shaped slot-coupled structure. (b) Schematic diagram of the cascaded three-stage waveguide T-junction power divider.
Compared with a simple rectangular slot, the H-shaped slot has a more complex current path and a longer effective electrical length. Its structure can be equivalent to two parallel longitudinal slots connected by a transverse bridge. This configuration provides stable and strong coupling over a wider frequency band, helping to extend the operating bandwidth of the antenna. In addition, the H-shaped structure is usually symmetric about the waveguide centerline, which not only facilitates exciting a symmetric field distribution in the radiating waveguide and ensures amplitude and phase consistency among array elements but also helps suppress the generation of higher-order modes, improving the overall radiation performance.
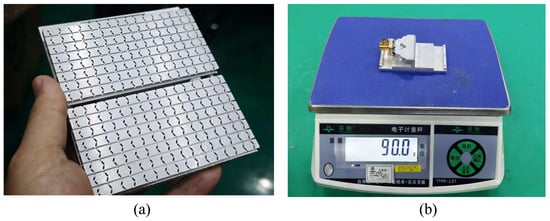
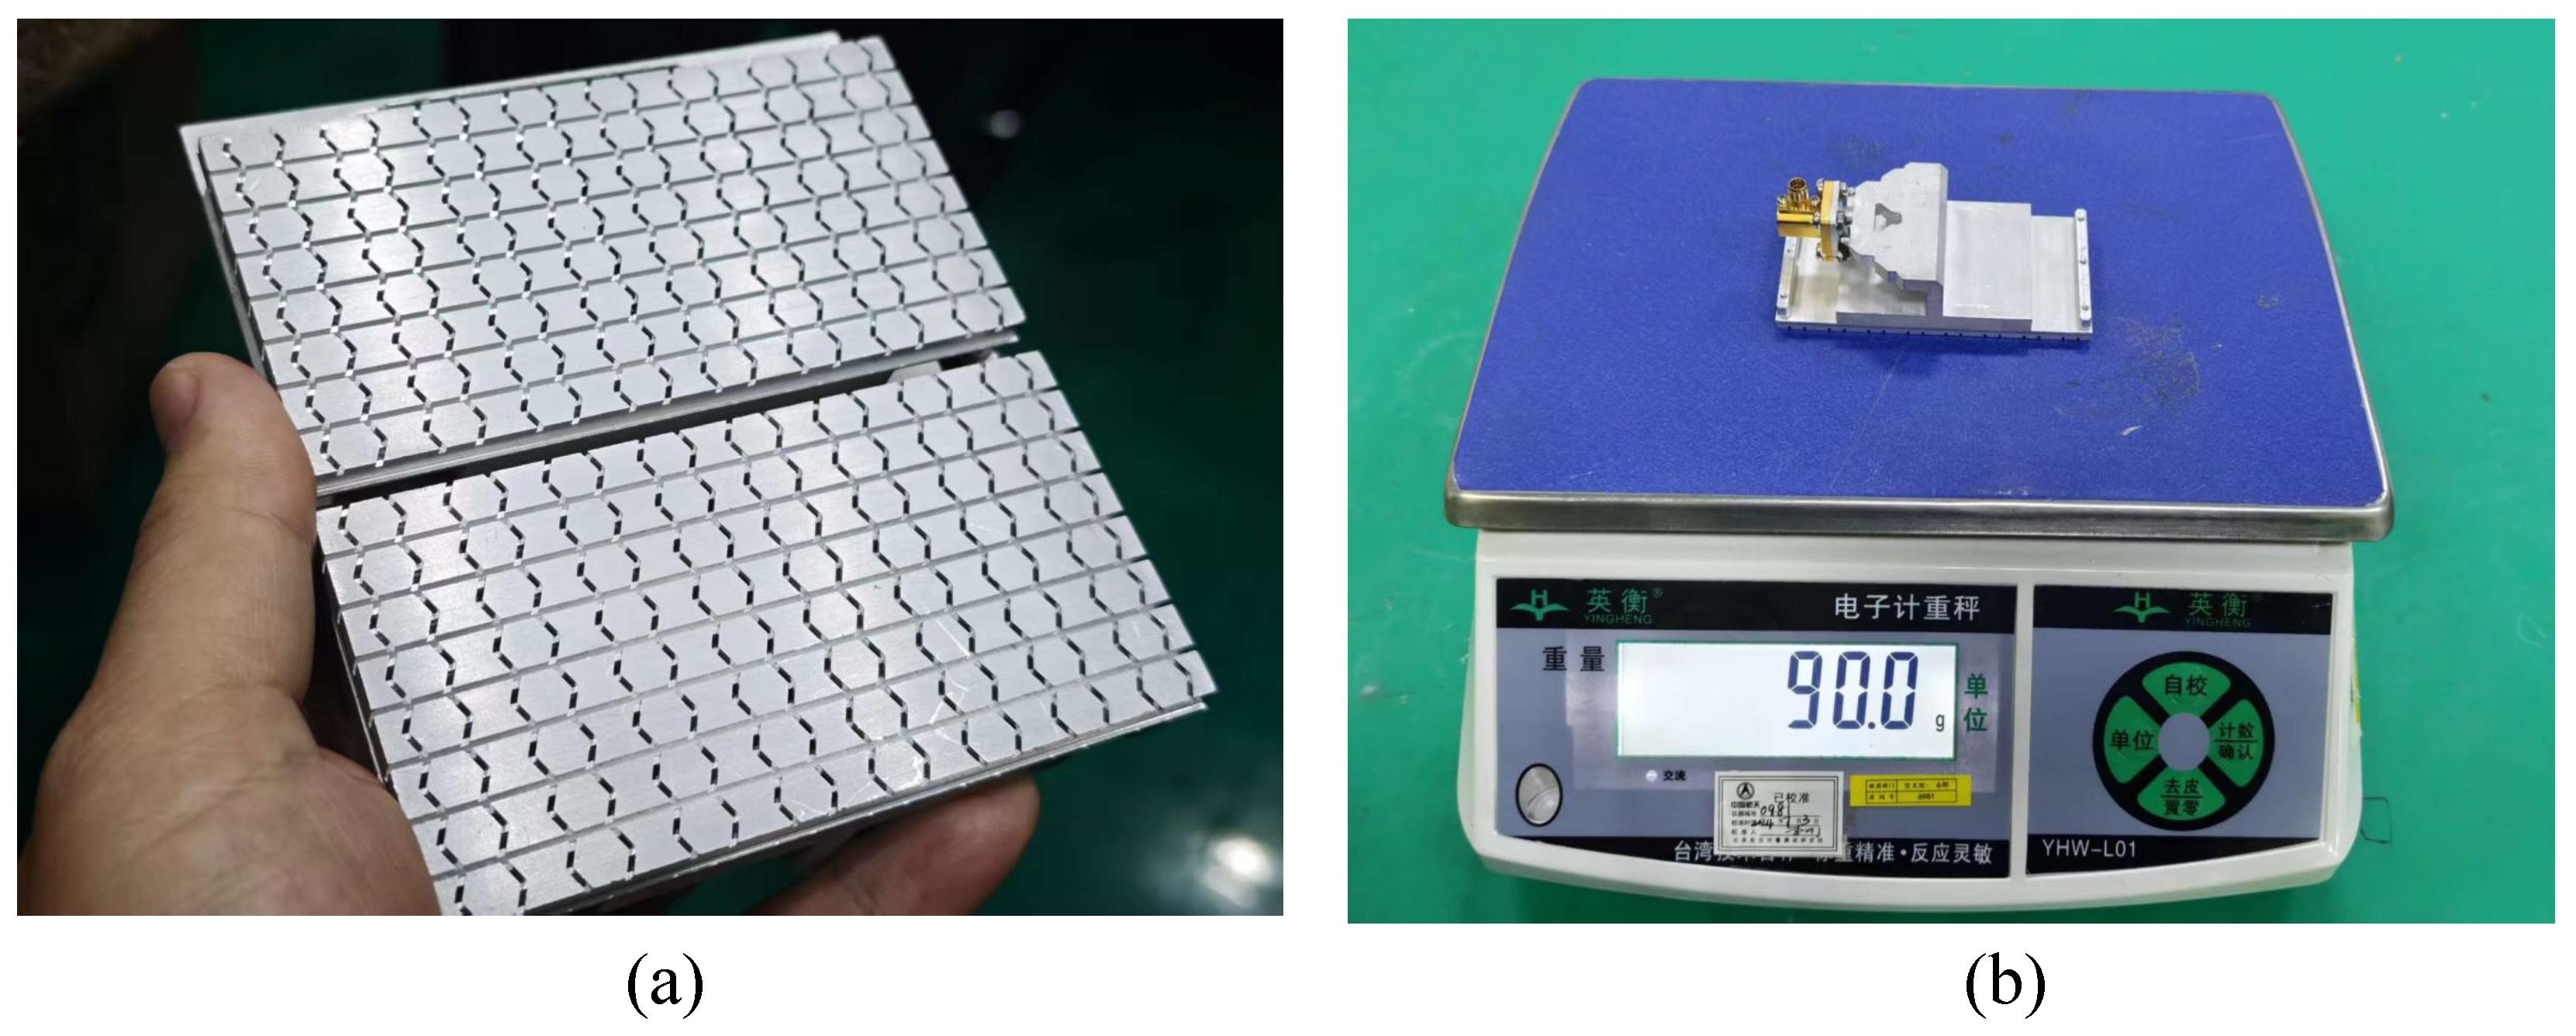
Furthermore, to achieve 8-channel power division in the range direction, this design adopts a three-stage waveguide T-junction power divider cascade to form a 1-to-8 power distribution network, as shown in Figure 7b. The T-junction waveguide power divider is one of the most commonly used basic power division structures in microwave engineering, featuring a simple structure, high mechanical strength, and large power-handling capacity. By adjusting its geometric parameters, equal or unequal power division can be flexibly achieved to meet the low-sidelobe requirements of the antenna array. Meanwhile, this structure is easy to fabricate and can be conveniently interconnected with standard waveguide-to-coaxial adapters, facilitating system integration. The designed passive waveguide slot antenna is shown in Figure 8a. As illustrated in Figure 8b, the weight of a single antenna is only 90 g, which meets the lightweight design requirements of the UAV SAR system.
Figure 8.
Passive waveguide slot antenna prototype. (a) Physical appearance. (b) Weight measurement of 90 g.
3. Ground-Based Experimental Results
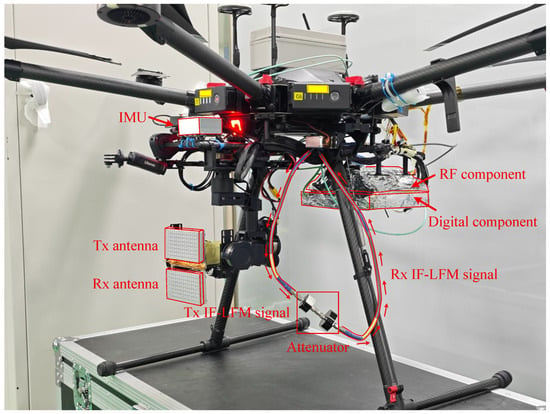
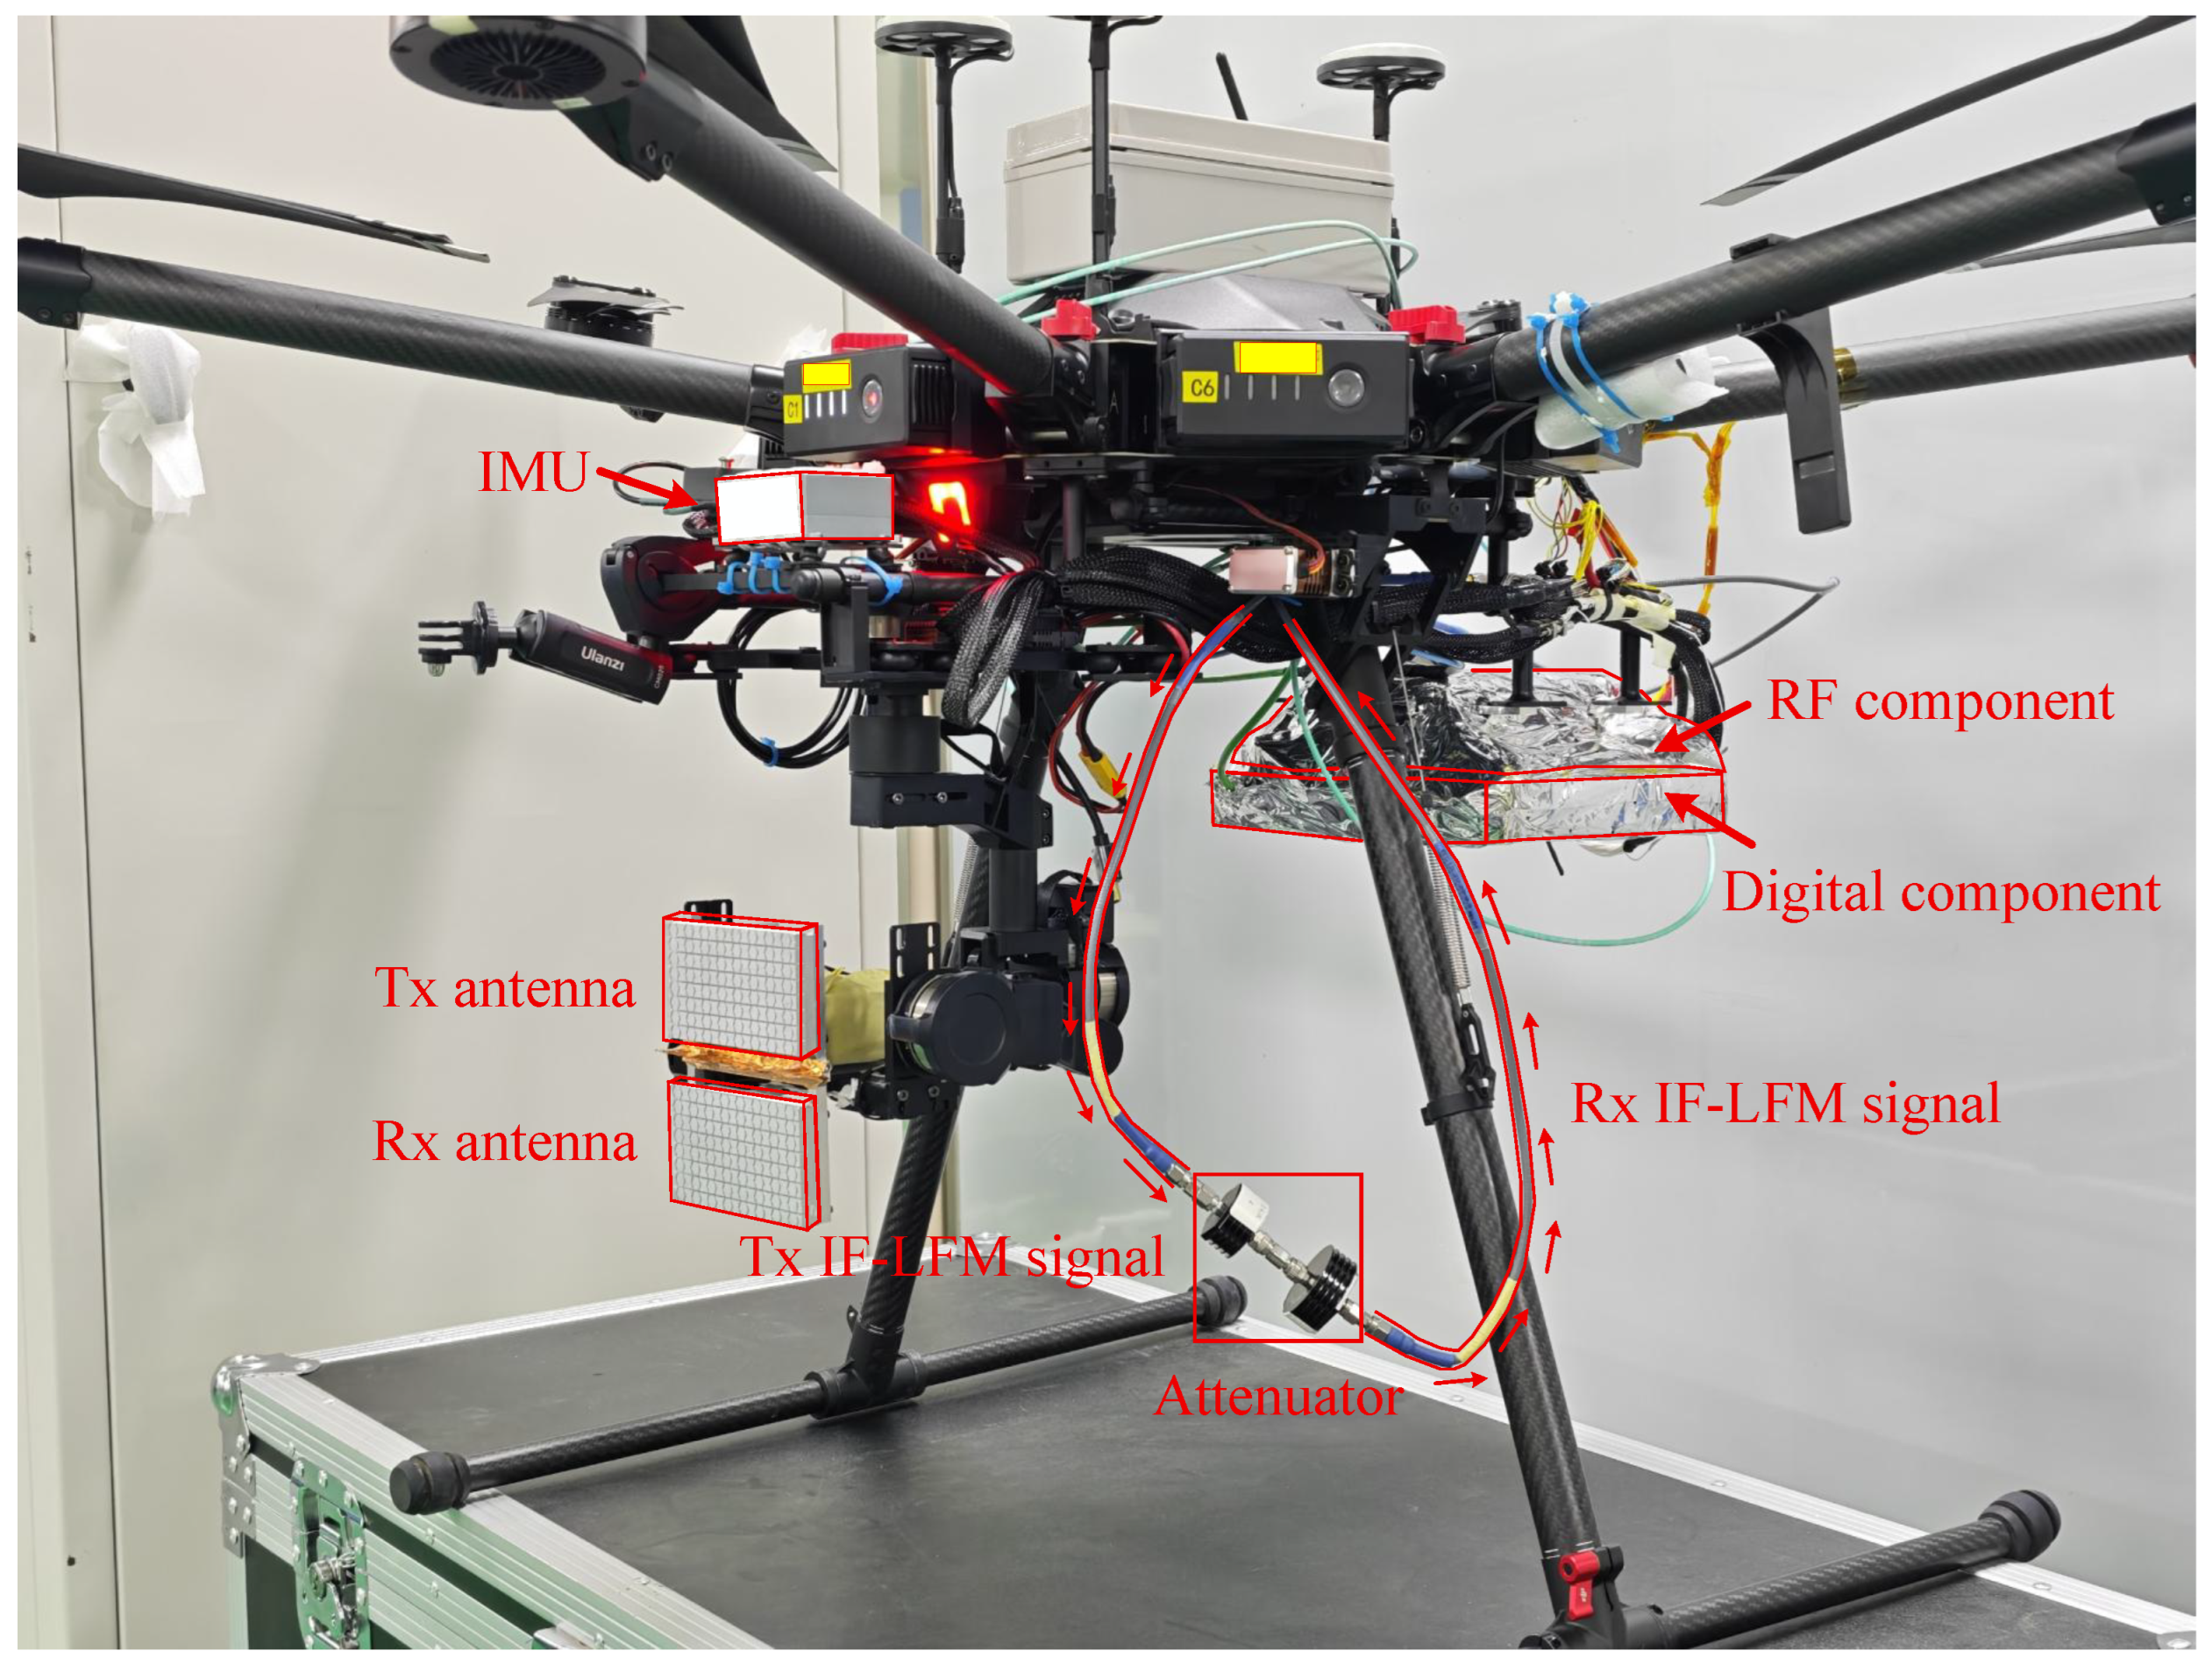
To achieve error compensation for IF-LFM signals, ground-based experiments were conducted on the UAV SAR system proposed in this paper. The physical prototype of the SAR system developed in this study is illustrated in Figure 9. The SAR system is mounted on the UAV, and its hardware structure is designed with full consideration of stability during imaging. Specifically, the digital components and RF components are interconnected and wrapped in aluminum foil. This design can maximize the isolation of interference signals from the complex external electromagnetic environment, ensure the stability of signal transmission, and avoid adverse effects of external interference on subsequent signal processing and error analysis.
Figure 9.
Prototype of the pulse-Doppler UAV SAR system.
In addition, the antenna is mounted on a pan-tilt. With the real-time attitude adjustment and stability control capabilities of the pan-tilt, it can prevent the fuselage jitter during flight from affecting the beam pointing, offset the adverse effects caused by the fuselage jitter during the UAV’s flight, and ensure that the antenna beam pointing remains accurate at all times. Meanwhile, the IMU is installed at the same position as the pan-tilt to record the spatial-variant information of the platform, so as to compensate for platform jitter in the data during imaging.
It should be noted that the difference between the system state during ground testing and that during flight missions lies in that the transmit cable and receive cable are not connected to the transmit and receive antennas; instead, the transmit and receive cables are connected via an attenuator. Transmitting and receiving IF-LFM signals through such a wired closed-loop method can fully acquire the full-link error characteristics of the system. It should be explained that since our system uses passive antennas, the amplitude errors and phase errors incurred during signal transmission are small and often negligible. Therefore, the overall system errors can be effectively extracted through this wired closed-loop test, and error compensation can be completed accordingly.
3.1. Signal Amplitude Compensation
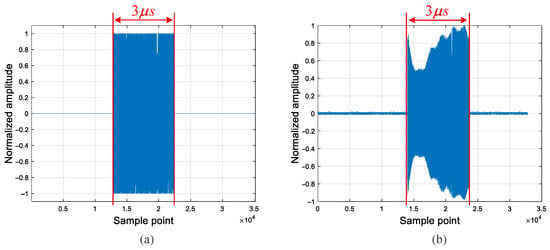
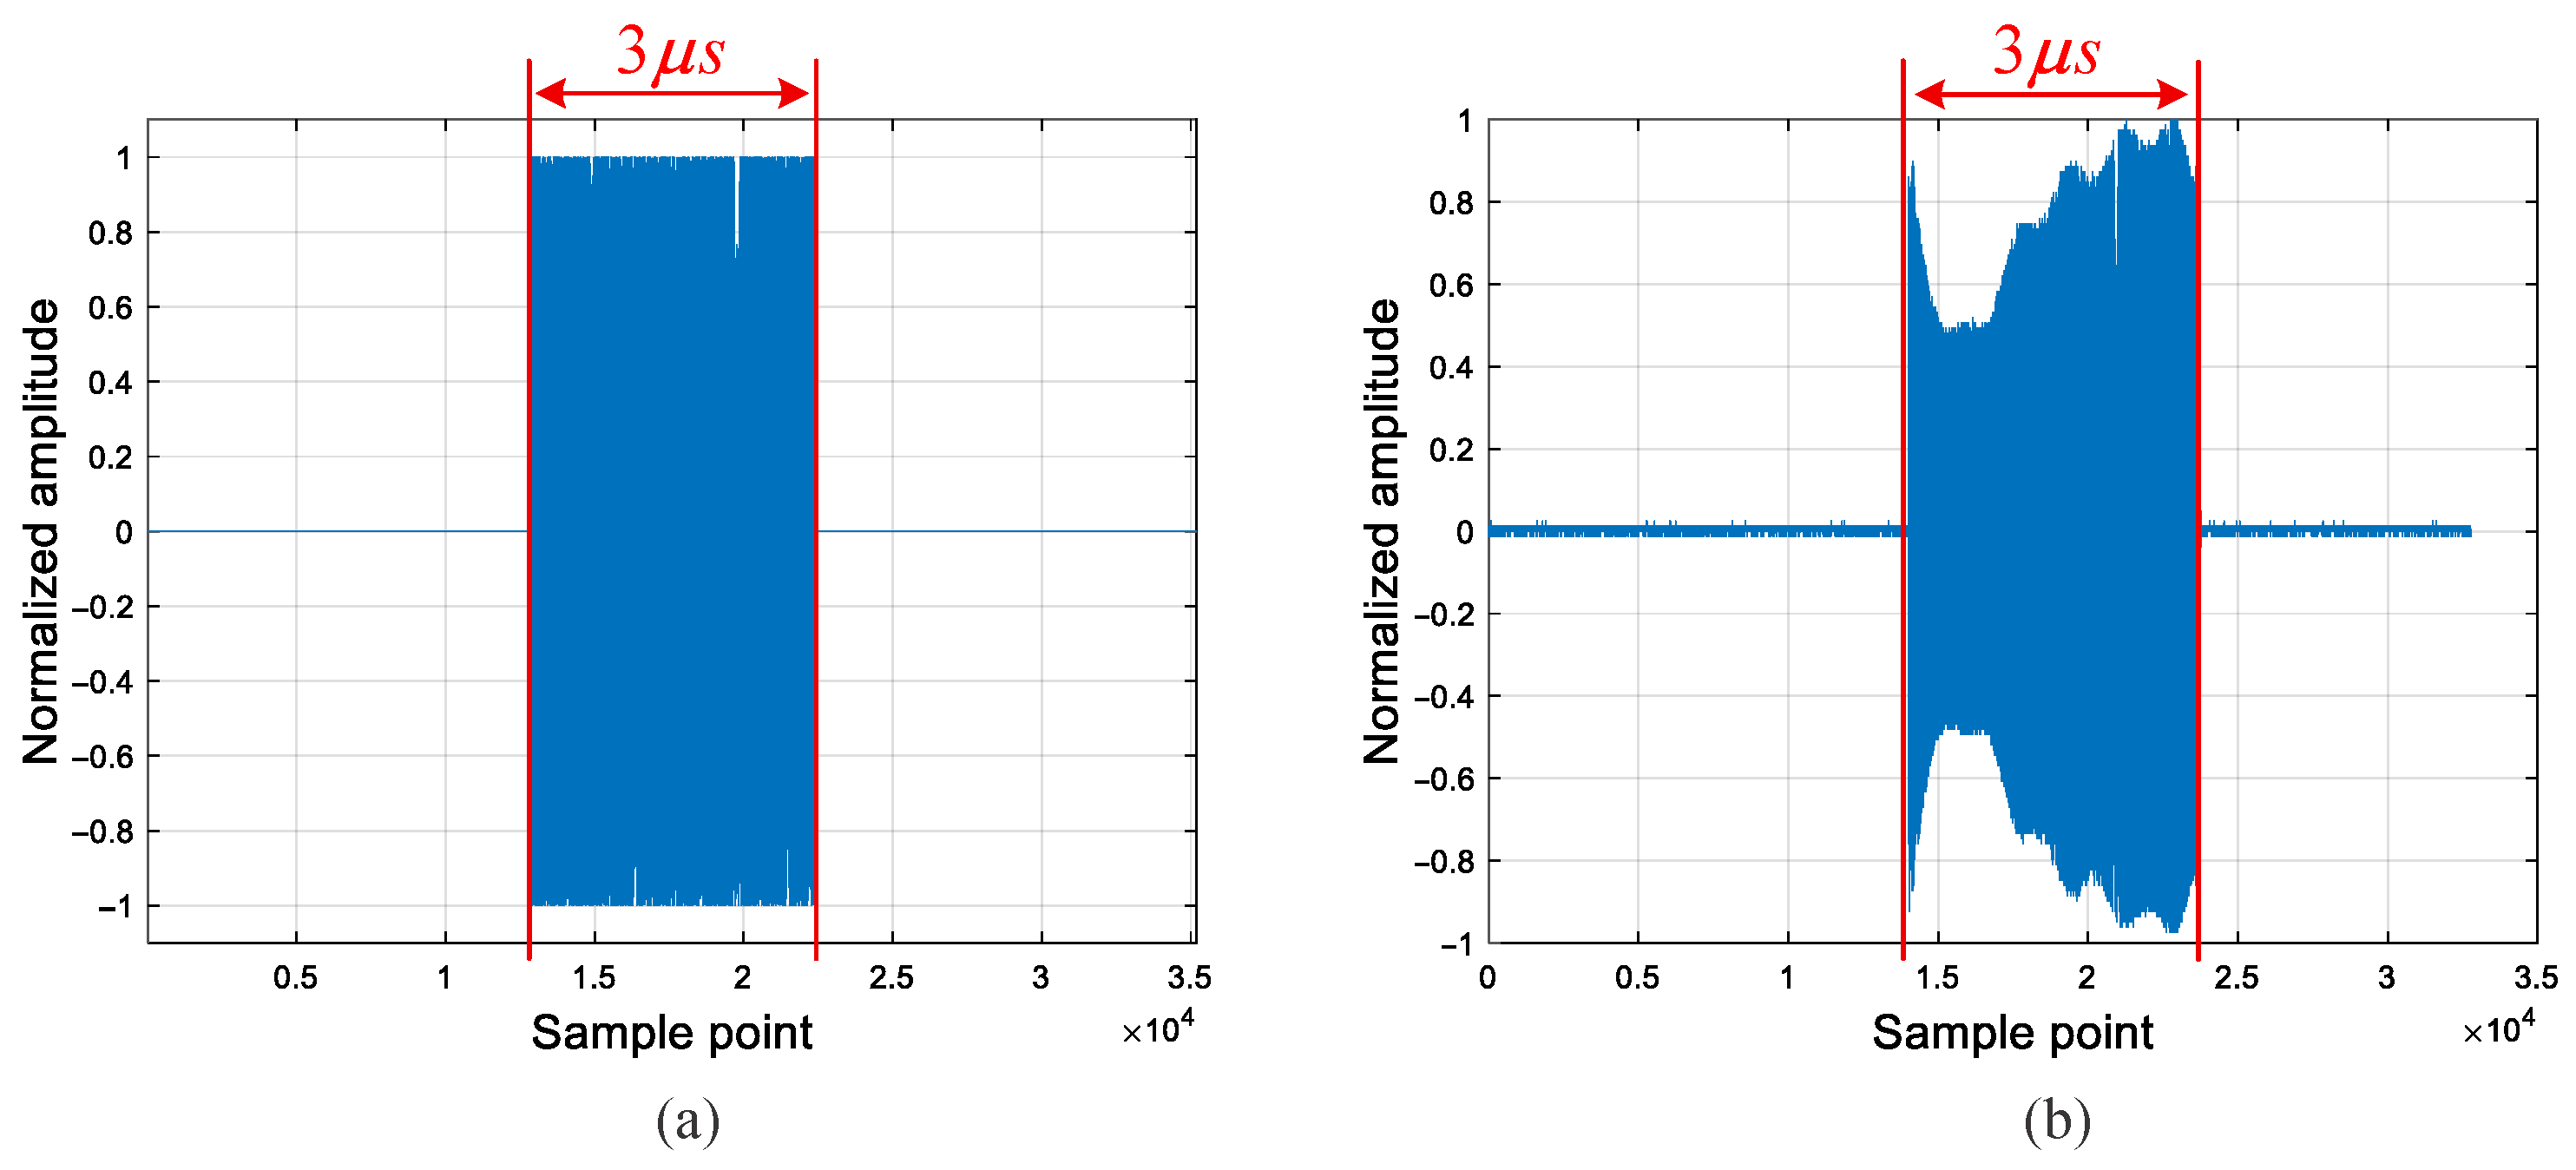
During the experiment, a standard IF-LFM waveform with a time width of 3 μs and a bandwidth of 1200 MHz was first pre-stored and transmitted through the DAC. After being up-converted by the RF module, the signal passed through a 32 dB attenuator and returned to the RF front end. It was then down-converted and sampled by the ADC to obtain the original intermediate-frequency IF-LFM signal, as shown in Figure 10.
Figure 10.
Waveforms of IF-LFM signals recorded by ILA, with a time width of 3 μs and a bandwidth of 1200 MHz. (a) Original IF-LFM signal transmitted by DAC and collected by ILA. (b) Original IF-LFM signal received by ADC and collected by ILA.
Figure 10a displays the first frame of the IF-LFM signal transmitted by the DAC, as sampled by the internal ILA of the FPGA. It can be observed that the waveform after digital-to-analog conversion is a standard IF-LFM signal. Figure 10b shows the first frame of the IF-LFM signal received by the ADC, also captured by the FPGA’s internal ILA. As illustrated, after propagating through the system loop, the signal amplitude undergoes significant distortion due to the combined effects of cable loss, standing-wave interference, and nonlinear distortion.
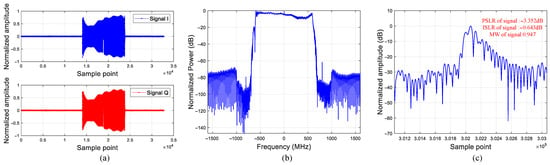
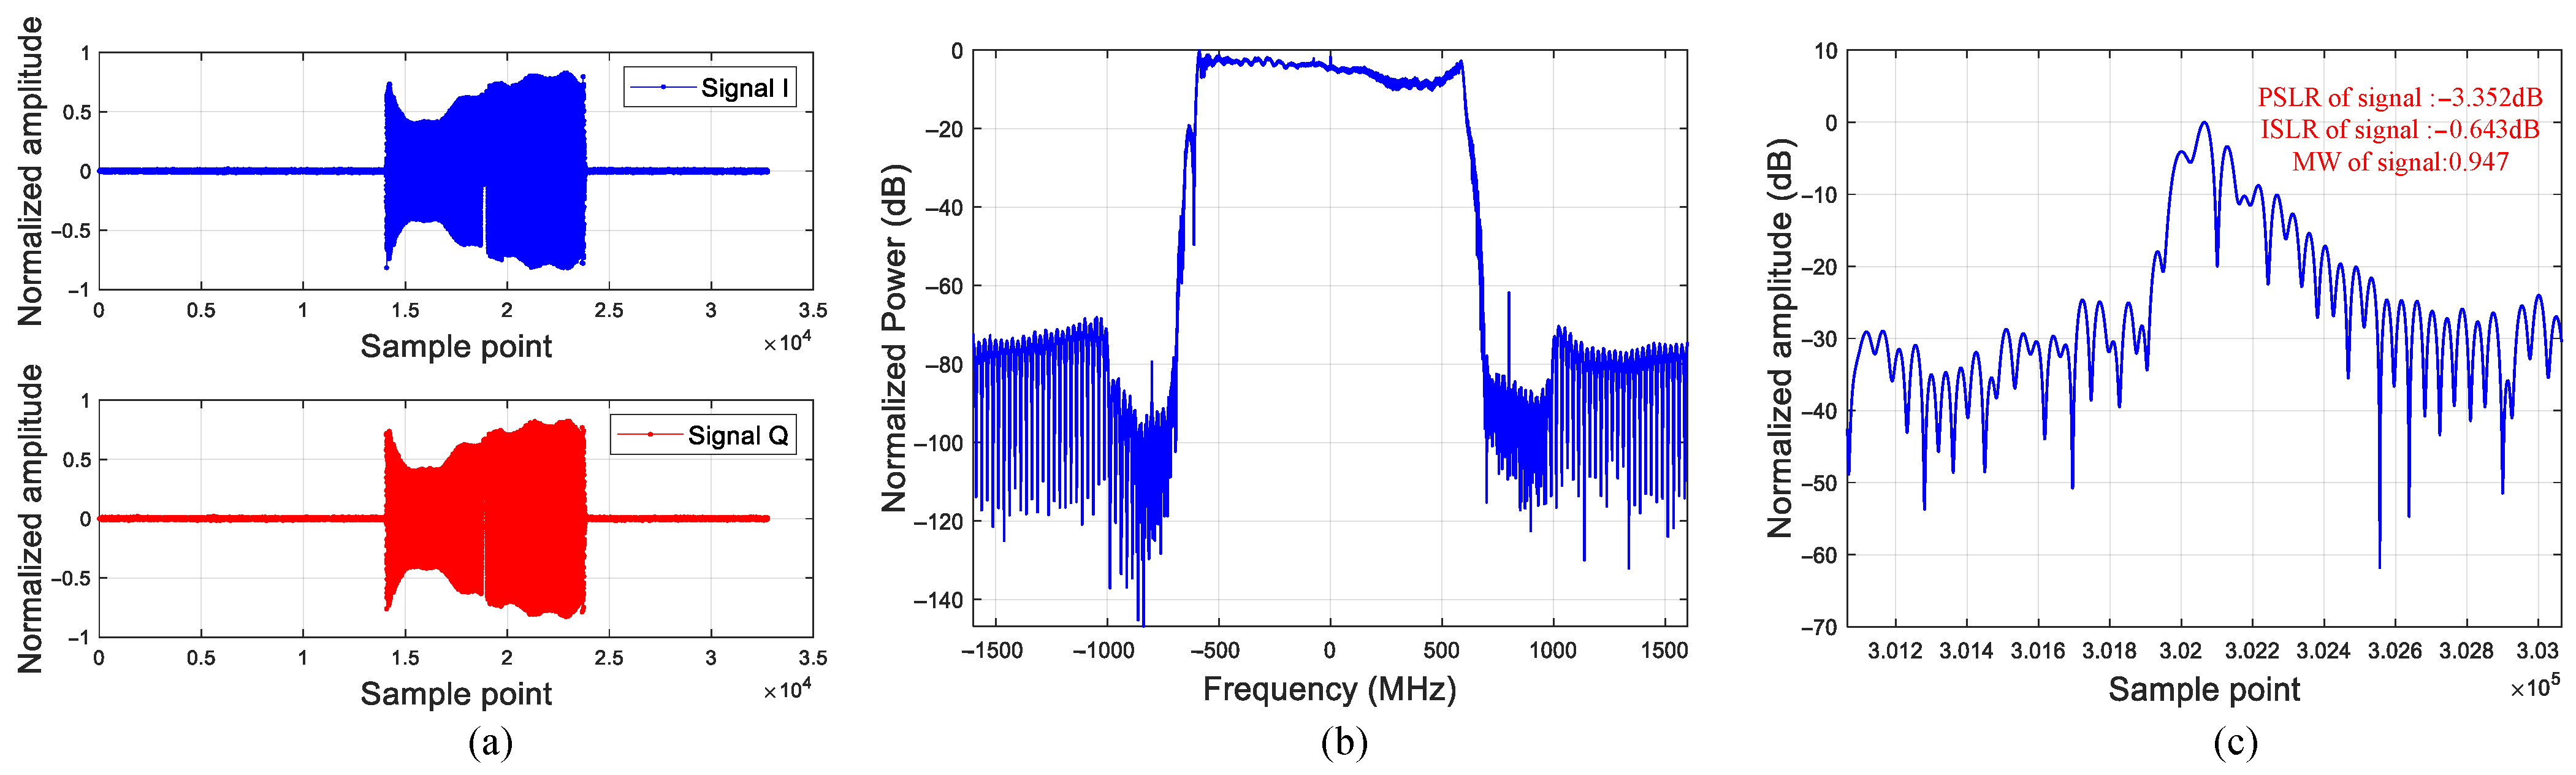
After the collected signal undergoes digital quadrature demodulation and low-pass filtering, the intermediate-frequency component is removed, yielding the baseband LFM signal . The in-phase (I) and quadrature (Q) components of this waveform are shown in Figure 11a. After applying the Fourier transform, the signal spectrum is obtained as illustrated in Figure 11b. It can be seen that the signal amplitude exhibits significant distortion due to system link errors. To quantify the impact of these errors on signal quality, matched filtering is performed on the baseband signal to achieve pulse compression. For this purpose, an ideal reference signal is generated in the frequency domain, expressed as:
where denotes the reference frequency axis, represents the number of sampling points, and is the sampling rate. The matched filtering can be implemented using the FFT and IFFT functions, and the pulse-compressed signal can be expressed as:
Figure 11.
Baseband LFM waveforms before amplitude compensation. (a) Time-domain I and Q waveforms. (b) Signal spectrum. (c) Pulse compression result.
The result of the signal after matched filtering is shown in Figure 11c. After 16-fold upsampling in the frequency domain, the PSLR, integrated sidelobe ratio (ISLR), and main lobe width (MW) factor are evaluated. The MW factor is defined as the ratio of the main lobe width of the distorted matched-filtered signal to the theoretical resolution, with a standard value of 0.886, which is used to quantify the main lobe broadening after the signal passes through the system link. The measured results show that the waveform achieves a PSLR of −3.352 dB, an ISLR of −0.643, and an MW factor of 0.947. This indicates that the original IF-LFM signal suffers severe distortion after passing through the system link, and the amplitude distortion significantly degrades the signal quality. Therefore, amplitude compensation for the signal is an indispensable step.
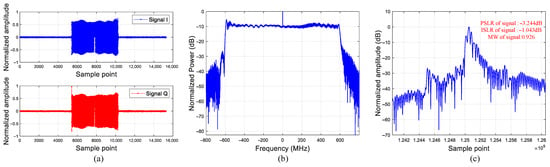
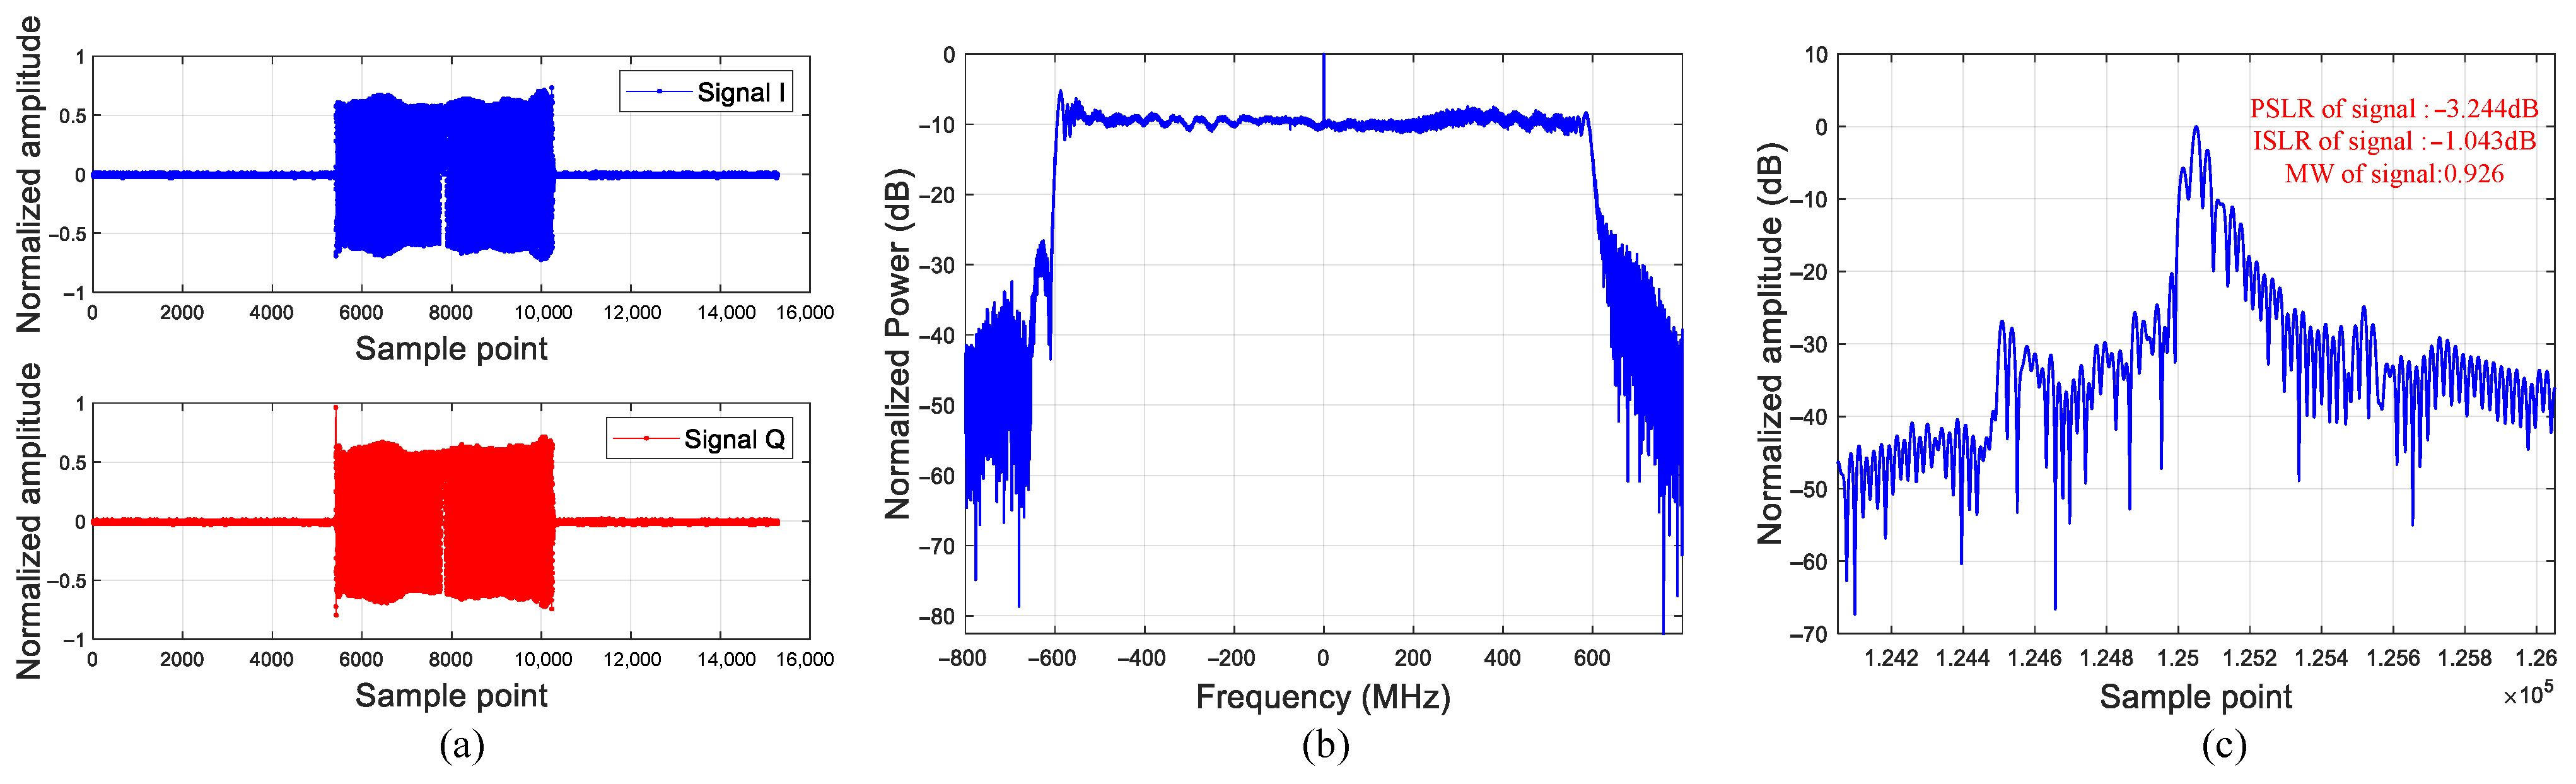
The filter coefficients obtained based on the proposed amplitude compensation method are shown in Table 3. After deploying them into the FIR filter on the FPGA, the result of amplitude compensation for the ADC sampled signal—after quadrature demodulation and subsequent processing by the FIR filter—is illustrated in Figure 12. It can be observed that the FIR filter effectively reduces the amplitude distortion of the time-domain waveform and improves the spectral flatness. However, the matched filtering result remains unsatisfactory because phase errors still exist in the sampled signal and require further phase compensation and correction.
Table 3.
FIR Filter Coefficients for I/Q Channels.
Figure 12.
Baseband LFM waveforms after amplitude compensation. (a) Time-domain I and Q waveforms. (b) Signal spectrum. (c) Pulse compression result.
3.2. Signal Phase Compensation
Based on the phase error extraction method proposed earlier, the sampled signal is conjugated and multiplied by the reference signal in accordance with Equation (21). The extracted phase corresponds to the phase error function of the target signal, and this processing procedure can be expressed as:
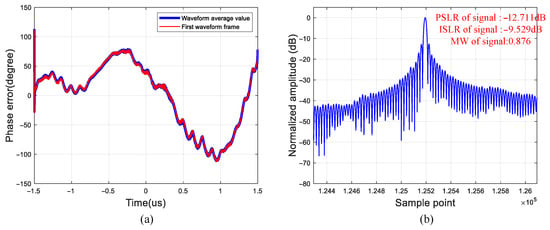
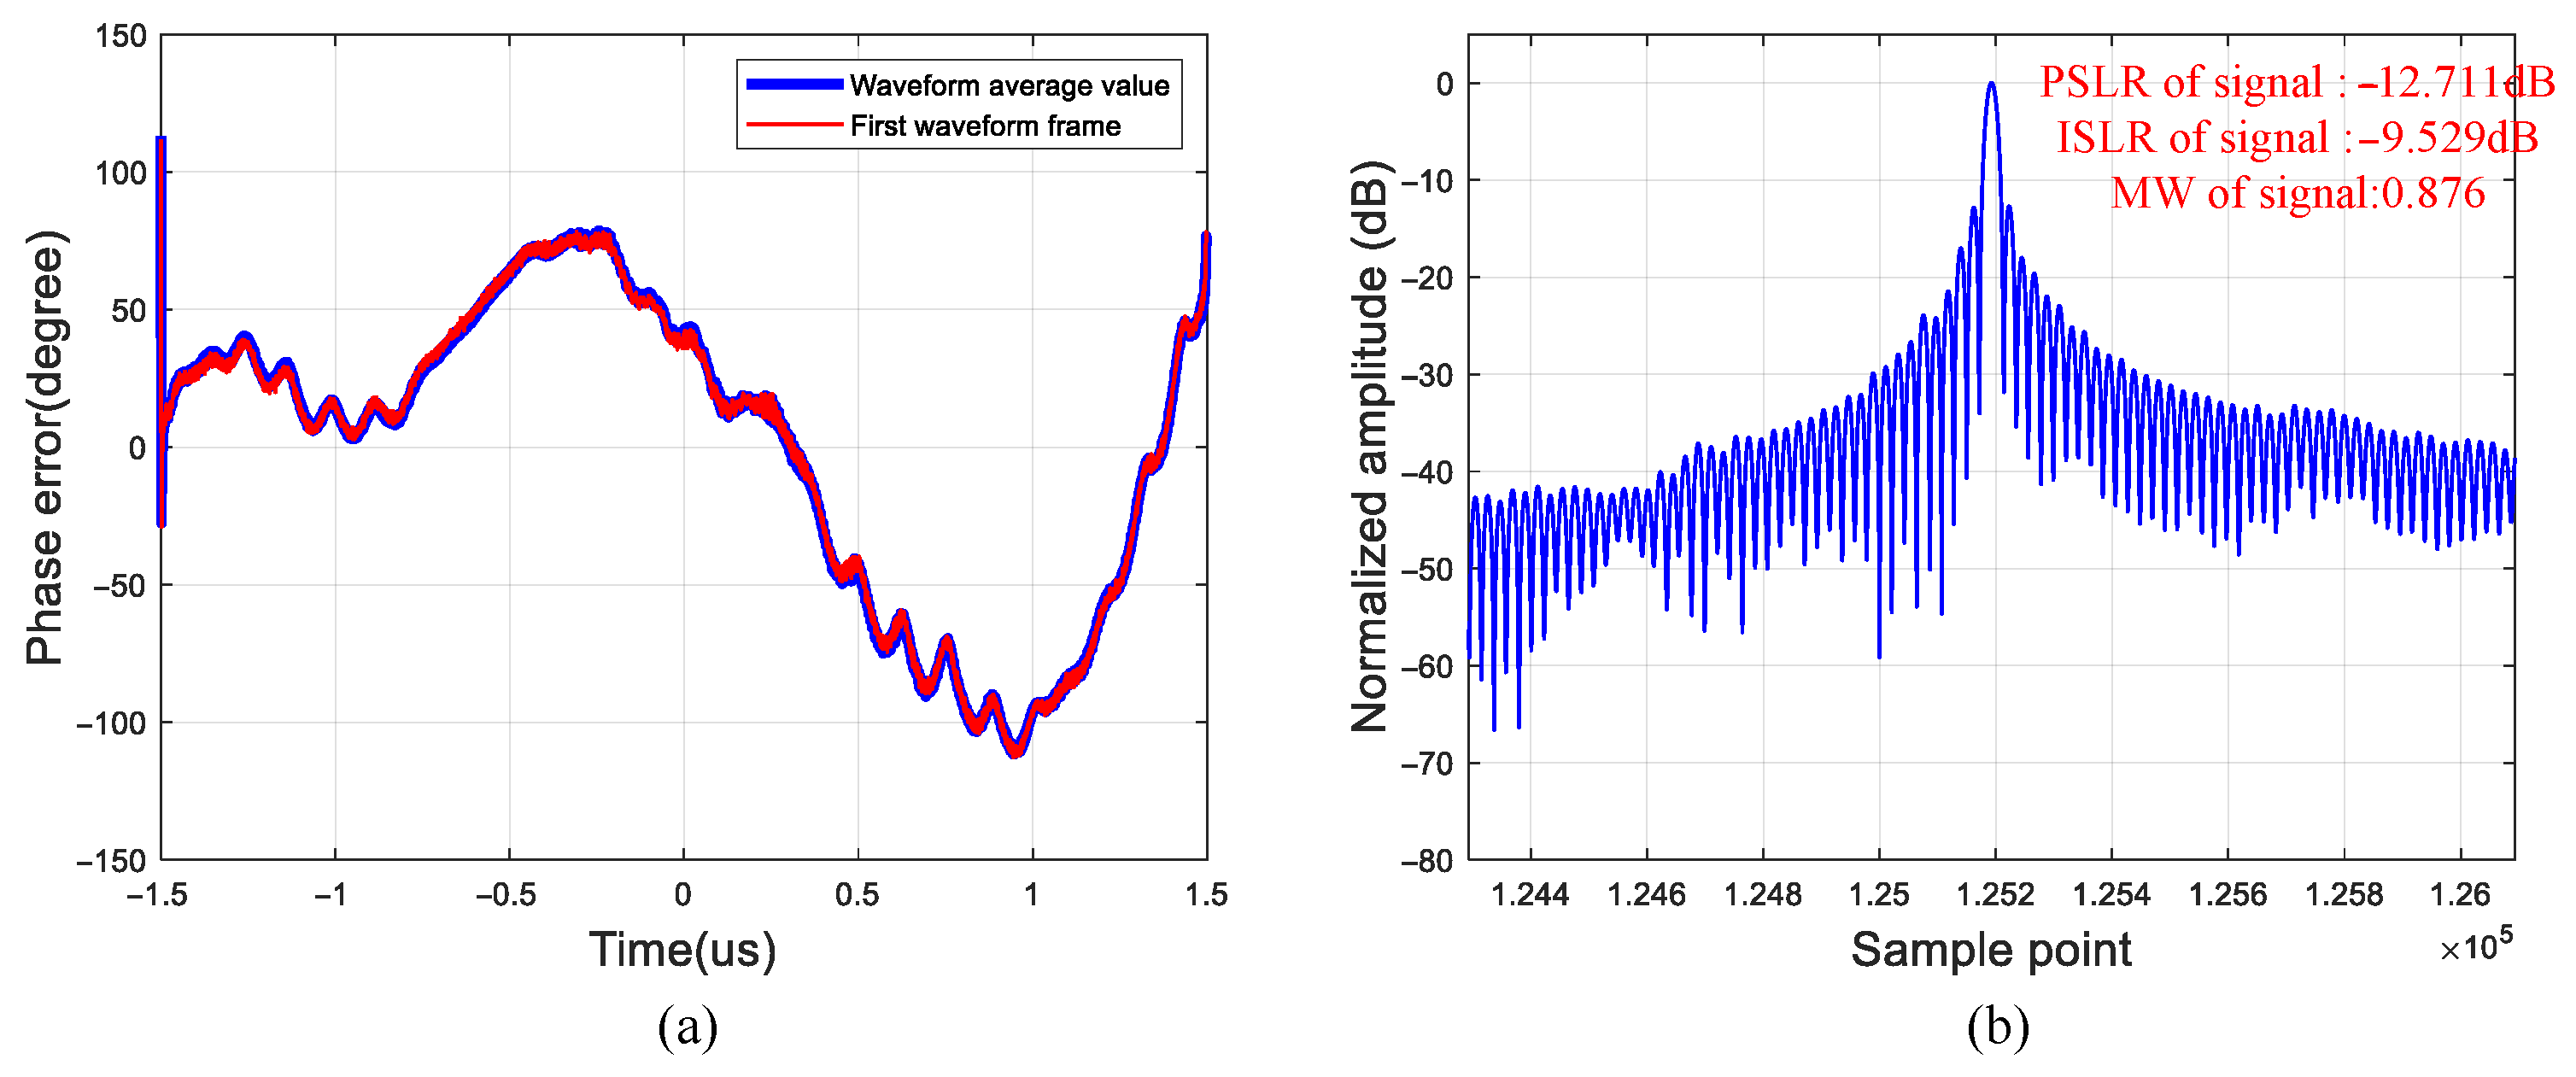
where denotes the phase extraction function of a signal. As shown in Figure 13a, the phase error of the system link can be extracted by performing conjugate multiplication between the sampled signal and the ideal reference signal. The red line in the figure represents the phase error curve corresponding to the first frame waveform, while the blue line is the average result of the phase error curves of 500 frames. The two curves exhibit a high degree of consistency in their variation trends, which verifies the inter-pulse stability of the system.
Figure 13.
Phase Error Extraction of System Link and Pulse Compression Performance After Phase Predistortion Compensation. (a) Phase error curves of single-frame and 500-frame averaged waveforms. (b) Pulse compression results of ADC-sampled signals.
Figure 13b shows the matched filtering result of the ADC-sampled signal after phase predistortion compensation. After the phase predistortion correction, the PSLR of the signal is , the ISLR is , and the main lobe width factor is . These values are basically consistent with those of the ideal signal, which fully verifies the effectiveness of the proposed phase compensation method.
3.3. Antenna Performance Experiment
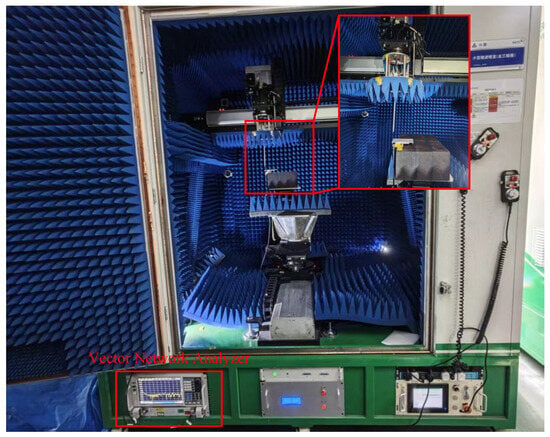
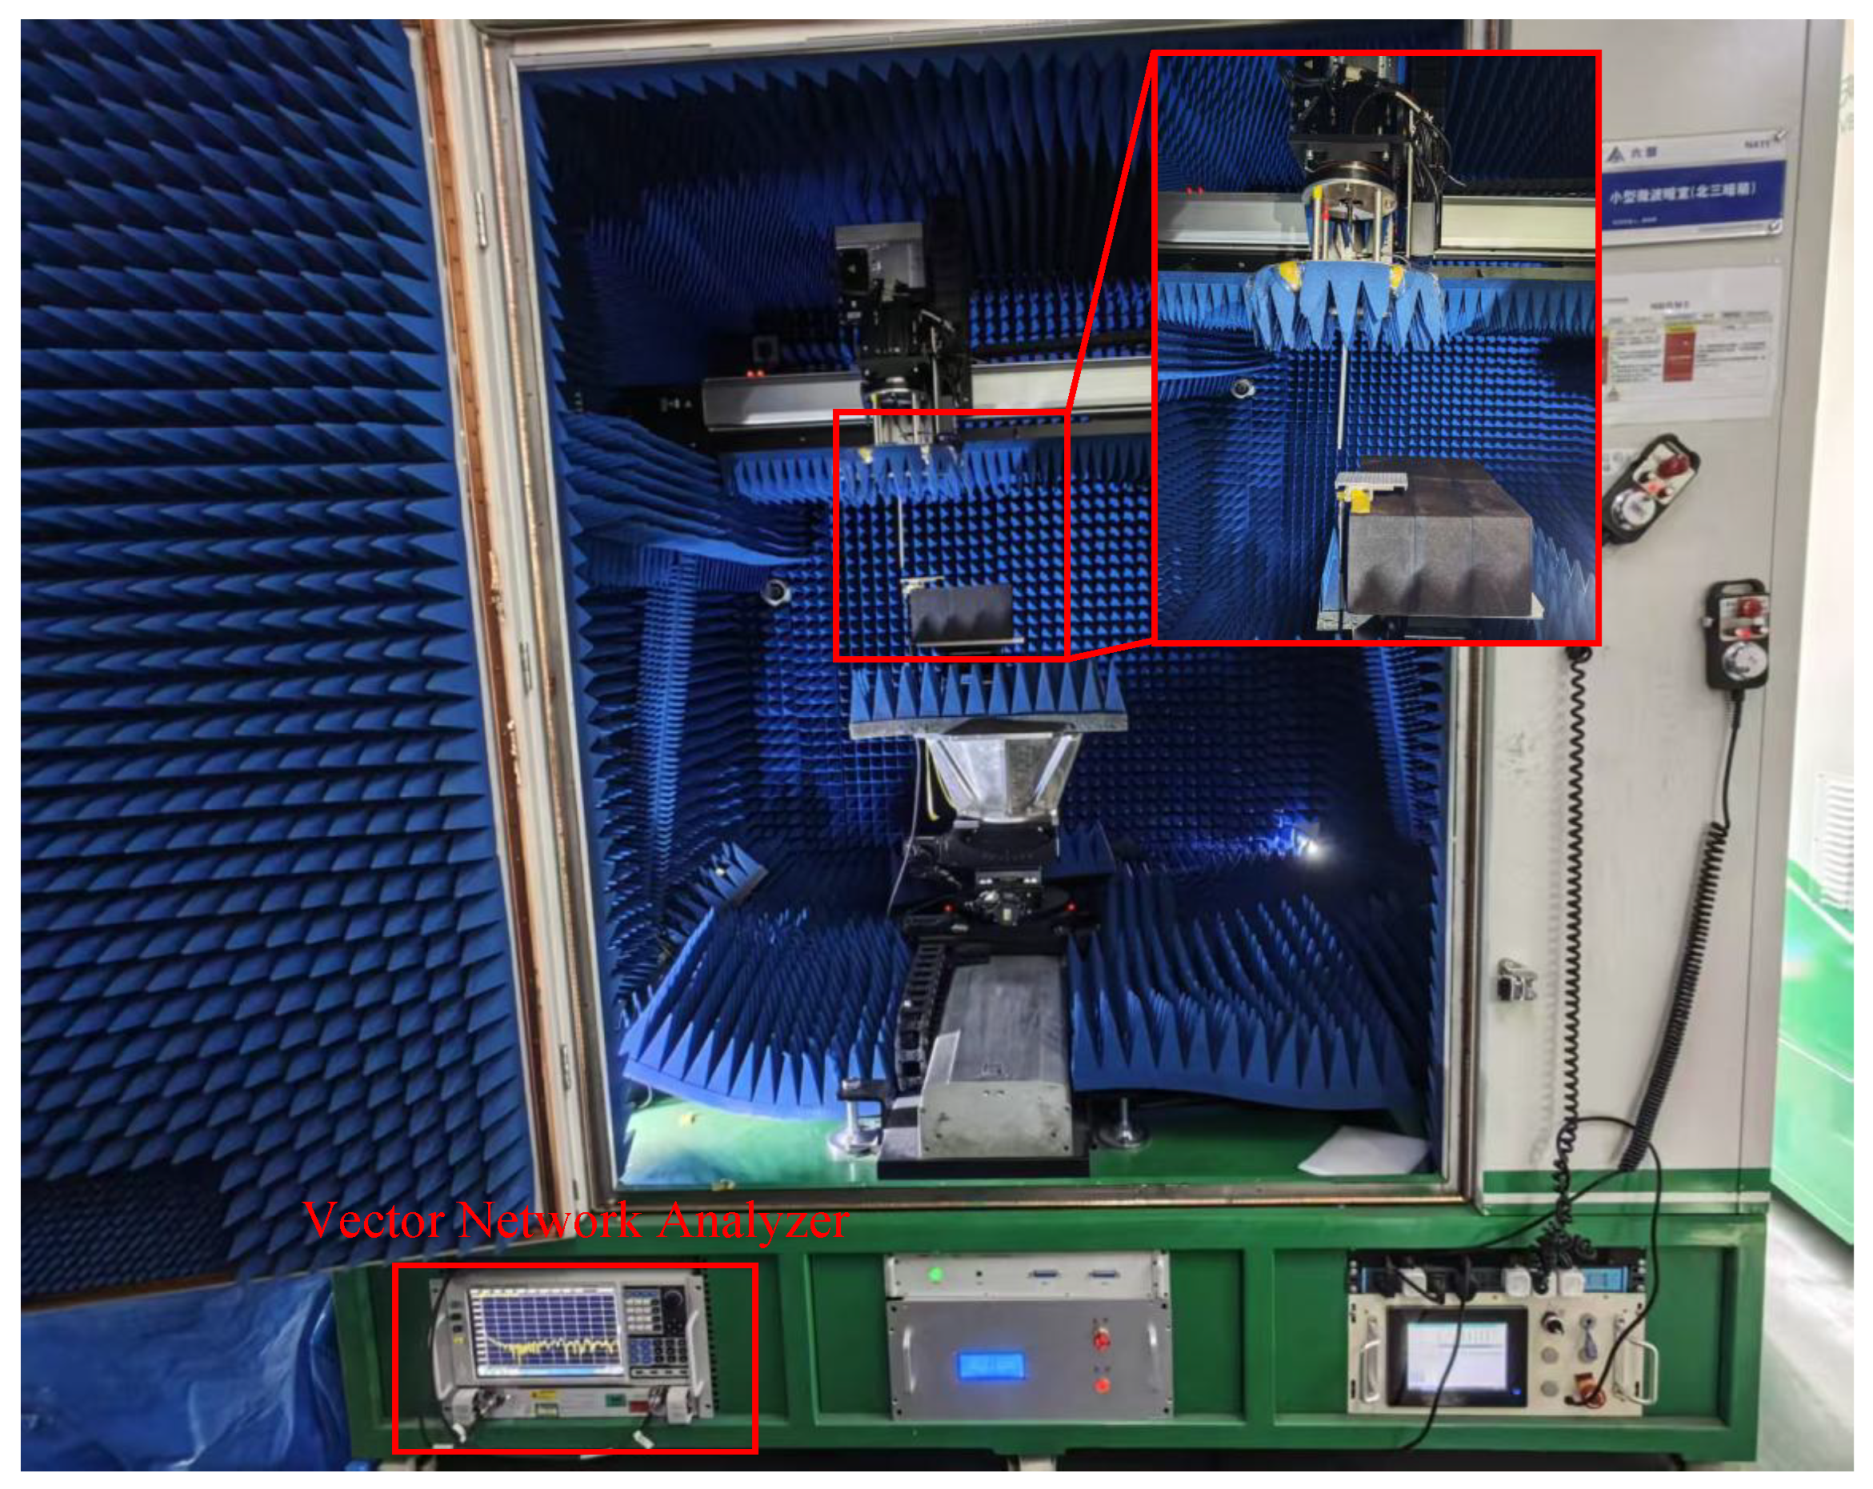
To comprehensively evaluate the actual radiation performance of the designed passive waveguide slot antenna, verify whether it achieves the expected directional radiation with concentrated energy, and accurately characterize the consistency and stability of key antenna performance parameters, a systematic test was carried out on the core performance indicators and radiation patterns of the antenna. Figure 14 shows the antenna performance measurement in the microwave anechoic chamber. As the antenna is passive, its radiation patterns in the transmitting and receiving states are equivalent. Therefore, during the measurement, the vector network analyzer transmits a signal to the probe, which propagates through space and is received by the antenna under test. The received microwave signal is then transmitted back to the vector network analyzer for data recording.
Figure 14.
UAV SAR Antenna Performance Test in Microwave Anechoic Environment.
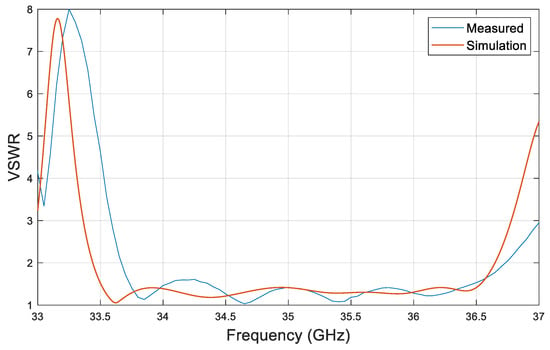
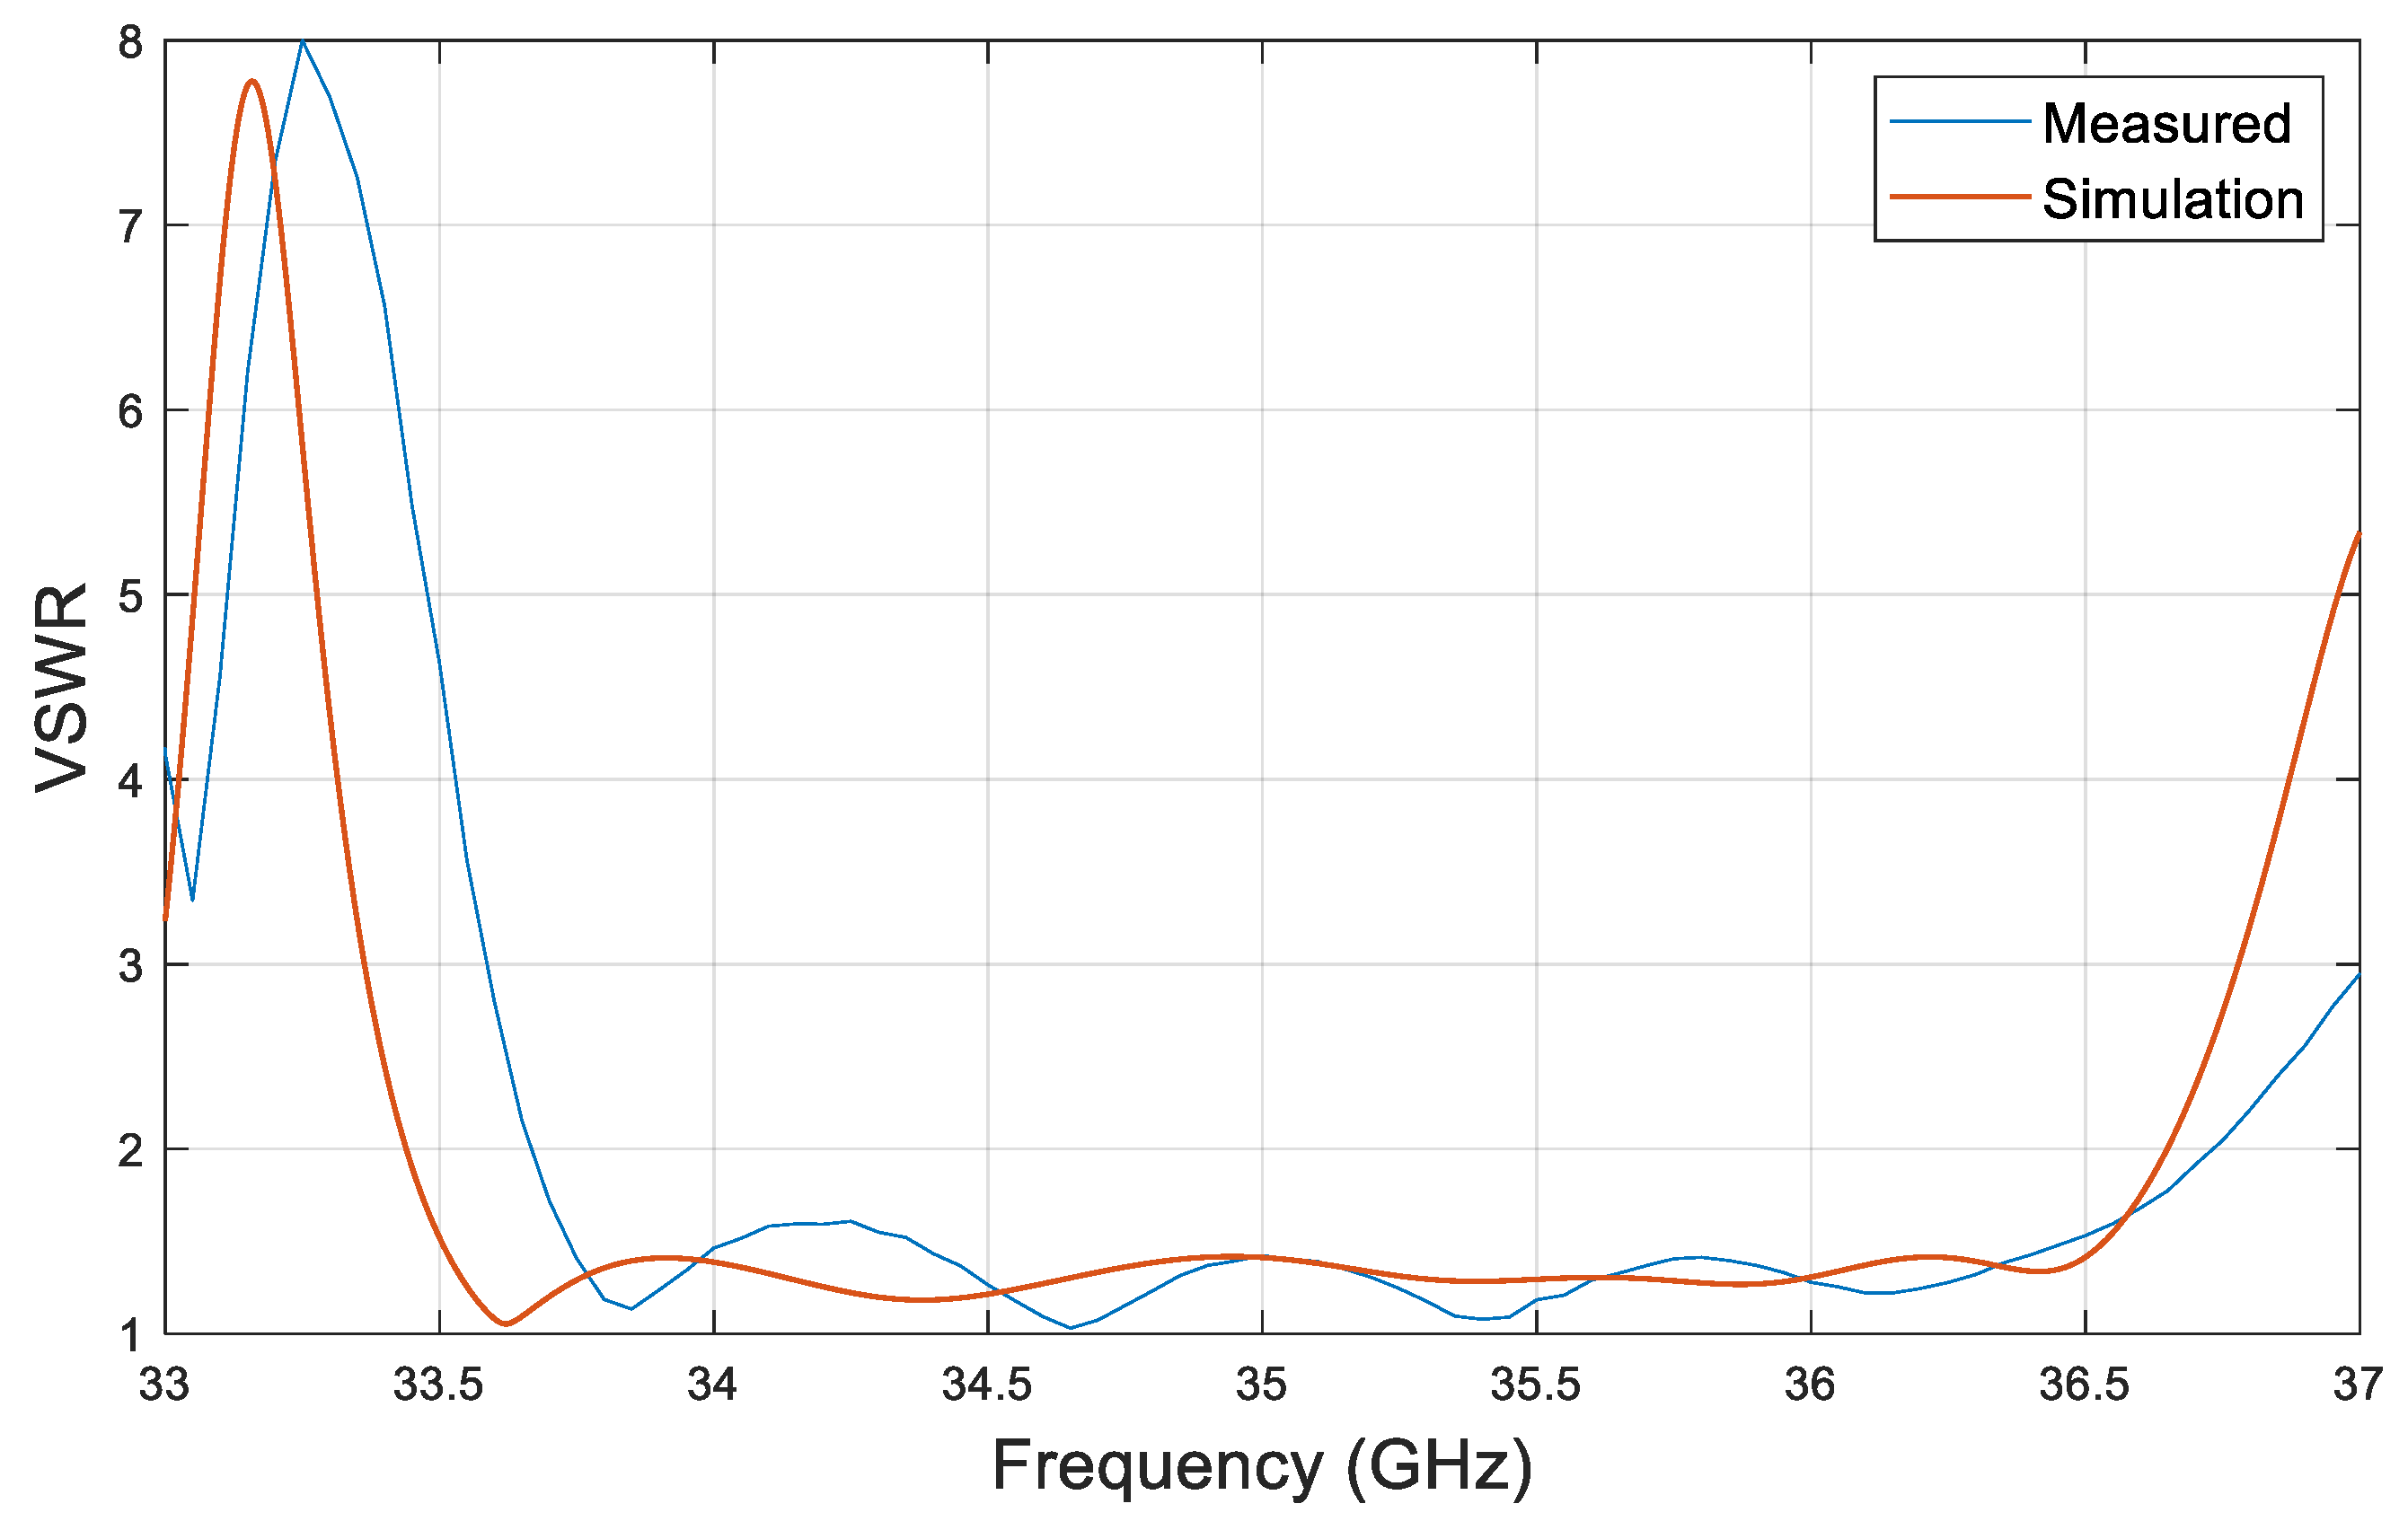
Figure 15 shows the relationship between antenna frequency and standing wave ratio (SWR). It can be observed that the simulated and measured curves exhibit a highly consistent frequency response trend in the range of 33.0 to 37.0 GHz. The fluctuation shapes and the positions of the peaks and valleys are in good agreement. Within the operating frequency band of the SAR system, the antenna’s SWR is better than 1.5, which meets the requirements of practical applications. A slight frequency deviation exists between the measured and simulated results, mainly due to dimensional tolerances and assembly gaps introduced during the fabrication process, which can bring additional parasitic parameters and thus slightly affect the frequency response.
Figure 15.
Relationship between Antenna Frequency and Standing Wave Ratio.
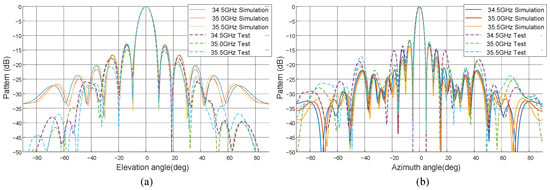
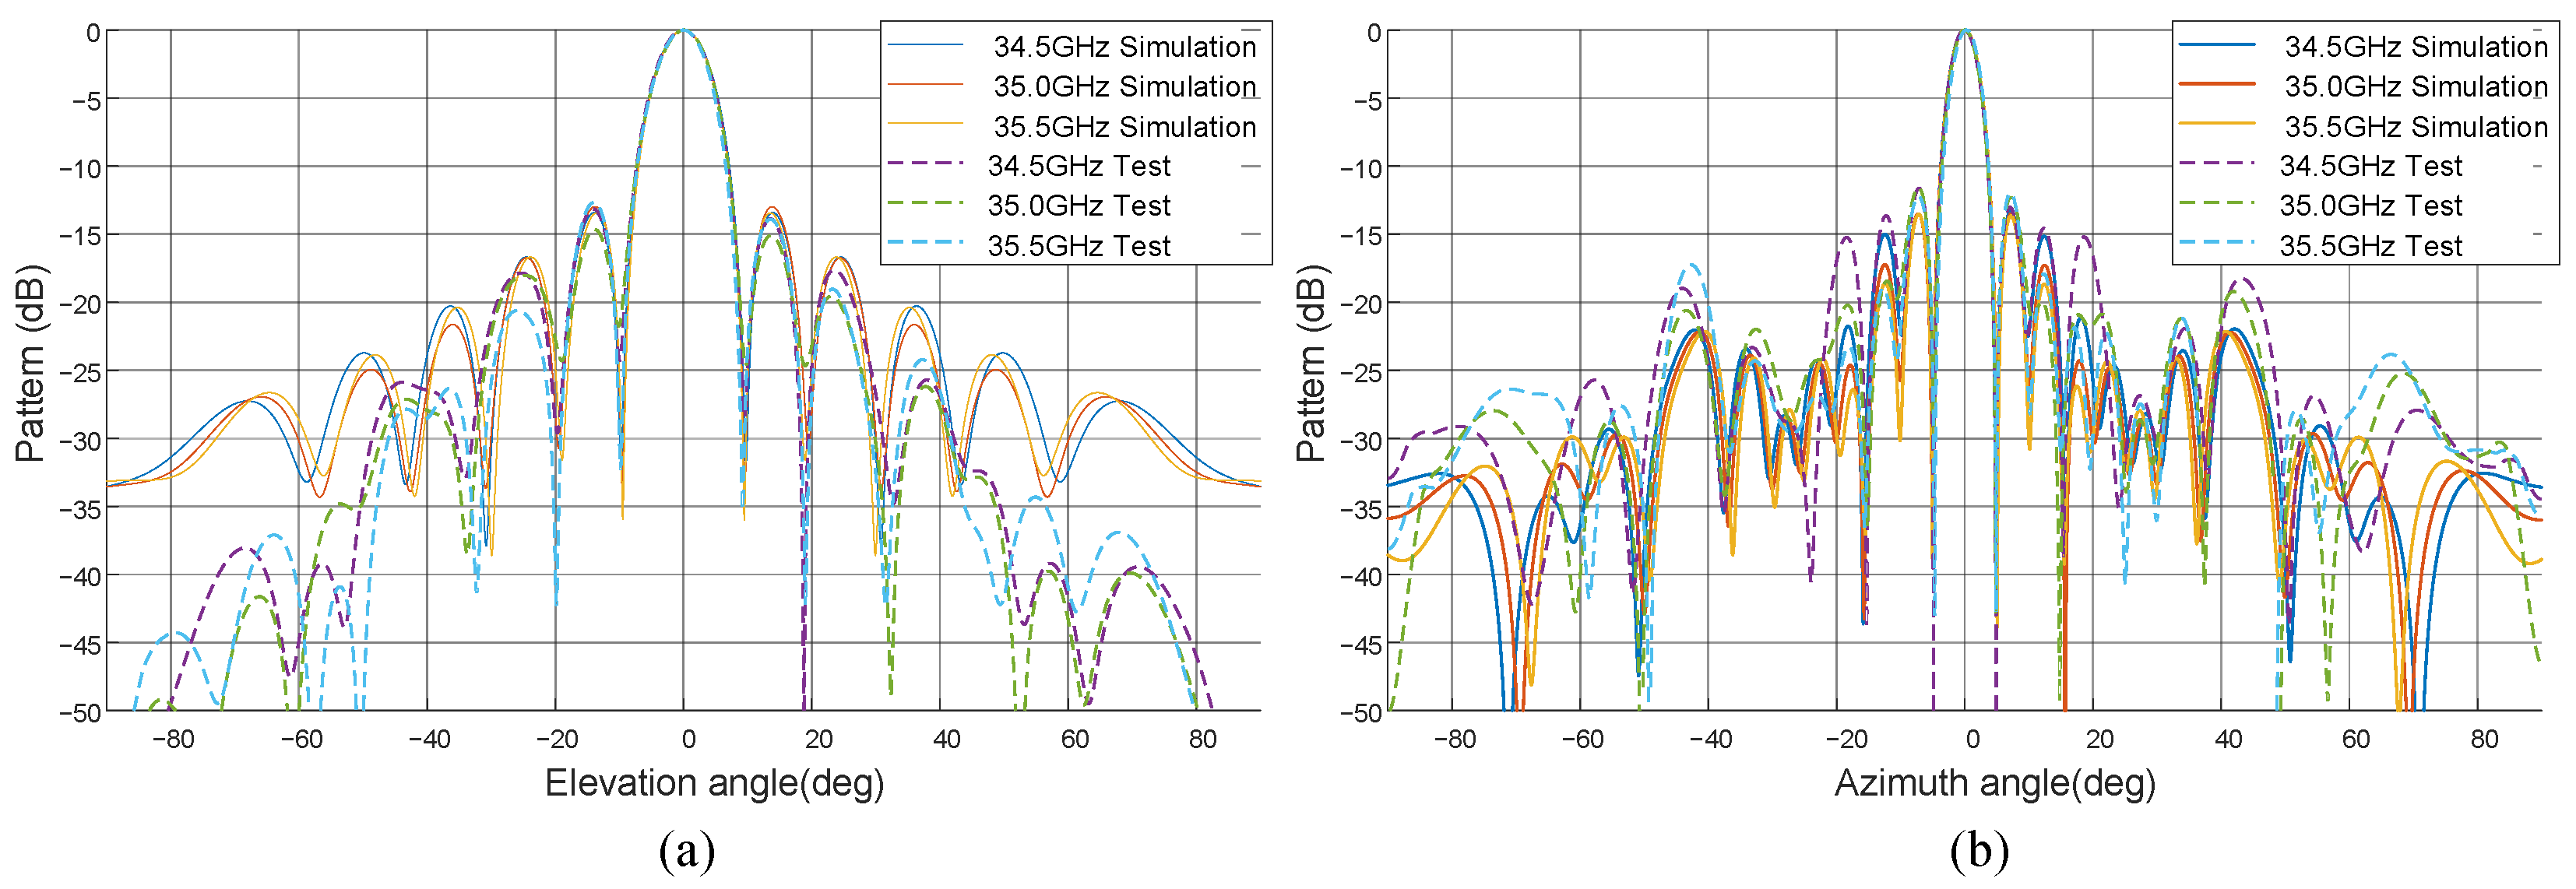
Radiation patterns at each frequency point were measured over the frequency range from 34.5 GHz to 35.5 GHz in steps of 0.5 GHz, and the results are presented in Figure 16. The simulated antenna patterns (solid lines) and measured results (dashed lines) show excellent agreement across the entire observation angle range from −80° to 80°, with a high overall level of consistency. This is reflected in two aspects. First, the main-lobe characteristics are highly consistent. The main-lobe direction, 3 dB beamwidth, and peak gain from simulation and measurement are almost identical, indicating that the focused directivity of the antenna’s radiated energy is accurately achieved in both the design and the fabricated prototype. Second, the sidelobe structures are in good agreement. The levels and positions of the first sidelobe and subsequent sidelobes correspond precisely between simulation and measurement, and the sidelobe suppression performance is effectively preserved in the physical antenna. This confirms that the actual control accuracy of the array amplitude and phase distribution meets the design requirements.
Figure 16.
Antenna Pattern Simulation and Measurement Results. (a) Elevation Plane Antenna Pattern. (b) Azimuth Plane Antenna Pattern.
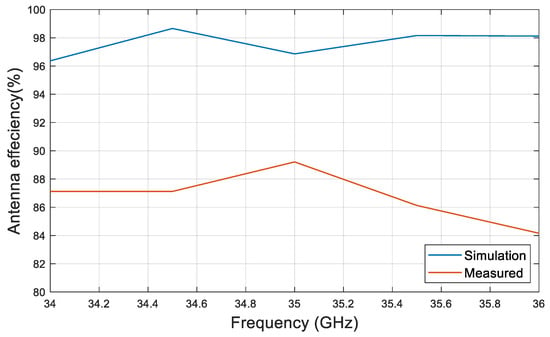
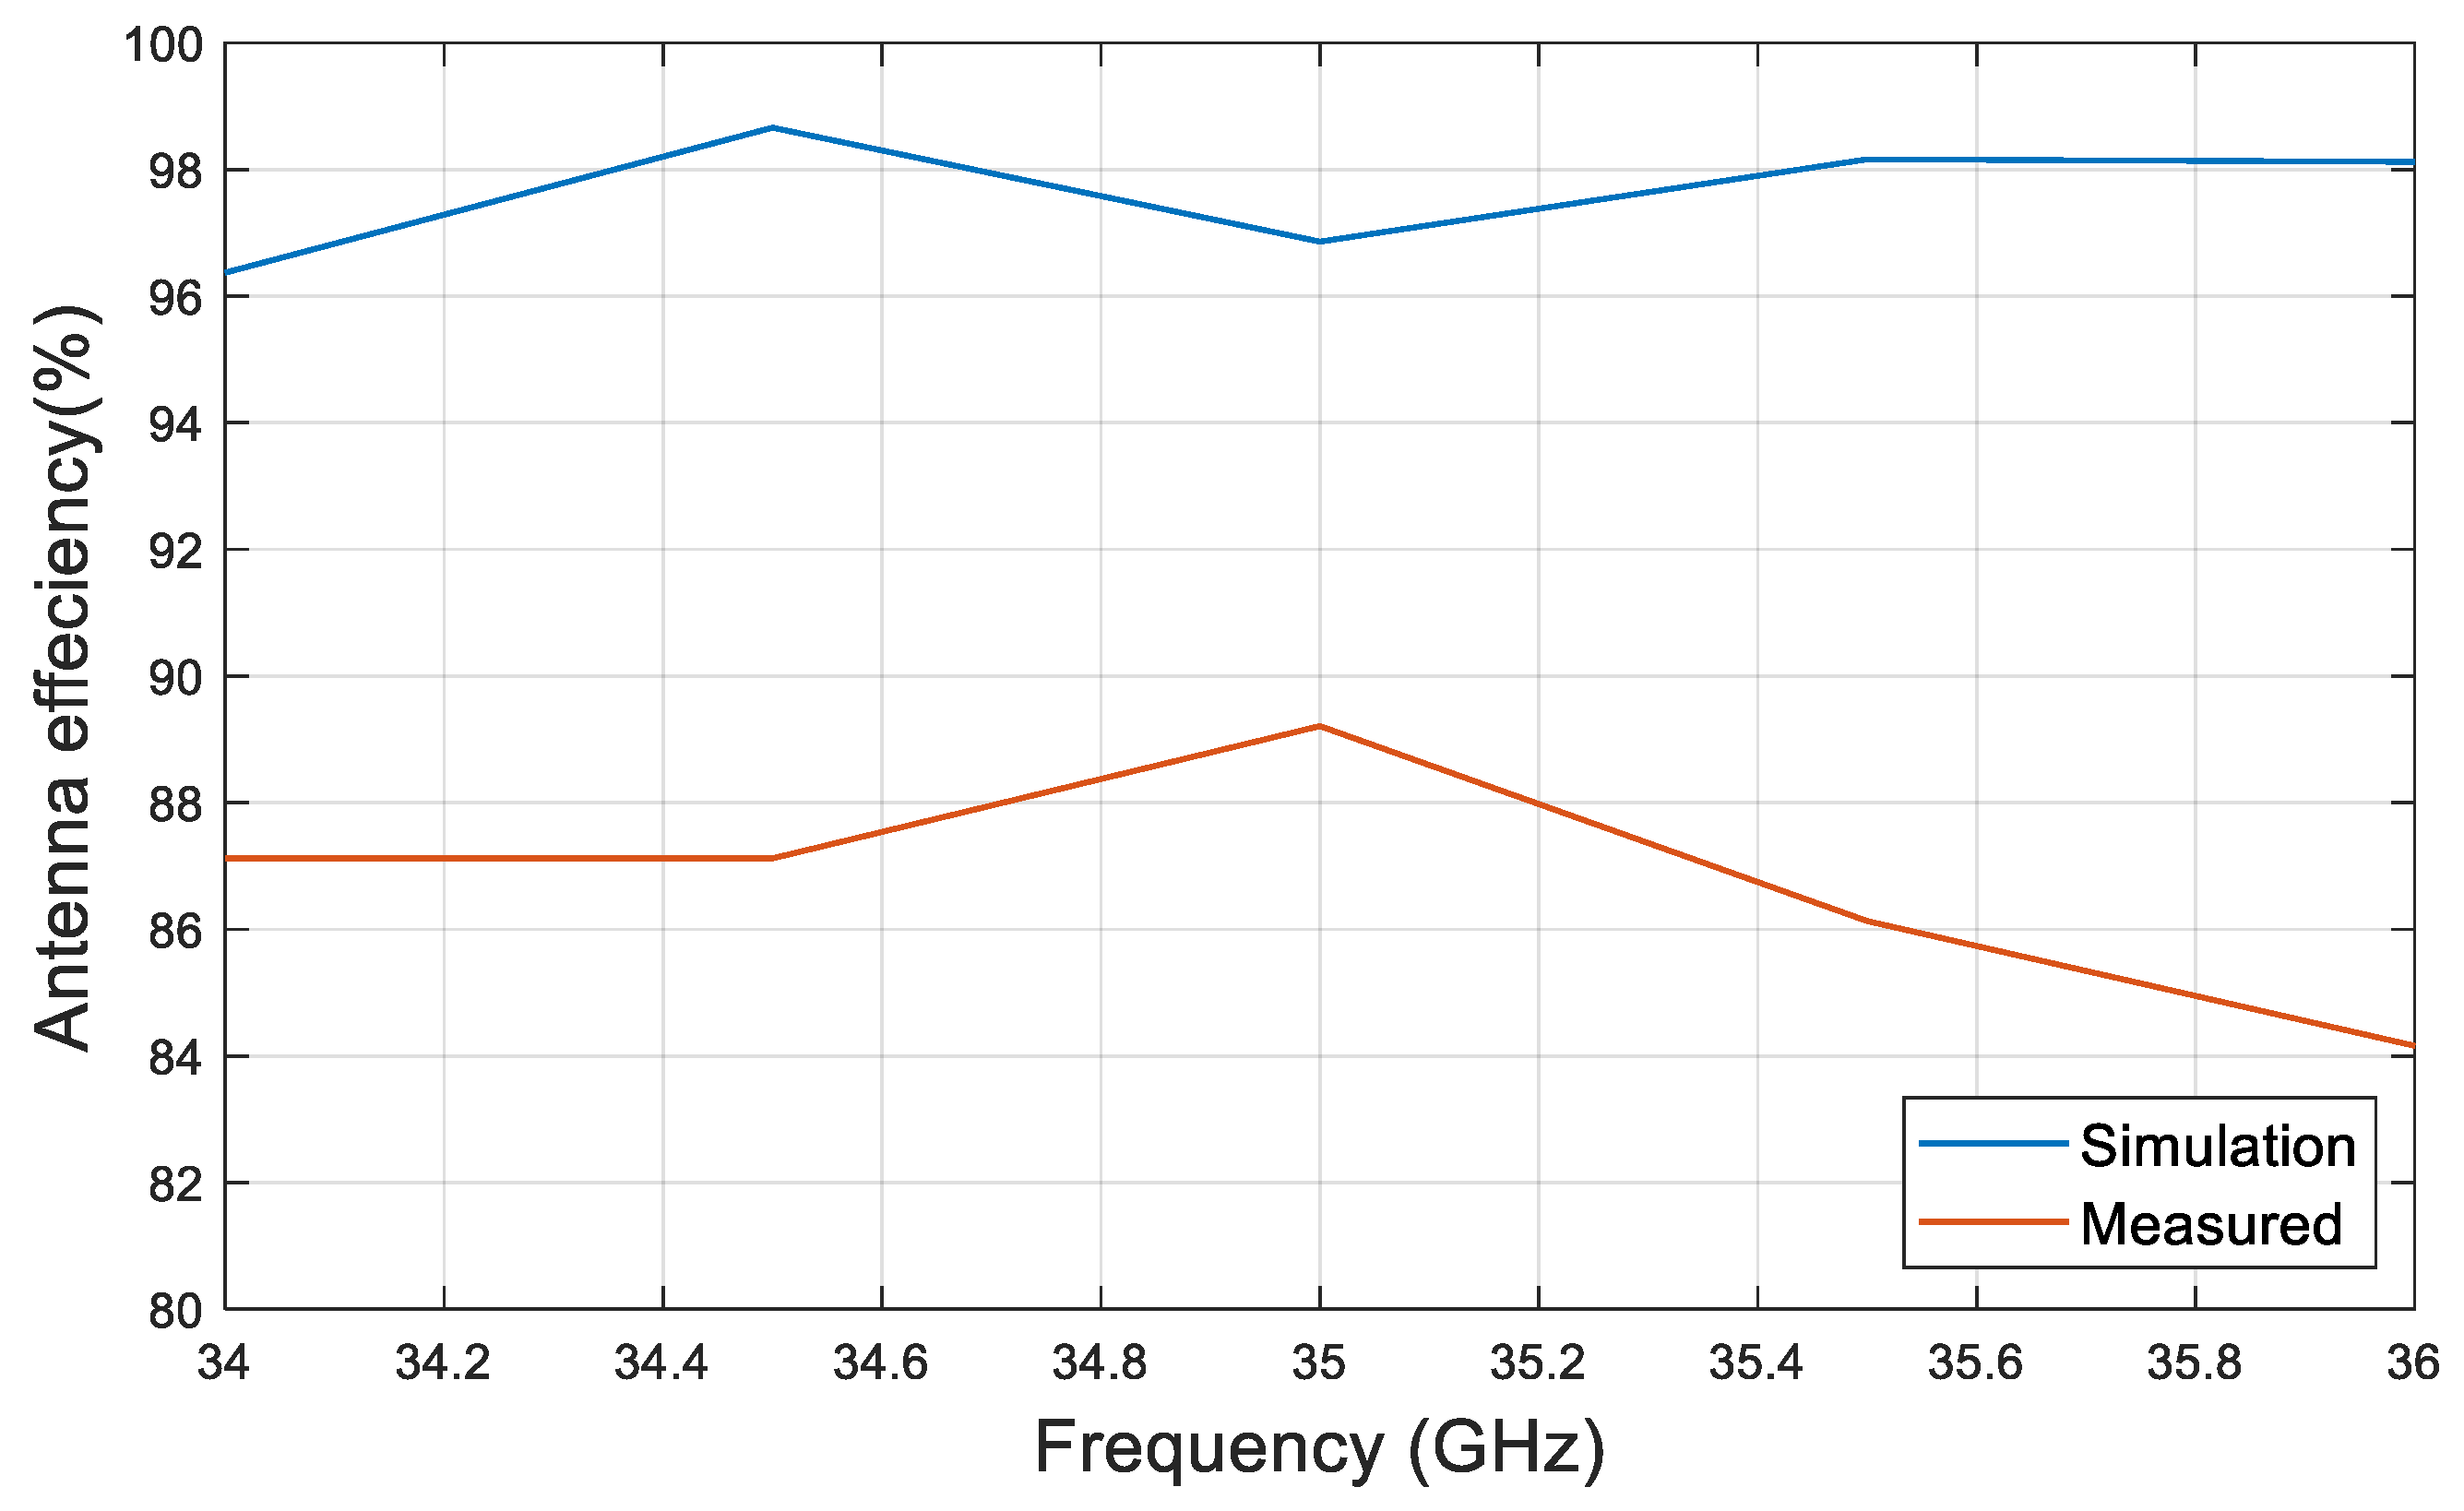
Within the Ka-band operating frequency range of 34 GHz to 36 GHz, the measured radiation efficiency of the antenna remains consistently above 80%, as shown in Figure 17, with a peak efficiency of approximately 89%. This indicates that the designed antenna exhibits excellent energy conversion and radiation capabilities and belongs to the category of high-efficiency antennas. There is a certain discrepancy between the measured radiation efficiency and the simulated results, mainly attributed to two factors. First, manufacturing and assembly tolerances exist. Dimensional deviations and assembly gaps in the physical prototype can introduce additional ohmic losses and energy leakage, thereby reducing the radiation efficiency. Second, there are residual losses in the measurement system. Although the system was calibrated, minor residual losses remain in the test cables, connectors, and adapters. These losses are included in the measured results, causing the measured values to be slightly lower than the simulated values.
Figure 17.
Antenna effeciency.
4. Flight Experiment Results
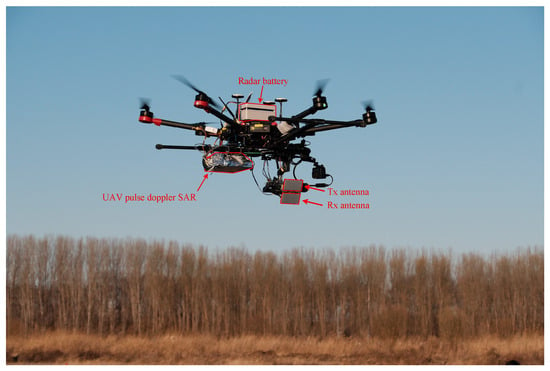
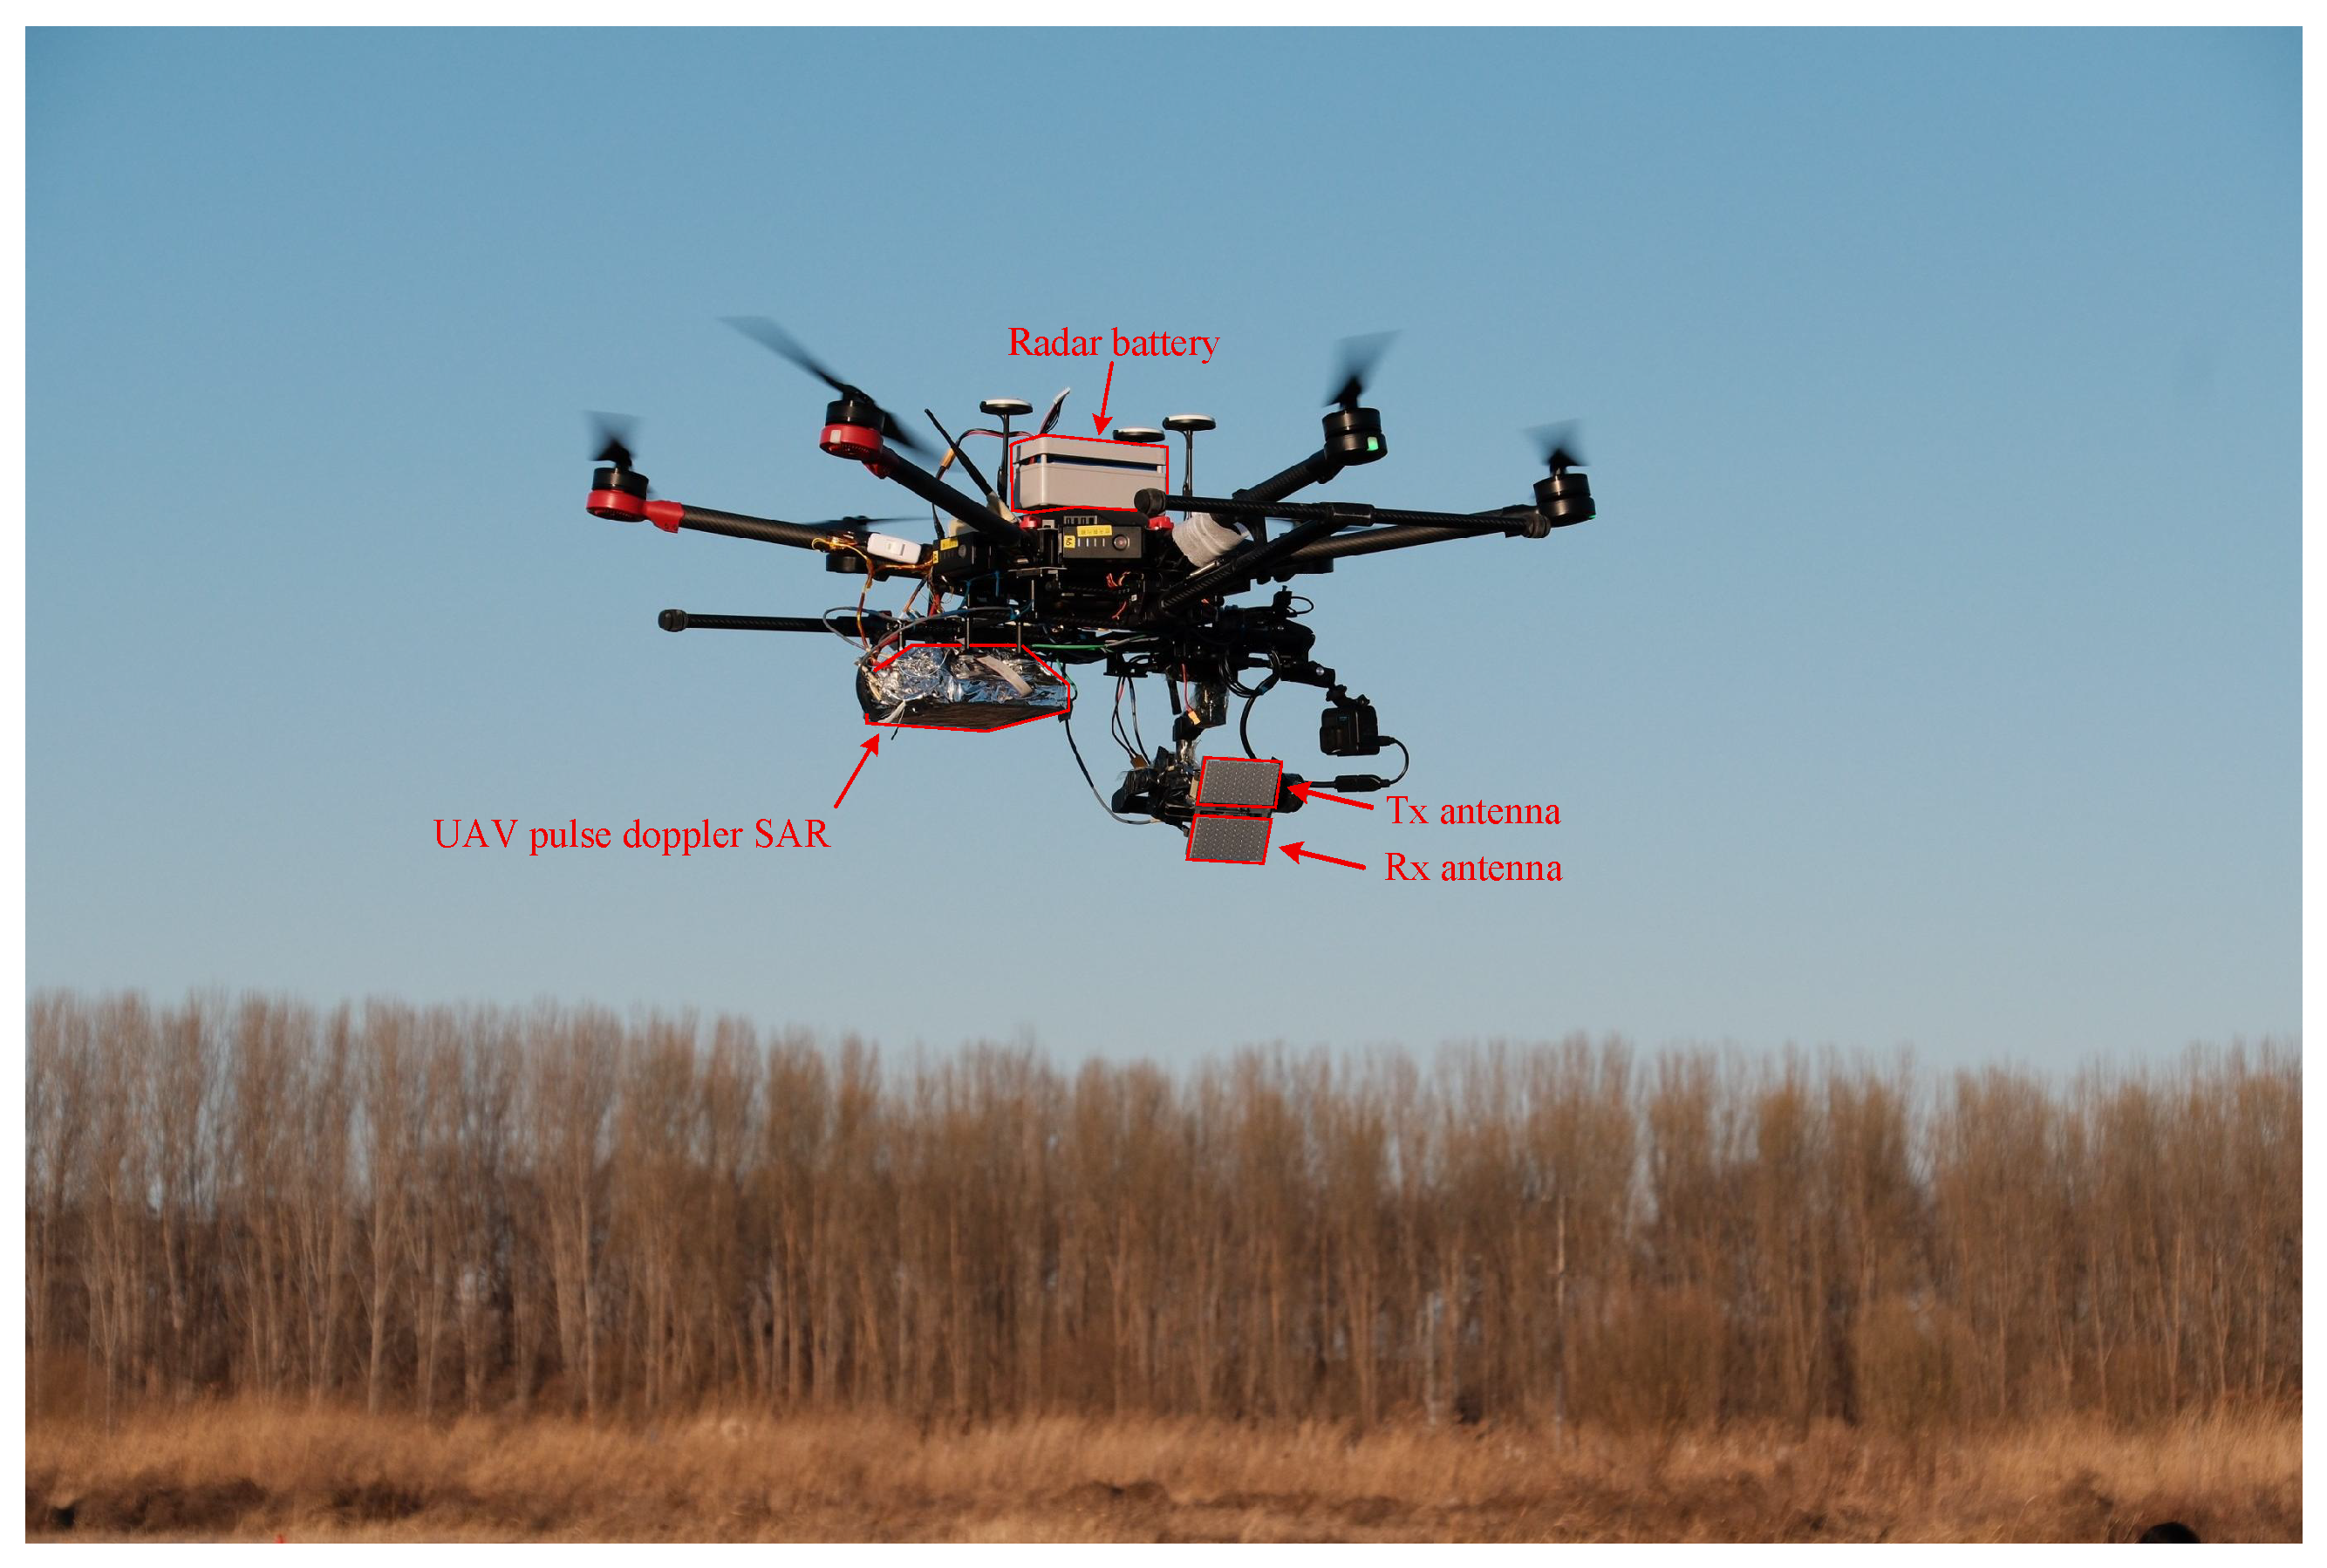
In this section, a radar carrying flight test is conducted using a lightweight small multi-rotor UAV, and the acquired raw data verifies the performance of the system. In November 2025, an imaging experiment of the self-developed pulse-Doppler mini-SAR was carried out in Tianjin, China, with the DJI M600 Pro (SZ DJI Technology Co., Ltd., Shenzhen, China) serving as the onboard UAV platform, as shown in Figure 18.
Figure 18.
Flight Experiment of Ka-band Mini-SAR System Based on DJI M600 Pro Platform.
The system adopts transmit-receive separated antennas to transmit and receive chirp signals, so as to avoid signal interference between the antennas. The radar is battery-powered, and the duration of a single flight is determined by the endurance of the platform, which is approximately 30 min. The detailed system parameters are listed in Table 4.
Table 4.
Ka-Band Mini-SAR System Parameters.
After the completion of the flight experiment, systematic imaging processing needs to be performed on the raw echo data collected by the radar, so as to accurately reconstruct the information of the observed scene and verify the imaging performance of the system. The specific processing flow is as follows: First, considering that the UAV platform is susceptible to airflow disturbances, attitude variations, and other factors during flight, which will induce space-variant effects caused by motion errors, precise compensation is implemented for the space-variant errors during platform movement based on the attitude and motion data acquired by the IMU, laying a solid foundation for high-quality imaging in subsequent steps. Second, the wk imaging algorithm, which is suitable for lightweight mini-SAR systems, is adopted to conduct preliminary focusing processing on the compensated echo data. This algorithm features strong motion adaptability and high imaging efficiency, which can effectively compress the signal bandwidth and improve the target resolution capability. Finally, to further correct residual phase errors and achieve ultra-high-precision focusing, the phase autofocus algorithm is introduced to optimize the image. The final imaging results are shown in Figure 19.
Figure 19.
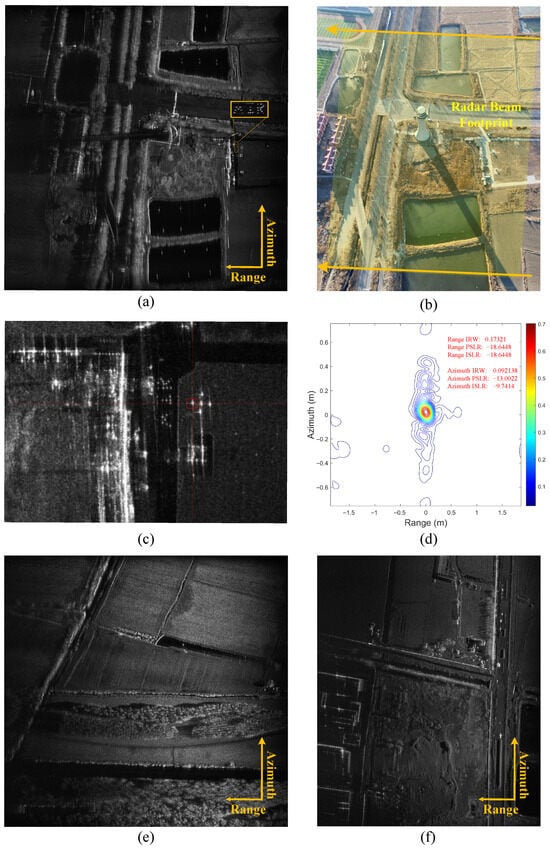
Imaging Results of Ka-band Mini-SAR Flight Experiment. (a) Imaging Result of Scene 1 with Tall Tower, Buildings and “AIR” Can Target. (b) Optical Photo of Scene 1. Yellow Area Indicates Radar Beam Illumination Range. (c) Imaging result of the corner reflector in Scene 1 (red square). (d) Two-dimensional upsampling result of the strong point target formed by the corner reflector. (e) Imaging Result of Scene 2 with Farmland, Pond and Shrubs. (f) Imaging Result of Scene 3 with Roads, Low-rise Houses and Mounds.
Figure 19a presents one of the typical imaging results obtained from this flight experiment. To intuitively and accurately verify the focusing performance of the system, cans with high scattering characteristics were artificially arranged to form the three letters “AIR” as characteristic targets in the observed scene during the experimental design phase. It can be clearly observed from the imaging results in Figure 19a that the three letters “AIR” have sharp contour edges free of defocusing blur, and the details of each letter are precisely focused. This fully demonstrates the effectiveness of the system’s motion compensation scheme and imaging algorithms. Figure 19b displays the optical aerial image of the scene corresponding to Figure 19a, which can be used for direct comparison to verify the consistency between the SAR imaging results and the actual scene. Figure 19c shows the imaging result of the corner reflectors placed (red square) in the imaging scene Figure 19a, which is used to quantitatively evaluate the imaging performance of the UAVSAR system. Figure 19d presents the result of two-dimensional upsampling for the strong reflective point target formed by the corner reflector. It can be seen from the parameters that the imaging resolution is better than 0.3 m. In addition, Figure 19c,d show the SAR imaging results of another two different observed scenes, respectively. Clear identification of scene details such as ground road textures, the edges of low-rise buildings, and vegetation distribution areas can be achieved from these images, with distinct texture layers, good contrast, and no significant clutter interference.
Based on the comprehensive analysis of the high-precision focusing imaging results from the three different observed scenes mentioned above, it can be concluded that the developed Ka-band mini-SAR system, when mounted on the UAV platform, can not only achieve high-precision imaging of artificial characteristic targets but also realize high-resolution and high-definition imaging reconstruction of complex natural scenes. This fully verifies that the Ka-band mini-SAR system has excellent motion compensation capability, imaging focusing performance, and practical scene adaptability, which fully meets the design specifications and application requirements of lightweight mini-SAR systems.
5. Discussion
Multi-rotor UAV have emerged as pivotal platforms for SAR in diverse remote sensing missions, owing to their superior maneuverability and robustness in complex flight environments. Nevertheless, the stringent constraints on SWaP typical of multi-rotor platforms present significant challenges for the deployment of high-performance radar payloads. Although FMCW architectures are widely adopted in micro-UAV SAR systems for their extreme miniaturization, they are inherently limited by direct-path signal leakage and relatively constrained anti-interference capabilities in complex electromagnetic environments.
In contrast to prevailing FMCW designs, the pulse-Doppler architecture proposed in this work leverages temporal isolation between transmission and reception to physically eliminate energy leakage, thereby preventing degradation in imaging performance. Regarding technical specifications, while reported micro-SAR systems typically maintain bandwidths between 400 MHz and 600 MHz [26,27], the developed system achieves an ultra-wide bandwidth of 1.2 GHz, providing a theoretical range resolution of sub-0.3 m.
This performance breakthrough is primarily attributed to the simplified direct IF-LFM generation scheme. By eliminating the conventional baseband-IF-RF three-stage conversion, this architecture fundamentally suppresses I/Q imbalance and local oscillator leakage introduced by analog mixers. Furthermore, systematic optimization of the hardware architecture restricts the FPGA resource utilization to less than 30% during the concurrent generation, processing, and storage of 1.2 GHz signals. This efficiency provides substantial computational margins for the future integration of on-board real-time imaging, cognitive processing, or BAQ algorithms.
Complementary to the architectural simplification, the proposed two-step error correction method is vital for maintaining signal integrity within the highly integrated environment. Deterministic amplitude and phase distortions, exacerbated by component nonlinearities and thermal drifts in compact RF chains, are precisely compensated using complex FIR filtering and segmented pre-distortion techniques. Such a design strategy, characterized by the tight integration of digital and RF components alongside a lightweight (90 g) waveguide slot antenna, achieves an optimal balance between high-resolution performance and UAV SWaP constraints, representing the state of the art in this domain.
In conclusion, the developed Ka-band pulse-Doppler SAR system demonstrates that ultra-wideband performance and lightweight design are not mutually exclusive. Through the deep synergistic optimization of the signal chain and correction algorithms, this research lays a critical foundation for high-precision UAV remote sensing in complex interference environments.
6. Conclusions
This paper develops a novel lightweight Ka-band pulse-Doppler SAR system for multi-rotor UAVs, addressing the trade-off between pulsed SAR’s high performance and UAVs’ SWaP constraints. Integrating a simplified IF-LFM generation architecture, highly integrated components, and a compact waveguide slot antenna, the system retains pulsed SAR’s advantages of strong anti-interference and high resolution. A two-step error correction method effectively reduces amplitude/phase distortion. Flight experiments have verified the imaging of artificial and natural scenes, with an imaging resolution of 0.3m, verifying the performance of the system and its practicality in unmanned aerial vehicle remote sensing tasks.
Author Contributions
Conceptualization, Y.L., Y.W. and P.W.; Methodology, Y.L., Y.W. and P.W.; Software, Y.W., J.S. and M.Z.; Validation, Y.L., Y.W., J.S., J.Q., J.S., K.X., Z.C., X.F., H.Z., M.Z., X.R., P.W., Y.Y. and F.Z.; Formal analysis, Y.W., P.W. and Y.L.; Investigation, Y.L., Y.W., J.S. and P.W.; Resources, Y.L., Y.W. and P.W.; Data curation, Y.W.; Writing—original draft, Y.W.; Writing—review & editing, Y.W.; Visualization, Y.W.; Supervision, F.Z.; Project administration, F.Z.; Y.L. and Y.W. contributed equally and reserve the right to list their name first in their resumes. All authors have read and agreed to the published version of the manuscript.
Funding
This research received no external funding.
Data Availability Statement
Dataset available on request from the authors.
Acknowledgments
We would like to thank the Aerospace Information Research Institute, Chinese Academy of Sciences, China; and the School of Electronic, Electrical and Communication Engineering, University of Chinese Academy of Sciences.
Conflicts of Interest
The authors declare no conflicts of interest.
References
- Cumming, I.G.; Wong, F.H. Digital Processing of Synthetic Aperture Radar Data; Artech House: Norwood, MA, USA, 2005; Volume 1, pp. 108–110. [Google Scholar]
- Qiu, J.; Zhang, Z.; Wang, R.; Wang, P.; Zhang, H.; Du, J.; Wang, W.; Chen, Z.; Zhou, Y.; Jia, H.; et al. A Novel Weight Generator in Real-Time Processing Architecture of DBF-SAR. IEEE Trans. Geosci. Remote Sens. 2022, 60, 5204915. [Google Scholar] [CrossRef] [Scilit]
- Wei, Y.; Zhang, Y.; Liu, Y.; Wang, W.; Wang, P.; Deng, Y.; Peng, W.; Zhang, Z.; Wang, Z.; Liu, R. Elevation-Interpulse Phase-Coded Waveform: A Novel Radar Waveform for Spaceborne MIMO-SAR. IEEE Trans. Geosci. Remote Sens. 2025, 63, 5213818. [Google Scholar] [CrossRef] [Scilit]
- Henderson, F.; Lewis, A. Manual of Remote Sensing: Principles and Applications of Imaging Radar; Wiley: New York, NY, USA, 1998. [Google Scholar]
- Li, B.; Chen, D.; Cao, H.; Wang, J.; Li, H.; Fu, T.; Zhang, S.; Zhao, L. Estimating the Observation Area of a Stripmap SAR via an ISAR Image Sequence. Remote Sens. 2023, 15, 5484. [Google Scholar] [CrossRef] [Scilit]
- Mu, H.; Zhang, Y.; Jiang, Y.; Ding, C. CV-GMTINet: GMTI Using a Deep Complex-Valued Convolutional Neural Network for Multichannel SAR-GMTI System. IEEE Trans. Geosci. Remote Sens. 2022, 60, 5201115. [Google Scholar] [CrossRef] [Scilit]
- Sabour, M.H.; Jafary, P.; Nematiyan, S. Applications and classifications of unmanned aerial vehicles: A literature review with focus on multi-rotors. Aeronaut. J. 2023, 127, 466–490. [Google Scholar] [CrossRef] [Scilit]
- Galle, B.; Arellano, S.; Bobrowski, N.; Conde, V.; Fischer, T.P.; Gerdes, G.; Gutmann, A.; Hoffmann, T.; Itikarai, I.; Krejci, T.; et al. A multi-purpose, multi-rotor drone system for long-range and high-altitude volcanic gas plume measurements. Atmos. Meas. Tech. 2021, 14, 4255–4277. [Google Scholar] [CrossRef] [Scilit]
- Bahabry, A.; Wan, X.; Ghazzai, H.; Menouar, H.; Vesonder, G.; Massoud, Y. Low-Altitude Navigation for Multi-Rotor Drones in Urban Areas. IEEE Access 2019, 7, 87716–87731. [Google Scholar] [CrossRef] [Scilit]
- Brigui, F.; Angelliaume, S.; Castet, N.; Dupuis, X.; Martineau, P. SARLight—First SAR Images from the New Onera SAR Sensor on UAV Platform. In Proceedings of the IGARSS 2022—2022 IEEE International Geoscience and Remote Sensing Symposium, Kuala Lumpur, Malaysia, 17–22 July 2022; pp. 7721–7724. [Google Scholar]
- Luebeck, D.; Wimmer, C.; Moreira, L.F.; Alcântara, M.; Oré, G.; Góes, J.A.; Oliveira, L.P.; Teruel, B.; Bins, L.S.; Gabrielli, L.H.; et al. Drone-borne Differential SAR Interferometry. Remote Sens. 2020, 12, 778. [Google Scholar] [CrossRef] [Scilit]
- Yan, X.; Chen, J.; Liyanage, B.; Wang, P.; Yang, W. A light-weight SAR system for multi-rotor UAV platform using LFM quasi-CW waveform. In Proceedings of the 2016 IEEE International Geoscience and Remote Sensing Symposium (IGARSS), Beijing, China, 10–15 July 2016; pp. 7346–7349. [Google Scholar]
- Milly, X.D.; Nouvel, J.-F.; Cantalloube, H.; Castet, N.; Boisot, O.; Dupuis, X. Sar-Light, A Versatile Sar Sensor on Uav Platform for Target Characterization. In Proceedings of the IGARSS 2023—2023 IEEE International Geoscience and Remote Sensing Symposium, Pasadena, CA, USA, 16–21 July 2023; pp. 1898–1901. [Google Scholar]
- Jean-Francois, N.; Nicolas, C.; Jérôme, H. SAR Imaging Challenges on UAV Trajectory Restitution Study Case with SAR-Light Prototype at X-Band. In Proceedings of the 2022 IEEE International Symposium on Inertial Sensors and Systems (INERTIAL), Avignon, France, 8–11 May 2022; pp. 1–3. [Google Scholar] [CrossRef] [Scilit]
- Curlander, J.C.; McDonough, R.N. Synthetic Aperture Radar: Systems and Signal Processing; Wiley: New York, NY, USA, 1991. [Google Scholar]
- Li, N.; Lv, Z.; Guo, Z.; Zhao, J. Time-Domain Notch Filtering Method for Pulse RFI Mitigation in Synthetic Aperture Radar. IEEE Geosci. Remote Sens. Lett. 2022, 19, 4013805. [Google Scholar] [CrossRef] [Scilit]
- Zhang, Y.; Wang, W.; Wang, R.; Deng, Y.; Jin, G.; Long, Y. A Novel NLFM Waveform With Low Sidelobes Based on Modified Chebyshev Window. IEEE Geosci. Remote Sens. Lett. 2020, 17, 814–818. [Google Scholar] [CrossRef] [Scilit]
- Jin, G.; Zhang, X.; Huang, J.; Zhu, D. High Freedom Parameterized FM (HFPFM) Code: Model, Correlation Function and Advantages. IEEE Trans. Aerosp. Electron. Syst. 2024, 60, 6284–6298. [Google Scholar] [CrossRef] [Scilit]
- Zhu, Z. Design of a Polyphase Parallel DDS Waveform Generator. In Proceedings of the 2023 IEEE 3rd International Conference on Information Technology, Big Data and Artificial Intelligence (ICIBA), Chongqing, China, 26–28 May 2023; pp. 1145–1148. [Google Scholar] [CrossRef] [Scilit]
- Dai, C.; Chai, W.; Zhang, J.; Chong, Y. X-band UWB-LFM signal generation technique based on PLL. In Proceedings of the 2016 CIE International Conference on Radar (RADAR), Guangzhou, China, 10–13 October 2016; pp. 1–4. [Google Scholar] [CrossRef] [Scilit]
- Jiang, T.; Li, B.; Sun, B.; Ma, X. Reserch of Digital Predistortion for Ultra Wideband LFM signal. In Proceedings of the 2022 3rd International Conference on Geology, Mapping and Remote Sensing (ICGMRS), Zhoushan, China, 22–24 April 2022; pp. 154–157. [Google Scholar] [CrossRef] [Scilit]
- Jin, G.; Liu, K.; Deng, Y.; Sha, Y.; Wang, R.; Liu, D.; Wang, W.; Long, Y.; Zhang, Y. Nonlinear Frequency Modulation Signal Generator in LT-1. IEEE Geosci. Remote Sens. Lett. 2019, 16, 1570–1574. [Google Scholar] [CrossRef] [Scilit]
- Wei, Y.; Liu, Y.; Wang, P.; Zhang, Y.; Qiu, J.; Deng, Y.; Wang, W.; Liu, R.; Zhang, Z.; Li, J. Intermediate-Frequency Nonlinear Frequency Modulation Signal Generator for UAV SAR Missions. IEEE Geosci. Remote Sens. Lett. 2024, 21, 4007405. [Google Scholar] [CrossRef] [Scilit]
- Parks, T.; McClellan, J. A program for the design of linear phase finite impulse response digital filters. IEEE Trans. Audio Electroacoust. 1972, 20, 195–199. [Google Scholar] [CrossRef] [Scilit]
- Karam, L.J.; McClellan, J.H. Complex Chebyshev approximation for FIR filter design. IEEE Trans. Circuits Syst. II Analog. Digit. Signal Process. 1995, 42, 207–216. [Google Scholar] [CrossRef] [Scilit]
- Nouvel, J.F.; Angelliaume, S.; Ruault du Plessis, O. The ONERA compact Ka-SAR. In Proceedings of the 2008 European Radar Conference, Amsterdam, The Netherlands, 30–31 October 2008; pp. 475–478. [Google Scholar] [CrossRef] [Scilit]
- Chenot, C.; Coquillas, B.; Marty, J.Y.; Ghetti, P.; Rakotovao, R.; Belmon, A.; Digneau, D.; Evrard, L.; Le Blanc, J.; Merlet, T.; et al. EPIK-SAR: Embedded radar Platform In Ku-band for SAR applications. In Proceedings of the 2024 International Radar Conference (RADAR), Rennes, France, 21–25 October 2024; pp. 1–6. [Google Scholar] [CrossRef] [Scilit]

Disclaimer/Publisher’s Note: The statements, opinions and data contained in all publications are solely those of the individual author(s) and contributor(s) and not of MDPI and/or the editor(s). MDPI and/or the editor(s) disclaim responsibility for any injury to people or property resulting from any ideas, methods, instructions or products referred to in the content. |
© 2026 by the authors. Licensee MDPI, Basel, Switzerland. This article is an open access article distributed under the terms and conditions of the Creative Commons Attribution (CC BY) license.