Article

Assessment of Three High-Resolution Forest Canopy Height Products in China

1
School of Resources and Environmental Engineering, Ludong University, Yantai 264025, China
2
Institute for Advanced Study of Coastal Ecology, Ludong University, Yantai 264025, China
*
Author to whom correspondence should be addressed.
Remote Sens. 2026, 18(7), 1046; https://doi.org/10.3390/rs18071046
Submission received: 21 January 2026 / Revised: 14 March 2026 / Accepted: 28 March 2026 / Published: 31 March 2026

Highlights

What are the main findings?
  • Performance of three high-resolution forest canopy height (FCH) products varies significantly across spatial scales and evaluation metrics.
  • Discrepancies in forest definitions among datasets critically influence accuracy assessments and comparability.
  • NNGI_FCH shows relatively balanced performance across the evaluated metrics when integrating forest area, spatial consistency, and overall accuracy.
What are the implications of the main findings?
  • Our analysis identifies major sources of divergence among three FCH products and offers practical guidance for selecting the most suitable FCH data for China’s heterogeneous forest ecosystems.
  • Our findings support improved forest monitoring and contribute to more reliable ecological modeling and sustainable resource management, with implications extending beyond China.

Abstract

Large-scale mapping of forest canopy height (FCH) is crucial for accurately understanding ecosystem succession and forest carbon sinks. Recently, three high-resolution FCH products have been released, including global forest canopy height (GFCH), NNGI_FCH_China (NNGI_FCH), and ETH_GlobalCanopyHeight (ETH_GCH). This study provides a detailed assessment of these FCH products across China from forest area, spatial consistency, and overall accuracy, with additional analyses of forest classification errors and evaluation under a unified forest mask. The assessment is conducted using forest inventory data, the China land cover dataset, and field measurement data. The results show that NNGI_FCH had the smallest relative error of 13.4% and achieved better estimates of forest area in all regions but the north and northeast regions. GFCH had the highest spatial consistency of 70.8% nationwide, followed by NNGI_FCH (69.7%), which performed slightly better than GFCH in the east and northwest regions. ETH_GCH exhibited the lowest spatial consistency of 35.6% and remained below 50% across all regions except the northeast and south regions. ETH_GCH demonstrated the highest overall accuracy across the country, with an R2 and RMSE of 0.56 and 4.14 m, followed by NNGI_FCH (R2 = 0.49, RMSE = 3.38 m) and GFCH (R2 = 0.48, RMSE = 3.38 m). Validation results of ETH_GCH were relatively stable in different regions of China, while those of NNGI_FCH varied more but still outperformed GFCH. This study offers valuable insights by evaluating large-scale FCH products, which will be a key basis for in-depth studies on the utilization and improvement of future FCH mapping.

1. Introduction

Forests form a critical component of the terrestrial carbon cycle. Enhancing forest carbon sinks is regarded as a primary approach to mitigating the rise of atmospheric CO2 concentrations and global warming, and it is also an effective way to achieve carbon neutrality [1,2]. Forest canopy height (FCH), as a key parameter describing forest vertical structure, is fundamental to the forest carbon cycle and global climate change [3,4]. High-resolution FCH products at a large scale play an irreplaceable role in accurately estimating forest carbon sinks, understanding forest ecosystem processes, and optimizing forest management strategies [5,6].
Light detection and ranging (LiDAR) is capable of penetrating the forest canopy for vertical structure information [7]. Therefore, LiDAR has been extensively used as an important data source for forest height estimation [8]. In particular, spaceborne LiDAR data have unparalleled advantages in the inversion and mapping of forest height over large areas [9,10]. The first earth observation spaceborne LiDAR instrument, the Geoscience Laser Altimeter System (GLAS), is onboard the Ice, Cloud, and land Elevation Satellite (ICESat) and has been successfully adopted for FCH retrieval at both regional or global scale [11,12,13]. However, the existing forest height maps produced by ICESat-1 GLAS have typically been undertaken at coarser spatial resolution (e.g., 500 m or 1 km) because of discrete ground sampling footprints. Compared with ICESat-1 GLAS, the recently launched ICESat-2 Advanced Topographic Laser Altimeter System (ATLAS) and Global Ecosystem Dynamics Investigation (GEDI) have smaller footprint diameters and higher sampling density, providing an unprecedented opportunity for large-scale high-resolution FCH mapping [4,14,15,16]. To overcome the spatial discontinuity problem of ICESat-2 ATLAS and GEDI data, researchers have tried to fuse these data with passive optical images to develop spatially continuous FCH distribution with the aid of statistical models, machine learning algorithms, and geostatistical methods. At national and continental scales, Zhu [15] established a forest height extrapolation model based on ICESat-2 ATLAS, GEDI, and optical remote sensing data to produce an FCH map with 30 m resolution across China (RMSE = 2.67 m). Liu et al. [5] developed a novel neural network guided interpolation (NNGI) method for mapping a 30 m FCH product of China by integrating GEDI, ICESat-2 ATLAS, and Sentinel-2 images (RMSE = 4.88–5.32 m). Malambo and Popescu [17] applied a gradient-boosted tree regression model and ICESat-2 canopy heights with ancillary Landsat, LANDFIRE (Landscape Fire and Resource Management Planning Tools), and topographic variables to produce a spatially explicit 30 m FCH product across the contiguous United States (MAE = 2.50 m). By integrating multidecadal spectral data from the Landsat archive and calibration data from Airborne Laser Scanning (ALS) and GEDI, Turubanova et al. [18] created a spatiotemporally consistent annual FCH dataset at a 30 m resolution for Europe based on improved regression tree ensembles (RMSE ≤ 4 m). On a global scale, Potapov et al. [10] developed a 30 m spatial resolution FCH map using the bagged regression tree ensemble method through integration of GEDI and Landsat data (RMSE = 6.60–9.07 m). Lang et al. [6] produced a global FCH map with a spatial resolution of 10 m by using a fully convolutional neural network that fused GEDI observations and Sentinel-2 data. More recently, Meta and the World Resources Institute generated a global FCH map at a 1 m resolution based on multiple remote sensing data such as WorldView, Quickbird, ALS, and GEDI (MAE = 2.80 m) [19]. These products provide a new approach for obtaining large-scale and high-resolution FCH data, which are key to understand terrestrial ecosystem functions. However, the FCH estimates of different products suffered from limited accuracy related to, for example, the different definitions of forest tree height, the quality of input data, and the accuracy of modeling procedures [3,20], which caused inconsistencies in the magnitude of FCH values and their spatial distribution across the same area [21]. Therefore, evaluating existing high-resolution FCH maps has scientific significance in reasonably using the relevant data and developing more accurate FCH products.
Due to the implementation of intensive afforestation and reforestation practices since the late 1970s, China’s forest areas and FCH have undergone notable changes. This poses a challenge for accurately quantifying forest biomass and carbon sink potential. In this study, we utilized three high-resolution FCH products across China, including Global Forest Canopy Height [10], NNGI_FCH_China [5], and ETH_GlobalCanopyHeight [6]. The main objectives are to (1) assess the accuracy of canopy height estimates in these products from forest area, spatial consistency, and overall accuracy; (2) demonstrate the applicability and uncertainty of FCH products in the Chinese region; and (3) analyze the potential reasons for inconsistencies among the three FCH products. The results obtained in this study can help related researchers to select suitable FCH products for China and provide new implications for improving FCH mapping.

2. Materials and Methods

2.1. Data

2.1.1. Forest Canopy Height Products

The global forest canopy height (GFCH) map with a spatial resolution of 30 m for the year 2019 (https://glad.umd.edu/dataset/gedi/, accessed on 1 December 2024) was developed through the integration of GEDI data available for April–October 2019 and Landsat analysis-ready time series data [10]. It provided footprint-based measurements of vegetation structure, including FCH between 52°N and 52°S globally (Table 1). The 95th percentile of energy return height relative to the ground (RH95) was used as the estimate of FCH. The Landsat multi-temporal metrics that represent the surface phenology serve as the independent variable for FCH modeling. The locally calibrated “moving window” and applied bagged regression tree ensemble model was implemented to ensure a high quality of forest height prediction and global map consistency. The GFCH map was compared to the GEDI validation data (R2 = 0.62, RMSE = 6.6 m) and available airborne LiDAR data (R2 = 0.61, RMSE = 9.07 m).
Liu et al. [5] developed a novel NNGI method to map FCH (NNGI_FCH) of China for 2019 at 30 m resolution (https://www.3decology.org/dataset-software/, accessed on 1 December 2024). They extracted a series of RH metrics from canopy to canopy top photons and selected RH100 and RH98 as representative FCH derived from GEDI and ICESat-2 ATLAS, respectively. The fusion of GEDI, ICESat-2 ATLAS and Sentinel-2 data provided improved estimates of forest canopy heights, in which the average FCH of China was 15.90 m with a standard deviation of 5.77 m. NNGI-derived FCH showed good agreements with GEDI footprints (R2 = 0.55, RMSE = 5.32 m), drone–LiDAR validation data (R2 = 0.58, RMSE = 4.93 m), and field measurements (R2 = 0.60, RMSE = 4.88 m). The proposed NNGI-based FCH mapping approach largely alleviated the saturation effect in areas with taller forest canopies compared with the previous interpolation methods.
Lang et al. produced a comprehensive global canopy height (ETH_GCH) map at 10 m resolution for the year 2020 (https://langnico.github.io/globalcanopyheight/, accessed on 1 December 2024) [6]. By integrating GEDI data with Sentinel-2 images, they developed a deep convolutional neural network to retrieve canopy top height data for anywhere on Earth and to quantify the uncertainty in these estimates. FCH was defined as RH98, the relative height at which 98% of the energy returned. The presented approach reduced the saturation effect commonly encountered when estimating FCH from satellite observations, allowing tall canopies with likely high carbon stocks to be resolved. We resampled ETH_GCH data to the spatial resolution of 30 m per pixel using the nearest neighbor method.

2.1.2. Forest Inventory Data

National forest inventory data (FID) from 2014–2018 was used in this study. This dataset was compiled from measurements at 41.5 × 10⁴ permanent plots distributed evenly across China [22]. The areas of forest stands for different forest types were documented by province. Due to the lack of national FID for the period 2019–2023, it was necessary to estimate the forest area for 2020 in this study. Based on the inventory cycle of the National Forest Inventory and previous studies [23,24], we assumed that forest area in the 2014–2018 inventory represented the state of forest distribution in 2015 and that the ratio of forest stands to total forests would remain unchanged for the next 5 years (82.4%). According to the national forest management plan (2016–2050), we calculated the area of forest stands in 2020. The area of newly planted forests was estimated as the difference in total forest stand area between 2015 and 2020. Based on the area proportion of planted forests in different types reported by the national FID of 2014–2018, the area of newly planted forests was allocated to different forest types in the next 5 years with the assumption that the proportions of planted forests of different types would remain unchanged from 2015 to 2020. By summarizing the results of existing forests and newly planted forests of different types, we can obtain the estimated forest area for each province and region of China in 2020.

2.1.3. The China Land Cover Dataset

The China land cover dataset (CLCD) is the annual 30 m land cover product derived from Landsat imagery on the Google Earth Engine platform, covering the period from 1990 to 2024 [25]. Specifically, the CLCD was assessed using a random forest algorithm applied to multiple temporal metrics generated from 335709 Landsat scenes. A post-processing framework incorporating spatiotemporal filtering and logical reasoning was implemented to enhance spatial and temporal consistency. The dataset achieved an overall accuracy of 79.31% based on 5463 validation samples, outperforming previously released land cover products (MCD12Q1, ESACCI_LC, FROM_GLC, and GlobeLand30). The CLCD included nine major classes: cropland, forest, shrub, grassland, water, snow and ice, barren, impervious, and wetland. The overall classification accuracy of forest class was 85.49% ± 1.30%. In this study, CLCD products for 2019 and 2020 were used to assess the spatial consistency of FCH data for the corresponding year at the pixel scale.

2.1.4. Field Measurement Data

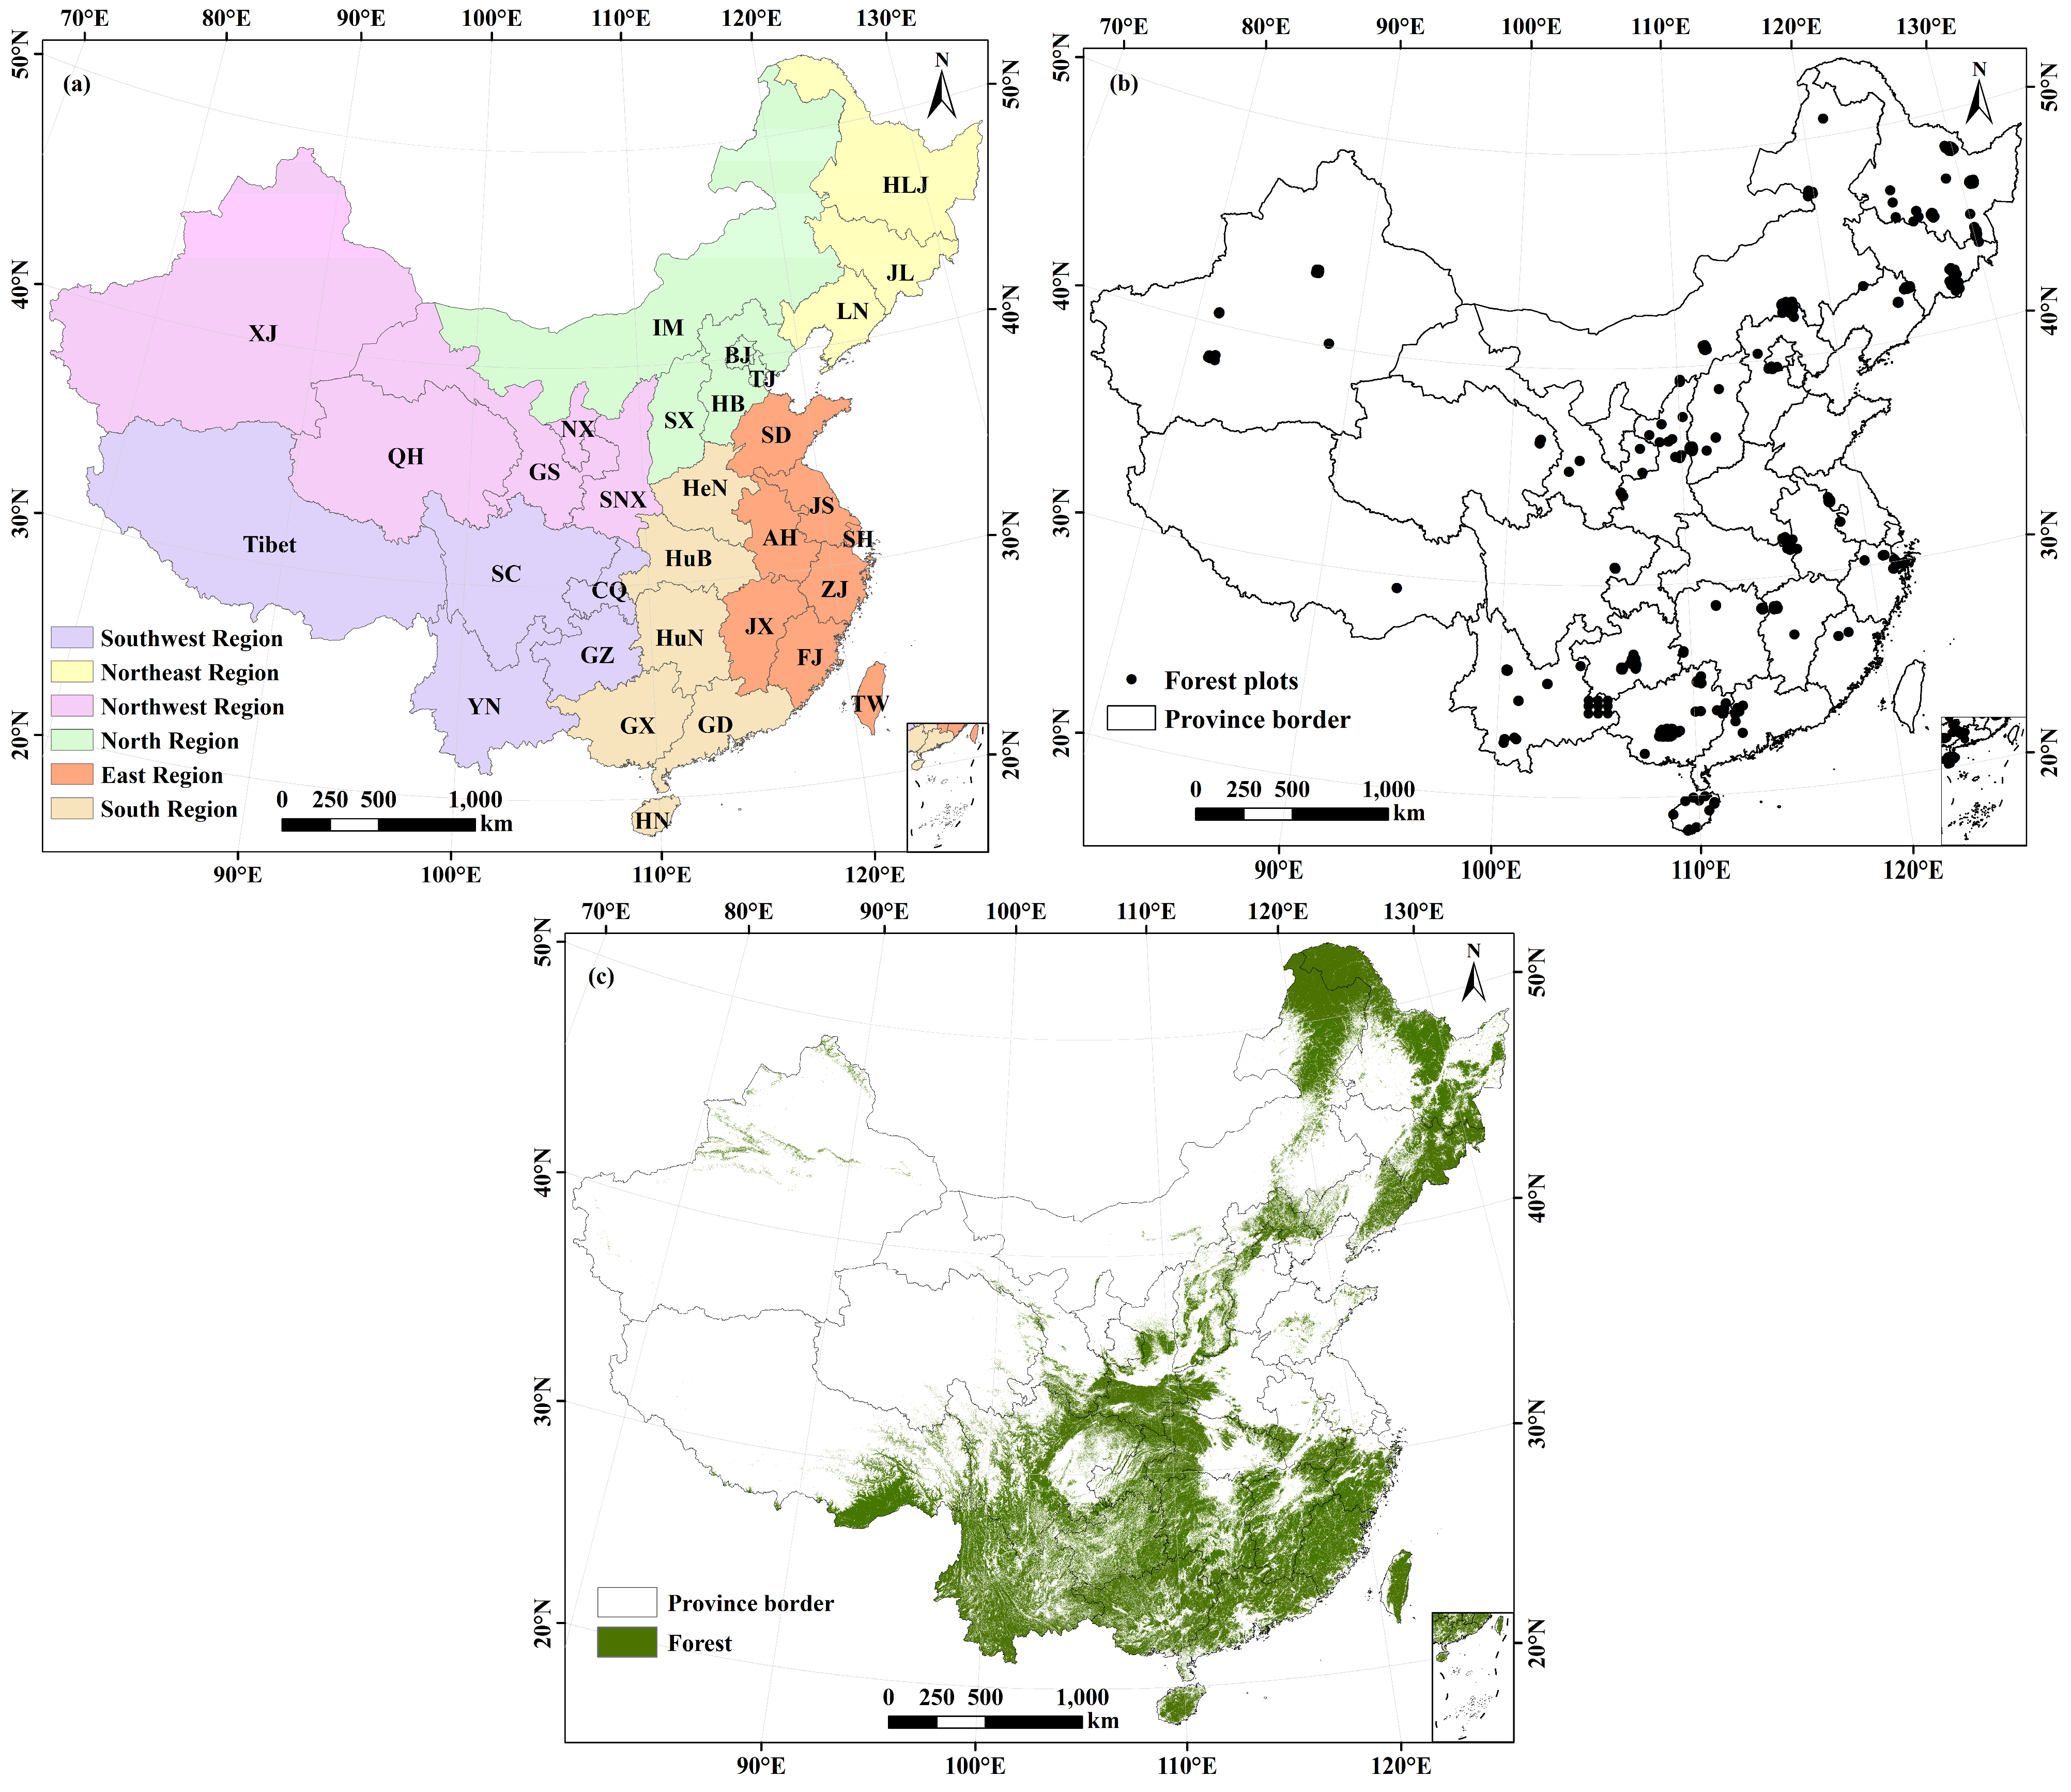
Field measurements at 1750 forest plots across China were collected from the literature and Science Data Bank (https://www.scidb.cn/, accessed on 2 December 2024) to evaluate the overall accuracy of FCH products (Figure 1a–c). The sampling was conducted for the period from 2016 to 2023. The recorded information of sampling plots included geographic location, forest type, and canopy height. These plots were evenly distributed in most regions of China except for the northwest region. Forest types and site conditions of the plots in most provinces were diverse. However, the sampling plots were sparse in the northwest region. Forests in this region accounted for a small fraction of the national total. Therefore, the lack of enough sampling plots here might have had a small impact on the accuracy of the three FCH maps.

2.2. Methods

2.2.1. Area Comparison Between FCH Products and FID

Relative error is one of the most common methods used to analyze the difference between the assessment data and the reference data [27]. In this study, the method is based on comparing the forest area consistency of three FCH products (GFCH, NNGI_FCH, and ETH_GCH) from FID at the regional and provincial scale. The calculation formula is as follows:
E = A F C H A F I D A F I D × 100 %
where E is the relative error of forest area, and AFCH and AFID denote the forest area obtained from the FCH product and FID for each region or province in China, respectively. AFCH is calculated as the number of canopy height pixels contained in each statistical division multiplied by the area of a single pixel (30 m × 30 m) in the FCH product.

2.2.2. Spatial Consistency for FCH Products

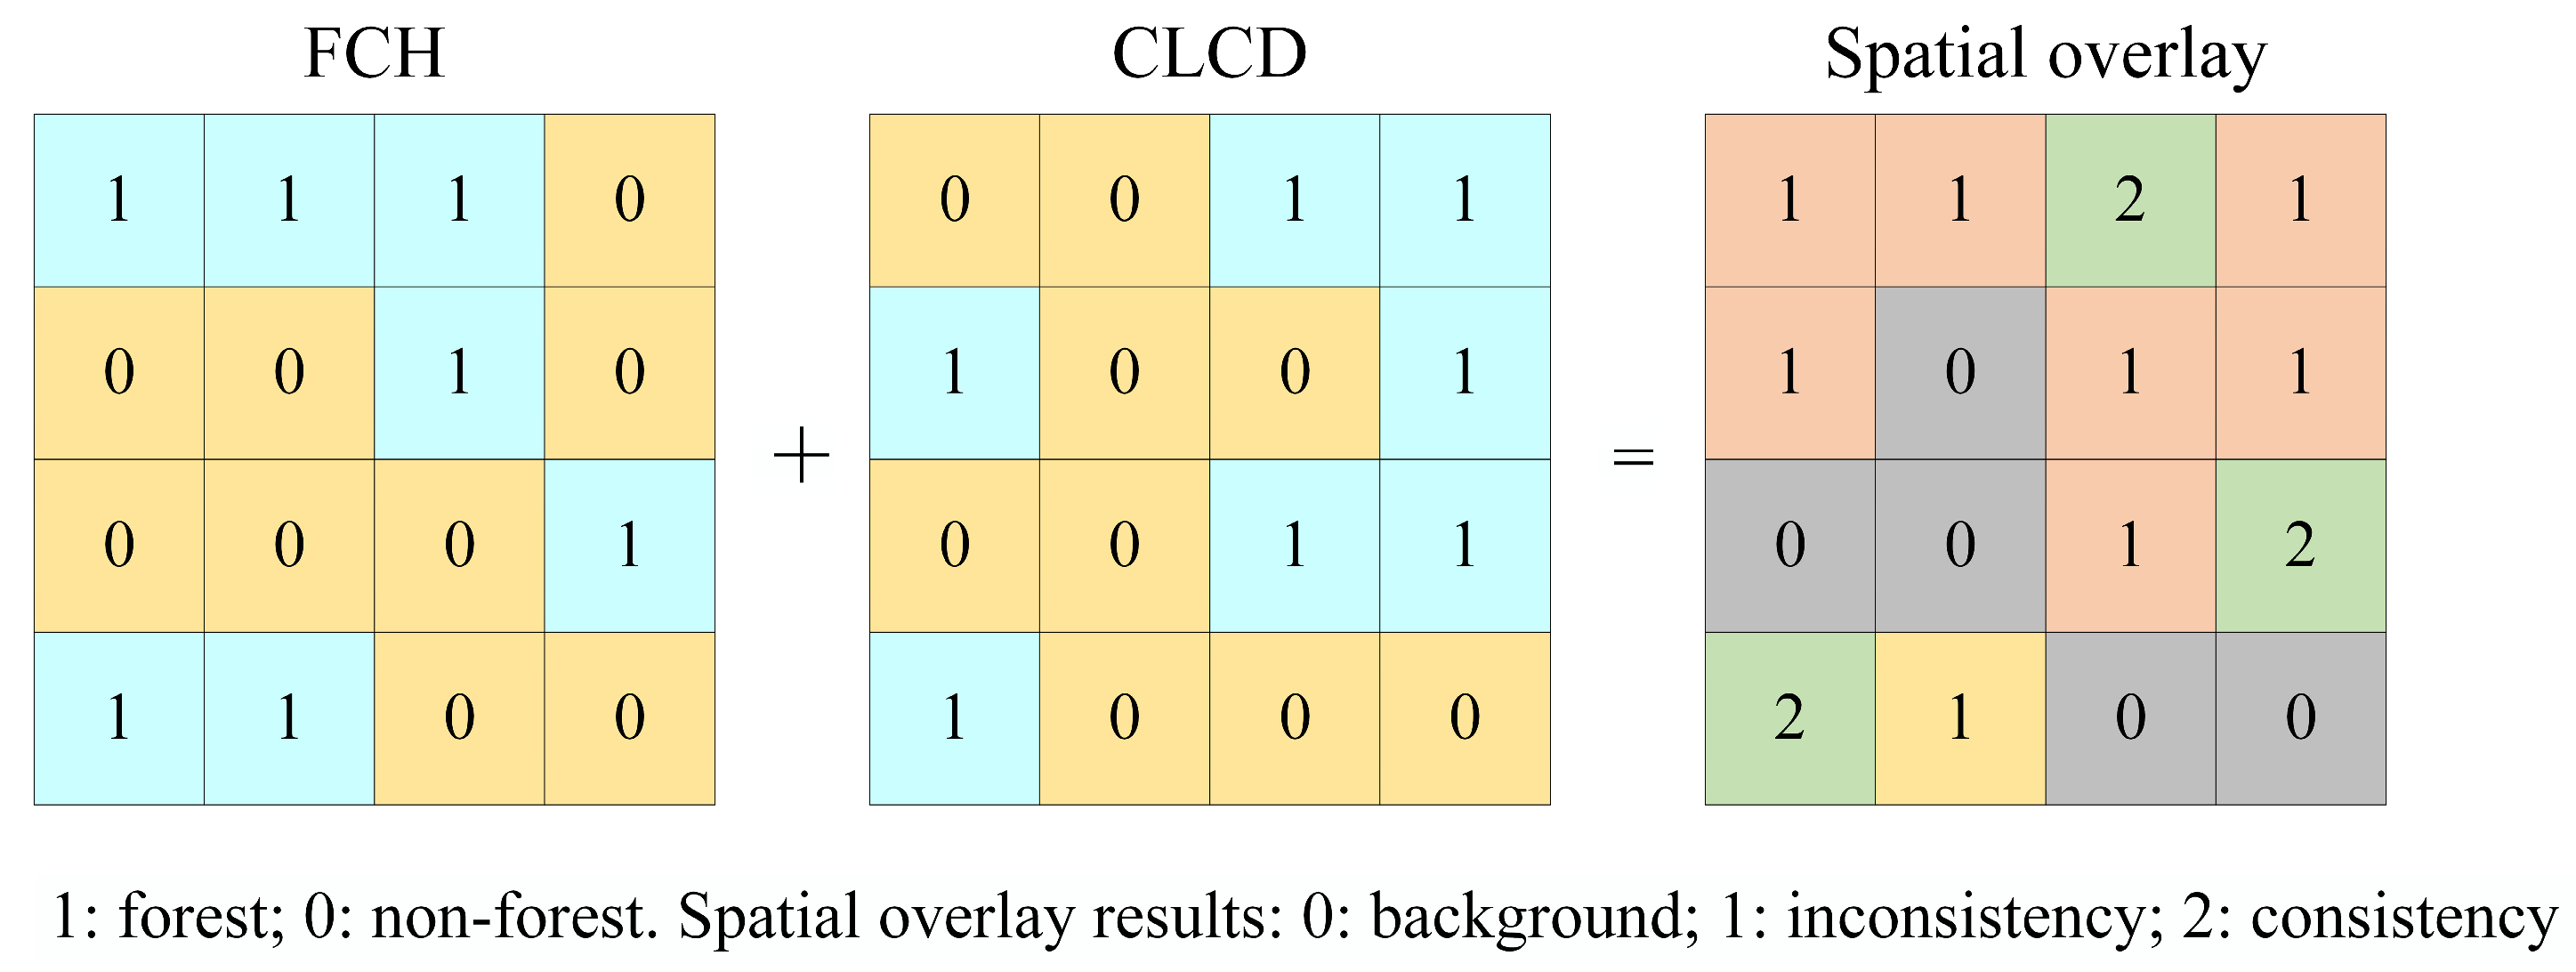
In order to intuitively illustrate the spatial consistency of the three FCH products in China, this study overlays each FCH product and CLCD data spatially based on ArcGIS 10.8.1 software (Figure 2). First, three FCH products and CLCD data for the corresponding year are binarized, respectively; this means that forest pixels are assigned a value of 1 and non-forest pixels are assigned a value of 0. Then, each FCH product and CLCD are calculated pixel by pixel using a raster calculator to acquire the spatial correspondence between the forest and non-forest pixels. Finally, based on the number of pixel-by-pixel matches that are obtained for the target classes from the FCH and CLCD data, the degree of consistency is divided into (1) consistency, i.e., when the target classes show exactly the same values for a given pixel, and (2) inconsistency, i.e., when the FCH and CLCD data have different target classes for a given pixel.

2.2.3. Method for Assessing Forest Classification Errors

To evaluate the accuracy of the three products in forest/non-forest classification, this study introduces two indicators: omission error and commission error. Based on the binarized results of the three FCH products and CLCD data, the classification results of the FCH products were compared with those of the CLCD data through spatial overlay analysis. The calculation formulas are as follows:
O E = F N T P + F N × 100 %
C E = F P T P + F P × 100 %
where OE represents the omission error, and CE represents the commission error. TP denotes the number of pixels classified as forest by both the FCH product and the CLCD data; FN denotes pixels classified as non-forest by the FCH product but as forest by the CLCD data; FP denotes pixels classified as forest by the FCH product but as non-forest by the CLCD data; and TN denotes pixels classified as non-forest by both the FCH product and the CLCD data.

2.2.4. Overall Accuracy of FCH Products

The overall accuracy of GFCH, NNGI_FCH, and ETH_GCH products in China was evaluated using 1750 field plot measurements, as mentioned in Section 2.1.4. We aggregated field plot measurements by region subdivisions to account for location inaccuracies and the 3-year gap between the field data and the FCH product. Statistical analysis indicates that the average temporal gap between field observations and product acquisition years is approximately 1.2 years. At national and regional scales, the canopy heights of GFCH, NNGI_FCH, and ETH_GCH products were compared with field measurements by way of linear regression. The coefficient of determination (R2) is used to describe the strength of the relationship between estimated and observed canopy heights, while the root mean square error (RMSE) is used to quantify estimation errors:
R 2 = 1 i = 1 n h i h ^ i 2 i = 1 n h i h ¯ i 2
R M S E = 1 n i = 1 n ( h i h ^ i ) 2  
where hi is the ith canopy height from field plot measurements; h ^ i is the corresponding canopy height taken from the GFCH, NNGI_FCH, or ETH_GCH product; h ¯ i is the average canopy height of all field measurements grouped by the whole country or region; and n is the number of samples.

3. Results

3.1. Comparisons of Estimated Forest Area from FCH Products with FID Estimates

There are significant differences in the estimates of forest area obtained from GFCH, NNGI_FCH and ETH_GCH products by comparison with the estimates of FID at the national and regional scales (Table 2). The estimated forest area from NNGI_FCH has the lowest relative error of 13.4% compared to FID at the national scale, followed by GFCH (58.8%) and ETH_GCH (188.6%). In most regions of China, these three FCH products tend to overestimate the forest area. GFCH has the best performance when compared with FID in the northeast region, with a relative error of −1.3% in the estimated forest area, which accurately reflects the canopy height variation within temperate coniferous forest and mixed forest. The estimated forest area from NNGI_FCH is slightly lower than FID, with a relative error of −6.7%. However, ETH_GCH overestimates 95.8% of the forest area. In the north region, the estimates of forest area from GFCH and NNGI_FCH agree well with FID, with relative errors of 5.4% and −13.3%, respectively. ETH_GCH has a larger relative error of 144.8% in this region. In the east region, the difference in forest area between GFCH and FID is 1.91 × 10⁵ km2, with a relative error of 77.9%. The NNGI_FCH product has a relatively smaller deviation, with a relative error of 15.3%, suggesting a low overestimation compared to GFCH. In contrast, the ETH_GCH product exhibits a relative error of 182.2%, which is significantly different from FID. In the south region, all three products show a trend of overestimation, with relative errors of 32.4%, 87.1%, and 147.7% for NNGI_FCH, GFCH, and ETH_GCH, respectively. In the southwest region, the relative errors of GFCH and ETH_GCH are 87.1% and 258.7%, respectively, but the NNGI_FCH product shows a lower relative error of 20.7%, indicating that NNGI_FCH has good applicability in this region. The forest resources in the northwest region are sparse and fragmented, which leads to the highest estimation errors of forest area among all products. GFCH shows a significant overestimation with a relative error of 81.5%, but NNGI_FCH has a relative error of 27.5%, representing its poorest performance across all regions. Furthermore, the estimated forest area by ETH_GCH is over three times greater than that of FID in this region. In general, the estimates of forest area from ETH_GCH are considerably larger than the FID estimates and have notable regional variations. Specifically, GFCH delivers relatively accurate estimates in the northeast and north regions, while NNGI_FCH demonstrates higher accuracy in the majority of other regions.
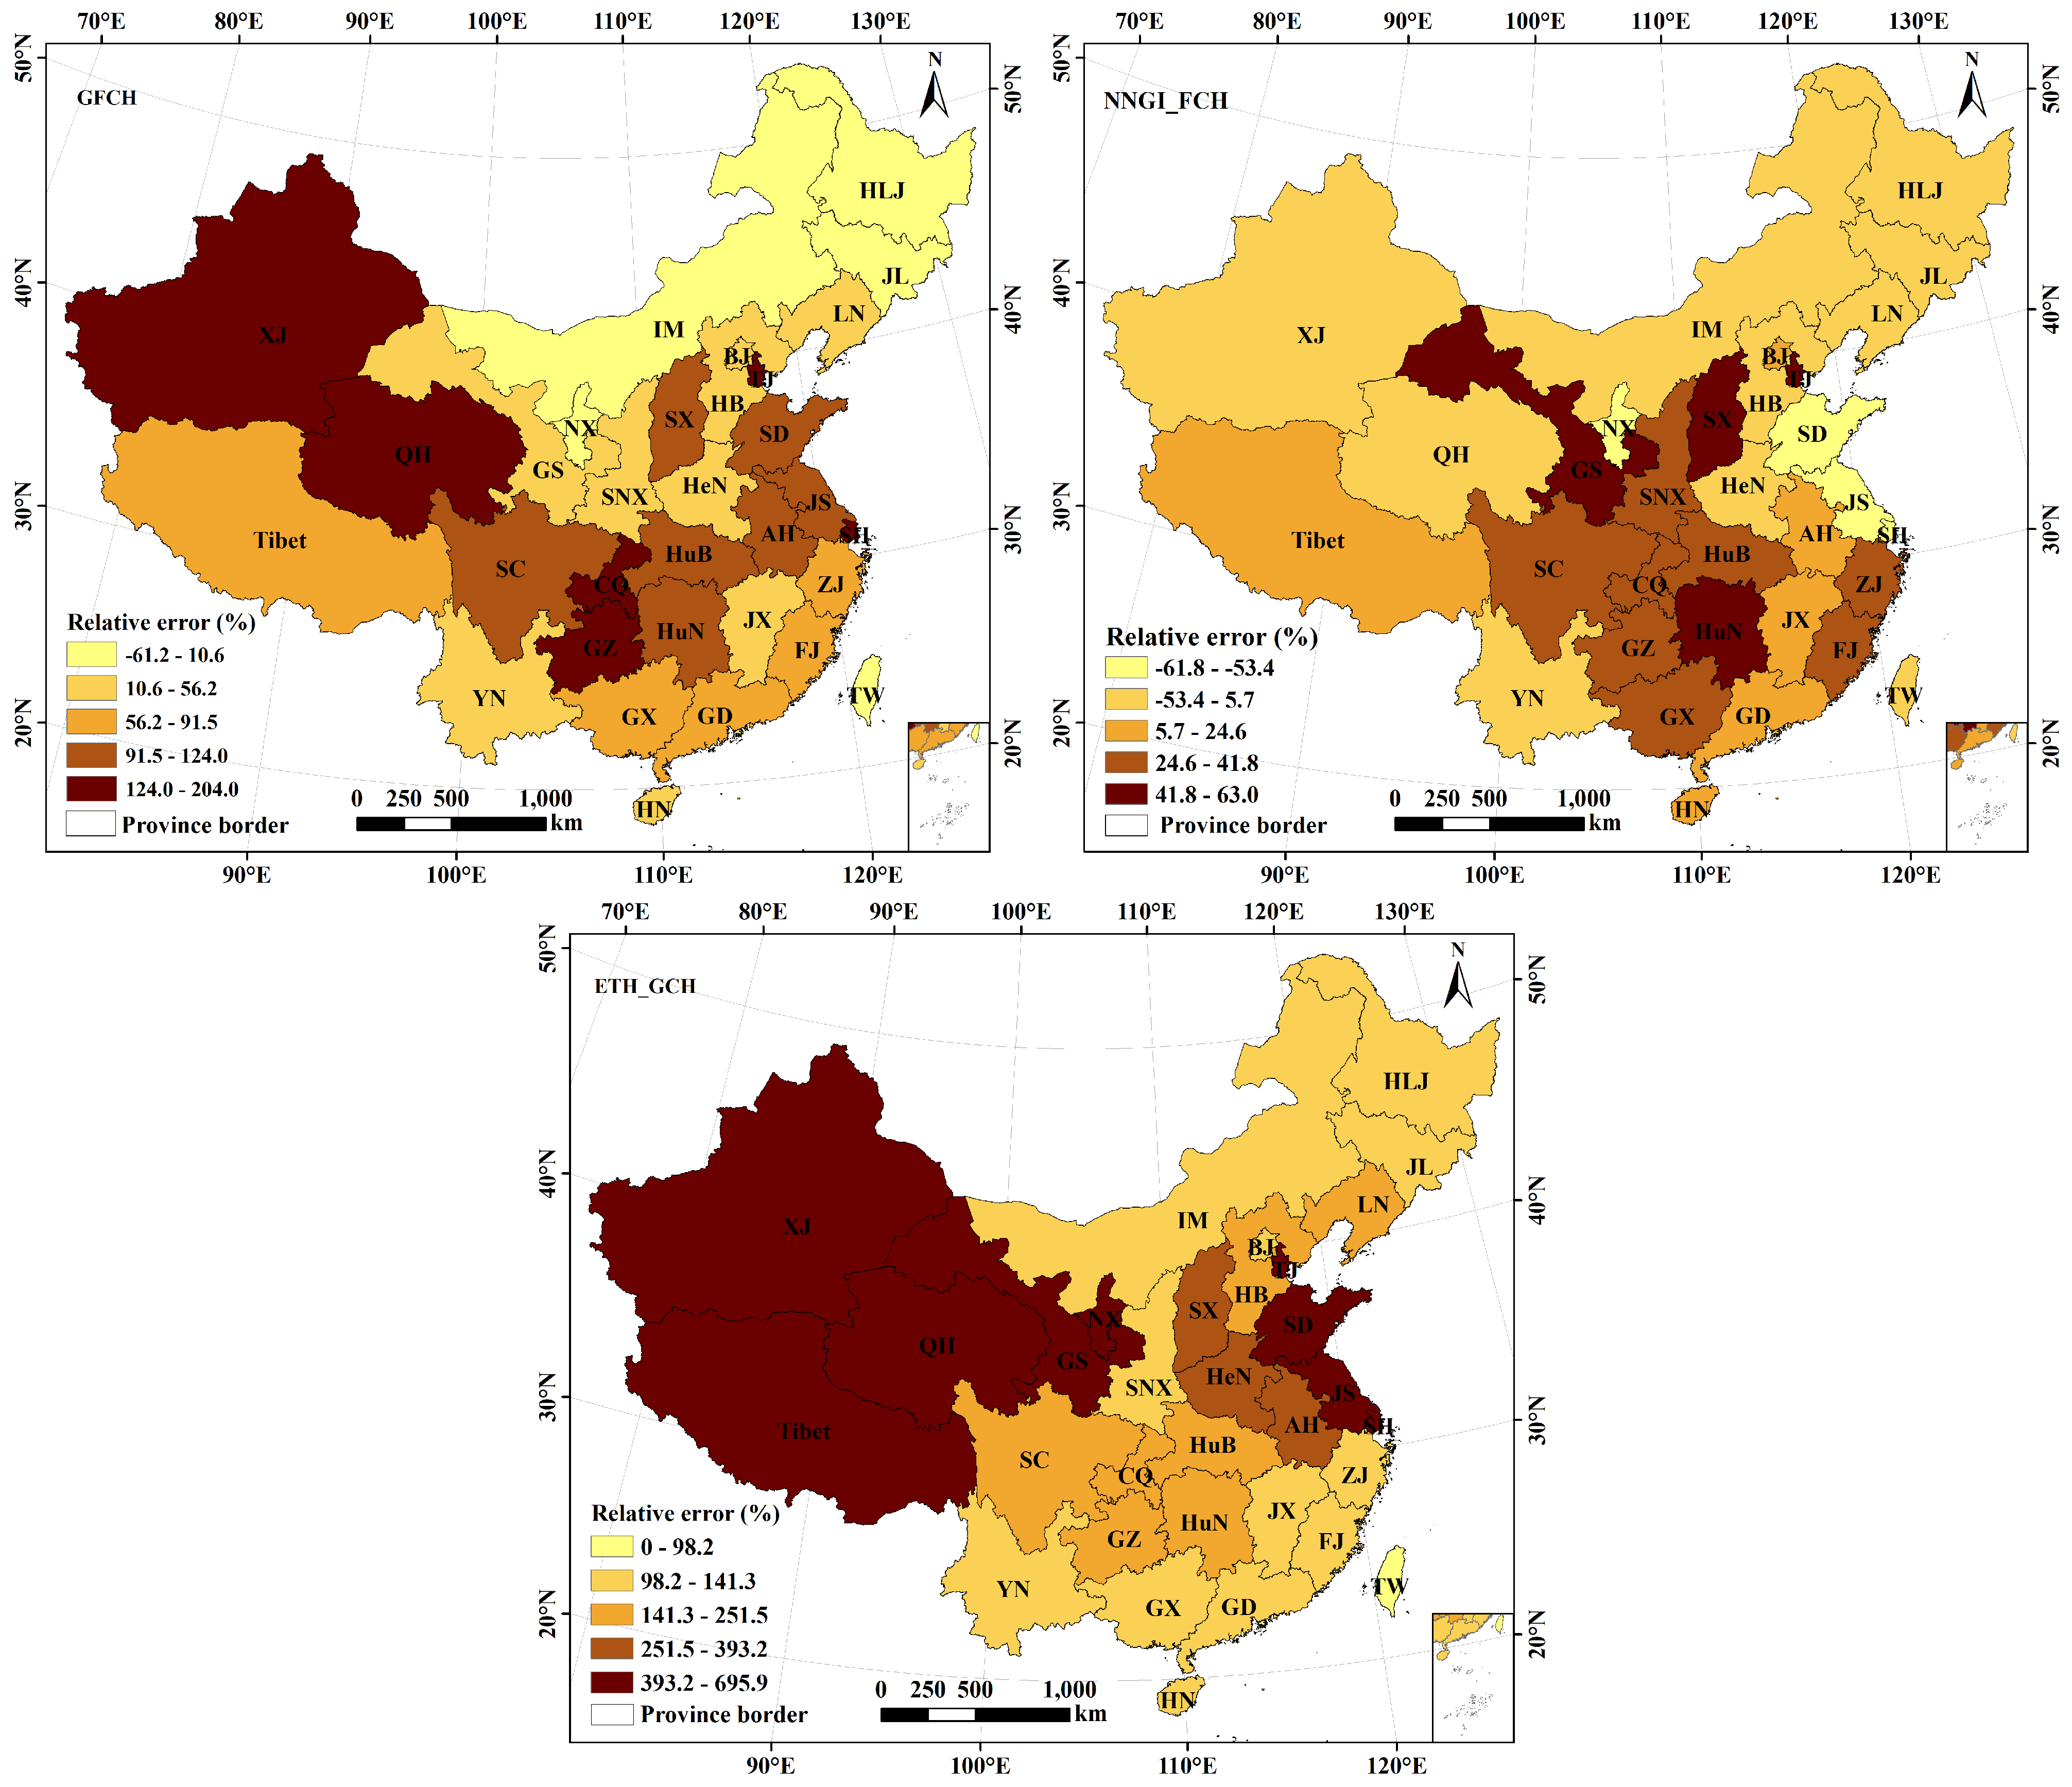
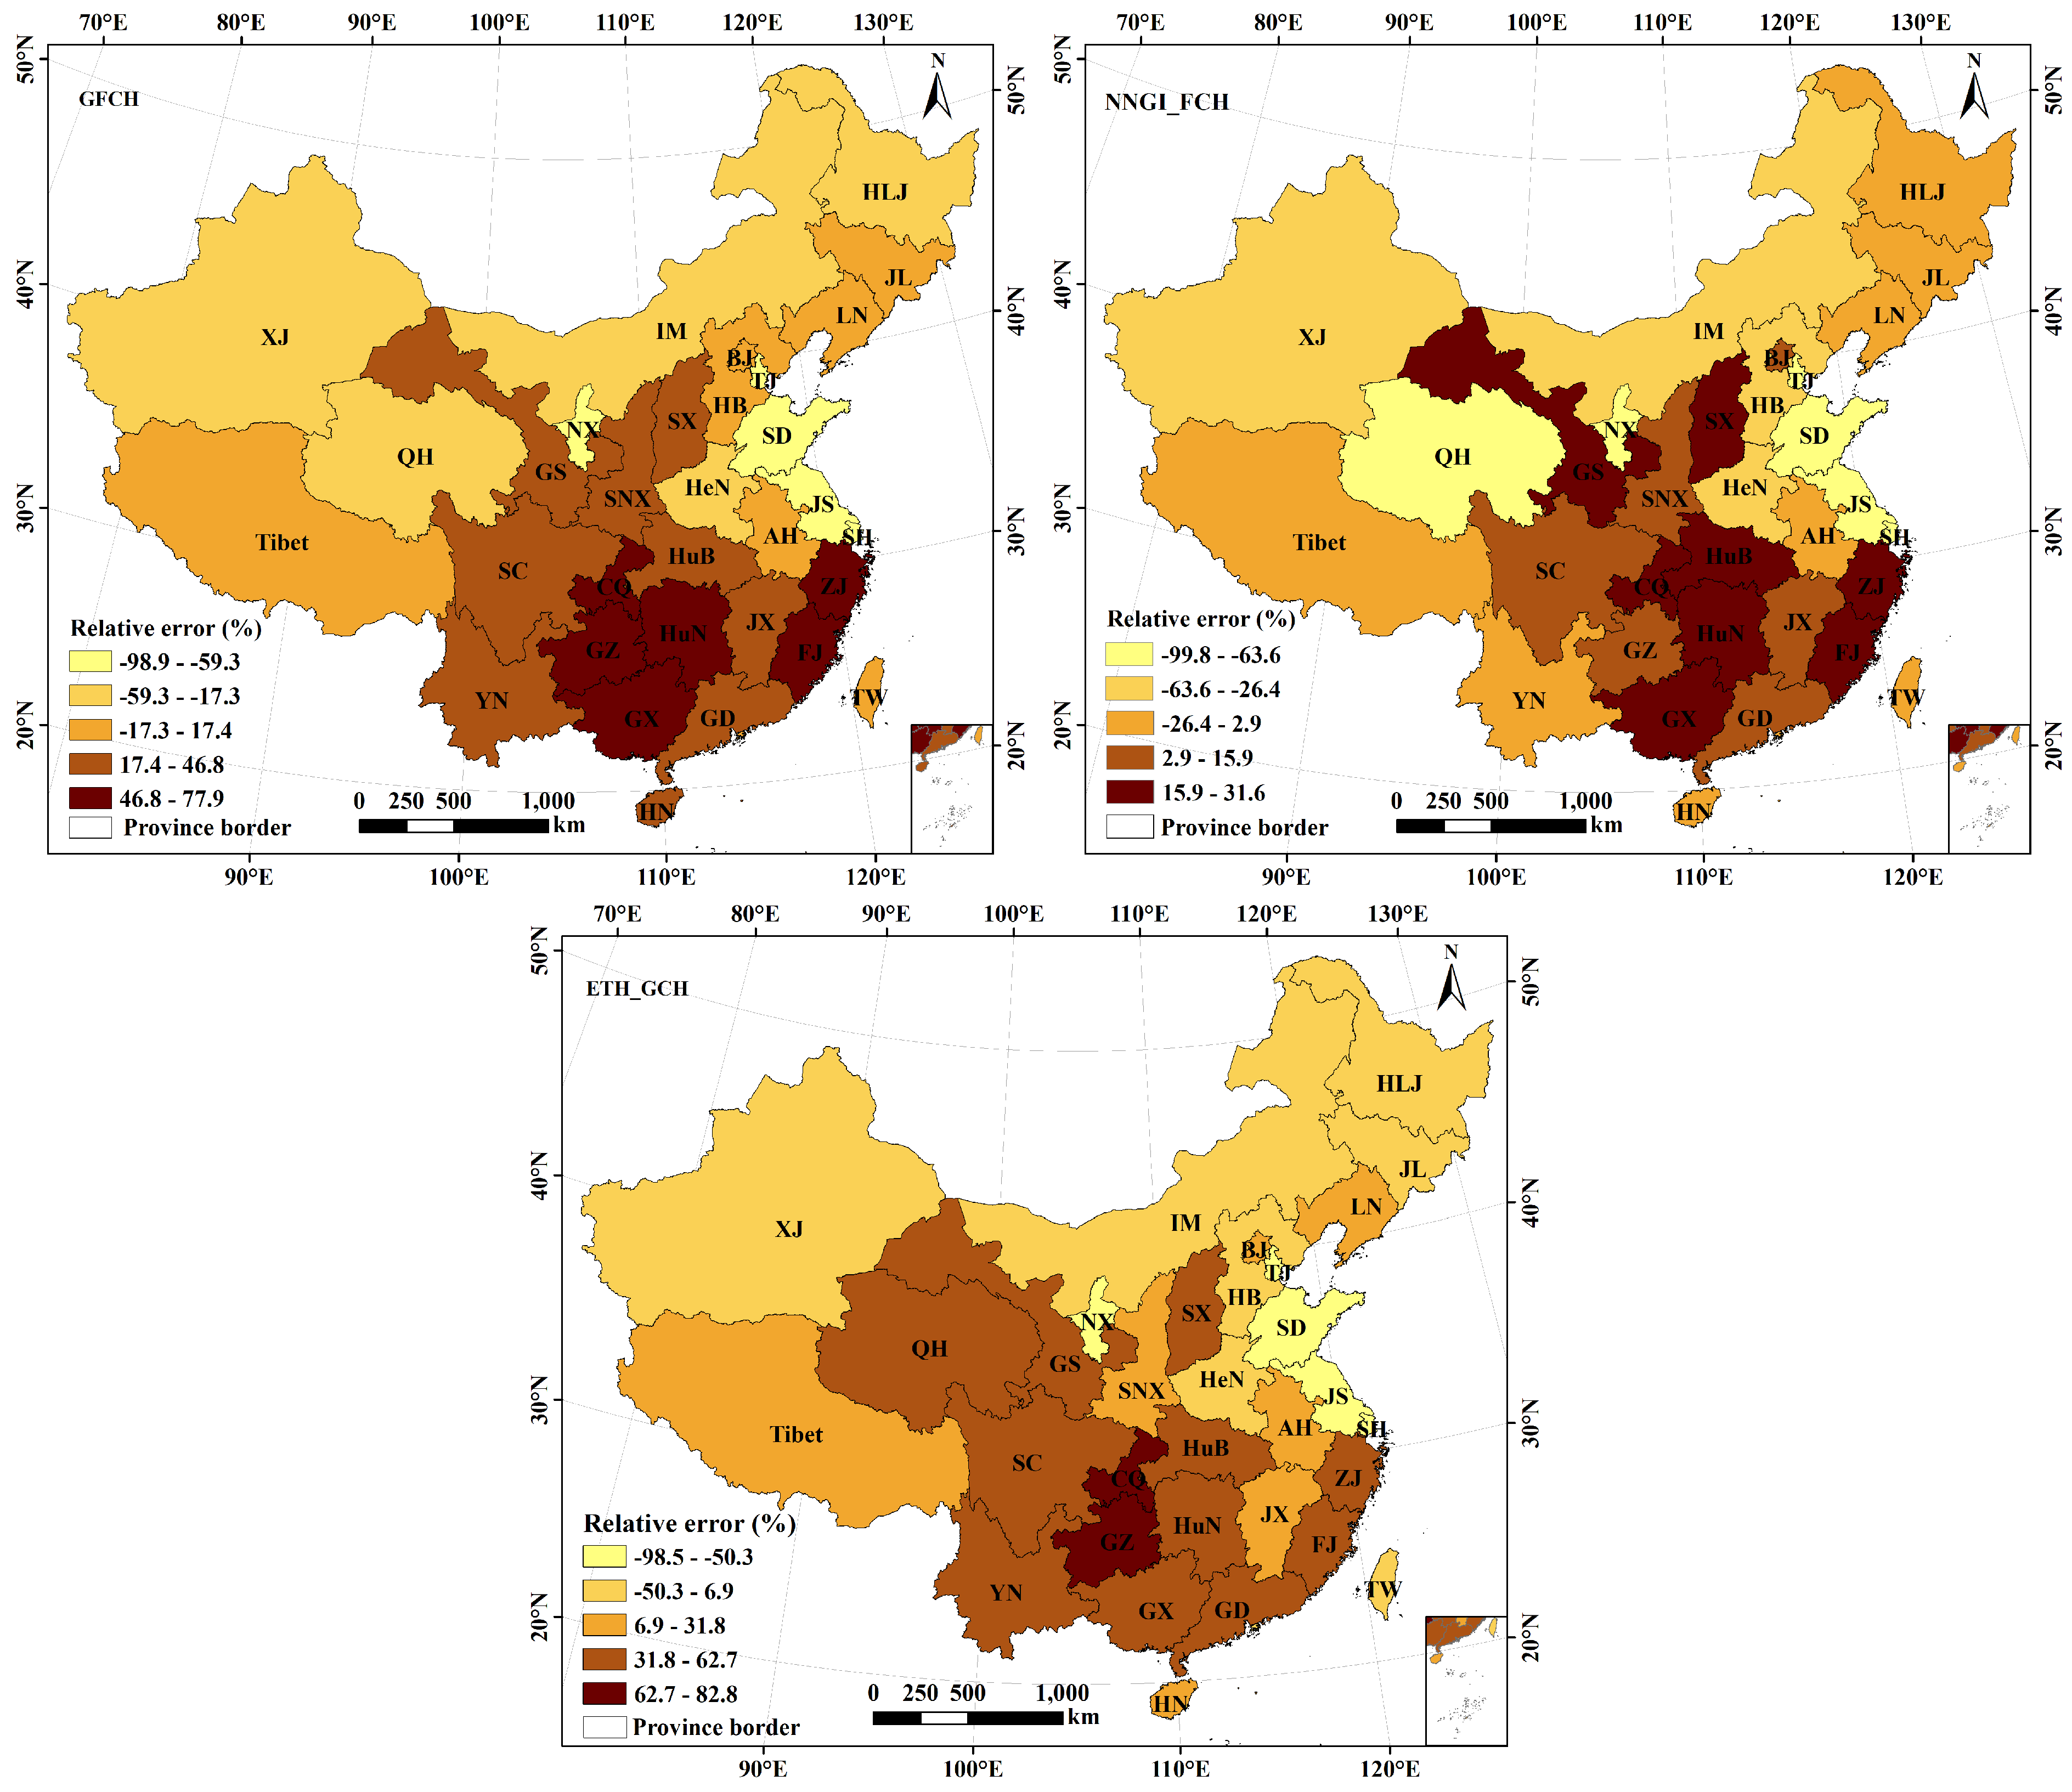
The relative errors of estimated forest area from GFCH, NNGI_FCH, and ETH_GCH products are further compared with the FID estimates at the provincial scale (Figure 3). The spatial distribution reveals substantial heterogeneity among the three products. The forest area estimated by GFCH is higher than the FID estimates in 28 provinces and municipalities, with particularly large relative errors in several provinces in eastern and southern China, where the values exceed 100%. Overestimation is also observed in coastal provinces, although the magnitude of the errors is relatively moderate. In contrast, several north provinces, including Heilongjiang, Inner Mongolia, and Ningxia, show negative deviations. The NNGI_FCH product demonstrates relatively high overall accuracy and low error dispersion, with relative errors within ±30% in 16 provinces and municipalities. Small errors are observed in provinces such as Yunnan, Jilin, and Liaoning, with particularly good agreement in Qinghai, where the relative error is close to 0. Nevertheless, moderate overestimations occur in parts of south and southwest region, while noticeable underestimations are found in several east provinces such as Shanghai and Shandong. In comparison, the ETH_GCH product exhibits substantial overestimation across most provinces, with relative errors exceeding 100% in the majority of regions. This bias may be attributed to the inclusion of non-forest vegetation with relatively high canopy heights in the ETH_GCH product.
To eliminate the influence of differences in forest definition, this study used CLCD data as a unified forest mask to calculate the relative error of forest area under this mask (Figure 4). At the national scale, the forest area estimates from NNGI_FCH, GFCH, and ETH_GCH showed significant improvement. Among them, NNGI_FCH performed the best, with the relative error reduced to 0.8%; GFCH also showed good performance, decreasing from 59.5% to 19.3%, while ETH_GCH exhibited the largest change in error, dropping from 188.6% to 28.7%. At the regional scale, in northeast and north region, ETH_GCH performed the best, with relative errors of 4.7% and 2.5%, respectively. GFCH and NNGI_FCH showed underestimation, particularly in the north region, where the relative errors of NNGI_FCH and GFCH were relatively large, at −21.1% and −14.0%, respectively. In the east, south, southwest and northwest regions, the relative errors of NNGI_FCH, GFCH, and ETH_GCH all decreased, with NNGI_FCH showing the closest agreement with FID. In the northwest region, the three products demonstrated notable improvement, with NNGI_FCH decreasing to 2.3%, followed by GFCH at 11.8%, while ETH_GCH estimates were relatively higher, at 26.0%. NNGI_FCH performed well in multiple provinces, with a more concentrated error distribution. The absolute relative errors in 22 provinces were within 30%, but underestimation worsened in provinces such as Shanghai, Tianjin, and Qinghai. The differences in GFCH across provinces and cities decreased, with 14 provinces showing relative errors within ±30%. Provinces such as Liaoning, Hebei and Jilin performed relatively well. The relative error of ETH_GCH improved significantly, dropping to within 100% in all cases, with excellent performance in provinces such as Heilongjiang, Jilin, and Hebei.

3.2. Spatial Consistency of FCH for Different Products

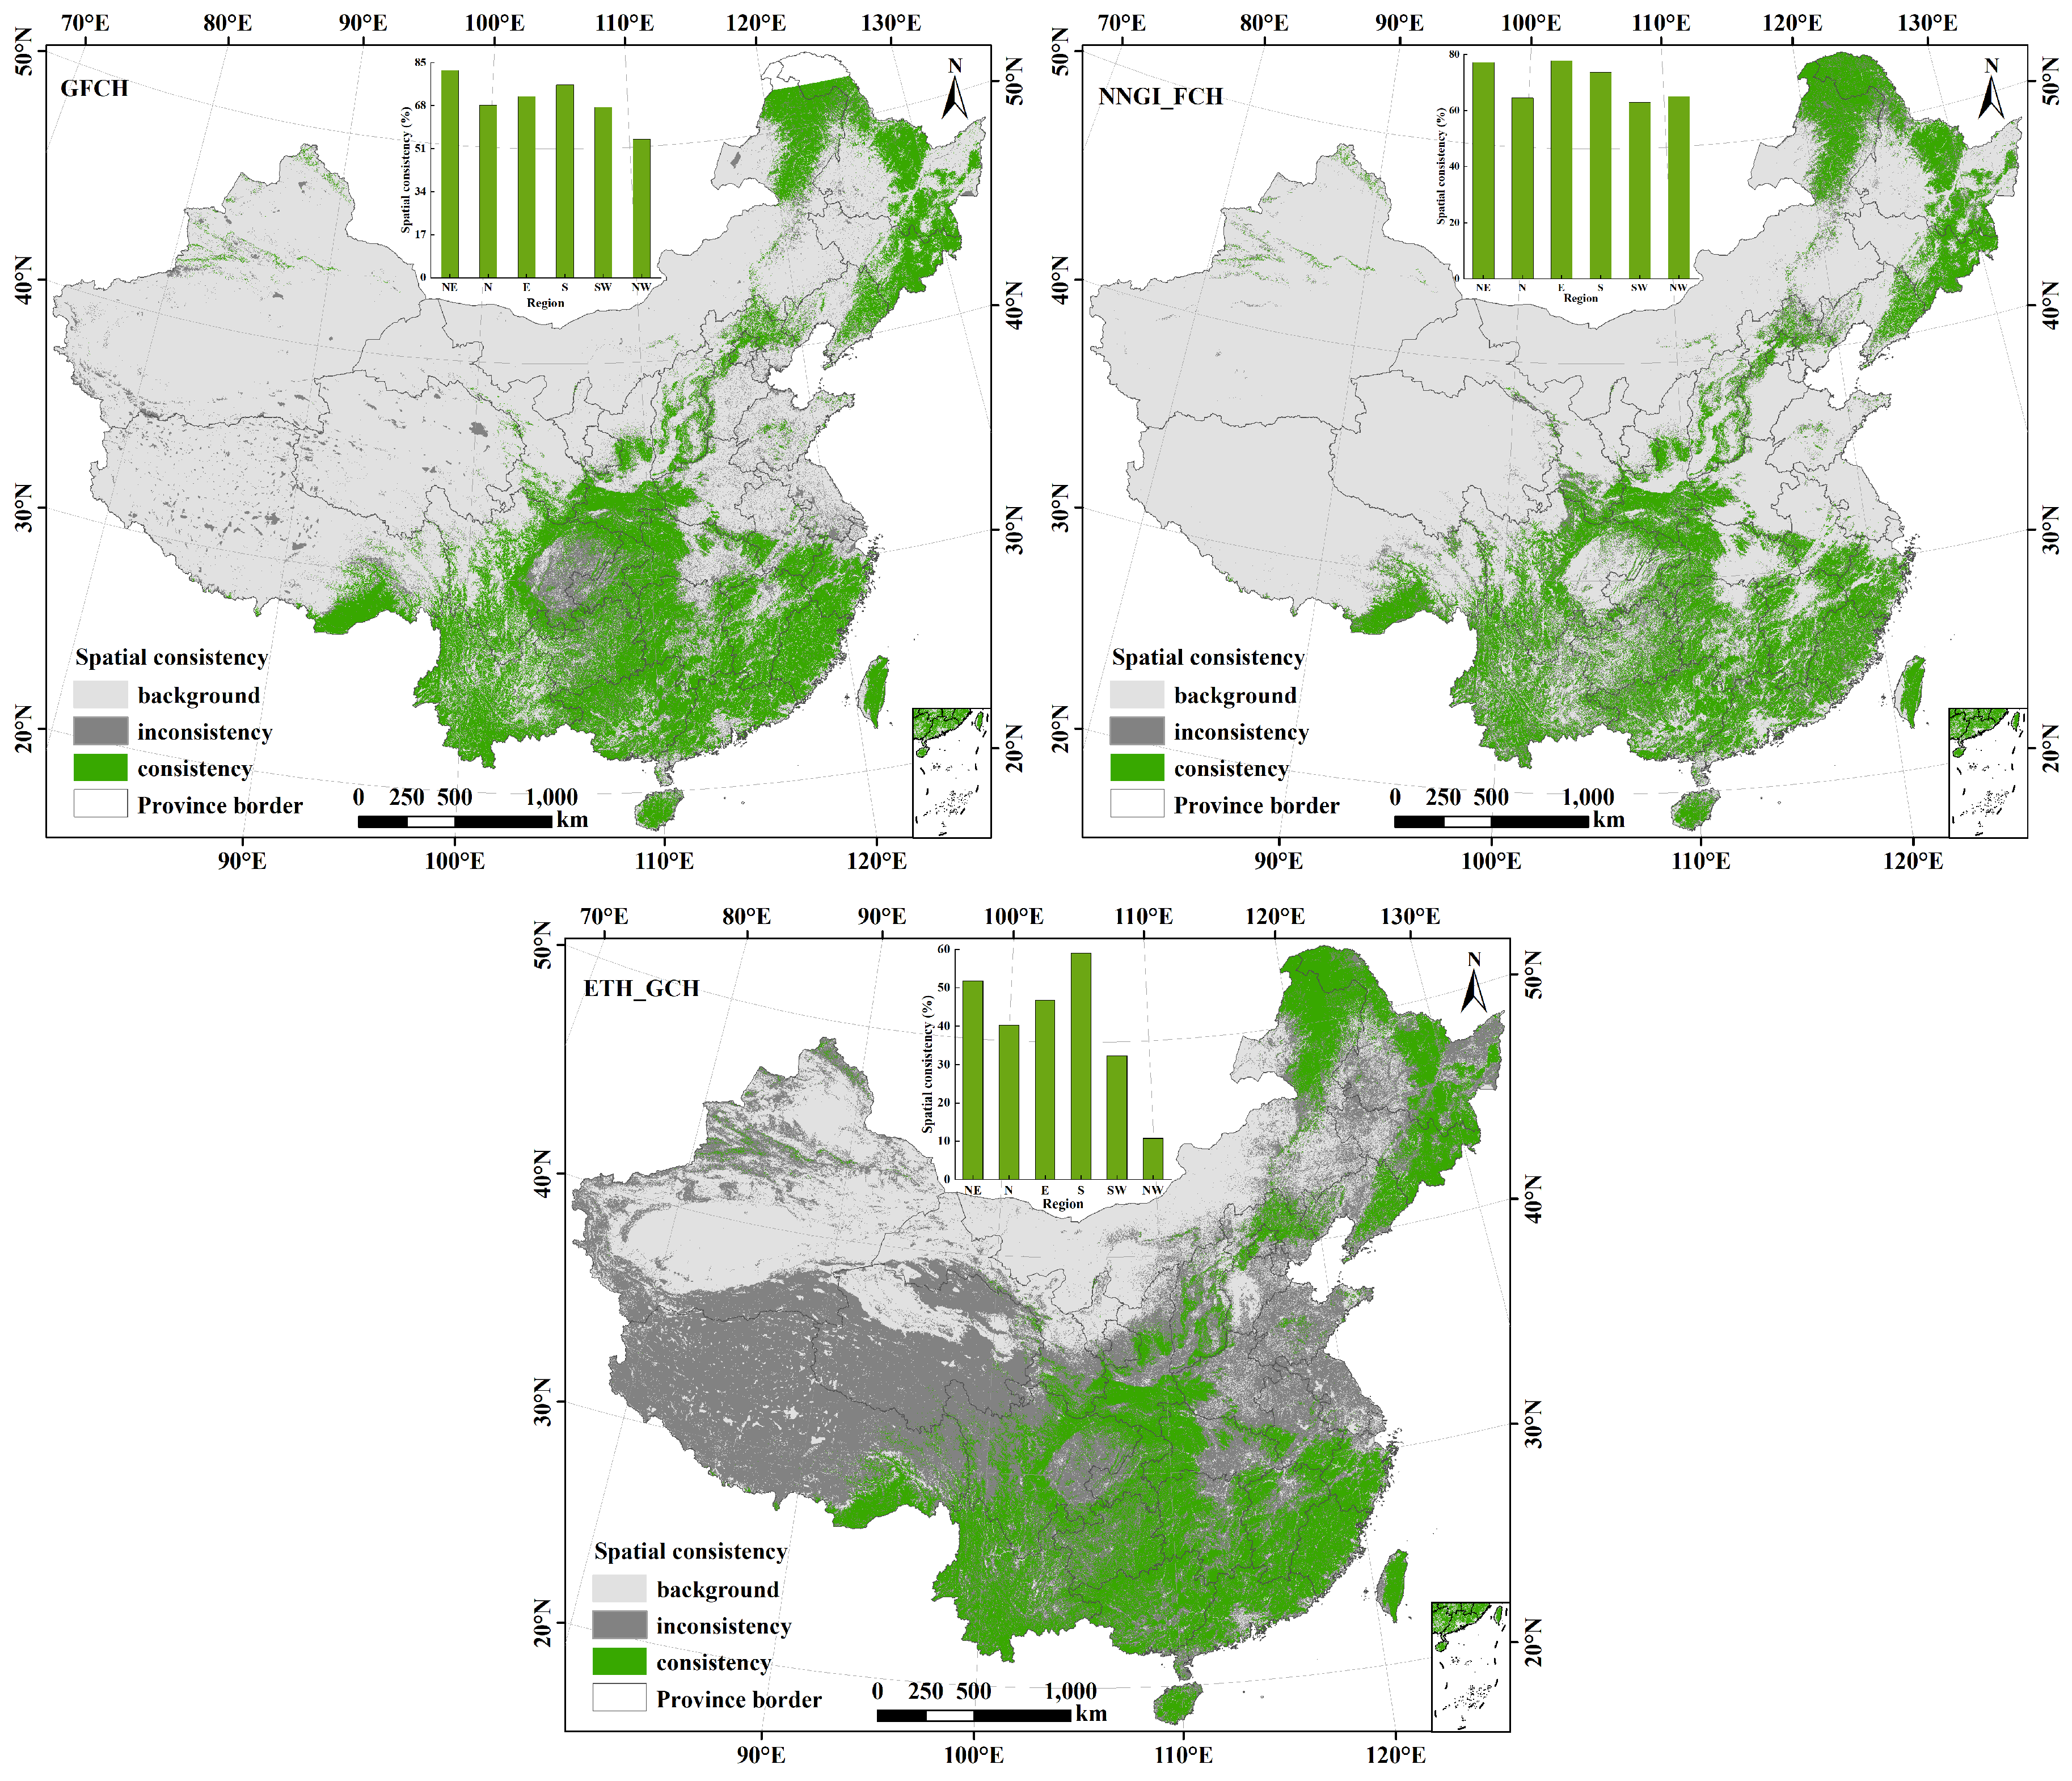
The spatial consistency distribution of GFCH, NNGI_FCH and ETH_GCH products by comparison with CLCD shows high spatial heterogeneity in China (Figure 5). At the national scale, the GFCH product exhibits the highest spatial consistency, reaching 70.8%, followed by NNGI_FCH with a comparable value of 69.7%. Both datasets demonstrate strong applicability for FCH analysis across China. ETH_GCH has slightly poor consistency at a value of 35.6%, primarily due to its broader definition of canopy height, which incorporates non-forest vegetation types. This inclusion increases spatial variability and reduces overall consistency. In the northeast region, NNGI_FCH presents a consistency of 77.2%, which is slightly lower than GFCH (82.0%). However, the consistency of ETH_GCH is low, with a value of 51.8%. In the north region, where forest cover is relatively sparse and discontinuously distributed, with concentrations mainly in mountainous areas such as the Taihang Mountains and limited presence in plains, GFCH and NNGI_FCH show respective consistencies of 68.2% and 64.5%. These two FCH products effectively capture the spatial distribution of forests. In contrast, ETH_GCH exhibits a much lower consistency of 40.2%. In the east region, NNGI_FCH attains the largest consistency of 77.7%, followed by GFCH (71.7%) and ETH_GCH (46.8%). All three FCH products perform well compared with CLCD in this region. In the south region, characterized by abundant forest resources and complex terrain, GFCH, NNGI_FCH, and ETH_GCH exhibit relatively high consistencies of 76.3%, 73.6%, and 59.0%, respectively, indicating strong adaptability of these products in areas with diverse forest types. The southwest region is dominated by extensive mountainous and hilly areas, where some non-forest vegetation types have canopy heights similar to those of forests. GFCH achieves a consistency of 67.4%, surpassing NNGI_FCH (62.9%), while ETH_GCH records a low value of 32.4%. This difference may be related to both the regression tree algorithm used in GFCH and differences in the input datasets and preprocessing strategies among the three products. All datasets demonstrate low spatial consistency in the northwest region, with values falling to 10.8%, 54.8%, and 65.0% for ETH_GCH, GFCH, and NNGI_FCH, respectively.
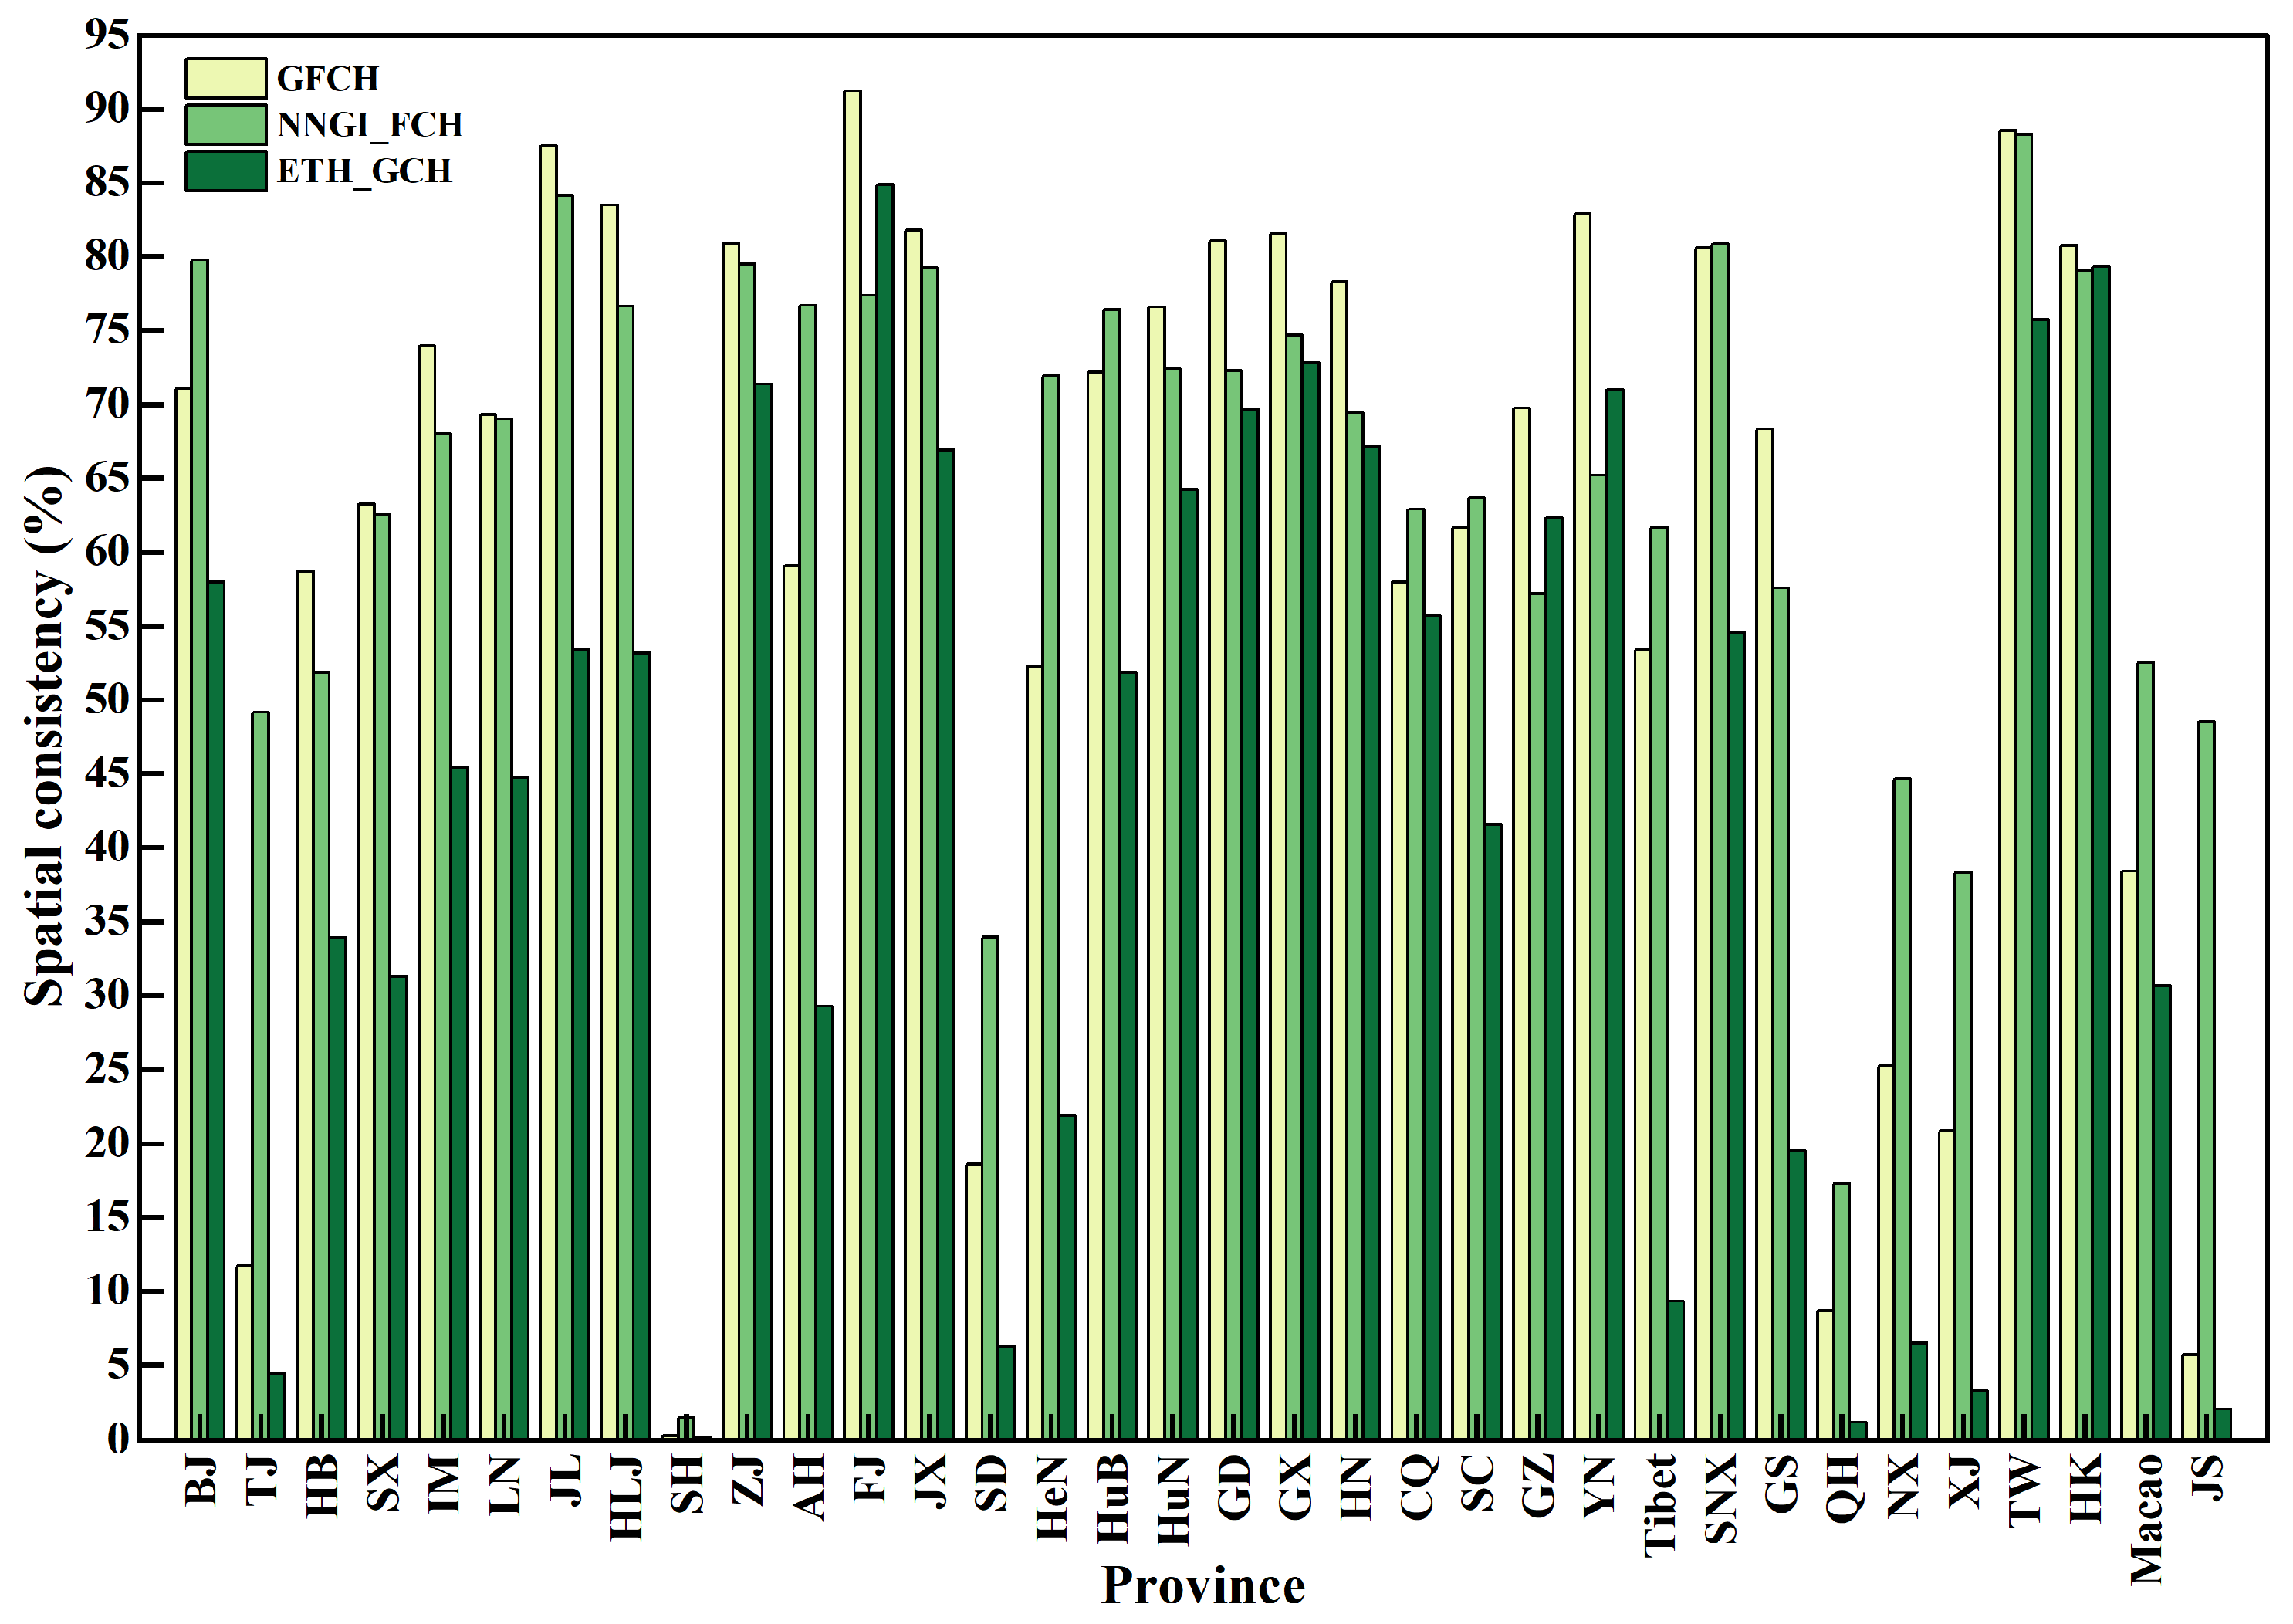
The spatial consistency of GFCH, NNGI_FCH and ETH_GCH products illustrates substantial variations in different provinces of China by comparison with CLCD (Figure 6). GFCH presents high spatial consistency in provinces with dense forest coverage, including Jilin (87.5%), Taiwan (88.5%) and Fujian (91.2%). However, its performance is notably low in urbanized regions, including Shanghai (0.3%), Jiangsu (5.7%), and Tianjin (11.7%), as well as in arid and semi-arid areas such as Qinghai (8.7%) and Xinjiang (20.9%). ETH_GCH shows relatively good spatial consistency in some southeastern provinces, such as Zhejiang (71.3%), Taiwan (75.7%), and Fujian (84.8%). Nevertheless, its consistency declines dramatically in arid regions such as Qinghai (1.2%) and Ningxia (6.5%). NNGI_FCH demonstrates stronger and more stable spatial consistency across provinces, with 27 provinces showing values above 50%. There is generally high spatial consistency in the provinces with abundant forest resources, such as Shaanxi (80.8%), Jilin (84.0%), and Taiwan (88.3%). It also shows good adaptability in some northern provinces, as indicated in Hebei (51.8%), Shanxi (62.5%), and Inner Mongolia (68.0%). Shanghai has the lowest spatial consistency at a value of 1.50%, followed by Qinghai (17.3%). Despite these low values, NNGI_FCH still shows the largest spatial consistency among the three products in both provinces. Compared with GFCH and ETH_GCH, NNGI_FCH exhibits superior spatial consistency in highly urbanized areas such as Tianjin, Shandong, and Jiangsu. Its consistency exceeds 10% in all provinces but Shanghai, demonstrating more balanced regional variation and greater overall reliability.
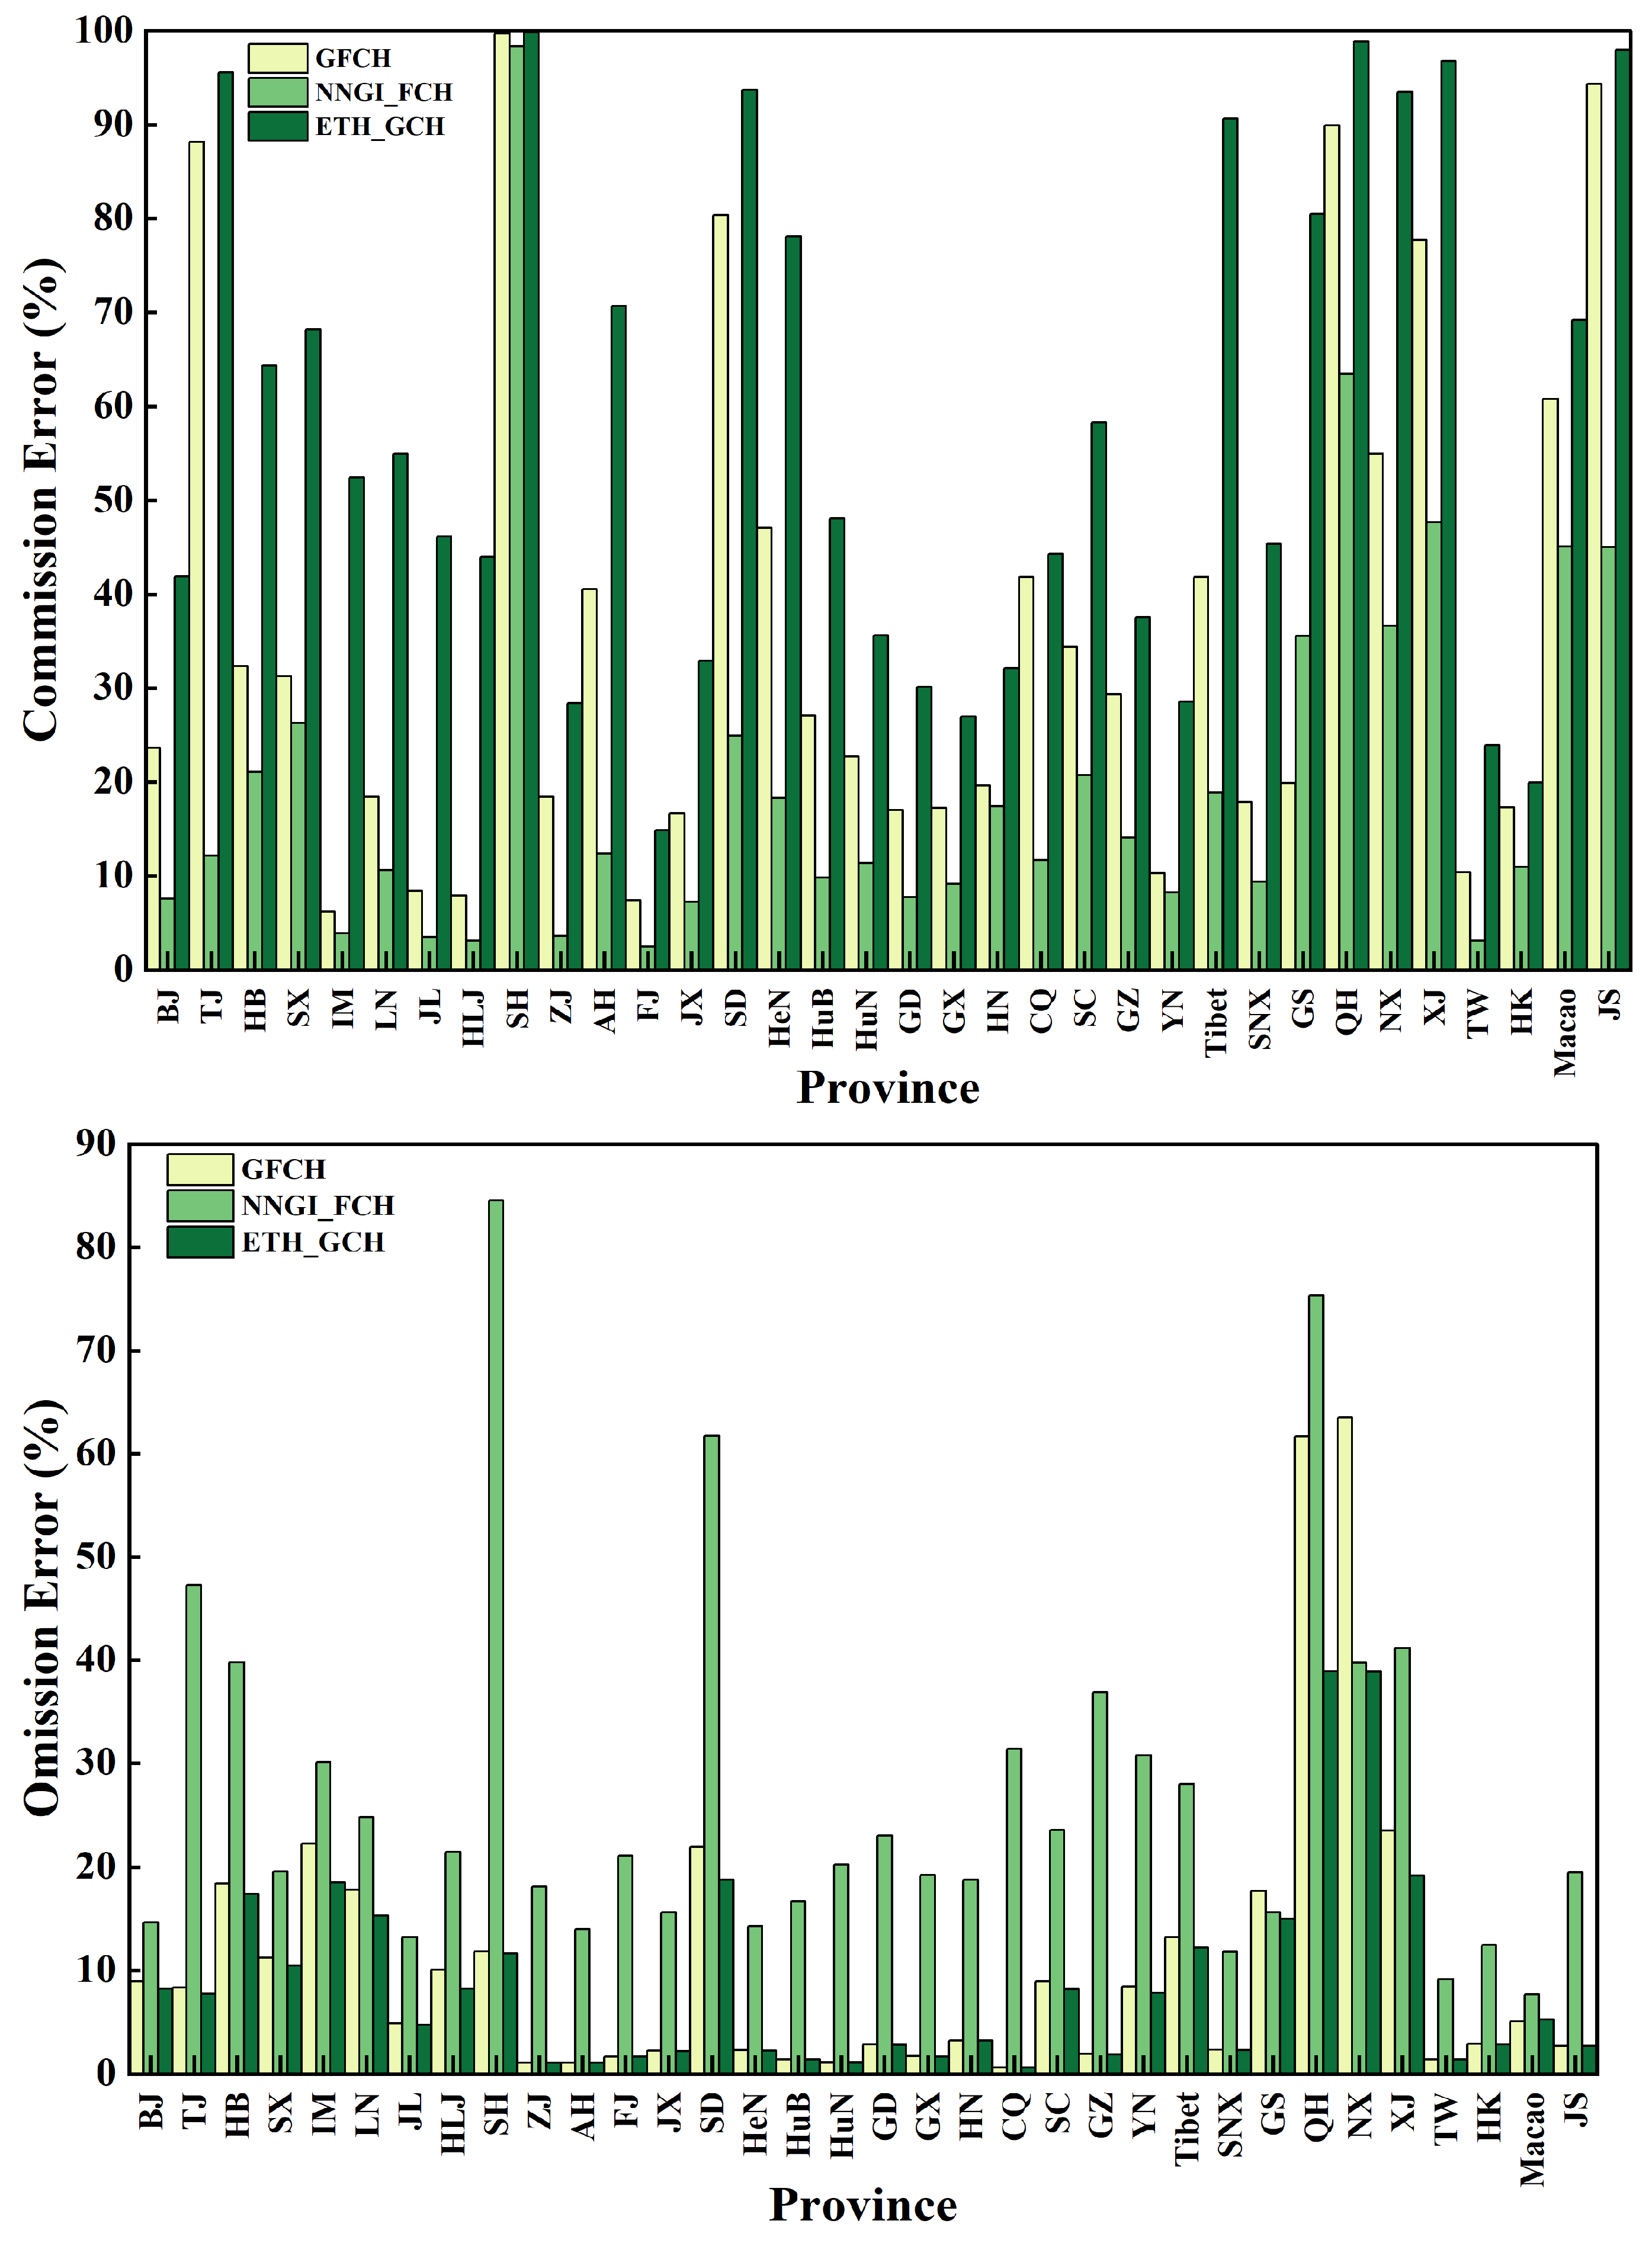
We evaluated the performance of three FCH products for forest/non-forest classification by calculating omission and commission errors for each region based on CLCD (Figure 7). At the national scale, GFCH shows the lowest omission error at 7.4% and a commission error of 25.0%. NNGI_FCH has the highest omission error at 23.5%, but the lowest commission error is 11.3%. ETH_GCH exhibits a relatively low omission error of 6.9%, but a commission error is substantially higher, reaching 64.1%. These results suggest clear differences in forest classification behavior among three FCH products. NNGI_FCH and GFCH apply relatively conservative criteria for forest identification, whereas ETH_GCH tends to misclassify substantial areas of non-forest land as forest. Marked spatial heterogeneity is also observed across regions. NNGI_FCH is characterized by low commission errors and high omission errors, with commission errors below 15% in all regions, but omission errors in the southwest, south, and east region are notably higher than in other regions, at 18.1%, 19.6%, and 29.4%, respectively. GFCH performs relatively consistently across regions, with omission errors below 20% in all regions and commission errors within 30% except in the northwest region (41.2%). ETH_GCH exhibits high commission errors and low omission errors across all regions, with the highest commission error of 67.5% in the southwest region. The commission errors of NNGI_FCH are predominantly concentrated between 2% and 20%, with excellent performance in provinces such as Heilongjiang, Inner Mongolia and Jilin. However, the omission errors of this product are generally high, with substantial amounts of actual forest undetected in provinces such as Ningxia, Shandong, Qinghai, and Shanghai. For GFCH, omission errors in 23 provinces are below 10%, but are higher in provinces such as Qinghai and Ningxia. Its commission errors are mainly distributed between 10% and 30%, with high values in provinces such as Tianjin, Jiangsu and Shanghai. For ETH_GCH, commission errors exceed 40% in most provinces, approaching 100% in locations such as Xinjiang, Jiangsu, Qinghai and Shanghai, indicating that a large amount of non-forest vegetation is misclassified as forest in this study. Its omission errors are low, below 10% in most provinces, but are relatively high in provinces such as Qinghai and Ningxia.

3.3. Overall Accuracy of Canopy Height Estimates for Different Products

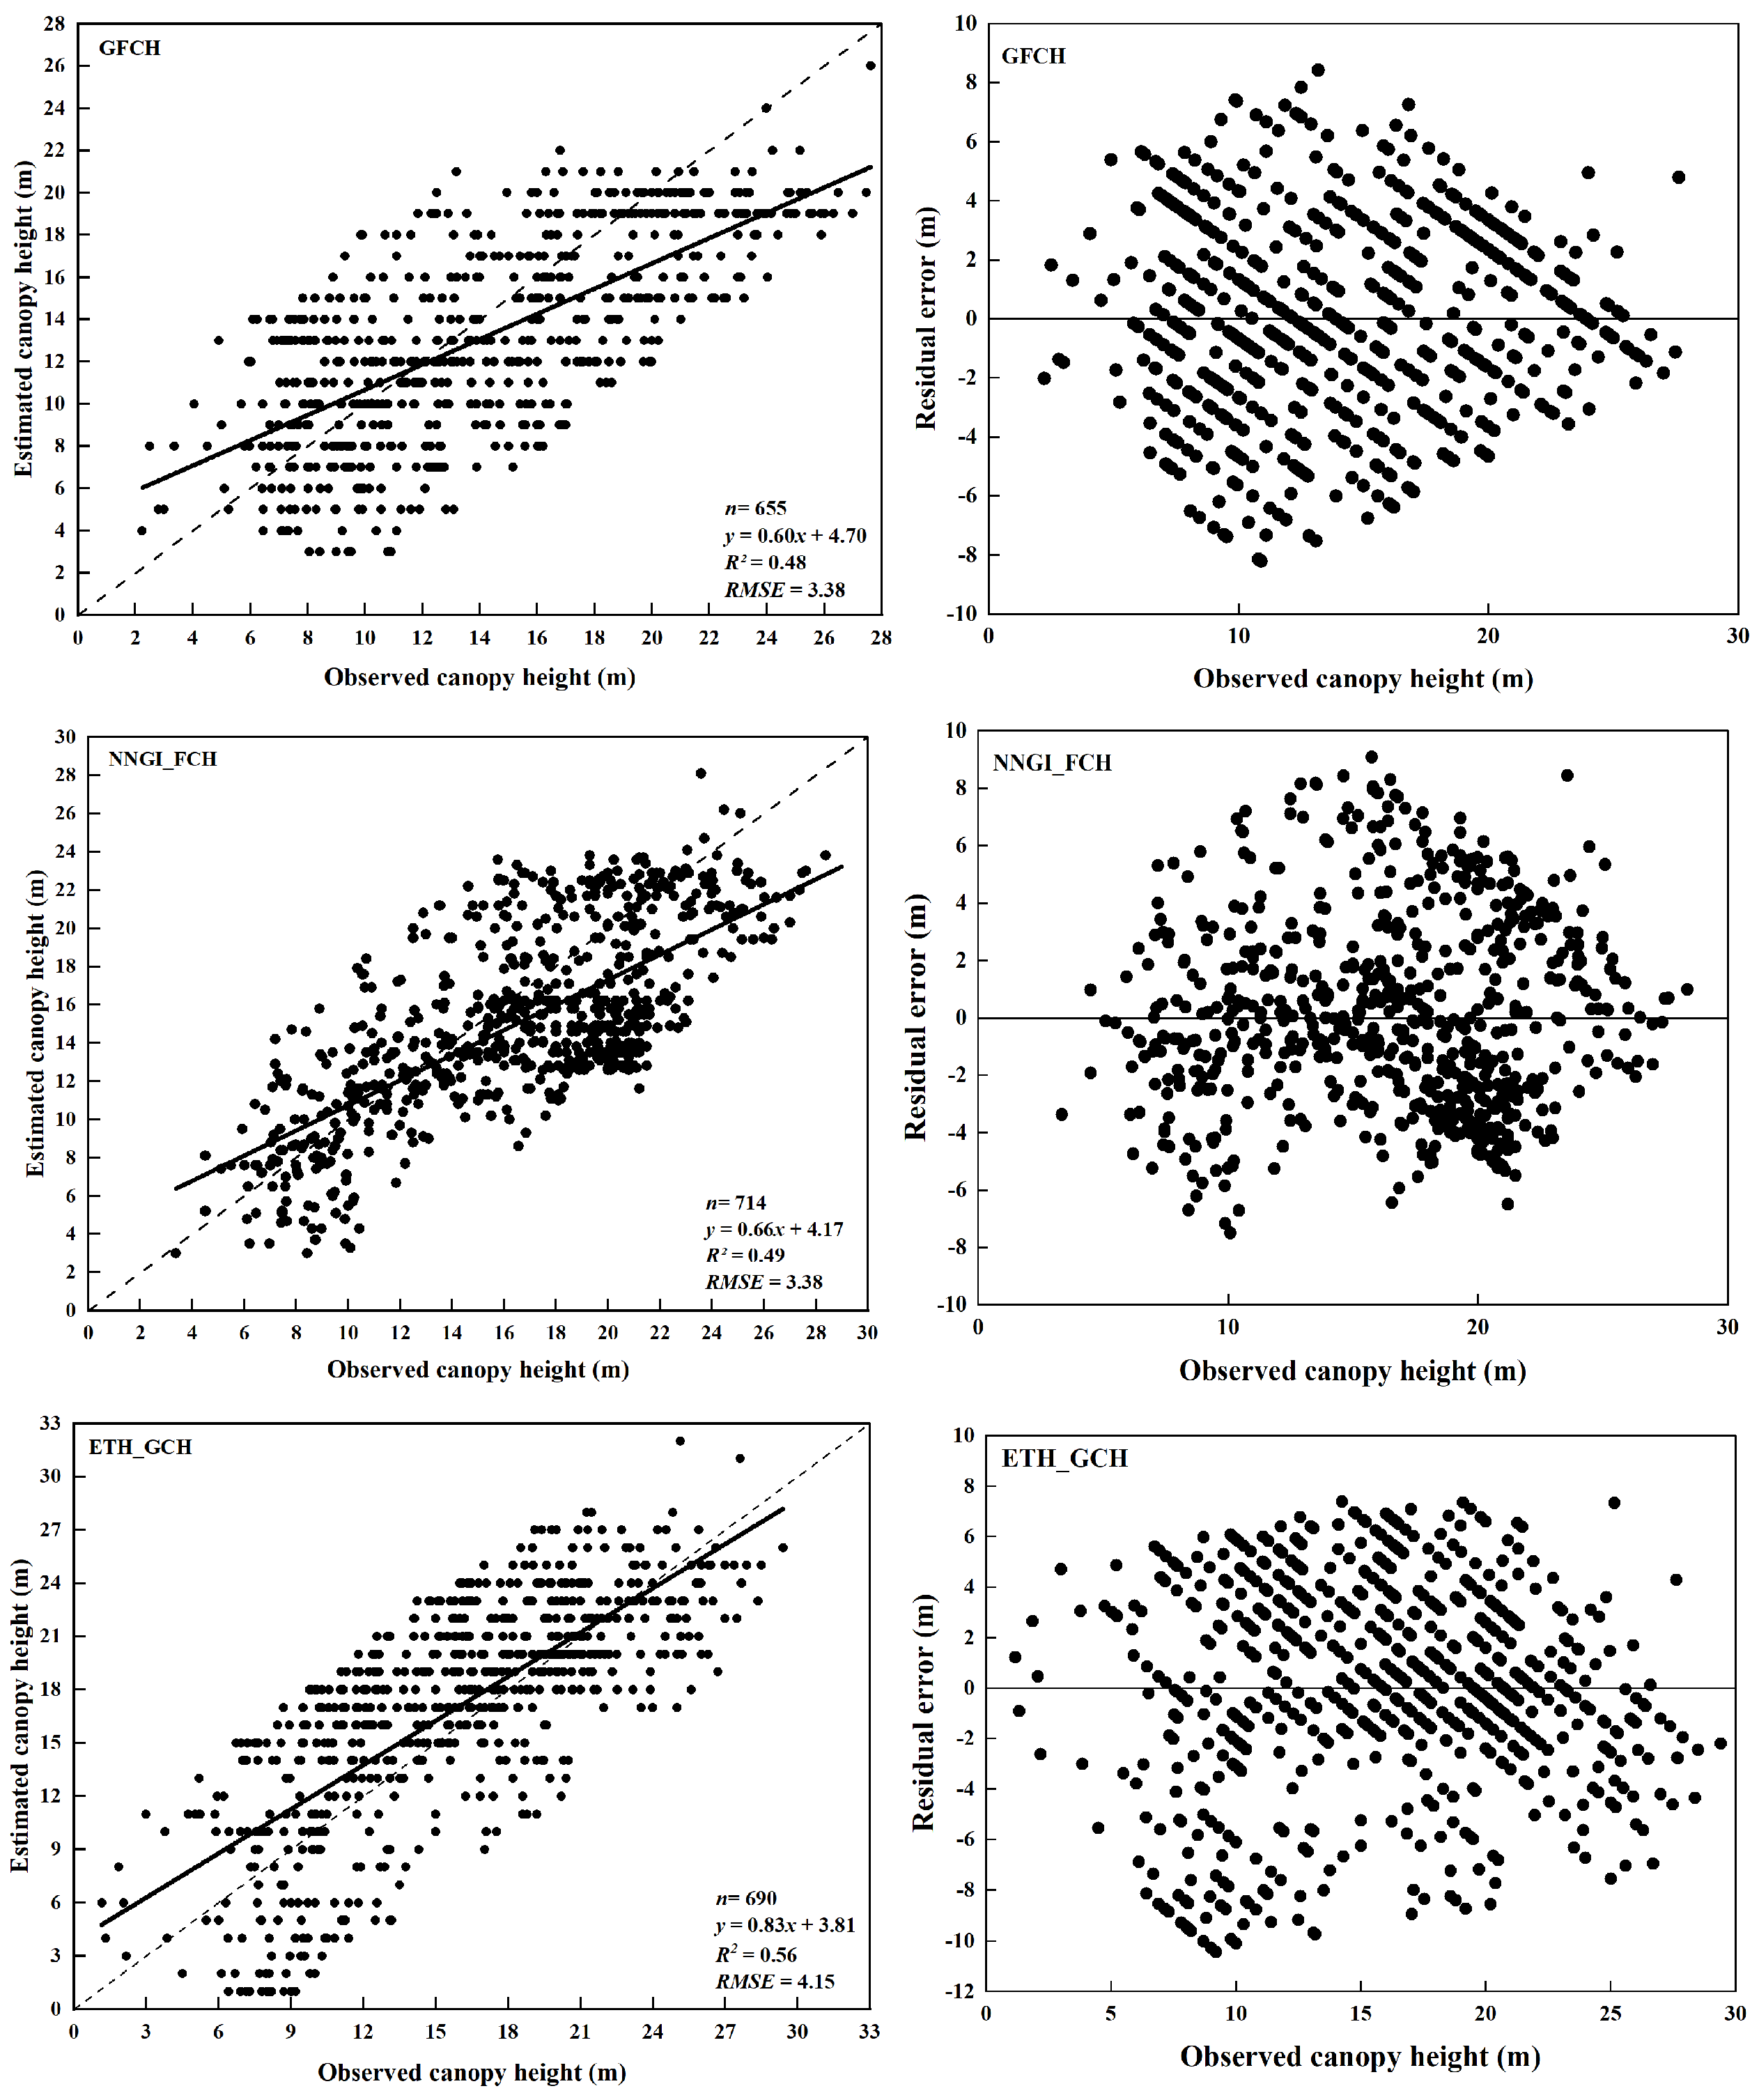
Figure 8 presents the comparisons of estimated FCH from GFCH, NNGI_FCH and ETH_GCH products with ground observations from the released datasets for China. The residuals of the three products are generally distributed around the zero line. Although slight asymmetry is observed in the residual distributions, no obvious systematic bias is evident. The agreement is statistically significant, and estimated FCH values are linearly correlated with observations, with a slight overestimate for short canopies and an underestimate for tall canopies. The correlations are almost equally high, with an R2 and RMSE of 0.48 and 3.38 m for GFCH, and 0.49 and 3.38 m for NNGI_FCH, respectively. The slope of NNGI_FCH is slightly greater than that of GFCH. The critical points for overestimation and underestimation of the FCH are 12.26 m and 11.75 m, respectively. This suggests that when canopy height exceeds these thresholds, GFCH and NNGI_FCH may exhibit an earlier-than-expected onset of the saturation effect. ETH_GCH shows the highest correlation with the observations, with an R2 of 0.56, but its RMSE value is a bit higher than that of GFCH and NNGI_FCH. In addition, the slope of ETH_GCH is relatively close to the 1:1 line, indicating relatively better agreement with the observed canopy heights among the three FCH products. On the other hand, the method adopted by mapping ETH_GCH exhibits obvious advantages of spatial continuity and adaptability across diverse environmental and geographical conditions on a large scale.
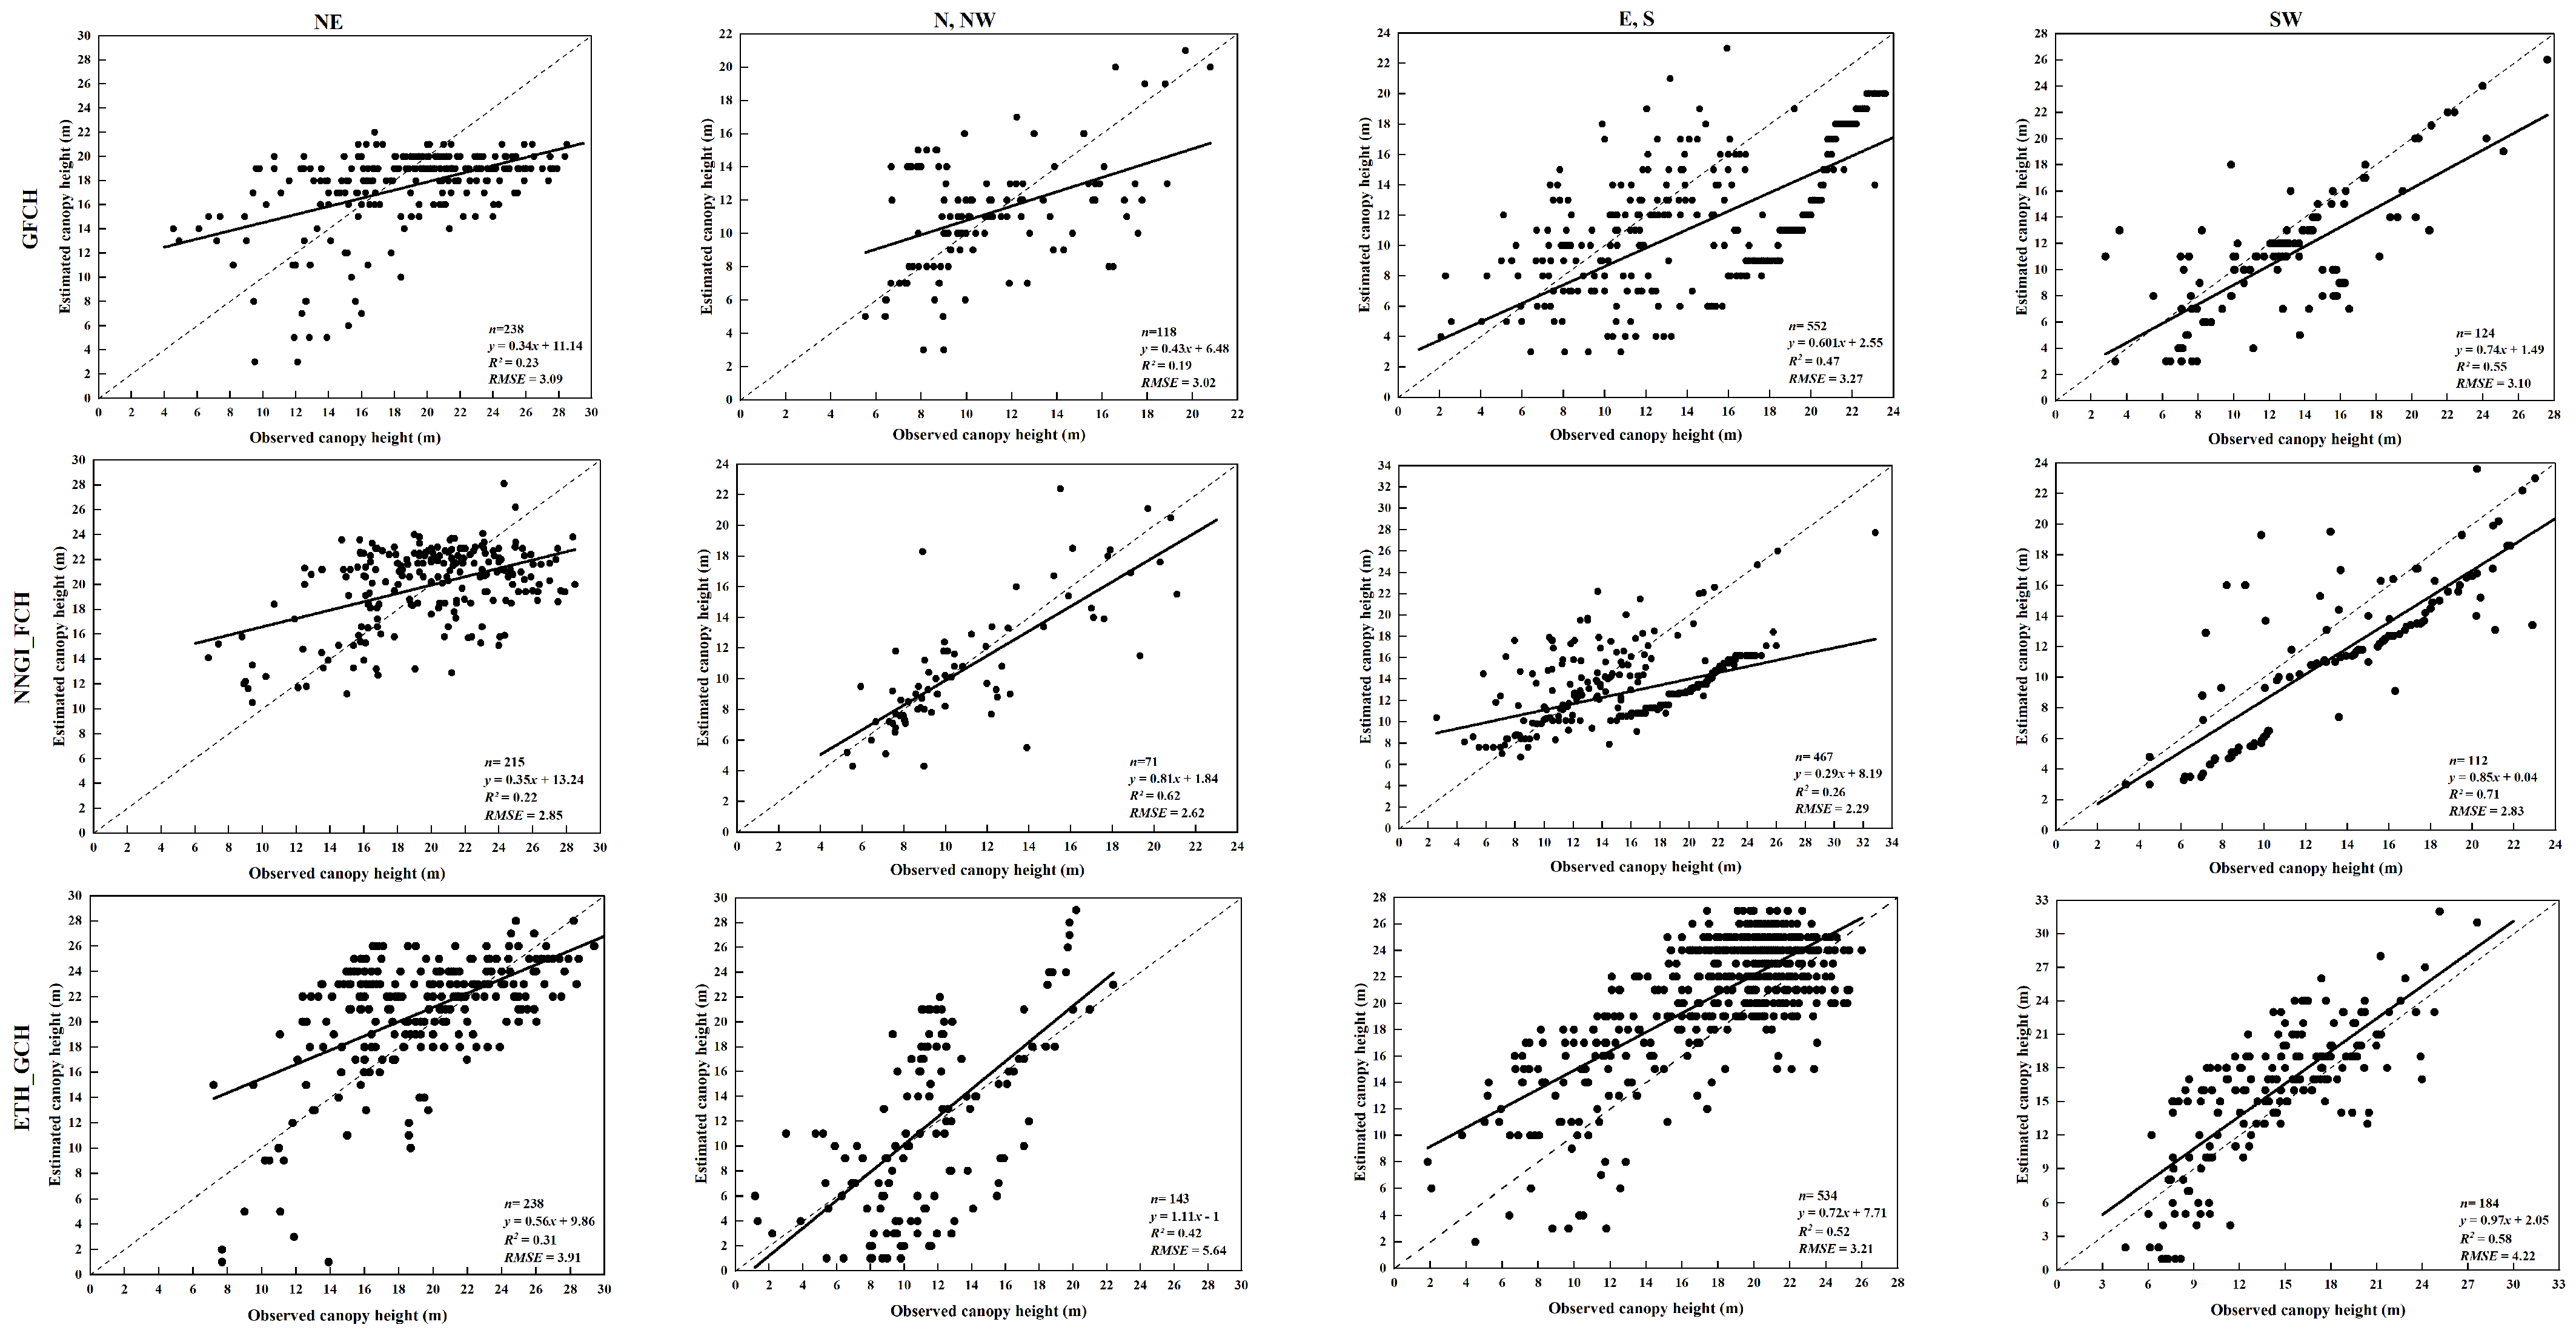
In general, the FCH estimates are in good agreement with the observed values at the regional scale (Figure 9). NNGI_FCH and GFCH demonstrate poor accuracy in the northeast region, with an R2 of 0.22 and 0.23, and RMSE of 2.85 m and 3.09 m, respectively. ETH_GCH shows relatively better performance (R2 = 0.31, RMSE = 3.91 m), although the improvement remains limited. In the north and northwest regions, NNGI_FCH outperforms ETH_GCH and GFCH in estimating FCH, with an R2 and RMSE of 0.62 and 2.62 m. The environmental conditions in these regions have minimal influence on the NNGI model, which effectively captures spatial variations in forest canopy height. ETH_GCH exhibits slightly lower performance (R2 = 0.42, RMSE = 5.64 m), primarily due to the prevalence of short canopy vegetation and the model’s positive bias. GFCH shows the lowest correlation with the observations, with an R2 and RMSE of 0.19 and 3.02 m. In the east and south regions, NNGI_FCH shows relatively low correlation with the observations, although the estimation error remains relatively small (R2 = 0.26, RMSE = 2.29 m). Comparatively, both GFCH and ETH_GCH present superior performance, with R2 values of 0.47 and 0.52, respectively. ETH_GCH particularly stands out with an RMSE of 3.21 m, indicating that its deep learning model successfully adapts to complex topography and heterogeneous forest structures, providing more reliable FCH estimates. In the southwest region, NNGI_FCH has the best agreement with the observed values, with an R2 and RMSE of 0.71 and 2.83 m, followed by ETH_GCH (R2 = 0.58, RMSE = 3.92 m). Although the fitting results of GFCH are slightly inferior, it maintains acceptable accuracy levels (R2 = 0.56, RMSE = 3.10 m) in this region.

4. Discussion

4.1. Assessment Methodology for FCH Products

To evaluate the accuracy of FCH products, forest area serves as a crucial metric due to its advantages. Variations in forest cover assessments across different satellite-based products, coupled with the influence of forest cover on canopy height inversion accuracy, underscore the importance of this metric. Forest area captures the spatial distribution of forest across landscapes [28,29]. Therefore, accurate estimation of this variable can function as an indirect metric for assessing the regional performance of FCH products. However, there are differences in spatial resolution and classification accuracy among the GFCH, NNGI_FCH and ETH_GCH products, which introduce variations in the estimated forest area within the same region. To address this, spatial analysis is conducted to quantify forest area for each product and compare it with the national FID. This comparison provides a unified spatial scale for evaluating the performance of various remote sensing datasets and modeling methods.
Beyond forest area estimation, the spatial distribution of forest is further analyzed to assess the delineation accuracy of each FCH product. Spatial consistency, which reflects both the differences and overlaps in spatial patterns between datasets [30], enables large-scale assessments of product performance and improves the precision of accuracy evaluations. This approach has proven effective for handling spatial data on a large scale. Spatial consistency and area consistency serve as complementary metrics, jointly improving the validation framework for remote sensing products [31,32,33]. The accuracy of canopy height retrieval is also strongly dependent on land cover type [34], and discrepancies in forest definitions across FCH products further complicate intercomparison. Accurate identification of forest and non-forest areas is a prerequisite for canopy height retrieval. In this study, CLCD data and FCH products are binarized to calculate spatial consistency, allowing for an intuitive and quantitative assessment of each product’s ability to detect forest cover. However, the spatial consistency metric alone cannot directly reflect the retrieval accuracy of FCH products. Therefore, this study combines spatial consistency with the statistical metrics R2 and RMSE to provide a more comprehensive evaluation of FCH product performance.
Observed field data remain essential for validating remote sensing outputs. A common validation approach involves fitting linear regression models between observed and estimated values to evaluate inversion accuracy. In this study, field measurements collected across provinces from 2016 to 2023 are used to maximize geographic coverage and reduce errors associated with sparse sampling. Previous studies have assessed the reliability of global FCH products in China [35] and temperate regions [21], focusing on either technical validation and error characterization or ecological modeling and applications. In contrast, this study integrates area estimation, spatial consistency, and overall accuracy to provide a more comprehensive and systematic assessment of three FCH products for the whole country in China. This multi-dimensional approach reduces the limitations inherent in single-method evaluation and enhances the robustness of product validation.

4.2. Potential Reasons for Inconsistencies in FCH Products

FCH is defined as the vertical distance from the top of the tree canopy to the ground [36]. Due to diverse research objectives, forest definitions vary across studies. The GFCH product defines tree height using the 90th percentile height of ALS data, which approximates the dominant tree height commonly used in ecology and effectively captures vertical forest structure. This study adopts GEDI RH95 as the target variable after observing its highest correlation with ALS-derived 90th-percentile heights. However, GEDI RH95 cannot inherently distinguish trees from artificial structures and requires ancillary land cover data for correction. In GFCH, forests are defined using the Global Forest Change product as areas with woody vegetation taller than 3 m [37]. This definition aligns more closely with forest distribution in northern China, where natural and planted forests are abundant. The GFCH model, based on a regression tree algorithm, performs well in forests with relatively homogeneous canopy structures, such as broadleaved and coniferous types. However, GEDI’s limited latitudinal coverage (below 51.6°N) restricts evaluation in northern regions, influencing spatial consistency and final assessments (Figure 5).
ETH_GCH uses GEDI RH98 as the canopy height reference and trains a deep convolutional neural network using Sentinel-2 data. Lang et al. [6] adopted the Nature Conservancy’s terrestrial ecosystem classification and ESA’s 10 m WorldCover product to exclude urban and cropland areas. The forest definition of ETH_GCH is threshold-dependent, which can lead to inconsistencies in forest classification. In this study, no forest threshold is imposed, and all vegetation is retained, resulting in looser forest delineation. Consequently, areas such as tall shrubs may be misclassified as forests, leading to a relatively high commission error (64.1%), which results in an overestimation of forest area (Table 2) and low spatial consistency (Figure 4). However, the product’s omission error is low (6.9%), indicating that its identification of actual forests is relatively accurate. After applying a unified forest mask, the relative error in forest area estimates decreased substantially, indicating that the high commission error is likely a major contributor to the overestimation of forest area. Despite this, ETH_GCH performs well nationwide, with high R2 and low RMSE values, effectively capturing canopy height variation (Figure 8). Although it exhibits localized systematic errors, ETH_GCH generally outperforms GFCH, leveraging high-resolution imagery and a robust deep learning framework for improved stability. This is consistent with the findings from Chen et al. [35].
Both GFCH and ETH_GCH are globally trained and validated models lacking region-specific optimization for China’s diverse forest types. In contrast, NNGI_FCH integrates waveform data from GEDI and ICESat-2, selecting RH100 and RH98, respectively, as inversion indices based on comparison with UAV LiDAR data. These metrics represent the maximum canopy height detected in each system. Combined with environmental variables, this approach yields height estimates that closely match ground observations. Liu et al. [5] adopted the GlobalLand30 standard, which defines forest as areas with >30% canopy closure and sparse forests as 10–30% closure [38]. NNGI_FCH utilizes extensive UAV LiDAR and field measurements in China, enhancing the model’s representativeness and adaptability. The use of RH98, which approximates the canopy top height, and forest definitions aligned with national inventory standards contributes to its strong performance across scales. Leveraging spaceborne LiDAR from GEDI and ICESat-2 [39,40], NNGI_FCH captures forest structure over large areas and employs neural network-guided interpolation to mitigate canopy height saturation commonly observed in regression and optical methods. This fusion approach reduces the striping effect and enhances sensitivity to structural heterogeneity [5]. At the national level, NNGI_FCH achieves spatial consistency exceeding 60% (Figure 5). However, its omission error is relatively high, at 23.5%. This issue is particularly pronounced in southwestern China, where the omission error reaches 29.4%. This indicates that the forest definition used in this product tends to omit actual forests. After applying a unified forest mask, the relative error in NNGI_FCH’s area estimates decreased from 13.4% to 0.8%. This suggests that the original area estimates of NNGI_FCH are less affected by forest definition inconsistency than those of the other products, whereas omission errors mainly influence the spatial delineation of forest distribution. Overall, NNGI_FCH shows relatively balanced performance in both area estimation and canopy height retrieval. In regions such as the southwest, north, and northwest, R2 values surpass those of GFCH and ETH_GCH (Figure 9). Strong correlations are observed between satellite-derived and in situ canopy heights, though deviations persist in areas with steep topography and dense forest cover [41,42,43]. To further assess the influence of forest definition differences, forest areas were recalculated using the CLCD dataset as a unified forest mask (Figure 4). The results show that the relative errors among the products were substantially reduced, indicating that some of the discrepancies observed in Figure 3 can be attributed to inconsistencies in forest definition. However, under the unified forest mask, NNGI_FCH still shows the closest agreement with the FID estimates. This suggests that the differences among the products are not solely caused by inconsistent forest definitions but may also be associated with differences in retrieval algorithms and training datasets. The results show that the three products exhibit different strengths under different evaluation metrics. NNGI_FCH shows relatively low commission error in forest classification and demonstrates comparatively balanced performance across the evaluated indicators.

4.3. Uncertainty and Major Error Sources of Quality Assessment

FCH data serve as fundamental input for a wide range of forest-related studies, including biomass estimation and ecosystem monitoring. However, generating high-precision FCH maps remains a major challenge. The three canopy height products evaluated in this study represent current leading datasets that capture vertical forest structure across multiple spatial scales. Variability among products stems from differences in algorithm design and the complexity of forest structure and terrain, underscoring the necessity of validation against ground observations. Due to the unavailability of national FID from 2019 to 2023 in this study, forest area estimates for 2020 were based on the findings of Fu et al. [24]. This extrapolation method may introduce uncertainty. During forest management processes, the rate of forest expansion and the proportion of plantation forests in different regions may vary due to local policies, ecological restoration programs, and natural disturbances. In this study, the assumption that the proportion of forest structure remained unchanged from 2015 to 2020 may lead to certain deviations, which could affect the comparison of forest area among different products. Such uncertainty may partly contribute to the discrepancies between actual forest area and product-derived estimates, which may further complicate inter-product comparisons. Larger estimation errors were observed in several northwestern provinces, such as Qinghai, Xinjiang, and Tibet (Figure 3). This is mainly attributed to the scarcity and fragmented distribution of forest resources in these regions, together with pronounced topographic variation and the widespread presence of mountains and plateaus, which increase the uncertainty of forest distribution statistics and canopy height estimation. Different products handle terrain effects in different ways, which may further influence the results. For example, the GFCH product filters samples from high-elevation and steep-slope areas during model training to reduce slope-related bias. The ETH_GCH product, in contrast, mitigates the influence of terrain on model training by correcting noise in the reference data caused by slope and footprint geolocation errors. The NNGI_FCH product mainly relies on GEDI and ICESat-2 waveform-based height metrics, but the performance of different waveform-processing algorithms may vary under complex terrain conditions. Overall, these three products do not adopt a consistent terrain normalization strategy, which may introduce additional uncertainty in mountainous and plateau regions. In addition, urbanization may also influence forest distribution and complicate satellite-based classification. In provinces such as Shanghai and Shandong, intensive human activities may reduce the accuracy of distinguishing forests from other vegetation types.
The field measurements used for validation are spatially uneven. In particular, data from northern, northwestern, and southwestern regions are limited, thus restricting independent verification of product accuracy in these areas. As a result, local performance, especially in sparse forest regions, remains under-assessed, potentially leading to underestimation of product suitability in those landscapes. Additionally, some field plots lack precise geolocation information, providing only coordinate ranges. To address this, sample locations were either randomly selected within reported bounds or averaged to derive representative positions. However, this approach may introduce positional errors and fail to capture the fine-scale changes in canopy height, thereby affecting the error estimation of the FCH product. Due to the limited availability of field measurements, a temporal mismatch exists between the sample plot observations used in this study and the FCH products, which may introduce some uncertainty into the validation results. Previous studies indicate that annual canopy height growth in southern China typically ranges from 0.13 to 0.20 m yr−1 [44]. Because forests in southern China generally exhibit relatively rapid growth, this range can be considered an upper estimate of canopy height increment. In this study, the average temporal gap between field observations and product acquisition years is approximately 1.2 years, corresponding to an expected canopy height increment of about 0.16–0.24 m. This value is much smaller than the RMSE values of the evaluated FCH products, suggesting that the influence of temporal mismatch on the validation results is likely limited.
This study is, to our knowledge, the first to comprehensively assess three high-resolution FCH products across China in terms of forest area, spatial consistency, and overall accuracy. The results establish a scientific foundation for selecting datasets suited to China’s diverse forest ecosystems and simultaneously contribute to forest monitoring initiatives in other regions, thereby supporting broader applications in forest resource management and ecological modelling.

5. Conclusions

This study systematically evaluated three high-resolution FCH products across China using metrics of forest area, spatial consistency, and overall accuracy. Results indicate that NNGI_FCH delivers the most accurate forest area estimates, with a relative error of 13.4%, significantly outperforming GFCH (58.8%) and ETH_GCH (188.6%). ETH_GCH notably overestimates forest area, especially in the northwest provinces, while NNGI_FCH maintains provincial relative errors within 65%, compared to only 19 provinces within 100% for GFCH. At the national scale, GFCH has the highest spatial consistency (70.8%), followed by NNGI_FCH (69.7%), while ETH_GCH records the lowest value (35.6%). NNGI_FCH achieves more balanced regional performance and maintains higher spatial consistency across several regions. In contrast, ETH_GCH remains below 50% in all but the northeast and south regions. In terms of overall accuracy, NNGI_FCH achieves an R2 of 0.49 and RMSE of 3.38 m nationwide and performs particularly well in the southwest region (R2 = 0.71, RMSE = 2.83 m). Although GFCH shows comparable national accuracy (R2 = 0.48, RMSE = 3.38 m), it suffers from unstable fitting in the north and northwest (R2 = 0.19, RMSE = 3.02 m). ETH_GCH demonstrates the best accuracy, with an R2 and RMSE of 0.56 and 4.15 m, but performs poorly in the northeast (R2 = 0.31, RMSE = 3.91 m).
Considering the study results, some recommendations are provided for users and producers of FCH products.
For users, each FCH product exhibits distinct advantages. NNGI_FCH shows strong performance in forest area estimation. GFCH is preferable for applications requiring precise forest distribution mapping. For use cases that prioritize canopy height accuracy, ETH_GCH may be the most suitable. When multiple metrics (forest area, spatial consistency, and canopy height accuracy) need to be considered simultaneously, NNGI_FCH provides relatively balanced performance among the evaluated products.
For producers, efforts should prioritize enhancing model adaptability to diverse environmental conditions. In regions where non-forest vegetation attains tree-like heights, improving land cover classification is critical to avoid misclassification. Moreover, in mountainous or topographically complex areas, more rigorous preprocessing of input data is required to reduce terrain-induced errors in canopy height retrieval.

Author Contributions

Conceptualization, C.Z.; Methodology, C.Z.; Validation, Y.C. and J.M.; Formal analysis, Y.C.; Investigation, Y.C.; Data curation, Y.C.; Writing—original draft, Y.C.; Writing—review & editing, C.Z.; Visualization, Y.C., J.M., R.W. and D.L.; Supervision, D.Z. and H.M.; Project administration, C.Z.; Funding acquisition, C.Z. All authors have read and agreed to the published version of the manuscript.

Funding

This work was supported by the National Natural Science Foundation of China (42471132, 42401158), the Natural Science Foundation of Shandong Province (ZR2021MD019), and the Innovation Project for graduate students of Ludong University (IPGS2025-062).

Data Availability Statement

The datasets generated and/or analyzed during the current study are available from the corresponding author on reasonable request.

Acknowledgments

We are grateful to the subject editor and three anonymous reviewers for their insightful comments and suggestions on an earlier version of this manuscript.

Conflicts of Interest

The authors declare no conflict of interest.

References

  1. Yang, Y.H.; Shi, Y.; Sun, W.J.; Chang, J.F.; Zhu, J.X.; Chen, L.Y.; Wang, X.; Guo, Y.P.; Zhang, H.T.; Yu, L.F.; et al. Terrestrial carbon sinks in China and around the world and their contribution to carbon neutrality. Sci. China Life Sci. 2022, 65, 861–895. [Google Scholar] [CrossRef]
  2. Pan, Y.; Birdsey, R.A.; Phillips, O.L.; Houghton, R.A.; Fang, J.Y.; Kauppi, P.E.; Keith, H.; Kurz, W.A.; Ito, A.; Lewis, S.L.; et al. The enduring world forest carbon sink. Nature 2024, 631, 563–569. [Google Scholar] [CrossRef]
  3. Zhu, X.X.; Nie, S.; Wang, C.; Xi, X.H.; Lao, J.Y.; Li, D. Consistency analysis of forest height retrievals between GEDI and ICESat-2. Remote Sens. Environ. 2022, 281, 113244. [Google Scholar] [CrossRef]
  4. Liu, S.Q.; Csillik, O.; Ordway, E.M.; Chang, L.L.; Longo, M.; Keller, M.; Moorcroft, P.R. Environmental drivers of spatial variation in tropical forest canopy height: Insights from NASA’s GEDI spaceborne LiDAR. Proc. Natl. Acad. Sci. USA 2025, 122, e2401755122. [Google Scholar] [CrossRef]
  5. Liu, X.Q.; Su, Y.J.; Hu, T.Y.; Yang, Q.L.; Liu, B.B.; Deng, Y.F.; Tang, H.; Tang, Z.Y.; Fang, J.Y.; Guo, Q.H. Neural network guided interpolation for mapping canopy height of China’s forests by integrating GEDI and ICESat-2 data. Remote Sens. Environ. 2022, 269, 112844. [Google Scholar] [CrossRef]
  6. Lang, N.; Jetz, W.; Schindler, K.; Wegner, J.D. A high-resolution canopy height model of the Earth. Nat. Ecol. Evol. 2023, 7, 1778–1789. [Google Scholar] [CrossRef] [PubMed]
  7. Bolton, D.K.; Tompalski, P.; Coops, N.C.; White, J.C.; Wulder, M.A.; Hermosilla, T.; Queinnec, M.; Luther, J.E.; Lier, O.R.; Fournier, R.A.; et al. Optimizing Landsat time series length for regional mapping of lidar-derived forest structure. Remote Sens. Environ. 2022, 239, 111645. [Google Scholar] [CrossRef]
  8. Li, Z.Y.; Liu, Q.W.; Pang, Y. Review on forest parameters inversion using LiDAR. Natl. Remote Sens. Bull. 2016, 20, 1138–1150. [Google Scholar] [CrossRef]
  9. Simard, M.; Pinto, N.; Fisher, J.B.; Baccini, A. Mapping forest canopy height globally with spaceborne lidar. J. Geophys. Res. 2011, 116, G04021. [Google Scholar] [CrossRef]
  10. Potapov, P.; Li, X.Y.; Hernandez-Serna, A.; Tyukavina, A.; Hansen, M.C.; Kommareddy, A.; Pickens, A.; Turubanova, S.; Tang, H.; Silva, C.E.; et al. Mapping global forest canopy height through integration of GEDI and Landsat data. Remote Sens. Environ. 2021, 253, 112165. [Google Scholar] [CrossRef]
  11. Wang, Y.Y.; Li, G.C.; Ding, J.H.; Guo, Z.D.; Tang, S.H.; Wang, C.; Huang, Q.N.; Liu, R.G.; Chen, J.M. A combined GLAS and MODIS estimation of the global distribution of mean forest canopy height. Remote Sens. Environ. 2016, 174, 24–43. [Google Scholar] [CrossRef]
  12. Yang, T.; Wang, C.; Li, G.C.; Luo, S.Z.; Xi, X.H.; Gao, S.; Zeng, H.C. Forest canopy height mapping over China using GLAS and MODIS data. Sci. China Earth Sci. 2015, 58, 96–105. [Google Scholar] [CrossRef]
  13. Jiao, H.; Wang, X.C.; Wu, J.R.; Gao, K.X. Improvement of forest canopy height estimation model by combining Geoscience Laser Altimetry System full waveform and multispectral remote sensing data over sloping terrain. J. Appl. Remote Sens. 2018, 12, 045019. [Google Scholar] [CrossRef]
  14. Popescu, S.C.; Zhou, T.; Nelson, R.; Neuenschwander, A.; Sheridan, R.; Narine, L.; Walsh, K.M. Photon counting LiDAR: An adaptive ground and canopy height retrieval algorithm for ICESat-2 data. Remote Sens. Environ. 2018, 208, 154–170. [Google Scholar] [CrossRef]
  15. Zhu, X.X. Forest Height Retrieval of China with a Resolution of 30 m Using ICESat-2 and GEDI Data. Ph.D. Dissertation, University of Chinese Academy of Sciences, Beijing, China, 2021. [Google Scholar] [CrossRef]
  16. Wu, Z.C.; Shi, F.L. Mapping forest canopy height at large scales using ICESat-2 and Landsat: An ecological zoning random forest approach. IEEE Trans. Geosci. Remote Sens. 2023, 61, 4400116. [Google Scholar] [CrossRef]
  17. Malambo, L.; Popescu, S. Mapping vegetation canopy height across the contiguous United States using ICESat-2 and ancillary datasets. Remote Sens. Environ. 2024, 309, 114226. [Google Scholar] [CrossRef]
  18. Turubanova, S.; Potapov, P.; Hansen, M.C.; Li, X.Y.; Tyukavina, A.; Pickens, A.H.; Hernandez-Serna, A.; Arranz, A.P.; Guerra-Hernandez, J.; Senf, C.; et al. Tree canopy extent and height change in Europe, 2001–2021, quantified using Landsat data archive. Remote Sens. Environ. 2023, 298, 113797. [Google Scholar] [CrossRef]
  19. Tolan, J.; Yang, H.I.; Nosarzewski, B.; Couairon, G.; Vo, H.V.; Brandt, J.; Spore, J.; Majumdar, S.; Haziza, D.; Vamaraju, J.; et al. Very high resolution canopy height maps from RGB imagery using self-supervised vision transformer and convolutional decoder trained on aerial lidar. Remote Sens. Environ. 2024, 300, 113888. [Google Scholar] [CrossRef]
  20. Liu, A.B.; Cheng, Y.T.; Chen, X. Evaluating ICESat-2 and GEDI with integrated Landsat-8 and PALSAR-2 for mapping tropical forest canopy height. Remote Sens. 2024, 16, 3798. [Google Scholar] [CrossRef]
  21. Moudrý, V.; Gábor, L.; Marselis, S.; Pracná, P.; Barták, V.; Prošek, J.; Navrátilová, B.; Novotný, J.; Potůčková, M.; Gdulová, K.; et al. Comparison of three global canopy height maps and their applicability to biodiversity modeling: Accuracy issues revealed. Ecosphere 2024, 15, e70026. [Google Scholar] [CrossRef]
  22. National Forestry and Grassland Administration. China Forest Resources Report (2014–2018); China Forestry Publishing House: Beijing, China, 2019. [Google Scholar]
  23. Xu, B.; Guo, Z.D.; Piao, S.L.; Fang, J.Y. Biomass carbon stocks in China’s forests between 2000 and 2050: A prediction based on forest biomass-age relationships. Sci. China Life Sci. 2010, 53, 776–783. [Google Scholar] [CrossRef]
  24. Fu, X.; Zhang, Y.X.; Wang, X.J. Prediction of forest biomass carbon pool and carbon sink potential in China before 2060. Sci. Silvae Sin. 2022, 58, 32–41. [Google Scholar]
  25. Yang, J.; Huang, X. The 30 m annual land cover dataset and its dynamics in China from 1990 to 2019. Earth Syst. Sci. Data 2021, 13, 3907–3925. [Google Scholar] [CrossRef]
  26. Chen, S.Y.; Lu, N.; Fu, B.J.; Wang, S.; Deng, L.; Wang, L.X. Current and future carbon stocks of natural forests in China. For. Ecol. Manag. 2022, 511, 120137. [Google Scholar] [CrossRef]
  27. Wang, J.; Yang, X.M.; Wang, Z.H.; Cheng, H.; Kang, J.; Tang, H.; Li, Y.; Bian, Z.; Bai, Z. Consistency analysis and accuracy assessment of three global ten-meter land cover products in Rocky Desertification Region—A case study of Southwest China. ISPRS Int. J. Geo-Inf. 2022, 11, 202. [Google Scholar] [CrossRef]
  28. Li, Y.; Sulla-Menashe, D.; Motesharre, S.; Song, X.P.; Kalnay, E.; Ying, Q.; Li, S.C.; Ma, Z.W. Inconsistent estimates of forest cover change in China between 2000 and 2013 from multiple datasets: Differences in parameters, spatial resolution, and definitions. Sci. Rep. 2017, 7, 8748. [Google Scholar] [CrossRef]
  29. Zhang, C.K.; Yu, Y. Accuracy verification of ground elevation and vegetation canopy height inversion from ICESat-2/ATLAS data. For. Eng. 2023, 39, 1–11. [Google Scholar]
  30. Chen, Y.Y.; Wang, Y.; Zhou, Y.H.; Yang, Y.K. Assessment of forest type data in global land cover products over China. Remote Sens. Technol. Appl. 2023, 38, 341–352. [Google Scholar]
  31. Wang, H.; Yan, H.M.; Hu, Y.F.; Xi, Y.; Yang, Y.C. Consistency and Accuracy of Four High-Resolution LULC Datasets—Indochina Peninsula Case Study. Land 2022, 11, 758. [Google Scholar] [CrossRef]
  32. Kang, J.M.; Yang, X.M.; Wang, Z.H.; Cheng, H.; Wang, J.; Tang, H.; Li, Y.; Bian, Z.; Bai, Z. Comparison of three ten meter land cover products in a drought region: A case study in northwestern China. Land 2022, 11, 427. [Google Scholar] [CrossRef]
  33. Zhu, J.T.; Ai, J.Q.; Chen, X.Y.; Tang, Y.H. Consistency analysis of classification results for lake wetland based on multi-source optical remote sensing data. Geogr. Geo-Inf. Sci. 2021, 37, 45–50. [Google Scholar]
  34. Wang, L.; Li, Y.; Zhu, J.J.; Fu, H.Q.; Gao, S.J. Accuracy Assessment of ICESat-2 ATL08 Terrain and Canopy Heights. Remote Sens. Inf. 2023, 38, 144–152. [Google Scholar]
  35. Chen, A.; Cheng, K.; Chen, Y.L.; Qi, Z.Y.; Yang, H.T.; Ren, Y.; Yang, Z.K.; Chen, M.X.; Xu, J.C.; Zhang, Y.X.; et al. Validating recent global canopy height maps over China’s forests based on UAV lidar data. Remote Sens. Environ. 2025, 329, 114957. [Google Scholar] [CrossRef]
  36. Hu, T.; Peng, J.; Dong, J.Q.; Xiao, S.C.; Xia, P. Forest definitions collaboration based on global remote sensing data products. Acta Geogr. Sin. 2024, 79, 1115–1128. [Google Scholar]
  37. Hansen, M.C.; Potapov, P.V.; Moore, R.; Hancher, M.; Turubanova, S.A.; Tyukavina, A.; Thau, D.; Stehman, S.V.; Goetz, S.J.; Loveland, T.R.; et al. High-resolution global maps of 21st-century forest cover change. Science 2013, 342, 850–853. [Google Scholar] [CrossRef] [PubMed]
  38. Chen, J.; Chen, J.; Liao, A.Q.; Cao, X.; Chen, L.J.; Chen, X.H.; He, C.Y.; Han, G.; Peng, S.; Lu, M.; et al. Global land cover mapping at 30 m resolution: A POK-based operational approach. ISPRS J. Photogramm. Remote Sens. 2015, 103, 7–27. [Google Scholar] [CrossRef]
  39. Neuenschwander, A.; Guenther, E.; White, J.C.; Duncanson, L.; Montesano, P. Validation of ICESat-2 terrain and canopy heights in boreal forests. Remote Sens. Environ. 2020, 251, 112110. [Google Scholar] [CrossRef]
  40. Roy, D.P.; Kashongwe, H.B.; Armston, J. The impact of geolocation uncertainty on GEDI tropical forest canopy height estimation and change monitoring. Sci. Remote Sens. 2021, 4, 100024. [Google Scholar] [CrossRef]
  41. Kong, D.L.; Xing, Y.Q. Inversion of tree height from GEDI and ICESat-2 spaceborne lidar. J. Nanjing For. Univ. 2025, 49, 175–184. [Google Scholar]
  42. Cai, L.T.; He, J.S.; Wu, J.; Han, X.R.; Wang, Y.; Xing, Z.K. Estimation of forest canopy height in different season based on GEDI waveform data. Trans. Chin. Soc. Agric. Mach. 2025, 56, 325–334. [Google Scholar]
  43. Liu, L.J.; Wang, C.; Nie, S.; Zhu, X.X.; Xi, X.H.; Wang, J.L. Analysis of the influence of different algorithms of GEDI L2A on the accuracy of ground elevation and forest canopy height. J. Univ. Chin. Acad. Sci. 2022, 39, 502–511. [Google Scholar]
  44. Chang, J.Y.; Tong, X.W.; Brandt, M.; Zhang, W.M.; Yue, Y.M.; Lu, J.; Liu, S.Y.; Zhai, L.; Wang, K.L. Tracking Southern China’s Forest Growth from Space. J. Remote Sens. 2025, 5, 0810. [Google Scholar] [CrossRef]
Figure 1. Distributions of forest regions and plots in China. (a) Forest regions following Chen et al. [26]; (b) geographical distribution of 1750 forest plots used; (c) spatial distribution of China’s forest in 2020. The northeast region includes Heilongjiang (HLJ), Jilin (JL), Liaoning (LN); the north region includes Beijing (BJ), Tianjin (TJ), Hebei (HB), Shanxi (SX), and Inner Mongolia (IM); the east region includes Shandong (SD), Jiangsu (JS), Anhui (AH), Shanghai (SH), Zhejiang (ZJ), Fujian (FJ), Jiangxi (JX), and Taiwan (TW); the south region includes Hainan (HN), Guangdong (GD), Guangxi (GX), Hunan (HuN), Hubei (HuB), and Henan (HeN); the southwest region includes Yunnan (YN), Sichuan (SC), Chongqing (CQ), Guizhou (GZ), and Tibet; and the northwest region includes Xinjiang (XJ), Qinghai (QH), Gansu (GS), Ningxia (NX), and Shannxi (SNX).
Remotesensing 18 01046 g001
Figure 2. Spatial overlay map of the FCH product (GFCH, NNGI_FCH, or ETH_GCH) and CLCD data.
Remotesensing 18 01046 g002
Figure 3. The relative error distribution of estimated forest area from GFCH, NNGI_FCH and ETH_GCH products in comparison with the estimates of FID in different provinces of China (excluding Taiwan, Hongkong and Macao due to lack of data). The northeast region includes Heilongjiang (HLJ), Jilin (JL), Liaoning (LN); the north region includes Beijing (BJ), Tianjin (TJ), Hebei (HB), Shanxi (SX), and Inner Mongolia (IM); the east region includes Shandong (SD), Jiangsu (JS), Anhui (AH), Shanghai (SH), Zhejiang (ZJ), Fujian (FJ), Jiangxi (JX), and Taiwan (TW); the south region includes Hainan (HN), Guangdong (GD), Guangxi (GX), Hunan (HuN), Hubei (HuB), and Henan (HeN); the southwest region includes Yunnan (YN), Sichuan (SC), Chongqing (CQ), Guizhou (GZ), and Tibet; and the northwest region includes Xinjiang (XJ), Qinghai (QH), Gansu (GS), Ningxia (NX), and Shannxi (SNX).
Remotesensing 18 01046 g003
Figure 4. The relative error distribution of estimated forests area from GFCH, NNGI_FCH and ETH_GCH products in comparison with the estimates of FID in different regions of China under a unified forest mask (excluding Taiwan, Hongkong and Macao due to lack of data). The northeast region includes Heilongjiang (HLJ), Jilin (JL), Liaoning (LN); the north region includes Beijing (BJ), Tianjin (TJ), Hebei (HB), Shanxi (SX), and Inner Mongolia (IM); the east region includes Shandong (SD), Jiangsu (JS), Anhui (AH), Shanghai (SH), Zhejiang (ZJ), Fujian (FJ), Jiangxi (JX), and Taiwan (TW); the south region includes Hainan (HN), Guangdong (GD), Guangxi (GX), Hunan (HuN), Hubei (HuB), and Henan (HeN); the southwest region includes Yunnan (YN), Sichuan (SC), Chongqing (CQ), Guizhou (GZ), and Tibet; and the northwest region includes Xinjiang (XJ), Qinghai (QH), Gansu (GS), Ningxia (NX), and Shannxi (SNX).
Remotesensing 18 01046 g004
Figure 5. The spatial consistency distribution of GFCH, NNGI_FCH and ETH_GCH products by comparison with CLCD in China. The bar chart represents the summary of spatial consistency of three FCH products in different regions of China.
Remotesensing 18 01046 g005
Figure 6. The spatial consistency of GFCH, NNGI_FCH and ETH_GCH products by comparison with CLCD in different provinces of China. The northeast region includes Heilongjiang (HLJ), Jilin (JL), Liaoning (LN); the north region includes Beijing (BJ), Tianjin (TJ), Hebei (HB), Shanxi (SX), and Inner Mongolia (IM); the east region includes Shandong (SD), Jiangsu (JS), Anhui (AH), Shanghai (SH), Zhejiang (ZJ), Fujian (FJ), Jiangxi (JX), and Taiwan (TW); the south region includes Hainan (HN), Guangdong (GD), Hongkong (HK), Guangxi (GX), Hunan (HuN), Hubei (HuB), and Henan (HeN); the southwest region includes Yunnan (YN), Sichuan (SC), Chongqing (CQ), Guizhou (GZ), and Tibet; and the northwest region includes Xinjiang (XJ), Qinghai (QH), Gansu (GS), Ningxia (NX), and Shannxi (SNX).
Remotesensing 18 01046 g006
Figure 7. Comparison of omission errors and commission errors among the GFCH, NNGI_FCH, and ETH_GCH products. The northeast region includes Heilongjiang (HLJ), Jilin (JL), Liaoning (LN); the north region includes Beijing (BJ), Tianjin (TJ), Hebei (HB), Shanxi (SX), and Inner Mongolia (IM); the east region includes Shandong (SD), Jiangsu (JS), Anhui (AH), Shanghai (SH), Zhejiang (ZJ), Fujian (FJ), Jiangxi (JX), and Taiwan (TW); the south region includes Hainan (HN), Guangdong (GD), Hongkong (HK), Guangxi (GX), Hunan (HuN), Hubei (HuB), and Henan (HeN); the southwest region includes Yunnan (YN), Sichuan (SC), Chongqing (CQ), Guizhou (GZ), and Tibet; and the northwest region includes Xinjiang (XJ), Qinghai (QH), Gansu (GS), Ningxia (NX), and Shannxi (SNX).
Remotesensing 18 01046 g007
Figure 8. Comparisons of estimated FCH from GFCH, NNGI_FCH and ETH_GCH products with observed FCH at plot scale in China, and residual distribution. The solid line is the regression line, while the dashed line is the 1:1 line. RMSE is the root mean square error (meters). All statistics are significant at the 0.01 level.
Remotesensing 18 01046 g008
Figure 9. Comparison of estimated FCH by GFCH, NNGI_FCH, and ETH_GCH products with observed FCH at the plot scale for different regions of China. From top to bottom, each row represents GFCH, NNGI_FCH, and ETH_GCH, respectively. From left to right, each column represents the northeast (NE), north (N), northwest (NW), east (E), south (S), and southwest (SW) regions. Due to the limited data availability, FCH values in the north and northwest regions were evaluated using the same field plots. The same is true for the east and south regions. The solid line is the regression line, while the dashed line is the 1:1 line. RMSE is the root mean square error (meters). All statistics are significant at the 0.01 level.
Remotesensing 18 01046 g009
Table 1. Base information of the FCH products used this study.
InformationGFCHNNGI_FCHETH_GCH
Region51.6°S–51.6°NChinaGlobal
Satellite sensorGEDI, LandsatGEDI, ICESat-2GEDI, Sentinel-2
Spatial resolution (m)303010
Temporal coverage201920192020
MethodBagged regression tree ensemble modelNeural network guided interpolation methodDeep convolutional neural network
FCH estimatesRH95RH98, RH100RH98
Forest definitionsAreas with woody vegetation taller than 3 mAreas with >30% canopy closure and sparse forests as 10–30% closureVegetation
Source[10][5][6]
Table 2. The relative error (RE) and absolute area differences (AAD) of estimated forests area from GFCH, NNGI_FCH and ETH_GCH products in comparison with the estimates of FID in different regions of China.
Region GFCHNNGI_FCHETH_GCH
RE (%)AAD (km2)RE (%)AAD (km2)RE (%)AAD (km2)
Northeast−1.34.21 × 103−6.72.14 × 10495.83.05 × 105
North5.41.31 × 104−13.33.26 × 104144.83.54 × 105
East77.91.91 × 10515.33.76 × 104182.24.47 × 105
South87.13.29 × 10532.41.22 × 105147.75.57 × 105
Southwest87.14.30 × 10520.71.02 × 105258.71.28 × 106
Northwest81.51.02 × 10527.53.43 × 104369.54.62 × 105
China58.81.06 × 10613.42.42 × 105188.63.40 × 106
Disclaimer/Publisher’s Note: The statements, opinions and data contained in all publications are solely those of the individual author(s) and contributor(s) and not of MDPI and/or the editor(s). MDPI and/or the editor(s) disclaim responsibility for any injury to people or property resulting from any ideas, methods, instructions or products referred to in the content.