


Highlights
What are the main findings?
- A Mamba-based self-refinement framework is proposed for VHR remote sensing change detection.
- The proposed method achieves state-of-the-art performance on LEVIR-CD and WHU-CD benchmarks with improved feature interaction and robustness.
What is the implication of the main finding?
- The framework provides an efficient solution for modeling long-range dependencies in high-resolution remote sensing data.
- The proposed strategies improve robustness to noisy annotations and enhance practical applicability in complex scenarios.
Abstract
Accurate change detection (CD) in very high-resolution (VHR, <1 m) optical remote sensing images remains challenging, as it requires effective modeling of long-range bi-temporal dependencies and robustness against label noise in complex urban environments. Existing deep learning-based CD methods either rely on convolutional operations with limited receptive fields or employ global attention mechanisms with high computational cost, making it difficult to simultaneously achieve efficient global context modeling and fine-grained structural sensitivity. To address these challenges, we propose a Mamba-based self-refinement framework for remote sensing change detection (MSRNet). Specifically, we introduce an attention-enhanced oblique state space module (AOSS) to model spatio-temporal dependencies with linear complexity while preserving fine-grained structural information. The four-branch attention fusion module (FBAM) further enhances cross-dimensional feature interaction to improve the discriminative capability of differential representations. In addition, a self-refinement module (SRM) incorporates a momentum encoder to generate high-quality pseudo-labels, mitigating annotation noise and enabling learning from latent changes. Extensive experiments on two benchmark VHR datasets, LEVIR-CD and WHU-CD, demonstrate that MSRNet achieves state-of-the-art performance in both accuracy and computational efficiency.
1. Introduction
CD aims to identify objects of interest that change between two aerial photographs taken at different times, playing a crucial role in environmental monitoring [1], urban expansion [2], ecological studies [3], and post-disaster assessment [4]. With the increasing availability of VHR remote sensing images, effectively identifying and characterizing subtle surface changes has become increasingly challenging, motivating the development of more advanced change detection techniques.
Traditional CD methods can generally be categorized into pixel-based and object-based approaches. Pixel-based methods, such as image differencing, image ratioing, and principal component analysis (PCA) [5,6,7], are computationally efficient and easy to implement. However, they are highly sensitive to illumination variations and image registration errors. As a result, these methods often produce noisy detection results. Object-based methods incorporate spatial and structural information by first segmenting images into meaningful regions [8,9]. This strategy can improve robustness to noise and spatial inconsistency. Nevertheless, these methods rely heavily on manually designed features, which limits their adaptability in complex and heterogeneous scenes. Consequently, traditional approaches often struggle to capture high-level semantic information and long-range contextual relationships. These limitations have motivated increasing research interest in deep learning-based computer vision methods for CD. A large number of recent studies have explored diverse deep learning paradigms for change detection, including CNN-based, Transformer-based, and emerging state-space and multimodal frameworks [10,11,12,13,14,15,16,17,18,19,20,21,22,23,24,25,26,27,28,29,30,31]. In addition, attention mechanisms and self-supervised or generative learning strategies have been widely investigated to enhance feature representation and reduce reliance on large-scale annotations [32,33,34,35,36,37,38,39,40].
Among these methods, CNN-based approaches have been widely studied due to their strong local feature extraction capability. FC-EF [41] introduced fully convolutional networks for end-to-end change detection and inspired numerous CNN-based variants. SNUNet [42] improves feature utilization through multi-level feature fusion and frequency-domain modeling. HANet [43] addresses the sample imbalance problem in remote sensing CD by combining hierarchical attention mechanisms with foreground-balanced sampling. Despite these advances, CNN-based methods still suffer from the limited receptive field of convolutional operations. This limitation makes it difficult to capture long-range spatial dependencies and global contextual information, which are essential for analyzing complex urban environments. To address this issue, Transformer-based frameworks have recently been explored. BIT [44] employs a bi-temporal image Transformer module to model global spatio-temporal relationships. TransCD [45] further enhances global dependency modeling by integrating hybrid multi-scale Transformers with micro-decoders. AdaptVFMs-RSCD [46] leverages the Segment Anything Model (SAM) and CLIP to bridge visual and semantic representations for semantic change detection. Although Transformer-based methods achieve superior performance compared with CNN-based approaches, their quadratic computational complexity leads to significant efficiency challenges when applied to large-scale VHR CD tasks.
Recently, Mamba [47] has demonstrated strong capability in efficiently modeling long-range dependencies through state-space representations. Building upon this paradigm, several Mamba-based CD methods have been proposed. RSM-CD [48] enhances directional sensitivity by introducing oblique scanning strategies, which improves robustness to perspective distortion. CDMamba [49] integrates CNNs with Mamba to balance local convolutional priors and global dependency modeling. ChangeMamba [50] further introduces multiple spatio-temporal interaction mechanisms to strengthen bi-temporal feature fusion. Despite these advances, existing Mamba-based CD frameworks mainly focus on improving scanning strategies or hybrid feature fusion. Limited attention has been paid to adaptive selective suppression and structural refinement within the state-space modeling process. In particular, most methods lack an explicit mechanism to dynamically regulate redundant spatial responses during feature propagation. They also struggle to suppress label noise interference. This issue is especially critical in VHR remote sensing scenarios with complex backgrounds and subtle structural changes.
To address the above limitations, we propose MSRNet, a Mamba-based self-refinement framework for VHR CD. Unlike existing Mamba-based approaches that mainly focus on scanning strategies or hybrid CNN–Mamba architectures, MSRNet introduces three key improvements. First, the AOSS mechanism is embedded into the Mamba encoder to enhance state-space modeling. It adaptively filters redundant spatial responses while preserving fine-grained structural details. Second, the FBAM module is designed to strengthen decoder feature representation through cross-dimensional channel–spatial interactions, enabling more accurate extraction of critical change cues. Third, the SRM module generates high-confidence pseudo-labels to alleviate annotation noise and improve training robustness. Through these designs, MSRNet effectively models global dependencies while improving structural precision and robustness in complex VHR remote sensing scenes.
2. Methods
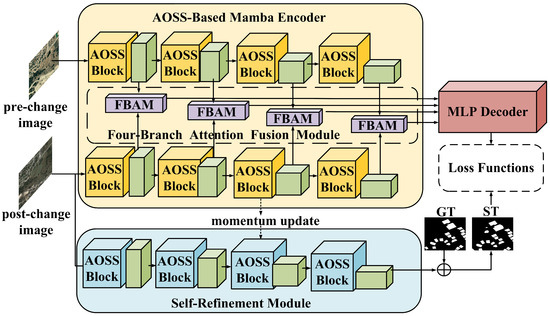
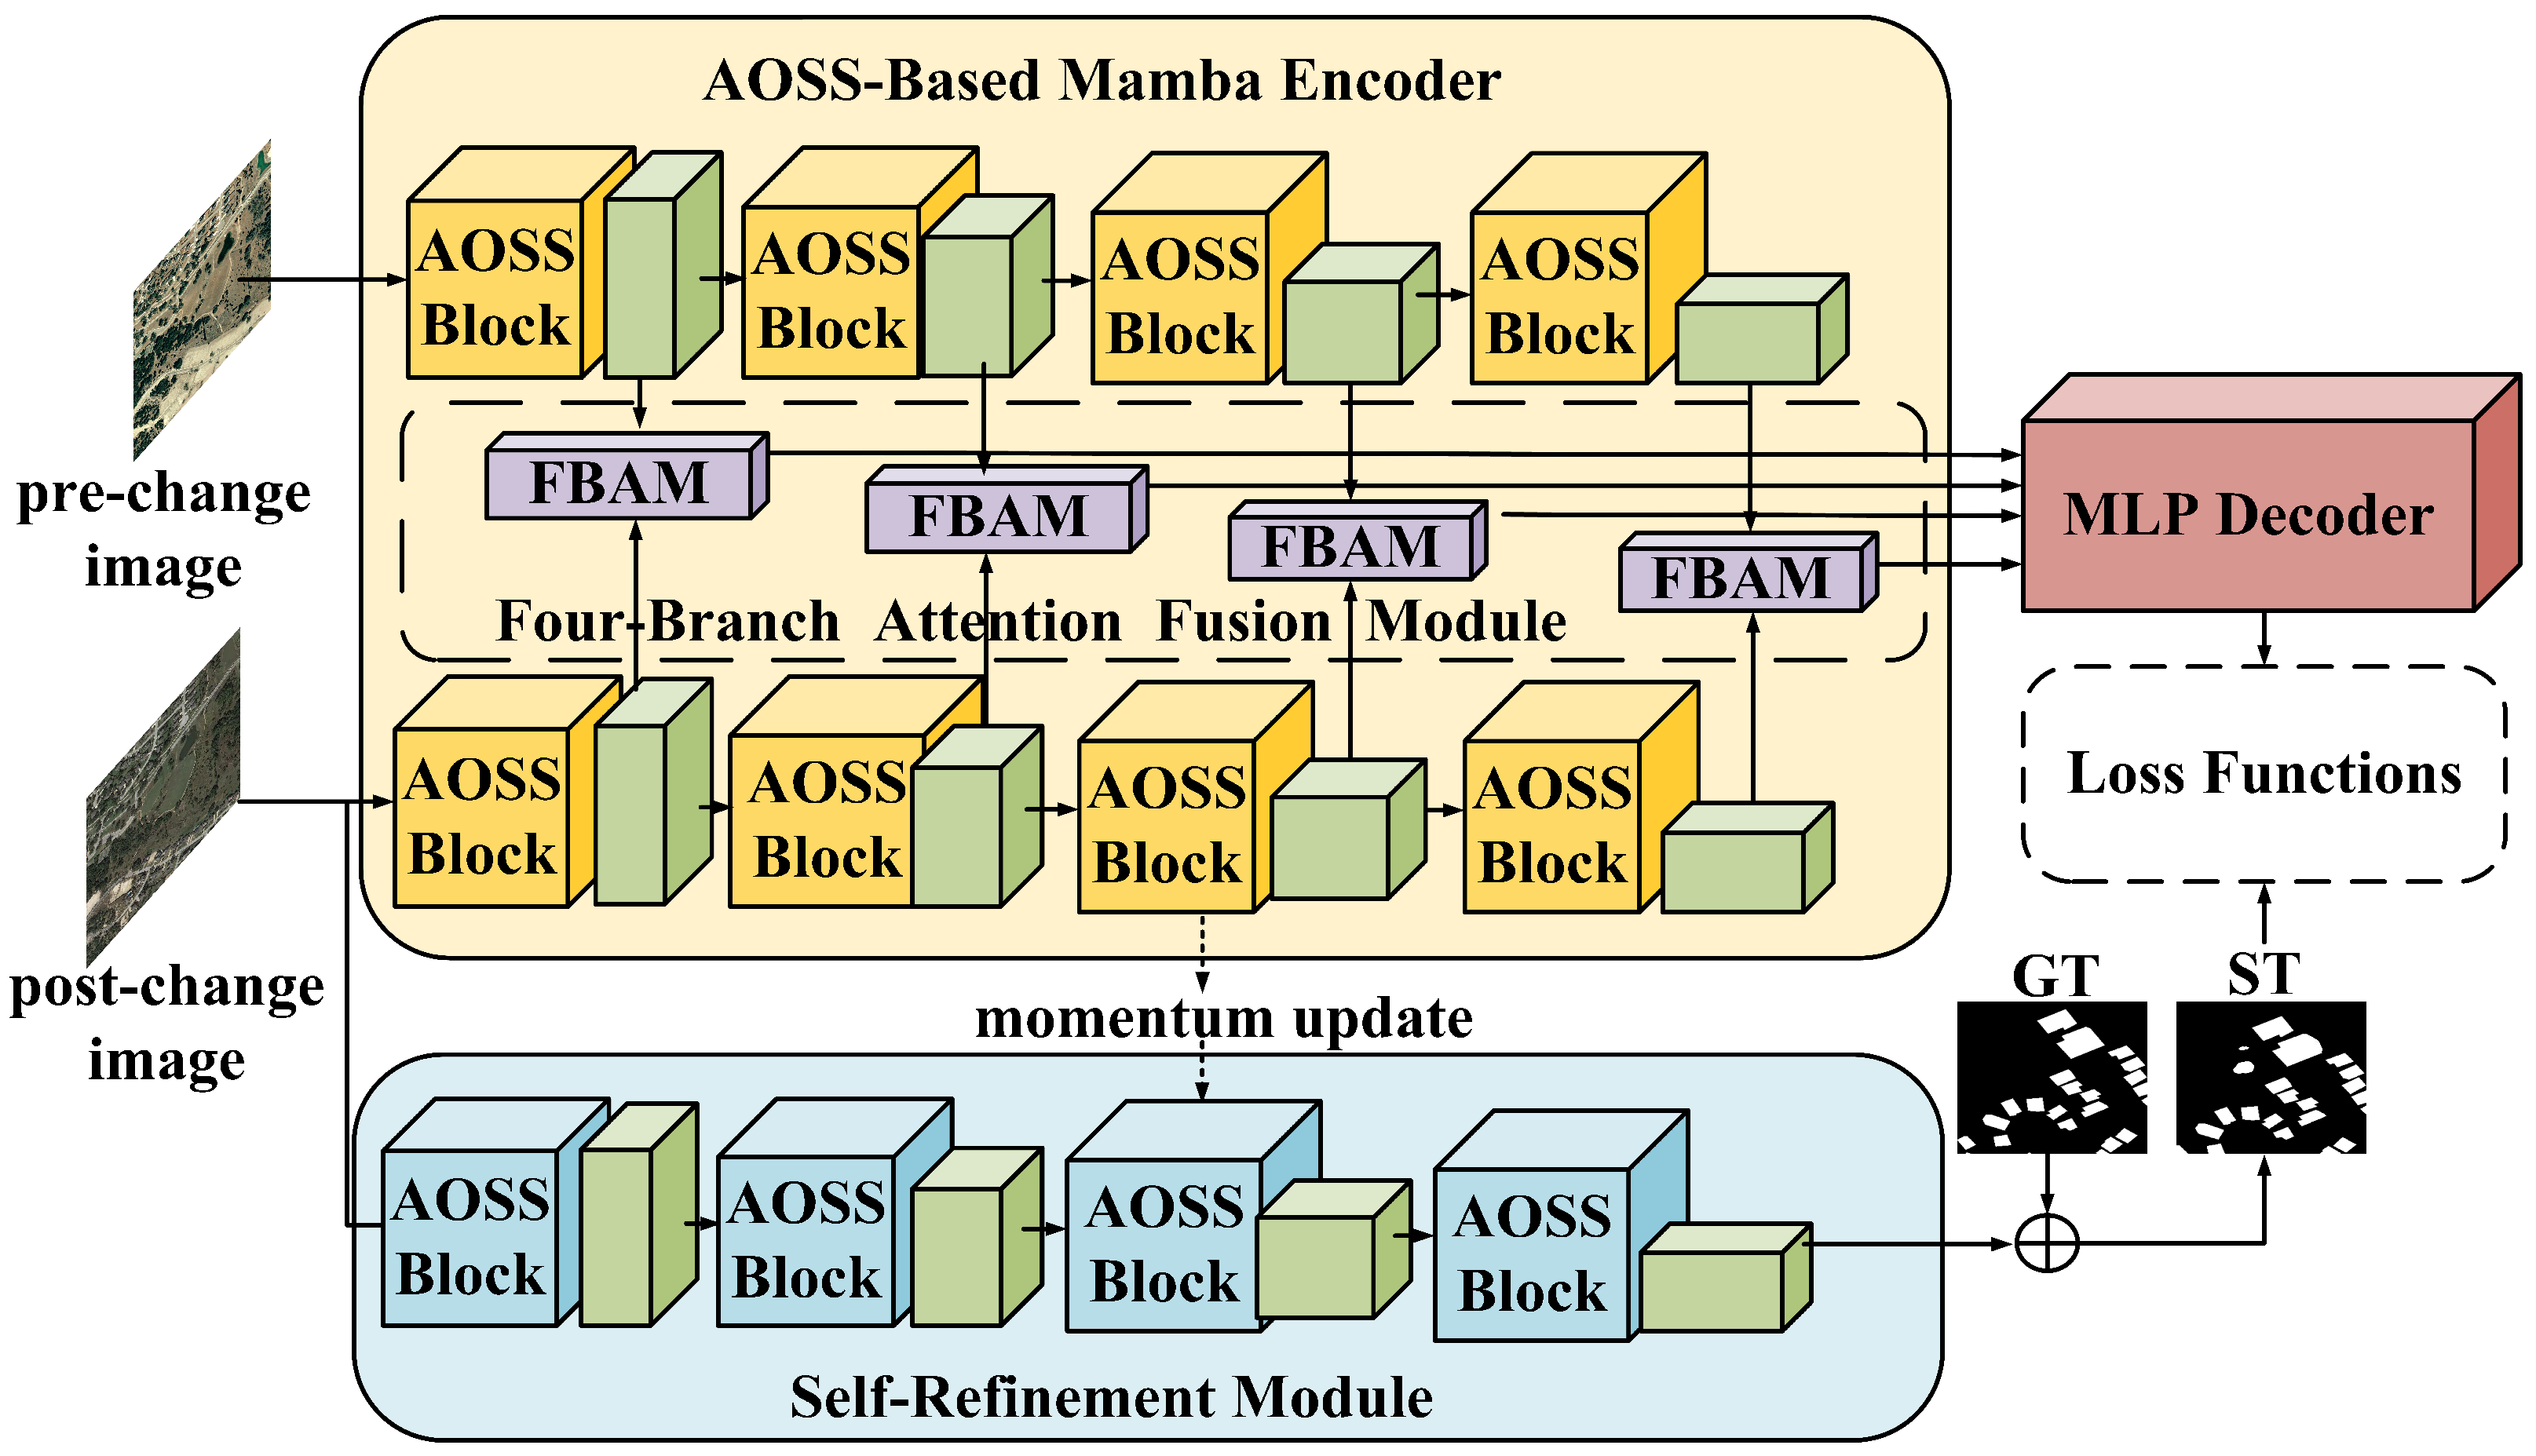
As shown in Figure 1, Our proposed MSRNet integrates three core components: a backbone network for fundamental feature extraction, four FBAM modules capturing multi-scale spatio-temporal dynamic changes from bi-temporal features, and an SRM module mitigating the label noise issue. We adopt the AOSS-based Mamba encoder as the backbone network to extract four scales of features. At each scale, FBAM facilitates information exchange between bi-temporal features. The fused features are then processed through an MLP to generate a change map, which is finally used to compute the loss with the SRM dynamically corrected labels.
Figure 1.
Overall architecture of the proposed MSRNet framework. The network consists of three key components: an AOSS-based Mamba encoder for hierarchical feature extraction, FBAM for cross-temporal feature interaction at different scales, and an SRM for pseudo-label correction during training. The bi-temporal images are first processed by the encoder to generate multi-scale feature representations. FBAM modules then enhance the interaction between features from different temporal images, highlighting discriminative change cues. Finally, the fused features are decoded to produce the final change detection map, while SRM improves supervision quality through iterative pseudo-label refinement.
2.1. AOSS-Based Mamba Encoder
Although State Space Models (SSMs) are effective at modeling long-range dependencies, they inherently operate on sequential representations and often overlook localized texture variations that are critical for detecting small changes in VHR images. To address this limitation, we propose the AOSS module, inspired by CrackMamba [51]. Unlike traditional SSMs, AOSS incorporates attention modulation directly into the state transition process. This design allows the model to adaptively weight each state update according to the importance of the spatial context and feature channels. Notably, the channel attention mechanism operates within the unified embedding space generated by the encoder rather than on the original spectral bands. This design enables AOSS to function independently of the specific sensor source or band composition of remote sensing data.
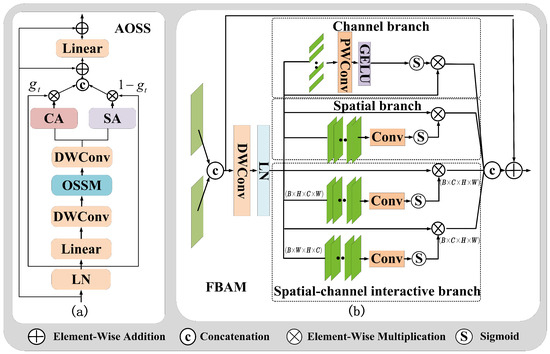
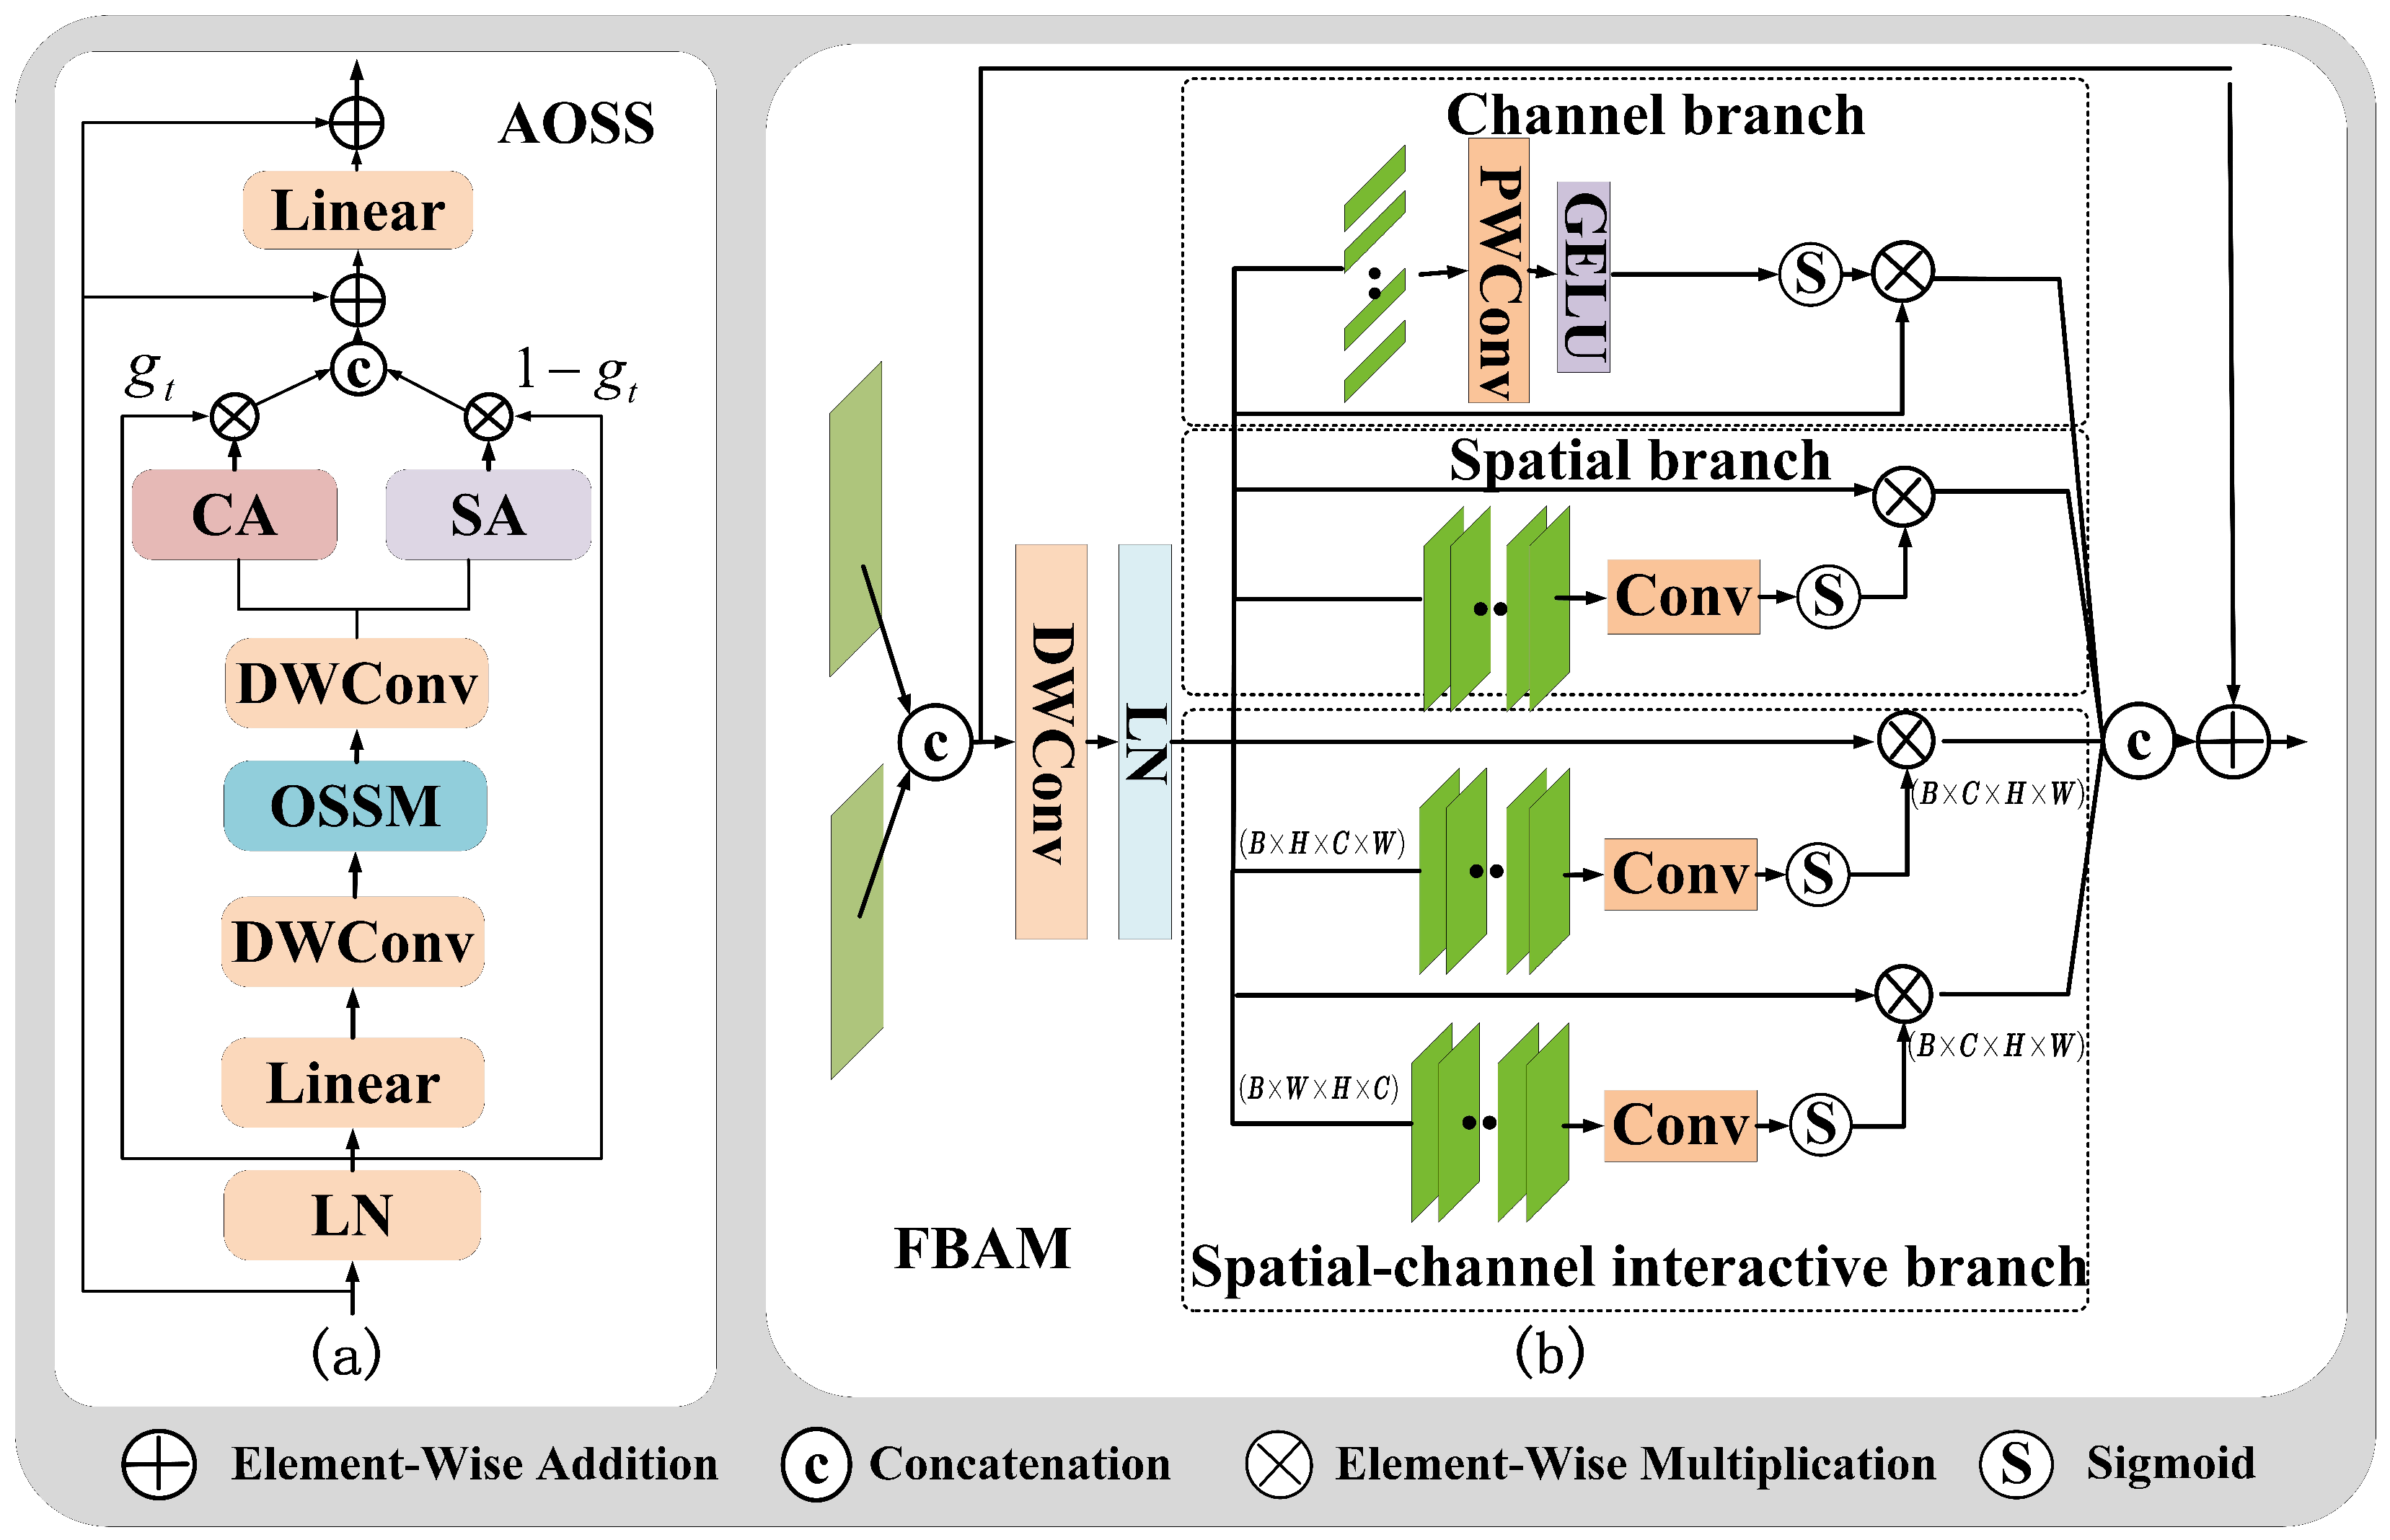
As illustrated in Figure 2a, the features produced by OSSM are first processed through depthwise convolutions to obtain . Meanwhile, the propagated latent state St is retained as a dynamic descriptor of contextual dependencies. Specifically, St is reshaped to recover its two-dimensional spatial topology according to the deterministic scan order of OSSM, ensuring precise spatial alignment with . This alignment enables state-aware gating, where the state information guides the adaptive fusion of channel and spatial attention responses.
Figure 2.
Architectural details of the proposed AOSS and FBAM modules. (a) Structure of the AOSS module integrated within the Mamba encoder. The module introduces spatial and channel attention mechanisms and a state-aware gating strategy to selectively suppress redundant responses and enhance structural feature representations. (b) Structure of the FBAM. The module contains spatial attention, channel attention, height–channel interaction, and width–channel interaction branches. These four parallel branches jointly model spatial and cross-dimensional dependencies, enabling effective fusion of bi-temporal features and improved sensitivity to subtle structural changes.
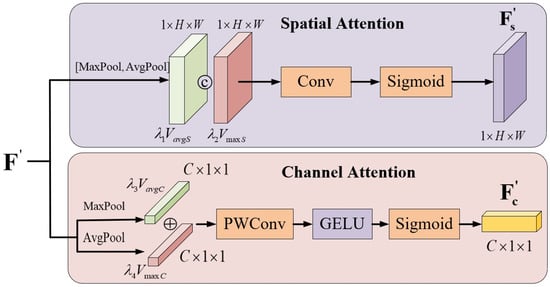
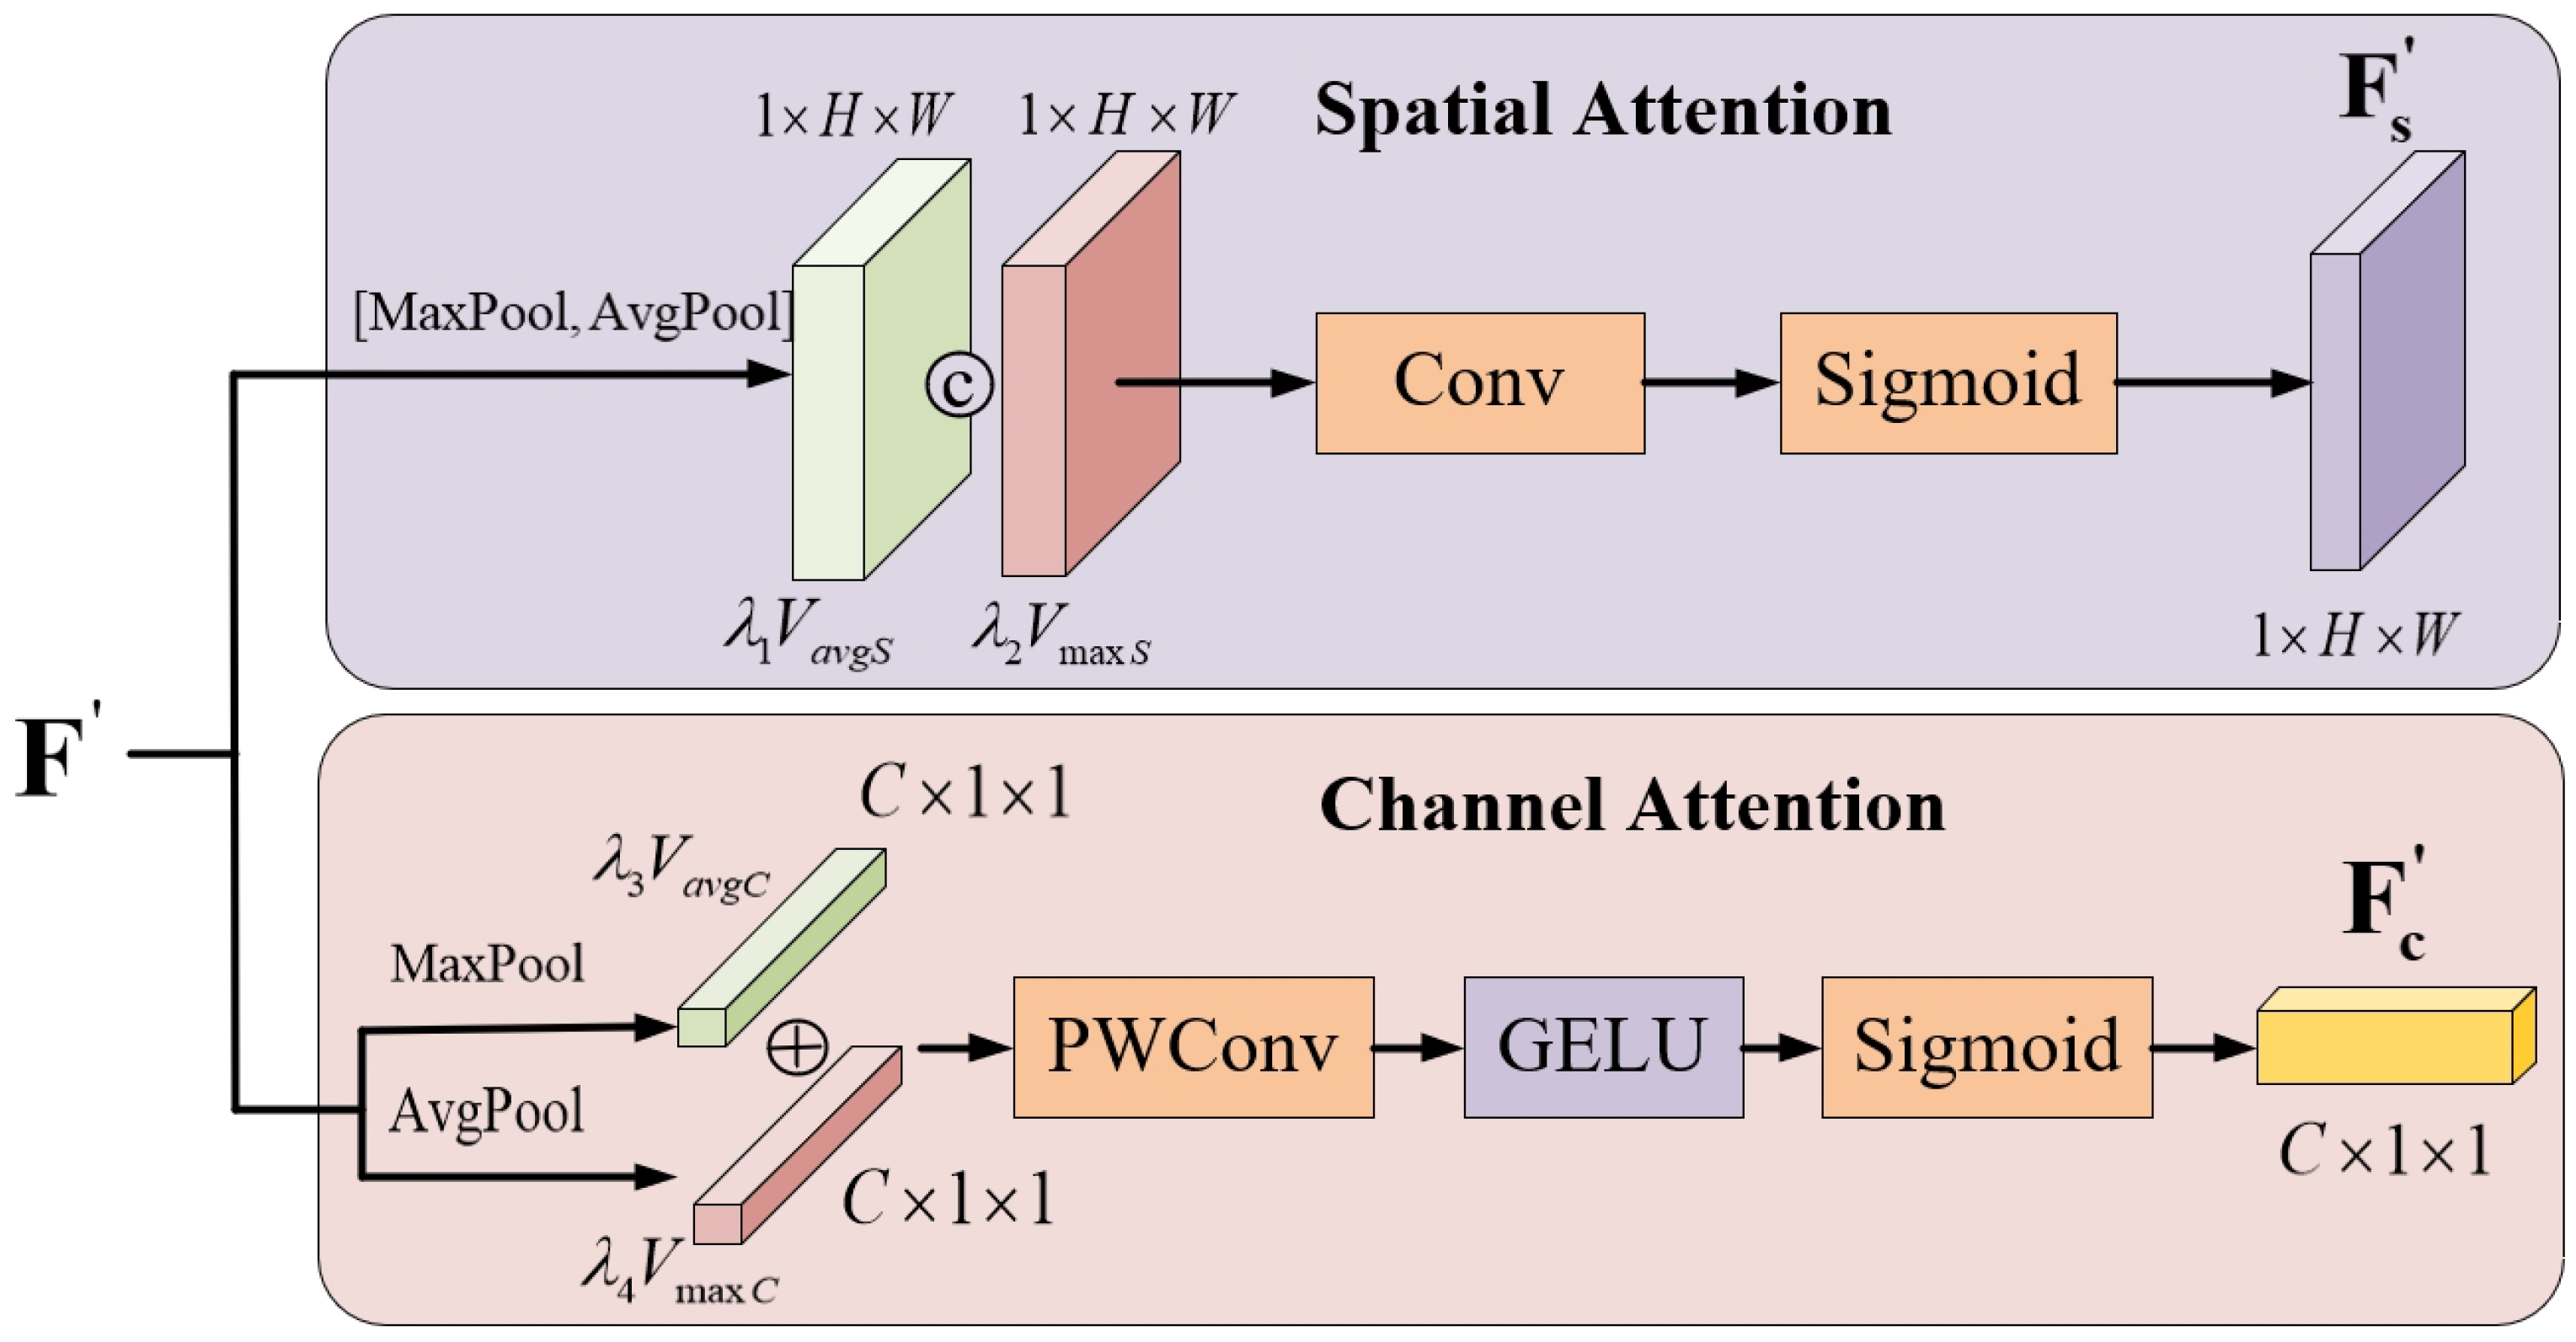
Following the CBAM design, in the channel attention branch, we apply global and max pooling operations along the spatial dimension to obtain channel descriptors. After fusing these descriptors using weighted summation, we perform dot-product convolution and sigmoid activation, as follows:
where the indices avg∗ and max∗ denote average and max pooling operations, respectively, and ∗ ∈ {C, S} represents the channel or spatial dimension. The coefficients λ1–λ12 are implemented as trainable scalar parameters and are optimized end-to-end together with the network weights, enabling dynamic balancing among multiple attention responses. Similarly, the spatial attention branch aggregates feature information using channel-wise average and max pooling. The pooled features are concatenated and passed through a 7 × 7 convolution, followed by a sigmoid activation to produce the spatial attention map. The processing of the two branches is illustrated in Figure 3.
Figure 3.
Illustration of spatial and channel attention branches within the AOSS. The channel attention branch aggregates global information through average and max pooling operations, followed by convolution and sigmoid activation, while the spatial attention branch captures spatial dependencies using channel-wise pooled descriptors and convolutional filtering. These attention responses are later combined through a state-aware gating mechanism to dynamically regulate feature propagation.
To integrate sequential dependencies into the attention process, we couple the attention maps with the latent state of the Mamba backbone through a state-aware gating mechanism, as follows:
where ⊙ denotes element-wise multiplication and X represents the input feature of the AOSS block. The gating mechanism adaptively integrates spatial and channel attention through a state-guided weighted modulation, where the gating weights are dynamically generated from the contextual state representation.
Unlike conventional attention mechanisms that combine spatial and channel attention using predefined serial or parallel structures, the proposed formulation enables the network to adaptively regulate their relative contributions according to the local state dynamics during feature propagation. Regions exhibiting consistent contextual patterns tend to produce smoother state responses, which bias the gating weights toward spatial attention to suppress redundant background activations. In contrast, regions with stronger state variations generate larger gating responses that emphasize channel-discriminative cues. This state-aware modulation alleviates the over-smoothing effect that may arise during state propagation and improves the model’s sensitivity to subtle structural discrepancies, particularly in densely built urban environments. As illustrated in the yellow region of Figure 1, the encoder consists of four hierarchical stages containing 2, 2, 9, and 2 AOSS blocks, respectively, which progressively extract multi-level feature representations for subsequent fusion and refinement.
2.2. Four-Branch Attention Fusion Module
Simple concatenation-based fusion often suppresses subtle bi-temporal differences, resulting in the loss of fine-grained variations. To address this limitation, we propose the FBAM, which explicitly captures spatial, channel, and cross-dimensional dependencies via a parallel multi-attention architecture.
As illustrated in Figure 2b, FBAM comprises four attention branches: spatial, channel, height–channel, and width–channel. The spatial and channel branches follow the standard CBAM-style operations [52]. In addition, two cross-dimensional branches are introduced to capture feature correlations along the height and width dimensions, thereby improving the sensitivity to subtle structural variations. Inspired by the rotation-based dependency modeling of triplet attention [53], FBAM extends this idea into a unified four-branch attention architecture that jointly models spatial, channel, and cross-dimensional interactions, enabling more effective fine-grained bi-temporal feature fusion.
Given the bi-temporal feature maps Xi,1 and Xi,2, they are concatenated along the channel dimension and fed into a lightweight convolutional integration module. The module consists of a depthwise convolution, followed by a pointwise convolution, layer normalization, and HSwish activation, producing an embedded representation . To model cross-dimensional dependencies, Ui is permuted along the height and width dimensions to obtain and , respectively. The corresponding attention responses are then computed from these rotated representations. Notably, the rotation operation corresponds to a deterministic permutation of spatial indices rather than a geometric transformation. Formally, for , the height-rotated and width-rotated tensors are defined as follows:
which can be efficiently implemented via tensor transposition without modifying the feature values. This permutation changes the direction of dependency modeling, enabling cross-dimensional interactions between spatial and channel dimensions, as follows:
where ⊕ denotes channel-wise concatenation and ⊗ denotes element-wise multiplication between the attention response and the input feature map. Unlike previous approaches that employ only a single cross-dimensional interaction, FBAM incorporates both height–channel and width–channel branches, enabling bidirectional modeling of structural correlations. Finally, the outputs of all four branches are concatenated to obtain the fused feature, as follows:
where , , , and denote the outputs of the spatial, channel, height–channel, and width–channel attention branches, respectively. This unified design integrates spatial–channel and cross-dimensional attention mechanisms within a single module, enabling comprehensive multi-scale feature interactions. By jointly modeling spatial, channel, and cross-dimensional dependencies, FBAM enhances the representation capability for fine-grained bi-temporal feature fusion.
2.3. MLP Decoder
To generate the final change detection map, a lightweight MLP-based decoder is employed to transform the fused bi-temporal representations into pixel-wise predictions. Specifically, the decoder first aligns the multi-scale fused features () to a unified spatial resolution of H/4 × W/4. The aligned features are then concatenated along the channel dimension, as follows:
A 1 × 1 convolution followed by batch normalization and ReLU activation is then applied for cross-scale channel integration, as follows:
The fused features are progressively upsampled by convolution and bilinear interpolation to restore spatial details, as follows:
The predicted probability map is obtained as
The final change detection mask is generated via
where η(·) denotes a binary thresholding operation.
2.4. Self-Refinement Module
Most existing CD methods rely on manually labeled annotations for supervision. However, the rich structural details and complex backgrounds in VHR images make manual annotation error-prone, especially for subtle or small-scale changes. To alleviate this issue, we propose the SRM that dynamically generates and refines pseudo-labels during training. The design of SRM is motivated by the observation that, in building CD scenarios, the spatial structure of changed objects is largely determined by the post-temporal image X2. In most VHR CD datasets, newly constructed or modified buildings are more clearly visible in the post-temporal image, and manual annotations are typically delineated around these structures. Therefore, the structural boundaries of change regions are often better preserved in X2 than in the bi-temporal difference alone. Based on this observation, SRM leverages the structural cues from the post-temporal image to refine noisy or incomplete change annotations.
SRM does not attempt to detect changes from a single image. Instead, it leverages the structural consistency of the post-temporal image to guide the refinement of supervision signals derived from bi-temporal predictions. This structure-guided refinement facilitates the recovery of missed change regions and suppresses annotation noise caused by coarse polygon labeling, boundary ambiguity, or temporal misalignment. The generated pseudo-labels are iteratively updated using the post-temporal image X2 through a momentum-driven auxiliary model, which progressively improves the reliability of supervision without altering the original ground-truth labels. As illustrated in the blue area of Figure 1, SRM runs in parallel with the main branch and is activated only during training.
Specifically, the post-temporal image X2 is fed into an AOSS-based Mamba encoder to generate a soft probability map. The resulting prediction is then thresholded and combined with the ground-truth labels to construct the refined supervision signal, as follows:
where GT denotes the manually annotated ground-truth labels, and ∨ represents the element-wise logical OR operation between two binary masks. The momentum model modelm maintains a slowly updated copy of the main network and is used to generate stable pseudo-labels during training, as follows:
where θo and θm denote the parameters of the main and momentum models, respectively, and m ∈ [0, 1) represents the momentum coefficient. Unlike conventional EMA-based or teacher–student frameworks that primarily enforce global consistency, SRM is tightly integrated with the MSRNet architecture. As a result, the pseudo-label refinement process can leverage the spatial and sequential context encoded by the AOSS and FBAM modules, enabling adaptive correction of mislabeled or missing regions during training.
2.5. Loss Function
CD is typically formulated as a pixel-level binary segmentation problem. To optimize segmentation performance, we adopt a hybrid loss function that combines Dice loss and BCEWithLogits loss. Dice loss encourages better overlap between the predicted change regions and the refined pseudo-labels, while BCEWithLogits loss improves pixel-wise classification accuracy and stabilizes the training process. The Dice loss is defined as
where ϵ is a small constant set to 10−6 for numerical stability. The BCEWithLogits loss is defined as
The final training loss is given by
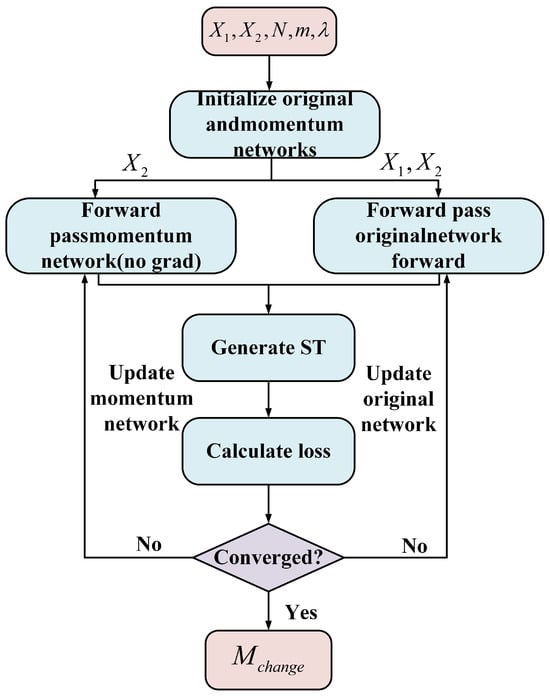
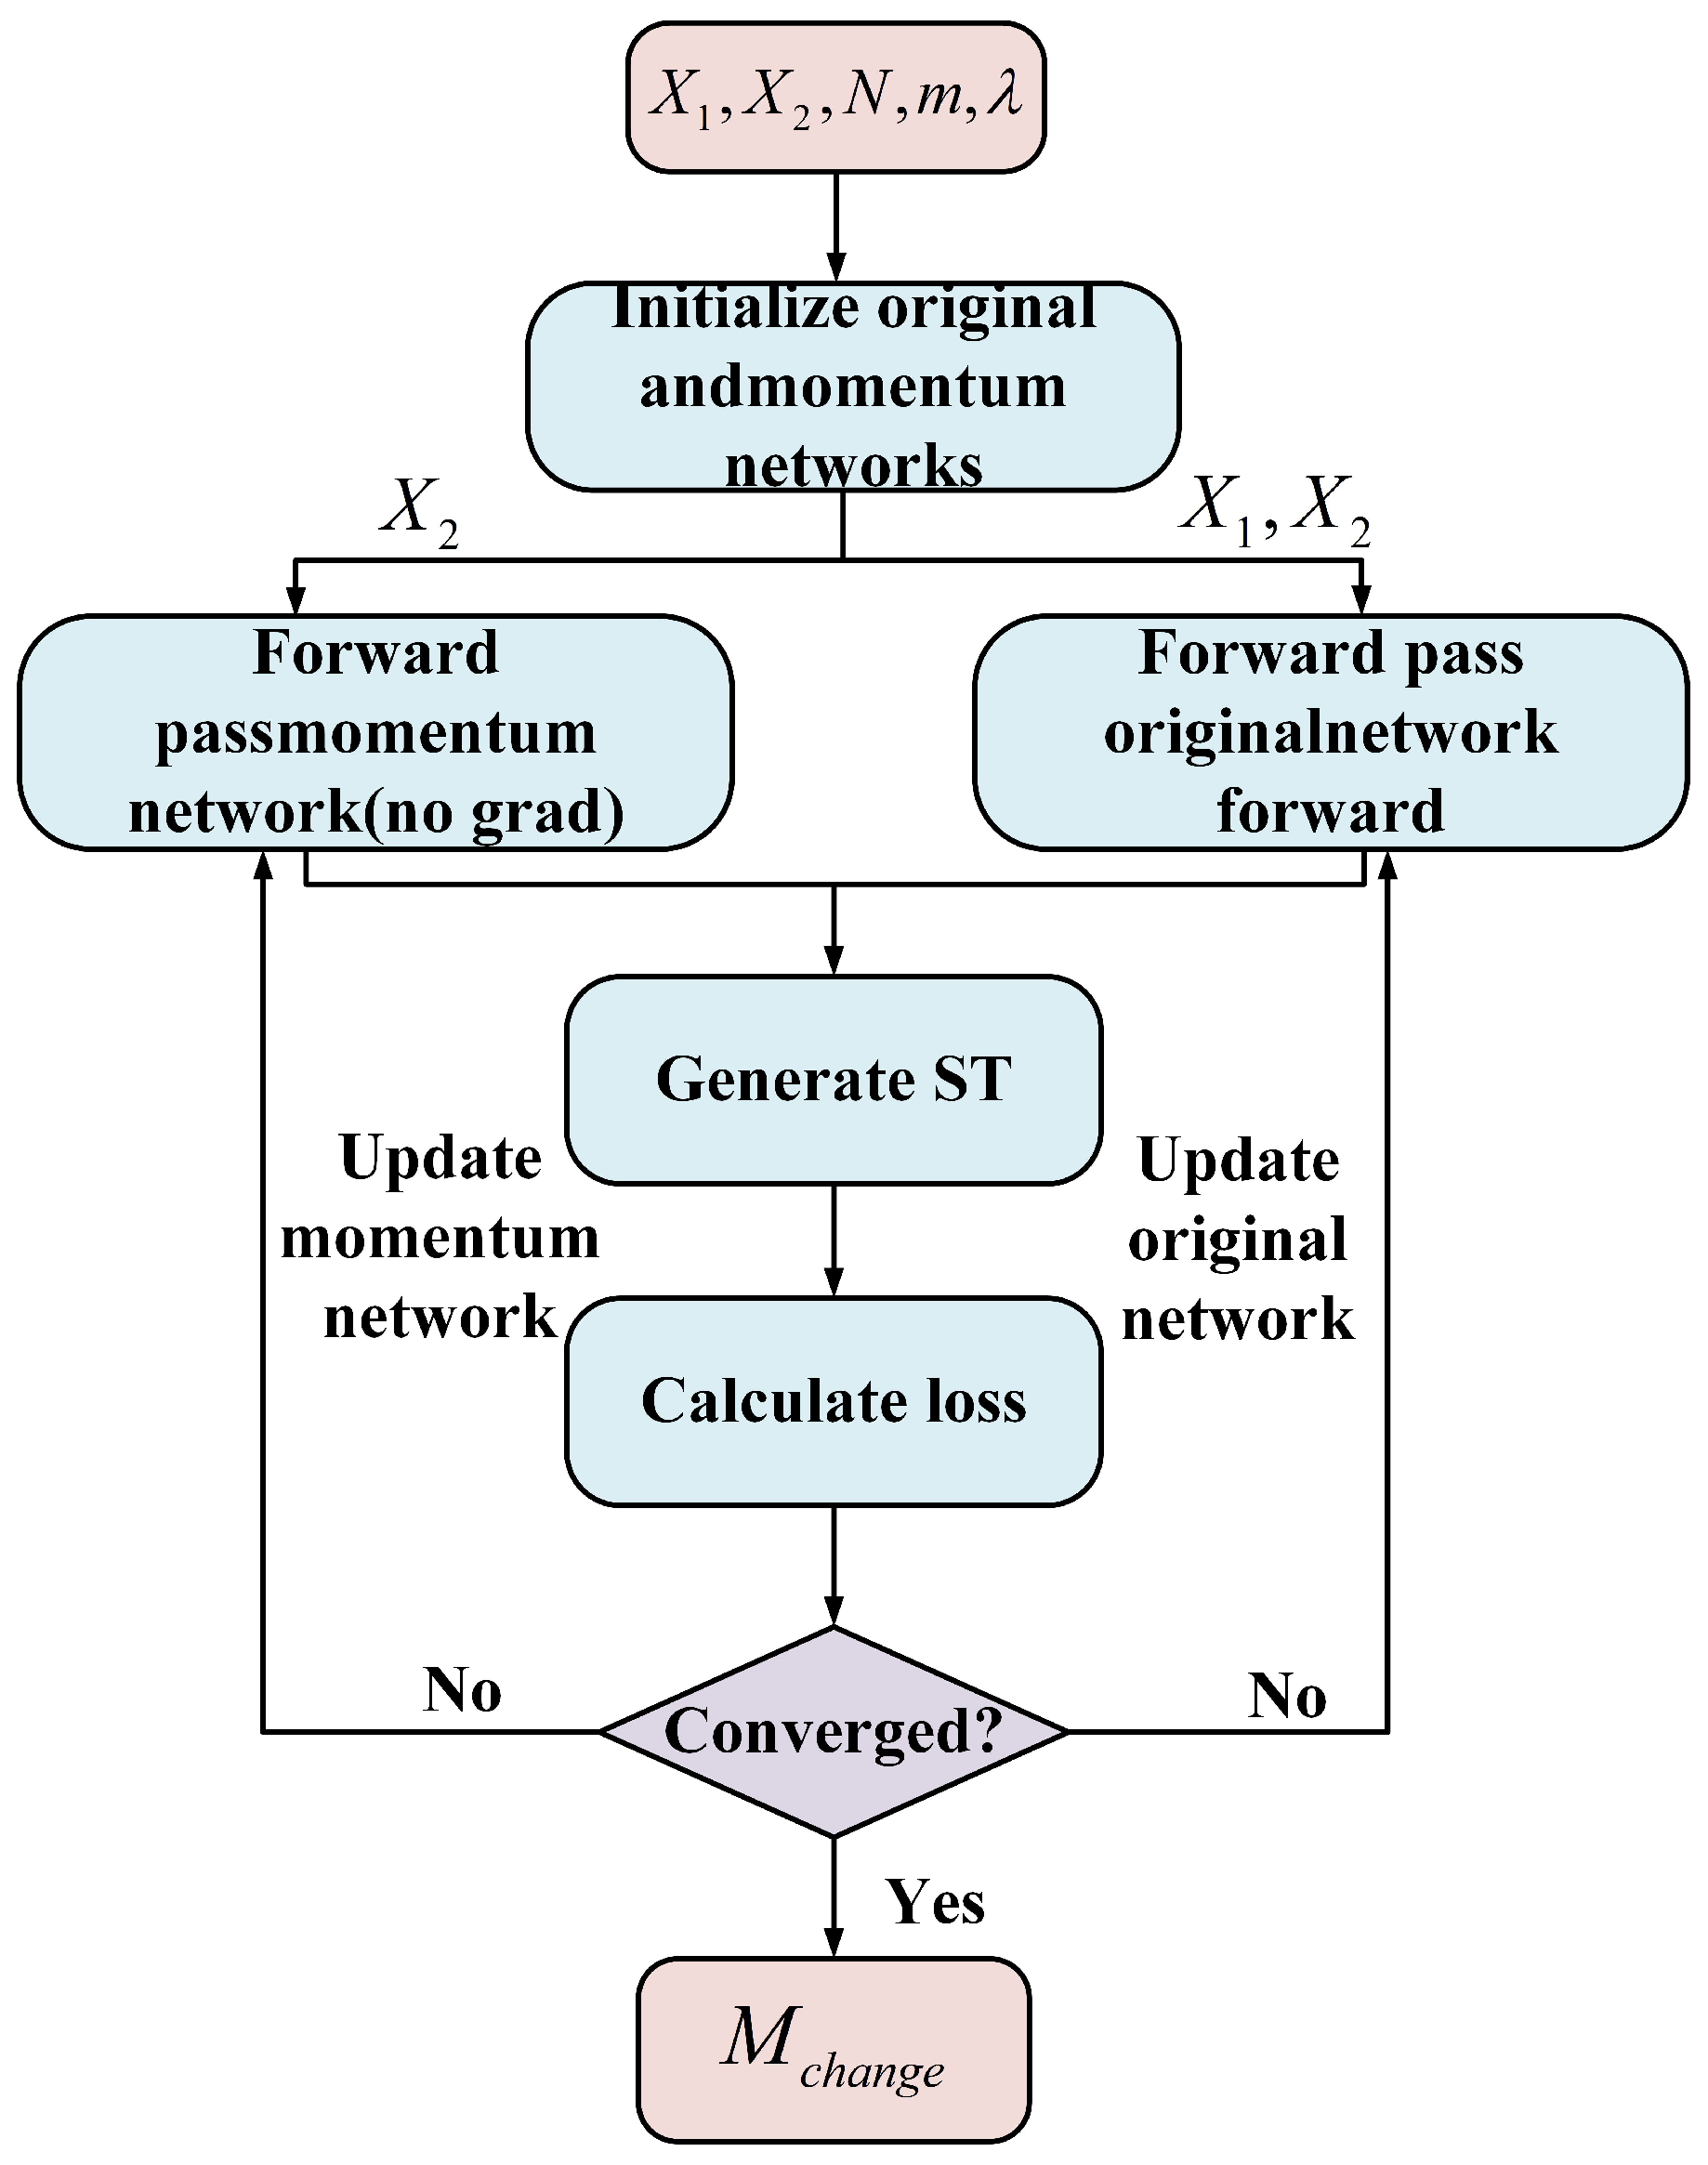
As illustrated in Figure 4, the overall training pipeline is summarized in Algorithm 1. Given the bi-temporal inputs, the main network is optimized via backpropagation, while the momentum model is updated using a momentum-based parameter update. Pseudo-labels are generated according to Equation (15). The loss is then computed to iteratively update the network parameters until convergence. This joint optimization strategy allows SRM to progressively refine pseudo-labels while maintaining stable supervision throughout training.
| Algorithm 1 Optimization process of MSRNet |
|
Figure 4.
Optimization flowchart of the MSRNet training process. During training, bi-temporal images are processed by both the main network and the momentum encoder. The momentum encoder generates pseudo-labels based on the post-temporal image, which are then combined with the original ground truth to produce refined supervision signals. The refined labels are used to compute the training loss, and the parameters of the main network are updated through backpropagation. Meanwhile, the momentum encoder is updated using an exponential moving average of the main network parameters.
3. Experiment
3.1. Datasets and Experimental Setting
Datasets and preprocessing:
LEVIR-CD [54] is a VHR change detection dataset containing 637 pairs of RGB remote sensing images with a spatial resolution of 0.5 m. Following the commonly used protocol, the dataset is divided into 445 image pairs for training, 64 for validation, and 128 for testing, corresponding approximately to a 7:1:2 split. WHU-CD [55] is an UVHR dataset consisting of a pair of large-scale RGB images with a spatial resolution of 0.075 m and dimensions of 32, 507 × 15, 354 pixels. The images are cropped into non-overlapping 256 × 256 patches, which are then divided into training, validation, and test sets using the same 7:1:2 ratio. All labels are binarized. During training, standard data augmentation techniques are applied, including random horizontal and vertical flipping, random transposition, normalization to [0, 1], and random swapping of X1 and X2.
Training settings: Models are optimized using the AdamW optimizer (weight decay 1 × 10⁻³, β1 = 0.9, β2 = 0.999). The initial learning rate is set to 1 × 10⁻³, selected from {1 × 10⁻⁴, 5 × 10⁻⁴, 1 × 10⁻³} based on validation performance. Training is conducted for 150 epochs with a batch size of 2 for training and 4 for validation and testing. The learning rate follows a cosine annealing schedule with 1000 warm-up steps. Evaluation is performed every 5 epochs after epoch 10. Mixed precision training and gradient clipping (maximum norm of 20) are applied to stabilize optimization. A fixed random seed (42) is used to ensure reproducibility. In the implementation, all coefficients λ1–λ12 are initialized to 1.0 and jointly optimized with the other network parameters during training.
To mitigate the impact of annotation omissions and inaccuracies, minor adjustments were made to the training–validation split. Fifteen images with evident annotation inconsistencies in the LEVIR-CD training set and seven images in the WHU-CD training set were corrected and moved to the validation set. A small number of imperfectly annotated samples (approximately 5–12 images) were intentionally retained in the training set to assess robustness. This refinement reduces the influence of severe annotation errors while preserving realistic label noise during training, particularly for the proposed self-refinement module. Following common practice, the official test sets are strictly reserved for the final evaluation, while the validation set is used only for ablation studies and hyperparameter tuning.
3.2. Ablation Experiments
To investigate the contribution of each proposed module, ablation experiments were conducted on the LEVIR-CD and WHU-CD datasets. Table 1 summarizes the configurations of the six variants. MSRNet-1 and MSRNet-2 include only the AOSS and FBAM modules, respectively. MSRNet-3 combines AOSS and FBAM. MSRNet-4 incorporates SRM alone, while MSRNet-5 integrates SRM with FBAM. Finally, the full MSRNet integrates all three modules.
Table 1.
Configuration of MSRNet and its ablation variants. Each variant selectively enables or disables the proposed modules, including the AOSS encoder, the FBAM feature fusion module, and the SOM self-refinement mechanism. Here, ✓ denotes that the module is enabled, and × denotes that the module is disabled.
Table 2 and Table 3 report the ablation results of MSRNet and its five variants on the LEVIR-CD and WHU-CD datasets. Compared with the baseline, each individual module brings noticeable performance improvements, demonstrating its effectiveness. Specifically, MSRNet-1 and MSRNet-2 indicate that AOSS and FBAM enhance spatial representation and bi-temporal feature interaction, respectively, while MSRNet-4 shows that SRM effectively refines supervision by suppressing noisy labels. When these modules are combined, the performance gains become more pronounced. MSRNet-3 and MSRNet-5 achieve higher F1 and IoU scores, highlighting the complementary roles of AOSS, FBAM, and SRM. The full MSRNet achieves the best overall results (F1 = 92.21, IoU = 85.01 on LEVIR-CD; F1 = 92.41, IoU = 85.91 on WHU-CD) with only a slight increase in inference time (≈148 ms/pair vs. ≈130 ms/pair), demonstrating an effective trade-off between accuracy and efficiency.
Table 2.
Ablation results of MSRNet variants on the LEVIR-CD dataset. The table reports quantitative performance comparisons among different model variants. The best results in each column are highlighted in bold.
Table 3.
Ablation results of MSRNet variants on the WHU-CD dataset. Similar to Table 2, this table evaluates the contributions of different modules on the WHU-CD dataset. The best results in each column are highlighted in bold.
The momentum coefficient m in SRM determines the update rate of the pseudo-label estimator and affects the stability of pseudo-label generation. To analyze its influence, MSRNet is evaluated with different values of m ∈ {0.7, 0.8, 0.9, 0.95} on the LEVIR-CD and WHU-CD datasets. As shown in Table 4, the proposed method maintains stable performance across a wide range of momentum values. The best results are consistently achieved at m = 0.9, yielding F1-scores of 92.21 and 92.41 and IoU scores of 85.01 and 85.91 on LEVIR-CD and WHU-CD, respectively. Smaller values of m make pseudo-label updates sensitive to noisy predictions, whereas larger values slow the adaptation process. These results demonstrate that SRM is robust to the choice of the momentum coefficient.
Table 4.
Sensitivity analysis of the momentum coefficient m in the SRM module. The table evaluates the influence of different momentum values on pseudo-label refinement performance across the LEVIR-CD and WHU-CD datasets. The best results in each column are highlighted in bold.
The effect of different confidence thresholds on label refinement is evaluated in Table 5 and Table 6. When the threshold is below 0.80, excessive noisy samples are introduced, leading to performance degradation. In contrast, thresholds above 0.85 filter out useful samples and weaken the refinement effect. The best performance is achieved at δ = 0.85 on both datasets.
Table 5.
Impact of confidence threshold δ on model performance for the LEVIR-CD dataset. The results demonstrate how the threshold influences label refinement quality and the final detection accuracy. The best results in each column are highlighted in bold.
Table 6.
Impact of confidence threshold δ on model performance for the WHU-CD dataset. Similar to Table 5, this table analyzes the sensitivity of the proposed method to the pseudo-label confidence threshold on the WHU-CD dataset. The best results in each column are highlighted in bold.
Table 7 compares MSRNet with different backbone architectures. The variant based on ResNet has the smallest model size (25.83 M parameters and 27.54 G FLOPs). However, its reliance on local convolution operations limits the modeling of long-range dependencies, which constrains detection accuracy. Replacing the backbone with Swin Transformer improves performance on the LEVIR-CD dataset, but its window-based self-attention restricts the perception of fine-grained spatial details. In addition, it introduces higher computational cost (42.40 M parameters and 58.97 G FLOPs), which leads to less stable performance on the WHU-CD dataset. In contrast, the variant using Mamba achieves the best trade-off between accuracy and efficiency, consistently delivering superior results on both datasets with only 32.66 M parameters and 44.26 G FLOPs. This advantage stems from Mamba’s selective state-space modeling mechanism, which efficiently integrates global context with fine-grained spatial details. By modeling long-range dependencies with linear complexity while preserving local receptive fields, Mamba enables accurate and efficient CD.
Table 7.
Performance comparison of different backbone architectures used in MSRNet. The table compares models using different backbone networks in terms of parameter size, computational complexity (FLOPs), and detection accuracy on both datasets. The results show that the Mamba backbone achieves the best balance between efficiency and performance. The best results in each column are highlighted in bold.
Table 8 and Table 9 present the ablation results of the proposed Feature Bi-temporal Attention Module on the LEVIR-CD and WHU-CD datasets. FBAM-hc-cw denotes the variant without the spatial channel interaction branch. FBAM-hc and FBAM-cw correspond to removing the height-axis and width-axis transformations within the spatial channel interaction branch, respectively. The complete FBAM consistently achieves the best performance, with F1-scores exceeding 92%, IoU values above 85%, and OA surpassing 99%. Removing either the height or width branch results in a slight performance decline. When both branches or the entire module is removed, the degradation becomes more pronounced, indicating reduced detection performance. These results demonstrate that each branch of FBAM contributes positively to the overall performance. The four-branch design effectively enhances the network’s ability to capture subtle temporal variations while maintaining high overall accuracy, particularly for detecting small-scale building changes.
Table 8.
Ablation study of FBAM components on the LEVIR-CD dataset. This table evaluates the contributions of different branches within the FBAM module, including height-channel and width-channel interaction mechanisms. Removing individual branches leads to performance degradation, indicating that each branch contributes to improved feature representation. The best results in each column are highlighted in bold.
Table 9.
Ablation study of FBAM components on the WHU-CD dataset. This table provides the corresponding FBAM ablation results on the WHU-CD dataset, further confirming the effectiveness of the multi-branch attention fusion design. The best results in each column are highlighted in bold.
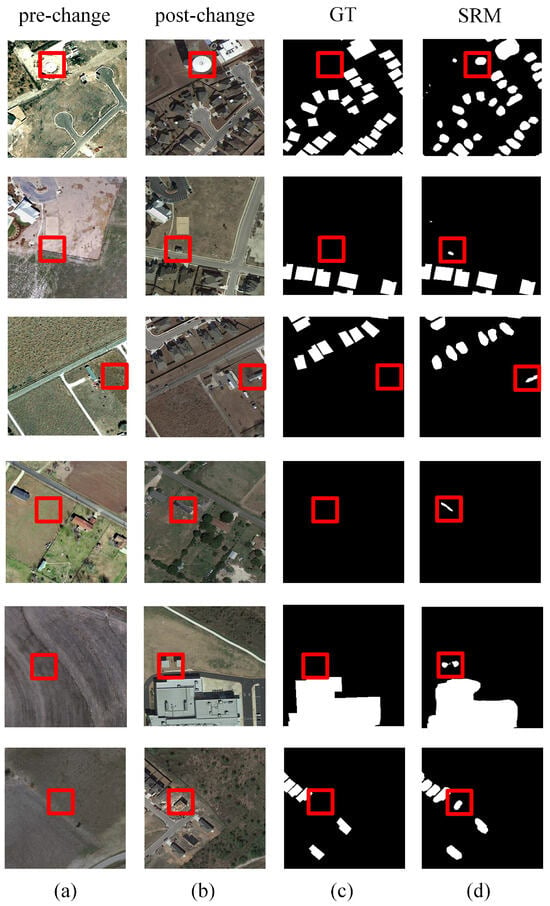
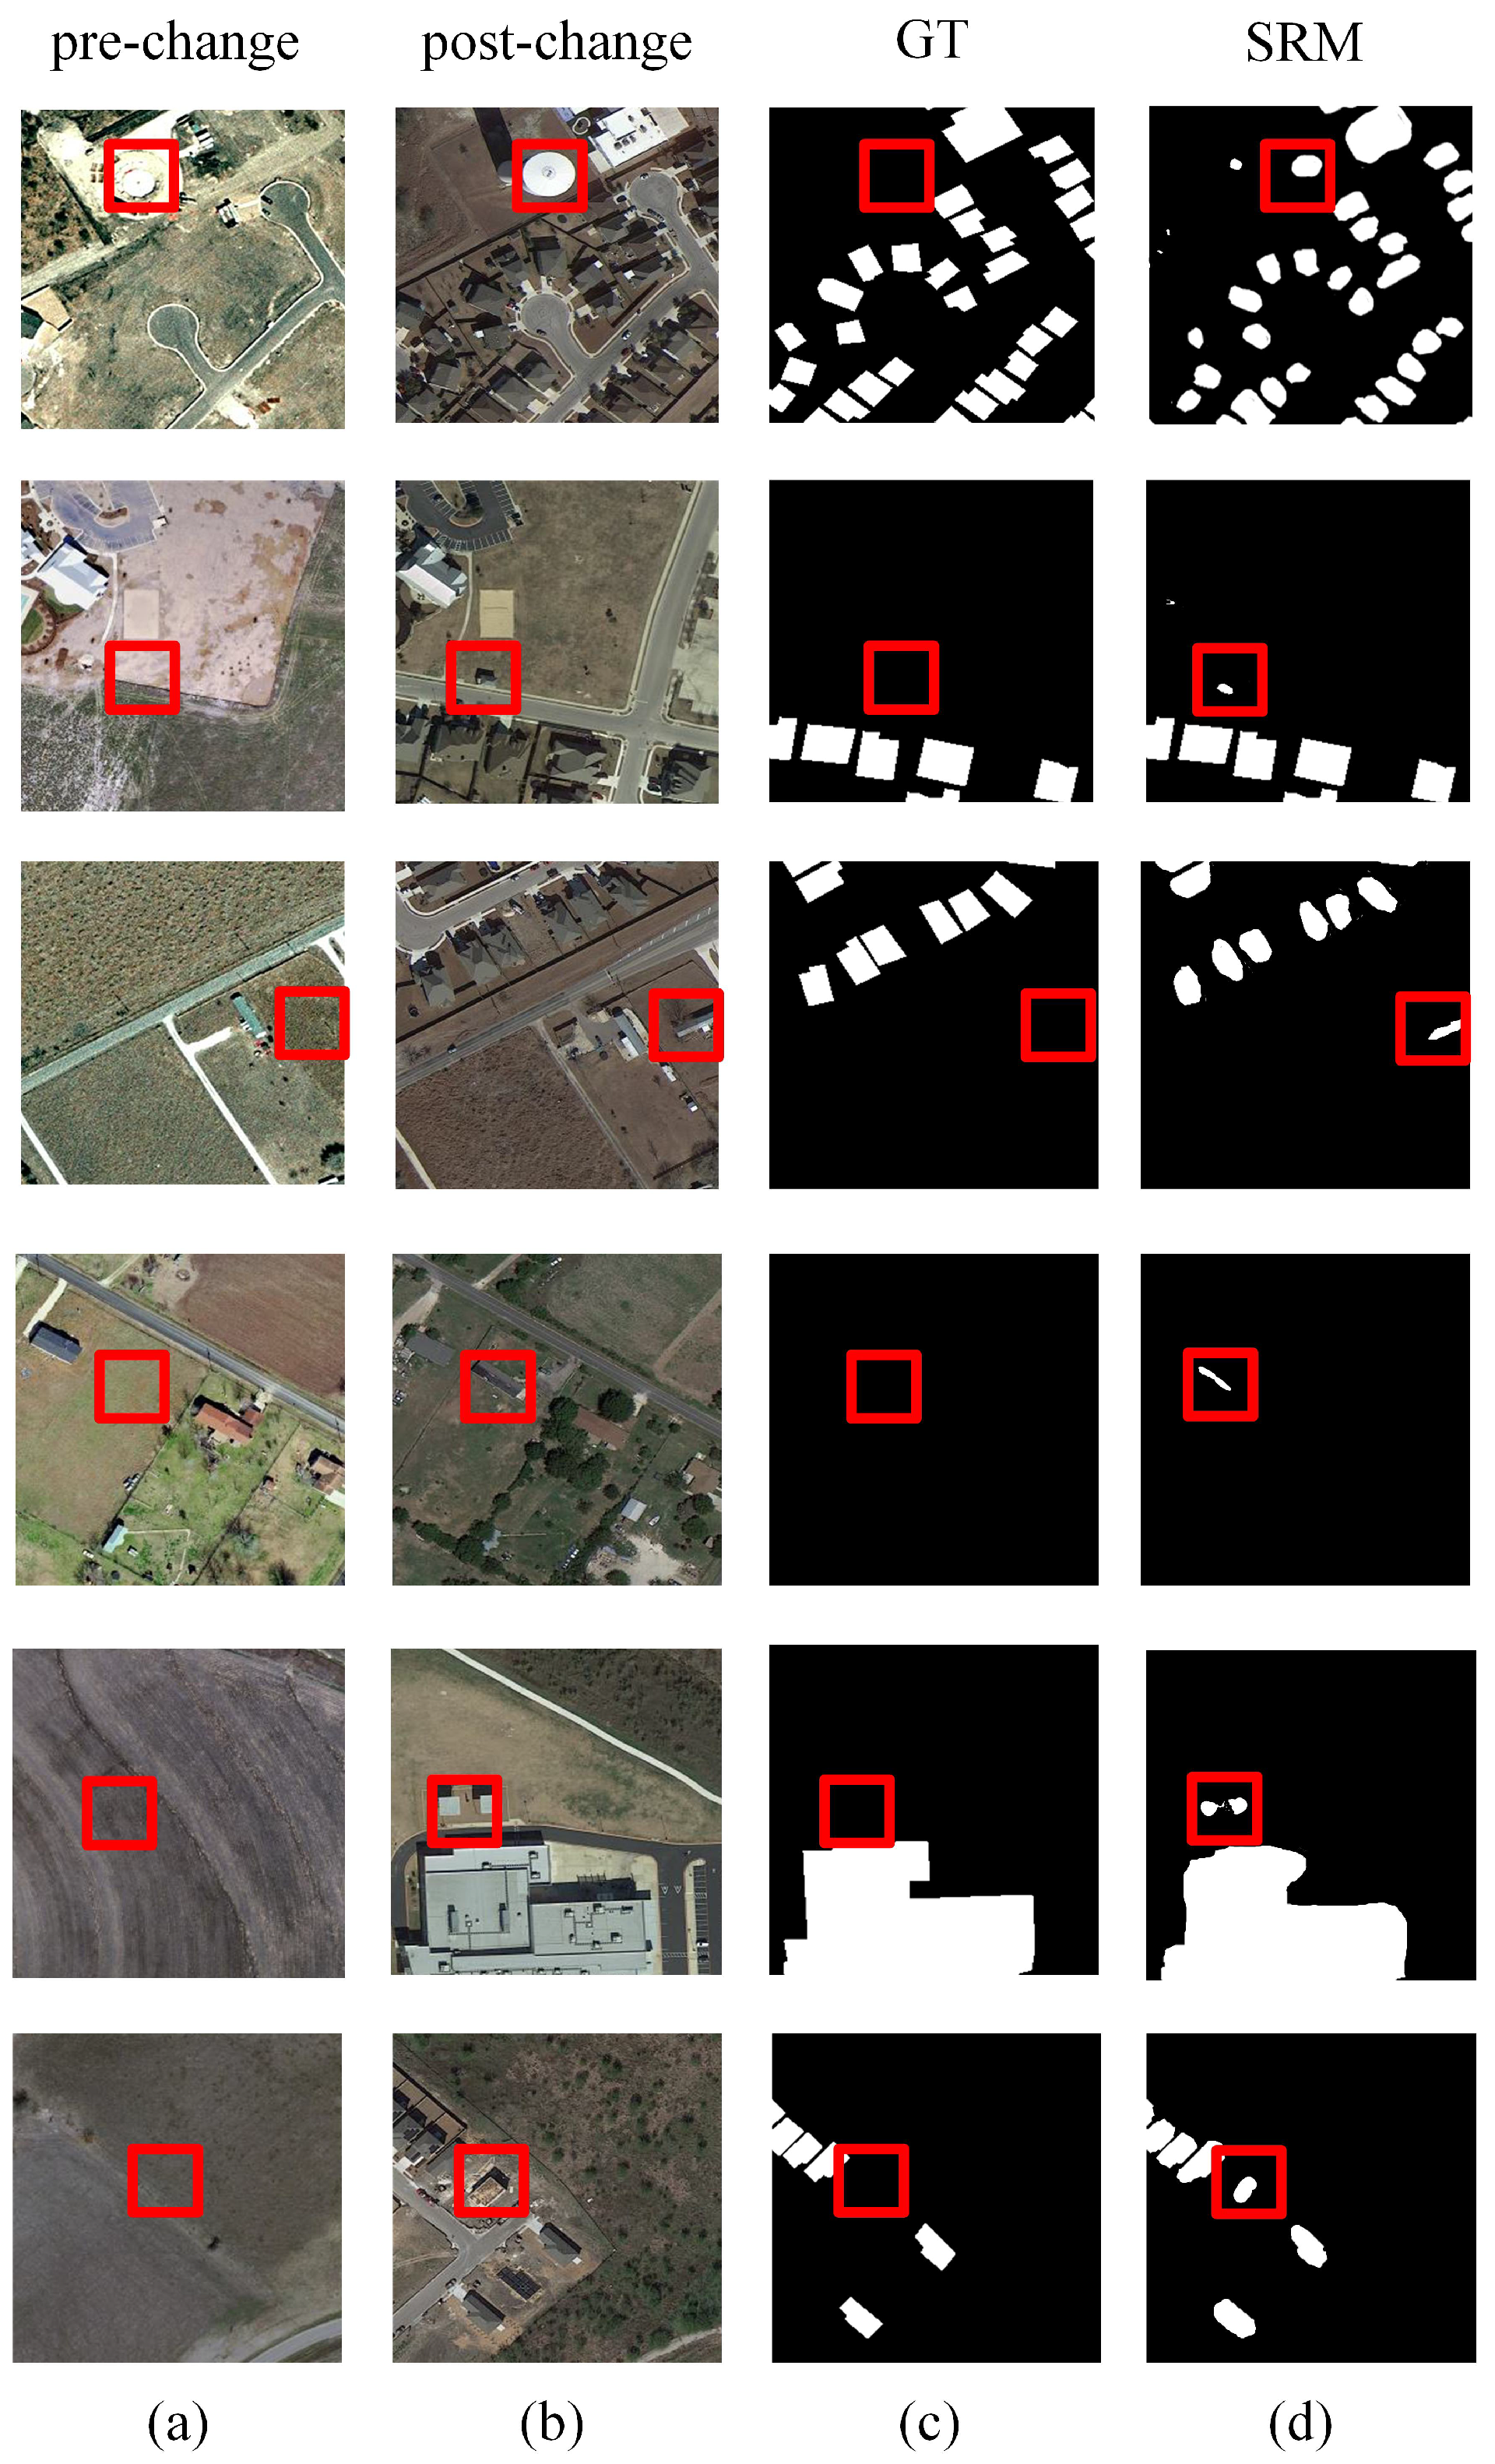
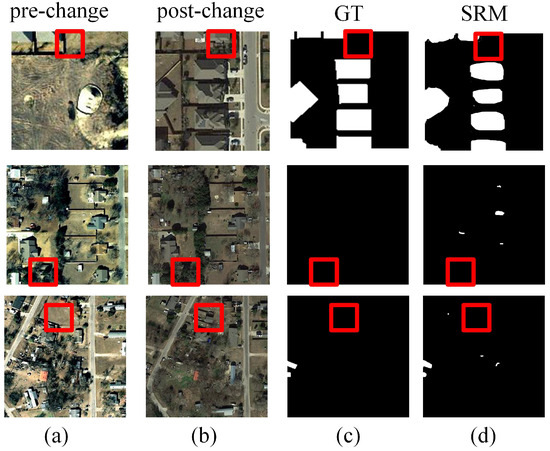
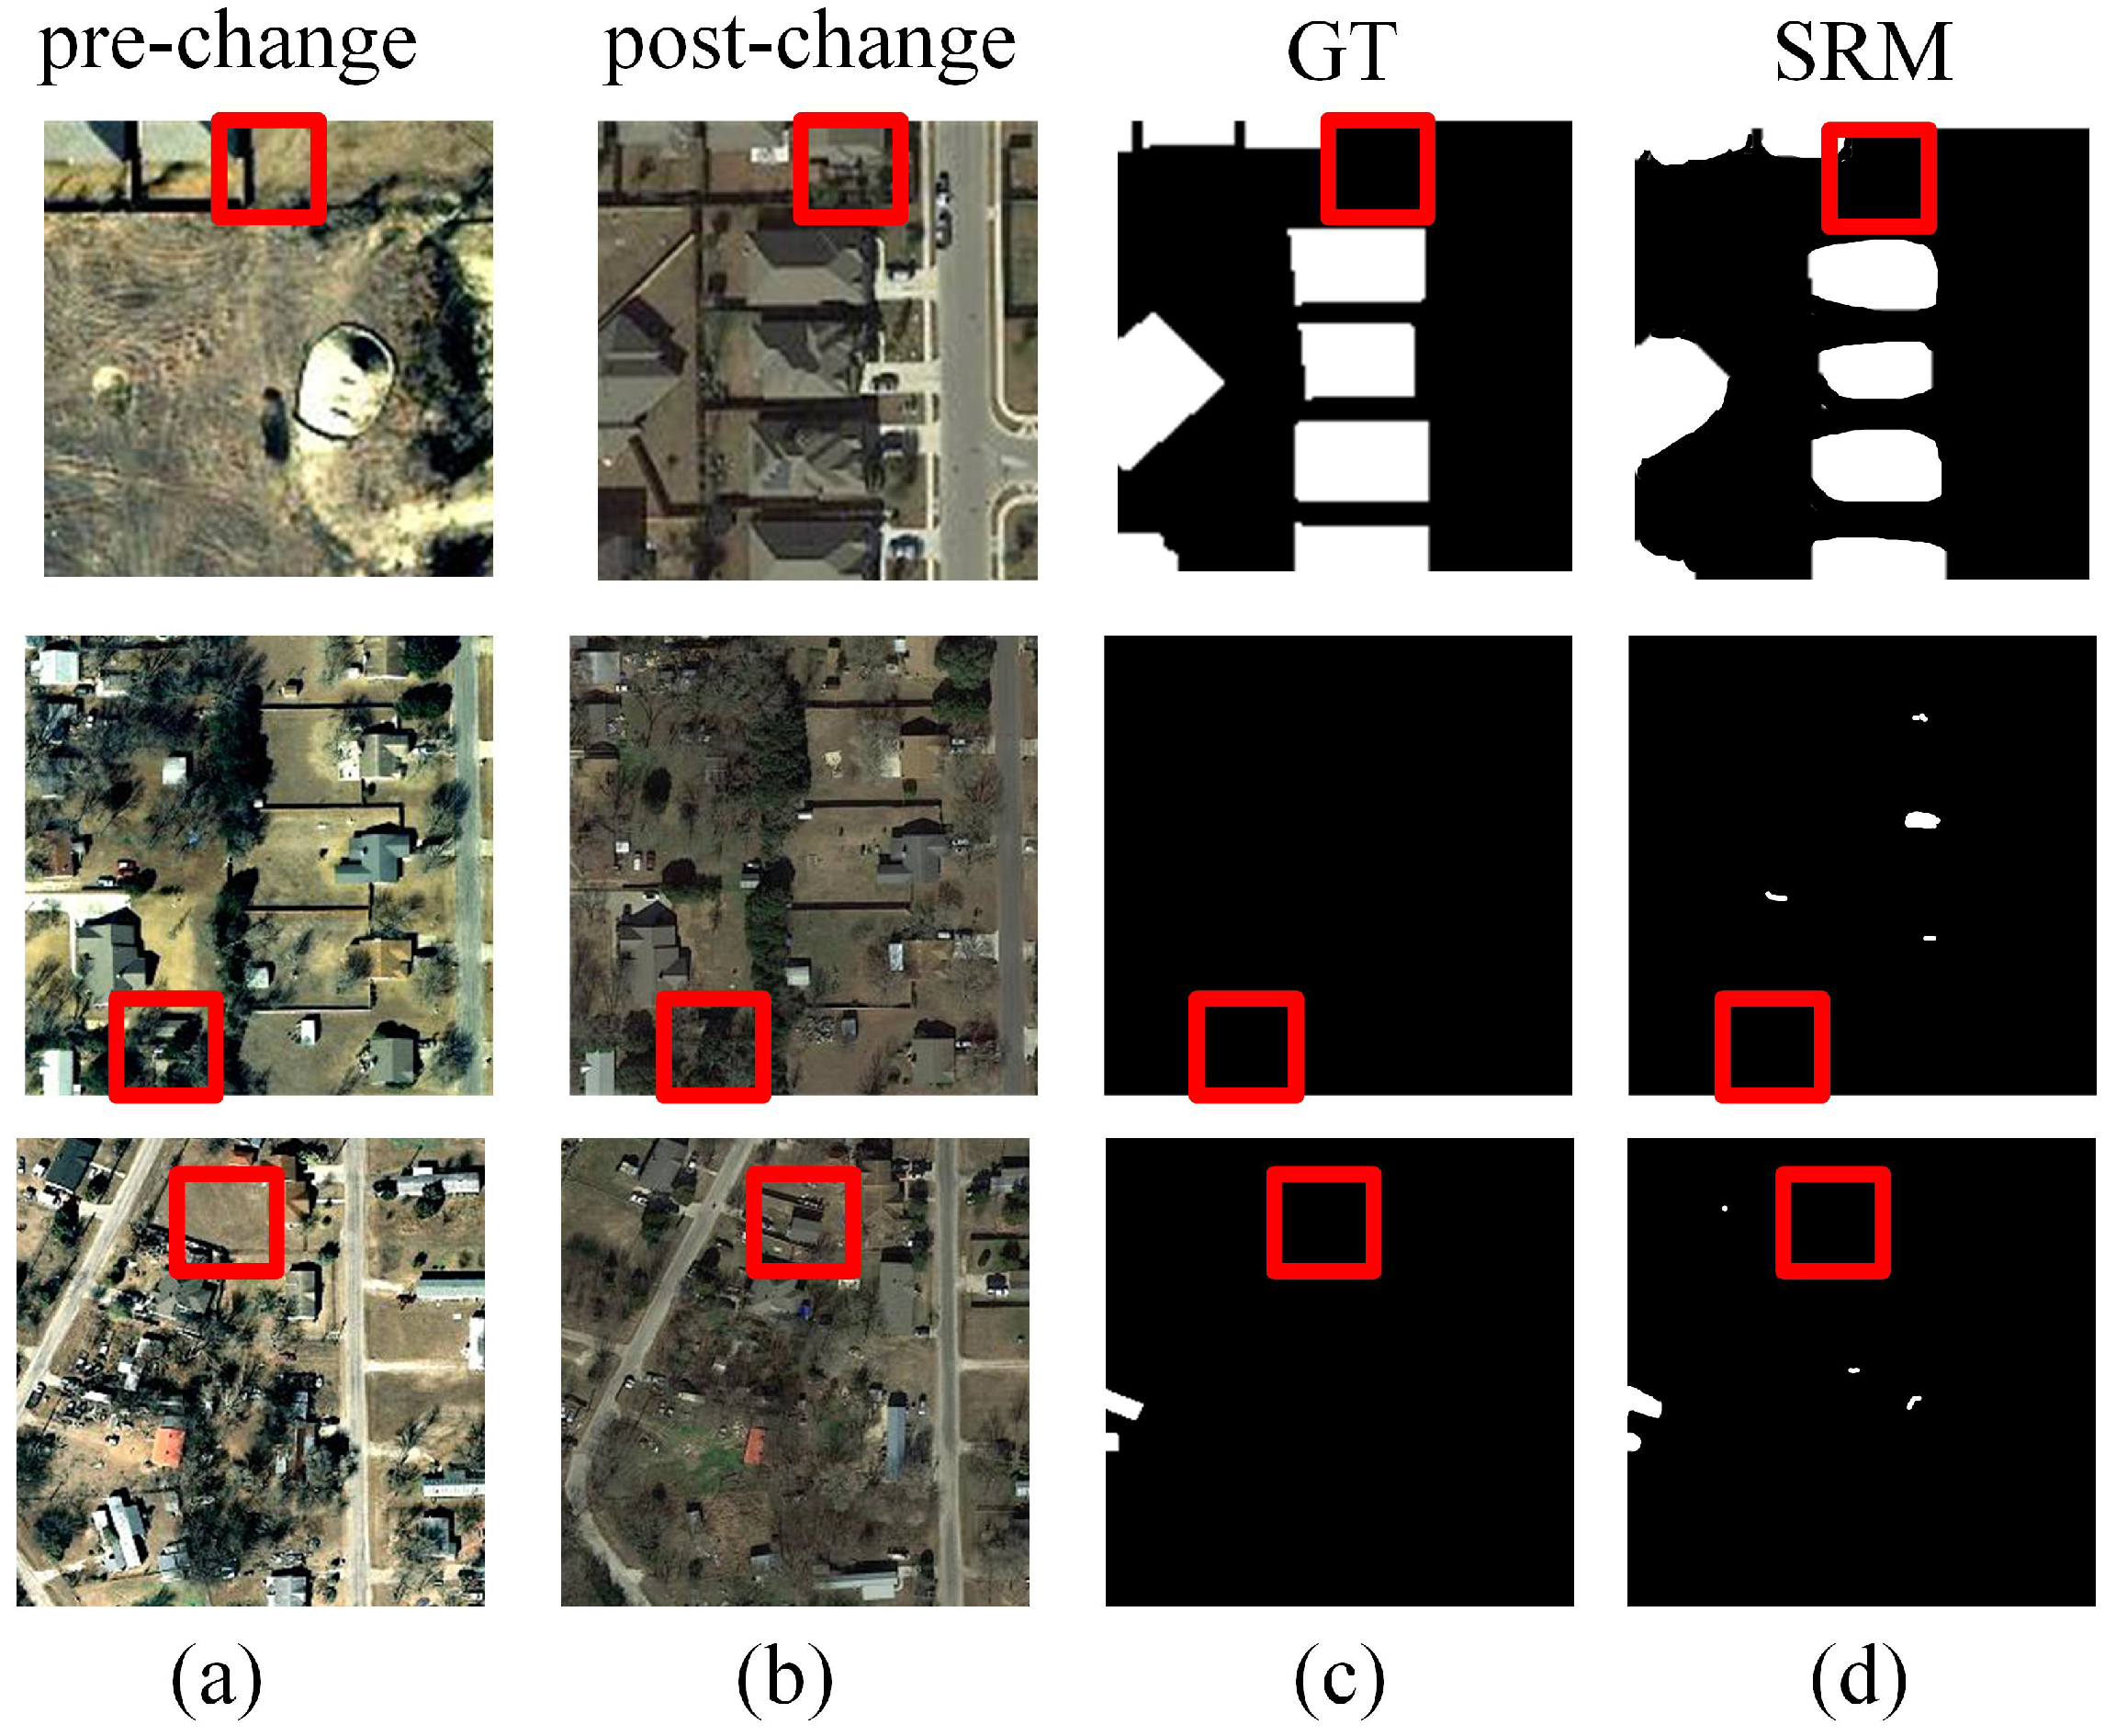
To validate the effectiveness of SRM, Figure 5 illustrates representative examples where objects missing from the ground-truth annotations are successfully recovered. The red boxes indicate regions with incomplete labels. Small structures, such as storage tanks and buildings, are occasionally omitted in the original annotations due to background interference, low contrast, or subtle structural characteristics. By performing adaptive pseudo-label refinement, SRM compensates for these omissions and enhances the reliability of supervision, thereby improving model learning.
Figure 5.
Visualization of pseudo-label refinement generated by the SRM module. (a) Pre-change image; (b) Post-change image; (c) Ground truth; (d) Binary prediction of the model with the SRM module. Red boxes indicate regions where objects are missing in the original annotations. Through iterative pseudo-label generation and refinement, the SRM module successfully recovers missing structures such as small buildings or storage tanks, improving label completeness and providing more reliable supervision during training.
To further evaluate the robustness and cross-scene generalization capability of the proposed method, additional experiments are conducted on the CLCD and DSIFN-CD datasets. Unlike LEVIR-CD and WHU-CD, which mainly focus on urban building expansion, these datasets cover more diverse geographic environments and more complex background distributions. Specifically, CLCD contains large-scale land-cover transformation scenes, where the proposed method achieves an F1-score of 77.36% and an IoU of 63.06%. In contrast, DSIFN-CD focuses on building changes under complex surroundings such as transportation infrastructure, on which the model obtains an F1-score of 62.81% and an IoU of 45.78%. The quantitative results are reported in Table 10. Despite significant variations in spatial patterns and scene complexity across datasets, the proposed method maintains stable detection performance. These results demonstrate its strong robustness and cross-scene generalization capability.
Table 10.
Cross-dataset generalization evaluation of MSRNet. The table reports detection performance on the CLCD and DSIFN-CD datasets, which contain different change patterns and environmental conditions. The results demonstrate the robustness and generalization capability of the proposed method across diverse scenes.
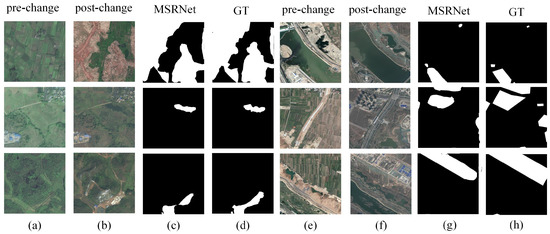
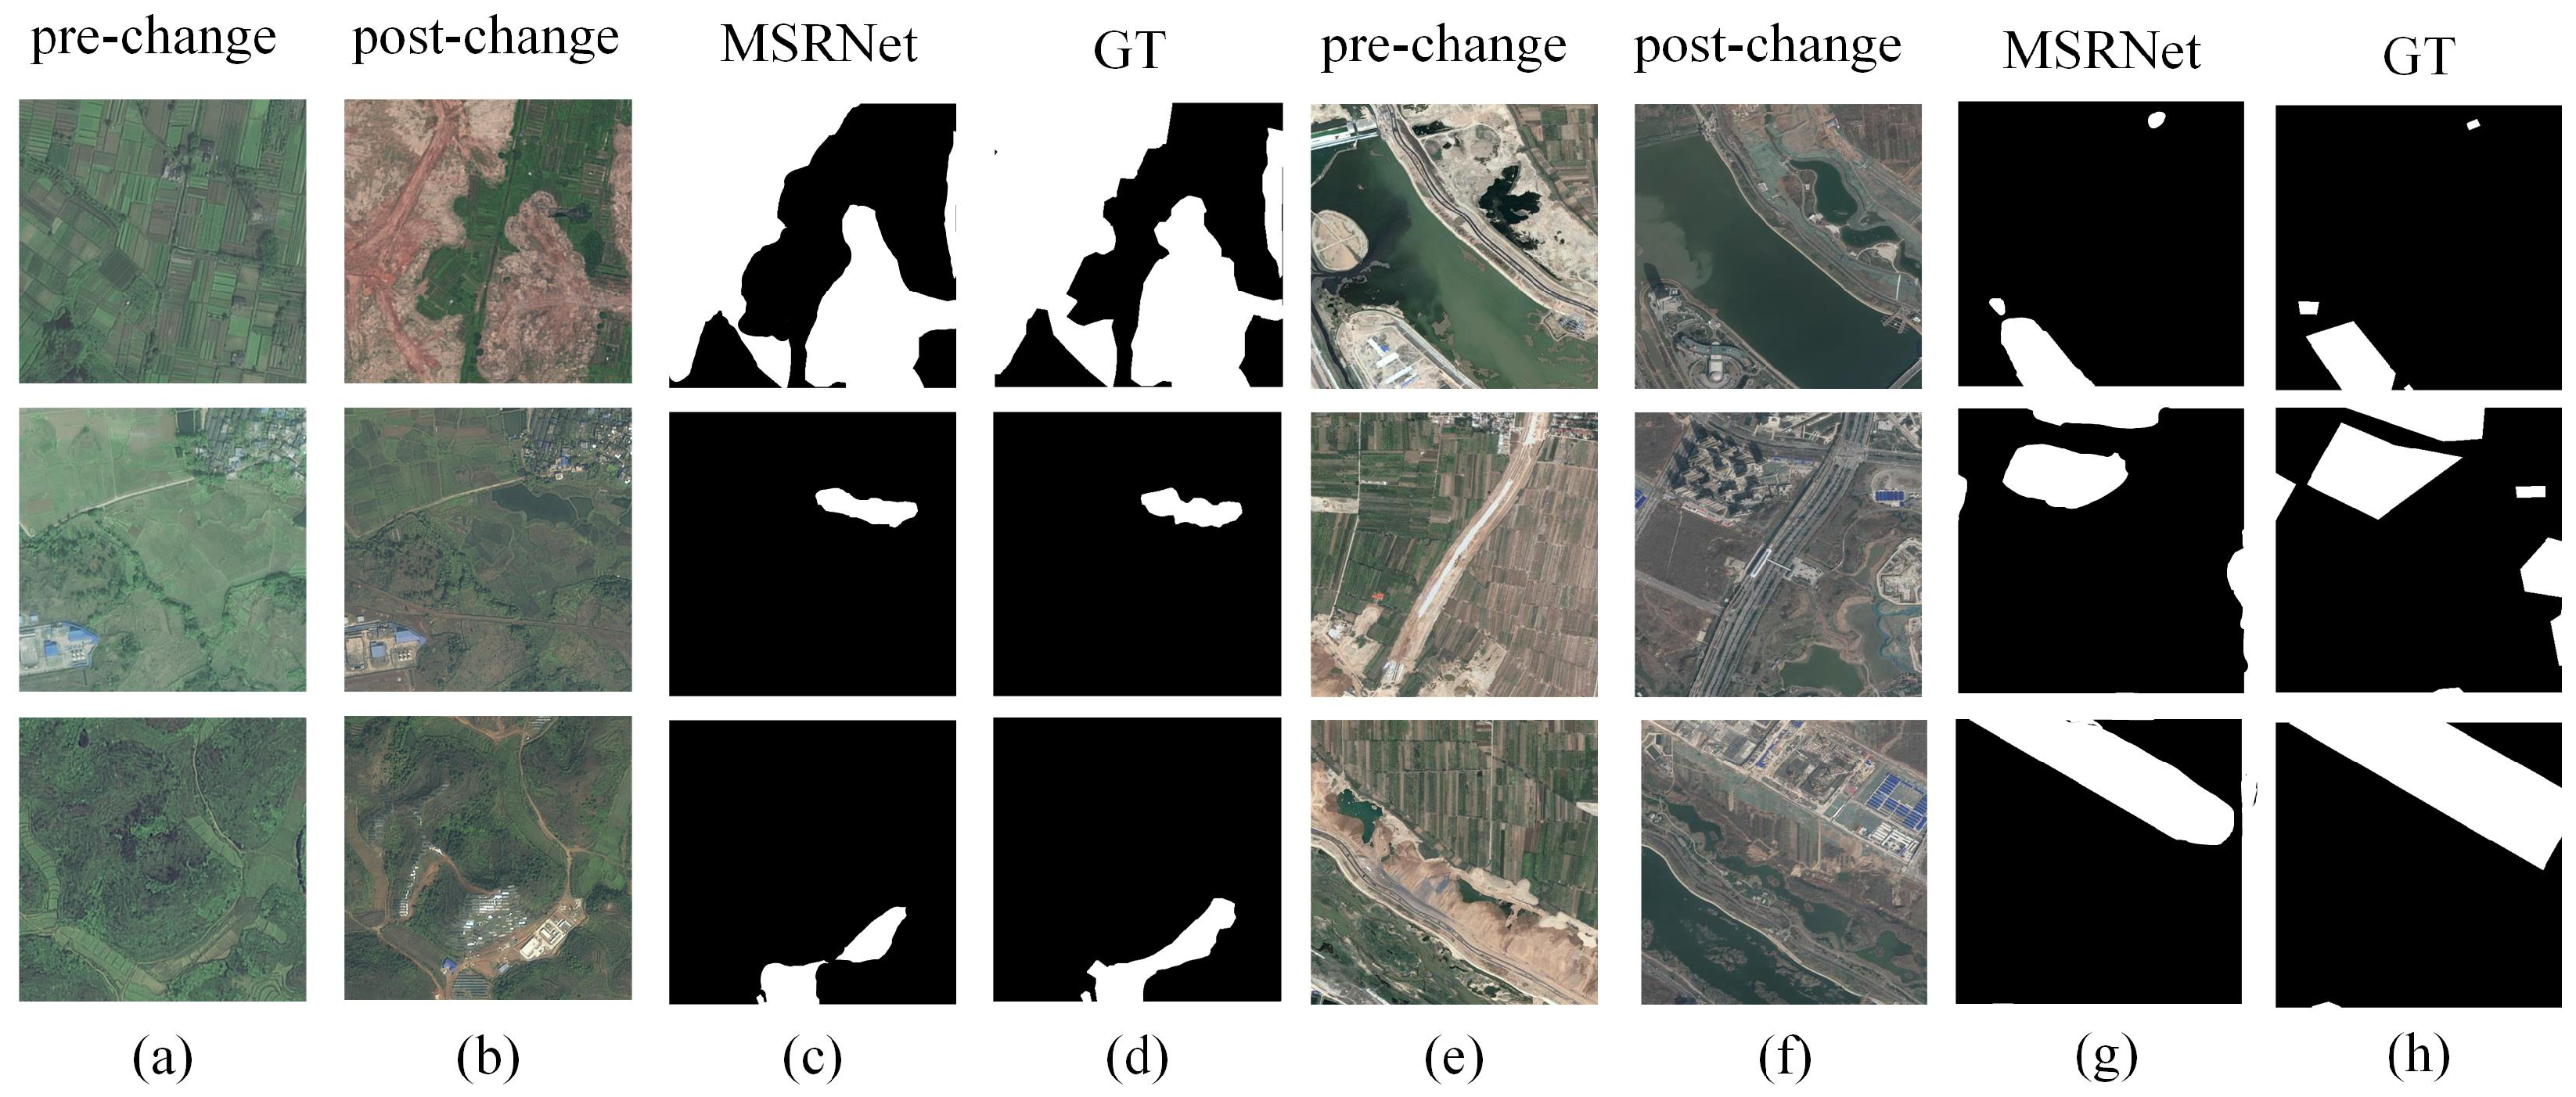
Figure 6 presents several qualitative examples. Figure 6a–d correspond to samples from the CLCD dataset. The proposed method accurately captures the main changed regions while preserving the structural integrity of the change areas, resulting in predictions that closely match the ground truth. Figure 6e–h show representative cases from the DSIFN-CD dataset, where building changes occur in more complex environments. Compared with the relatively regular building patterns observed in the LEVIR-CD and WHU-CD datasets, scenes in DSIFN-CD typically contain irregular building layouts and heterogeneous surroundings. Despite these challenges, the proposed method can still reliably identify the changed building regions while maintaining clear structural boundaries.
Figure 6.
Qualitative change detection results on the CLCD and DSIFN-CD datasets. (a–d) Examples from the CLCD dataset showing large-scale land-cover changes. (e–h) Examples from the DSIFN-CD dataset containing complex building change scenarios.
An additional experiment was conducted on the LEVIR-CD dataset to evaluate the capability of MSRNet in detecting small-scale and subtle changes, based on stratification by target size and intensity difference. As reported in Table 11, the proposed model is able to detect extremely small changes (smaller than 3 × 3 pixels), achieving F1-scores ranging from 0.62 to 0.78 under different intensity difference levels. For targets larger than or equal to 3 × 3 pixels, the performance becomes more stable and consistently higher, suggesting that larger spatial structures provide stronger discriminative cues for change detection. Moreover, the results indicate that higher intensity differences generally lead to improved detection performance, highlighting the sensitivity of the model to subtle variations. It should be noted that this experiment serves as a preliminary analysis rather than a comprehensive statistical evaluation, and more extensive experiments will be conducted in future work.
Table 11.
Detection performance of MSRNet on the LEVIR-CD dataset under different target sizes and intensity difference levels (ΔI).
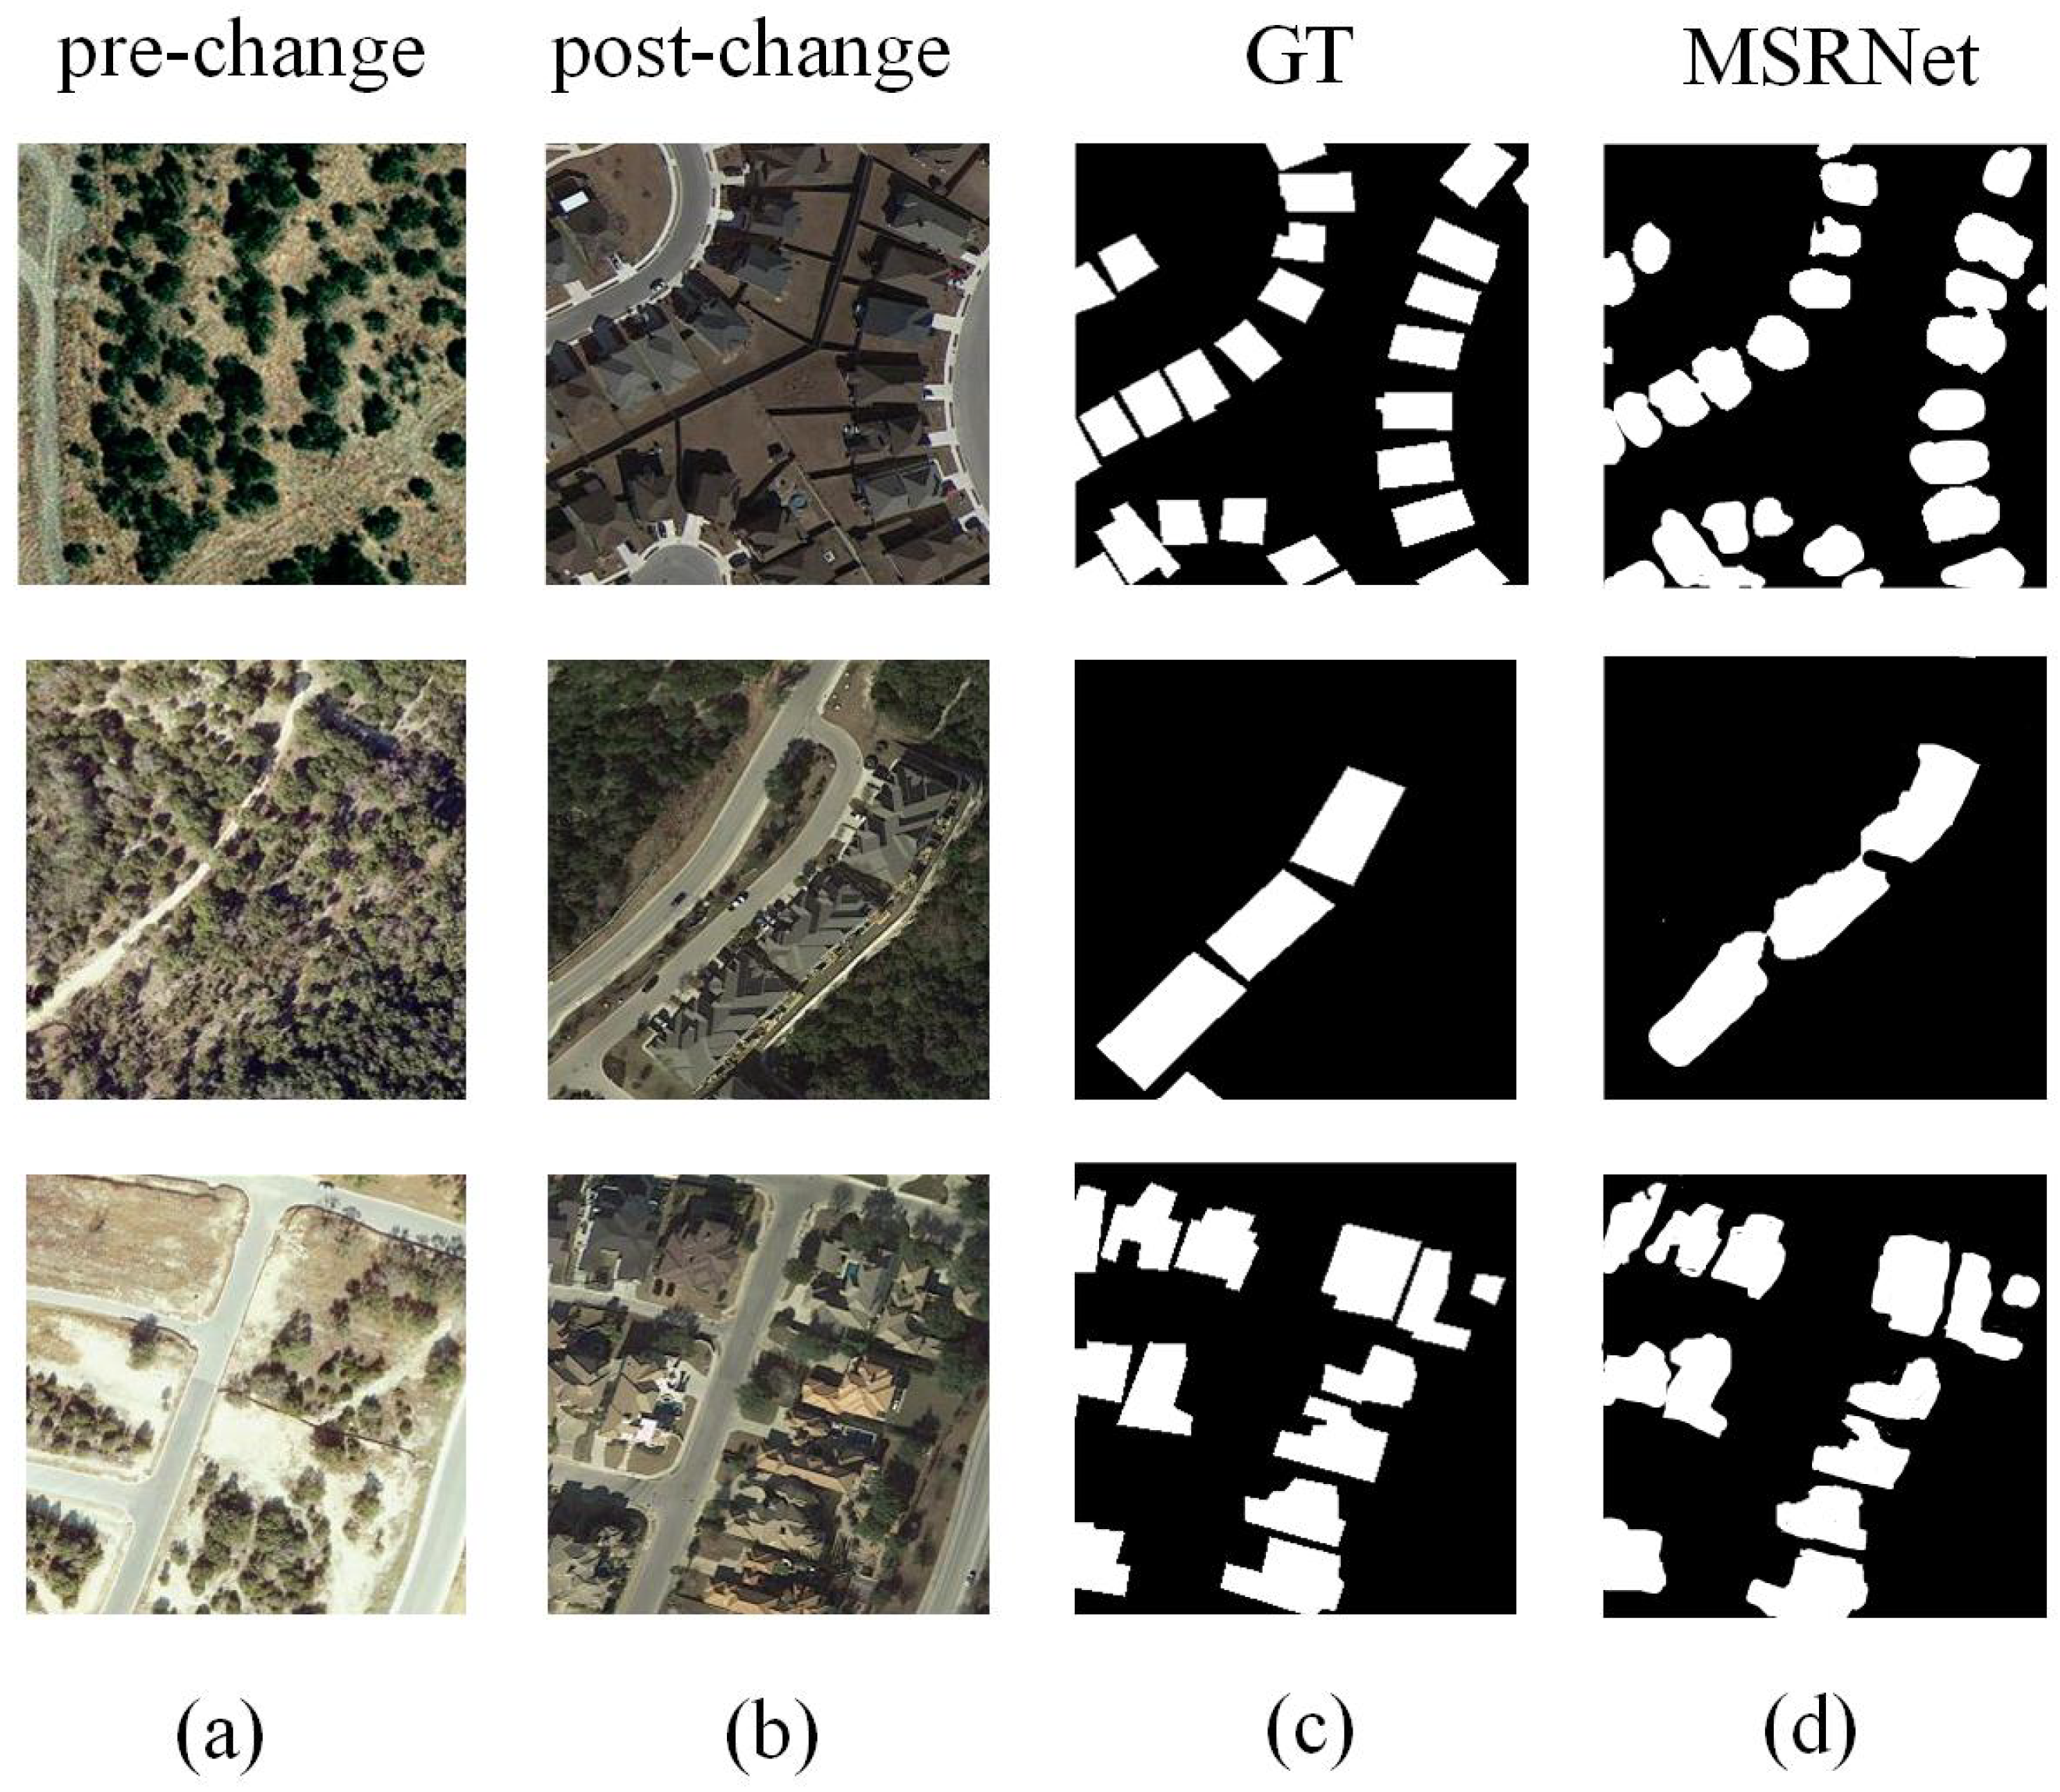
Although MSRNet achieves strong performance on small change targets, challenges remain in complex scenarios. As shown in Figure 7, performance degrades in densely clustered regions, where adjacent objects tend to be merged and subtle inter-object variations are difficult to capture. This issue mainly arises from reduced sensitivity to fine-grained spatial boundaries under cluttered backgrounds. Furthermore, when targets are severely occluded or located in low-texture areas, the extracted features become less discriminative, leading to incomplete or fragmented change maps.
Figure 7.
Visualization of challenging failure cases in complex scenes. (a) Pre-change image; (b) Post-change image; (c) Ground truth; (d) Binary prediction of the proposed method. In densely clustered urban areas, closely spaced objects may be partially merged, leading to incomplete segmentation boundaries. These results highlight the remaining challenges in detecting subtle structural differences in cluttered environments.
Nevertheless, the proposed self-refinement strategy alleviates the negative impact of label noise through adaptive feature re-weighting and iterative correction, enabling stable performance on large-scale high-resolution datasets. Quantitative comparisons demonstrate that MSRNet consistently outperforms baseline methods in terms of F1-score and IoU. Future work will focus on boundary-aware refinement to better preserve small and clustered targets, noise-aware pseudo-label filtering to reduce ambiguous supervision, and enhanced cross-temporal alignment mechanisms to further improve robustness in complex high-resolution change detection scenarios.
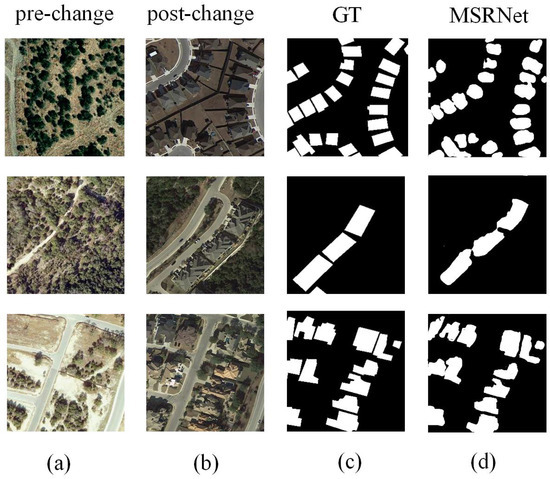
Figure 8 presents typical failure cases related to synthetic pseudo-label generation. Three main challenges are identified. First, small targets that are not annotated in the dataset remain undetected in both ground-truth and synthetic labels, limiting effective supervision for subtle changes. Second, noise in the synthetic labels introduces ambiguous training signals, especially in regions with weak temporal differences. Third, residual cross-temporal misalignment may reduce the reliability of the refinement process. These issues mainly arise from the reliance of pseudo-label quality on early-stage feature discrimination, where weak or ambiguous signals may propagate through subsequent refinement stages. Although SRM improves robustness to incomplete annotations, pseudo-label generation remains sensitive to fine-scale structures and challenging imaging conditions.
Figure 8.
Visualization of failure cases related to synthetic pseudo-label generation. (a) Pre-change image; (b) Post-change image; (c) Ground truth; (d) Binary prediction of the model with the SRM module. Red boxes indicate regions where objects are not correctly detected or are missing in the pseudo-labels. Some small or weakly defined structures remain undetected due to missing annotations or ambiguous visual cues. Additionally, noise introduced during pseudo-label generation may produce uncertain supervision signals, particularly in regions with minimal temporal differences.
3.3. Comparison Experiment Results
To comprehensively assess the performance of the model, five commonly used evaluation metrics were employed: precision (P), recall (R), F1-score (F1), Intersection over Union (IoU), and overall accuracy (OA). These metrics collectively provide a detailed and robust measure of the model’s effectiveness. We compared MSRNet with ten representative state-of-the-art CD methods, including IFNet [56], FC-EF [41], HANet [43], BIT [44], Changeformer [57], RSM-CD [48], STANet [54], MSFNet [58], HATNet [59], LCD-Net [60], and ScratchFormer [61], using their official settings to ensure reproducibility.
Table 12 and Table 13 report the quantitative evaluation results on the LEVIR-CD and WHU-CD benchmarks. Compared with all competing methods, MSRNet consistently achieves the best overall performance. On the LEVIR-CD dataset, MSRNet achieves an F1-score of 92.21 ± 0.12 and an IoU of 85.01 ± 0.10. On the WHU-CD dataset, it obtains an F1-score of 92.41 ± 0.13 and an IoU of 85.91 ± 0.11. Although the strongest CNN-based baseline achieves high precision, several leading Transformer-based models also demonstrate competitive recall rates. However, these approaches tend to optimize individual metrics rather than achieving balanced performance. In contrast, MSRNet maintains consistently strong results across all standardized evaluation metrics. To further verify the reliability of the improvements, paired t-tests were conducted between MSRNet and the competing methods. The results indicate that the performance gains are statistically significant (p < 0.05), confirming the robustness of the proposed method.
Table 12.
Quantitative comparison with state-of-the-art change detection methods on the LEVIR-CD dataset. The table summarizes performance comparisons between MSRNet and several representative deep learning-based change detection models. Metrics include precision, recall, F1-score, IoU, overall accuracy, parameter size, computational complexity, and inference time. The best results in each column are highlighted in bold.
Table 13.
Quantitative comparison with state-of-the-art change detection methods on the WHU-CD dataset. The table reports the performance comparison on the WHU-CD benchmark using the same evaluation metrics as in Table 11. The results demonstrate that MSRNet achieves superior overall performance while maintaining competitive computational efficiency. The best results in each column are highlighted in bold.
To ensure a rigorous evaluation of computational efficiency, inference time (ms/pair) was measured under identical conditions on a single NVIDIA RTX 4090 GPU. MSRNet achieves an average latency of 145 ms/pair, which is comparable to the most efficient CNN baseline but delivers significantly higher accuracy. Furthermore, MSRNet operates faster than state-of-the-art Transformer-based methods, whose inference latency typically exceeds 180–200 ms per pair due to the computational overhead of attention mechanisms. Although it is not the fastest model in absolute terms, MSRNet demonstrates a clear advantage in the trade-off between accuracy and efficiency. With 32.66 M parameters and 44.26 GFLOPs, MSRNet achieves superior overall performance compared with both CNN and Transformer architectures. These improvements stem from the proposed modules. AOSS enhances spatial representation by jointly modeling local and global dependencies. FBAM strengthens bi-temporal feature fusion through mutual guidance between channel and spatial dimensions, while SRM suppresses annotation noise via momentum pseudo-label refinement. Together, these modules enable MSRNet to achieve state-of-the-art performance with strong efficiency and robustness.
The model is trained for 150 epochs on both the LEVIR-CD and WHU-CD datasets. On LEVIR-CD, stable convergence is observed around epoch 74, where the validation F1-score reaches 0.9126 and remains stable thereafter. The average training time per epoch is approximately 126 s, resulting in a total training time of about 5.2 h on a single GPU. On WHU-CD, the validation F1-score reaches 0.9203 and becomes stable after epoch 80, indicating reliable convergence behavior. The average training time per epoch is approximately 180 s, leading to a total training time of about 7.5 h.
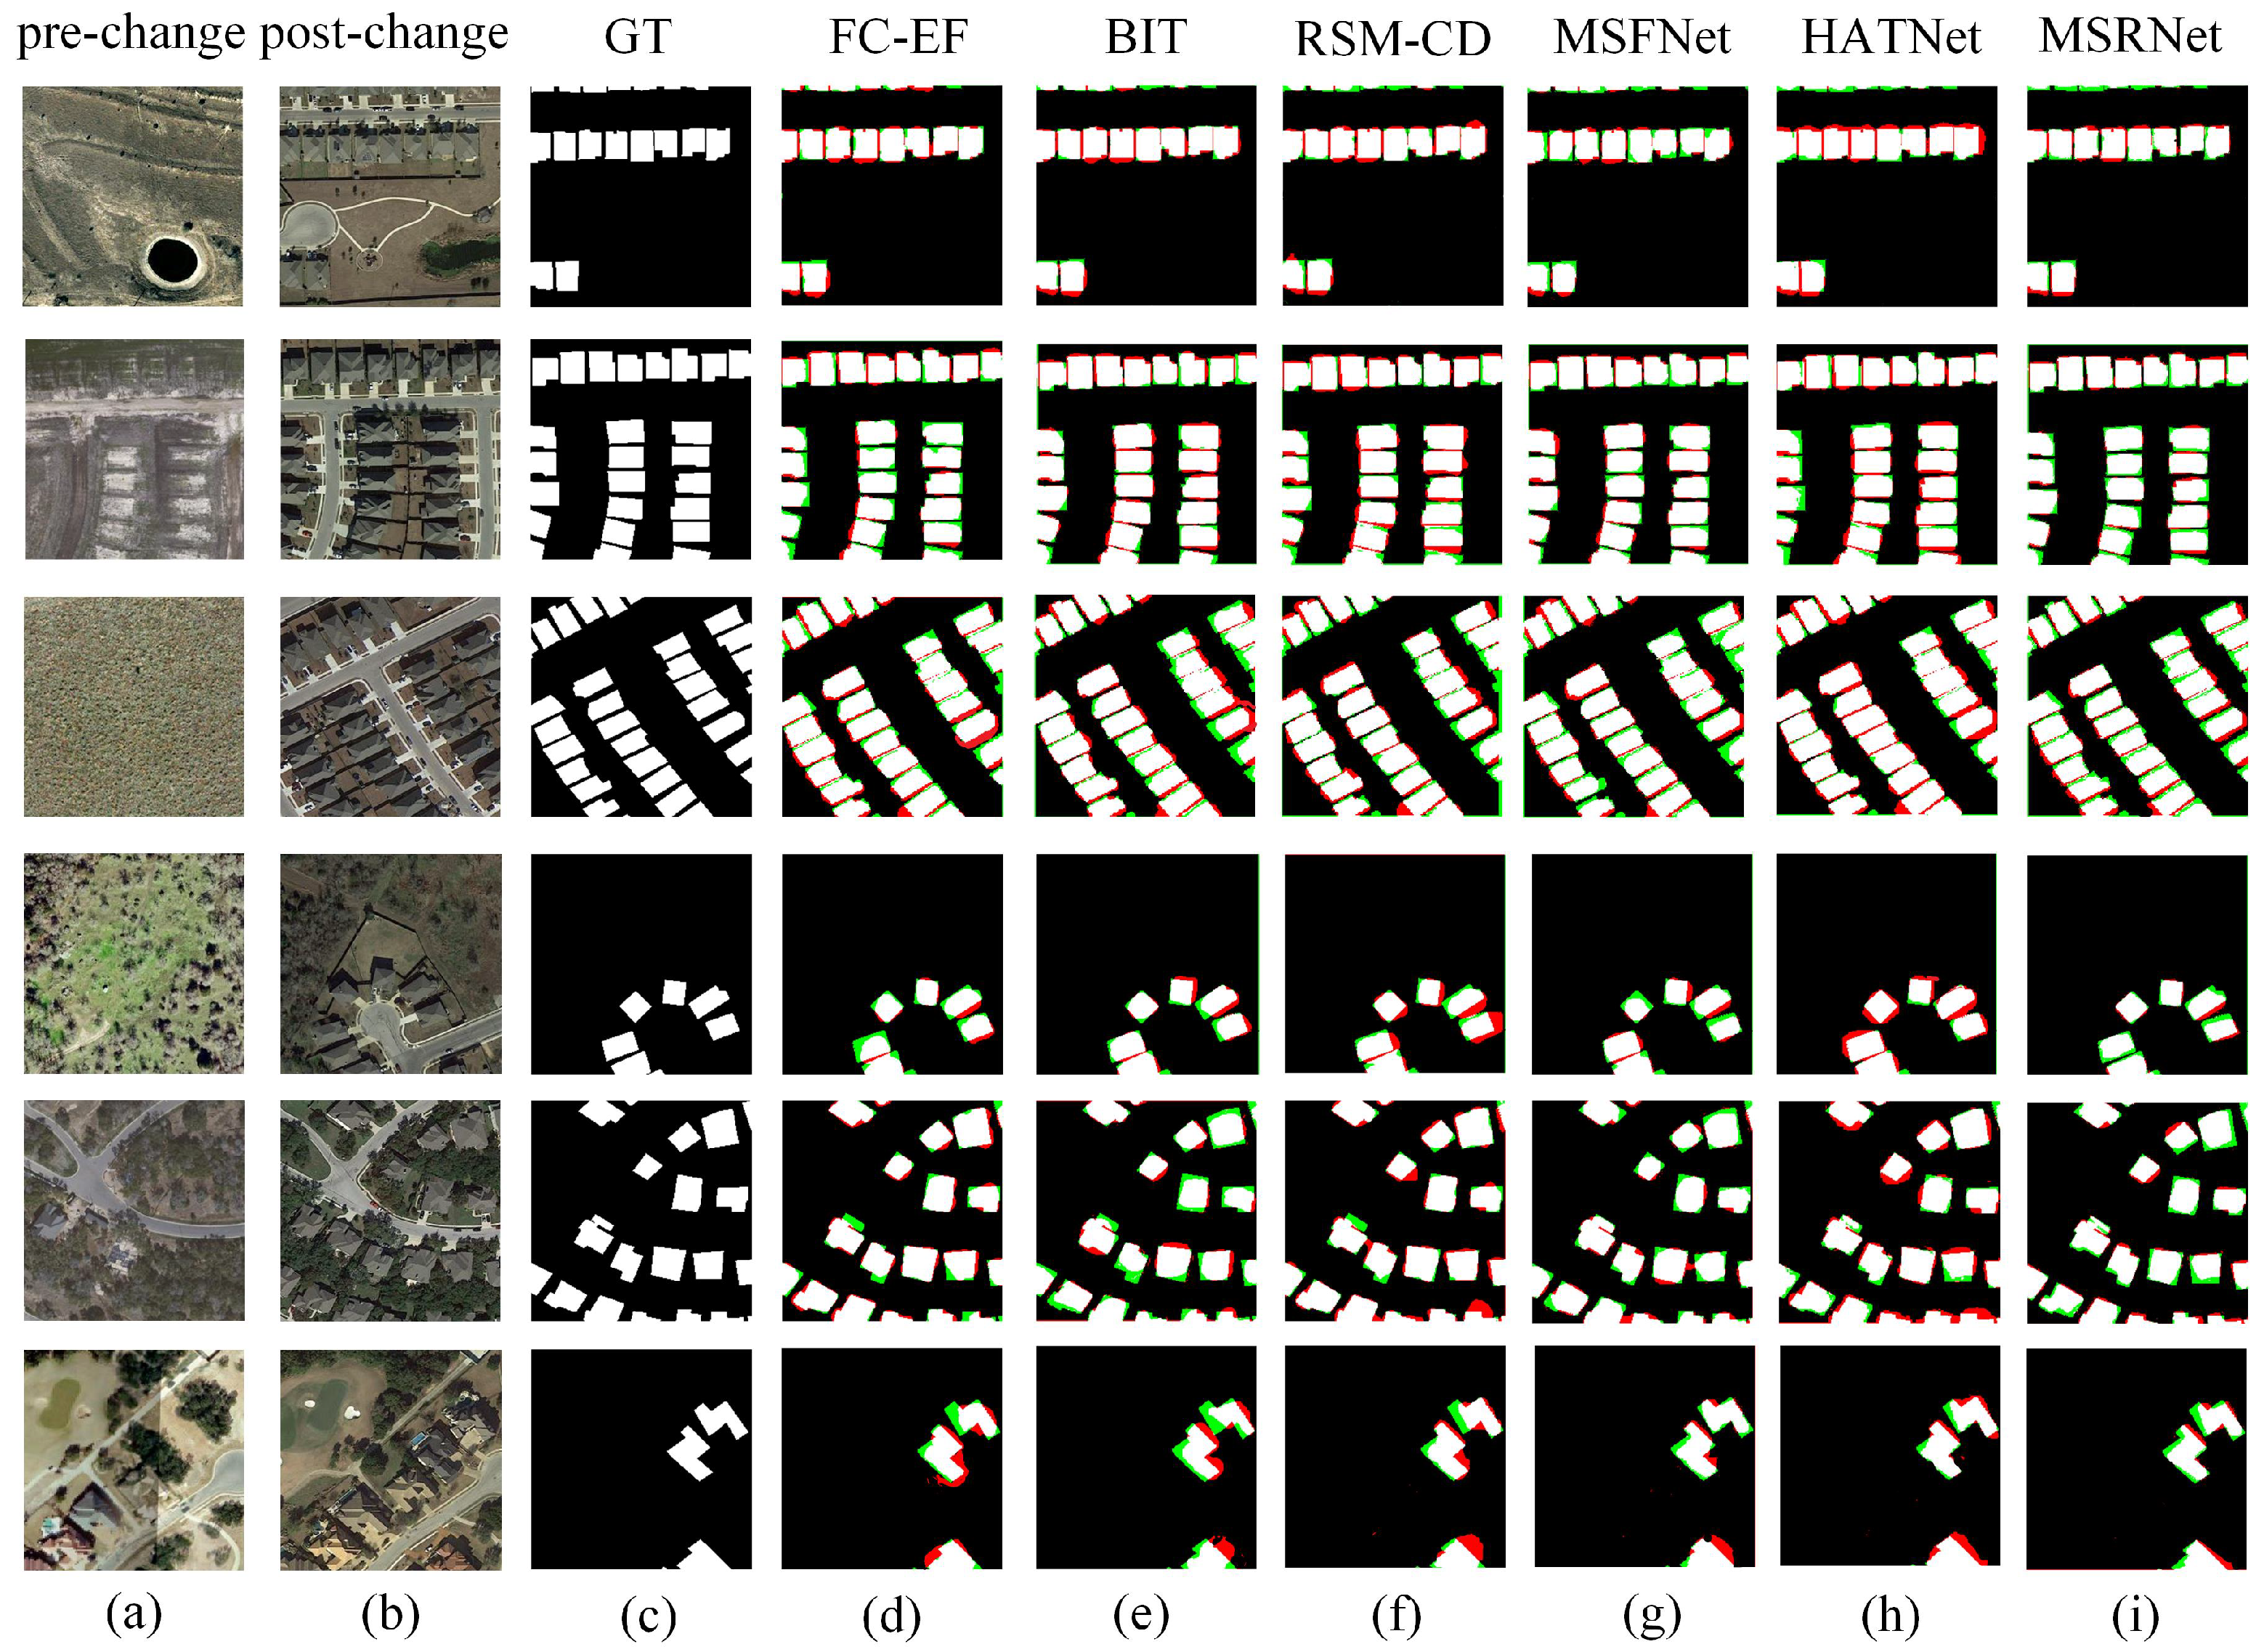
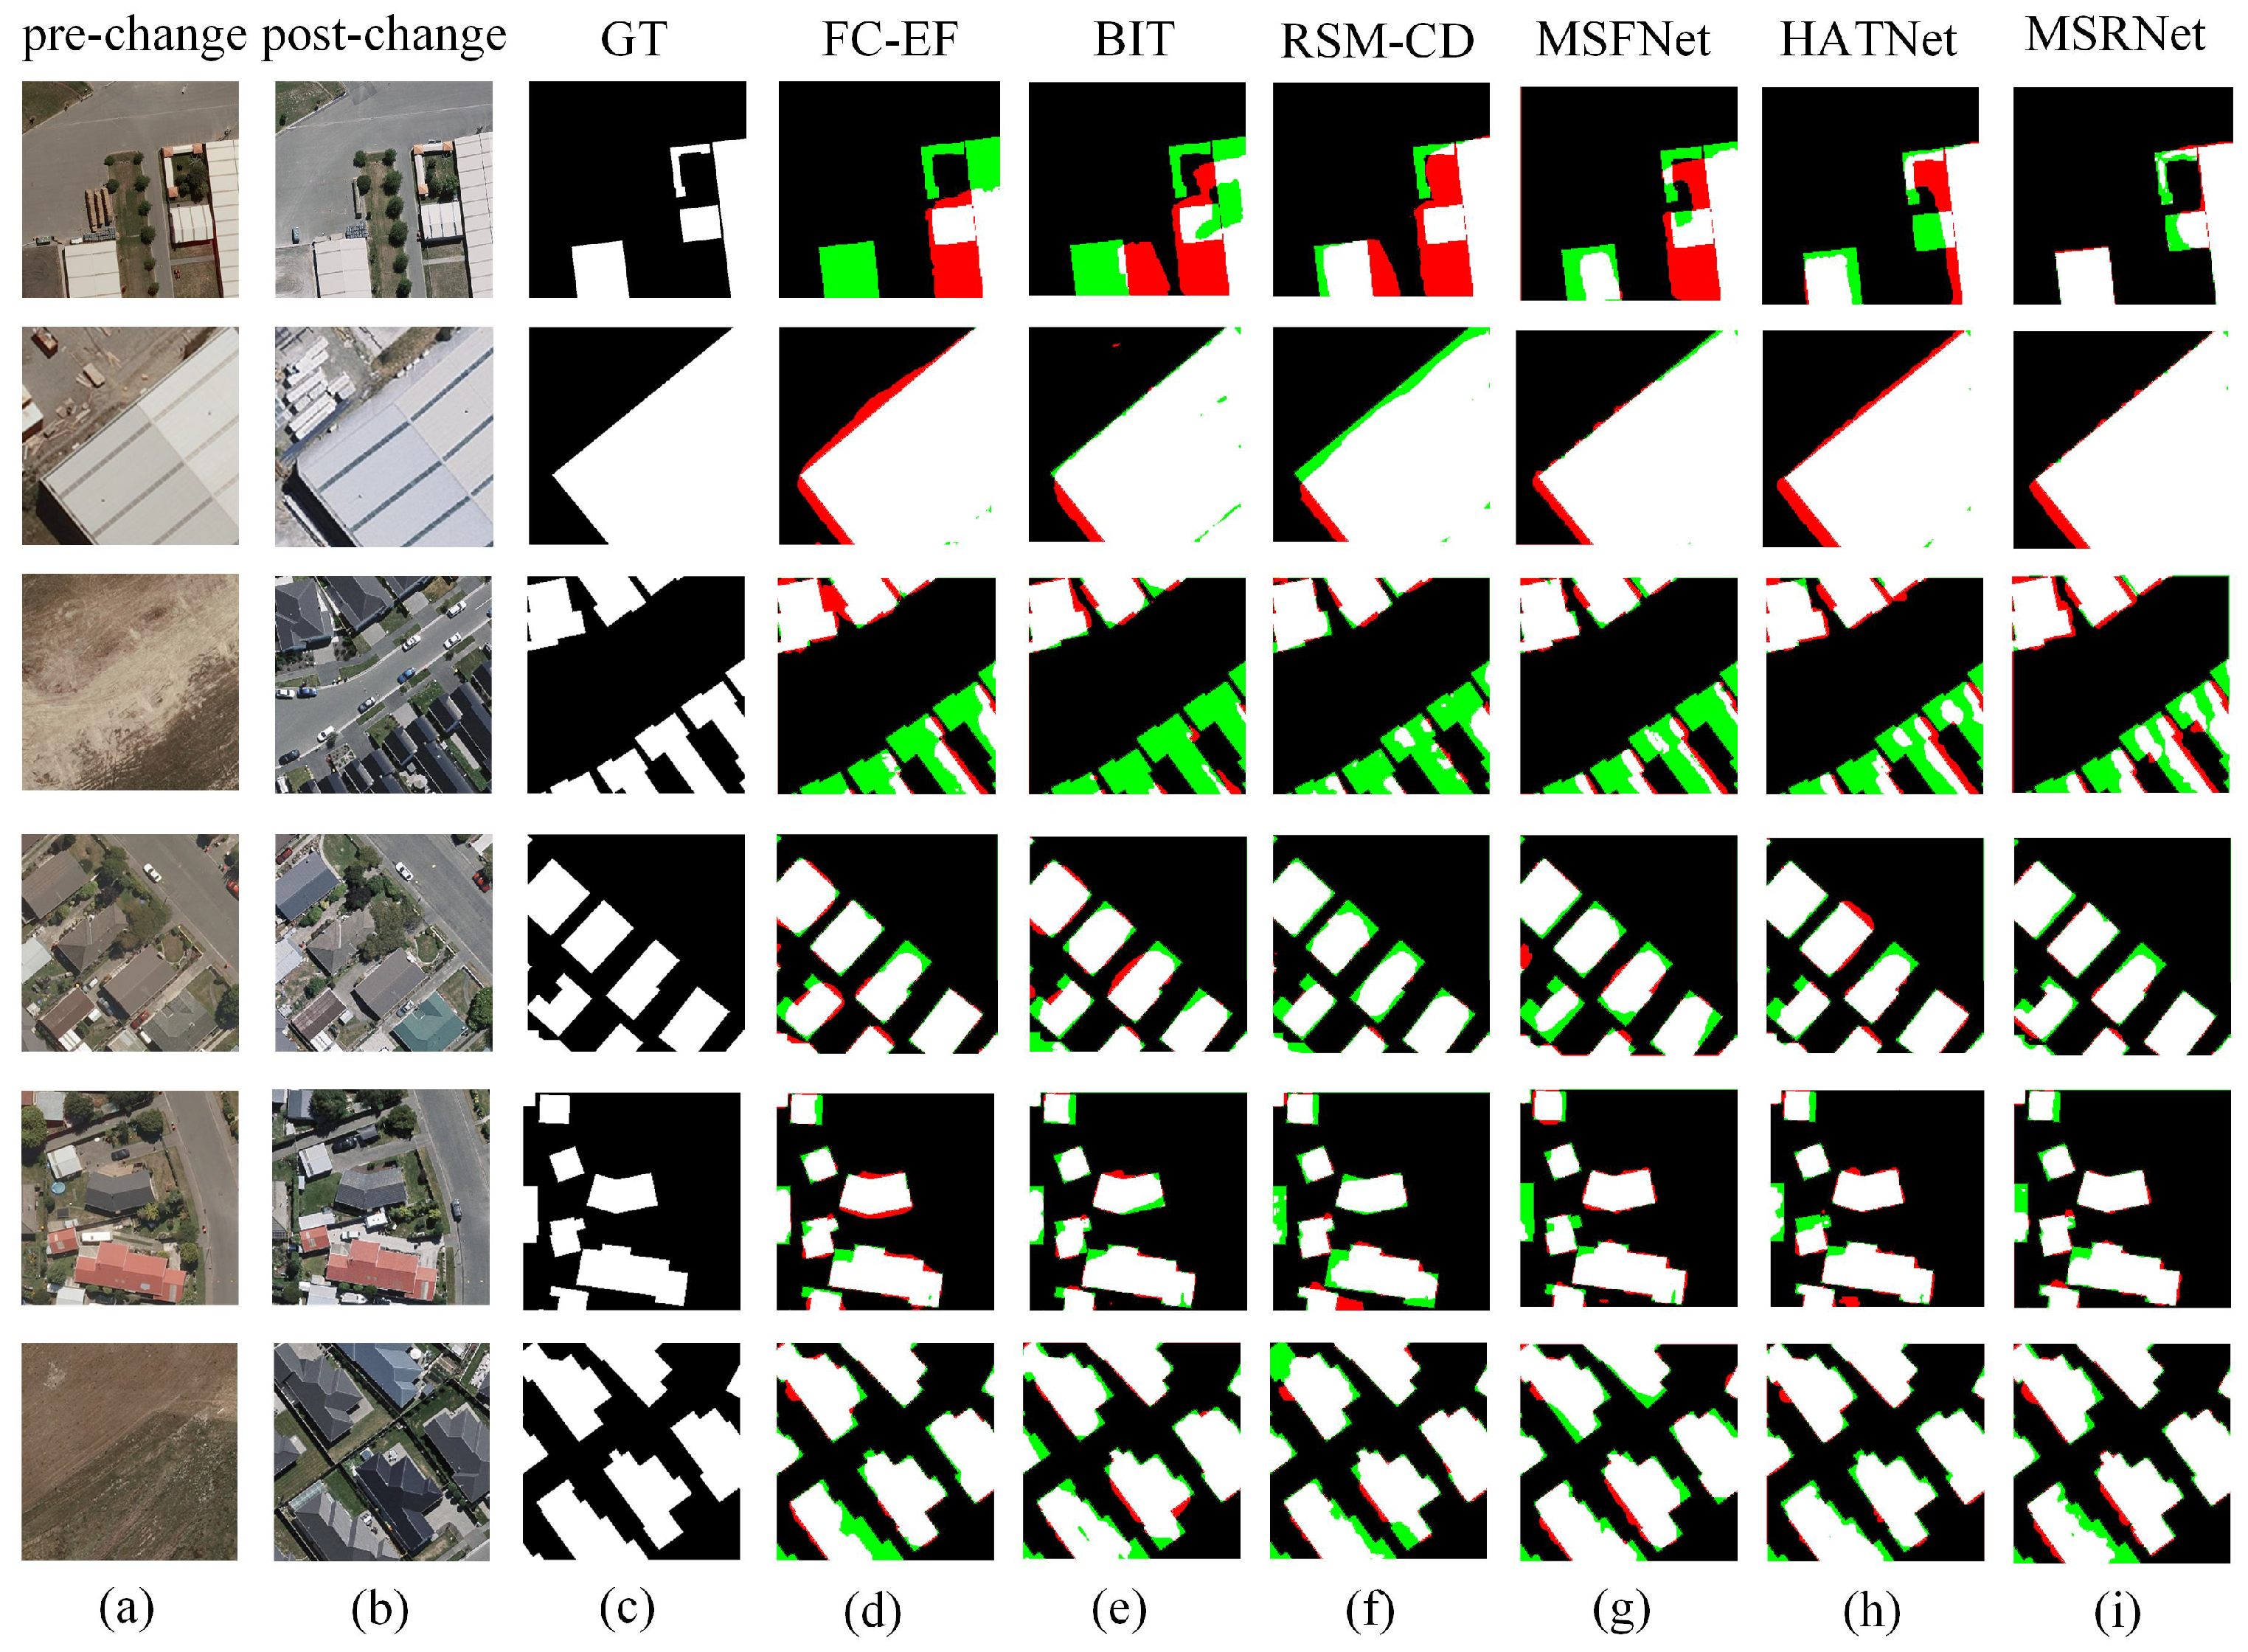
To assess the reliability of these improvements, paired t-tests were conducted between MSRNet and two representative methods, MSFNet and RSM-CD. The results demonstrate statistically significant improvements in both F1-score and IoU, confirming the robustness and consistency of the proposed model. Qualitative comparisons were conducted using representative samples from two datasets. As shown, Figure 9a–c and Figure 10a–c correspond to the pre-change image, post-change image, and the ground-truth label, respectively, while Figure 9d–h and Figure 10d–h present the visualization results of several representative models. The results show that MSRNet accurately captures subtle changes within object boundaries, demonstrating the effectiveness of the proposed modules for improving change detection performance.
Figure 9.
Visual comparison of MSRNet with representative change detection methods on the LEVIR-CD dataset. (a) Pre-change image; (b) Post-change image; (c) Ground truth; (d) FC-EF; (e) BIT; (f) RSM-CD; (g) MSFNet; (h) HATNet; (i) MSRNet. Red regions denote false positives (FP), while green regions denote false negatives (FN). Compared with other approaches, MSRNet produces more accurate boundaries and fewer misclassified regions, particularly in small-scale building change scenarios.
Figure 10.
Visual comparison of MSRNet with representative change detection methods on the WHU-CD dataset. (a) Pre-change image; (b) Post-change image; (c) Ground truth; (d) FC-EF; (e) BIT; (f) RSM-CD; (g) MSFNet; (h) HATNet; (i) MSRNet. Red regions denote false positives (FP), while green regions denote false negatives (FN). The proposed MSRNet achieves more complete detection of change regions while maintaining clearer structural boundaries.
4. Conclusions
In this study, we proposed MSRNet, a framework for detecting small or low-contrast changes in VHR optical remote sensing images. MSRNet consists of three main components: an AOSS-based Mamba encoder for multi-scale spatial–semantic representation, a four-branch attention fusion module for bi-temporal feature alignment and interaction, and a self-refinement module that improves annotation quality during training. Extensive experiments on public benchmarks demonstrate that MSRNet achieves competitive performance compared with state-of-the-art methods. Specifically, it improves upon the best baseline by +0.66/+0.41 (F1-score/IoU) on LEVIR-CD and +0.98/+0.50 on WHU-CD. The results indicate that the proposed framework is effective in capturing small or low-contrast changes and subtle structural variations in complex urban environments. Nevertheless, challenges remain in densely distributed or weakly labeled regions, where adjacent objects may merge or subtle variations may be overlooked. Future work will focus on enhancing feature modeling, incorporating uncertainty-aware pseudo-label refinement, extending the framework to multimodal data, and developing lightweight variants suitable for near-real-time applications. Overall, the proposed MSRNet provides a robust and effective solution for high-resolution change detection.
Author Contributions
Conceptualization, H.S., X.Y., J.Z. and T.Z.; Methodology, H.S. and B.L.; Data curation, B.L.; Writing—review & editing, R.L. and T.Z.; Visualization, H.S.; Project administration, R.L.; Funding acquisition, X.Y. All authors have read and agreed to the published version of the manuscript.
Funding
This work was supported in part by the National Natural Science Foundation of China under Grants 62276274 and 62573423, in part by the Key R&D Program of Shaanxi Province Project 2024CY2-GJHX-42, and in part by the Shaanxi Natural Science Basic Research Program—Youth Project 2025JC-YBQN-824.
Data Availability Statement
The data presented in this study are openly available in the LEVIR-CD and WHU-CD datasets. The LEVIR-CD dataset is publicly available from its official repository at https://gts.ai/dataset-download/levir-cd/ (accessed on 20 March 2026). The WHU-CD dataset is available at https://gpcv.whu.edu.cn/data/building_dataset.html (accessed on 20 March 2026).
Conflicts of Interest
The authors declare no conflicts of interest.
References
- Nourani, V.; Roushangar, K.; Andalib, G. An inverse method for watershed change detection using hybrid conceptual and artificial intelligence approaches. J. Hydrol. 2018, 562, 371–384. [Google Scholar] [CrossRef] [Scilit]
- Al-Dousari, A.E.; Mishra, A.; Singh, S. Land use land cover change detection and urban sprawl prediction for Kuwait metropolitan region, using multi-layer perceptron neural networks (MLPNN). Egypt. J. Remote Sens. Space Sci. 2023, 26, 381–392. [Google Scholar] [CrossRef] [Scilit]
- Ji, R.; Tan, K.; Wang, X.; Xin, L. Spatiotemporal monitoring of a grassland ecosystem and its net primary production using Google Earth Engine: A case study of inner mongolia from 2000 to 2020. Remote Sens. 2021, 13, 4480. [Google Scholar] [CrossRef] [Scilit]
- Wang, C.; Zhao, D.; Qi, X.; Shi, Z. A hierarchical decoder architecture for multilevel fine-grained disaster detection. IEEE Trans. Geosci. Remote Sens. 2023, 61, 5607114. [Google Scholar] [CrossRef] [Scilit]
- Chen, J.; Gong, P.; He, C.; Pu, R.; Shi, P. Land-use/land-cover change detection using improved change-vector analysis. Photogramm. Eng. Remote Sens. 2003, 69, 369–379. [Google Scholar]
- Nielsen, A.A.; Conradsen, K.; Simpson, J.J. Multivariate alteration detection (MAD) and MAF postprocessing in multispectral, bitemporal image data: New approaches to change detection studies. Remote Sens. Environ. 1998, 64, 1–19. [Google Scholar] [CrossRef] [Scilit]
- Deng, J.S.; Wang, K.; Deng, Y.H.; Qi, G.J. PCA-based land-use change detection and analysis using multitemporal and multisensor satellite data. Int. J. Remote Sens. 2008, 29, 4823–4838. [Google Scholar] [CrossRef] [Scilit]
- Hussain, M.; Chen, D.; Cheng, A.; Wei, H.; Stanley, D. Change detection from remotely sensed images: From pixel-based to object-based approaches. ISPRS J. Photogramm. Remote Sens. 2013, 80, 91–106. [Google Scholar] [CrossRef] [Scilit]
- Aances, H.; Nielsen, A.A.; Carstensen, J.M.; Larsen, R.; Ersbøll, B. Efficient incorporation of Markov random fields in change detection. In Proceedings of the 2009 IEEE International Geoscience and Remote Sensing Symposium, Cape Town, South Africa, 12–17 July 2009; Volume 3, pp. 689–692. [Google Scholar]
- Peng, S.; Zhu, X.; Deng, H.; Deng, L.; Lei, Z. Fusionmamba: Efficient image fusion with state space model. arXiv 2024, arXiv:2404.07932. [Google Scholar] [CrossRef] [Scilit]
- Lee, H.; Lee, K.; Kim, J.H.; Na, Y.; Park, J.; Choi, J.P.; Hwang, J.Y. Local similarity siamese network for urban land change detection on remote sensing images. IEEE J. Sel. Top. Appl. Earth Obs. Remote Sens. 2021, 14, 4139–4149. [Google Scholar] [CrossRef] [Scilit]
- Lei, T.; Wang, J.; Ning, H.; Wang, X.; Xue, D.; Wang, Q.; Nandi, A.K. Difference enhancement and spatial–spectral nonlocal network for change detection in VHR remote sensing images. IEEE Trans. Geosci. Remote Sens. 2021, 60, 4507013. [Google Scholar] [CrossRef] [Scilit]
- Xu, Q.; Shi, Y.; Guo, J.; Ouyang, C.; Zhu, X.X. UCDFormer: Unsupervised change detection using a transformer-driven image translation. IEEE Trans. Geosci. Remote Sens. 2023, 61, 5619917. [Google Scholar] [CrossRef] [Scilit]
- Zhao, S.; Zhang, X.; Xiao, P.; He, G. Exchanging dual-encoder–decoder: A new strategy for change detection with semantic guidance and spatial localization. IEEE Trans. Geosci. Remote Sens. 2023, 61, 4508016. [Google Scholar] [CrossRef] [Scilit]
- Wu, C.; Chen, H.; Du, B.; Zhang, L. Unsupervised change detection in multitemporal VHR images based on deep kernel PCA convolutional mapping network. IEEE Trans. Cybern. 2021, 52, 12084–12098. [Google Scholar] [CrossRef] [Scilit]
- Dosovitskiy, A. An image is worth 16 × 16 words: Transformers for image recognition at scale. arXiv 2020, arXiv:2010.11929. [Google Scholar]
- Zhang, C.; Wang, L.; Cheng, S.; Li, Y. SwinSUNet: Pure transformer network for remote sensing image change detection. IEEE Trans. Geosci. Remote Sens. 2022, 60, 5224713. [Google Scholar] [CrossRef] [Scilit]
- Zhu, L.; Liao, B.; Zhang, Q.; Wang, X.; Liu, W.; Wang, X. Vision Mamba: Efficient visual representation learning with bidirectional state space model. arXiv 2024, arXiv:2401.09417. [Google Scholar] [CrossRef] [Scilit]
- Liu, Y.; Tian, Y.; Zhao, Y.; Yu, H.; Xie, L.; Wang, Y.; Ye, Q.; Jiao, J.; Liu, Y. Vmamba: Visual state space model. Adv. Neural Inf. Process. Syst. 2024, 37, 103031–103063. [Google Scholar]
- Hassani, A.; Walton, S.; Li, J.; Li, S.; Shi, H. Neighborhood attention transformer. In Proceedings of the IEEE/CVF Conference on Computer Vision and Pattern Recognition (CVPR), Vancouver, BC, Canada, 18–24 June 2023; pp. 6185–6194. [Google Scholar]
- Cheng, G.; Huang, Y.; Li, X.; Lyu, S.; Xu, Z.; Zhao, H.; Zhao, Q.; Xiang, S. Change detection methods for remote sensing in the last decade: A comprehensive review. Remote Sens. 2024, 16, 2355. [Google Scholar] [CrossRef] [Scilit]
- Dong, S.; Wang, L.; Du, B.; Meng, X. ChangeCLIP: Remote sensing change detection with multimodal vision-language representation learning. ISPRS J. Photogramm. Remote Sens. 2024, 208, 53–169. [Google Scholar] [CrossRef] [Scilit]
- Zhu, Q.; Guo, X.; Li, Z.; Li, D. A review of multi-class change detection for satellite remote sensing imagery. Geo-Spat. Inf. Sci. 2024, 27, 1–15. [Google Scholar] [CrossRef] [Scilit]
- Wu, C.; Zhang, L.; Du, B.; Chen, H.; Wang, J.; Zhong, H. UNet-like Remote Sensing Change Detection: A review of current models and research directions. IEEE Geosci. Remote Sens. Mag. 2024, 12, 305–334. [Google Scholar] [CrossRef] [Scilit]
- Ning, X.; Zhang, H.; Zhang, R.; Huang, X. Multi-stage progressive change detection on high resolution remote sensing imagery. ISPRS J. Photogramm. Remote Sens. 2024, 207, 231–244. [Google Scholar] [CrossRef] [Scilit]
- Cheng, P.; Xia, M.; Wang, D.; Lin, H.; Zhao, Z. Transformer Self-Attention Change Detection Network with Frozen Parameters. Appl. Sci. 2025, 15, 3349. [Google Scholar] [CrossRef] [Scilit]
- Ding, L.; Zhu, K.; Peng, D.; Tang, H.; Yang, K.; Bruzzone, L. Adapting segment anything model for change detection in VHR remote sensing images. IEEE Trans. Geosci. Remote Sens. 2024, 62, 5611711. [Google Scholar] [CrossRef] [Scilit]
- Liu, J.; Xu, R.; Duan, Y.; Guo, T.; Shi, G.; Luo, F. MDGF-CD: Land-cover change detection with multi-level DiffFormer feature grouping fusion for VHR remote sensing images. Inf. Fusion 2025, 120, 103110. [Google Scholar] [CrossRef] [Scilit]
- Chen, X.; Li, L.; Li, Z.; Liu, M.; Li, Q.; Qi, H.; Yu, P.L. KD loss: Enhancing discriminability of features with kernel trick for object detection in VHR remote sensing images. Eng. Appl. Artif. Intell. 2024, 129, 107641. [Google Scholar] [CrossRef] [Scilit]
- Zhang, J.; Ding, L.; Zhou, T.; Wang, J.; Atkinson, P.M.; Bruzzone, L. Recurrent Semantic Change Detection in VHR Remote Sensing Images Using Visual Foundation Models. IEEE Trans. Geosci. Remote Sens. 2025, 63, 5402314. [Google Scholar] [CrossRef] [Scilit]
- Jiang, W.; Sun, Y.; Lei, L.; Kuang, G.; Ji, K. Change detection of multisource remote sensing images: A review. Int. J. Digit. Earth 2024, 17, 2398051. [Google Scholar] [CrossRef] [Scilit]
- Hu, J.; Shen, L.; Sun, G. Squeeze-and-excitation networks. In Proceedings of the IEEE Conference on Computer Vision and Pattern Recognition (CVPR), Salt Lake City, UT, USA, 18–22 June 2018; pp. 7132–7141. [Google Scholar]
- Wang, Q.; Wu, B.; Zhu, P.; Li, P.; Zuo, W.; Hu, Q. ECA-Net: Efficient channel attention for deep convolutional neural networks. In Proceedings of the IEEE/CVF Conference on Computer Vision and Pattern Recognition (CVPR), Seattle, WA, USA, 13–19 June 2020; pp. 11534–11542. [Google Scholar]
- Wen, Y.; Ma, X.; Zhang, X.; Pun, M.O. GCD-DDPM: A generative change detection model based on difference-feature guided DDPM. IEEE Trans. Geosci. Remote Sens. 2024, 62, 5404416. [Google Scholar] [CrossRef] [Scilit]
- He, K.; Fan, H.; Wu, Y.; Xie, S.; Girshick, R. Momentum contrast for unsupervised visual representation learning. In Proceedings of the IEEE/CVF Conference on Computer Vision and Pattern Recognition (CVPR), Seattle, WA, USA, 13–19 June 2020; pp. 9729–9738. [Google Scholar]
- Chen, T.; Kornblith, S.; Norouzi, M.; Hinton, G. A simple framework for contrastive learning of visual representations. In Proceedings of the International Conference on Machine Learning (ICML), Virtual, 13–18 July 2020; pp. 1597–1607. [Google Scholar]
- Caron, M.; Misra, I.; Mairal, J.; Goyal, P.; Bojanowski, P.; Joulin, A. Unsupervised learning of visual features by contrasting cluster assignments. Adv. Neural Inf. Process. Syst. 2020, 33, 9912–19924. [Google Scholar]
- Huang, Y.; Li, X.; Du, Z.; Shen, H. Spatiotemporal enhancement and interlevel fusion network for remote sensing images change detection. IEEE Trans. Geosci. Remote Sens. 2024, 62, 5609414. [Google Scholar]
- Wang, L.; Fang, Y.; Li, Z.; Wu, C.; Xu, M.; Shao, M. Summator–subtractor network: Modeling spatial and channel differences for change detection. IEEE Trans. Geosci. Remote Sens. 2024, 62, 5604212. [Google Scholar] [CrossRef] [Scilit]
- Long, J.; Zeng, H.; Zhao, H.; Lin, H.; Li, J. Detecting semantic changes from VHR remote sensing images by integrating semantic correlations and change priors. Int. J. Appl. Earth Obs. Geoinf. 2025, 144, 104916. [Google Scholar] [CrossRef] [Scilit]
- Daudt, R.C.; Le Saux, B.; Boulch, A. Fully convolutional siamese networks for change detection. In Proceedings of the 2018 25th IEEE International Conference on Image Processing (ICIP), Athens, Greece, 7–10 October 2018; pp. 4063–4067. [Google Scholar]
- Fang, S.; Li, K.; Shao, J.; Li, Z. SNUNet-CD: A Densely Connected Siamese Network for Change Detection of VHR Images. IEEE Geosci. Remote Sens. Lett. 2022, 19, 8007805. [Google Scholar] [CrossRef] [Scilit]
- Han, C.; Wu, C.; Guo, H.; Hu, M.; Chen, H. HANet: A hierarchical attention network for change detection with bitemporal very-high-resolution remote sensing images. IEEE J. Sel. Top. Appl. Earth Obs. Remote Sens. 2023, 16, 3867–3878. [Google Scholar]
- Chen, H.; Qi, Z.; Shi, Z. Remote sensing image change detection with transformers. IEEE Trans. Geosci. Remote Sens. 2021, 60, 5607514. [Google Scholar]
- Ke, Q.; Zhang, P. Hybrid-TransCD: A hybrid transformer remote sensing image change detection network via token aggregation. ISPRS Int. J. Geo-Inf. 2022, 11, 263. [Google Scholar]
- Jiang, W.; Sun, Y.; Lei, L.; Kuang, G.; Ji, K. AdaptVFMs-RSCD: Advancing Remote Sensing Change Detection from binary to semantic with SAM and CLIP. ISPRS J. Photogramm. Remote Sens. 2025, 230, 304–317. [Google Scholar] [CrossRef] [Scilit]
- Gu, A.; Dao, T. Mamba: Linear-time sequence modeling with selective state spaces. In Proceedings of the First Conference on Language Modeling, Philadelphia, PA, USA, 7 October 2024. [Google Scholar]
- Zhao, S.; Chen, H.; Zhang, X.; Xiao, P.; Bai, L.; Ouyang, W. Rs-mamba for large remote sensing image dense prediction. IEEE Trans. Geosci. Remote Sens. 2024, 62, 5633314. [Google Scholar] [CrossRef] [Scilit]
- Zhang, H.; Chen, K.; Liu, C.; Chen, H.; Zou, Z.; Shi, Z. CDMamba: Incorporating Local Clues into Mamba for Remote Sensing Image Binary Change Detection. arXiv 2024, arXiv:2406.04207. [Google Scholar]
- Chen, H.; Song, J.; Han, C.; Xia, J.; Yokoya, N. ChangeMamba: Remote sensing change detection with spatiotemporal state space model. IEEE Trans. Geosci. Remote Sens. 2024, 62, 4409720. [Google Scholar] [CrossRef] [Scilit]
- He, Z.; Wang, Y.H. Mamba meets crack segmentation. arXiv 2024, arXiv:2407.15714. [Google Scholar] [CrossRef] [Scilit]
- Woo, S.; Park, J.; Lee, J.Y.; Kweon, I.S. Cbam: Convolutional block attention module. In Proceedings of the European Conference on Computer Vision (ECCV), Munich, Germany, 8–14 September 2018; pp. 3–19. [Google Scholar]
- Misra, D.; Nalamada, T.; Arasanipalai, A.U.; Hou, Q. Rotate to attend: Convolutional triplet attention module. In Proceedings of the IEEE/CVF Winter Conference on Applications of Computer Vision, Waikoloa, HI, USA, 3–8 January 2021; pp. 3139–3148. [Google Scholar]
- Chen, H.; Shi, Z. A spatial-temporal attention-based method and a new dataset for remote sensing image change detection. Remote Sens. 2020, 12, 1662. [Google Scholar] [CrossRef] [Scilit]
- Ji, S.; Wei, S.; Lu, M. Fully convolutional networks for multisource building extraction from an open aerial and satellite imagery dataset. IEEE Trans. Geosci. Remote Sens. 2018, 57, 574–586. [Google Scholar] [CrossRef] [Scilit]
- Zhang, C.; Yue, P.; Tapete, D.; Jiang, L.; Shangguan, B.; Huang, L.; Liu, G. A deeply supervised image fusion network for change detection in high resolution bi-temporal remote sensing images. ISPRS J. Photogramm. Remote Sens. 2020, 166, 183–200. [Google Scholar] [CrossRef] [Scilit]
- Bandara, W.G.C.; Patel, V.M. A transformer-based siamese network for change detection. In Proceedings of the IGARSS 2022–2022 IEEE International Geoscience and Remote Sensing Symposium, Kuala Lumpur, Malaysia, 17–22 July 2022; pp. 207–210. [Google Scholar]
- Guo, Z.; Chen, H.; He, F. MSFNet: Multi-scale Spatial-frequency Feature Fusion Network for Remote Sensing Change Detection. IEEE J. Sel. Top. Appl. Earth Obs. Remote Sens. 2024, 18, 1912–1925. [Google Scholar]
- Xu, C.; Ye, Z.; Mei, L.; Yu, H.; Liu, J.; Yalikun, Y.; Lei, C. Hybrid attention-aware transformer network collaborative multiscale feature alignment for building change detection. IEEE Trans. Instrum. Meas. 2024, 73, 5012914. [Google Scholar] [CrossRef] [Scilit]
- Liu, W.; Li, J.; Wang, H.; Tan, R.; Fu, Y.; Tian, Q. LCD-Net: A Lightweight Remote Sensing Change Detection Network Combining Feature Fusion and Gating Mechanism. IEEE J. Sel. Top. Appl. Earth Obs. Remote. Sens. 2025, 18, 7769–7780. [Google Scholar] [CrossRef] [Scilit]
- Noman, M.; Fiaz, M.; Cholakkal, H.; Narayan, S.; Anwer, R.M.; Khan, S.; Khan, F.S. Remote sensing change detection with transformers trained from scratch. IEEE Trans. Geosci. Remote Sens. 2024, 62, 4704214. [Google Scholar] [CrossRef] [Scilit]

Disclaimer/Publisher’s Note: The statements, opinions and data contained in all publications are solely those of the individual author(s) and contributor(s) and not of MDPI and/or the editor(s). MDPI and/or the editor(s) disclaim responsibility for any injury to people or property resulting from any ideas, methods, instructions or products referred to in the content. |
© 2026 by the authors. Licensee MDPI, Basel, Switzerland. This article is an open access article distributed under the terms and conditions of the Creative Commons Attribution (CC BY) license.