


Highlights
What are the main findings?
- A strategy for cross-scale label transfer from near-ground to aerial imagery using RTK technology represents a paradigm shift, enabling rapid, uniform, and non-destructive fieldwide disease grading, achieving orders-of-magnitude efficiency gains over manual surveys, and solving the problems of scarce samples and costly annotation.
- A disease detection architecture, DualRiceNet, with a coupled spectral–spatial dual-branch and cross-attention mechanism design, exhibits strong generalization in complex real-world farmland environments, maintaining consistently high accuracy across substantial variations in geography, time, phenology, and variety.
What are the implications of the main findings?
- The proposed cross-scale label-transfer strategy provides a scalable paradigm for disease dataset construction, mitigating reliance on costly manual annotation and lowering the barrier to applying data-intensive deep learning in field-scale disease detection.
- The proposed DualRiceNet architecture provides a scalable, transferable paradigm for interpreting weak disease spatial–spectral signals, supports precise decisions and multi-scale collaborative applications, and is clearly related to sustainable agriculture.
Abstract
Accurate field-scale crop disease detection is crucial for precise decisions and for highly efficient multi-scale collaboration. UAV-based multispectral imaging technology offers advantages in terms of high efficiency and low cost. Deep learning shows potential for deep representation and fusion of spectral and spatial features. However, traditional manual disease surveys are limited by efficiency and cost, making it difficult to meet the large sample sizes required by deep learning. Therefore, we proposed a method for rice bacterial leaf blight detection using UAV-based multispectral imagery. This method integrates a cross-scale sample-label transfer, and a spectral–spatial dual-branch feature fusion architecture (DualRiceNet). We first used RTK positioning to transfer disease labels from near-ground RGB images to high-altitude multispectral images, effectively expanding the dataset and alleviating the scarcity of labeled samples. DualRiceNet employed a cross-attention mechanism to couple its spectral and spatial branches, thereby isolating disease-specific spatial–spectral patterns from complex interference from the farmland background. DualRiceNet achieved an overall accuracy (OA) of 92.3% on the same-distribution test set. In an independent scenario test set spanning multiple differences in geography, time, phenology, and variety, the model maintained the highest OA of 80.0%. Our method demonstrated an excellent generalization ability to real-world environmental variations in rice fields.
1. Introduction
Rice is one of the most important staple crops worldwide, playing an irreplaceable strategic role in ensuring food security and maintaining socio-economic stability [1]. Pests and diseases remain key biotic stress factors constraining high and stable rice yields. Climate change has led to more frequent extreme weather events and altered temperature and humidity patterns. This resulted in pests and diseases spreading more widely and causing greater damage, thereby posing a persistent and severe threat to rice production safety [2]. Therefore, developing timely and accurate pest and disease monitoring technologies has become an urgent need for achieving green and sustainable agricultural development. As the basic unit of production management, the field scale is crucial for agricultural practices. In this context, comprehensive and high-precision detection at the field scale facilitates providing a solid basis for decision-making in precise field prevention and control. Concurrently, it could generate accurate ground-truth data to match the sample needs for satellite-based large-scale models [3].
Recently, unmanned aerial vehicle (UAV) remote sensing has gradually become an essential means of field-scale crop disease and pest detection due to its flexibility, non-destructive nature, and high efficiency [4,5]. UAV platforms can quickly acquire information on the agricultural environment and crop growth, playing a crucial role in precision agriculture and smart farming [6,7]. UAVs can further enable fine-grained collection of crop disease and pest information by carrying various sensors. Hyperspectral sensors provide continuous, high-resolution spectral information and demonstrate strong performance in characterizing field-scale diseases and pests [8,9]. However, their high cost and complex data processing requirements significantly limit their widespread adoption in practical field environments. In addition, low-cost RGB cameras excel at interpreting spatial information and are thus widely used to detect pests and diseases in vegetation with clearly distinct targets, such as forests and fruit trees [10,11]. However, for small-target crops like rice, their application is mostly confined to leaf-scale analysis [12]. This limitation makes it difficult for them to effectively characterize the overall spatial distribution of pests and diseases at the field scale using RGB imagery. In contrast, UAV multispectral technology offers a better balance among cost, efficiency, and practicality. By significantly reducing hardware and data processing burdens, multispectral technology offers a practical pathway from research to field application. Crucially, it retains stress-sensitive spectral bands such as the red edge and the near-infrared [13]. Therefore, studies on field-scale disease and pest detection using UAV multispectral technology have attracted increasing attention [14,15]. Existing studies have shown that multispectral imaging technology performs well at detecting and assessing various crop diseases and pests, including wheat stripe rust [16], citrus Huanglongbing [17], and potato late blight [18]. These results confirm the potential of UAV multispectral imagery in crop disease and pest detection.
Efficiently extracting discriminative features from UAV-based multispectral imagery and constructing reliable models for pest and disease detection remain significant scientific challenges in this field. Existing reports mainly fall into two categories. One category relies on traditional machine learning methods, using manually designed features such as spectral indices and texture features, combined with various classifiers to detect diseases [19,20,21]. The second category leverages the rapid advances in deep learning, particularly the powerful spatial feature-extraction capabilities of convolutional neural networks, to achieve high-precision pest and disease detection [22,23]. For instance, network architectures (CNNs) such as DF-UNet and Ir-UNet have been successfully applied to achieve high-accuracy detection of wheat stripe rust [24,25]. Although the studies above demonstrate the potential of drone-based multispectral technology for pest and disease monitoring, two key challenges remain to achieve full coverage and high-precision detection at the field scale. First, existing methods have limitations in spectral–spatial feature extraction and deep fusion. Traditional machine learning approaches rely on handcrafted spectral or textural features and struggle to automatically capture the complex spatial context of diseases. While deep learning excels at extracting spatial features, it often overlooks the inherent spectral sequence and inter-channel correlations in multispectral data. Although some CNN-based studies have attempted to combine these two feature types [26,27,28], they mostly remain at the level of simple feature concatenation or early fusion. Meanwhile, due to the inherent limitations of its local receptive field, CNN has difficulty capturing long-range dependencies across spectral bands, which in turn affects the accurate characterization of disease spectral features. In recent years, Transformer-based architectures have made significant progress and are expected to effectively address the aforementioned limitations. Through self-attention mechanisms, Transformer can capture global dependencies and explicitly model sequential relationships in spectral data, thereby uncovering intrinsic correlations across spectral bands [29]. Therefore, Transformers and CNNs exhibit complementary advantages: CNNs excel at extracting local spatial features, while Transformers provide global spectral context information. This integration enables a comprehensive, deep analysis of spectral and spatial information in remote sensing images. Some reported CNN-Transformer methods have demonstrated great potential in agricultural applications by leveraging this complementarity [30,31,32]. Second, non-destructive, efficient sample annotation methods suitable for true field environments remain lacking. Existing studies predominantly rely on field plot surveys in controlled experimental environments. While effective for obtaining accurate labels in the defined experimental setting, they are ill-suited for continuously planted, structurally complex real fields. Traditional manual survey methods suffer from time- and labor-intensive data collection, susceptibility to crop damage, and high subjectivity. This makes the traditional method difficult to efficiently, uniformly, and non-destructively obtain a complete picture of disease distribution within the field. This leads to an inadequate sample size and poor spatial representativeness, failing to meet the large-sample requirements of data-driven modeling.
Rice bacterial leaf blight (RBLB), caused by the bacterium Xanthomonas oryzae pv. oryzae, is one of the three major diseases in rice production [33]. This disease is a devastating bacterial disease with strong outbreaks and rapid spread. The typical symptoms are water-soaked streaks on the leaves that quickly turn white and wither, severely damaging the plant’s photosynthetic capacity. Especially during the critical period from jointing to booting, bacterial blight can cause yield losses of up to 50%, posing a serious threat to the safe production of rice [34]. Therefore, conducting field-scale severity detection of RBLB can not only help reveal the remote sensing response mechanism of this disease, but also provide a direct basis for precise control decisions in the field. Meanwhile, this is of great significance for ensuring stable rice production and promoting sustainable agricultural development.
This study proposed a field-scale RBLB detection method using UAV-based multispectral imagery. This method integrated a cross-scale sample-label transfer and a spectral–spatial dual-branch feature fusion architecture. The specific research objectives include (1) designing an efficient and accurate disease detection dataset collaborative generation strategy to address the challenge of high-quality sample annotation in real-world field scenarios; (2) constructing a deep fusion model of spectral–spatial dual-branch features for UAV-based multispectral imagery to improve RBLB detection precision under limited spectral bands; and (3) comparing and evaluating the performance and generalization ability of the proposed method in field-scale RBLB detection.
2. Materials
2.1. Study Area
Two experiments were conducted in real-world rice fields where the disease occurred naturally (Figure 1). The first experiment was conducted from 31 August 2024, in Ninghai County, Ningbo City, Zhejiang Province (121°59′E, 29°30′N), in Fields A and B. The rice in both fields was continuously cropped late-season rice in the heading and flowering periods. The second experiment was conducted on 16 August 2025, in Field C, Yuyao City, Ningbo City, Zhejiang Province (121°01′E, 30°08′N). The rice in this field was continuously cropped as late-season rice in the jointing period. Ningbo City is located along the coast and is frequently affected by typhoons. Heavy rainfall from late July to September coincides with the rice’s sensitive period, leading to disease outbreaks. Since 2019, the area affected by rice bacterial leaf blight in this region has been increasing annually (https://www.natesc.org.cn/ZTZL/PlantProtect (accessed on 12 July 2024)).
Figure 1.
The (a) study area location, (b) rice Field A, and (c) rice Field B and their near-ground UAV sampling points for the first experiment, and (d) rice Field C and its near-ground UAV sampling points for the second experiment.
2.2. Data Acquisition
2.2.1. High-Altitude UAV-Based Multispectral Imagery Covering the Entire Rice Field
The experiments used a DJI Mavic 3 multispectral UAV to capture images of the rice canopy. This UAV integrates a 20-megapixel, 4/3-inch CMOS visible light image sensor and four 5-megapixel, 1/2.8-inch CMOS multispectral image sensors. The four spectral channels of the multispectral images are as follows: green, red, red edge, and near-infrared. In addition, it is equipped with an RTK module for centimeter-level high-precision positioning. Data collection was conducted between 11:00 A.M. and 1:00 P.M. on clear days. Before the flight, a calibration reflectance panel for the multispectral sensor was manually captured to facilitate reflectance calibration. The flight altitude was set to 30 m. The side-overlap rate was 70%, and the forward-overlap rate was 80% to produce accurate multispectral images. Subsequently, DJI Terra V3.5 software was used to stitch and reconstruct images, creating a complete multispectral image dataset of the rice field at 30 m altitude.
2.2.2. Near-Ground UAV-Based RGB Imagery from Rice Field Uniform Fixed-Point Sampling
To construct a dataset for detecting RBLB, we first reconstructed a multispectral image of the rice field at an altitude of 30 m using image stitching. This image was then used as a baseline map for planning the flight path for near-ground high-resolution RGB image acquisition. The near-ground flight altitude was uniformly set to 2.5 m above the rice canopy. The field of view of a single RGB image near the ground was calculated accordingly. Subsequently, based on the spatial resolution of the baseline image, the required pixel spacing between adjacent waypoints to ensure no overlap of the image field of view was calculated. Based on these parameters, we used ArcGIS 10.6 to complete the flight-path layout. The baseline image was first imported into ArcGIS 10.6 for visualization. Operators then manually placed waypoints along a pre-set S-shaped flight path, using the calculated pixel spacing as a basis and visual identification, striving to ensure that the waypoints uniformly covered the entire planting area. After the waypoints were set up, the coordinates were exported as an XML file and imported into the UAV system as the flight path for near-ground high-resolution RGB image acquisition. Ultimately, 658 high-definition RGB images were collected in the first experiment, including 419 images of Field A and 239 images of Field B. In total, 120 images were collected in the second experiment (Field C). Each image has a resolution of 5280 × 3956 pixels.
3. Methods
3.1. Dataset Construction for RBLB Detection
This study proposed a quick, semi-automatic method for constructing an RBLB detection dataset. This method first implemented cross-scale sample-label transfer by using RTK positioning as an intermediary. Specifically, the disease visual interpretations from high-definition, near-ground UAV RGB images were mapped onto regionally matched high-altitude UAV multispectral imagery. Data augmentation and feature enhancement were then applied. Finally, RBLB detection datasets suitable for large-scale deep learning models have been created. The specific dataset construction process is shown in Figure 2.
Figure 2.
Workflow for dataset construction for the RBLB detection.
3.1.1. Cross-Scale Sample-Label Transfer from Near-Ground to High-Altitude Using RTK Positioning
We constructed a deep learning-ready, representative, non-destructive dataset for rice disease detection by fusing UAV imagery at 30 m multispectral and 2.5 m high-definition RGB canopy resolutions. RTK positioning enabled the precise transfer of disease annotations from the RGB to the multispectral plots.
- Step 1: Disease severity annotation using 2.5 m UAV-based RGB imagery of rice canopy
The symptoms of RBLB typically begin at the leaf tip or margin, then rapidly extend along the veins from the leaf margin or midrib, forming streaks that eventually cover the entire leaf. Based on these characteristics of RBLB, this study used the following steps to annotate the disease severity levels in high-resolution RGB images acquired at a height of 2.5 m above the rice canopy. In this process, the national standard for rice leaf diseases (GB/T 17980.19-2000) [35] was used as an important reference. First, each image was equally divided into six sub-images to create an expanded sample set for disease severity grading. Then, 30 equally sized, non-overlapping rectangular annotation boxes were randomly marked within each sub-image, each occupying approximately 0.2% of the sub-image’s total area. Next, visual interpretation was performed to determine the status of each annotation box. Specifically, if any leaf within a box showed visible lesions, the box was considered RBLB-positive. Boxes containing only healthy leaves or non-lesion features (such as shade, water droplets, or soil) were recorded as negative. The proportion of positive boxes in each sub-image was then calculated as the disease ratio (DR), representing disease occurrence in that sub-image. Finally, based on the disease proportion, the severity was further divided into three levels: 0 ≤ DR ≤ 10% for healthy, 10% < DR ≤ 30% for mild, and DR > 30% for severe. Setting DR ≤ 10% as the healthy label was primarily chosen to optimize classification performance. Notably, the selection of a 30% threshold ensured the clearest possible distinction between adjacent severity levels.
- Step 2: Cross-scale sample-label transfer from 2.5 m RGB to 30 m multispectral imagery
First, the corresponding field-of-view ranges of the rice paddies in the images at the two altitudes were calculated using RTK positioning. Then, in the mosaicked and reconstructed 30 m altitude multispectral image, we delineated the areas corresponding to the RGB image for each cruise sampling point and created a shapefile. This operation was implemented using ENVI 5.6, a remote sensing image-processing software. Each RGB image corresponds to a 202 × 133-pixel area in the multispectral image. Based on this, 658 multispectral images were segmented according to the shapefile. By following the steps described above, we have achieved dual-scale spatial image matching using RTK information. Subsequently, edge pixels were removed, and the images were resized to 192 × 128 pixels. Each multispectral image was then equally divided into six non-overlapping 64 × 64-pixel sub-images. To further control data quality, we further removed two types of interfering samples. The first type is imagery, in which angle deviations during the drone’s turning phase may affect registration accuracy. The second type is sub-images containing mixed information from non-target objects because the positioning points were close to the field ridges. The initial RBLB detection dataset was constructed, which included 2741 images with disease labels.
3.1.2. Data Augmentation for RBLB Detection Dataset
We further applied data augmentation to the RBLB detection dataset we initially constructed. First, the 2741 multispectral image sub-images were divided into training, validation, and Test 1 sets in a 7:1:2 ratio, containing 1918, 275, and 548 samples, respectively. Meanwhile, a completely new dataset from Field C was used as Test 2. To avoid data leakage and accurately reflect the model’s generalization ability, data augmentation was only applied to the training set. Data augmentation was performed using perturbation augmentation and geometric transformations. First, brightness change, random noise, and blurring were applied to simulate field-environment disturbances. A total of 100 samples were added to each disease severity category, resulting in 1064, 626, and 1130 samples for healthy, mild, and severe cases in the training set, respectively (Table 1). This data augmentation can improve the model’s robustness to spectral variations. Based on this, random geometric augmentation was dynamically applied during training, including horizontal and vertical flipping and 90°, 180°, and 270° rotations. This real-time geometric augmentation strategy does not fix the number of augmented samples. Since it is applied stochastically at each epoch, the model encounters different transformed versions of each original sample during training. As a result, the effective training data size far exceeds the static set of 2820 samples. Statistics from our subsequent training process show that, on average, the model processes approximately 15,360 effective samples per epoch (6112 for healthy, 2608 for mild, and 6640 for severe), an increase of about 5.4 times over the static sample size. This substantial increase in effective data scale can significantly improve the model’s adaptability to changes in spatial perspective.
Table 1.
Dataset partitioning and perturbation augmentation of the training set.
3.1.3. Feature Augmentation for RBLB Detection Dataset
In addition to data augmentation on the training set, we further expanded the dataset’s feature space by computing and selecting vegetation indices sensitive to RBLB. In remote sensing-based disease monitoring, vegetation indices can effectively enhance the spectral response differences between crop physiological status and disease stress and are therefore often used to highlight disease-related features. Based on the spectral characteristics of bacterial blight, this study selected six relevant vegetation indices, whose calculation formulas are shown in Table 2. To further reduce feature redundancy and enhance their relevance to plant diseases, we employed correlation analysis to select features. We removed vegetation indices that were highly correlated with one another (R2 > 0.8) and showed weak associations with disease severity, yielding a more concise and discriminative feature set. Finally, to systematically evaluate the impact of feature enhancement on disease detection performance, we constructed the following three datasets for comparative analysis. Dataset A only contains original multispectral bands (OMBs). Dataset B only contains the disease-sensitive optimal vegetation indices (OVIs) for RBLB. Dataset C combines both OMBs and OVIs s to examine the performance of the combined features.
Table 2.
Vegetation indices used in this study for RBLB.
3.2. RBLB Detection Model Construction Through Spectral–Spatial Dual-Branch Feature Fusion Architecture
Using UAV-based multispectral imagery, we developed a deep learning model with a spectral–spatial dual-branch feature fusion architecture (DualRiceNet) to detect RBLB severity at the field scale. The model includes a spectral branch, a spatial branch, and a cross-attention fusion mechanism module, and the specific technical process is shown in Figure 3.
Figure 3.
The process diagram of the DualRiceNet model.
3.2.1. Spectral Branch
Multispectral UAV imagery, with its four spectral bands or calculated vegetation indices, contains spectral features that reflect changes in vegetation health. However, there are significant nonlinear coupling relationships between these features, and the impact of diseases on spectral features is often very weak. Traditional convolutional structures struggle to effectively capture long-range dependencies between different spectral features in the spectral dimension. To enhance the expressive power of spectral features, this study constructed a Transformer-based spectral feature extraction branch. The Transformer structure can effectively establish long-range feature dependencies via a self-attention mechanism, thereby capturing global contextual information [39,40] and enabling the mining of intrinsic correlations among multispectral features.
First, the spatial dimensions of the input multispectral image are flattened into a sequence dimension, yielding a flattened spectral sequence feature . Where represents the number of spatial locations, C represents the number of spectral channels, and B represents the batch size. The original spectral channels are low-dimensional. Their direct use in the attention mechanism would create a severe information bottleneck, thereby hindering effective feature representation and degrading the attention matrices. This would hinder the model’s ability to capture the nonlinear dependencies between spectral features. Therefore, this study maps the spectral features to a higher-dimensional embedding space using a linear projection layer, enhancing the expressive power of the spectral vectors. In this, the hidden dimension d = 64. This allows the Transformer to model relationships among spectral features in a richer feature subspace, yielding more stable and comprehensive spectral feature learning.
After completing the high-dimensional embedding, the model uses a three-layer stacked Transformer encoder to perform deep modeling on the high-dimensional embedding space Z. Each encoder layer consists of a multi-head self-attention module and a feedforward network. The number of attention heads is set to 4. Residual connections and layer normalization are combined to stabilize the training process. The self-attention mechanism performs global comparisons of spectral patterns across all pixels. This allows it to capture long-range dependencies, which are difficult for traditional convolutions to model, and to identify subtle spectral changes induced by bacterial blight. This cross-band global nonlinear modeling capability is key to improving the performance of multispectral disease severity grading. The three-layer stacked Transformer encoder produces global spectral features S, thereby providing highly expressive spectral representations for subsequent cross-attention fusion. This design enables the model to fully capture variations in disease severity across both spectral and spatial domains.
3.2.2. Spatial Branch
The spatial branch aims to fully extract the spatial distribution characteristics and morphological structure of disease lesions from multispectral images captured by drones, to assist in assessing the severity of bacterial blight. First, the input multispectral image passes through a 3 × 3 convolutional layer, followed by batch normalization and a ReLU activation function. This pipeline maps the input to more discriminative primary spatial features to achieve local smoothing, noise suppression, and the extraction of local texture information. Since the original images often contain factors such as uneven illumination, noise, and weed interference, directly feeding the original bands into dilated convolutions can easily amplify noise and degrade feature quality. Therefore, constructing a stable, continuous spatial feature representation using a shallow convolutional layer improves the reliability of subsequent multi-scale feature extraction.
The occurrence and development of RBLB exhibit distinct multi-scale evolutionary characteristics in space. In the early stages of the disease, lesions are mostly confined to the leaf tips, appearing as discrete point-like lesions. As severity increases, the lesions expand and merge along leaf veins, eventually forming large, strip-like necrotic areas. This process clearly demonstrates the spatial heterogeneity of the disease, from local infection to overall spread. Therefore, after primary spatial feature extraction, an atrous spatial pyramid pooling (ASPP) module is employed to capture multi-scale disease-texture features, namely the spatial distribution and morphology of RBLB. ASPP facilitates multi-scale contextual feature extraction and expands the receptive field while maintaining a manageable parameter size and computational cost [41,42,43]. In our study, the ASPP module employs a six-parallel-branch structure to model multi-scale receptive fields for the primary spatial features. Specifically, ASPP includes a 1 × 1 convolutional branch and four 3 × 3 atrous convolutional branches with different dilation rates (1, 6, 12, 18) to extract local and contextual features at different spatial scales. ASPP also includes a global average pooling branch, parallel to the convolutional branches, to obtain global contextual information. The six parallel branches are concatenated along the channel dimension, and feature fusion is performed using 1 × 1 convolution. Batch Normalization and ReLU activation functions are introduced at each branch and during the feature fusion stage to enhance nonlinear expressiveness. The final multi-scale spatial features were denoted as . This network can extract local fine textures, leaf-structure information, and large-scale background changes in parallel, thereby achieving effective fusion of multi-scale spatial information. Furthermore, ASPP’s atrous convolution expands the receptive field without significantly increasing the number of parameters, thereby reducing computational complexity. This maximizes the preservation of spatial differences across disease severity levels, providing a structurally sufficient and scale-rich spatial feature representation for subsequent spectral–spatial cross-attention fusion.
3.2.3. Cross-Attention Fusion Mechanism
The spectral branch and the spatial branch, respectively, focus on extracting spectral-dependent features and spatial structural features from multispectral data. However, RBLB not only manifests as changes in leaf spectral reflectance across disease stages but also exhibits differences in spatial texture and lesion morphology. Therefore, relying solely on spectral or spatial features makes it difficult to comprehensively describe the distribution of disease characteristics. However, traditional feature concatenation or weighting methods fail to establish an explicit mapping between spectral variations and their corresponding spatial regions, which can easily lead to ambiguous information fusion and limit the model’s discriminative ability. Therefore, to achieve deep interaction and adaptive fusion between spectral and spatial features, a cross-attention fusion mechanism is introduced to efficiently integrate these two types of information at the feature level.
The feature tensor output from the spectral branch is denoted as . The feature tensor output from the spatial branch is reconstructed as . In them, B denotes the batch size, N denotes the number of spatial locations of the features, and d denotes the feature dimension. The cross-attention module uses three linear transformation layers to map the input features to query vectors , key vectors , and value vectors . The spectral features S are used as the query to guide the attention mechanism in selecting the most relevant spatial features P. The correlation between the query and the key is computed as a dot product, and the attention weight matrix A is obtained via Softmax normalization.
This weight matrix reflects the strength of spectral–spatial correlations across different spatial locations. Subsequently, the fused output is obtained via weighted summation, integrating complementary information from the spectral and spatial branches.
3.2.4. Loss Function
To mitigate the impact of the imbalance in the distribution of healthy, mildly affected, and severely affected samples in the training set on model learning, this study employs the Focal Loss function. Compared to traditional cross-entropy, Focal Loss reduces the loss contribution of easily classified samples and increases the model’s attention to minority and difficult-to-classify samples. The basic form of Focal Loss is as follows:
Here, is the predicted probability of the model for the true class, is the class balancing coefficient, and is the modulating factor. We set to enhance the model’s discriminative ability on difficult-to-classify categories such as mild diseases.
For multi-class scenarios, Focal Loss can be written as:
Here, C is the number of classes, and is the one-hot encoding label. The class weight is calculated based on the number of samples for each class in the training set as follows:
Through this loss function design, the model can effectively balance class imbalance during training, improving sensitivity to difficult-to-detect categories such as mild diseases, thereby enhancing overall classification performance.
3.3. Model Training, Comparison, and Evaluation
This study trains, validates, and evaluates the constructed DualRiceNet model through the following four aspects.
First, ablation experiments were conducted to validate the effectiveness of the proposed model architecture. To ensure a direct, objective evaluation free of manual feature design bias, we used Dataset A (OMBs) to train DualRiceNet. This dataset is the most basic and versatile, containing only the original multispectral bands. Subsequently, the individual contributions of the spectral branch, spatial branch, and cross-attention fusion module were evaluated separately.
Second, the system compares the impact of different feature inputs on model performance. The model input dataset includes three datasets: Dataset A (OMBs), Dataset B (OVIs), and Dataset C (the combination of OMBs and OVIs). The OMBs directly provide complete spectral reflectance information details, laying the foundation for the model to extract fine-grained spectral features. The OVIs enhance the expression of vegetation’s physiological and biochemical characteristics, exhibiting greater sensitivity and robustness to diseases. The combination of OMBs and OVIs allows for the simultaneous preservation of low-level spectral information details and high-level physiological response semantic features, creating a complementary effect. This combination enables the spectral and spatial branches to learn discriminative patterns from richer data and more effectively focus on key disease representations through a cross-attention fusion mechanism. By comparing these three input types, the contribution of different feature sources to model performance can be comprehensively evaluated, thereby verifying the adaptability of the constructed spectral–spatial fusion mechanism in multi-feature scenarios.
Third, we compared the performance of our method with existing mainstream methods. We selected three typical methods: random forest (RF) [44], ResNet-18 [45], and three-dimensional convolutional neural network (3D-CNN) [46], and trained and tested them on the three datasets mentioned above. We then compared their results with those of DualRiceNet to evaluate the performance of our proposed model. The RF algorithm is an ensemble learning method that builds multiple decision trees and uses voting or averaging to make predictions. During training, the model uses bootstrap sampling to create data subsets. Additionally, it randomly selects a subset of features at each node split. These techniques work together to improve the RF model’s generalization and reduce the risk of overfitting. In this study, 100 estimators were used. The maximum depth was 4. The minimum number of samples per leaf node was 2 [44]. In remote sensing image classification tasks, the number of data samples is often small, which can easily lead to overfitting. ResNet-18 [45,47] is a deep residual network used for image recognition. It has a small number of parameters and low computational complexity, and the residual connections help prevent overfitting. These characteristics make ResNet-18 well-suited for remote sensing image classification. Furthermore, 3D-CNN can simultaneously extract spatial–spectral features along both spatial and spectral dimensions. 3D-CNN has been successfully applied to wheat stripe rust detection based on multispectral UAV imagery [46]. Figure 4 and Figure 5 show the network architectures of ResNet-18 and 3D-CNN used in this study.
Figure 4.
The network structure of ResNet-18 in this study.
Figure 5.
The network structure of 3D-CNN in this study.
Fourth, to comprehensively evaluate the model’s performance, we additionally conducted two validations. First, we further evaluated the models’ stability and reliability using five-fold cross-validation on the dataset that achieved the highest accuracy in the previous modeling experiments. Second, we tested the model’s generalization ability on independent scenarios. The DualRiceNet model trained on Dataset A was directly applied to the multispectral imagery of Field C (Test 2). Test 2 was not included in the model’s training. Thus, this dataset can be used to assess the severity of bacterial blight at the field scale, thereby further validating the model’s practicality and generalization.
Furthermore, all experiments were quantitatively evaluated using four metrics to ensure the comparability and scientific validity of the results. These metrics include overall accuracy (OA), Precision, Recall, and F1-score. The definitions of these metrics are as follows:
Here, TP represents the number of correctly predicted positive samples. TN represents the number of negative samples correctly predicted by the model. FP represents the number of positive samples incorrectly predicted by the model. FN represents the number of negative samples incorrectly predicted by the model.
The experiments were conducted on a computing platform equipped with an Intel Xeon CPU (Intel Corporation, Santa Clara, CA, USA), 16 GB of RAM, and an NVIDIA Tesla P100 GPU (NVIDIA Corporation, Santa Clara, CA, USA). The deep learning components were implemented using the PyTorch 2.9.0 framework. During model training, the initial learning rate was set to 0.001. The Adaptive Gradient (AdaGrad) optimization algorithm was used to improve the stability and efficiency of parameter updates.
4. Results
4.1. The Response of Different Vegetation Indices to RBLB
Figure 6 shows the correlation between the six vegetation indices. The vegetation indices exhibited varying degrees of correlation. In them, only RBBBDI and RBBRI, and NGRDI and GI have R2 values exceeding 0.8. Ultimately, we selected four vegetation indices, RBBBDI, GRE, PSRI, and NGRDI, that exhibited low redundancy and strong complementarity. These four indices served as core physiological parameters for subsequent model input and disease characteristic analysis.
Figure 6.
Coefficients of determination (R2) between different vegetation indices.
Figure 7 shows the response characteristics of healthy, mild, and severe disease samples across four vegetation indices: RBBDI, GRE, PSRI, and NGRDI. The effectiveness of different indices in distinguishing disease levels varies. Among them, RBBDI showed the best ability to differentiate between the three disease levels. The RBBDI values of healthy samples were concentrated in the high range, while those of mild samples decreased significantly, and those of severe samples decreased further. The distribution overlap of the three sample types was low, and the gradient characteristics were clear. NGRDI and PSRI could effectively distinguish between healthy/mild samples and severe samples. The NGRDI values for healthy and mild samples were both concentrated in the high-value range and overlapped in distribution, whereas those for severe samples were significantly lower. PSRI showed the opposite pattern to NGRDI. The PSRI values for healthy and mild samples were concentrated in the low-value range and overlapped in distribution, whereas those for severe samples were significantly higher. These characteristics resulted in NGRDI and PSRI having a clear boundary between the distribution of healthy/mild and severe samples. The GRE had a limited ability to distinguish between disease levels. There was significant overlap in the GRE value ranges of the three sample types.
Figure 7.
Response of vegetation indices to RBLB.
4.2. Ablation Experiment of DualRiceNet Based on Dataset A
Ablation experiments were conducted on the OMBs (Dataset A) to verify the effectiveness of each module. In addition to validating the three core modules of DualRiceNet, we introduced several commonly used components from baseline models. These include a 1 × 1 CNN for spectral analysis, a 3 × 3 CNN for spatial analysis, and two fusion methods: feature addition and feature concatenation. To provide a more comprehensive comparison, these components were then combined and evaluated alongside the three modules of DualRiceNet. The ablation experimental results are shown in Table 3. When only the spectral branch was used, the model achieved an OA of 91.2%, indicating that spectral features have strong discriminative power for detecting RBLB. Furthermore, its Recall and Precision were 85.8% and 89.1%, respectively, demonstrating stable performance in detecting most disease samples. When only the spatial branch was used, the OA was 90.2%, slightly lower than the spectral branch. This indicates that although spatial texture features can also reflect the morphological changes of the disease on the leaf surface, their discriminative power is weaker than that of spectral features. At the same time, its Precision decreased to 86.5%, indicating that spatial features are more susceptible to background noise and texture variations. When both spectral and spatial branches were introduced using the simplest feature addition fusion, the model’s overall performance improved, with OA remaining at 91.2% and F1-score increasing to 87.9%. This shows that spectral and spatial information are complementary, and their combination can enhance the model’s ability to perceive subtle changes in the disease. An interesting result is that when feature concatenation fusion is used instead of feature summation fusion, the model OA drops to 90.8%, and the other three metrics also decrease. After further replacement with the cross-attention module, the model’s performance peaked, with OA increasing to 92.3% and Precision, Recall, and F1-score also increasing to 89.9%, 88.3%, and 89.0%, respectively. This result indicates that cross attention can highlight more discriminative features by adaptively allocating attention weights, thereby strengthening the correlation between spectral and spatial features and ultimately improving the model’s detection accuracy. Furthermore, replacing the spectral branch from a Transformer to a 1 × 1 CNN reduced the model OA by 2.8%. Replacing the spatial branch from an ASPP to a 3 × 3 CNN reduced the model OA by 1.1%. These ablation results further validate that both the Transformer and the ASPP are both critical to DualRiceNet.
Table 3.
Ablation experiments of different branches of the model based on Dataset A.
The ASPP module in the spatial branch of DualRiceNet has a relatively complex structure, consisting of six parallel branches. To systematically evaluate the independent contribution of each branch to model performance, we conducted additional ablation studies using Dataset A. The corresponding results are summarized in Table 4. The complete ASPP module (Experiment 7, which includes 1 × 1 convolution, four types of dilation-rate 3 × 3 convolutions, and a global average pooling branch) was used as the baseline, achieving the best performance. Removing any branch resulted in varying degrees of degradation in model performance. Specifically, removing the global average pooling branch (Experiment 6) had the least impact on model performance, with OA only decreasing to 91.4% and F1 decreasing to 87.8%. This indicates that the global context information provided by this branch plays a supplementary role rather than a core contribution. After removing the convolution branch with an expansion rate of 18 (Experiment 5), the OA decreased to 90.7%, and F1 decreased to 87.0%. This indicates that the context information of a large receptive field is helpful for disease detection. In contrast, removing the 1 × 1 convolutional branch (Experiment 1) reduced the OA to 90.2%, with a particularly significant decrease in F1 (85.0%, a 4.0% reduction from the baseline). This indicates that this branch plays a crucial role in feature-channel interaction and the preservation of local detail. Removing convolutional branches with dilation rates of 1, 6, and 12 (Experiments 2–4) resulted in decreases in OA (89.6% to 90.0%) and F1-scores (below 86%). Among these, removing the branch with a dilation rate of 1 (Experiment 2) yielded the worst performance (OA of 89.6% and F1 of 82.7%). This demonstrates that convolutional branches with small-to-medium dilation rates (1, 6, 12) are essential for capturing the fine texture and local spatial patterns of lesions. Their absence significantly impairs the model’s ability to perceive lesion details. These results demonstrate that the multi-branch design of the ASPP module, through the synergistic effects of different receptive fields, achieves effective modeling of the disease’s multi-scale spatial characteristics.
Table 4.
Ablation experiments of different branches of the ASPP module based on Dataset A.
4.3. Comparison and Evaluation of the DualRiceNet Model with Different Input Datasets
Table 5, Table 6 and Table 7 compared DualRiceNet with existing models, RF, ResNet-18, and 3D-CNN across different input data types. The results show that both the input feature type and the model structure significantly affect disease-detection performance. Overall, traditional machine learning models (RF) showed some stability across the three input data types but exhibited significant deficiencies in detecting mild disease categories. Although the deep learning models ResNet-18 and 3D-CNN achieved high accuracy in the healthy and severe disease categories, their Recall for the mild disease category was significantly low, indicating their limitations in distinguishing subtle disease features.
Table 5.
Accuracy results of different models on Test 1 based on Dataset A.
Table 6.
Accuracy results of different models on Test 1 based on Dataset B.
Table 7.
Accuracy results of different models on Test 1 based on Dataset C.
DualRiceNet performed best across all three datasets. When using Dataset A as input, DualRiceNet achieved a higher OA of 92.3% compared to other models, showing a significant advantage in Precision and F1-score for mild disease cases (Table 5). When Dataset B was used as input, the performance of all models improved, but DualRiceNet showed the largest gain, reaching an OA of 94.0% (Table 6). When using Dataset C as input, DualRiceNet achieved substantial improvements in mild disease detection, with the F1-score increasing to 82.1% and the OA reaching 94.5%, the best result across all experiments (Table 7). These results demonstrate that the spectral–spatial dual-branch structure and the attention fusion mechanism employed by DualRiceNet effectively leverage correlations among multi-source features, thereby significantly improving the stability and accuracy of disease detection.
Furthermore, among the three datasets, the models built on Dataset C achieved the best overall performance for all methods except 3D-CNN. Therefore, we conducted five-fold cross-validation on Dataset C to further evaluate the performance of the four methods. Table 8 shows the average accuracy results for each model under five-fold cross-validation on dataset C. Among all models, DualRiceNet still achieved the highest OA of 93.9%, outperforming RF (90.5%), ResNet-18 (91.9%), and 3D-CNN (91.3%). DualRiceNet also performed excellently in terms of precision and F1-score, reaching 93.7% and 91.5%, respectively, which are 1.5–4.8% higher than those of the comparison models. This indicates that DualRiceNet maintains a good balance between accuracy and stability across different fold numbers. To further verify the statistical significance of DualRiceNet’s performance improvement, we performed a paired-samples t-test on its OA and the comparison models’ OA in five-fold cross-validation. The results show that the p-values for all comparisons were much smaller than the significance level α = 0.05 (p < 0.001), and the t-values were all positive (Table 9). This indicates that the performance difference between DualRiceNet and the comparison models is highly statistically significant, with DualRiceNet’s classification accuracy being significantly higher than that of the comparison models.
Table 8.
Average accuracy results of five-fold cross-validation for different models based on Dataset C.
Table 9.
Paired t-test results of OA between DualRiceNet and compared models in five-fold cross-validation on dataset C.
4.4. Evaluation of the Generalization Ability of the DualRiceNet Model Based on Test 2
We further used Test 2, which was not included in the model training, to quantify the generalization ability of the four method models trained on Dataset A in unknown environments. Figure 8 shows the confusion matrices for the four models trained on Dataset A. By category, RF and 3D-CNN had the highest number of correct detections in the healthy category, with 19 samples each. In the mild disease category, ResNet-18 outperformed other models, correctly detecting 43 mild samples, but it still exhibited some confusion in healthy and severe cases. For severe disease, DualRiceNet performed the best, correctly detecting 42 samples. In terms of overall performance, 3D-CNN exhibited the weakest generalization, with an accuracy of 62.5%. In contrast, DualRiceNet achieved the highest OA of 80.0% under this input condition, demonstrating stronger generalization ability.
Figure 8.
Confusion matrices of RBLB detection results for Field C using (a) RF, (b) ResNet-18, (c) 3D-CNN, and (d) DualRiceNet models based on Dataset A.
4.5. Mapping RBLB Severity Using the DualRiceNet Model Trained with Dataset A
We used the DualRiceNet model trained on Dataset A to map the field distribution of RBLB severity levels in three rice paddies (Figure 9). The results showed that the model-detected spatial pattern of the disease was highly consistent with the field survey. Specifically, Field A was dominated by healthy and mildly affected samples. Field B was dominated by severely diseased plants. The detection results for Field C also basically matched the actual survey results. These results demonstrate that our DualRiceNet model generalizes well across different regions.
Figure 9.
Spatial distribution of RBLB severity in (a) Field A, (b) Field B, and (c) Field C with RGB images as the background.
5. Discussion
5.1. Achieved the Quick Dataset Construction Through Cross-Scale Sample-Label Transfer Utilizing RTK Positioning and Semi-Automatic Interpretation
The disease-detection dataset construction strategy we proposed eliminates reliance on plant-protection investigators and standardized experimental fields. By leveraging semi-automatic disease interpretation and RTK-based cross-scale sample-label transfer, it built a high-quality, reliable, representative, and applicable dataset for deep learning models. This solution systematically addresses two key limitations currently faced by UAV remote sensing in crop disease detection at the data level.
Traditional small-sample manual survey methods [48] face significant limitations in representativeness and scale. Their limited sample size and subjective spatial distribution make these methods unsuitable for supporting data-driven deep learning models. To address this, our study employs drone-based near-ground fixed-point cruising to rapidly and non-destructively acquire high-definition RGB images that evenly cover the entire field (Figure 1). This approach quickly increases the effective sample size from dozens (in traditional methods) to hundreds, fundamentally meeting the basic requirements of deep learning for data scale and distribution. However, it should be noted that the waypoint planning in this study relied on manual layout in ArcGIS, which is inherently subjective and labor-intensive. Future research will adopt more standardized and automated waypoint-generation methods, such as creating regular fishing-net grids in ArcGIS to assist with waypoint setting, to reduce manual intervention and improve the method’s repeatability and efficiency.
Existing large-scale manual annotation methods [49] rely on standardized experimental fields, which are costly, inefficient, and poorly aligned with the complex environment of real rice paddies. Actual fields typically have variable planting structures, interwoven ridges, and blurred disease boundaries. Therefore, models trained on idealized experimental field data often lack practicality and generalizability in real-world applications. To address this, we developed a rapid label-generation method (Figure 2). This method, utilizing RTK technology, enables cross-scale migration of disease labels interpreted from near-ground (2.5 m above the rice canopy) high-resolution RGB images to high-altitude (30 m) multispectral images. This method minimizes systematic errors and improves the spatial accuracy of disease information during cross-scale transmission. But, even with the same RTK UAV system, centimeter-level positioning errors may still occur between independent flights. This could lead to pixel-level misalignment in the 30 m multispectral image, potentially causing spatial shifts during label migration. Furthermore, low-altitude flight at 2.5 m inevitably introduces localized shifts in rice plants caused by UAV wind fields and geometric distortions from the center outward, whereas the 30 m multispectral image is largely unaffected by these factors. The differences between the two image scales also inevitably introduce some errors into label migration. It is worth noting, however, that our disease labels are not acquired at the pixel level, nor are they based on individual leaves, but rather on DR statistics within the quadrat scale. This approach significantly reduces the impact of local image distortion or leaf-level misalignment. Furthermore, while edge geometric distortion in near-ground images introduces deformation, it also provides multi-angle observations. This mitigates to some extent the problem of lower-level diseased leaves being easily obscured and difficult to estimate within the vertical field of view. Simultaneously, we conducted further quantitative verification of the disease-label generation method’s reliability. Specifically, disease severity levels were determined by randomly placing bounding boxes and visually interpreting each acquired high-resolution RGB image. Simultaneously, we conducted field surveys of 40 sample plots across different disease severities and microenvironments, strictly following traditional plant protection survey standards. The comparison results of the two methods showed a high degree of consistency through an R2 of 0.871 between the image interpretation results and the field plant protection survey data (Figure 10). This strongly demonstrates the reliability of the disease sample labels generated by our high-resolution image interpretation method.
Figure 10.
Comparison of RBLB plant protection survey results and RGB image visual interpretation.
Although the label transfer strategy effectively alleviates the sample-labeling problem, it still falls short of meeting the requirements of deep learning algorithms for large-scale training data. At the same time, data augmentation can effectively increase sample diversity, thereby limiting overfitting and improving the model’s generalization across different environmental conditions [50]. Based on this, we further introduced two data augmentation strategies, including perturbation augmentation and geometric augmentation. Among them, perturbation augmentation aims to simulate image color shifts, noise interference, and changes in sharpness caused by various factors during actual UAV remote sensing data acquisition. These factors include weather changes (e.g., cloud movement leading to variations in solar irradiance), flight differences (e.g., sudden changes in flight attitude), and ground environmental interference (e.g., sensor noise and environmental disturbances) [51,52]. All these factors can cause variations in spectral reflectance. Meanwhile, existing studies have shown that severe weather and image distortions significantly reduce model performance, whereas introducing corresponding perturbation augmentations during training can greatly improve the model’s detection accuracy in complex environments [53], which fully demonstrates that considering real environmental perturbations during training is crucial for improving the model’s generalization. Therefore, we employed three perturbation augmentation operations, brightness change, random noise, and blurring, to address these potential issues in real-world acquisition scenarios. However, these perturbation augmentation methods may alter the original spectral distribution of multispectral images, thereby negatively impacting the model. To verify this, we further compared the average reflectance of the original image and samples augmented by the three perturbation methods in different bands (Figure 11). The results show that the mean reflectance of the augmented samples in each band is very close to that of the original samples, with differences all within 0.005—which indicates that these operations, while introducing diversity, did not significantly distort the overall spectral distribution characteristics. Furthermore, our model achieved an OA of 91.2% on dataset A and 80% on the cross-region test (Test 2), demonstrating the positive contribution of perturbation augmentation data to the model’s generalization. However, since the perturbation augmentation in our study was performed before geometric augmentation, we did not separately evaluate its contribution to model accuracy. This will be explored further in future work.
Figure 11.
Average spectral reflectance for multispectral images of three perturbation-augmented and original Fields A and B.
5.2. Enhanced Discriminative Power Through Cross-Attention-Driven Adaptive Fusion of Spectral and Spatial Features
Our proposed DualRiceNet is based on the core design principle of a dual synergistic representation of RBLB that encompasses spectral response and spatial morphology. Spectral changes reflect systemic changes in leaf physiology, while spatial textures reveal the geometric patterns of lesion expansion. The introduction of a cross-attention fusion mechanism aims to achieve deep interaction and adaptive collaboration between spectral and spatial features. The DualRiceNet goal is to overcome the limitations of a single feature modality in comprehensively characterizing the disease’s complex manifestations.
We analyzed the contribution and effectiveness of each module of DualRiceNet through ablation experiments (Table 3). When operating independently, the Transformer-based spectral branch achieved an OA of 91.2%, confirming its effectiveness in modeling global nonlinear dependencies among multispectral bands and sensitively capturing subtle spectral changes caused by diseases. The ASPP-based spatial branch alone achieved an OA of 90.2%, underscoring its importance for capturing lesion morphology, texture, and multi-scale distribution. Notably, its lower Precision (86.5%) compared to the spectral branch (89.1%) reflects the inherent challenge of spatial features being more susceptible to interference from complex field backgrounds. Introducing cross-attention mechanism for feature fusion yielded the best OA (92.3%), outperforming both feature addition (91.2%) and concatenation (90.8%). This substantiates that the cross-attention mechanism can adaptively enhance discriminative representations by weighting correlations between spatial regions and the disease-severity spectral changes, thereby establishing their precise associations. Further component substitutions, replacing the spectral Transformer with a 1 × 1 CNN, reduced OA by 2.8%, while substituting the spatial ASPP with a 3 × 3 CNN decreased OA by 1.1%, underscoring the critical contributions of both core modules. Collectively, these results demonstrate that the synergistic design of Transformer-based spectral modeling, ASPP-based multi-scale spatial encoding, and cross-attention fusion is essential for achieving optimal disease detection performance.
Furthermore, to comprehensively evaluate DualRiceNet’s feature processing and fusion capabilities, we systematically tested its performance across three input types. These inputs include OMBs (Dataset A), OVIs (Dataset B), and their combination (Dataset C). We also compared its performance with RF, ResNet-18, and 3D-CNN.
The four algorithm models using OVIs that incorporate expert prior knowledge outperformed OMBs-based models (Table 5 and Table 6). Specifically, except for the RF model with an OA of 91.8%, the OAs of ResNet-18, 3D-CNN, and DualRiceNet increased by 2.0%, 3.9%, and 1.7%, respectively. The mild-label F1-scores across the four algorithms increased by 0.2%, 3.5%, 12.0%, and 5.9%, respectively. These results indicate that, compared to the OMBs, the artificial OVI focused on information strongly correlated with physiological stress. Which can reduce the models’ learning difficulty to some extent and help them capture disease changes more efficiently.
When using the combination of OMBs and OVIs as input, the four algorithms showed different performances (Table 6 and Table 7).
The OA of the ResNet-18 model remained at 92.5%, but its mild-label F1-score decreased by 2.8%. Compared to OVIs, the OVI-based 3D-CNN model showed a decrease in overall performance, with its OA and mild-label F1-score decreasing by 1.5% and 6.3%, respectively. These results indicate that simply concatenating multi-source features without deep processing may introduce noise or irrelevant information, which might interfere with the learning of both ResNet-18 and 3D-CNN models, also demonstrating their limitations in adaptive selection of cross-modal features and in deep fusion. Simultaneously, we observed that 3D-CNN showed a stronger dependence on manual feature engineering and weaker resistance to interference than ResNet-18. This difference between ResNet-18 and 3D-CNN may stem from their fundamental architectural assumptions. The core of 3D-CNN lies in its 3D convolutional kernel, which slides simultaneously along both spatial and spectral dimensions, assuming local spectral continuity in the input [54]. When the input consists of multiple homogeneous vegetation indices, even when discretely arranged, each index provides highly discriminative features strongly correlated with the disease. The consistency and quality of the information compensate for the lack of continuity, allowing their advantages to be leveraged, thereby demonstrating a strong dependence on these high-quality, manually engineered features. However, when OMBs are heterogeneously mixed with OVIs, the local continuity and physical consistency of the input in the spectral dimension are completely disrupted. This resulted in 3D-CNN being unable to effectively learn under its presupposed continuity assumption, and its joint modeling mechanism also failed, leading to a significant performance decline and reduced resistance to interference. In contrast, ResNet-18, as a 2D network, treats different bands as independent channels for spatial fusion, without strong assumptions about spectral continuity [55]. This may make ResNet-18 more tolerant of variations in feature structure, leading to stronger resistance to interference and a lower dependence on manual feature engineering.
When combined with OMBs and OVIs as inputs, the performance of both the RF model and our proposed DualRiceNet model was further improved. The OA and mild-label F1-score of the RF model both increased by 0.2%. The OA and mild-label F1-score of the DualRiceNet model increased by 0.5% and 0.1%, respectively. These results indicate that although the OA of the RF model is lower than that of deep learning algorithms, it is more robust to interference. This may be because the RF algorithm is based on an ensemble-learning paradigm that uses decision trees. Through implicit feature-importance selection, RF automatically reduces the weight of noise and redundant features during training, thereby filtering out irrelevant information [56]. Simultaneously, its relaxed requirements for feature distribution and structure allow it to handle heterogeneous combined inputs flexibly. In addition, the multi-tree ensemble effectively reduces variance, thus maintaining stability [57]. However, this filtering-averaging mechanism is essentially robust but shallow statistical learning. Which makes RF difficult to uncover deep non-linear associations and synergistic effects between multi-source features. Therefore, its performance ceiling is usually lower than that of deep learning models capable of complex feature interaction and fusion. Unlike RF, our proposed DualRiceNet, through its spectral–spatial dual-branch design, separates and strengthens feature representations across modalities at the source. Meanwhile, DualRiceNet combines a cross-attention mechanism to dynamically establish associations between spectral changes and corresponding spatial regions, achieving cross-modal fusion. This architecture not only suppresses interference but also enables deeper understanding and adaptive fusion of multi-source features. Therefore, DualRiceNet exhibits superior discriminative power and robustness compared to traditional methods in complex field scenarios with low signal-to-noise ratios and weak features. Overall, our DualRiceNet showed great potential for graded detection of crop diseases and pests.
Despite DualRiceNet’s superior performance, confusion between adjacent severity levels, particularly in mild cases, remains a challenge. Across all datasets, the recall for the mild category (72.0–80.7%) is consistently lower than that for the healthy (95.9–97.7%) and severe (96.6–99.6%) categories (Table 5, Table 6 and Table 7). This indicates that a substantial proportion of mild samples were misclassified as healthy or severe. We attribute this confusion to two primary factors. First, although we defined three discrete severity levels, they were derived by reclassifying a continuous disease severity index. Consequently, samples near the category boundaries inevitably carry ambiguous characteristics. Second, the number of mild training samples is relatively limited (626 after perturbation augmentation), which may constrain the model’s ability to learn the full variability of the mild stage. Our future work will address this limitation through several strategies. First, more mild-stage samples will be collected to better represent boundary cases. Soft-label or ordinal regression approaches that respect the continuous nature of disease progression can also be explored. Temporal dynamics will be incorporated to leverage symptom development patterns for improved detection accuracy across all categories.
5.3. Strong Generalization of DualRiceNet Validated Across Quadruple Differences in Geography, Time, Phenology, and Variety
To systematically evaluate the generalization ability of DualRiceNet, we directly transferred it to an independent Test 2 (Field C) to verify its performance.
It should be noted that this evaluation was conducted using models trained on Dataset A (OMBs), rather than on the higher-performing Dataset C (the combination of OMBs and OVIs). This deliberate choice ensures a more rigorous assessment of generalization. First, the spectral bands in Dataset A follow a fixed band physical order, providing a stable input structure essential for reliable generalization evaluation. In contrast, vegetation indices are artificial constructs with no inherent order relationship. Their arbitrary channel order in Dataset C could introduce uncertainty that confounds the assessment of the model’s true generalization capability [58]. Thus, testing on OMBs alone establishes a stricter benchmark for evaluating the model’s ability to directly extract intrinsic disease patterns from sensor data.
In addition, Test 2 differs from Test 1, which was conducted on Fields A and B used for model training, in geography, time, rice phenology, and rice variety, thereby creating a comprehensive evaluation scenario. This scenario closely approximates the complexity of real-world farmland and can be used to rigorously test the model’s generalization ability. First, there are significant geographical differences between the two test sets (Figure 1). The Test 1 data originated from Ninghai County, located between the Tiantai Mountains and the Siming Mountains, and mainly consists of low mountains, hills, and alluvial plains [59]. Field C, located in Yuyao City for Test 2, has terrain that is higher in the south and lower in the north, and encompasses hills, river valleys, and alluvial plains [60]. This distinct topography and microclimate of the two locations constitute the first difference in the environment with respect to disease occurrence. Second, there are clear differences in time and rice phenology. The Test 1 data were collected during the rice heading period on 31 August 2024, when rice panicles were clearly visible (Figure 12a, upper-left, red circle). But the Test 2 data were collected during the rice jointing period on 16 August 2025 (Figure 12b, upper-left). This introduced interannual climate fluctuations and differences in key growth and development periods of rice. These two differences directly affected canopy structure, physiological state, and the background spectrum of disease expression. Furthermore, the rice varieties planted at the two locations differ (Figure 12). Variation in variety differences directly determines canopy structure, leaf morphology, and the physiological and biochemical baseline of plants. These are intrinsic genetic factors that underlie differences in population spectral backgrounds. Under the combined effects of geographic, time, rice phenology, and rice variety differences, the two data sets exhibit distinct spectral-feature distributions. Figure 11 clearly shows that the multispectral reflectance of Field C differs from that of Fields A and B in distribution. Under these different conditions, DualRiceNet still achieved a detection OA of 80.0% and performed best among all compared models (Figure 8). To further verify the model’s stability on independent Test 2, we conducted three random sampling tests. Each time, 80% of the samples in Test 2 were randomly selected for testing. The random sampling test results still show that the DualRiceNet outperformed the baseline models (Figure 13). Meanwhile, the DualRiceNet model’s OA across all three sampling tests was at least 79%, with an average OA of 79.6%, only 0.4% lower than that using the whole samples in Test 2. These results strongly demonstrate that DualRiceNet successfully isolates the multiple background interferences caused by geographical environment, interannual climate, growth stage, and even the variety itself. Its core strength lies in capturing highly specific and universal spectral recognition patterns triggered by the bacterial blight pathogen.
Figure 12.
Average spectral reflectance of multispectral imagery from (a) Fields A and B in Ninghai County, and (b) Field C in Yuyao City.
Figure 13.
Model validation results, including (a) OA, (b) Precision, (c) Recall, and (d) F1-score, using three random subsamples from independent Test 2.
However, due to the unpredictability of RBLB outbreaks and limitations imposed by human resources, the dataset used for cross-domain testing in this study (Test 2, Field C) contained only 120 samples. Although the overall accuracy of 80.0% provides valuable preliminary evidence of the model’s generalization potential in the complex environment of real farmland, the small test set size inevitably limits the statistical power of the conclusions. In the future, we will expand the test dataset by collecting samples from more years, geographical regions, and rice varieties to more robustly validate the model’s generalization ability.
5.4. Future Work
In our cross-scale sample-label transfer, the near-ground high-definition RGB images used for disease visual interpretation are acquired only from a vertical perspective. This approach may lead to the omission of disease spots in the lower canopy. Therefore, in the future, we will attempt to obtain more comprehensive disease information through multi-angle flights or controlled wind-field disturbances of the canopy. At the same time, the current reliance on visual interpretation for disease occurrence severely limits the efficiency of sample category labeling, hindering the rapid construction of large-scale datasets. In the future, we will explore integrating lightweight deep-learning detection models to enable fully automated upgrades.
Second, although we evaluated the model’s generalization ability on a completely new test set (Test 2 from Field C), both test sets were collected under clear weather conditions. However, cloudy weather is common in rice-growing regions of southern China, and changes in lighting conditions directly affect spectral characteristics. Therefore, it is crucial to test the model’s stability under different weather conditions in the future.
Third, our model demonstrated good generalization across different rice varieties and growth stages. However, we did not systematically evaluate differences in disease occurrence across rice varieties. We also did not systematically evaluate disease evolution patterns throughout the entire rice growth cycle. In the future, we will attempt to construct a standardized disease spectral library covering a wide range of cultivated varieties and key rice growth periods. The regulatory mechanisms of varietal characteristics and rice growth in disease detection models should also be explored to further improve the model’s applicability.
Furthermore, DR ≤ 10% generally represents an early stage of disease development, and accurate detection at this level is crucial for timely and effective control. However, in our disease severity classification, samples with DR ≤ 10% were labeled as healthy to improve separability, which limits our model’s ability to detect very early-stage infections. On the other hand, although RBLB occurred naturally in the field plots, the overall disease type was singular. Actual rice fields often face more complex conditions involving multiple pest and disease stresses. In future work, we will pursue more refined disease severity detection and incorporate image datasets containing mixed occurrences of multiple pests and diseases, including rice blast, sheath blight, and leaf folder.
6. Conclusions
We proposed DualRiceNet, a method for detecting RBLB severity using UAV-based multispectral imagery. This method integrated a dual-scale sample label transfer mapping with a spectral–spatial dual-branch feature cross-fusion network. High-precision detection of disease severity levels at the field scale is achievable.
For the sample dataset, disease sample points were first collected via near-ground fixed-point inspections with a UAV system. The sample labels were then annotated using high-definition RGB images through visual interpretation. Finally, using high-precision RTK positioning as a technical bridge, these disease labels can be successfully transferred to UAV-based multispectral imagery acquired at 30 m altitude. This approach ensures spatial accuracy while efficiently expanding the modeling sample size, significantly reducing the cost of traditional manual surveys. Thus, the practical constraints posed by insufficient sample size in disease remote sensing detection can be effectively addressed.
In terms of model performance, DualRiceNet demonstrated superiority across a range of input features. When using OMBs as input, its OA reached 92.3%, outperforming RF, ResNet-18, and 3D-CNN. When using OVIs as input, the accuracy improved further to 94.0%, remaining the best among the four methods. When combining OMBs and OVIs, the performance of the ResNet-18 and 3D-CNN models decreased, while DualRiceNet still showed a slight improvement in accuracy. These results demonstrate that DualRiceNet excels at multimodal feature fusion and at handling class imbalance.
Most importantly, DualRiceNet achieved the highest OA of 80.0% when tested on independent datasets with significant differences in geography, time, phenology, and variety. This result demonstrates that DualRiceNet possesses strong generalization ability to real-world environmental variations in rice fields. Which means that our DualRiceNet can effectively isolate interference from complex farmland backgrounds and capture the spatial–spectral response patterns of the diseases themselves.
Author Contributions
Conceptualization, H.M., Z.G. and J.Z.; methodology, Z.G. and Y.J.; software, Z.G., Y.J. and D.L.; validation, Z.G., D.L. and D.C.; formal analysis, H.M. and Z.G.; investigation, Z.G., D.L. and D.S.; resources, H.M., D.C. and J.Z.; data curation, Z.G., Y.J. and D.L.; writing—original draft preparation, H.M. and Z.G.; writing—review and editing, D.C. and D.S.; visualization, H.M., Z.G., Y.J., D.L. and D.S.; supervision, D.C. and J.Z.; project administration, J.Z.; funding acquisition, J.Z., H.M. and D.C. All authors have read and agreed to the published version of the manuscript.
Funding
This research was funded by the National Natural Science Foundation of China, grant number 42401400 and 42201412; and the Zhejiang Provincial Natural Science Foundation of China, grant number LR25D010003 and ZCLZ24F0201.
Data Availability Statement
Some of the data are available upon reasonable request.
Conflicts of Interest
The authors declare no conflicts of interest.
References
- Zahra, N.; Hafeez, M.B.; Nawaz, A.; Farooq, M. Rice production systems and grain quality. J. Cereal Sci. 2022, 105, 103463. [Google Scholar] [CrossRef] [Scilit]
- Conde, S.; Catarino, S.; Ferreira, S.; Temudo, M.P.; Monteiro, F. Rice pests and diseases around the world: Literature-based assessment with emphasis on Africa and Asia. Agriculture 2025, 15, 667. [Google Scholar] [CrossRef] [Scilit]
- Zhou, X.; Yang, L.; Wang, W.; Chen, B. UAV data as an alternative to field sampling to monitor vineyards using machine learning based on UAV/Sentinel-2 data fusion. Remote Sens. 2021, 13, 457. [Google Scholar] [CrossRef] [Scilit]
- Niu, B.; Feng, Q.; Chen, B.; Ou, C.; Liu, Y.; Yang, J. HSI-TransUNet: A transformer based semantic segmentation model for crop mapping from UAV hyperspectral imagery. Comput. Electron. Agric. 2022, 201, 107297. [Google Scholar] [CrossRef] [Scilit]
- Zhu, H.; Lin, C.; Liu, G.; Wang, D.; Qin, S.; Li, A.; Xu, J.; He, Y. Intelligent agriculture: Deep learning in UAV-based remote sensing imagery for crop diseases and pests detection. Front. Plant Sci. 2024, 15, 1435016. [Google Scholar] [CrossRef] [Scilit]
- Delavarpour, N.; Koparan, C.; Nowatzki, J.; Bajwa, S.; Sun, X. A technical study on UAV characteristics for precision agriculture applications and associated practical challenges. Remote Sens. 2021, 13, 1204. [Google Scholar] [CrossRef] [Scilit]
- Guebsi, R.; Mami, S.; Chokmani, K. Drones in precision agriculture: A comprehensive review of applications, technologies, and challenges. Drones 2024, 8, 686. [Google Scholar] [CrossRef] [Scilit]
- Guo, A.; Huang, W.; Qian, B.; Wang, K.; Liu, H.; Ren, K. Improved early detection of wheat stripe rust through integration pigments and pigment-related spectral indices quantified from UAV hyperspectral imagery. Int. J. Appl. Earth Obs. Geoinf. 2024, 135, 104281. [Google Scholar] [CrossRef] [Scilit]
- Cheng, X.; Huang, W.; Guo, A.; Cai, Z.; Dong, Y.; Hu, B.; Chen, G.; Su, H.; Li, L. Monitoring of rubber tree powdery mildew by combining spatial-spectral features and plant traits quantified from UAV hyperspectral imagery. Comput. Electron. Agric. 2026, 241, 111274. [Google Scholar] [CrossRef] [Scilit]
- Duarte, A.; Borralho, N.; Cabral, P.; Caetano, M. Recent advances in forest insect pests and diseases monitoring using UAV-based data: A systematic review. Forests 2022, 13, 911. [Google Scholar] [CrossRef] [Scilit]
- Sorbelli, F.B.; Palazzetti, L.; Pinotti, C.M. YOLO-based detection of Halyomorpha halys in orchards using RGB cameras and drones. Comput. Electron. Agric. 2023, 213, 108228. [Google Scholar] [CrossRef] [Scilit]
- Amarasingam, N.; Gonzalez, F.; Salgadoe, A.S.A.; Sandino, J.; Powell, K. Detection of white leaf disease in sugarcane crops using UAV-derived RGB imagery with existing deep learning models. Remote Sens. 2022, 14, 6137. [Google Scholar] [CrossRef] [Scilit]
- Dong, T.; Liu, J.; Shang, J.; Qian, B.; Ma, B.; Kovacs, J.M.; Walters, D.; Jiao, X.; Geng, X.; Shi, Y. Assessment of red-edge vegetation indices for crop leaf area index estimation. Remote Sens. Environ. 2019, 222, 133–143. [Google Scholar] [CrossRef] [Scilit]
- Choosumrong, S.; Hataitara, R.; Sujipuli, K.; Weerawatanakorn, M.; Preechaharn, A.; Premjet, D.; Laywisadkul, S.; Raghavan, V.; Panumonwatee, G. Bananas diseases and insect infestations monitoring using multi-spectral camera RTK UAV images. Spat. Inf. Res. 2023, 31, 371–380. [Google Scholar] [CrossRef] [Scilit]
- Park, H.G.; Yun, J.P.; Kim, M.Y.; Jeong, S.H. Multichannel object detection for detecting suspected trees with pine wilt disease using multispectral drone imagery. IEEE J. Sel. Top. Appl. Earth Obs. Remote Sens. 2021, 14, 8350–8358. [Google Scholar] [CrossRef] [Scilit]
- Su, J.; Liu, C.; Hu, X.; Xu, X.; Guo, L.; Chen, W. Spatio-temporal monitoring of wheat yellow rust using UAV multispectral imagery. Comput. Electron. Agric. 2019, 167, 105035. [Google Scholar] [CrossRef] [Scilit]
- Lan, Y.; Huang, Z.; Deng, X.; Zhu, Z.; Huang, H.; Zheng, Z.; Lian, B.; Zeng, G.; Tong, Z. Comparison of machine learning methods for citrus greening detection on UAV multispectral images. Comput. Electron. Agric. 2020, 171, 105234. [Google Scholar] [CrossRef] [Scilit]
- Franceschini, M.H.D.; Bartholomeus, H.; Van Apeldoorn, D.F.; Suomalainen, J.; Kooistra, L. Feasibility of unmanned aerial vehicle optical imagery for early detection and severity assessment of late blight in potato. Remote Sens. 2019, 11, 224. [Google Scholar] [CrossRef] [Scilit]
- Rodriguez, J.; Lizarazo, I.; Prieto, F.; Angulo-Morales, V. Assessment of potato late blight from UAV-based multispectral imagery. Comput. Electron. Agric. 2021, 184, 106061. [Google Scholar] [CrossRef] [Scilit]
- Su, J.; Liu, C.; Coombes, M.; Hu, X.; Wang, C.; Xu, X.; Li, Q.; Guo, L.; Chen, W. Wheat yellow rust monitoring by learning from multispectral UAV aerial imagery. Comput. Electron. Agric. 2018, 155, 157–166. [Google Scholar] [CrossRef] [Scilit]
- Gao, C.; Ji, X.; He, Q.; Gong, Z.; Sun, H.; Wen, T.; Guo, W. Monitoring of wheat fusarium head blight on spectral and textural analysis of UAV multispectral imagery. Agriculture 2023, 13, 293. [Google Scholar] [CrossRef] [Scilit]
- LeCun, Y.; Bengio, Y.; Hinton, G. Deep learning. Nature 2015, 521, 436–444. [Google Scholar] [CrossRef] [Scilit]
- Kamilaris, A.; Prenafeta-Boldú, F.X. Deep learning in agriculture: A survey. Comput. Electron. Agric. 2018, 147, 70–90. [Google Scholar] [CrossRef] [Scilit]
- Zhang, T.; Yang, Z.; Xu, Z.; Li, J. Wheat yellow rust severity detection by efficient DF-UNet and UAV multispectral imagery. IEEE Sens. J. 2022, 22, 9057–9068. [Google Scholar] [CrossRef] [Scilit]
- Zhang, T.; Xu, Z.; Su, J.; Yang, Z.; Liu, C.; Chen, W.; Li, J. Ir-unet: Irregular segmentation u-shape network for wheat yellow rust detection by UAV multispectral imagery. Remote Sens. 2021, 13, 3892. [Google Scholar] [CrossRef] [Scilit]
- Zhang, X.; Han, L.; Dong, Y.; Shi, Y.; Huang, W.; Han, L.; González-Moreno, P.; Ma, H.; Ye, H.; Sobeih, T. A deep learning-based approach for automated yellow rust disease detection from high-resolution hyperspectral UAV images. Remote Sens. 2019, 11, 1554. [Google Scholar] [CrossRef] [Scilit]
- Nguyen, C.; Sagan, V.; Maimaitiyiming, M.; Maimaitijiang, M.; Bhadra, S.; Kwasniewski, M.T. Early detection of plant viral disease using hyperspectral imaging and deep learning. Sensors 2021, 21, 742. [Google Scholar] [CrossRef] [Scilit]
- Nagasubramanian, K.; Jones, S.; Singh, A.K.; Sarkar, S.; Singh, A.; Ganapathysubramanian, B. Plant disease identification using explainable 3D deep learning on hyperspectral images. Plant Methods 2019, 15, 98. [Google Scholar] [CrossRef] [Scilit] [PubMed]
- Sun, E.; Cui, Y.; Liu, P.; Yan, J. A decade of deep learning for remote sensing spatiotemporal fusion: Advances, challenges, and opportunities. Inf. Fusion 2025, 126, 103675. [Google Scholar] [CrossRef] [Scilit]
- Zhao, J.; Sun, D.; Mi, J.; Zhao, K.; Peng, J.; Tu, K.; Liu, J.; Lan, W.; Pan, L. Hyperspectral imaging coupled with transformer enhanced convolutional autoencoder architecture towards real-time multi-target classification of damaged soybeans. Food Control 2025, 179, 111606. [Google Scholar] [CrossRef] [Scilit]
- Li, Y.; Dang, L.M.; Wang, H.; Fayaz, M.; Danish, S.; Shang, J.; Song, H.; Moon, H. Transformer-based detection of abnormal rice growth using drone-based multispectral imaging. Comput. Electron. Agric. 2025, 239, 111055. [Google Scholar] [CrossRef] [Scilit]
- Zhang, L.; Zhao, Y.; Zhou, C.; Zhang, J.; Yan, Y.; Chen, T.; Lv, C. JuDifformer: Multimodal fusion model with transformer and diffusion for jujube disease detection. Comput. Electron. Agric. 2025, 232, 110008. [Google Scholar] [CrossRef] [Scilit]
- Yuan, L.; Yu, Q.; Xiang, L.; Zeng, F.; Dong, J.; Xu, O.; Zhang, J. Integrating UAV and high-resolution satellite remote sensing for multi-scale rice disease monitoring. Comput. Electron. Agric. 2025, 234, 110287. [Google Scholar] [CrossRef] [Scilit]
- Yasmin, S.; Hafeez, F.Y.; Mirza, M.S.; Rasul, M.; Arshad, H.M.I.; Zubair, M.; Iqbal, M. Biocontrol of bacterial leaf blight of rice and profiling of secondary metabolites produced by rhizospheric Pseudomonas aeruginosa BRp3. Front. Microbiol. 2017, 8, 1895. [Google Scholar] [CrossRef] [Scilit]
- GB/T 17980.19-2000; Pesticide—Guidelines for the Field Efficacy Trials(I)—Fungicides Against Leaf Diseases of Rice. Standards Press of China: Beijing, China, 2000.
- Zhang, J.; Zhou, X.; Shen, D.; Yu, Q.; Yuan, L.; Dong, Y. Development of spectral features for monitoring rice bacterial leaf blight disease using broad-band remote sensing systems. Phyton 2024, 93, 745. [Google Scholar] [CrossRef] [Scilit]
- Caasi, O.; Hongo, C.; Wiyono, S.; Giamerti, Y.; Saito, D.; Homma, K.; Shishido, M. The potential of using Sentinel-2 satellite imagery in assessing bacterial leaf blight on rice in West Java, Indonesia. J. Int. Soc. Southeast Asian Agric. Sci. 2020, 26, 1–16. [Google Scholar]
- Yudarwati, R.; Hongo, C.; Sigit, G.; Barus, B.; Utoyo, B. Bacterial leaf blight detection in rice crops using ground-based spectroradiometer data and multi-temporal satellites images. J. Agric. Sci 2020, 12, 38–49. [Google Scholar] [CrossRef] [Scilit]
- Zhang, W.; Zhang, Y.; Gao, S.; Lu, X.; Tang, Y.; Liu, S. Spectrum-induced transformer-based feature learning for multiple change detection in hyperspectral images. IEEE Trans. Geosci. Remote Sens. 2023, 62, 5500212. [Google Scholar] [CrossRef] [Scilit]
- Xu, F.; Mei, S.; Zhang, G.; Wang, N.; Du, Q. Bridging CNN and transformer with cross-attention fusion network for hyperspectral image classification. IEEE Trans. Geosci. Remote Sens. 2024, 62, 5522214. [Google Scholar] [CrossRef] [Scilit]
- Liu, R.; Tao, F.; Liu, X.; Na, J.; Leng, H.; Wu, J.; Zhou, T. RAANet: A residual ASPP with attention framework for semantic segmentation of high-resolution remote sensing images. Remote Sens. 2022, 14, 3109. [Google Scholar] [CrossRef] [Scilit]
- Wei, Y.; Guo, X.; Lu, Y.; Hu, H.; Wang, F.; Li, R.; Li, X. Phenology-Guided Wheat and Corn Identification in Xinjiang: An Improved U-Net Semantic Segmentation Model Using PCA and CBAM-ASPP. Remote Sens. 2025, 17, 3563. [Google Scholar] [CrossRef] [Scilit]
- Hu, L.; Zhou, X.; Ruan, J.; Li, S. ASPP+-LANet: A Multi-Scale Context Extraction Network for Semantic Segmentation of High-Resolution Remote Sensing Images. Remote Sens. 2024, 16, 1036. [Google Scholar] [CrossRef] [Scilit]
- Zhang, S.; Li, X.; Ba, Y.; Lyu, X.; Zhang, M.; Li, M. Banana fusarium wilt disease detection by supervised and unsupervised methods from UAV-based multispectral imagery. Remote Sens. 2022, 14, 1231. [Google Scholar] [CrossRef] [Scilit]
- Su, H.; Pan, Y.; Qin, L.; Wu, G.; Shi, C.; Wang, Y.; Hua, S.; Luo, S. Research on the monitoring method of rice blast disease at canopy scale based on UAV multispectral imaging. In Proceedings of the 2024 43rd Chinese Control Conference (CCC), Kunming, China, 28–31 July 2024; pp. 7699–7704. [Google Scholar]
- Nguyen, C.; Sagan, V.; Skobalski, J.; Severo, J.I. Early detection of wheat yellow rust disease and its impact on terminal yield with multi-spectral UAV-imagery. Remote Sens. 2023, 15, 3301. [Google Scholar] [CrossRef] [Scilit]
- Zhao, Y.; Zhang, X.; Feng, W.; Xu, J. Deep learning classification by ResNet-18 based on the real spectral dataset from multispectral remote sensing images. Remote Sens. 2022, 14, 4883. [Google Scholar] [CrossRef] [Scilit]
- Ma, H.; Huang, W.; Dong, Y.; Liu, L.; Guo, A. Using UAV-based hyperspectral imagery to detect winter wheat fusarium head blight. Remote Sens. 2021, 13, 3024. [Google Scholar] [CrossRef] [Scilit]
- Deng, J.; Zhang, X.; Yang, Z.; Zhou, C.; Wang, R.; Zhang, K.; Lv, X.; Yang, L.; Wang, Z.; Li, P.; et al. Pixel-level regression for UAV hyperspectral images: Deep learning-based quantitative inverse of wheat stripe rust disease index. Comput. Electron. Agric. 2023, 215, 108434. [Google Scholar] [CrossRef] [Scilit]
- Doornbos, J.; Babur, Ö. Ending Overfitting for UAV Applications-Self-Supervised Pretraining on Multispectral UAV Data. ISPRS Ann. Photogramm. Remote Sens. Spat. Inf. Sci. 2025, 10, 31–39. [Google Scholar] [CrossRef] [Scilit]
- Wang, Y.; Yang, Z.; Khan, H.A.; Kootstra, G. Improving radiometric block adjustment for UAV multispectral imagery under variable illumination conditions. Remote Sens. 2024, 16, 3019. [Google Scholar] [CrossRef] [Scilit]
- Wu, S.; Lu, Y.; Fan, W.; Zhang, S.; Wu, Z.; Wang, F. An efficient downwelling light sensor data correction model for UAV multi-spectral image DOM generation. Drones 2025, 9, 491. [Google Scholar] [CrossRef] [Scilit]
- Munir, A.; Siddiqui, A.J.; Anwar, S.; El-Maleh, A.; Khan, A.H.; Rehman, A. Impact of adverse weather and image distortions on vision-based UAV detection: A performance evaluation of deep learning models. Drones 2024, 8, 638. [Google Scholar] [CrossRef] [Scilit]
- Liu, Z.; Wang, W.; Ma, Q.; Liu, X.; Jiang, J. Rethinking 3D-CNN in hyperspectral image super-resolution. Remote Sens. 2023, 15, 2574. [Google Scholar] [CrossRef] [Scilit]
- Hu, W.; Huang, Y.; Wei, L.; Zhang, F.; Li, H. Deep convolutional neural networks for hyperspectral image classification. J. Sens. 2015, 2015, 258619. [Google Scholar] [CrossRef] [Scilit]
- Genuer, R.; Poggi, J.M.; Tuleau-Malot, C. Variable selection using random forests. Pattern Recognit. Lett. 2010, 31, 2225–2236. [Google Scholar] [CrossRef] [Scilit]
- Biau, G.; Scornet, E. A random forest guided tour. Test 2016, 25, 197–227. [Google Scholar] [CrossRef] [Scilit]
- Luo, X.; Xu, J.; Xu, Z. Channel importance matters in few-shot image classification. In Proceedings of the 39th International Conference on Machine Learning, PMLR, Baltimore, MD, USA, 17–23 July 2022; pp. 14542–14559. [Google Scholar]
- Zhu, X.; Pei, X.; Yang, S.; Wang, W.; Dong, Y.; Fang, M.; Liu, W.; Jiang, L. Spatial prediction of ground substrate thickness in shallow mountain area based on machine learning model. Front. Earth Sci. 2024, 12, 1455124. [Google Scholar] [CrossRef] [Scilit]
- Wang, X. Analysis on the Spatial Distribution and Influencing Factors of Cultivated Land Value: A Case Study of Yuyao City, Zhejiang Province. Master’s Thesis, Zhejiang University, Hangzhou, China, 2021. [Google Scholar]
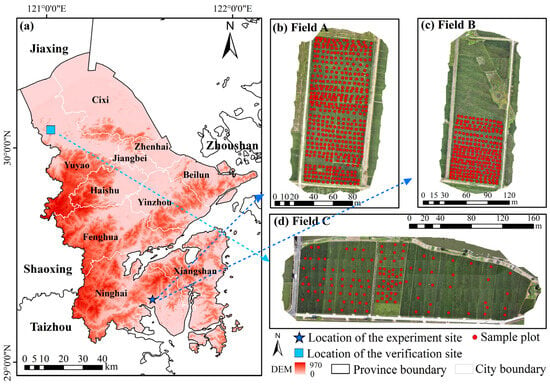
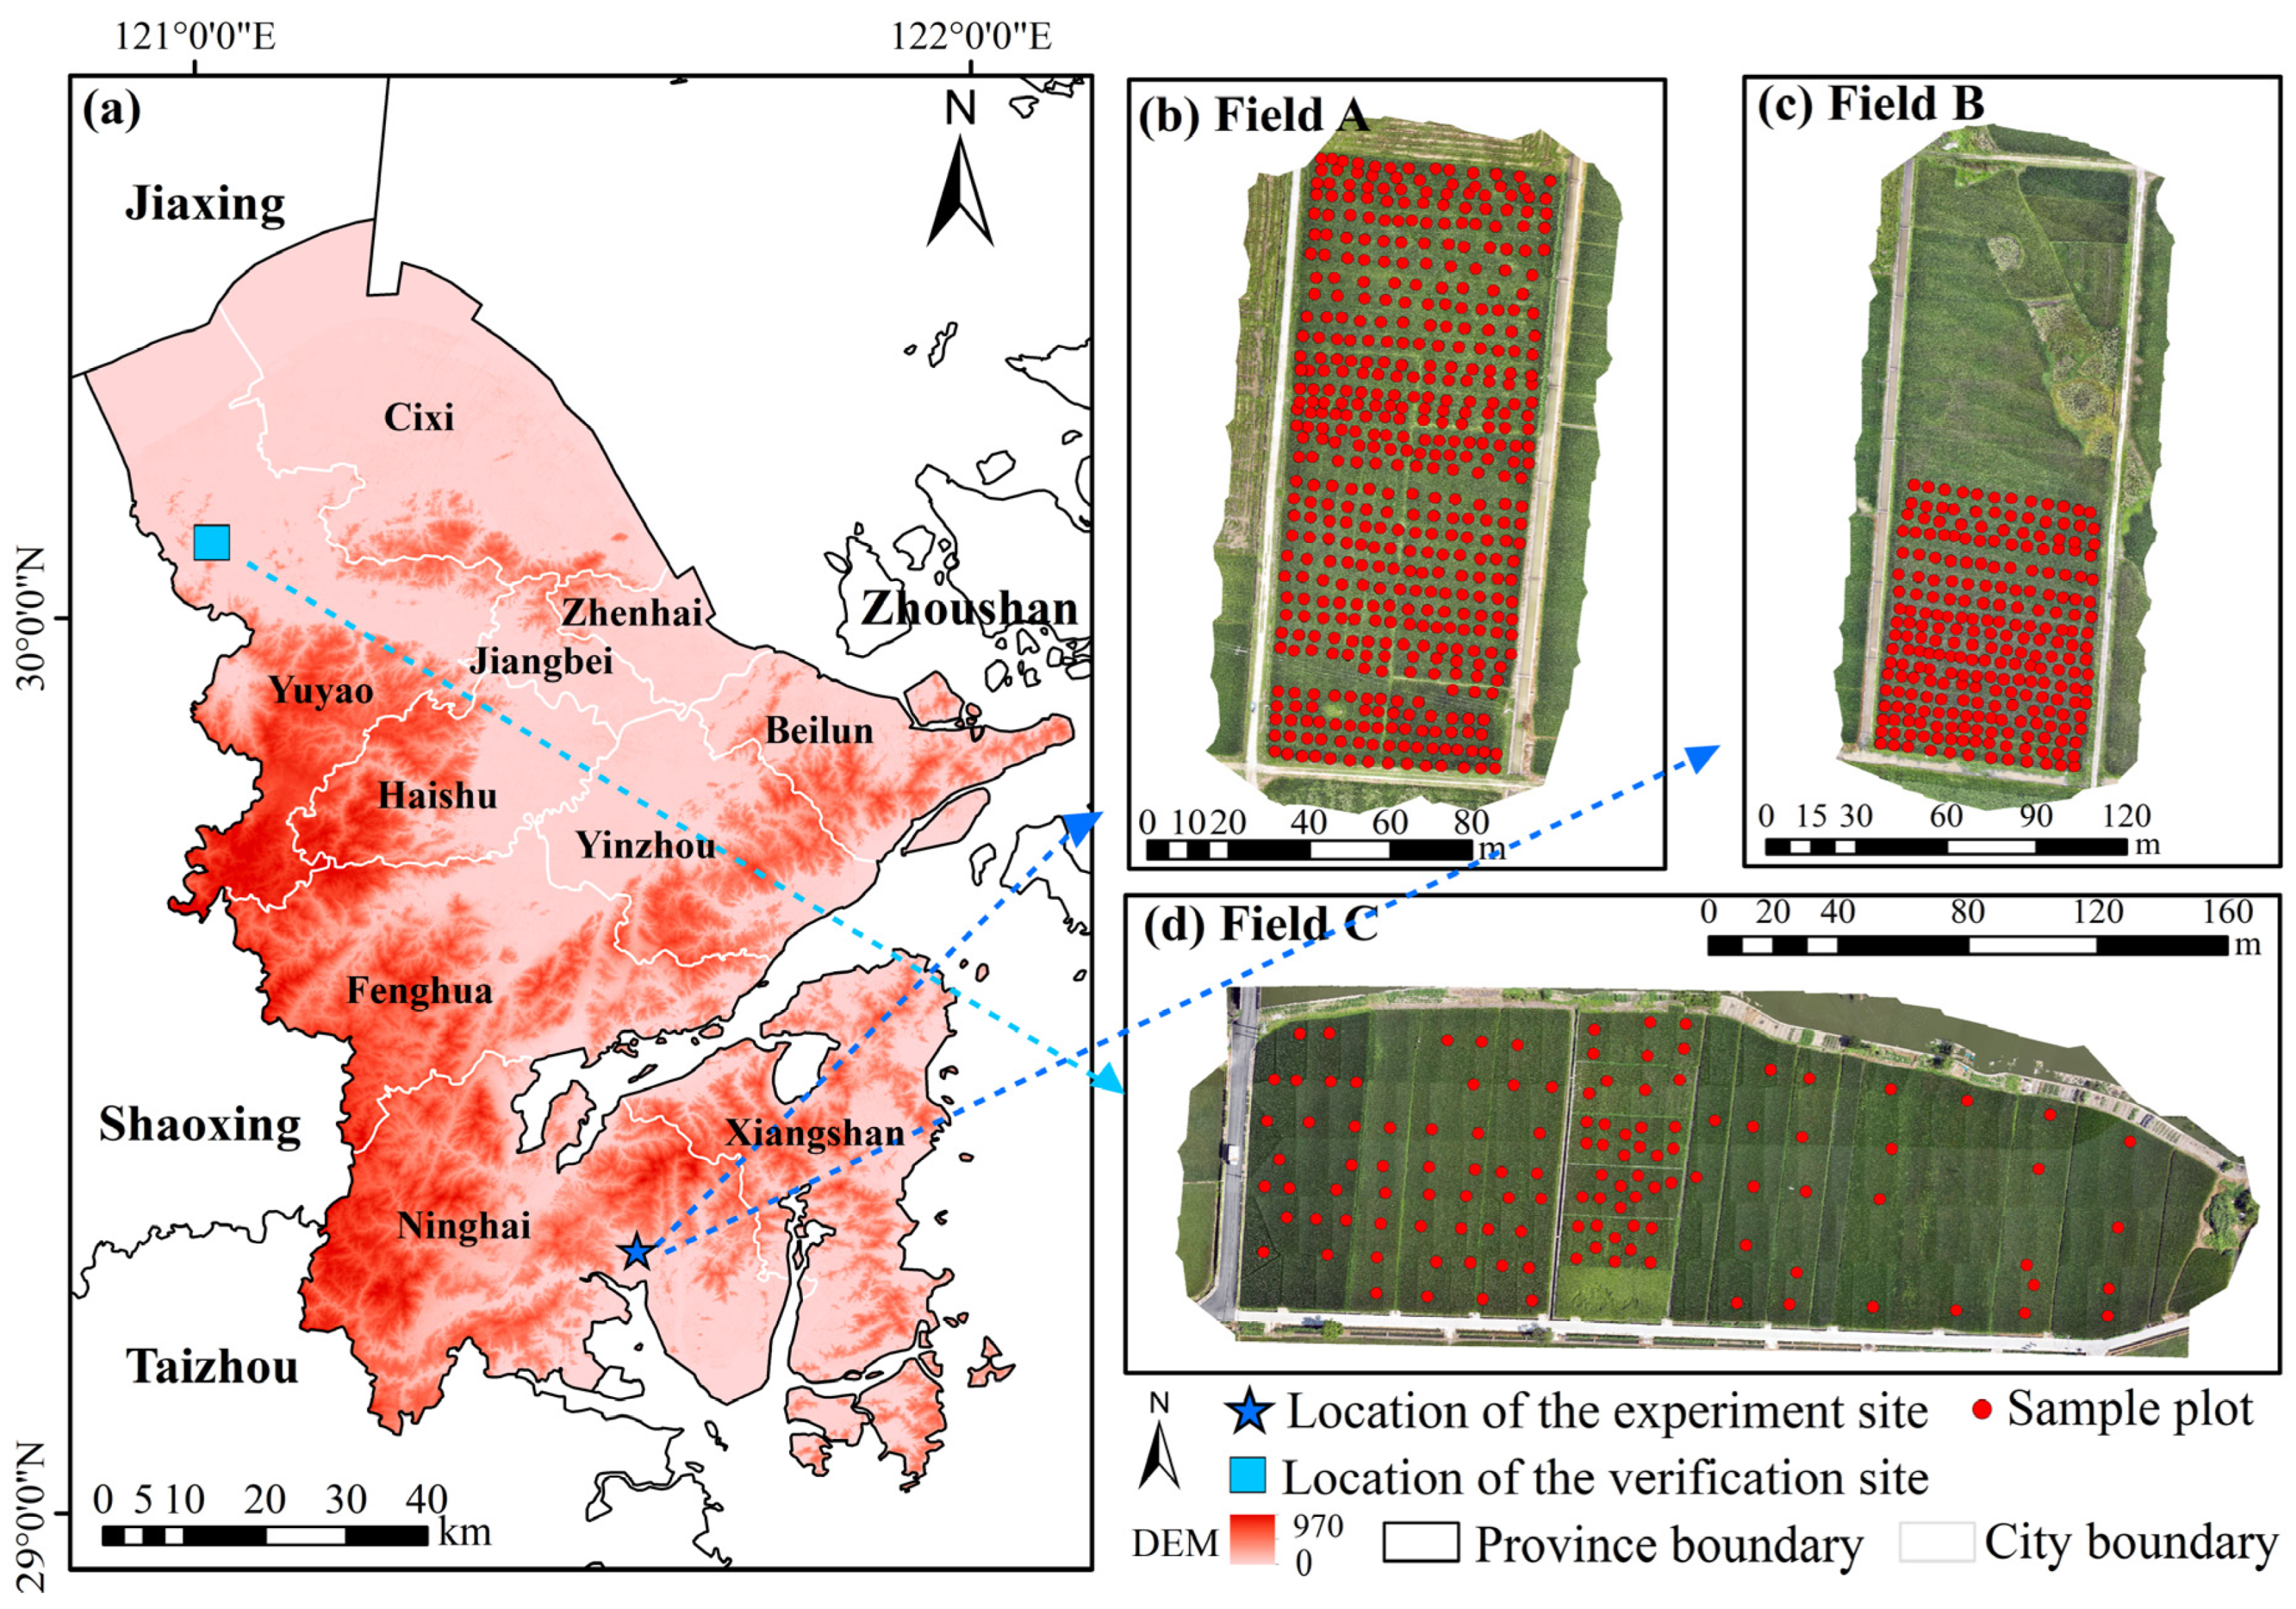
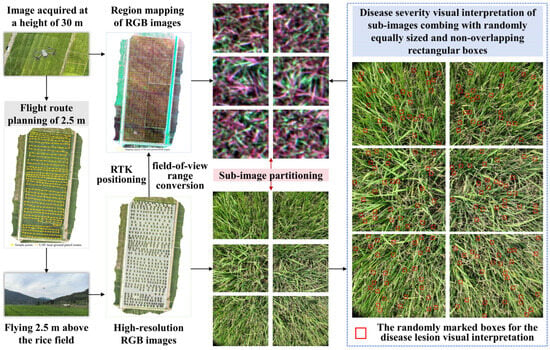
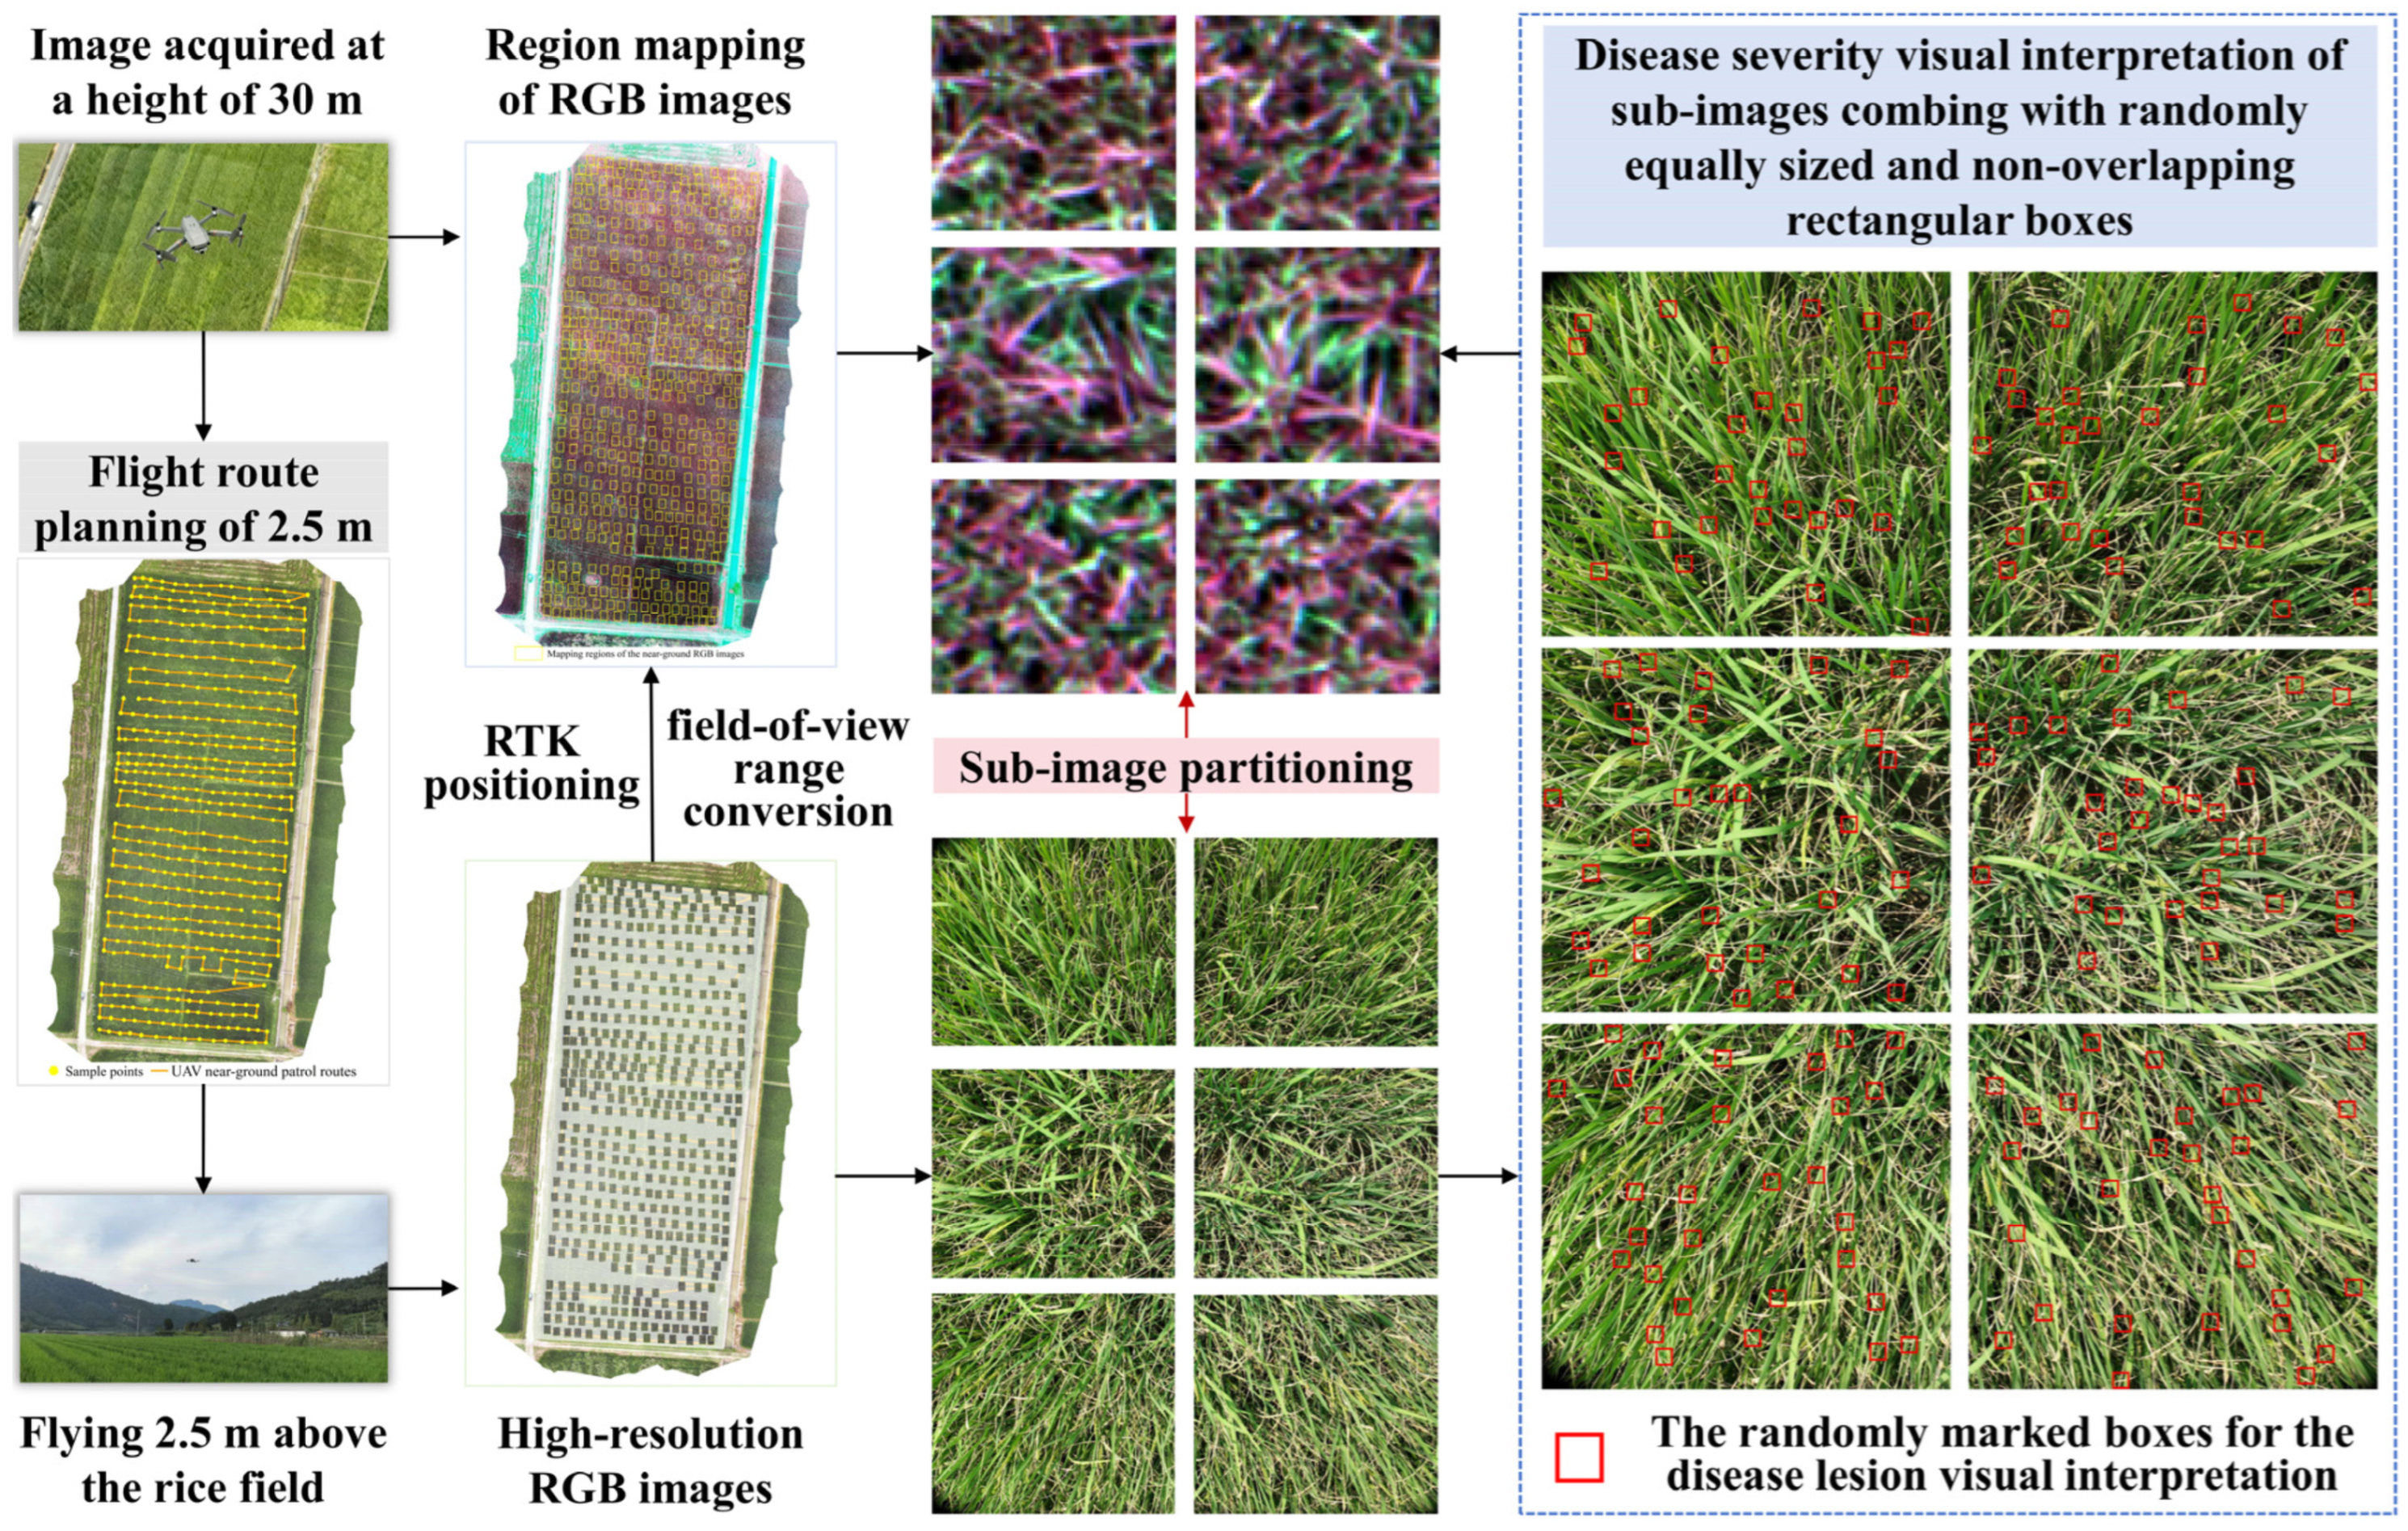
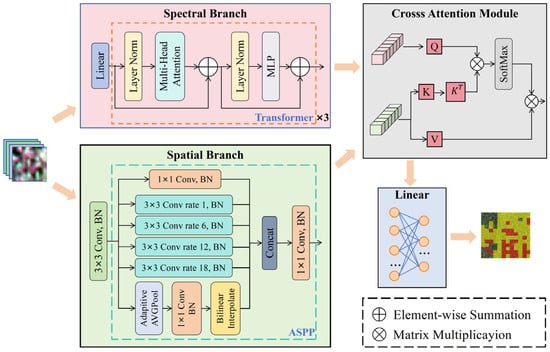
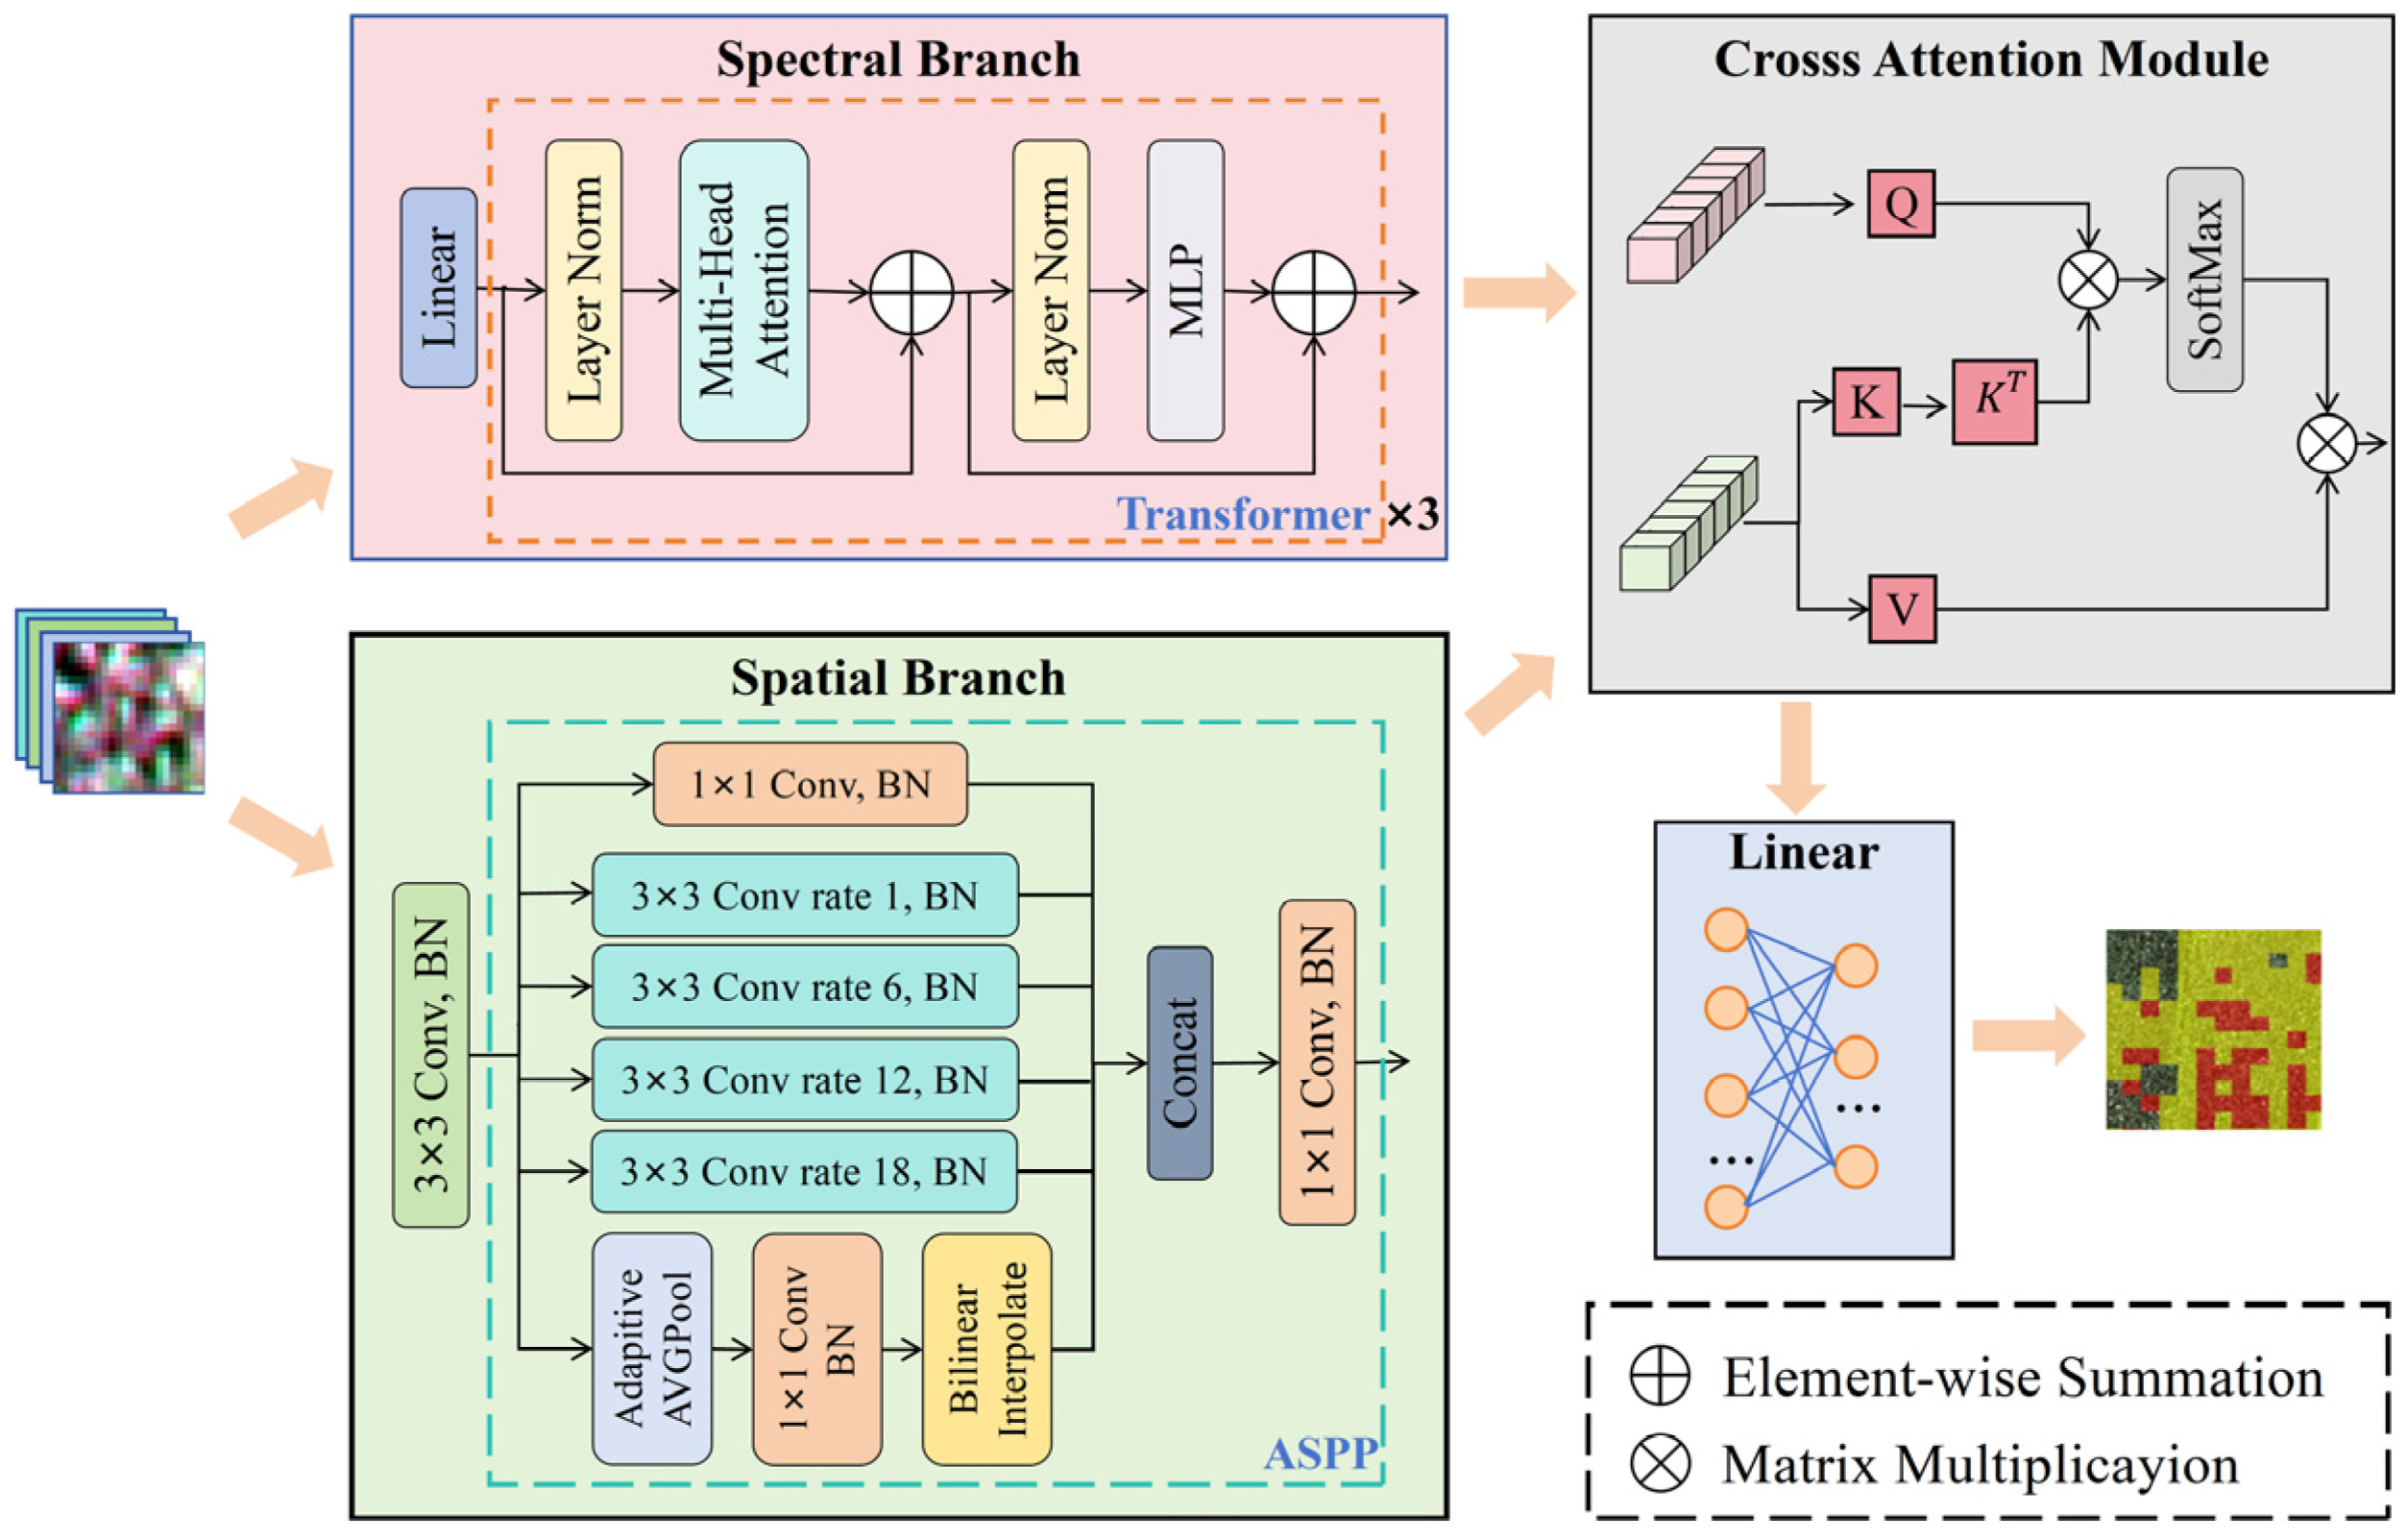
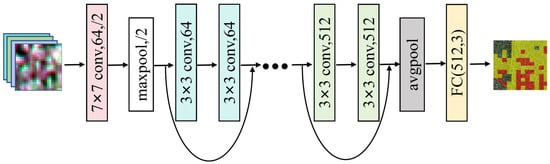
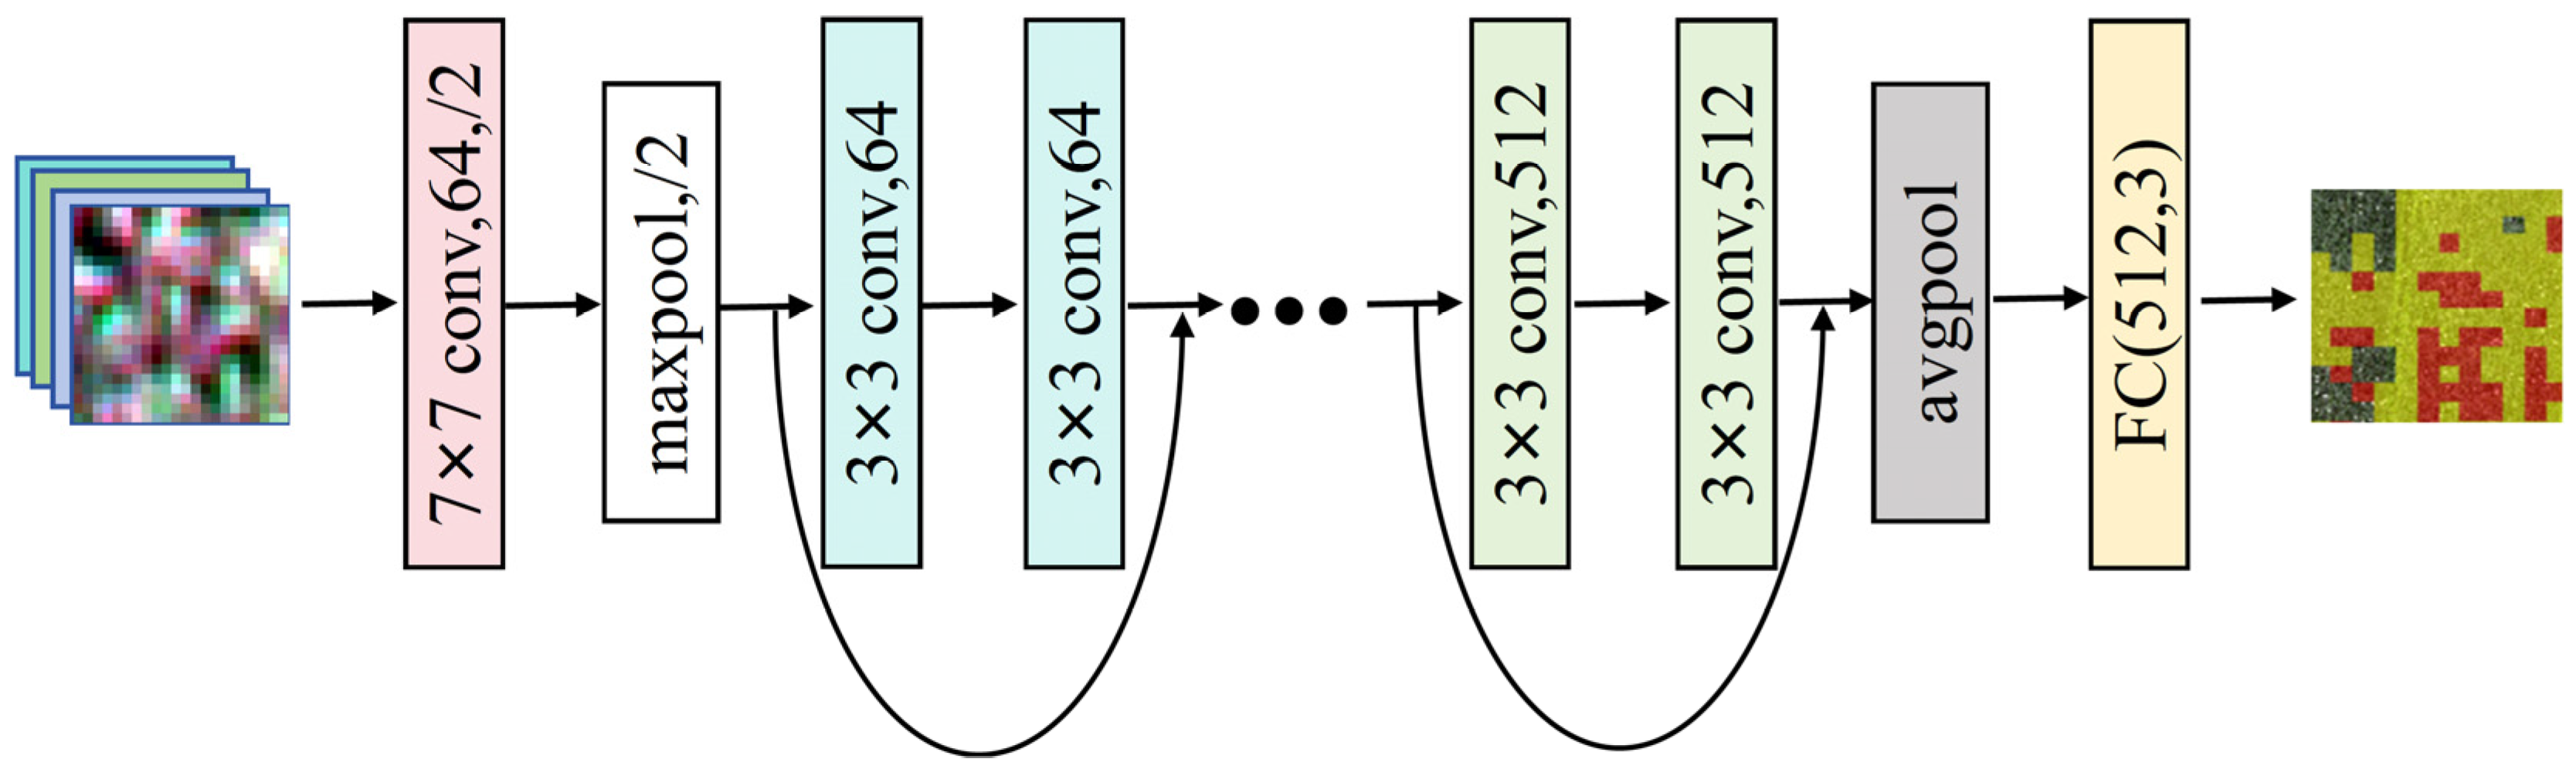


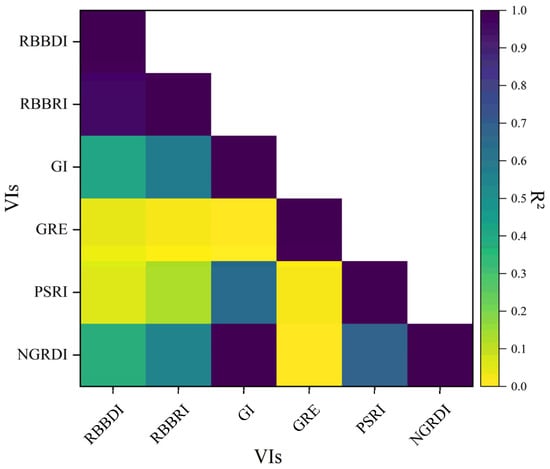
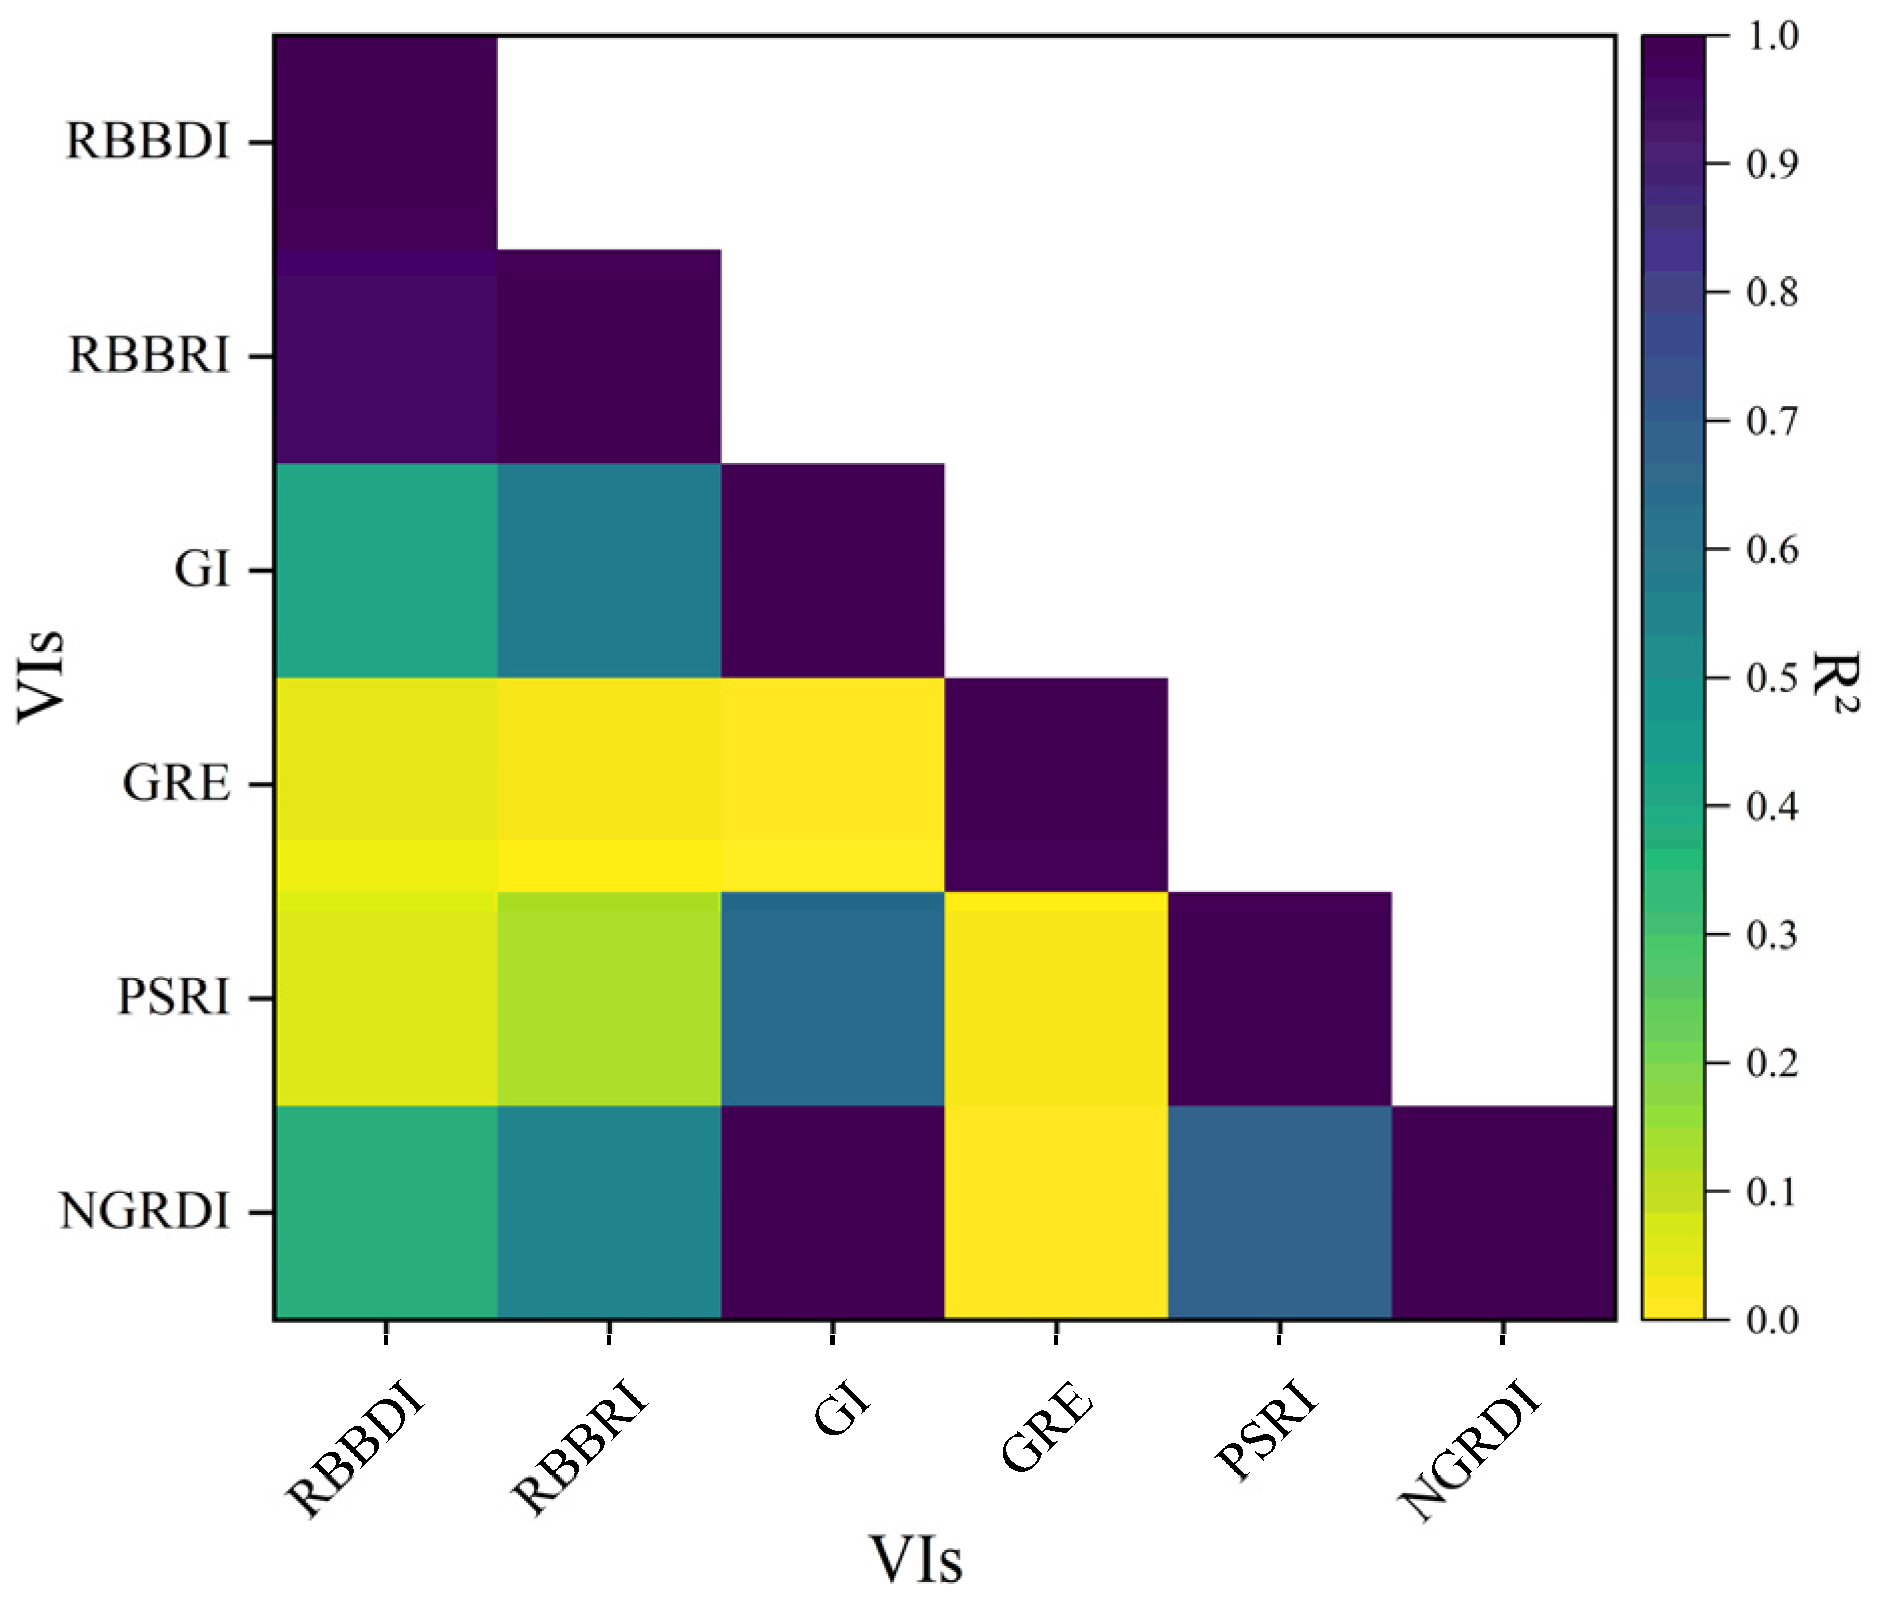
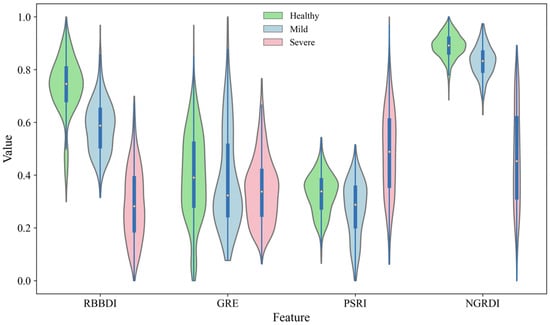
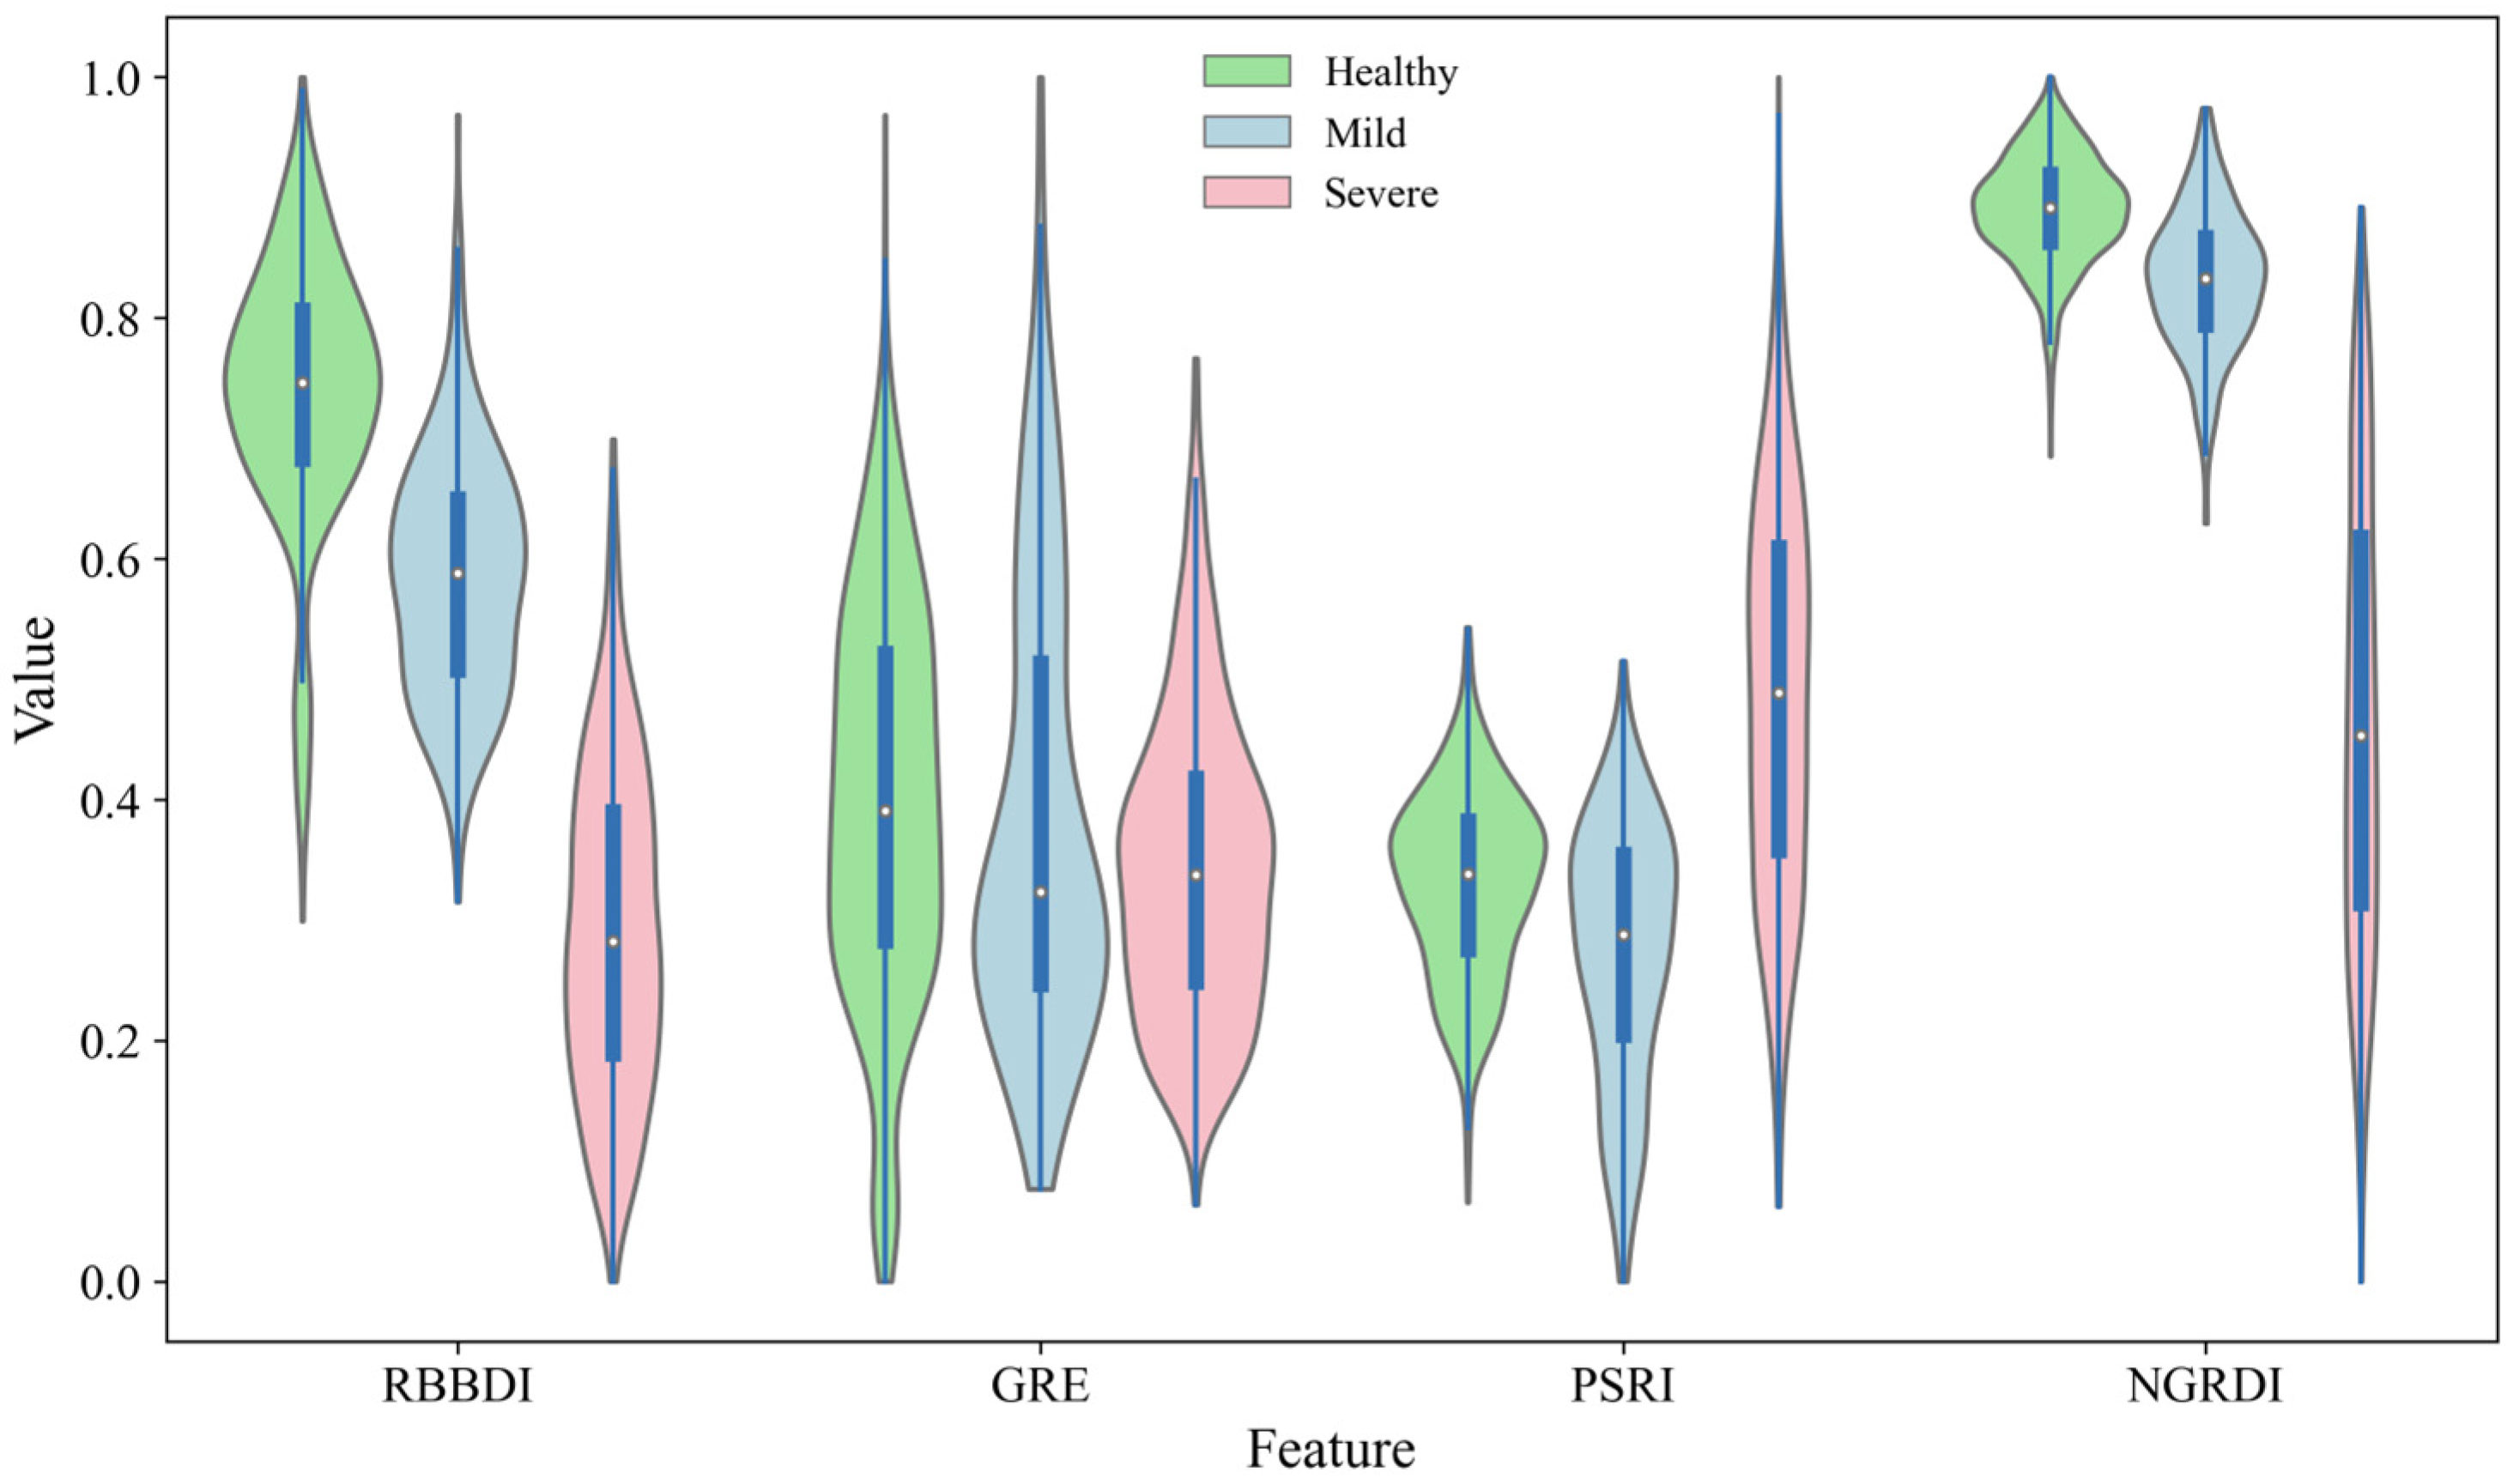
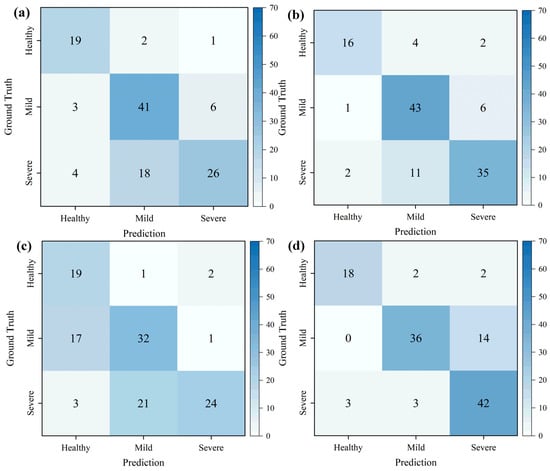
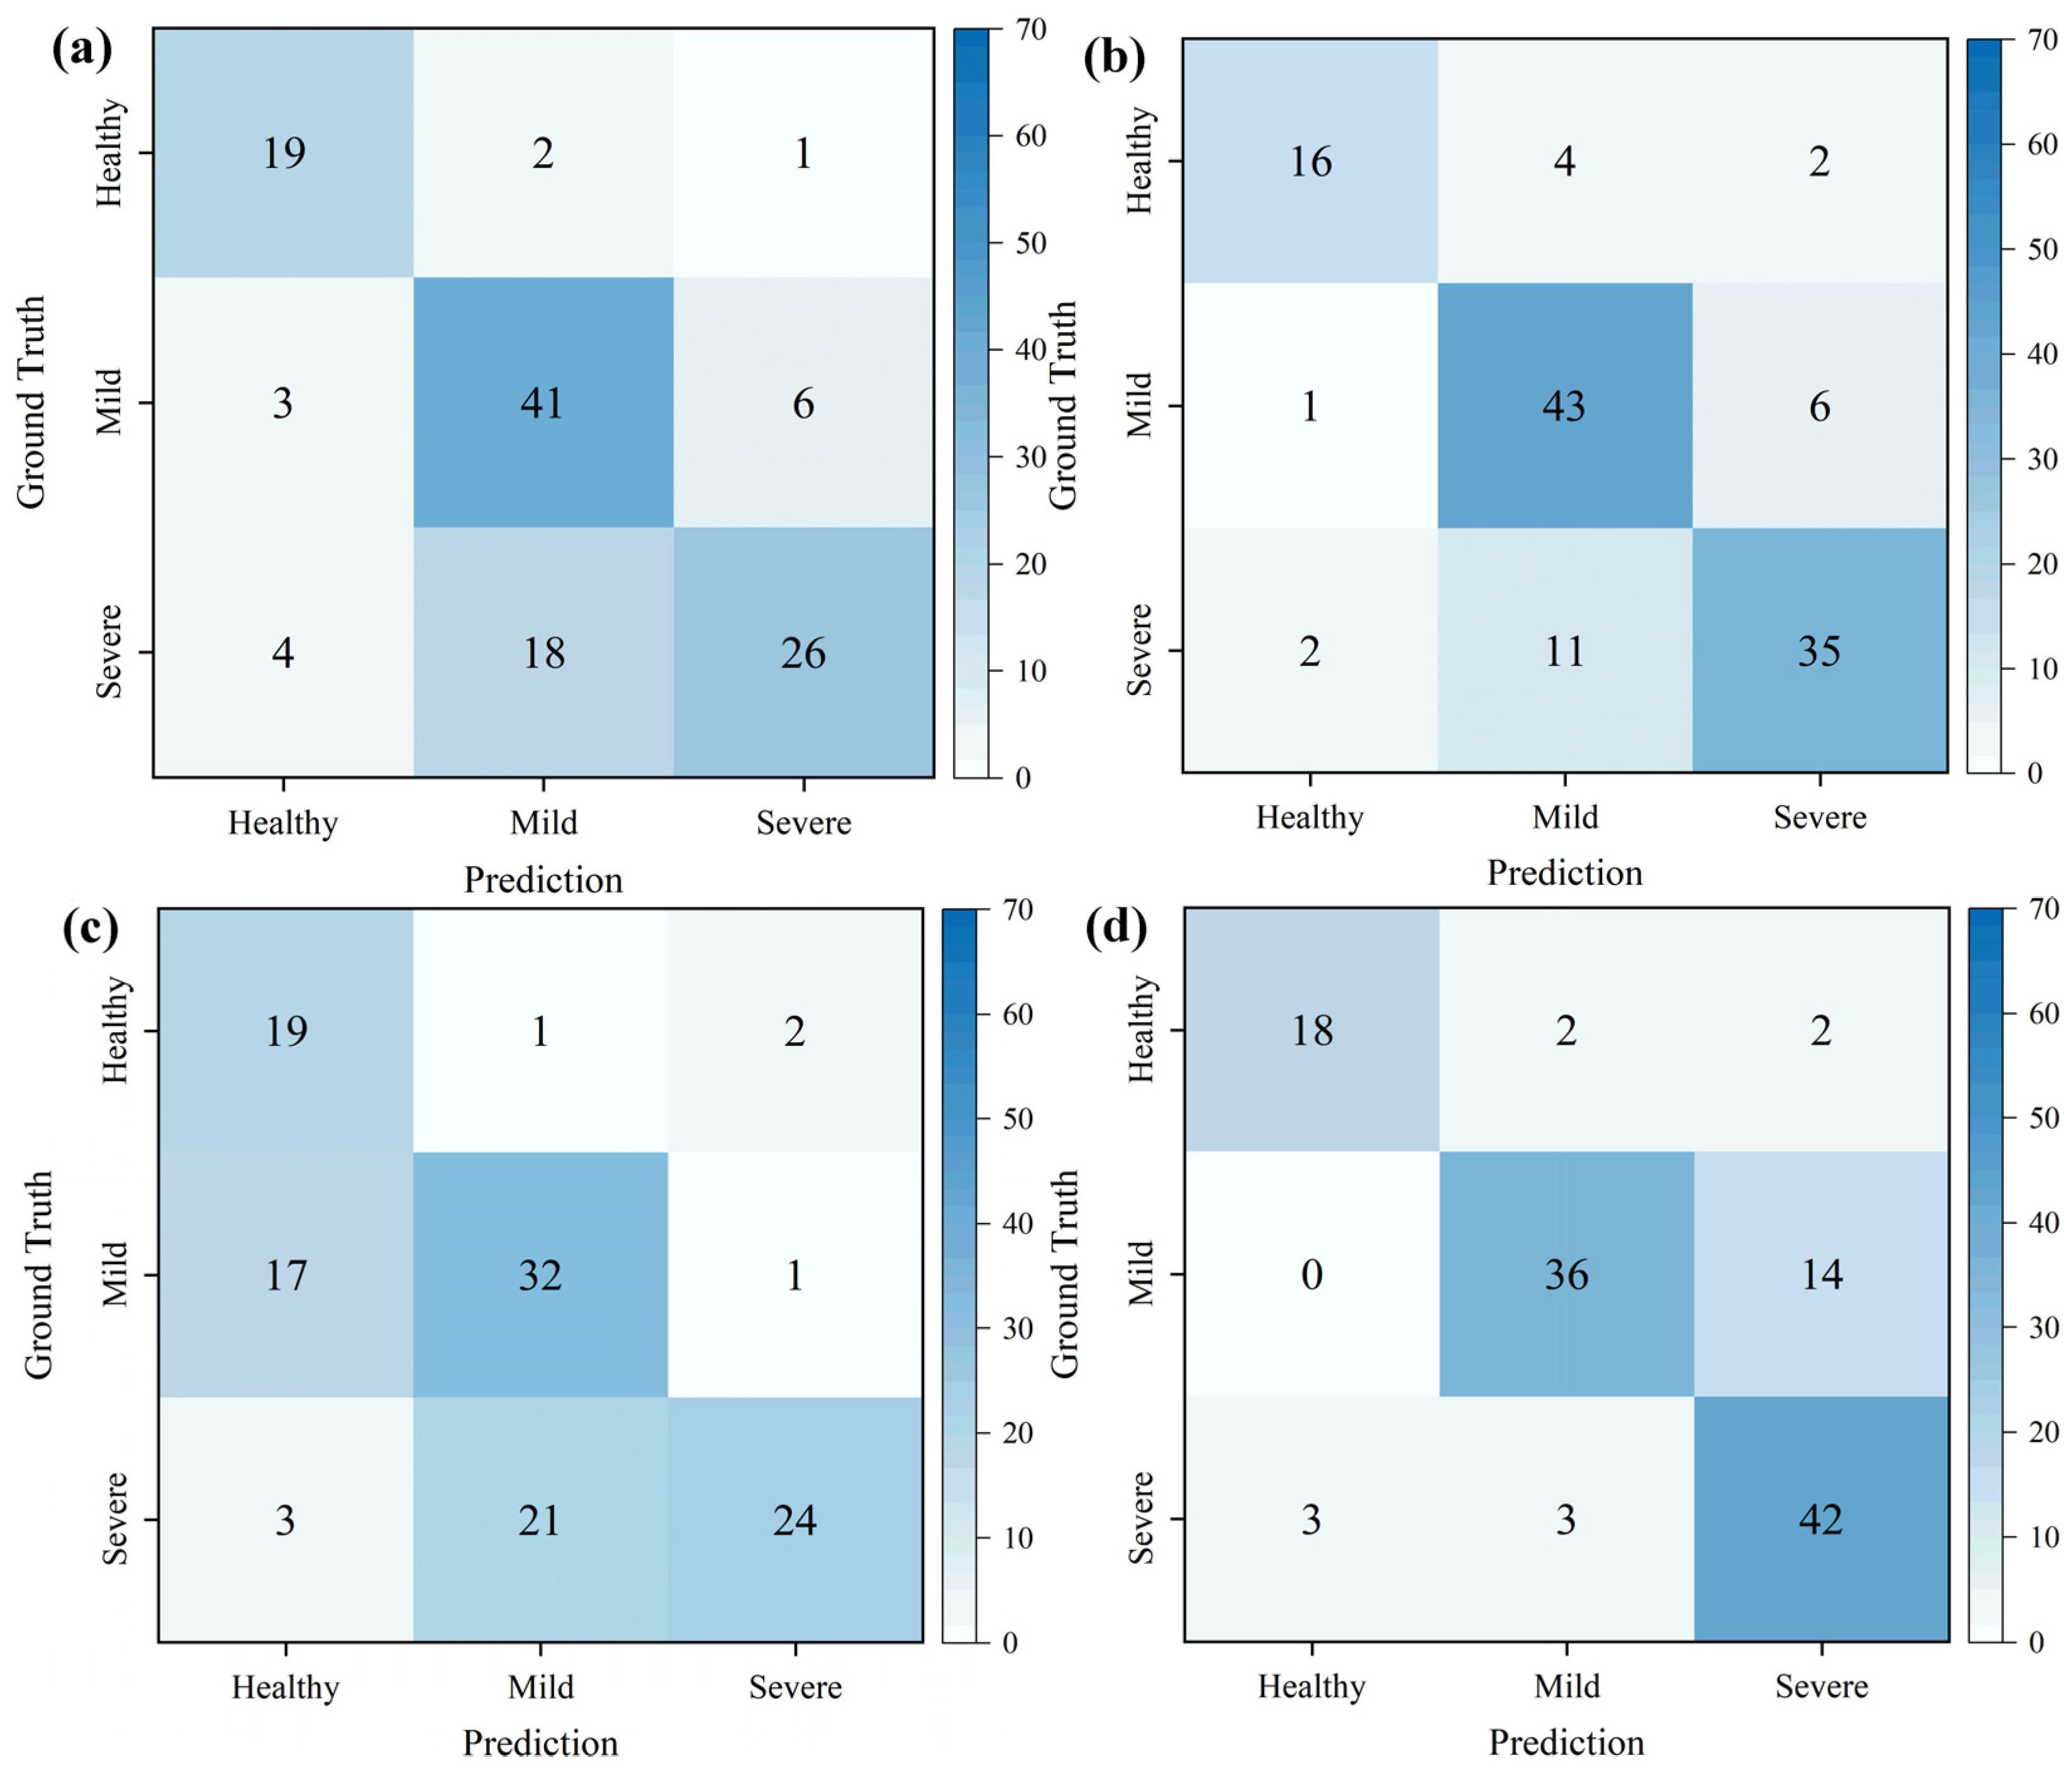
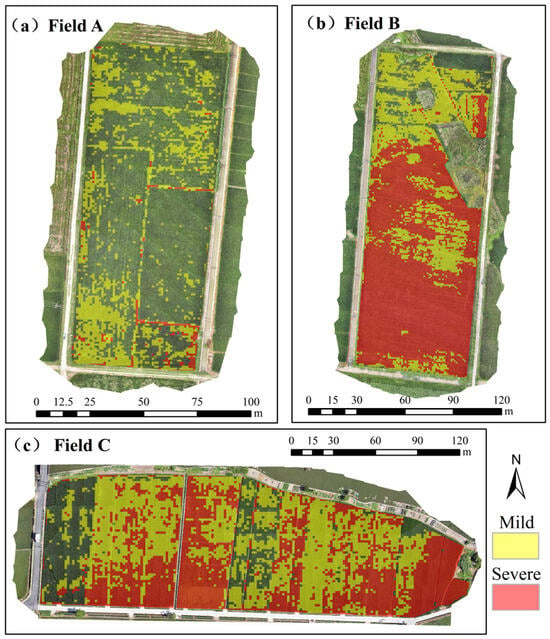
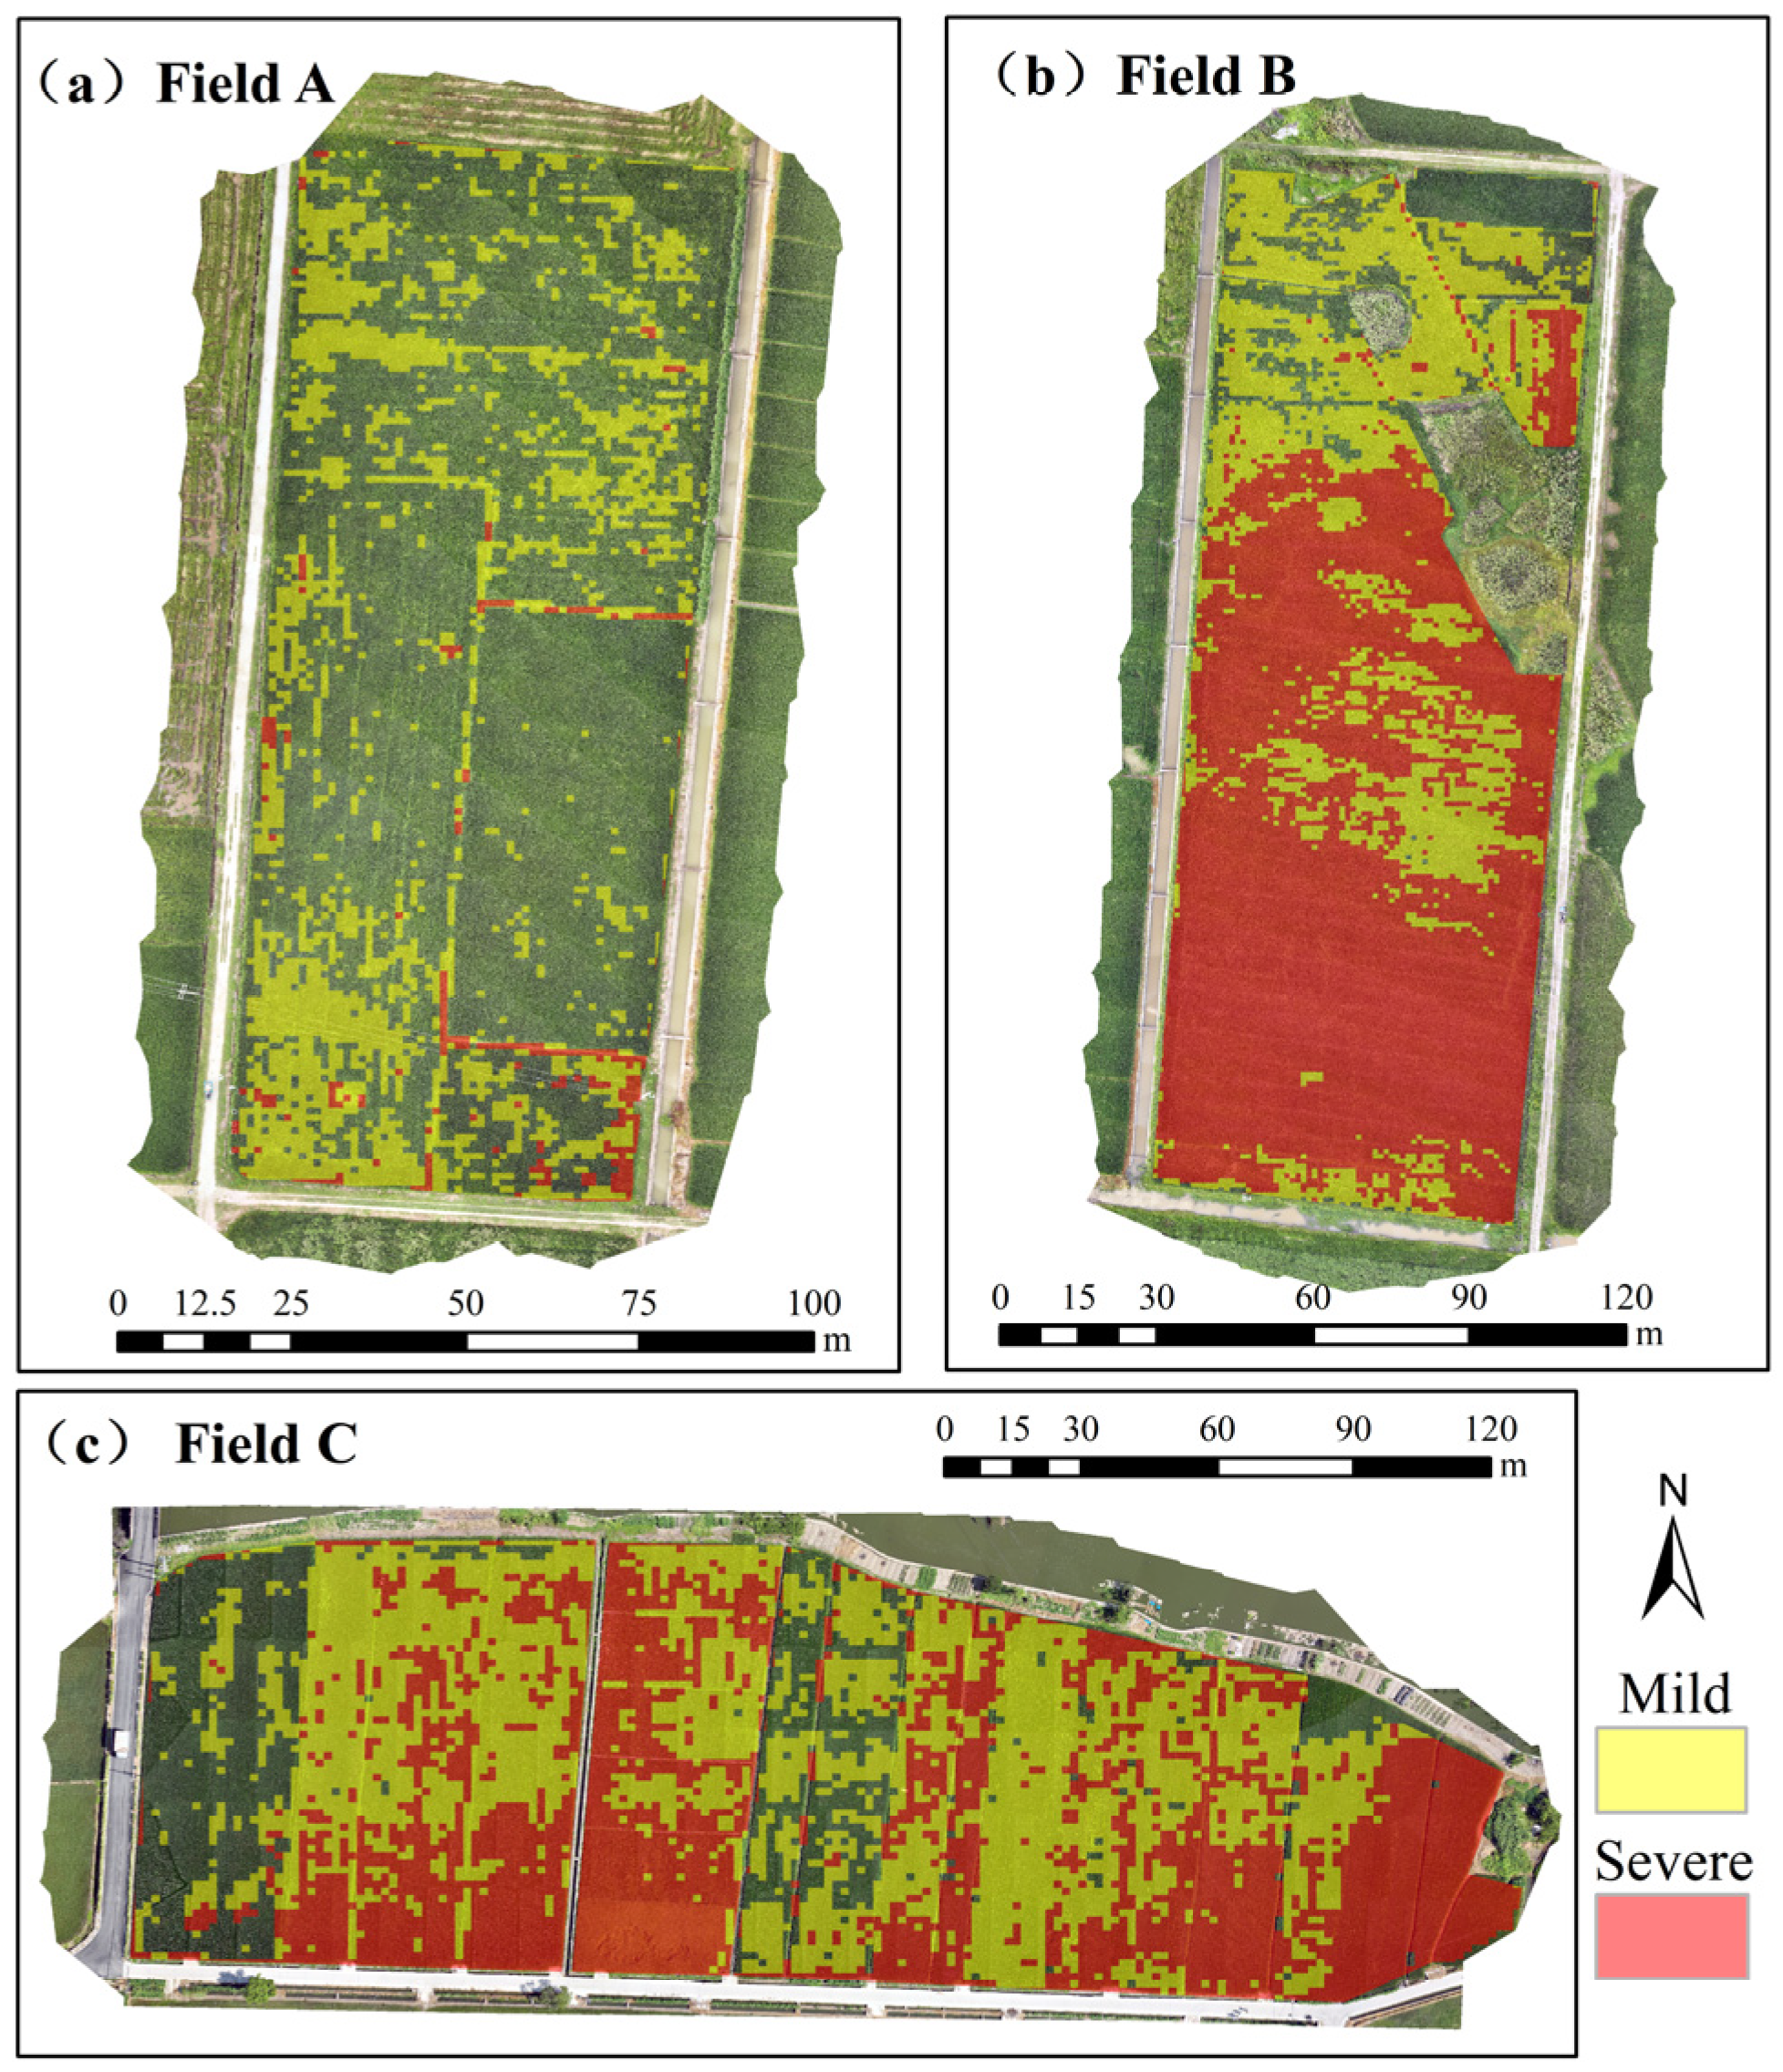
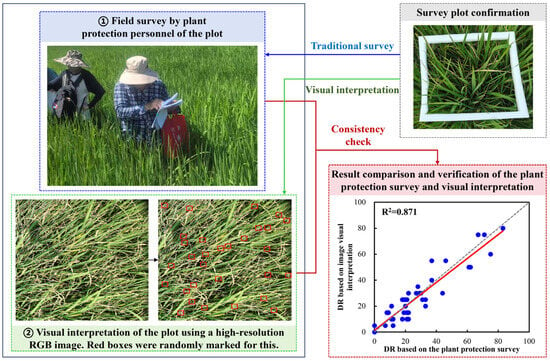
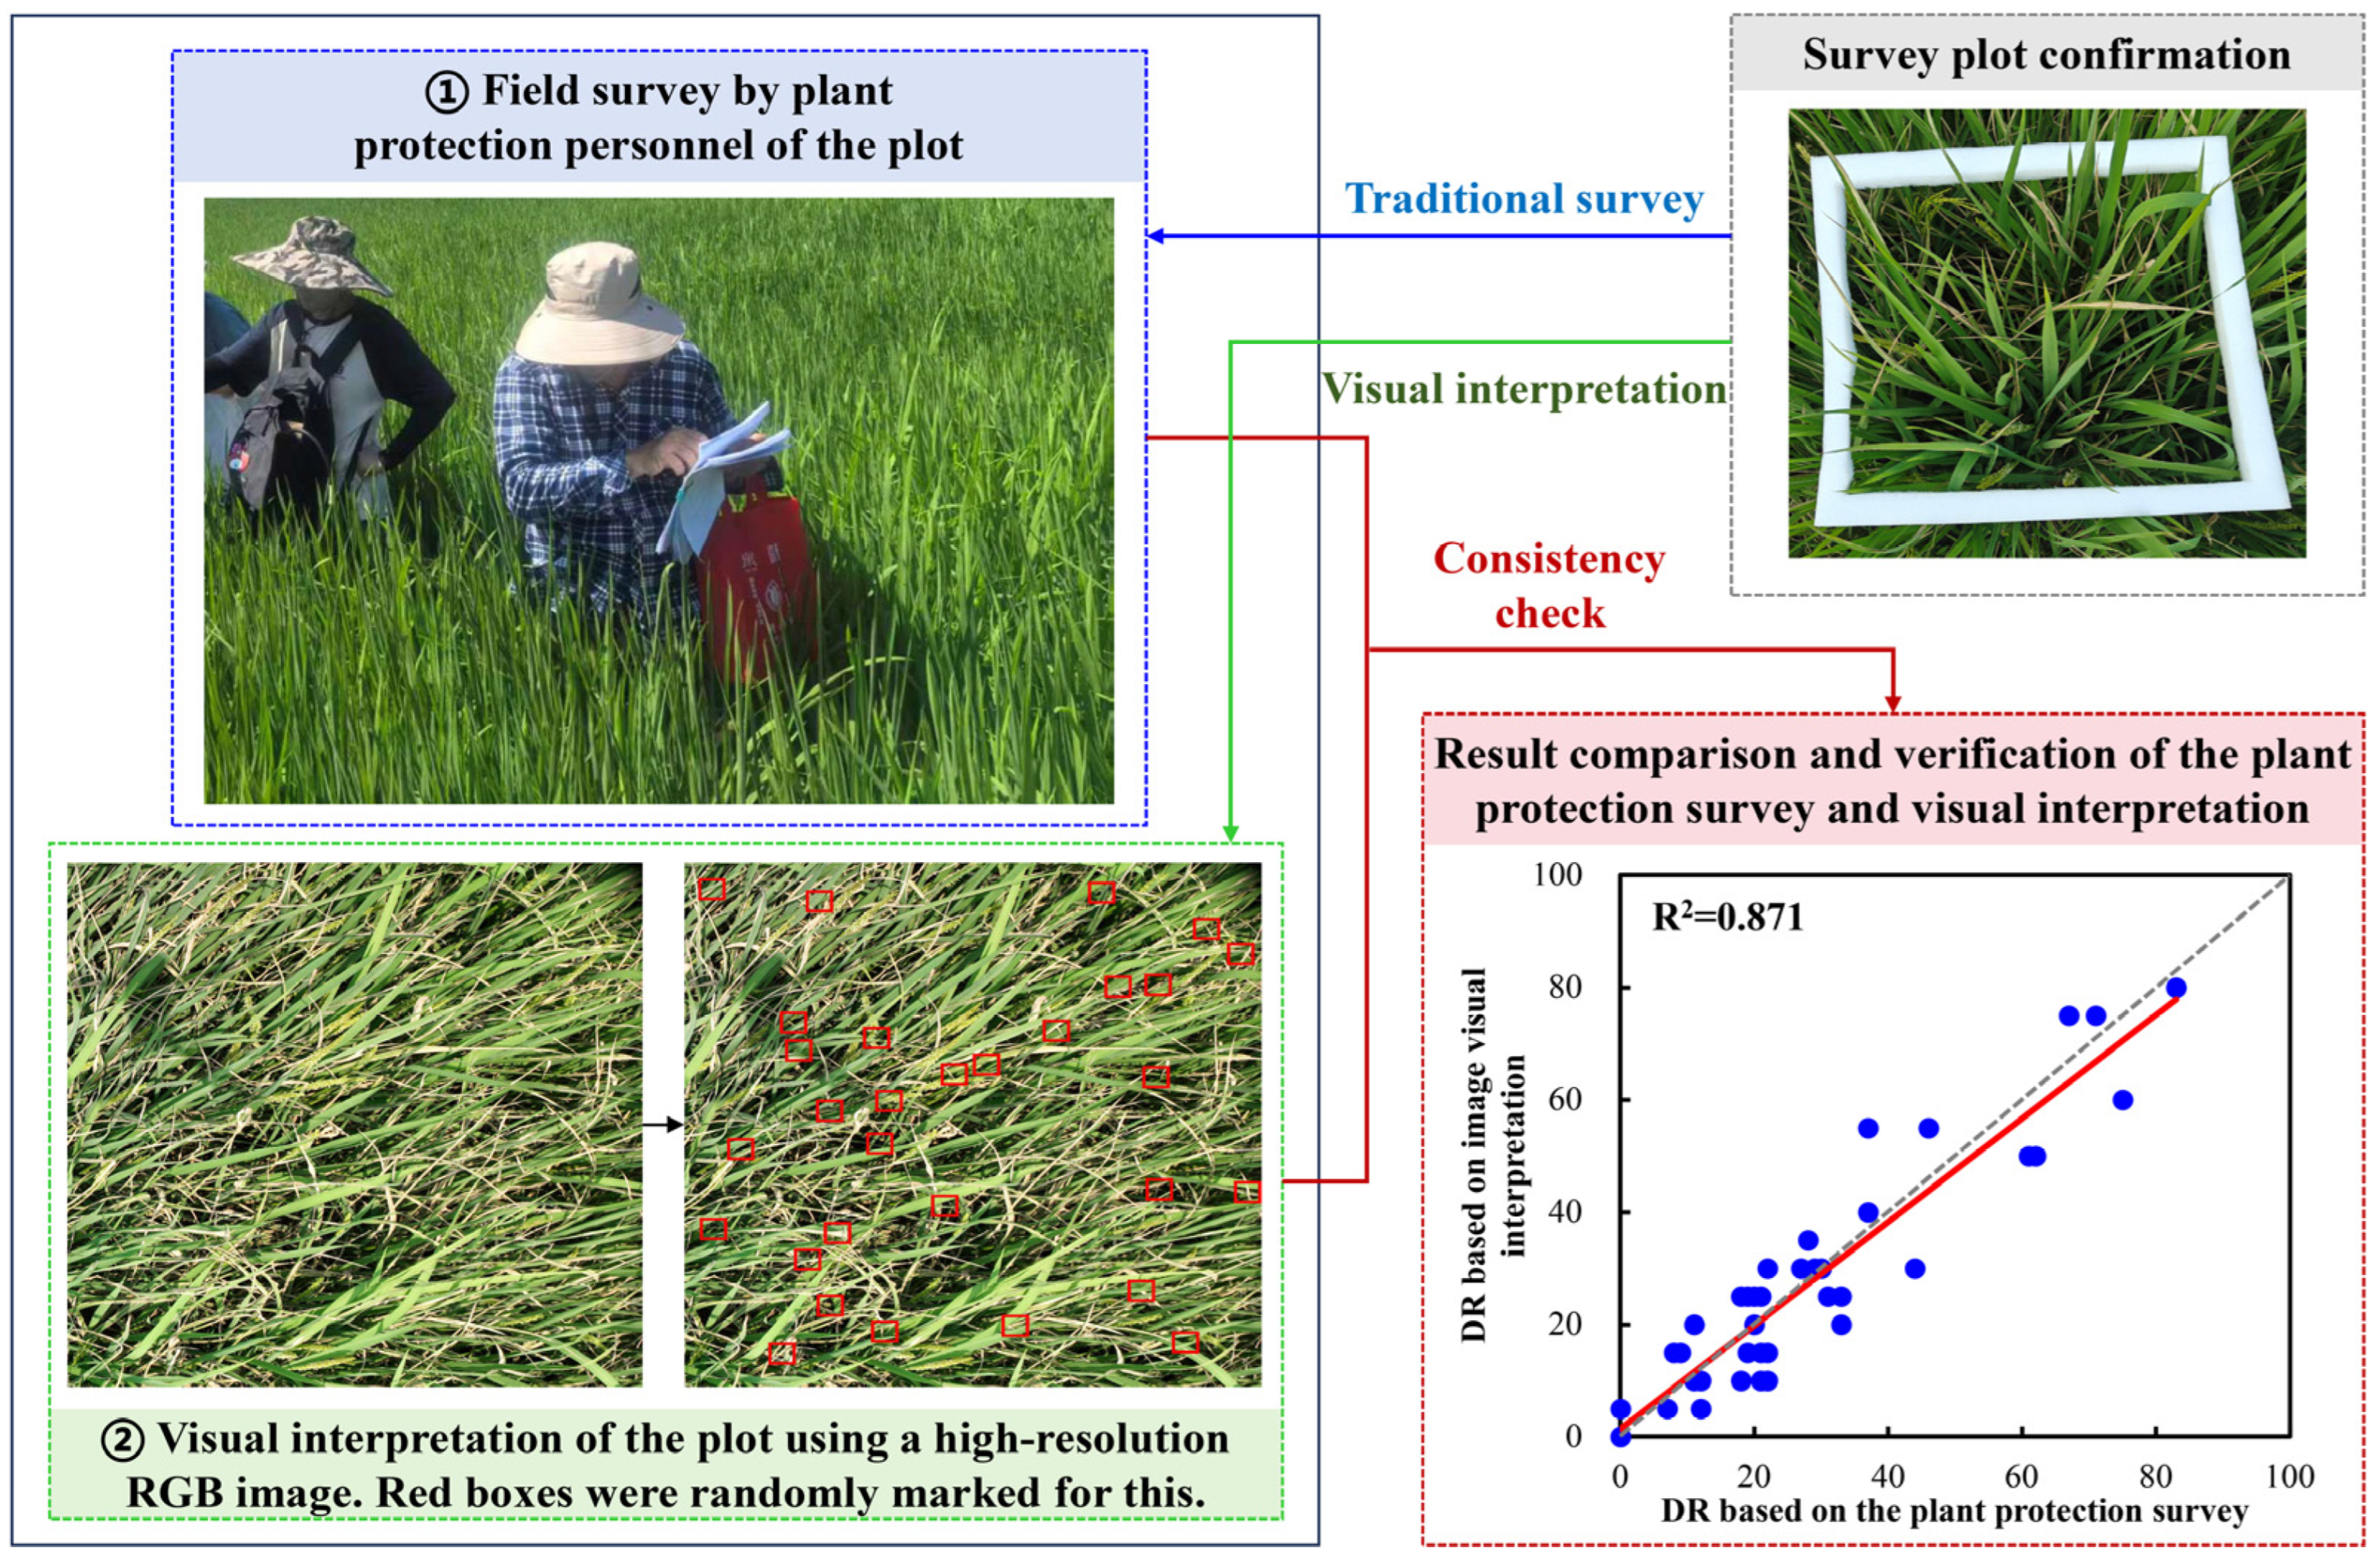
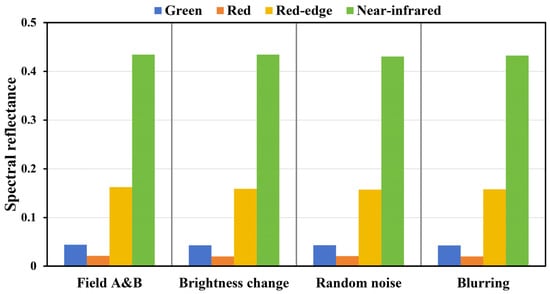
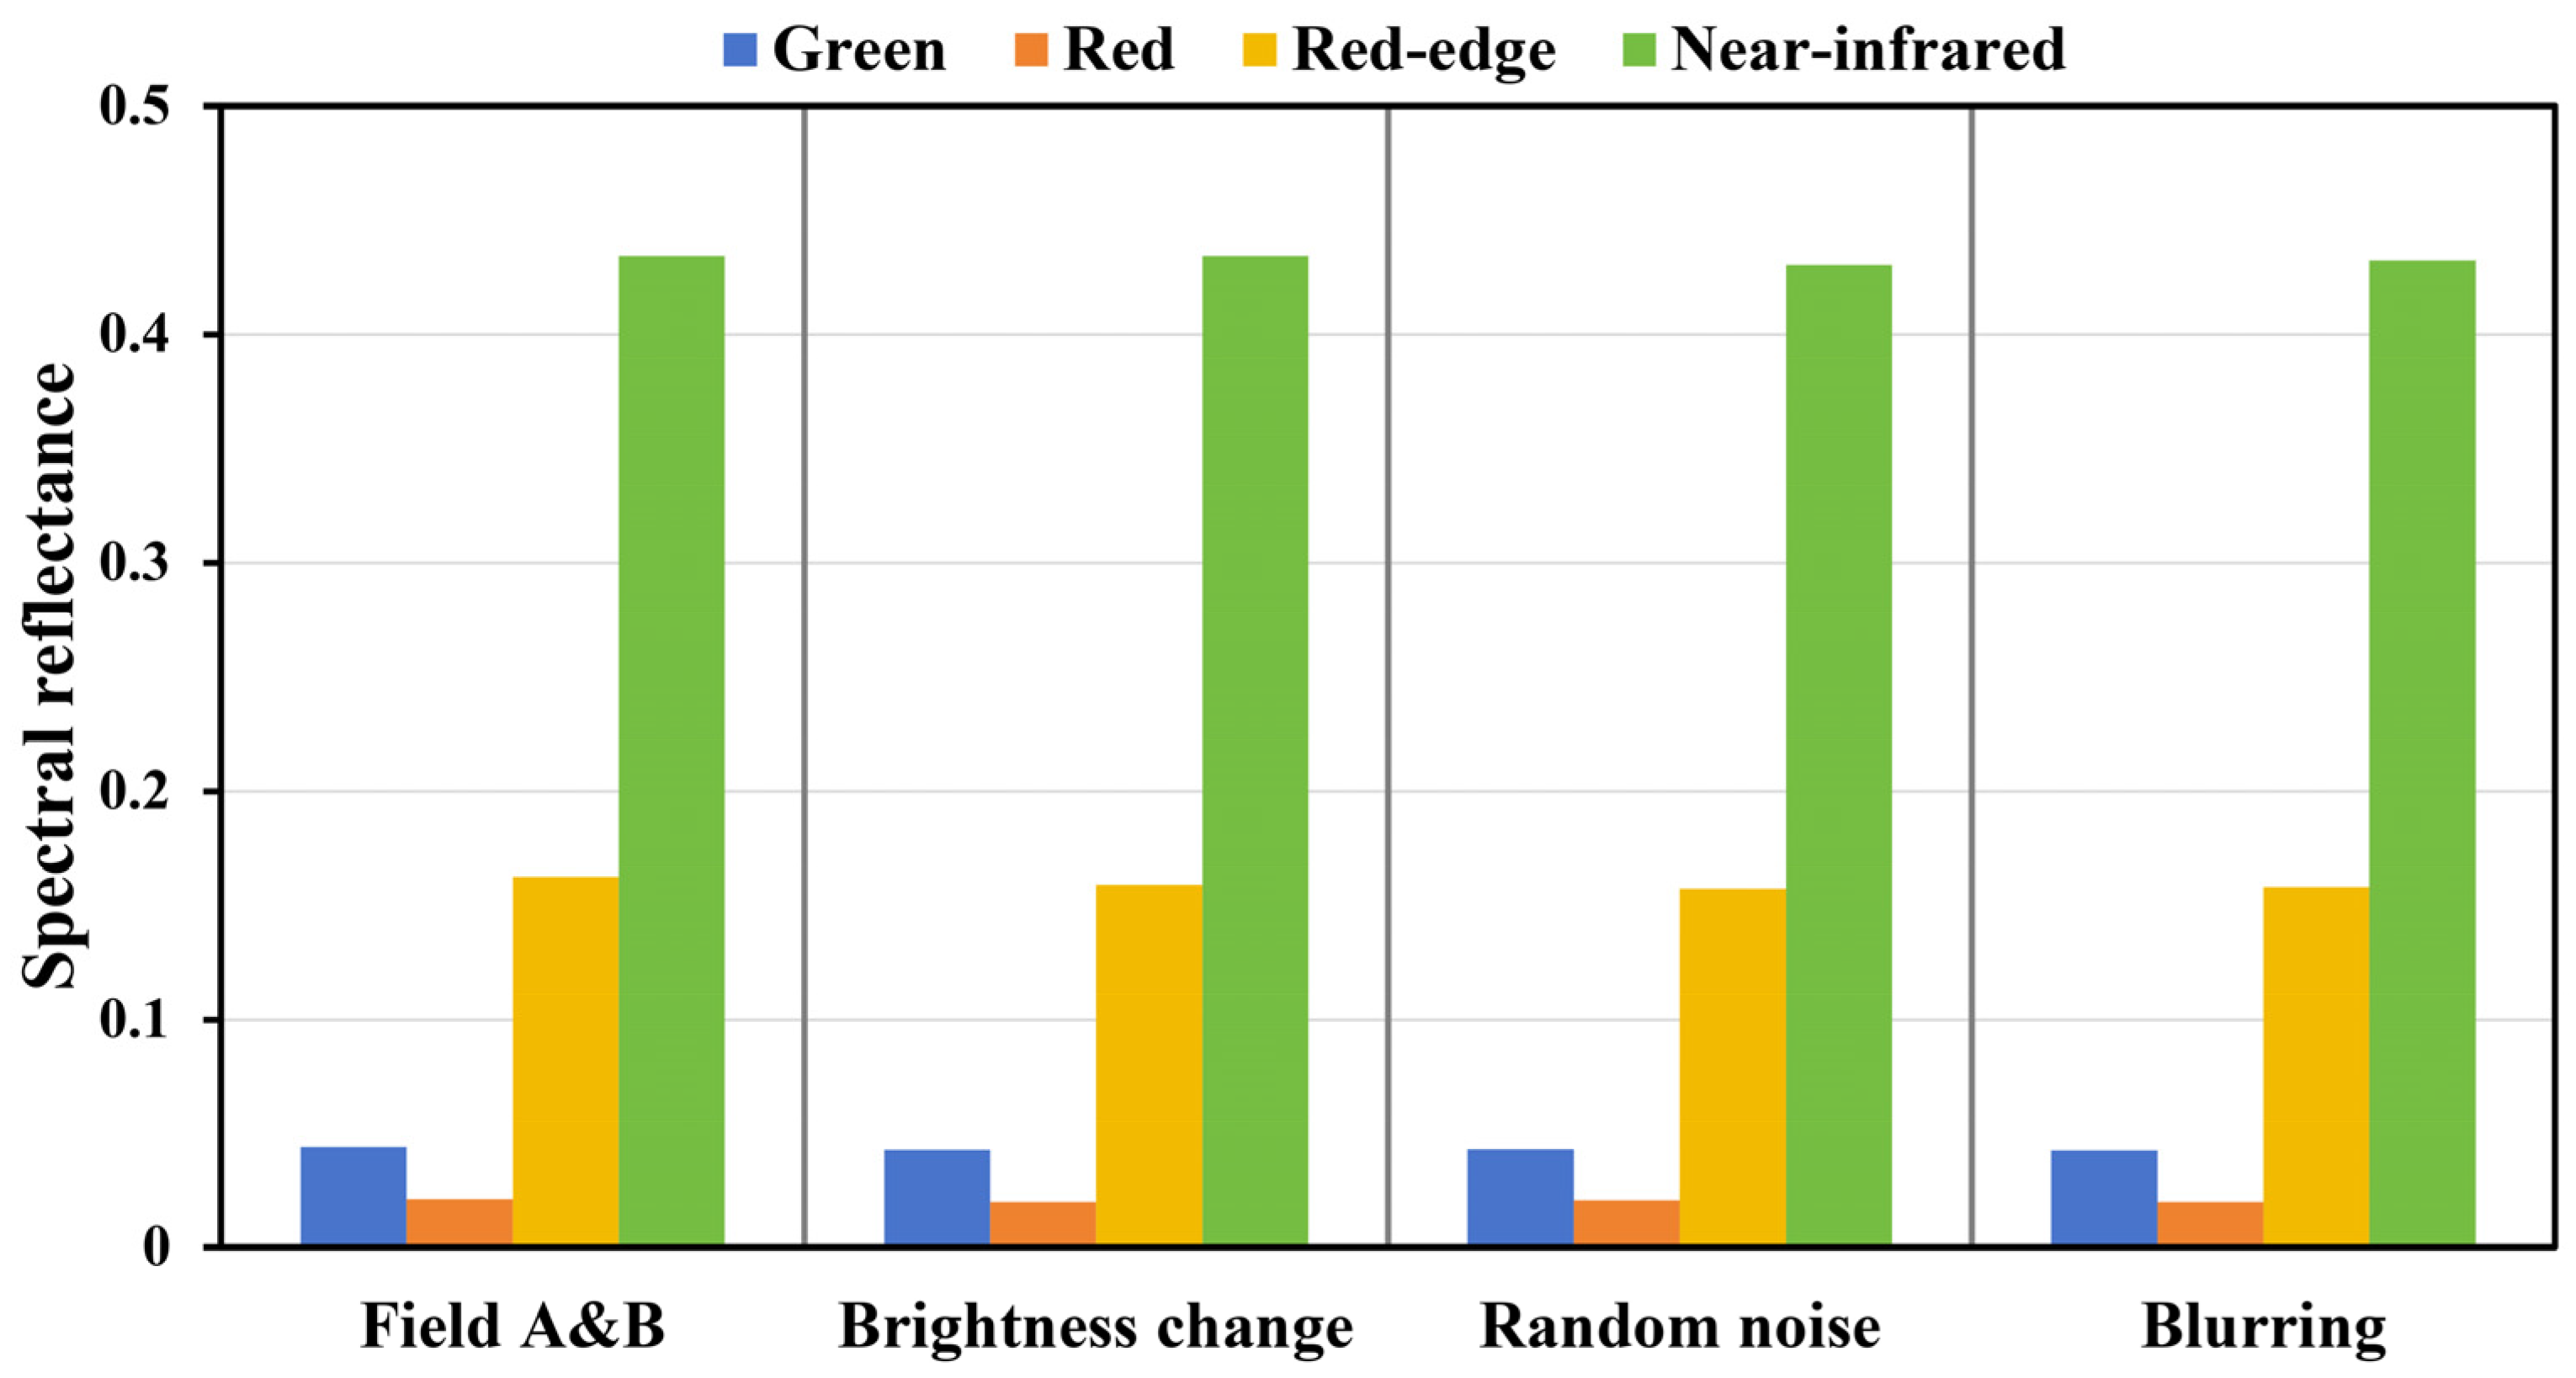
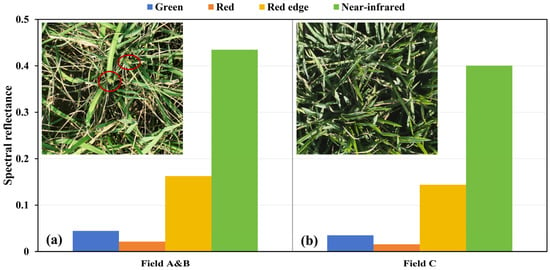
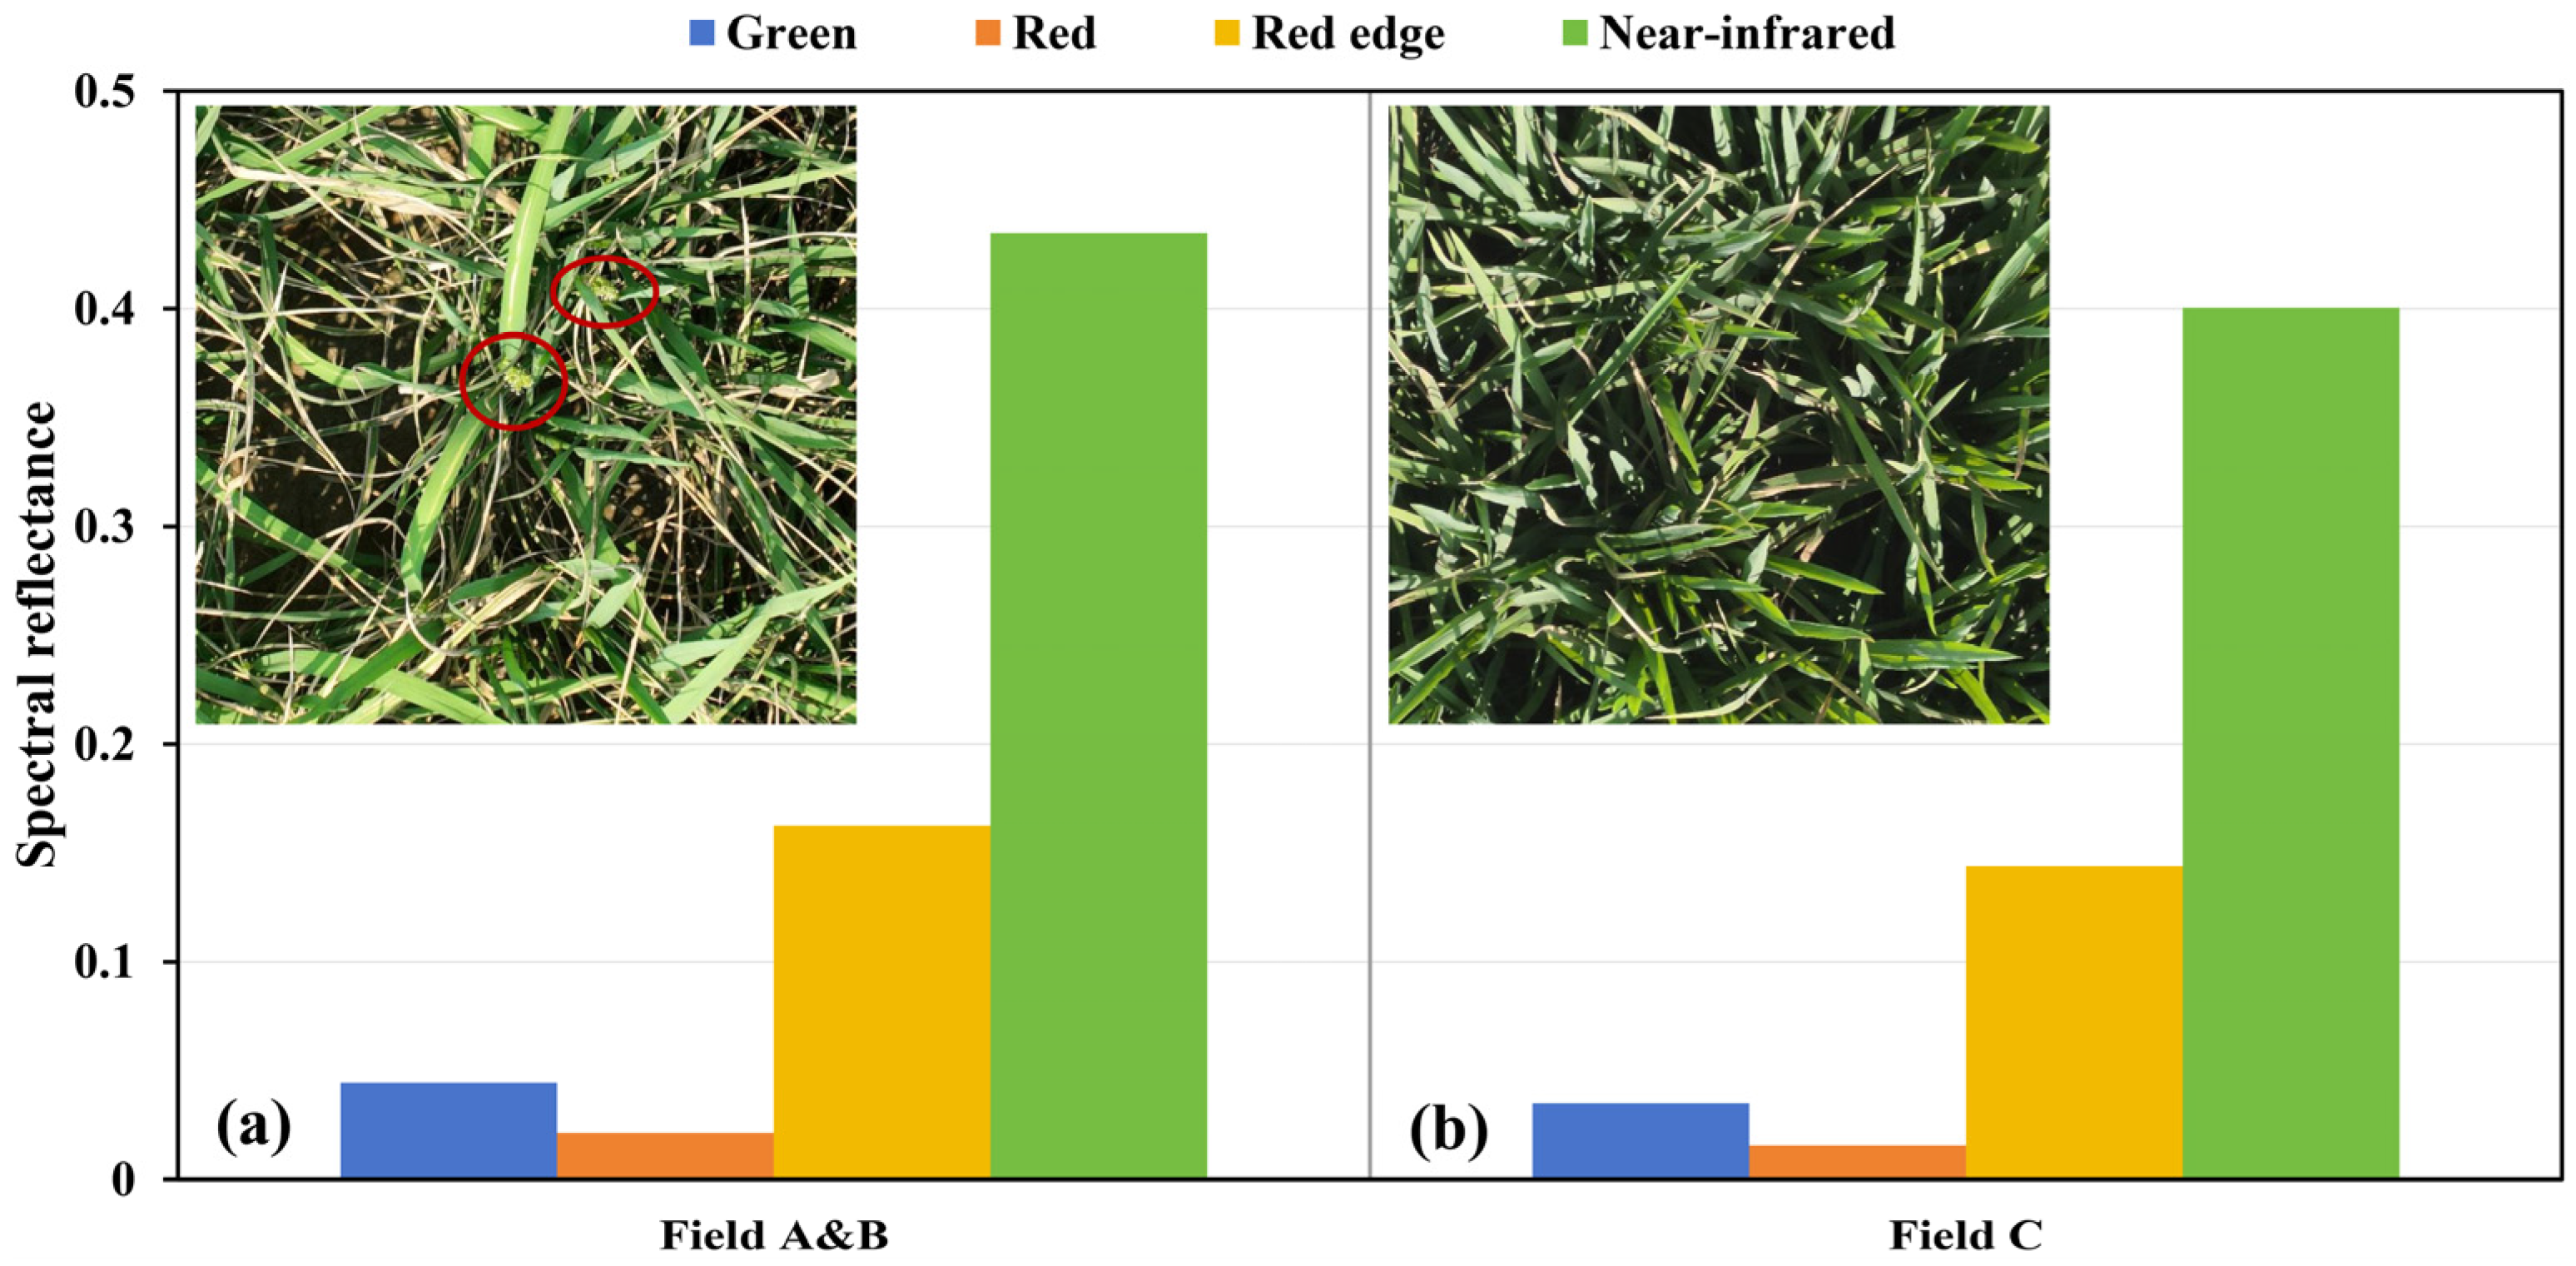
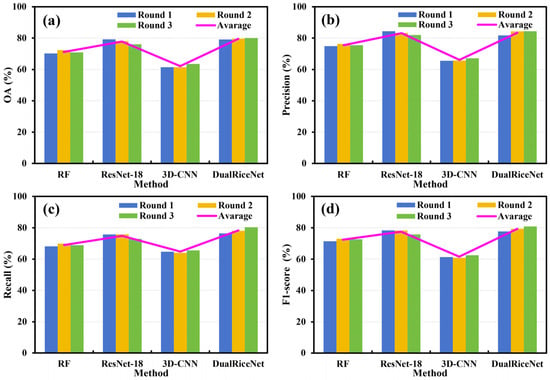
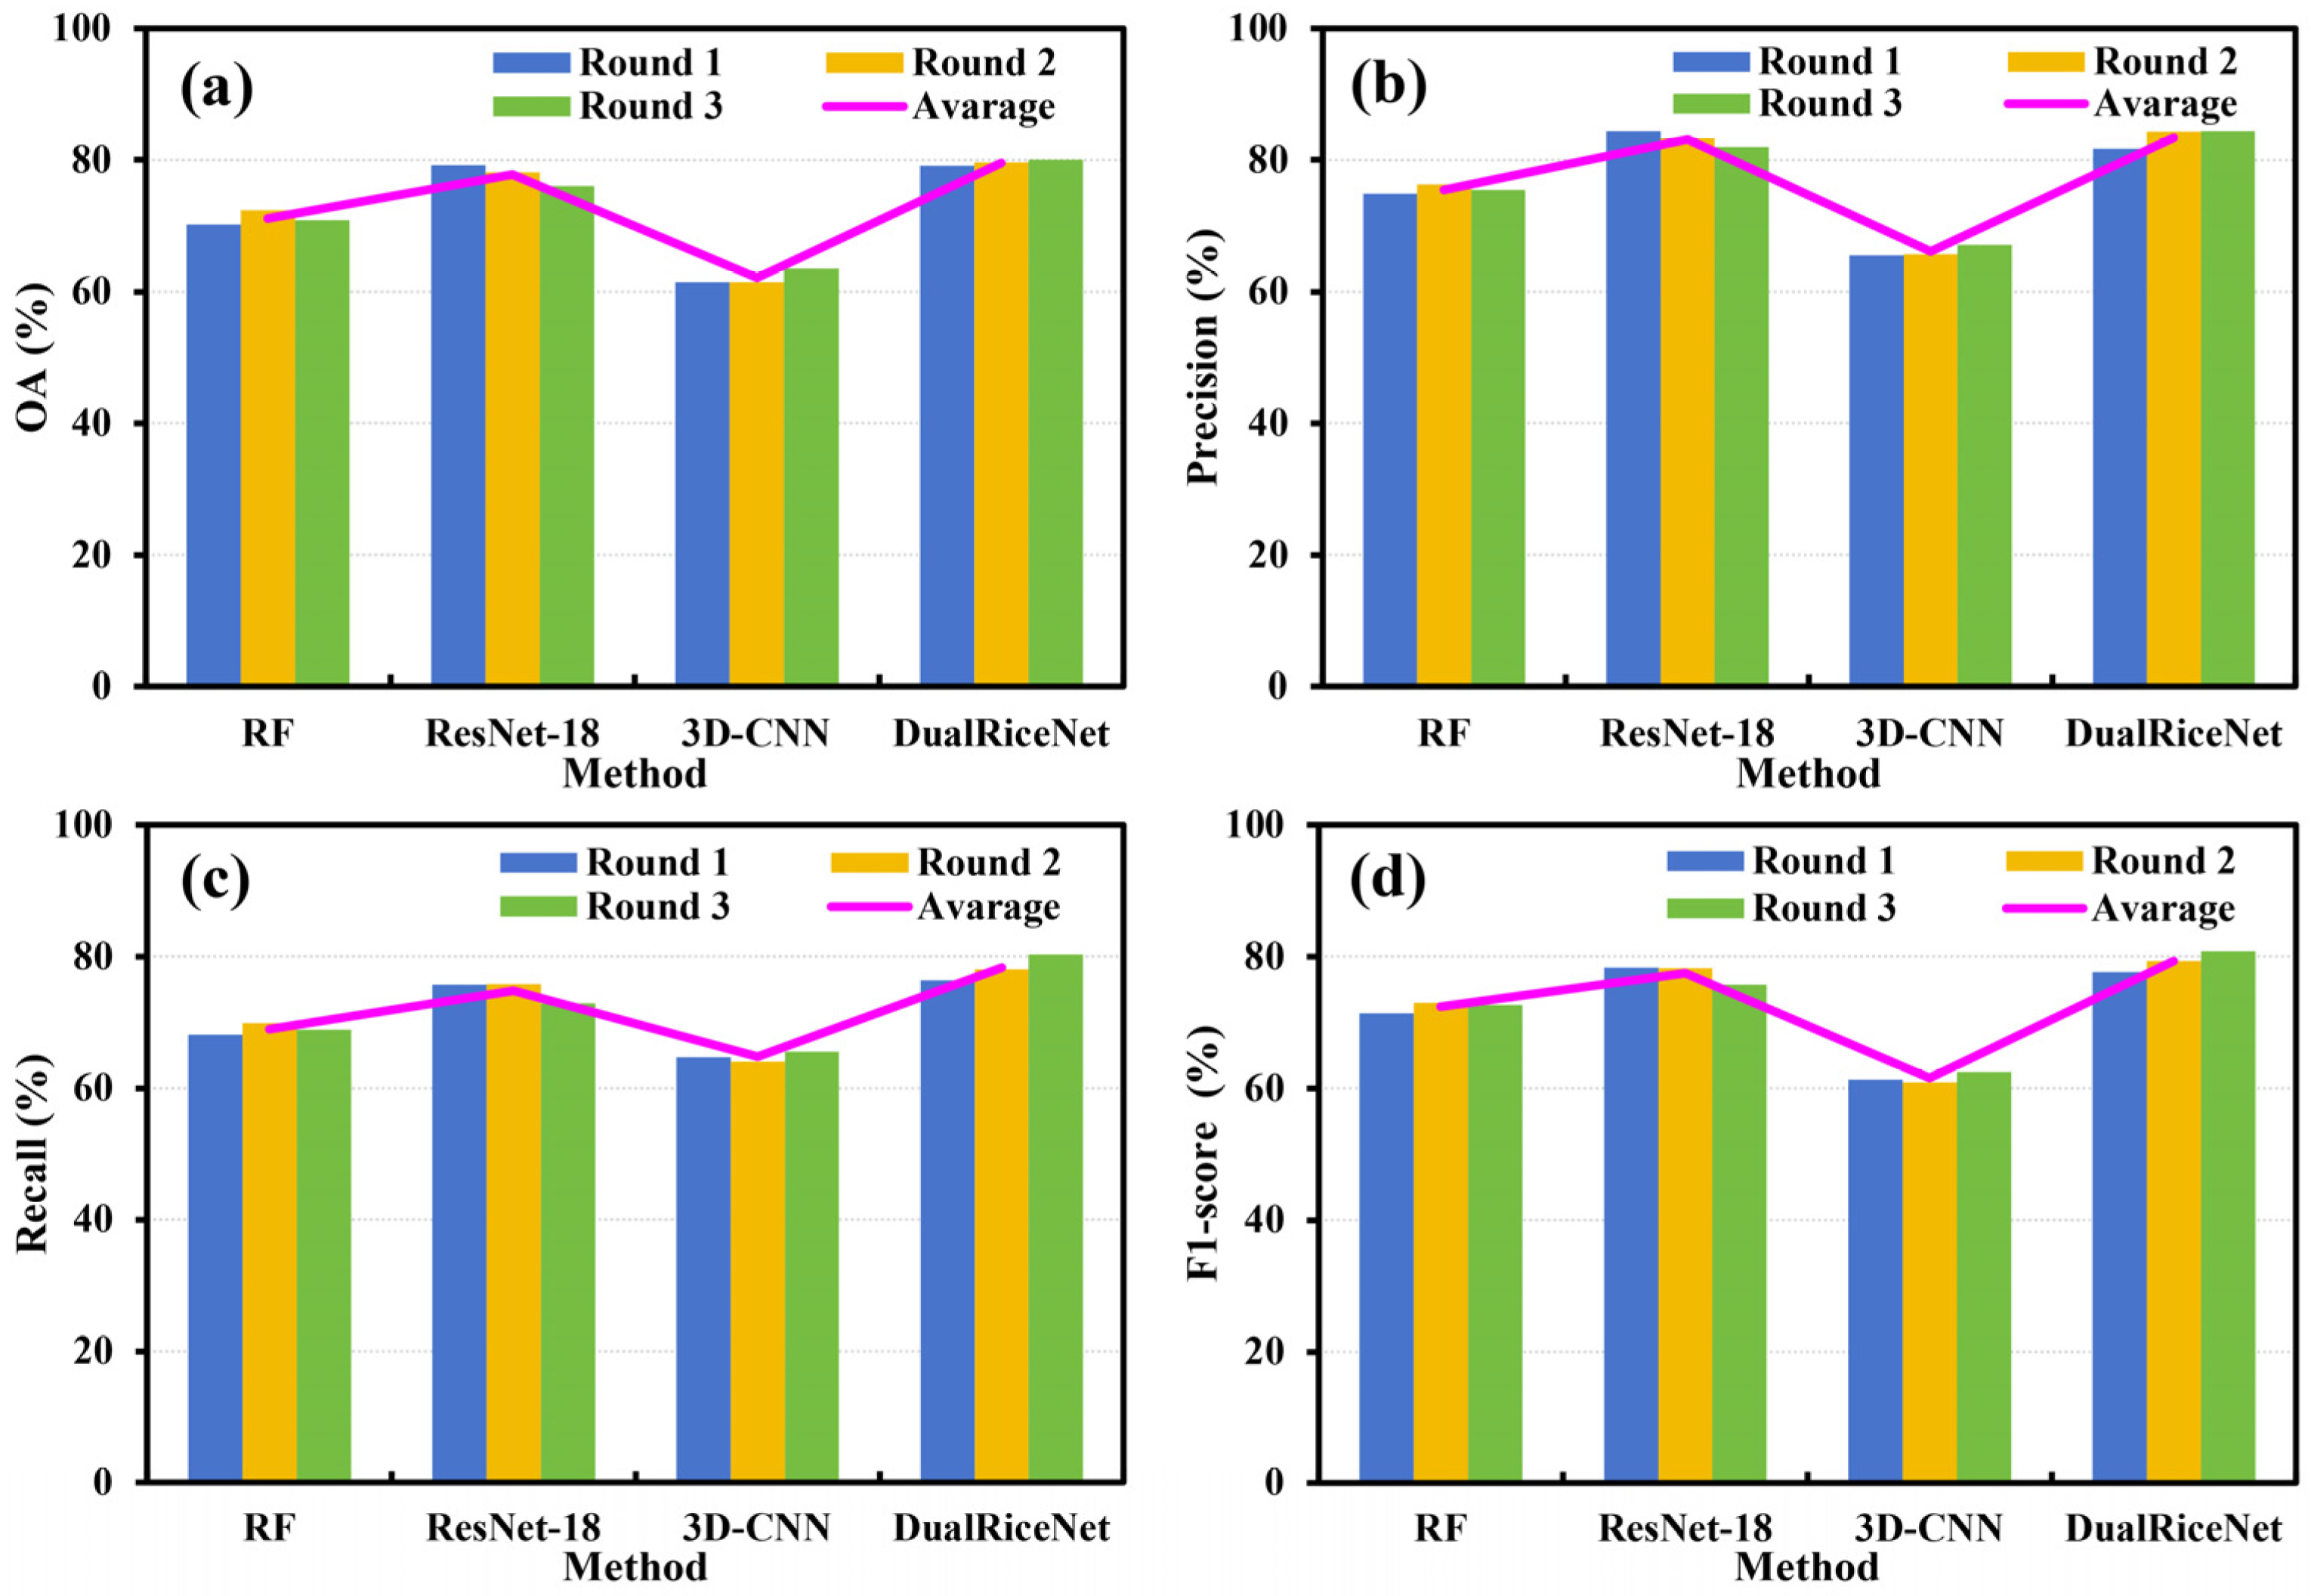

Disclaimer/Publisher’s Note: The statements, opinions and data contained in all publications are solely those of the individual author(s) and contributor(s) and not of MDPI and/or the editor(s). MDPI and/or the editor(s) disclaim responsibility for any injury to people or property resulting from any ideas, methods, instructions or products referred to in the content. |
© 2026 by the authors. Licensee MDPI, Basel, Switzerland. This article is an open access article distributed under the terms and conditions of the Creative Commons Attribution (CC BY) license.