


Highlights
What are the main findings?
- The Revised Local Maximum (RLM) algorithm effectively identified individual Moso bamboo from UAV RGB imagery (OA = 82.20%), with stand density showing a strong correlation with plot-level biomass (R2 = 0.96).
- Six stand density-dependent aboveground biomass models for Moso bamboo were developed. The Artificial Neural Network (ANN) model achieved the best performance (validation set R2 = 0.87, RMSE = 4.56 Mg/ha), with 10-fold cross-validation confirming its robustness (R2 = 0.84 ± 0.06).
What are the implications of the main findings?
- This approach overcomes limitations of satellite remote sensing, enabling fine-scale Moso bamboo biomass monitoring via UAV images and the RLM algorithm, supporting accurate regional carbon stock assessments.
- A low-cost and scalable biomass estimation framework was established, requiring only UAV RGB images (no LiDAR data), facilitating sustainable bamboo forest management and the advancement of the “dual carbon” goal.
Abstract
The accurate estimation of aboveground biomass (AGB) in Moso bamboo forests is critical for assessing their carbon sequestration potential and supporting sustainable management. Satellite-based approaches are often constrained by signal saturation and mixed-pixel effects, whereas Unmanned Aerial Vehicle (UAV) imagery enables precise individual tree detection, overcoming these limitations. In this study, we propose a stand density (SD)-driven AGB estimation framework using high-resolution UAV RGB imagery. Individual bamboo positions were extracted using the Revised Local Maximum (RLM) algorithm, which achieved an optimal accuracy at a 2.5 m sampling interval (OA = 82.20%). Using 85 ground-truth plots, we developed six SD-AGB models and evaluated them via 10-fold cross-validation and independent UAV validation (10 plots). The Artificial Neural Network (ANN) model outperformed others, with strong calibration (R2 = 0.94, RMSE = 3.78 Mg/ha), robust cross-validation (R2 = 0.84 ± 0.06, RMSE = 5.24 ± 0.67 Mg/ha), and reliable independent validation (R2 = 0.87, RMSE = 4.56 Mg/ha). Spatial mapping revealed a total of 14,190 bamboo plants with an average AGB of 32.80 Mg/ha. This UAV-based SD-AGB framework provides a robust, scalable, and cost-effective tool for precise biomass estimation, supporting sustainable bamboo forest management and carbon sequestration strategies and progress towards SDG 15.
1. Introduction
Moso bamboo (Phyllostachys edulis), the most widely distributed bamboo species in China, accounts for nearly 70% of the total bamboo forest area nationwide, with its stand area reaching 5.27 million hectares [1]. Endowed with the dual characteristics of rapid growth (only 50–60 days from bamboo shoot to mature culm) and efficient carbon sequestration (with an annual carbon sequestration capacity of 10.19 ± 2.54 Tg), Moso bamboo forests have emerged as a critical resource for addressing global climate change and supporting the “dual carbon” strategy as well as the bamboo as a substitute for plastic initiative [2,3,4]. The accurate estimation of the aboveground biomass (AGB) in Moso bamboo forests is the core prerequisite for evaluating their carbon sequestration capacity and clarifying the carbon cycle of terrestrial ecosystems [5,6,7]. Important explorations in this field have been conducted utilizing remote sensing technology and modeling algorithms [8].
The AGB of individual Moso bamboo is mainly correlated with the diameter at breast height (DBH) and age, while its correlation with tree height is negligible [9]. Consequently, a traditional small-scale AGB estimation mostly relies on the construction of regression models using the DBH and age [9]. This method enables high-precision calculations, but it requires extensive field surveys. These surveys are time-consuming, labor-intensive, and have limited coverage. Thus, they cannot meet monitoring needs at regional or even national scales. In contrast, satellite remote sensing data are commonly used for large-scale estimations of the AGB of Moso bamboo forests [10,11,12]. Remote sensing datasets such as Landsat and Sentinel-2 enable the efficient coverage of large-scale areas [13,14,15]. However, their insufficient spatial resolution fails to capture the fine-scale structural heterogeneity of Moso bamboo stands [16]. Additionally, the temporal–spatial asynchrony between remote sensing data and ground surveys introduces systematic biases [4]. Collectively, these issues result in a highly variable coefficient of determination (R2) for the AGB estimation models, with values ranging from 0.11 to 0.86, as shown in Table A1. This considerable spread makes it difficult to ensure the overall reliability of the assessment outcomes [4,17,18].
The emergence of Unmanned Aerial Vehicle (UAV) remote sensing technology offers a new possibility for overcoming this dilemma [19,20,21]. It can acquire high-resolution imagery and flexibly match the timing of ground surveys, effectively addressing the temporal–spatial asynchrony issue of traditional satellite remote sensing [22,23,24]. Theoretically, it serves as an ideal tool to bridge the gap between small-scale accuracy and large-scale efficiency [25,26]. However, in practice, onboard visible light data can only capture two-dimensional image information, failing to directly obtain key parameters that traditional biomass models rely on [27,28]. While Light Detection and Ranging (LiDAR) can retrieve three-dimensional forest structure, its utility for Moso bamboo is constrained by the species’ biological characteristics. Recent studies show that LiDAR-derived height metrics contribute minimally to AGB estimation in Moso bamboo forests (R2 = 0.08–0.31) due to the uniform canopy height [29], and even advanced LiDAR cannot directly measure DBH. This technical bottleneck prevents the high-resolution advantage of UAVs from translating into improved biomass estimation accuracy. Consequently, there is an urgent need to identify a core modeling factor better aligned with UAV data characteristics—one that bypasses the reliance on three-dimensional structural parameters. Stand density, which can be directly derived from UAV RGB imagery through individual tree detection, offers a promising alternative.
Regarding the growth traits of Moso bamboo, individual morphological indicators exhibit inherently limited discriminative power. The DBH and height vary slightly across individuals, with coefficients of variation of only 17% and 16%, respectively, and are predominantly concentrated within the ranges of 8–12 cm (DBH) and 8–11.5 m (height) [14]. Our prior findings revealed weak correlations between the plot-level AGB of Moso bamboo and the average DBH or average height, with an R2 of merely 0.11 and 0.01, respectively, which is insufficient to accurately reflect the actual plot AGB [14]. In stark contrast, the plot AGB demonstrated a strong positive correlation with stand density, achieving a correlation coefficient of 0.79 and an R2 of 0.78, making stand density a more stable and core predictor than the DBH or height [14]. Critically, stand density does not require complex three-dimensional structural data; it can be directly derived via individual bamboo recognition from UAV RGB imagery. This dual advantage—easy accessibility and a strong biomass correlation—offers a practical solution for overcoming UAV technical bottlenecks and enabling rapid Moso bamboo AGB estimations.
Against this background, this study posits that stand density (SD), a readily derivable metric from UAV RGB imagery, serves as a robust and practical proxy for constructing a novel AGB estimation model, effectively bypassing the need for complex 3D data. The specific objectives of this work are to (1) identify individual Moso bamboo from UAV images using the Revised Local Maximum (RLM) algorithm; (2) construct and validate six SD-AGB models (linear, power, logarithmic, Random Forest (RF), Support Vector Machine (SVM), and Artificial Neural Network (ANN)) to identify the optimal performer; and (3) map the spatial distribution of the AGB and analyze its characteristics. By proposing this novel perspective, we aim to provide a low-cost, widely applicable method for regional Moso bamboo AGB estimation, directly supporting sustainable forest management practices (SDG 15).
2. Materials and Methods
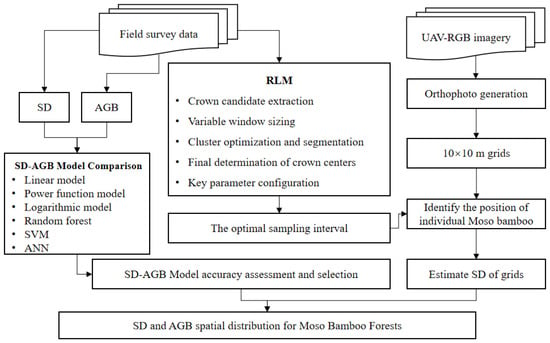
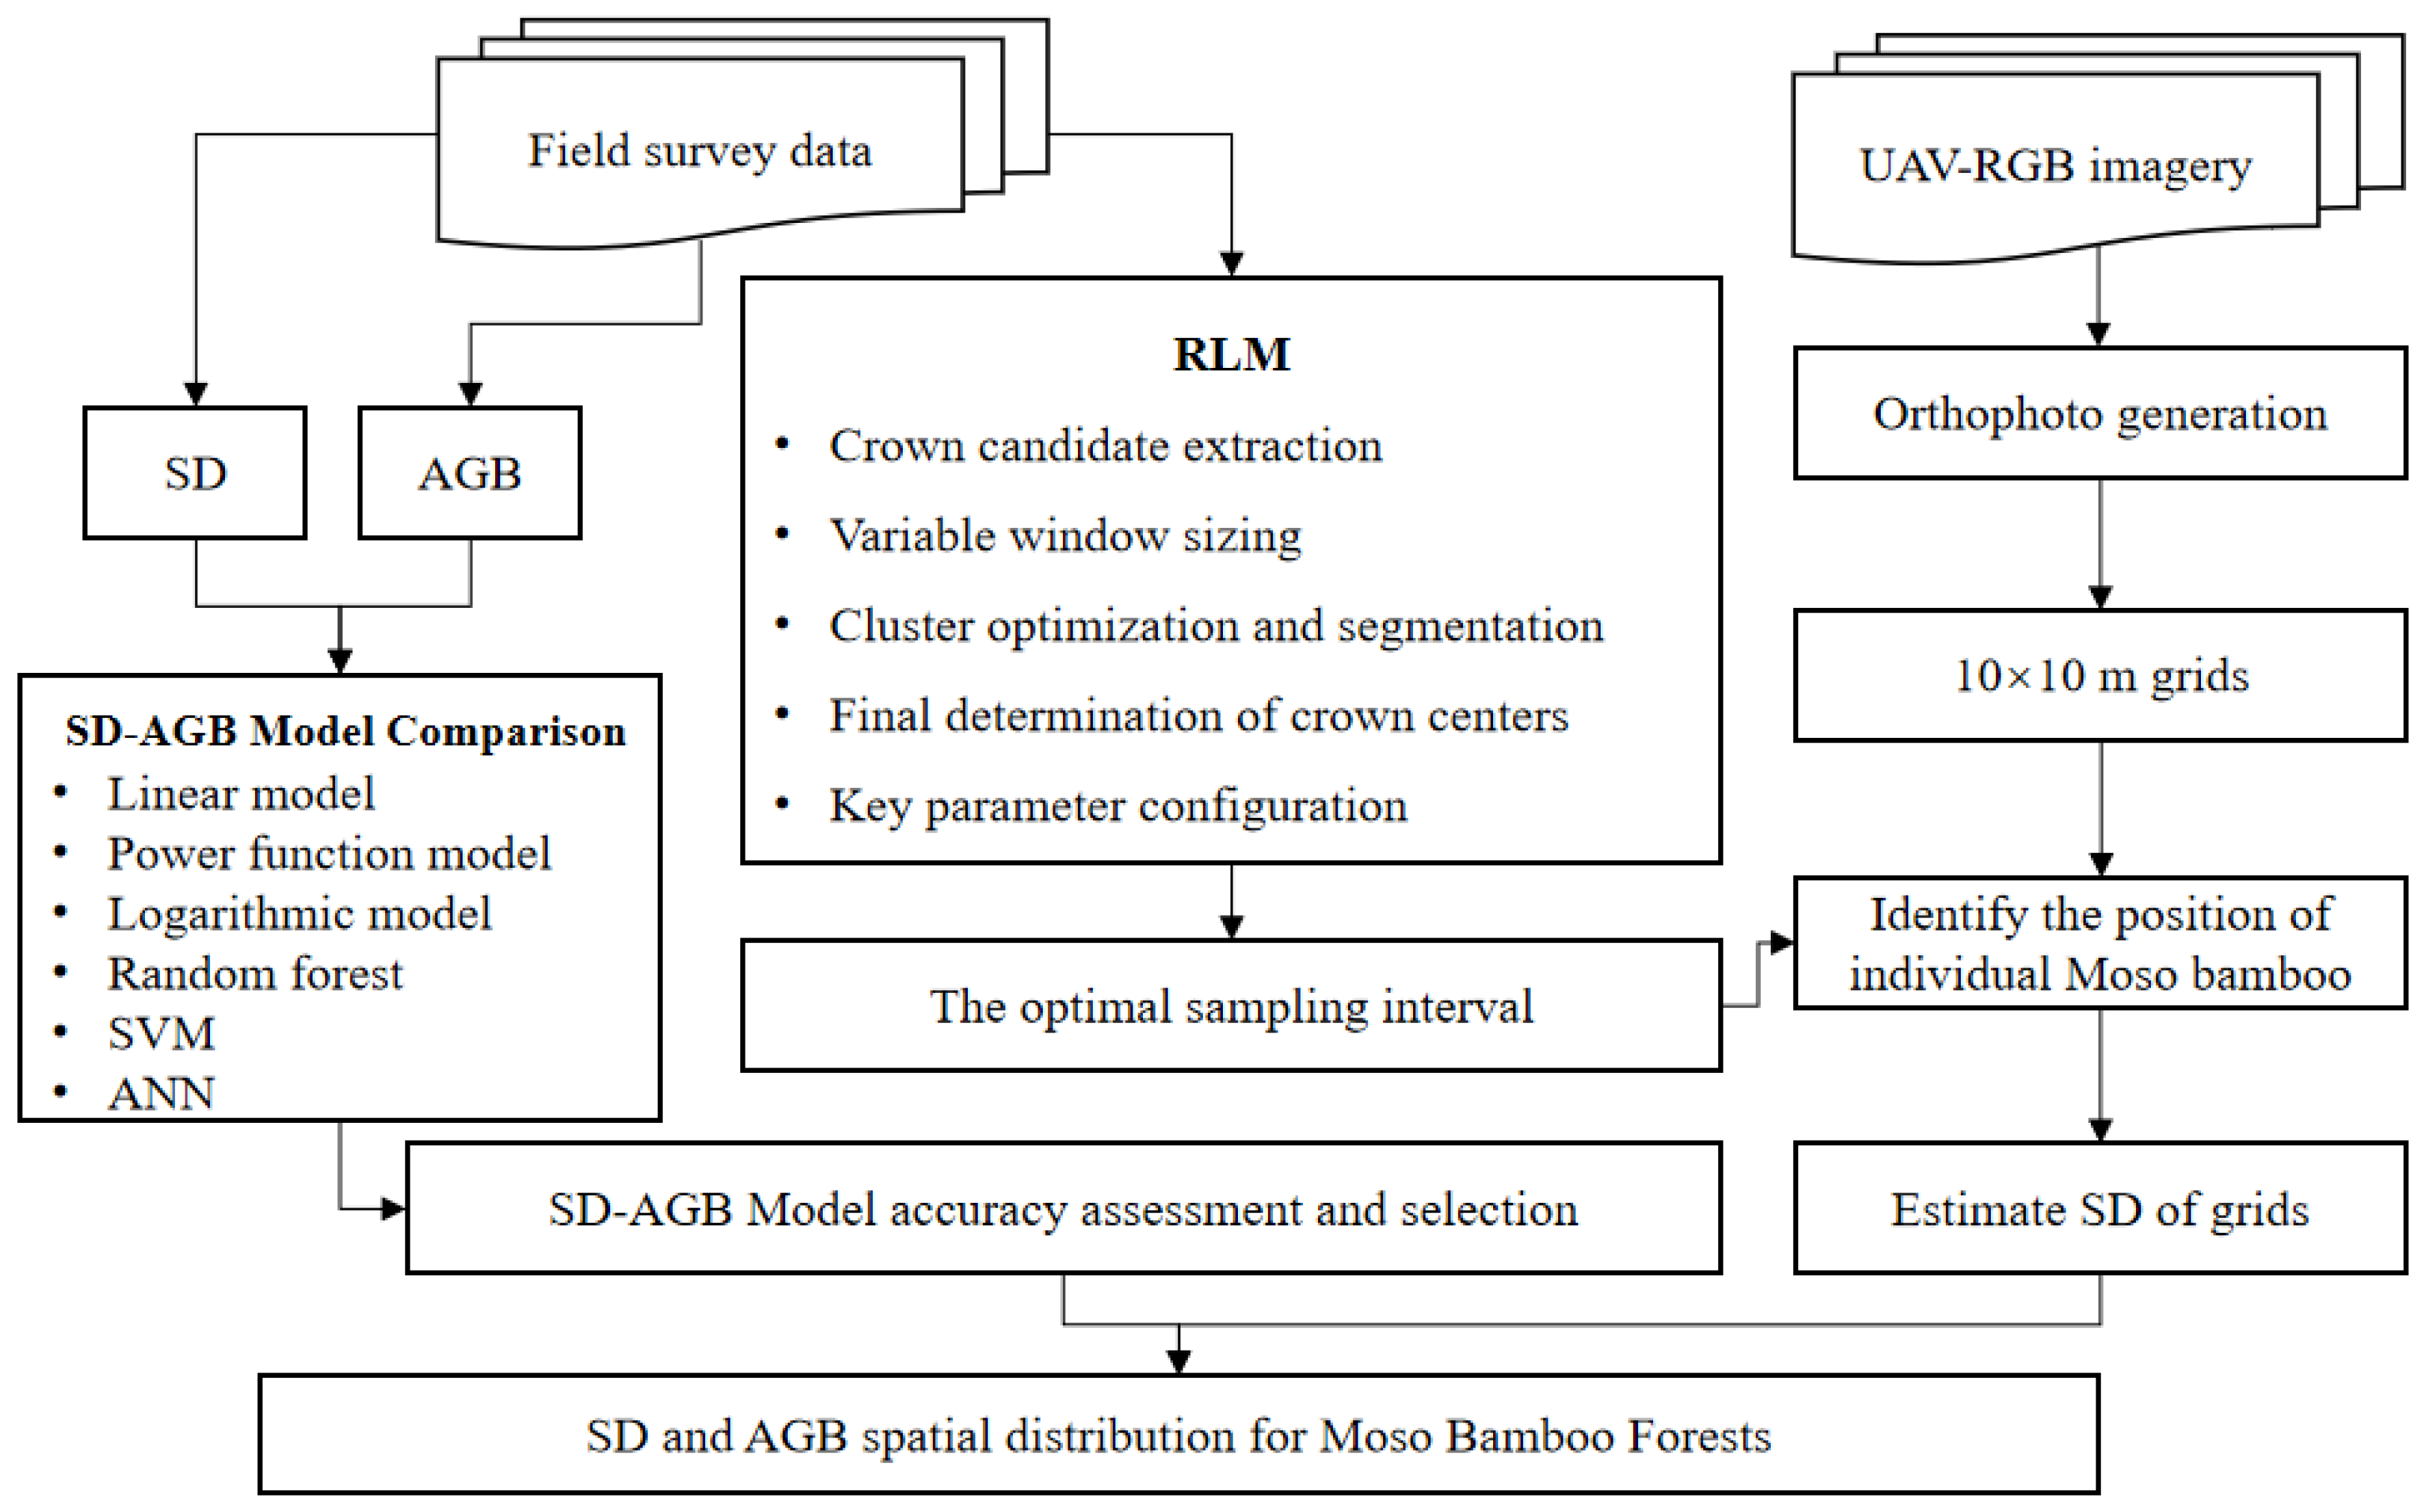
The overall study framework is illustrated in Figure 1 and consists of four steps: (1) high-resolution UAV imagery and sample plots were collected; (2) the RLM algorithm was applied to extract positions of individual Moso bamboos from UAV imagery, and the optimal sampling interval was determined; (3) based on data from 85 sample plots, six SD-AGB models (linear, power function, logarithmic, RF, SVM, and ANN) were compared, and the optimal model was identified; and (4) the study area was divided into 10 × 10 m grids, the stand density of each grid was calculated, and the spatial distribution of the SD and AGB was analyzed by integrating the optimal model.
Figure 1.
The framework of this study.
2.1. Study Area
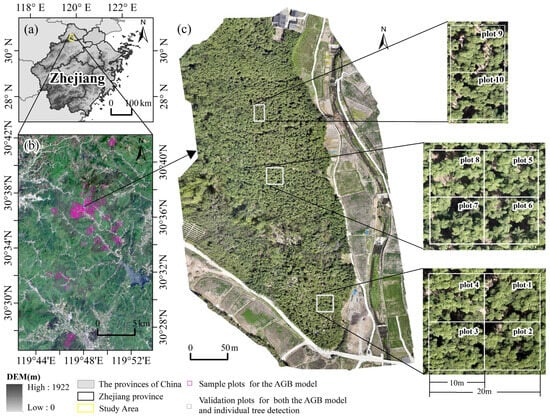
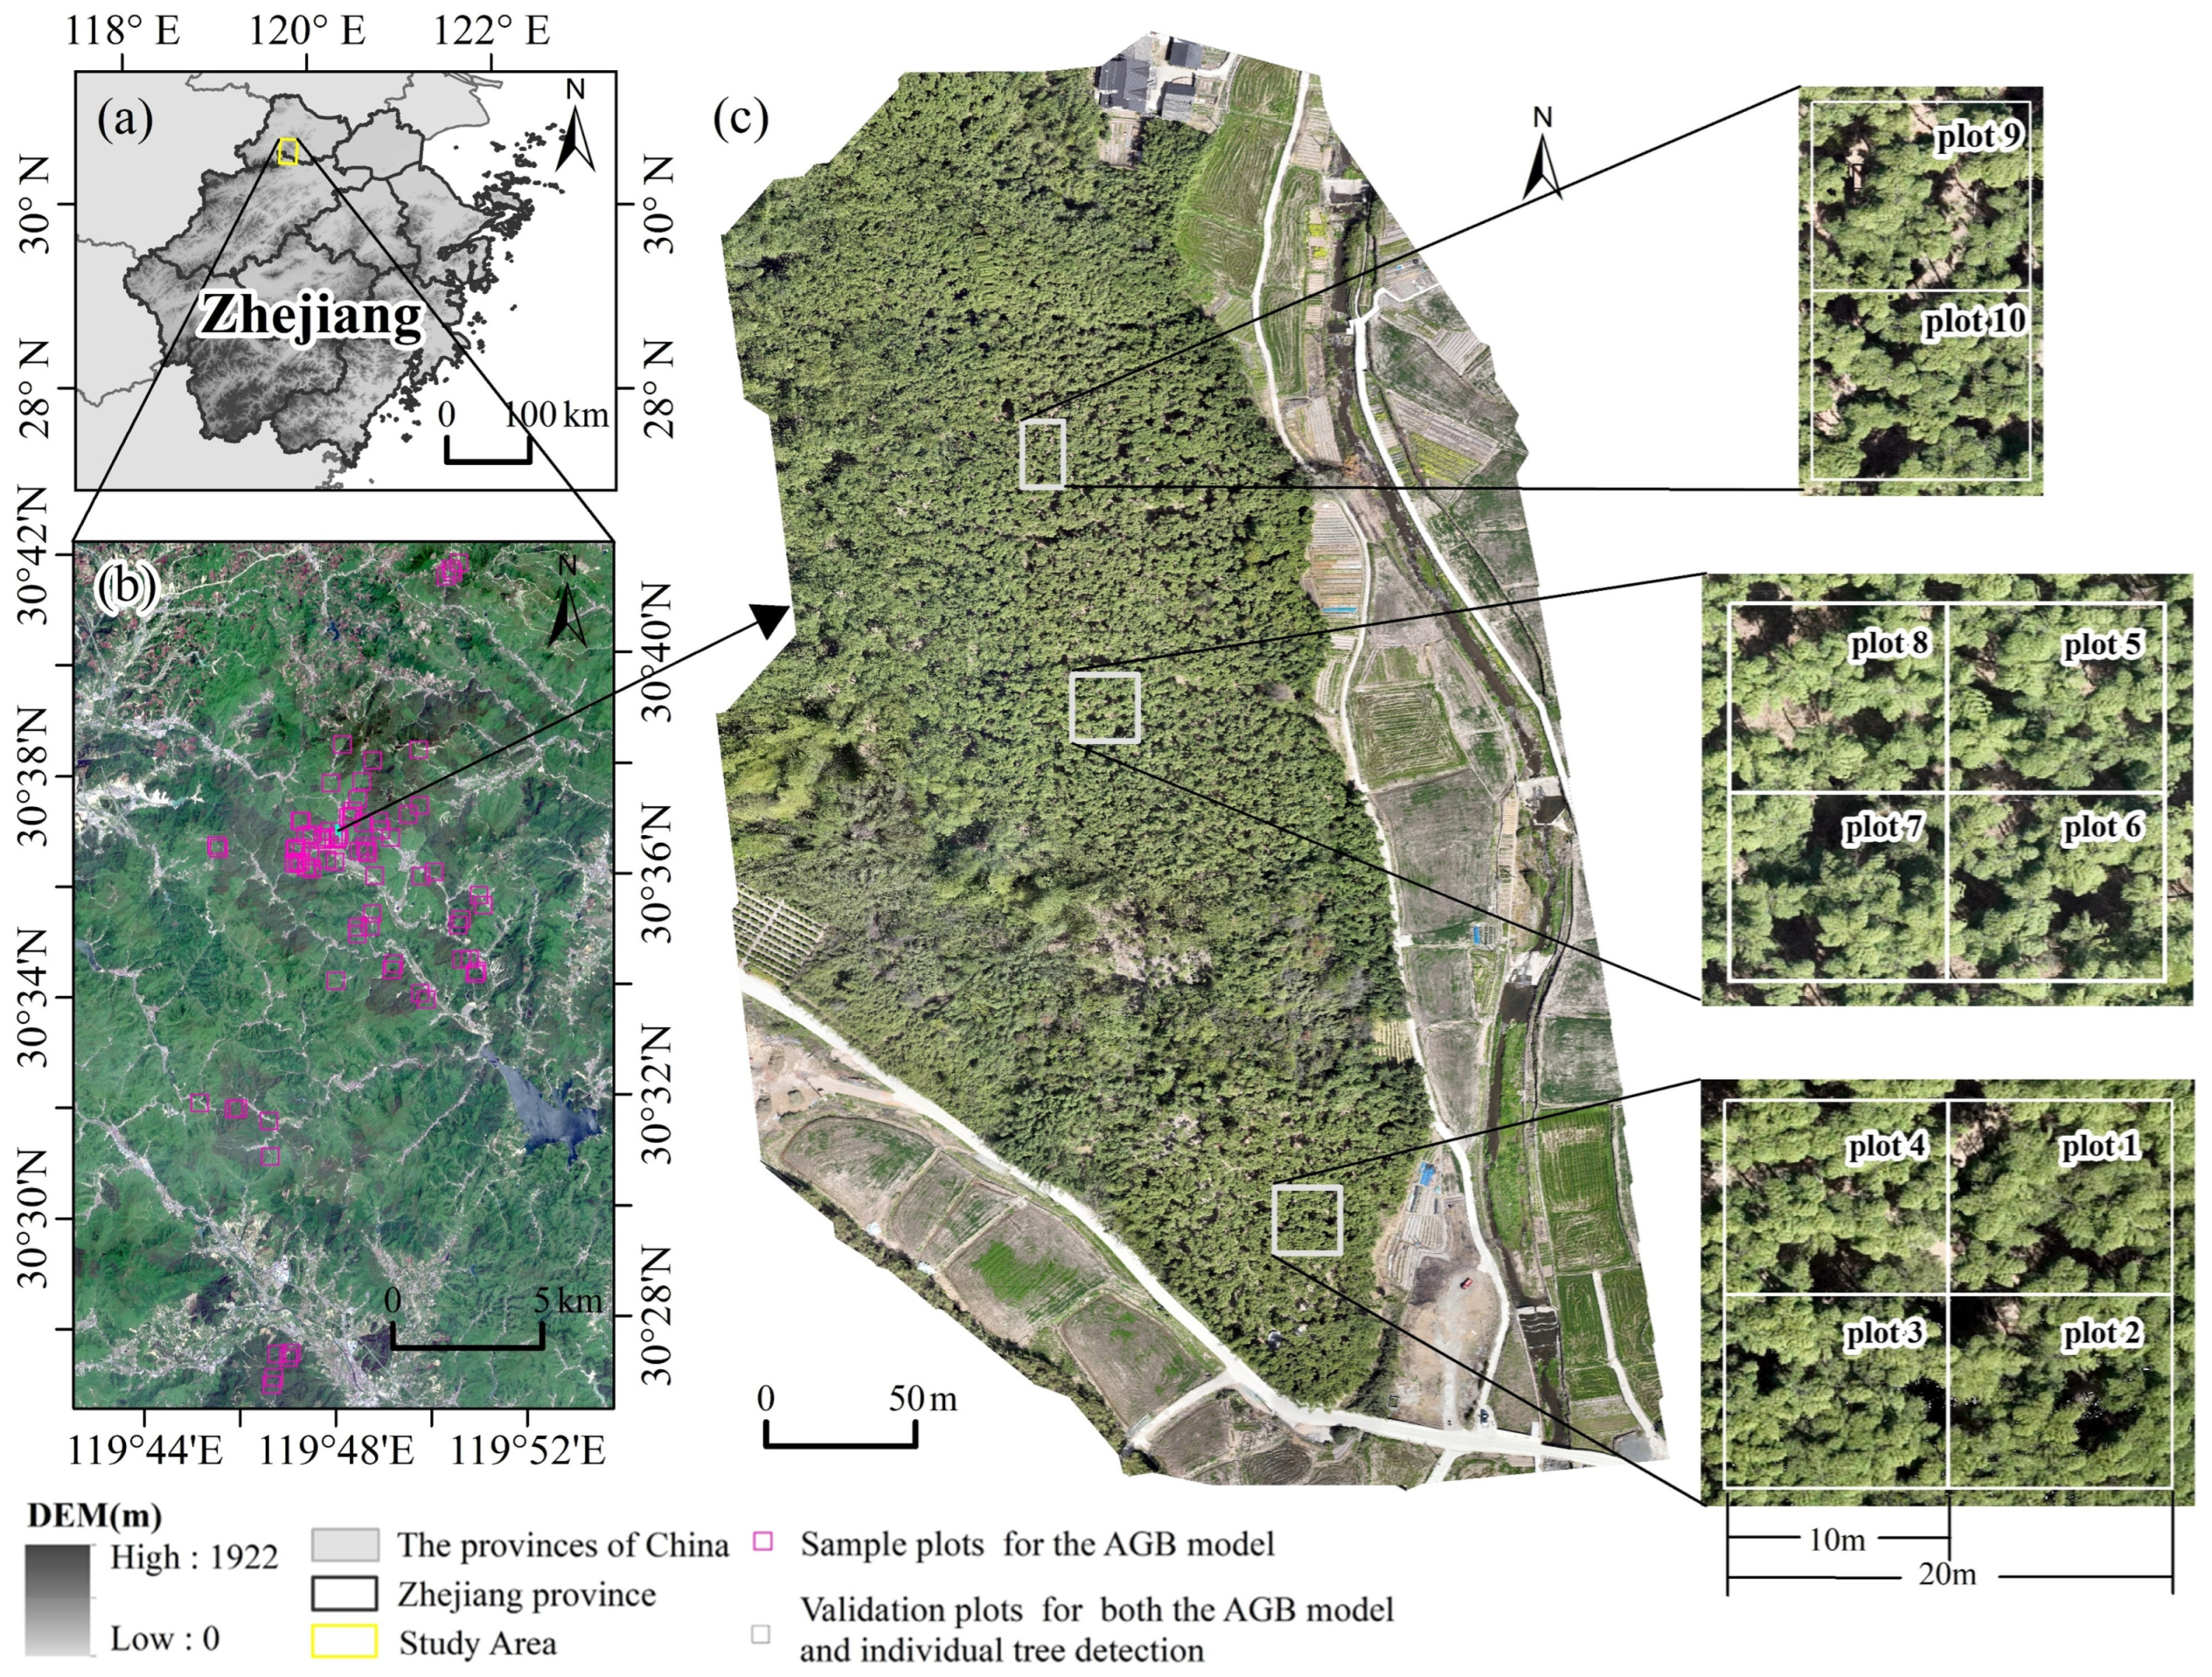
Deqing County, Zhejiang Province (30°35′–30°38′N, 119°47′–119°49′E), was chosen as the study area, as one of the important Moso bamboo production areas in China (Figure 2). This region has a north subtropical monsoon climate, characterized by four distinct seasons, abundant sunshine, plentiful rainfall, and a humid climate. The forest resources are mainly evergreen broad-leaved forests, including Moso bamboo forests, evergreen forests, and evergreen broad-leaved forests. Meanwhile, planted forests such as pine and fir are also distributed. Among them, Moso bamboo forests are the main type of bamboo forests in this area, accounting for 86% of the total bamboo forest area. This is the largest Moso bamboo trading and distribution center in China, and the bamboo industry has become one of the most characteristic and advantageous industries in the local area.
Figure 2.
Study area. (a) Study area location. (b) Sentinel-2 image. (c) UAV RGB image.
2.2. Datasets
UAV aerial photography data and measured plot data were acquired in Deqing County, Zhejiang Province, from 1 April to 2 April 2025. Before collecting UAV data, a red flag marker was placed at each of the four corners of the plot, and a Polar Mini Mobile Real-Time Kinematic (RTK) (Guangzhou South Surveying and Mapping Technology Co., Ltd., Guangzhou, China) was used to collect the plot locations to ensure that the plot positions could be clearly identified in the image data. High-resolution remote sensing data were acquired using a DJI Mavic 3E UAV (Shenzhen DJI Technology Co., Ltd., Shenzhen, China). This platform is equipped with a surveying-grade wide-angle camera featuring a 4/3-inch CMOS sensor with 20 megapixels. The camera is equipped with a mechanical shutter to eliminate motion distortion (the “rolling shutter” effect) during high-speed flight, which is critical for high-precision photogrammetry. The sensor has a large pixel size of 3.3 μm, enhancing its performance in low-light conditions. The lens has a fixed focal length of 24 mm (in 35 mm equivalent format), providing a field of view (FOV) of 84°. It captures imagery in the standard visible spectrum (red, green, and blue bands). The data were collected on a clear and windless day, with shooting conducted from 09:40 to 11:20 a.m. High-precision positioning was achieved using network RTK technology. The aerial photography height was set at 150 m, with a side overlap of 70% and a heading overlap of 80%. This flight configuration resulted in a ground sampling distance (GSD) of approximately 4.03 cm/pixel for the raw imagery. The UAV images were processed for stitching and distortion elimination using DJI Terra software (version 4.4.6, Shenzhen DJI Technology Co., Ltd., Shenzhen, China), generating a digital orthophoto with geographic coordinates. After the UAV data collection was completed, ground surveys were immediately conducted, with a total of 95 sample plots (see details in Table A2). All 95 plots were located within the same study area to ensure consistency in stand conditions and operational feasibility. The 85 plots (20 m × 20 m) used for model calibration were spaced with a minimum distance of 50 m to avoid overlap and ensure spatial independence. The remaining 10 plots (10 m × 10 m) used for UAV validation were adjacent subsets of larger areas due to logistical constraints, serving only as an end-to-end test; the robustness of the density–AGB relationship is primarily supported by the 85 independent plots via 10-fold cross-validation. The DBH of Moso bamboos at 1.3 m was measured using tape. The age of each bamboo plant was identified via the color method [30]. Each bamboo plant was labeled and marked, and information such as the slope and aspect of each plot was documented. The positional information of each individual Moso bamboo within the sample plots was manually collected using a Polar Mini Mobile RTK system.
The auxiliary data include DEM and administrative division vector boundary data. The DEM data were sourced from the ALOS PALSAR High-Resolution Radiometric Terrain-Corrected (RTC) Product, obtained via the NASA Earth data search platform (https://search.earthdata.nasa.gov/), with a spatial resolution of 12.5 m and using the UTM Zone 50 coordinate projection system. The administrative boundary data include vector data of China’s provincial administrative divisions and vector data of the three-level administrative divisions (province, city, and county) of Zhejiang Province.
2.3. Methods
2.3.1. Extraction of Individual Moso Bamboo Position
The RLM algorithm, proposed by Xu et al. [31] and selected for its effectiveness in handling overlapping canopies, was implemented as follows: First, using high-resolution visible light images, bands that can effectively separate the canopy from the background are selected. Gray profile curves along the column direction (X) are extracted at specific sampling intervals (usually set as the minimum crown length, CLmin). After smoothing with Savitzky–Golay filtering, first-order differences are used to detect local maximum points along each column (LMc), ensuring that the distance between adjacent LMcs is greater than CLmin/2. Subsequently, similar processing is performed along the row direction (Y) of each LMc point to extract local maximum points along the row (LMr). The LMr that is closest and does not exceed the maximum crown length (CLmax) is identified as a candidate crown center point. Next, profiles in the horizontal and vertical directions are extracted with the candidate point as the center. Canopy boundaries are dynamically determined by detecting the local minima of DN values in the profiles and an amplitude threshold (0.05 times the amplitude). The variable window size (VWS) is calculated and constrained by the preset CLmin and CLmax. To optimize the crown center positioning, the algorithm collects pixels within the VWS with DN values higher than the 85th percentile to form candidate clusters and calculates their coordinate mean and standard deviation. If the coordinate dispersion within the cluster is lower than the set threshold (SDthr = CLmin/2), it is regarded as a crown center; otherwise, the K-means algorithm is used to segment the cluster, iterating until convergence or the maximum number of iterations is reached, thereby reducing missed detections and false detections of overlapping crowns. Finally, candidate centers with spacing less than VWS/2 are merged, and their coordinate mean is taken as the final crown center position. The size of the moving window is crucial and needs to be set according to the actual crown size, directly affecting detection accuracy and computational efficiency.
Key parameters of the RLM algorithm were optimized based on field measurements. The minimum and maximum crown length (CLmin, CLmax) were determined according to the observed crown size distribution in the study area. The sampling interval was systematically tested to identify the optimal value.
2.3.2. Estimation of AGB Model Based on Stand Density
A total of 95 sample plots were utilized in this study, with 85 plots allocated for the SD-AGB model construction and the remaining 10 plots reserved for validation. The plot-level aboveground biomass (AGBplots), serving as the ground truth for modeling, was derived from non-destructive field measurements and an established species-specific allometric equation. Specifically, within each plot, the DBH and age of each individual Moso bamboo were recorded. The AGB of the individual Moso bamboo (AGBplant, kg) was then calculated using the widely recognized allometric model from Formula (1) [9]. The total AGB of each plot was obtained by summing the biomass of all Moso bamboos within the plot (Formula (2)), and finally converted to plot-level aboveground biomass (AGBplots, Mg/ha) by dividing by the plot area to serve as the dependent variable. The stand density (SD, plants/ha) was derived using Formula (3).
where AGBplant represents the AGB of individual Moso bamboo (kg), D is the DBH (cm), A is the bamboo age (degree), AGBplots is the total AGB of Moso bamboos in the plot (kg), SD is the stand density (plants/ha), n is the number of Moso bamboos in the plot, and S is the plot area (ha).
Using SD as the independent variable and AGBplots as the dependent variable, the SD-AGB estimation models were constructed based on linear, power function, and logarithmic models (see Formulas (4)–(6)), as well as RF, SVM, and ANN models. The linear model was employed as a baseline reference to examine whether a simple proportional relationship existed between the variables. The power function model effectively captured the decay process of the biomass accumulation rate that resulted from intensified inter-individual competition as the density increased. Finally, the logarithmic model offered an alternative classical mathematical formulation for describing the density saturation effect. The machine learning models (RF, SVM, ANN) were implemented using the scikit-learn library (version 1.4.2) in Python (version 3.11.12), with parameters optimized through a grid search to minimize prediction error while maintaining generalization capability.
The parameters a and b in the model are constant values determined through the fitting process.
Based on the high-resolution image data collected using the UAV, the RLM algorithm was employed to accurately estimate the positions of individual Moso bamboo. A regular 10 × 10 m grid was overlaid on the images, and the number of Moso bamboos within each grid cell was counted to calculate the stand density. Using the established SD-AGB regression model, the AGB in each grid cell was estimated.
2.3.3. Assessment of Accuracy
The accuracy of the individual tree extraction was evaluated using the commission error (CE), omission error (OE), and overall accuracy (OA). Specifically, the CE reflects over-detection cases, the OE characterizes the level of under-detection, and OA measures the overall recognition capability [32]. A detected bamboo plant was considered correctly extracted (i.e., counted as Nt) if the distance between its detected crown center and any field-measured bamboo position was less than half of the average crown diameter (approximately 1.5 m based on field observations).
The accuracy of the SD-AGB models was comprehensively evaluated using multiple metrics on the training set and test set, including the R2, RMSE, and mean absolute error (MAE). Among these metrics, those from the training set reflect the model’s fitting degree to known data, while those from the test set are used to assess the model’s generalization ability on unknown data. A higher R2 indicates a stronger ability of the model to explain variability; lower RMSE and MAE values indicate smaller deviations between the model’s predicted values and actual values. Specifically, the RMSE is more sensitive to outliers, while the MAE can reflect the level of the average absolute error. In summary, an excellent model should exhibit a high R2 and a low RMSE and MAE on both the training set and test set so as to achieve a balance between fitting goodness and generalization performance [33,34]. Validation samples were input into the model, and the predicted values were compared with ground-measured true values to calculate the above-mentioned metrics. The calculation methods are shown in Formulas (7)–(12).
To rigorously evaluate the generalization capability of the models and address the limitations of a single validation set, we employed 10-fold cross-validation using the 85 samples designated for model construction. Specifically, the 85 samples were randomly partitioned into ten subsets of approximately equal size (eight samples per subset). In each iteration, nine subsets (77 samples) were used for training and the remaining one subset (8 samples) for validation. This process was repeated ten times, with each subset serving as the validation set once. Model performance was reported as the mean ± standard deviation of R2, RMSE, and MAE across the ten folds, providing a comprehensive assessment of both accuracy and stability. Additionally, an independent validation was performed using the remaining 10 samples that were not involved in the 10-fold cross-validation process, further evaluating the models’ generalization ability on unseen data.
where Ne is the number of monitored plants extracted via the RLM algorithm, Nt is the number of correctly extracted plants determined through spatial matching, Nr is the number of Moso bamboo plants measured in the field, yi is the observed AGB value, is the predicted AGB, and n is the number of samples.
3. Results
3.1. Individual Moso Bamboo Position Extraction
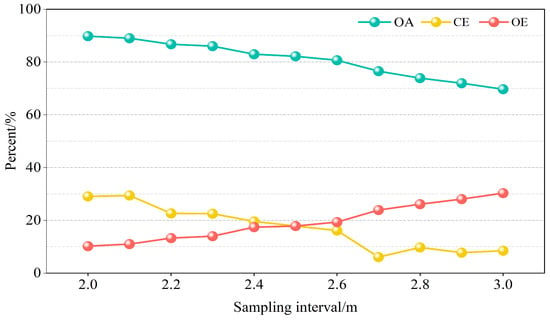
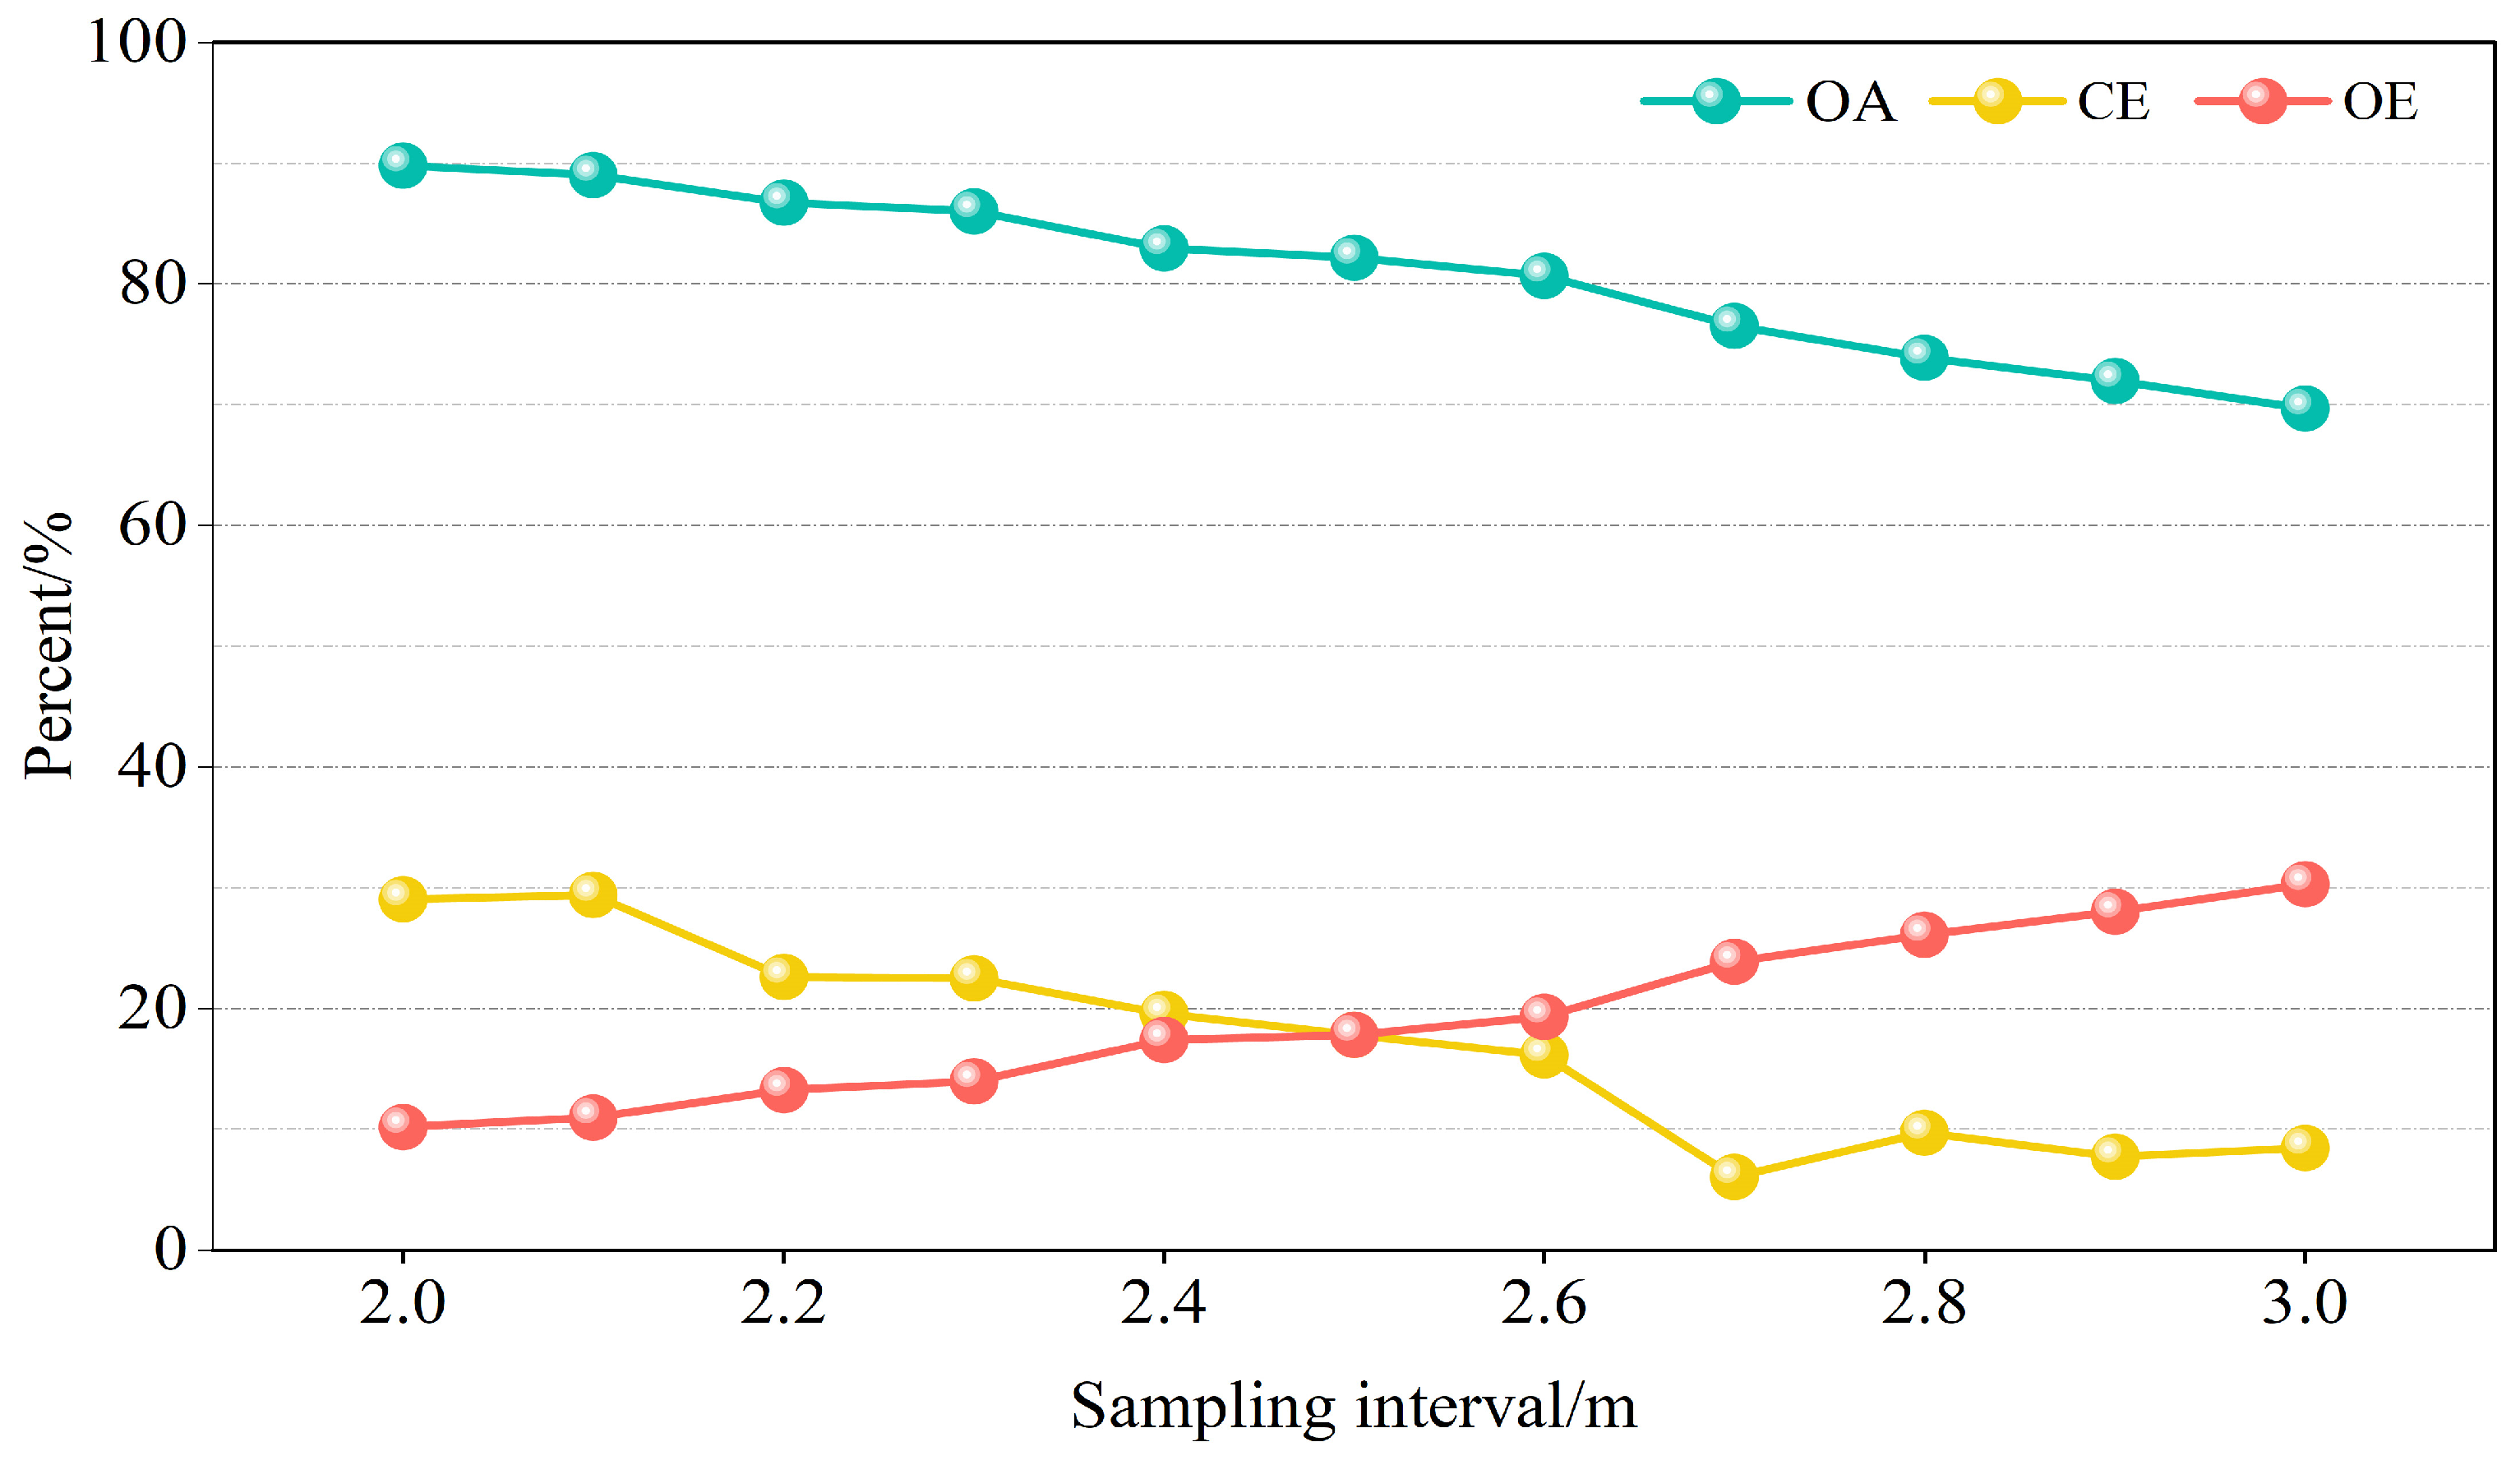
The variation in the OA, CE, and OE under different sampling intervals is shown in Figure 3. The OA has a relatively high overall value and shows a decreasing trend with the increase in the sampling interval. The value of the CE fluctuates significantly and shows an overall downward trend. The value of the OE is relatively low but shows an upward trend with the increase in the sampling interval. When the sampling interval is 2.5 m, the OA is higher than 80%, and both the CE and OE are below 20%, representing the optimal accuracy. A variety of sampling intervals ranging from 2 m to 3 m with a step size of 0.1 m were systematically tested, and the model performance was evaluated accordingly. Finally, the optimal sampling interval was determined to be 2.5 m.
Figure 3.
Accuracy of individual tree positions varied with sampling intervals. The accuracy was evaluated based on overall accuracy (OA), commission error (CE), and omission error (OE). OA measures overall recognition capability, CE indicates over-detection, and OE reflects under-detection.
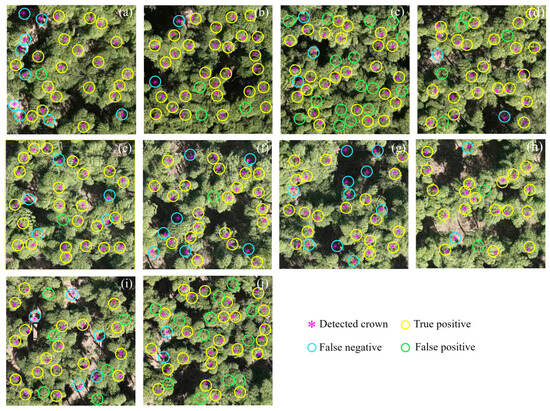
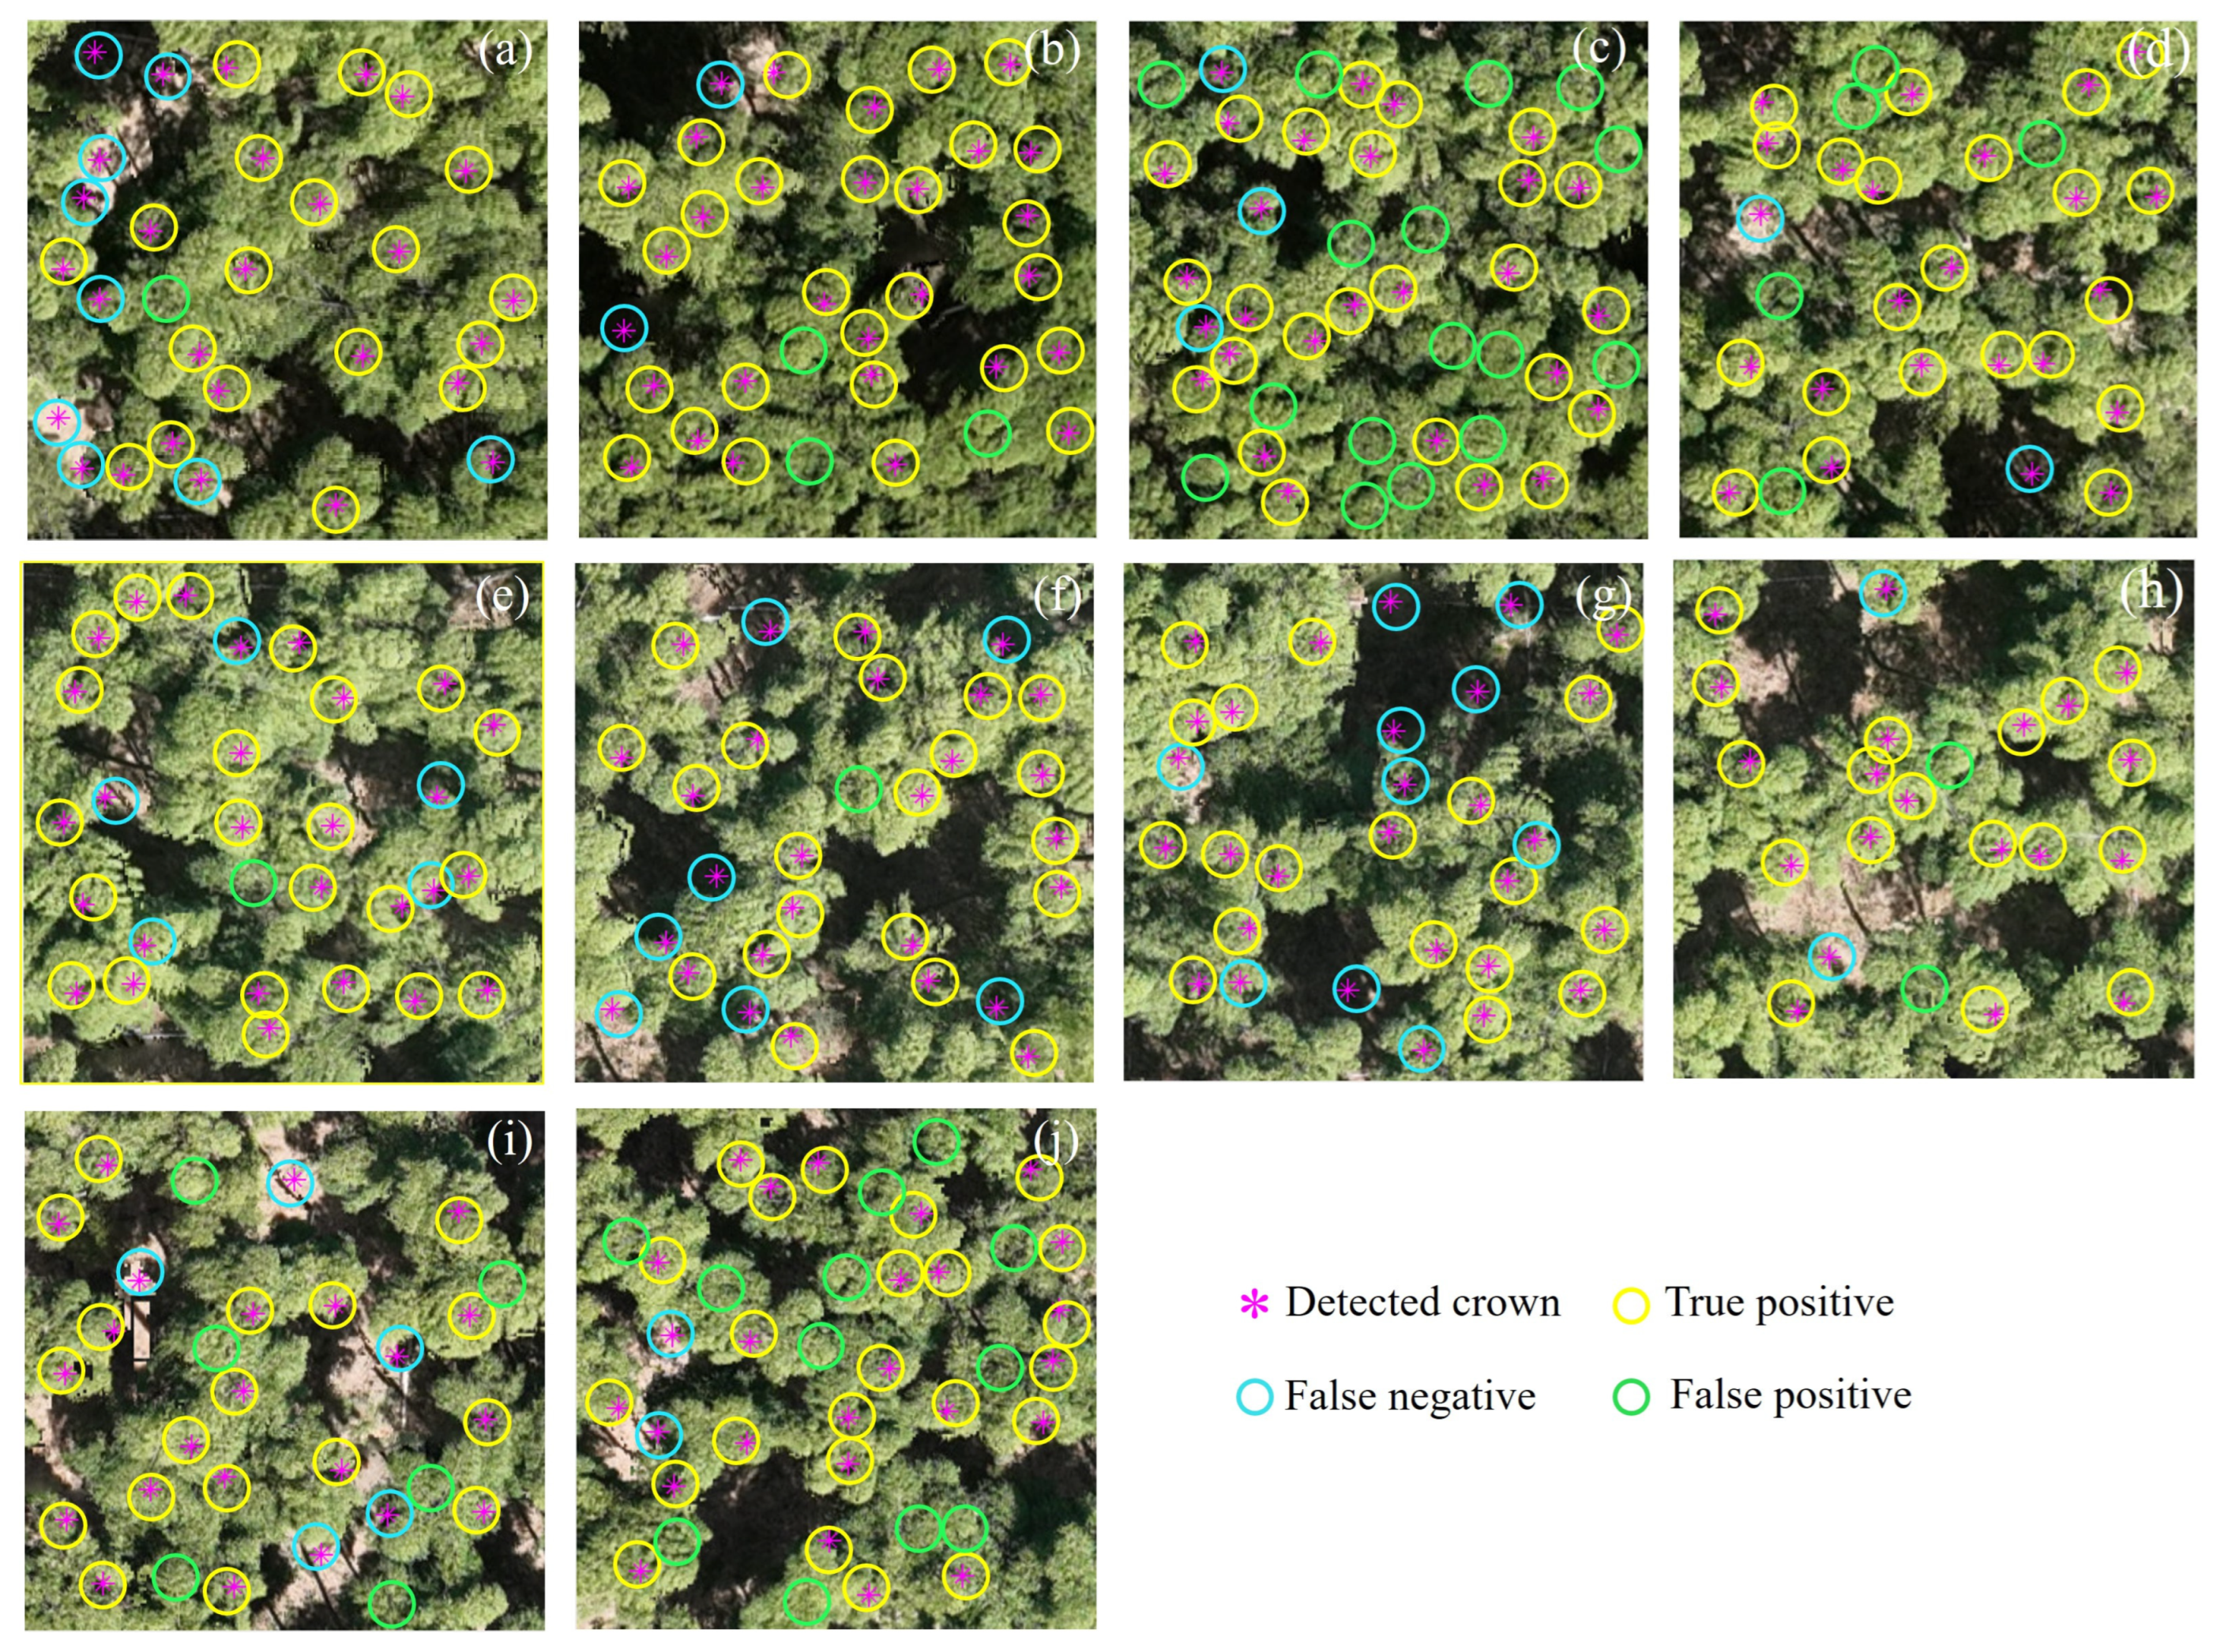
The green light band of the UAV images was taken as the characteristic value, the sampling interval was set to 2.5 m, and the RLM algorithm was adopted to extract the individual Moso bamboo positions. The monitoring results are shown in Figure 4. The individual Moso bamboo positions can be monitored relatively accurately using the proposed method, but issues of misclassification and omission exist. In plots with sparser Moso bamboo distributions and less canopy overlap, the correct recognition rate was higher, but there was greater misclassification, such as in Plot 7 (Figure 4g). In plots with dense Moso bamboo distributions and severe canopy overlap, the correct recognition rate was lower, and there was greater undercounting of individual plants, such as in Plot 3 and Plot 10 (Figure 4c,j).
Figure 4.
Individual Moso bamboo position in 10 sample plots: (a–j) represent plots 1 to 10, respectively. Detected crowns are classified as true positives (correct detection), false positives (commission error), or false negatives (omission error) based on spatial matching with field survey data.
The individual Moso bamboo position results in the sample plots were statistically analyzed and are presented in Table 1. The overall OA, CE, and OE for the individual Moso bamboo position extraction in the sample plots were 82.20%, 17.80%, and 17.80%, respectively. The OA varied significantly among plots, ranging from 60.98% to 100%. Plot 7 achieved the optimal accuracy, with an OA of 100% and an OE of 0%. In contrast, Plots 3 and 10, which had the highest number of Moso bamboos, demonstrated relatively poor performances. Specifically, Plot 3 had an OA of only 60.98% and a high OE of 39.02%, while Plot 10 exhibited an OA of 66.67% and an OE of 33.33%.
Table 1.
Accuracy of individual tree crown position extraction.
3.2. Comparative Analysis of Six SD-AGB Models
The fitted linear, power, and logarithmic models are presented in Formulas (13)–(15). The six SD-AGB models were systematically evaluated using three metrics—modeling fit, 10-fold cross-validation, and independent UAV validation—with results summarized in Table 2. During the training stage, machine learning models outperformed traditional approaches. Random Forest (SD-AGBRF) and Artificial Neural Network (SD-AGBANN) achieved the highest R2 values (0.96 and 0.94, respectively) and the lowest errors. However, the validation error of RF (RMSE = 6.50 Mg/ha) indicated overfitting. Traditional models showed comparable but lower performance (R2 = 0.79–0.81), while Support Vector Machine (SD-AGBSVM) exhibited moderate accuracy (validation R2 = 0.80), comparable to traditional models.
Table 2.
Comparative analysis of six SD-AGB models.
In 10-fold cross-validation, ANN maintained the best accuracy (R2 = 0.84 ± 0.06) and the lowest errors (RMSE = 5.24 ± 0.67 Mg/ha), demonstrating robust cross-validation stability, followed closely by RF (R2 = 0.83 ± 0.06). Among traditional models, the power function and linear models showed comparable performance (R2 = 0.81), slightly outperforming the logarithmic model (R2 = 0.80 ± 0.07).
On the independent UAV validation set, ANN achieved the highest R2 (0.87) and the lowest errors (RMSE = 4.56 Mg/ha; MAE = 3.78 Mg/ha). Although RF attained the same R2 (0.87), its substantially higher errors (RMSE = 6.50 Mg/ha) further confirmed the superior generalization capability of ANN. The power function emerged as the best-performing traditional model (R2 = 0.86, RMSE = 4.62 Mg/ha), while the logarithmic model exhibited the poorest performance (R2 = 0.69).
Overall, ANN was identified as the optimal model, achieving a favorable balance between modeling fit (R2 = 0.94), cross-validation robustness (R2 = 0.84 ± 0.06), and independent validation accuracy (R2 = 0.87). The power function served as a strong interpretable alternative, particularly suitable for applications prioritizing model transparency over marginal gains in predictive accuracy.
3.3. SD and AGB Spatial Distribution of Moso Bamboo Forests
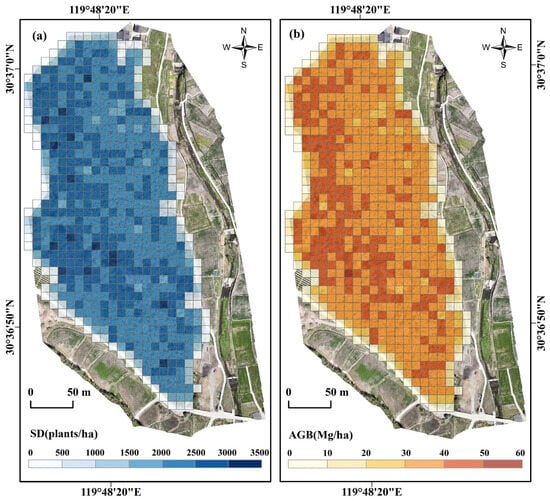
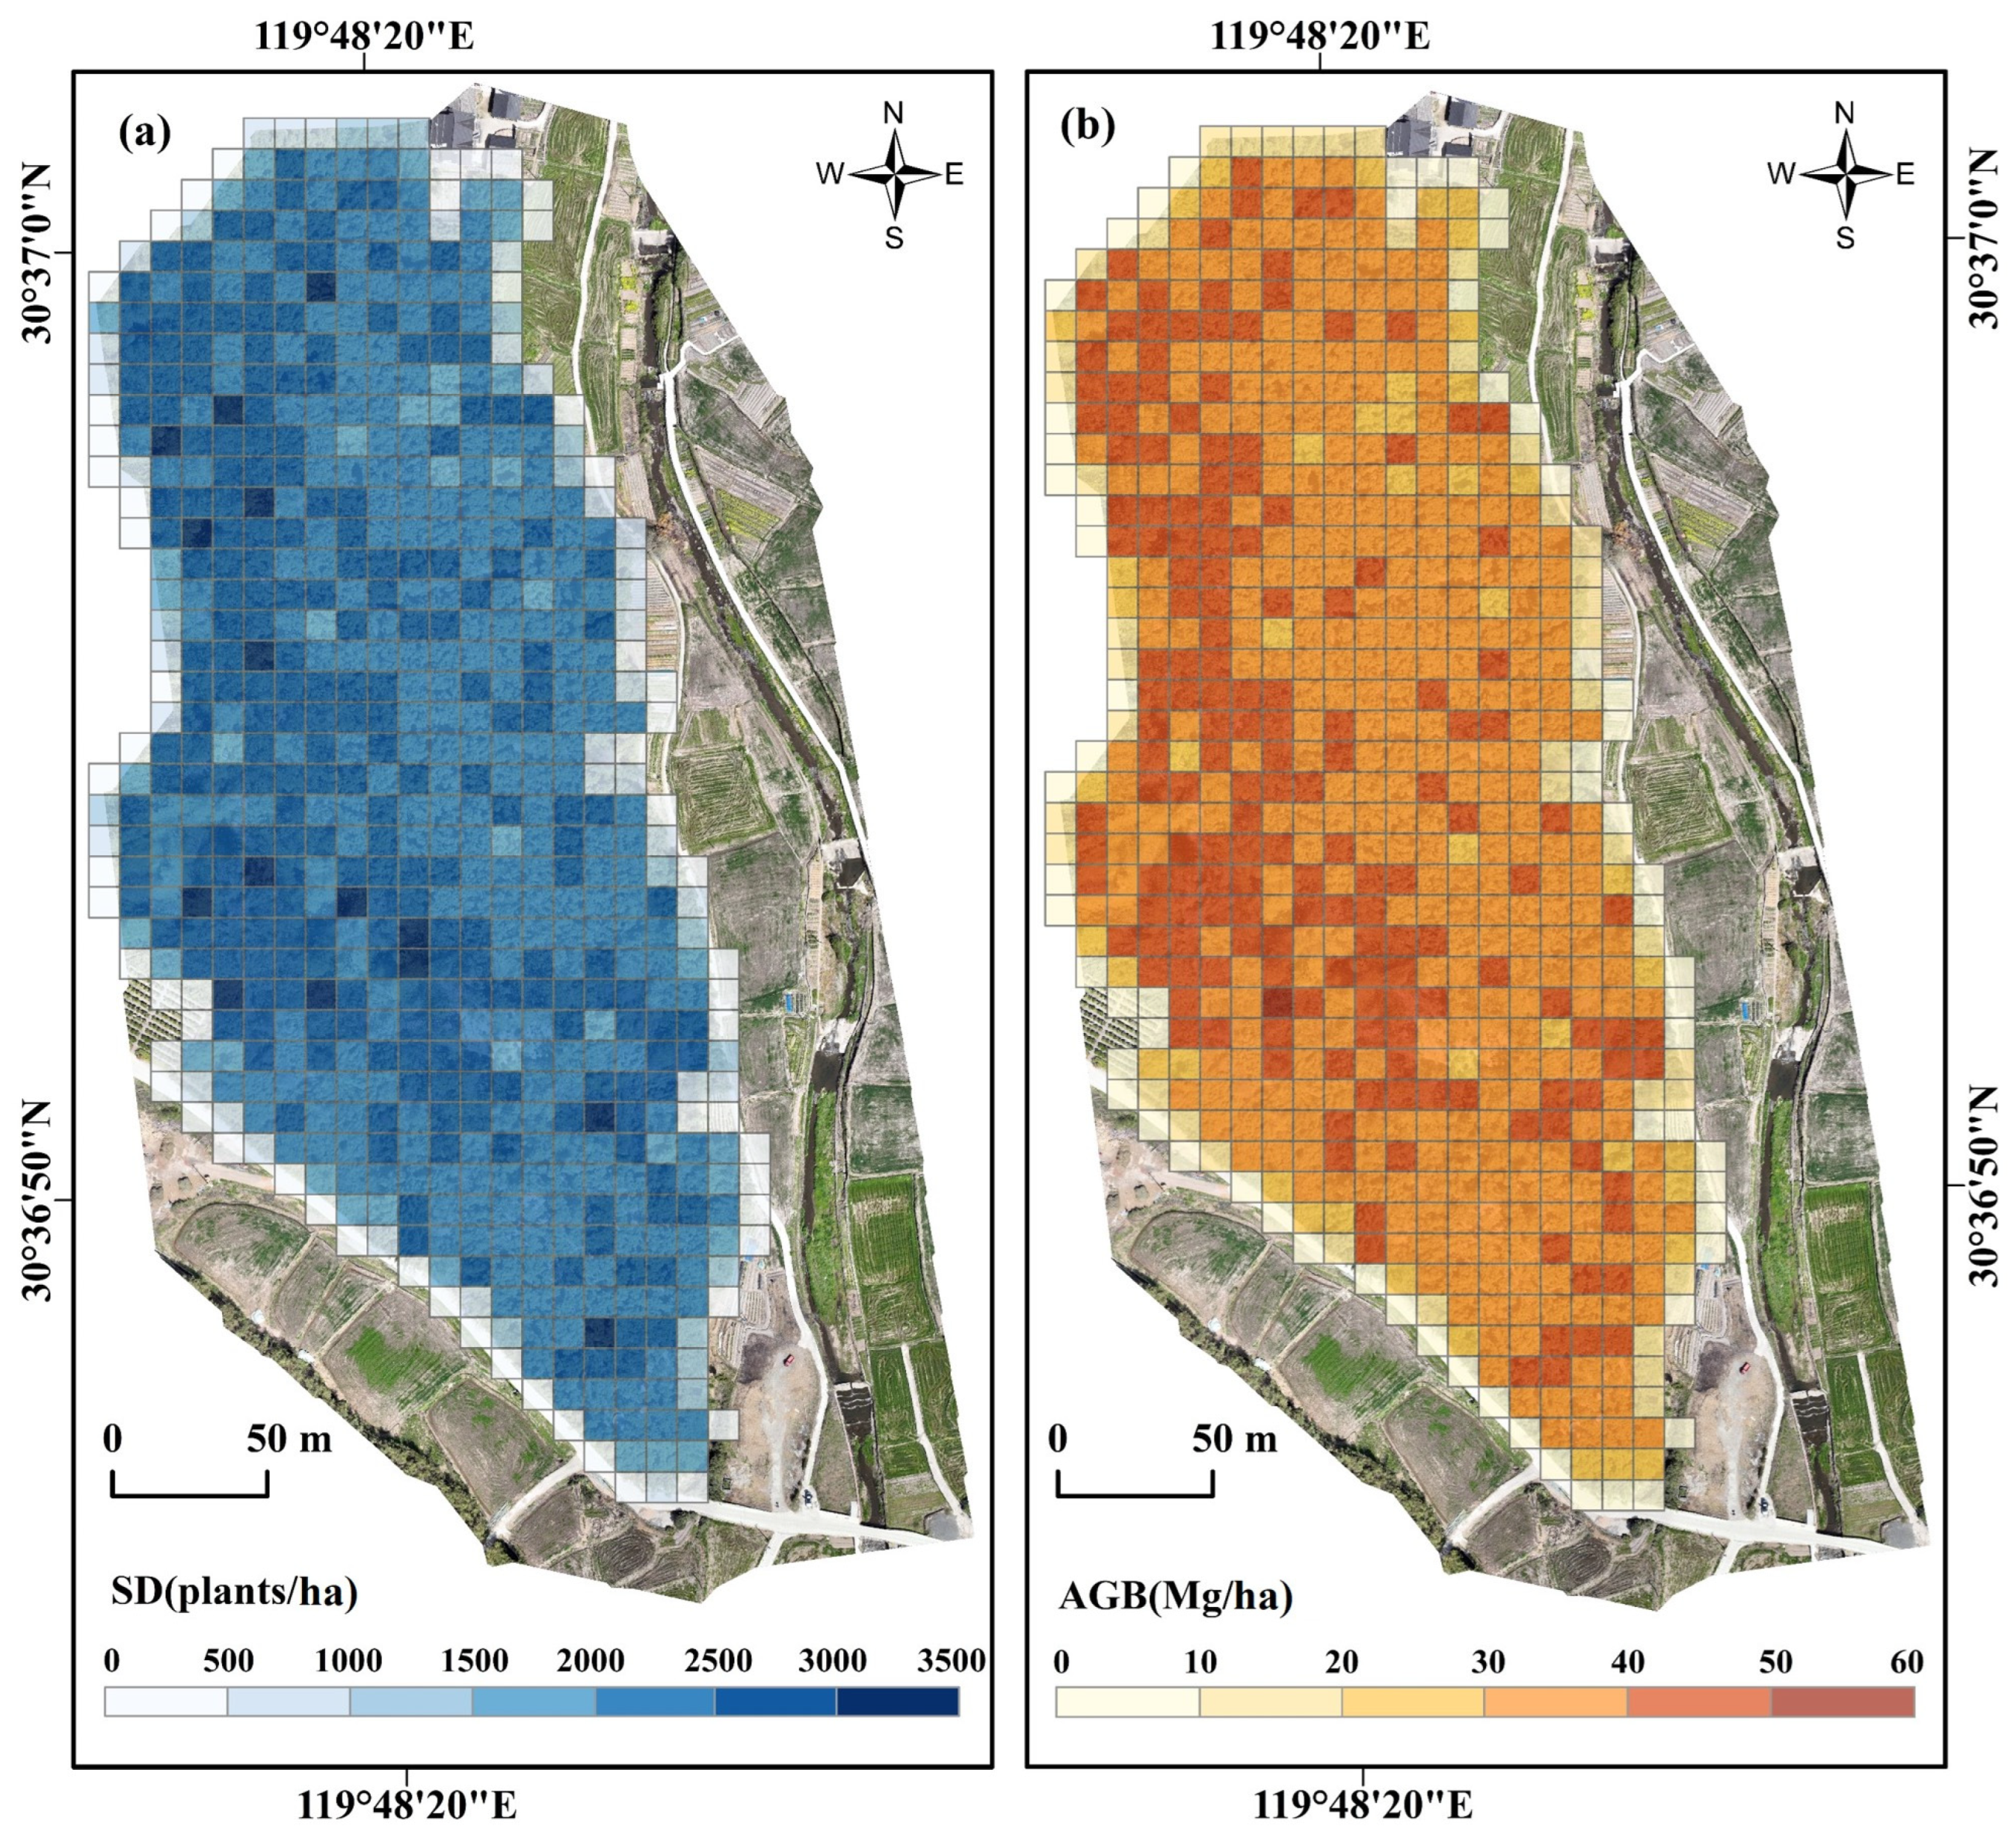
The study area was divided into 654 square grids of 10 × 10 m as basic analysis units. The selection of this grid scale aligns with the dimensions used for field survey plots and individual bamboo validation, ensuring consistency and comparability across data sources. Moreover, the 10 × 10 m grid effectively corresponds to the relatively homogeneous spatial distribution of Moso bamboo forests, enabling the aggregation of high-resolution individual tree detection outcomes. This approach facilitates a more stable and efficient representation of the spatial patterns in the SD and AGB. Individual Moso bamboo plants were localized from UAV imagery data using the RLM algorithm, and the number of plants in each grid cell is shown in Figure 5a. The spatial distribution of the Moso bamboo plant density exhibited heterogeneity, with high-density areas primarily concentrated in the northwestern part of the study area. The stand density of this region ranges from 2500 to 3000 plants per hectare, whereas the density in the eastern region is relatively lower, varying from 2000 to 2500 plants per hectare. As shown in Figure 5b, the biomass estimated by using the SD-AGBANN model indicates that the spatial distribution of the AGB is highly consistent with the stand density, exhibiting a similar gradient-changing pattern. The regions with high biomass coincide with the high-density northwest area, while the regions with low biomass are mainly situated in the eastern area.
Figure 5.
Spatial distribution of stand density and aboveground biomass in Moso bamboo forests: (a) stand density (plants/ha) and (b) aboveground biomass (Mg/ha).
4. Discussion
4.1. Factors Influencing Individual Moso Bamboo Tree Identification
Our results demonstrate that the RLM algorithm can be effectively applied to Moso bamboo forests with a satisfactory overall accuracy (OA = 82.20%). While the accuracy does not exceed that of state-of-the-art deep learning models (e.g., Multi-band YOLOv7 with AP@0.50: 89.15%) [34,35], which require extensive datasets and computationally intensive training, our method offers superior computational efficiency and practical deployability.
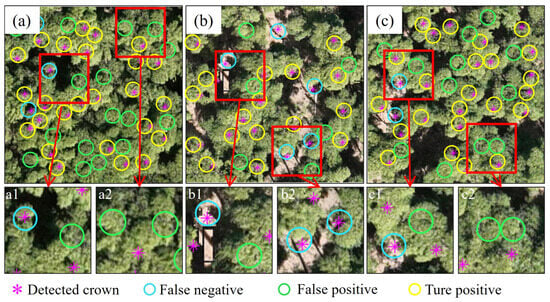
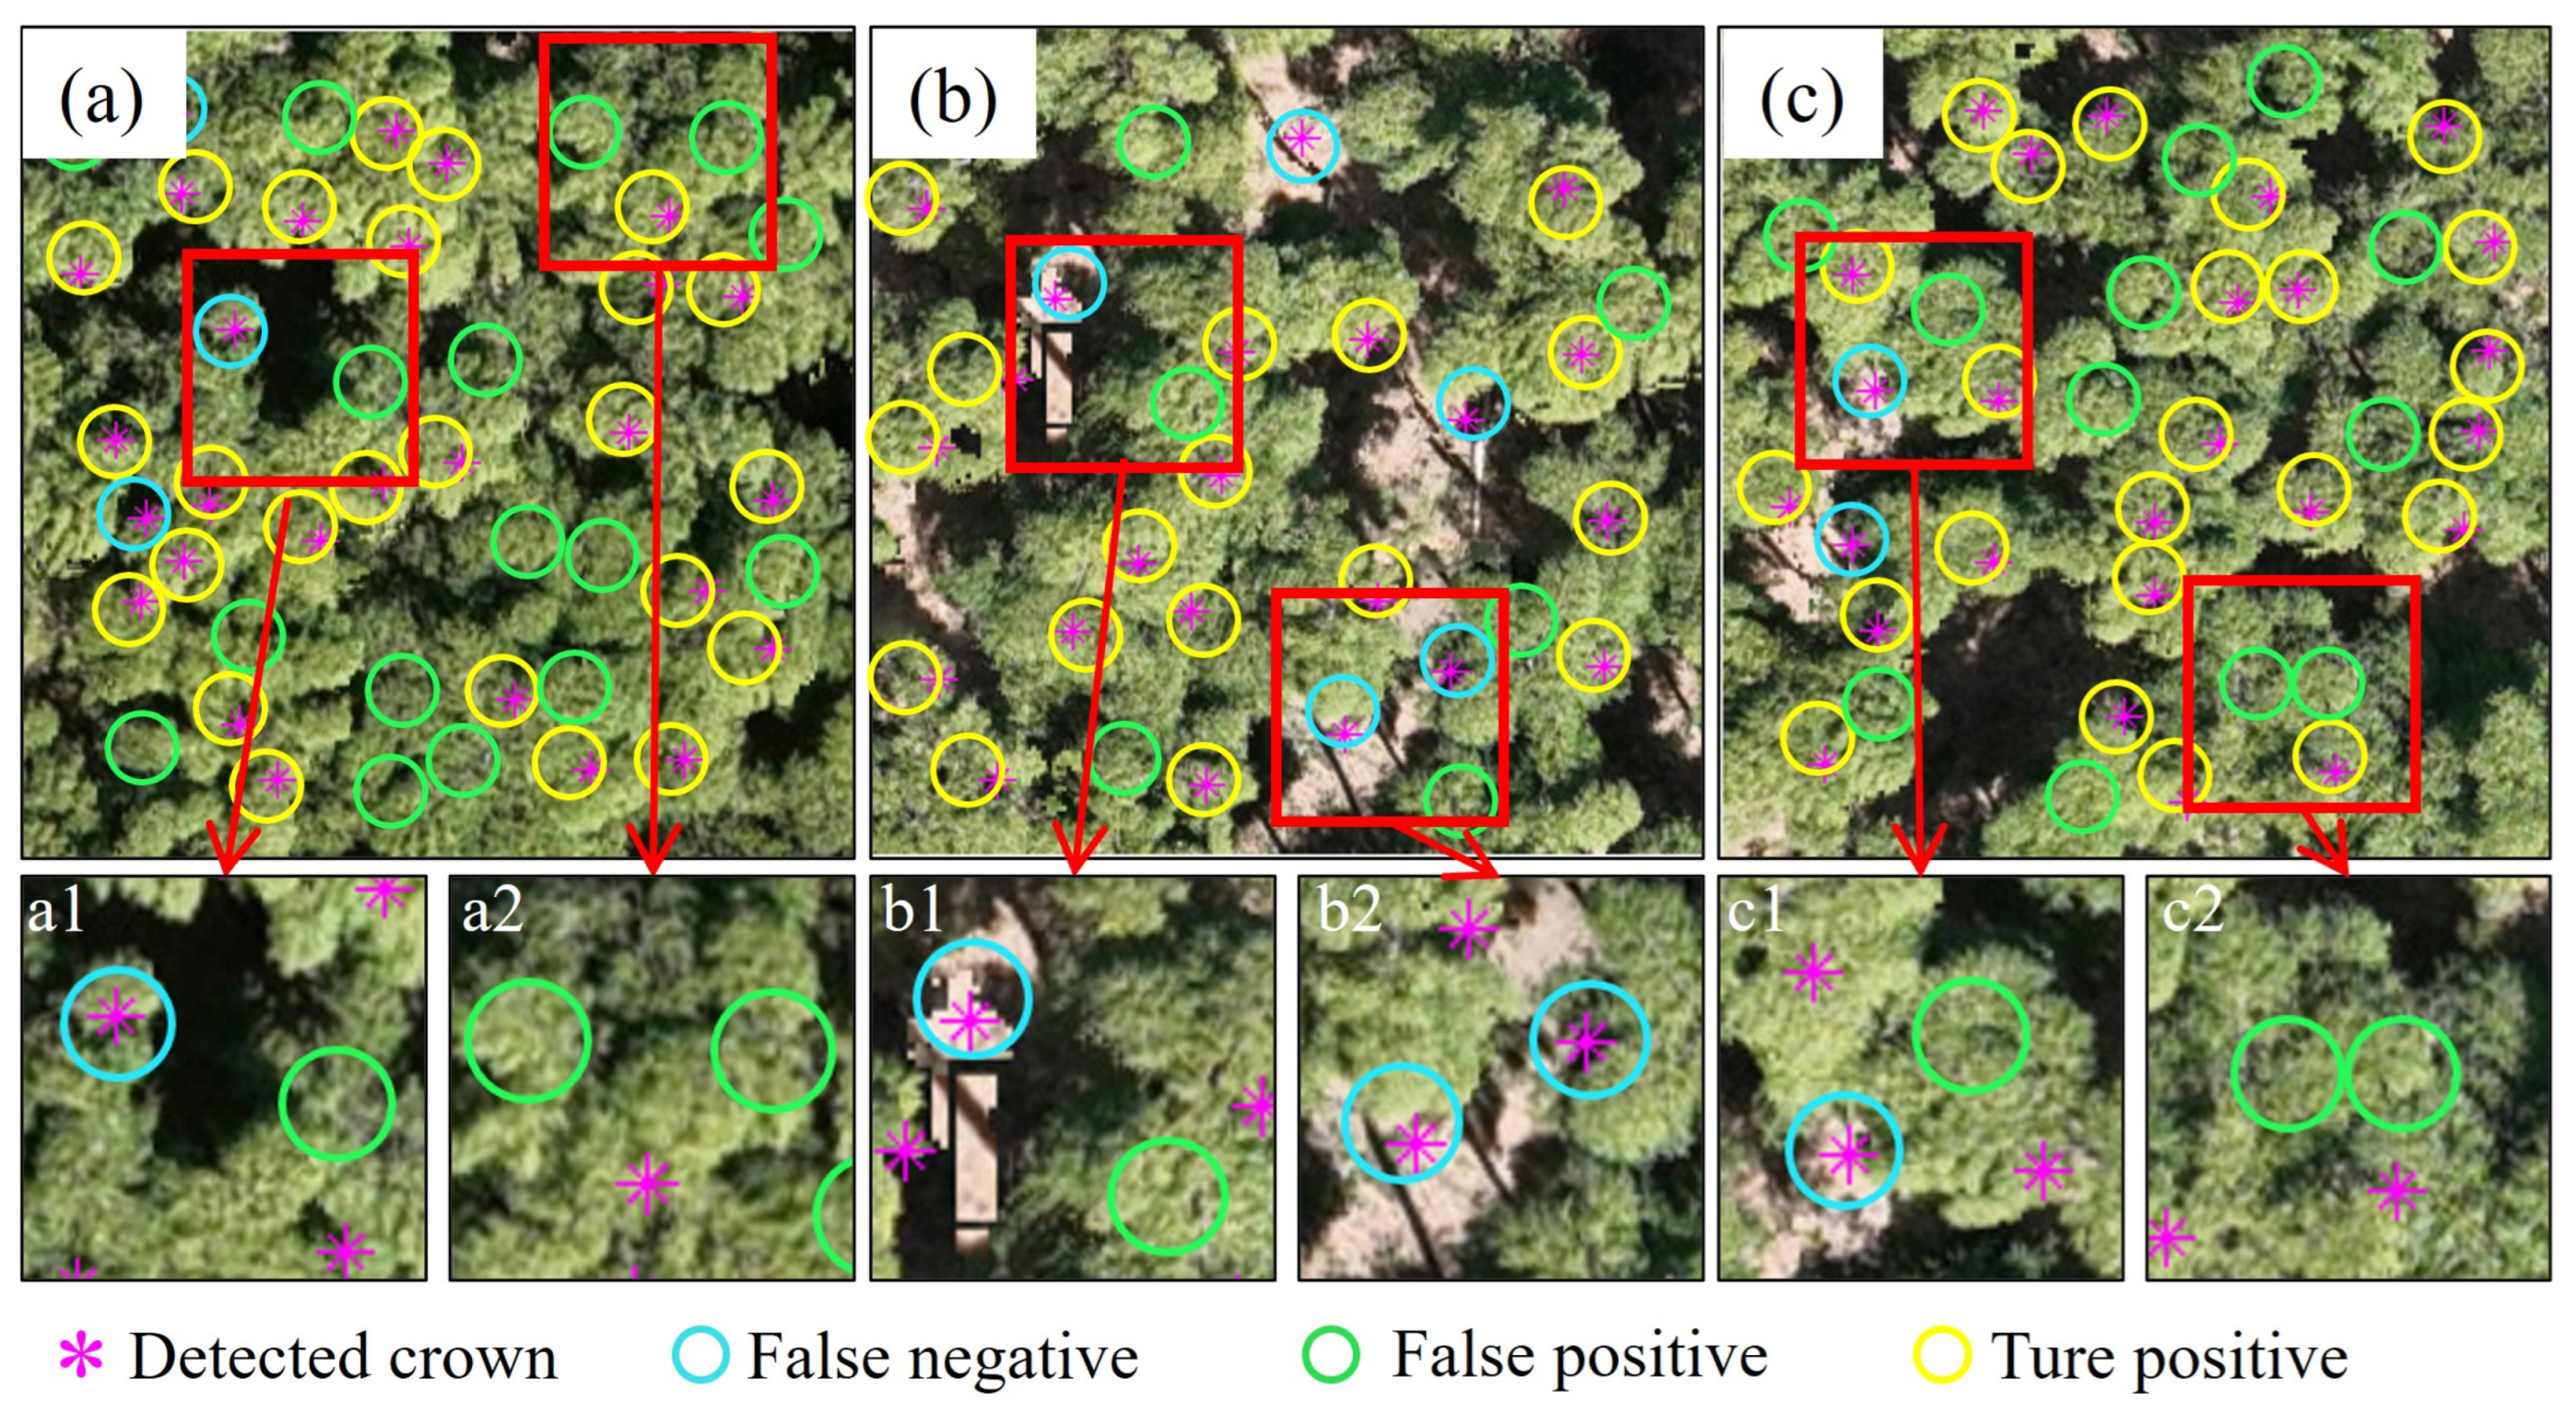
The Moso bamboo identification performance is influenced by a confluence of factors related to the canopy structure, terrain, and phenology. First, management practices significantly alter the canopy morphology. The common practice of hooking bamboo tops in autumn/winter creates asymmetric crowns, directly challenging the core assumption of the RLM algorithm—that the spectral maximum coincides with the geometric center of a symmetrical crown. This introduces a systematic bias in the crown center detection. Second, complex canopy structures and high stand density represent primary challenges. In high-density plots (e.g., Figure 6a,c), severe canopy overlap leads to confusion in identifying distinct spectral maxima, resulting in elevated omission errors (OE > 30%). The algorithm’s built-in clustering and splitting strategies mitigate this by merging overly close candidate centers (“one bamboo, multiple centers”) and splitting dispersed clusters (“multiple bamboos, one center”). Nevertheless, as seen in our densest plots, these strategies have limitations, and VWS estimation errors increase with canopy complexity, leading to undercounting. These individual tree detection errors directly propagate to the subsequent biomass estimation: omission errors lead to underestimation of SD and, consequently, a systematic underestimation of AGB, while commission errors produce the opposite effect. Therefore, improving the individual tree detection accuracy, particularly reducing omission errors in high-density stands, is critical for enhancing the reliability of this framework. Third, terrain-induced errors, particularly on slopes >10°, contribute to inaccuracies. Trunk inclination causes projection displacement, which is exacerbated at plot boundaries. This “edge effect”—referring to the positional displacement and identification errors of bamboo plants located near plot boundaries due to terrain-induced canopy projection shifts—can lead to misclassification (including bamboos from outside the plot) or omission (excluding displaced bamboos within the plot), affecting stand density calculations. Finally, phenological timing introduces a systematic underestimation. Our data acquisition in early April preceded the full leaf expansion of new shoots, making them spectrally undetectable to the UAV. This inevitably leads to an undercount of the current year’s growth. Future campaigns should be scheduled for June–July to obtain a more complete inventory.
Figure 6.
Omission and misclassification of individual bamboo tree position. (a,a1,a2) Plot 3. (b,b1,b2) Plot 9. (c,c1,c2) Plot 10.
Additionally, future research could further explore the application potential of off-nadir or multi-angle UAV imaging for aboveground biomass estimation in Moso bamboo forests [36]. Oblique imaging captures spectral features from the side of tree crowns and information on the vertical distribution of foliage, providing richer canopy structural data. This approach offers significant advantages for accurately distinguishing individual bamboo crowns from understory vegetation in forests with severe canopy overlap, thereby improving the individual tree detection accuracy. Integrating multi-angle spectral information with existing individual tree recognition algorithms represents promise for further enhancing the robustness and accuracy of biomass estimation models in high-density bamboo stands.
4.2. Potential of UAVs for Estimating AGB of Moso Bamboo Forests
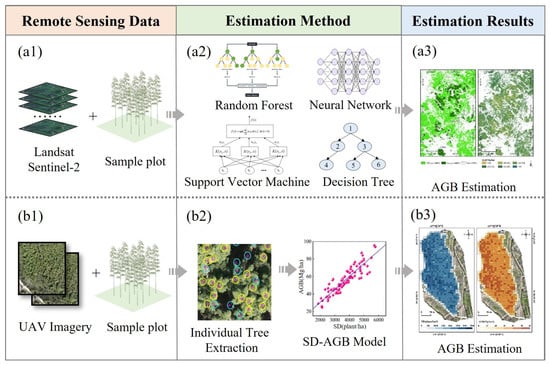
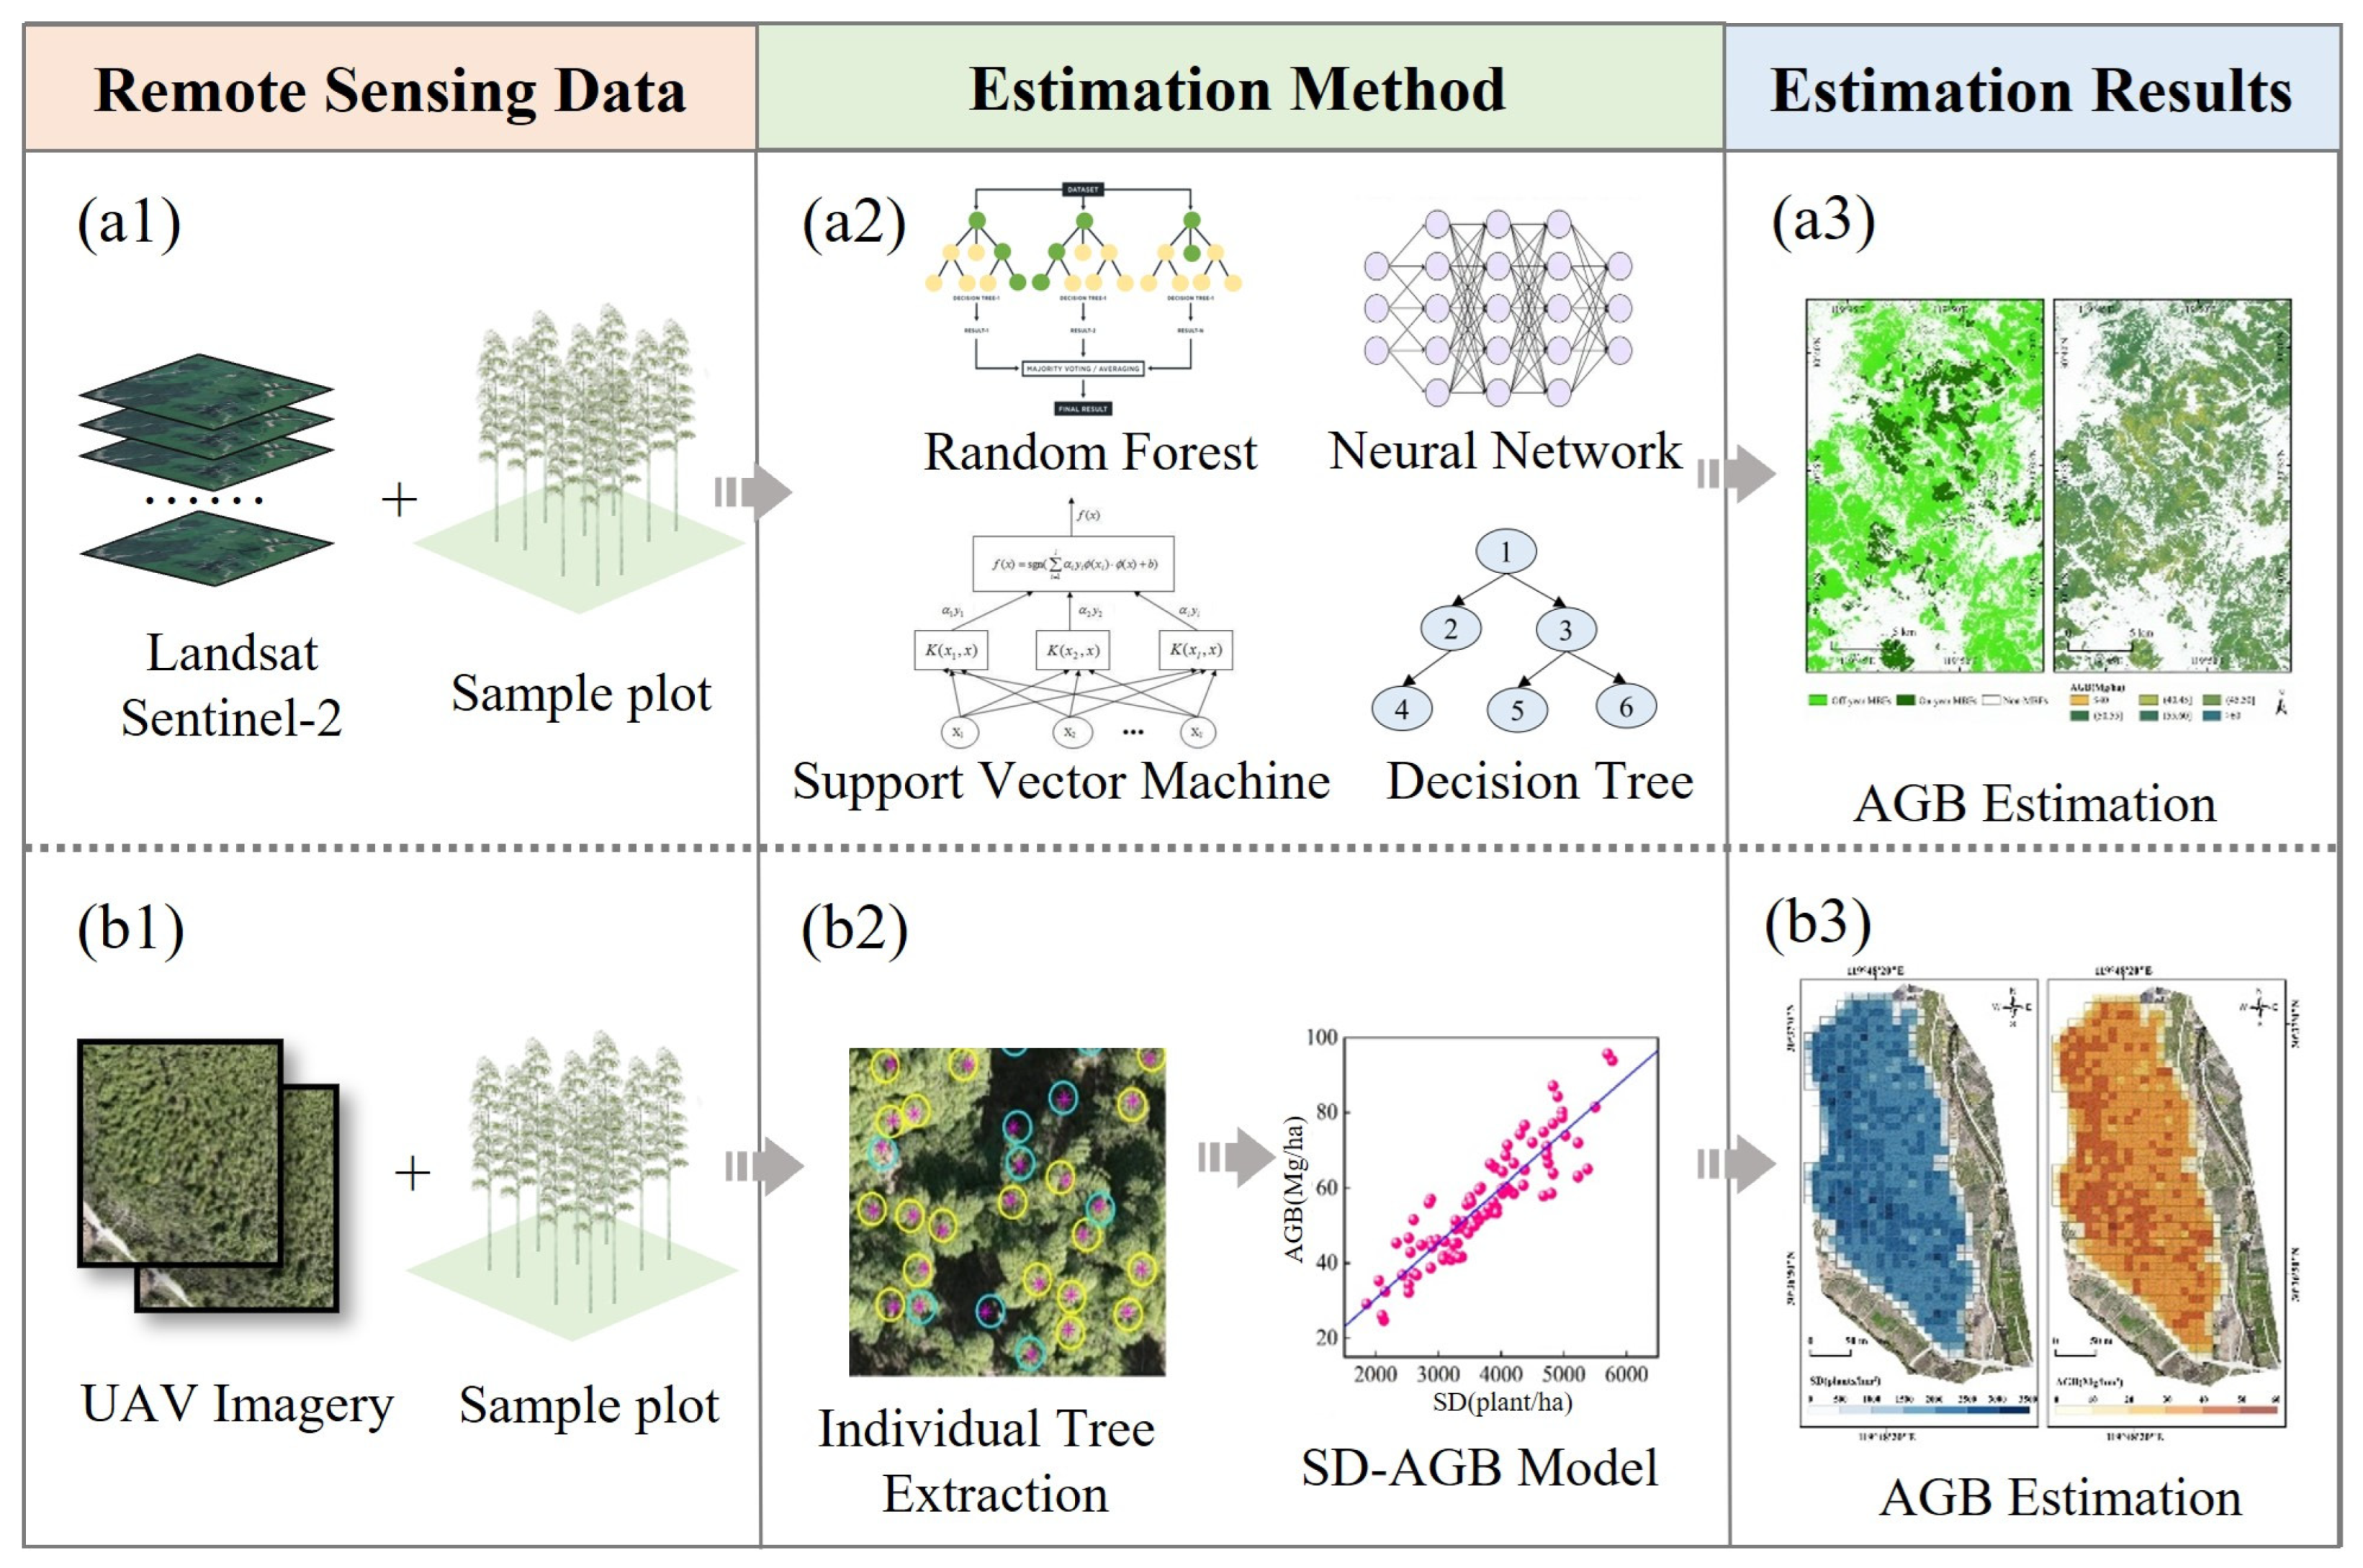
In contrast to the saturation and heterogeneity challenges that constrain satellite-based models (e.g., R2 ranging from 0.11 to 0.86 as noted in the Introduction), our UAV-SD-AGB approach achieved a markedly higher and more consistent accuracy (R2 = 0.87–0.94 on the validation set, Table 2). The optimal ANN model attained a 10-fold cross-validation R2 of 0.84 ± 0.06 (Table 2), with the narrow standard deviation confirming robust generalization capability across different data subsets. Traditional AGB estimation in Moso bamboo forests predominantly relies on satellite remote sensing data (e.g., Landsat and Sentinel series), which typically follow a three-step workflow: (1) establishing empirical relationships between spectral indices and field-measured plots (Figure 7(a1)), (2) developing predictive models via regression (Figure 7(a2)), and (3) generating regional AGB distribution maps (Figure 7(a3)). While these methods achieve a moderate modeling accuracy (see Table A1), their estimation performance is often constrained by inherent limitations, including low spectral saturation thresholds [17], mixed-pixel effects [15], and stand heterogeneity [2]—challenges that remain unresolved at satellite spatial resolutions.
Figure 7.
Comparison of different remote sensing sensors for AGB research. (a1–a3) Series represents AGB estimation based on satellite remote sensing data. (b1–b3) Series represents AGB estimation based on UAV imagery.
In contrast, UAV platforms offer transformative advantages for fine-scale AGB mapping. Their operational flexibility enables centimeter-resolution data acquisition, while integration with LiDAR or hyperspectral sensors facilitates detailed structural parameter extraction [19,37]. However, the effectiveness of LiDAR-derived metrics depends on forest structure characteristics. Liu et al. [29] demonstrated that for Moso bamboo forests, AGB estimation models relying solely on conventional point cloud metrics (e.g., height percentiles) yielded poor accuracy (R2 = 0.08–0.31), as the uniform canopy height of this species limits the utility of height-related variables. Capitalizing on these capabilities, this study developed an SD-AGB model that leverages stand density as a proxy for biomass—a feasible approach given the relatively uniform height and DBH distribution of Moso bamboo. The RLM algorithm successfully delineated individual bamboo locations (Figure 7(b1,b2)), yielding robust model performance (R2 = 0.81–0.86; Figure 7(b2,b3)) while mitigating spectral saturation effects common in satellite-based methods. However, the stand density-driven approach is inherently limited. As a univariate model, it cannot capture within-stand variations in the DBH or tree height, which have been shown to improve estimation the accuracy substantially, for example, Li demonstrated that incorporating these variables could increase accuracy to an R2 = 0.94 [14]. These limitations are partly attributable to the data source itself. In contrast, direct use of Light Detection and Ranging (LiDAR) can more effectively capture the three-dimensional forest structure, and integrating multi-source remote sensing data has emerged as a key strategy for enhancing both estimation accuracy and mechanistic transparency. The literature consistently highlights that fusing LiDAR with other data sources—such as multispectral, hyperspectral, or ground-based observations—enables more robust and physiologically transparent estimation frameworks. For instance, integrating UAV-LiDAR with Sentinel-2 imagery [37] or combining multi-platform LiDAR point clouds [38] has yielded high predictive accuracy (R2 = 0.89) in bamboo and spruce forests, underscoring the value of multi-scale structural information, particularly in complex terrain. Furthermore, synergistic “ground-UAV-spaceborne” frameworks, such as those incorporating GEDI spaceborne LiDAR [39], validate the role of such integration in sample expansion and structural characterization at regional scales. Critically, these integrated approaches allow the introduction of species-specific traits [40] or the fusion of ground validation data [41], leading to models with clearer biophysical mechanisms and improved goodness-of-fit. Even when combined with deep learning techniques [42], allometric models based on LiDAR-derived structural parameters (e.g., height and crown diameter) demonstrate reliable performance. Collectively, these studies indicate that moving beyond single-data-source models toward multidimensional data fusion—encompassing structural, spectral, taxonomic, and ground-based information—is essential to overcome the limitations of stand-level approaches and advance toward more accurate, mechanistic biomass estimation. It should be noted that canopy height models (CHM) derived from UAV imagery were not utilized in this study. This is because Moso bamboo exhibits remarkably uniform height distribution (coefficient of variation of only 16%) and a negligible correlation with AGB (R2 = 0.01) as demonstrated in a previous study [14], rendering CHM-derived metrics less informative for biomass estimation.
The UAV-RGB imagery used in this study, while cost-effective and adequate for stand density mapping, is restricted to broad visible bands. This prevents the detailed biochemical discrimination enabled by hyperspectral sensors, and it cannot directly capture the three-dimensional canopy architecture obtained via LiDAR. Future work to advance individual tree identification and mechanistic biomass estimation should therefore prioritize the integration of these advanced sensors. Specifically, hyperspectral data could refine species separation and vitality assessment, while LiDAR-derived metrics (e.g., canopy height, volume) would allow for direct estimation of structural parameters like DBH. On a practical level, we will address current gaps by: (1) deriving canopy texture metrics from high-resolution imagery to quantify stand heterogeneity, (2) integrating UAV-LiDAR point clouds for vertical parameter extraction, and (3) integrating UAV-borne hyperspectral data to extract biochemical parameters closely linked to biomass, such as chlorophyll and nitrogen content, thereby improving the physiological interpretability of the model. Additionally, to overcome UAVs’ limited operational coverage (10–50 km2/day), synergistic use of spaceborne LiDAR and hyperspectral data will be explored for large-area AGB mapping.
5. Conclusions
This study presents the first stand density-dependent AGB model for Moso bamboo forests using UAV-RGB imagery, establishing stand density as a pivotal factor in aboveground biomass estimation. The RLM algorithm effectively identified individual bamboo stems, achieving an 82% overall accuracy at an optimal 2.5 m sampling interval. The comparative analysis of six models confirmed the superiority of the ANN, with a robust performance in both calibration (R2 = 0.94, RMSE = 3.78 Mg/ha), 10-fold cross-validation (R2 = 0.84 ± 0.06, RMSE = 5.24 ± 0.67 Mg/ha), and independent validation (R2 = 0.87, RMSE = 4.56 Mg/ha). The spatial analysis of 14,190 mapped Moso bamboos revealed an average AGB of 32.80 Mg/ha. By integrating UAV-derived stand density metrics, this work advances a parsimonious yet scalable framework for high-resolution AGB mapping in complex bamboo ecosystems. This methodology not only addresses saturation limitations of satellite-based approaches but also supports carbon stock quantification and sustainable forest management practices.
Author Contributions
Conceptualization, M.H. and N.L.; methodology, L.L. and M.H.; software, X.X.; validation, M.H., N.L., and D.Z.; formal analysis, M.H. and T.W.; investigation, T.W. and C.Y.; resources, J.M., T.W., and Y.Z.; data curation, D.Z. and S.Z.; writing—original draft preparation, M.H.; writing—review and editing, N.L. and L.L.; visualization, Y.L. and W.Z.; supervision, L.L.; project administration, N.L.; funding acquisition, N.L. All authors have read and agreed to the published version of the manuscript.
Funding
This research was funded by the National Natural Science Foundation of China (grant no. 42101387), the Anhui Province Universities Outstanding Talented Person Support Project (grant no. YQZD2024045, YQZD2025086), Anhui Provincial Natural Science Foundation (grant no. 2508085QD134), the Natural Science Research Project for Anhui Universities (grant no. 2023AH030094, 2023AH010071), and Science and Technology Plan Project of Chuzhou (2025ZD002).
Data Availability Statement
The data presented in this study are available on request from the corresponding author.
Acknowledgments
We appreciate support we received from Linjia Wei, Yuhao Li, and Zhicheng Wu during the field data collection.
Conflicts of Interest
The authors declare no conflicts of interest.
Abbreviations
The following abbreviations are used in this manuscript:
| AGB | Aboveground Biomass |
| SD | Stand Density |
| DBH | Diameter at Breast Height |
| UAV | Unmanned Aerial Vehicle |
| VWS | Variable Window Size |
| RLM | Revised Local Maximum |
| ANN | Artificial Neural Network |
| RF | Random Forest |
| SVM | Support Vector Machine |
Appendix A
Table A1.
Estimation accuracy for AGB of Moso bamboo forests using satellite remote sensing data.
Table A2.
Sample plots used in this study.
References
- Feng, P.; Li, Y. China’s Bamboo Resources in 2021. World Bamboo Ratt. 2023, 23, 100–103. [Google Scholar]
- Li, L.; Li, N.; Lu, D.; Chen, Y. Mapping Moso bamboo forest and its on-year and off-year distribution in a subtropical region using time-series sentinel-2 and Landsat 8 data. Remote Sens. Environ. 2019, 231, 111265. [Google Scholar] [CrossRef] [Scilit]
- Li, L.; Li, N.; Zang, Z.; Lu, D.; Wang, G.; Wang, N. Examining phenological variation of on-year and off-year bamboo forests based on the vegetation and environment monitoring on a New Micro-Satellite (VENµS) time-series data. Int. J. Remote Sens. 2021, 42, 2203–2219. [Google Scholar] [CrossRef] [Scilit]
- Li, N.; Hu, M.; Xie, J.; Wei, L.; Wu, T.; Zhang, W.; Gu, S.; Li, L. Enhancing aboveground biomass estimation in Moso bamboo forests: The role of on-year and off-year phenomena in remote sensing. Front. For. Glob. Change 2025, 8, 1515767. [Google Scholar] [CrossRef] [Scilit]
- Zhou, G.; Xu, X.; Du, H.; Ge, H.; Shi, Y.; Zhou, Y. Estimating aboveground carbon of Moso bamboo forests using the k nearest neighbors technique and satellite imagery. Photogramm. Eng. Remote Sens. 2011, 77, 1123–1131. [Google Scholar] [CrossRef] [Scilit]
- Xu, X.; Du, H.; Zhou, G.; Ge, H.; Shi, Y.; Zhou, Y.; Fan, W.; Fan, W. Estimation of aboveground carbon stock of Moso bamboo (Phyllostachys heterocycla var. pubescens) forest with a Landsat Thematic Mapper image. Int. J. Remote Sens. 2011, 32, 1431–1448. [Google Scholar] [CrossRef] [Scilit]
- Du, H.; Sun, X.; Han, N.; Mao, F. RS estimation of inventory parameters and carbon storage of Moso bamboo forest based on synergistic use of object-based image analysis and decision tree. J. Appl. Ecol. 2017, 28, 3163–3173. [Google Scholar]
- Gao, Y.; Lu, D.; Li, G.; Wang, G.; Chen, Q.; Liu, L.; Li, D. Comparative analysis of modeling algorithms for forest aboveground biomass estimation in a subtropical region. Remote Sens. 2018, 10, 627. [Google Scholar] [CrossRef] [Scilit]
- Zhou, G. Carbon Storage, Fixation and Distribution in Mao Bamboo (Phyllostachys pubescens) Stands Ecosystem. Ph.D. Thesis, Zhejiang University, Hangzhou, China, 2006. [Google Scholar]
- Du, H.; Cui, R.; Zhou, G.; Shi, Y.; Xu, X.; Fan, W.; Lü, Y. The responses of Moso bamboo (Phyllostachys heterocycla var. pubescens) forest aboveground biomass to Landsat TM spectral reflectance and NDVI. Acta Ecol. Sin. 2010, 30, 257–263. [Google Scholar] [CrossRef] [Scilit]
- Du, H.; Zhou, G.; Ge, H.; Fan, W.; Xu, X.; Fan, W.; Shi, Y. Satellite-based carbon stock estimation for bamboo forest with a non-linear partial least square regression technique. Int. J. Remote Sens. 2012, 33, 1917–1933. [Google Scholar] [CrossRef] [Scilit]
- Du, H.; Mao, F.; Li, X.; Zhou, G.; Xu, X.; Han, N.; Sun, S.; Gao, G.; Cui, L.; Li, Y.; et al. Mapping global bamboo forest distribution using multisource remote sensing data. IEEE J. Sel. Top. Appl. Earth Obs. Remote Sens. 2018, 11, 1458–1471. [Google Scholar] [CrossRef] [Scilit]
- Chen, Y.; Li, L.; Lu, D.; Li, D. Exploring bamboo forest aboveground biomass estimation using Sentinel-2 data. Remote Sens. 2019, 11, 7. [Google Scholar] [CrossRef] [Scilit]
- Li, L.; Xie, J.; Wei, L.; Hu, M.; Ma, J.; Zhang, S.; Li, N. From the individual scale to the plot scale: A better understanding of the ecological parameters of Moso bamboo forests. Ind. Crops Prod. 2025, 232, 121262. [Google Scholar] [CrossRef] [Scilit]
- Lu, D.; Chen, Q.; Wang, G.; Liu, L.; Li, G.; Moran, E. A survey of remote sensing-based aboveground biomass estimation methods in forest ecosystems. Int. J. Digit. Earth 2014, 9, 63–105. [Google Scholar] [CrossRef] [Scilit]
- Li, X.; Du, H.; Mao, F.; Zhou, G.; Chen, L.; Xing, L.; Fan, W.; Xu, X.; Liu, Y.; Cui, L.; et al. Estimating bamboo forest aboveground biomass using EnKF-assimilated MODIS LAI spatiotemporal data and machine learning algorithms. Agric. For. Meteorol. 2018, 256–257, 445–457. [Google Scholar] [CrossRef] [Scilit]
- Zhao, P.; Lu, D.; Wang, G.; Liu, L.; Li, D.; Zhu, J.; Yu, S. Forest aboveground biomass estimation in Zhejiang Province using the integration of Landsat TM and ALOS PALSAR data. Int. J. Appl. Earth Observ. Geoinf. 2016, 53, 1–15. [Google Scholar] [CrossRef] [Scilit]
- Li, Y.; Han, N.; Li, X.; Du, H.; Mao, F.; Cui, L.; Liu, T.; Xing, L. Spatiotemporal estimation of bamboo forest aboveground carbon storage based on Landsat data in Zhejiang, China. Remote Sens. 2018, 10, 898. [Google Scholar] [CrossRef] [Scilit]
- Cao, L.; Coops, N.C.; Sun, Y.; Ruan, H.H.; Wang, G.B.; Dai, J.S.; She, G.H. Estimating canopy structure and biomass in bamboo forests using airborne LiDAR data. ISPRS J. Photogramm. Remote Sens. 2019, 148, 114–129. [Google Scholar] [CrossRef] [Scilit]
- Deng, Z.; Xu, Q.; Fan, S.; Wei, S.; Liu, G.; Li, Z.; Cai, C. Effects of stand structure on aboveground biomass in mixed Moso bamboo forests in Tianbaoyan National Nature Reserve, Fujian, China. Forests 2025, 16, 905. [Google Scholar] [CrossRef] [Scilit]
- Hu, Y.; Sun, R.; He, M.; Zhao, J.; Li, Y.; Huang, S.; Zhang, J. Estimating spatiotemporal dynamics of carbon storage in Robinia pseudoacacia plantations in the Caijiachuan Watershed using sample plots and uncrewed aerial vehicle-borne laser scanning data. Remote Sens. 2025, 17, 1365. [Google Scholar] [CrossRef] [Scilit]
- Zhu, Y.; Myint, S.W.; Liu, K.; Liu, L.; Cao, J. Integration of UAV LiDAR and WorldView-2 images for modeling mangrove aboveground biomass with GA-ANN wrapper. Ecol. Process. 2024, 13, 85. [Google Scholar] [CrossRef] [Scilit]
- Zhai, Y.; Wang, L.; Yao, Y.; Jia, J.; Li, R.; Ren, Z.; He, X.; Ye, Z.; Zhang, X.; Chen, Y.; et al. Spatially continuous estimation of urban forest aboveground biomass with UAV-LiDAR and multispectral scanning: An allometric model of forest structural diversity. Agric. For. Meteorol. 2025, 360, 110301. [Google Scholar] [CrossRef] [Scilit]
- Liu, Y.; Fan, Y.; Feng, H.; Chen, R.; Bian, M.; Ma, Y.; Yue, J.; Yang, G. Estimating potato above-ground biomass based on vegetation indices and texture features constructed from sensitive bands of UAV hyperspectral imagery. Comput. Electron. Agric. 2024, 220, 108918. [Google Scholar] [CrossRef] [Scilit]
- Niu, X.; Chen, B.; Sun, W.; Feng, T.; Yang, X.; Liu, Y.; Liu, W.; Fu, B. Estimation of coastal wetland vegetation aboveground biomass by integrating UAV and satellite remote sensing data. Remote Sens. 2024, 16, 2760. [Google Scholar] [CrossRef] [Scilit]
- Huang, X.; Chen, Y.; Tan, H.; Zhang, Y.; Yu, S.; Chen, X.; Yu, K.; Liu, J. Extraction of the spatial structure of Chinese fir plantations stands based on unmanned aerial vehicle and its effect on AGB. For. Ecol. Manag. 2024, 558, 121800. [Google Scholar] [CrossRef] [Scilit]
- Fu, H.; Zhao, H.; Jiang, J.; Zhang, Y.; Liu, G.; Xiao, W.; Du, S.; Guo, W.; Liu, X. Automatic detection of tree crown and height using Mask R-CNN based on unmanned aerial vehicles images for biomass mapping. For. Ecol. Manag. 2024, 555, 121712. [Google Scholar] [CrossRef] [Scilit]
- Li, L.; Zhu, H.; Wu, T.; Wei, L.; Li, N. New landscape-perspective exploration of Moso bamboo forests under on/off-year phenomena and human activities. Front. For. Glob. Change 2023, 6, 1204329. [Google Scholar] [CrossRef] [Scilit]
- Liu, X.; Li, G.; Li, L.; Lu, D. Modeling Moso Bamboo Tree Density and Aboveground Biomass Using Multi-Site UAV-LiDAR Data. Remote Sens. 2026, 18, 115. [Google Scholar] [CrossRef] [Scilit]
- Chepkoech, E.K.; Agevi, H.; Lung’ayia, H.; Tsingalia, H.M. Woody species composition, stand structure and regeneration status of Londiani Forest in Kenya. For. Ecol. Manag. 2024, 15, 653. [Google Scholar] [CrossRef] [Scilit]
- Xu, X.; Zhou, Z.; Tang, Y.; Qu, Y. Individual tree crown detection from high spatial resolution imagery using a revised local maximum filtering. Remote Sens. Environ. 2021, 258, 112397. [Google Scholar] [CrossRef] [Scilit]
- Hu, B.; Li, J.; Jing, L.; Aaron, J. Improving the efficiency and accuracy of individual tree crown delineation from high-density LiDAR data. Int. J. Appl. Earth Obs. Geoinf. 2014, 26, 145–155. [Google Scholar] [CrossRef] [Scilit]
- Raghavendra, N.S.; Sreedhara, B.M.; Muttana, S.B.; Mundher, Y.Z. Daily scale streamflow forecasting in multiple stream orders of Cauvery River, India: Application of advanced ensemble and deep learning models. J. Hydrol. 2023, 626, 130320. [Google Scholar] [CrossRef] [Scilit]
- Guan, Y.; Tian, X.; Zhang, W.; Marino, A.; Huang, J.; Mao, Y.; Zhao, H. Forest canopy cover inversion exploration using multi-source optical data and combined methods. Forests 2023, 14, 1527. [Google Scholar] [CrossRef] [Scilit]
- Lv, L.; Zhao, Y.; Li, X.; Yu, J.; Song, M.; Huang, L.; Mao, F.; Du, H. UAV-Based Intelligent Detection of Individual Trees in Moso Bamboo Forests with Complex Canopy Structure. IEEE J. Sel. Top. Appl. Earth Observ. Remote Sens. 2024, 17, 11915–11930. [Google Scholar] [CrossRef] [Scilit]
- Cui, L.; Sun, M.; Jiao, Z.; Park, J.; Agca, M.; Zhang, H.; He, L.; Dai, Y.; Dong, Y.; Zhang, X.; et al. Effectiveness of the Reconstructed MODIS Typical-Angle Reflectances on Forest Biomass Estimation. Remote Sens. 2022, 14, 5475. [Google Scholar] [CrossRef] [Scilit]
- Zhang, L.; Zhao, Y.; Chen, C.; Li, X.; Mao, F.; Lv, L.; Yu, J.; Song, M.; Huang, L.; Chen, J.; et al. UAV-LiDAR integration with Sentinel-2 enhances precision in AGB estimation for bamboo forests. Remote Sens. 2024, 16, 705. [Google Scholar] [CrossRef] [Scilit]
- Ali, J.S.; Chen, L.; Liao, B.; Wang, C.; Zhang, F.; Bhutto, Y.A.; Junejo, S.A.; Nian, Y. Integration of UAS and Backpack-LiDAR to Estimate Aboveground Biomass of Picea Crassifolia Forest in Eastern Qinghai, China. Remote Sens. 2025, 17, 681. [Google Scholar] [CrossRef] [Scilit]
- Nian, Y.; Chen, S.; Chen, J.; Che, M.; Zhang, W.; Ali, J.S.; Zhang, H.; Wang, X.; Liao, B.; Wang, X. Mapping Subalpine Forest Aboveground Biomass in Qilian Mountain National Park Using UAV-LiDAR, GEDI, and Multisource Satellite Data. IEEE J. Sel. Top. Appl. Earth Obs. Remote Sens. 2025, 18, 12407–12420. [Google Scholar] [CrossRef] [Scilit]
- Qiao, Y.; Zheng, G.; Du, Z.; Ma, X.; Li, J.; Moskal, L. Tree-Species Classification and Individual-Tree-Biomass Model Construction Based on Hyperspectral and LiDAR Data. Remote Sens. 2023, 15, 1341. [Google Scholar] [CrossRef] [Scilit]
- Winsemius, S.; Babcock, C.; Kane, V.R.; Bormann, K.J.; Safford, H.D.; Jin, Y. Improved Aboveground Biomass Estimation and Regional Assessment with Aerial Lidar in California’s Subalpine Forests. Carbon Balance Manag. 2024, 19, 41–64. [Google Scholar] [CrossRef] [Scilit]
- So, K.; Chau, J.; Rudd, S.; Robinson, D.T.; Chen, J.; Cyr, D.; Gonsamo, A. Direct Estimation of Forest Aboveground Biomass from UAV LiDAR and RGB Observations in Forest Stands with Various Tree Densities. Remote Sens. 2025, 17, 2091. [Google Scholar] [CrossRef] [Scilit]

Disclaimer/Publisher’s Note: The statements, opinions and data contained in all publications are solely those of the individual author(s) and contributor(s) and not of MDPI and/or the editor(s). MDPI and/or the editor(s) disclaim responsibility for any injury to people or property resulting from any ideas, methods, instructions or products referred to in the content. |
© 2026 by the authors. Licensee MDPI, Basel, Switzerland. This article is an open access article distributed under the terms and conditions of the Creative Commons Attribution (CC BY) license.