


Highlights
What are the main findings?
- The first 1 km resolution permafrost thickness map for Northeast China was generated using a novel temperature inversion framework and Random Forest algorithm.
- Permafrost thickness is primarily controlled by precipitation and topography, with a critical increase observed above an altitude threshold of 1350 m a.s.l.
What are the implications of the main findings?
- The proposed framework effectively overcomes the lack of deep borehole data, providing a reproducible method for estimating permafrost thickness in complex, data-scarce regions.
- These results offer vital baseline data for engineering infrastructure stability and ecological modeling within the discontinuous permafrost zones of the Greater and Lesser Khingan Mountains.
Abstract
Permafrost thickness serves as a critical indicator of hydrogeological conditions in cold regions and significantly influences the safety of engineering infrastructure. Due to the combined effects of climate, ecology, and human activities, the thermal characteristics and spatial distribution of permafrost in the Greater and Lesser Khingan Mountains of Northeast China exhibit high complexity, rendering existing permafrost thickness estimation methods largely inapplicable in this region. We developed an integrated estimation framework that bridges the gap between limited deep ground temperature measurements and regional-scale mapping. To overcome the scarcity of deep borehole (>20m) data, a physical-statistical inversion method was employed to derive permafrost base depths from shallow borehole temperature profiles, thereby expanding the foundational dataset to 104 representative sites. Integrating these ground observations with satellite-derived products (e.g., MODIS NDVI) and auxiliary environmental covariates (e.g., DEM-based topography and gridded climatic data), a Random Forest algorithm (RF) was applied to generate a 1 km-resolution permafrost thickness distribution map across Northeast China with a classification accuracy of 0.74. The results indicate that the average permafrost thickness in the study area is 47.71 ± 10 m, exhibiting a spatial pattern of thicker in the north and west, thinner in the south and east, and greater in mountainous areas than in plains. The top three influencing factors of permafrost thickness are atmospheric precipitation, surface thawing degree days (TDDs), and topographic position index (TPI), revealing that the thickness of discontinuous permafrost in northeastern China is primarily governed by local factors such as soil moisture, represented by the thick permafrost existed under a small patch of ground surface. This study provides a new methodological framework for estimating permafrost thickness in regions with limited ground temperature gradient measurement in deep boreholes.
1. Introduction
Permafrost, defined as subsurface materials remaining at or below 0 °C for at least two consecutive years [1], constitutes a vital component of the cryosphere. Its thermal regime exhibits pronounced sensitivity to climatic variations, with thickness dynamics exerting direct controls on hydrological-ecological security, carbon sequestration capacity, and critical infrastructure stability [2,3,4]. Located at the southern edge of the high-latitude permafrost belt in Eurasia, the Greater and Lesser Khingan Mountains in Northeast China (46°30′–53°30′N) represent one of the regions experiencing the most pronounced permafrost degradation under global warming [5]. The permafrost here is characterized by relatively high temperatures (−1.5 to 0 °C), elevated ice content, and discontinuous spatial distribution [6,7]. Observational records over the past three decades reveal a rapid warming trend in ground temperatures (+0.34 °C/decade) [8] accompanied by a substantial reduction in permafrost thickness (−1.2 m/decade). Notably, this thinning rate far exceeds the concurrent active-layer thickening (+15 cm/decade), posing severe risks to critical linear infrastructure such as the China–Russia crude oil pipelines and the Mohe-Beiji Village Railway (in the permafrost region), with cascading impacts on local hydrology, ecology, engineering infrastructure, and even the climate [9,10,11,12,13].
However, the systematic understanding of permafrost distribution patterns in Northeast China is currently constrained by considerable discrepancies in estimated permafrost areas across various studies, ranging from 1.74 × 10⁵ km2 to 4.44 × 10⁵ km2 [14,15,16,17,18]. These variations stem not only from data heterogeneity but also from the complex interplay between localized “island” permafrost and diverse land covers, such as the thermal insulation of Sphagnum-Larch forests and the varying thickness of winter snow cover, which complicates the upscaling of point-based observations to regional maps [19]. Consequently, this suboptimal grasp of permafrost distribution directly impacts the precision with which permafrost thickness can be characterized.
Permafrost thickness, defined as the vertical distance between upper and lower permafrost boundaries, serves as a key diagnostic parameter for assessing cryospheric dynamics. While deep borehole thermometry remains the most accurate determination method, high costs limit its application for regional-scale surveys. Consequently, engineering and environmental investigations predominantly utilize shallow boreholes (≤15 m depth), with thickness estimation typically employing geothermal gradient extrapolation. This conventional approach estimates the lower boundary depth by utilizing the ground temperature at the depth of zero annual amplitude (ZAA) (where annual temperature fluctuations decay to ≤0.1 °C) and subsequent geothermal gradients [9,20,21]. It should be noted, however, that the thermal profile often exhibits a non-linear gradient (composed of various sections with differing gradients), which typically results from complex lithology and varying thermal properties of distinct rock layers [22,23]. However, systematic borehole observations in the Greater and Lesser Khingan Mountains reveal frequent occurrences of null or negative geothermal gradients at annual variation depths, primarily driven by the latent heat release during phase change in warm permafrost and the transient thermal lag caused by rapid surface warming. These phenomena invalidate the methodological prerequisite of positive thermal gradients and introduce substantial estimation errors. While previous studies have established empirical relationships between permafrost thickness and mean annual ground temperature since the classical studies in the Arctic and Eurasia [21,24,25,26,27,28], these region-specific parameterizations exhibit limited transferability to Northeast China’s permafrost systems. This is largely because the asymptotic relationship between thickness and ground temperature in warm permafrost (near 0 °C) is highly sensitive to local non-climatic factors (e.g., snow insulation), weakening the correlation strength observed in colder regions [29,30]. This methodological gap hinders the detailed characterization of discontinuous permafrost zones in the study area.
This study is founded on two principal scientific premises: (1) Nonlinear deep geothermal gradient features in permafrost zones can be quantitatively described through physical modeling; (2) Environmental similarity governs inter-borehole geothermal gradient pattern coherence. Building upon these postulates, our primary research objective is to develop and implement a novel methodological framework that integrates deep borehole-derived thermal constraints with shallow borehole data to accurately reconstruct the depth of the permafrost base across the Greater and Lesser Khingan Mountains. Specifically, this framework aims to overcome the limitations of traditional geothermal gradient extrapolation methods in this region by enabling the reliable estimation of permafrost thickness in areas with sparse deep borehole observations. Ultimately, this research seeks to provide a high-resolution spatial distribution map of permafrost thickness, offering critical insights into the current state and spatial heterogeneity of permafrost in this crucial southern discontinuous permafrost zone.
2. Materials and Methods
2.1. Study Area
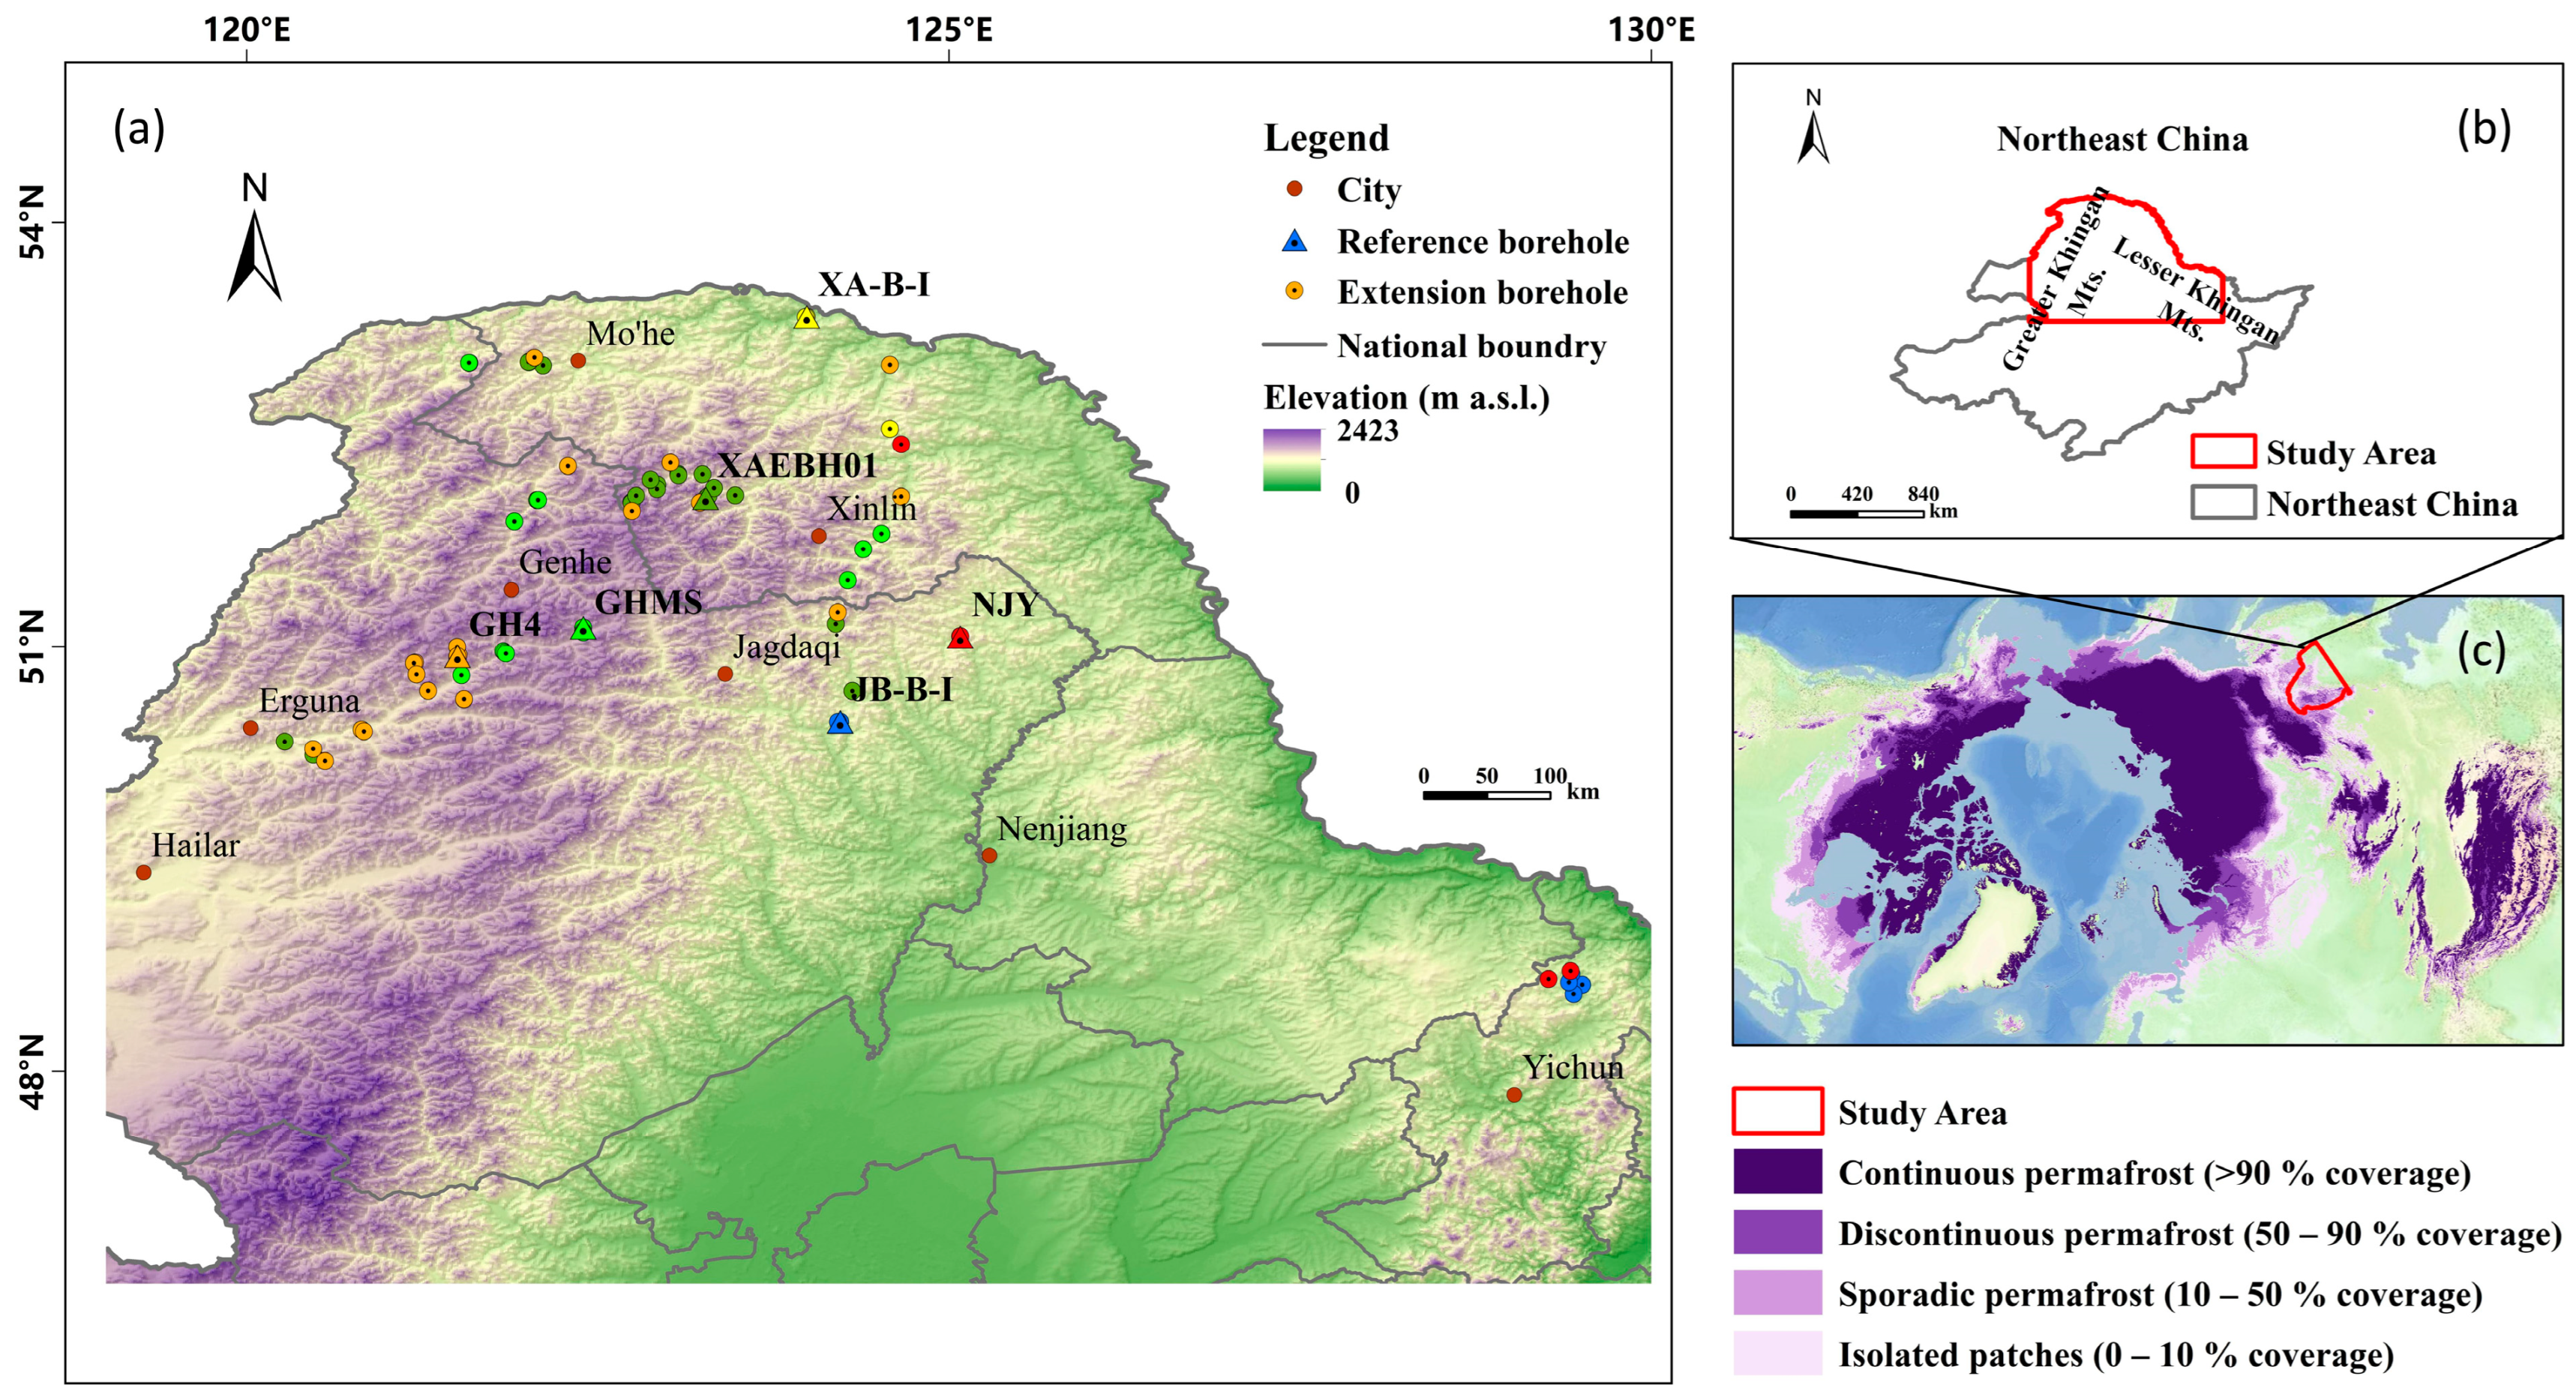
Situated in mid-high latitudes along Eurasia’s eastern continental margin, Northeast China’s permafrost region develops under a cold-temperate to temperate continental monsoon climate regime shaped by competing influences from the Siberian–Mongolian High and East Asian monsoon systems (Figure 1). This climatic configuration drives pronounced spatial heterogeneity in permafrost distribution, primarily concentrated across the Greater and Lesser Khingan Mountains and adjacent high-altitude zones, forming the distinctive Khingan-Baikal permafrost type [31]. It exhibits a distribution pattern that transitions gradually from north to south and from high to low elevations.
Figure 1.
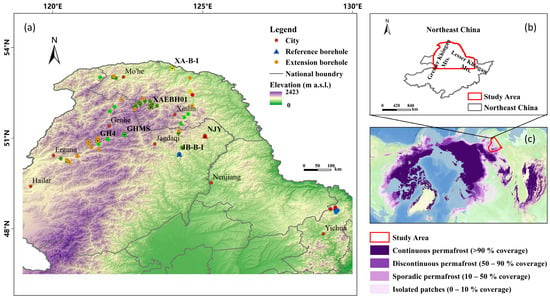
Location map and topography of the study area in Northeast China. Notes: (a) Distribution of boreholes (n = 104) for monitoring mean annual ground temperature. Borehole Types: Triangles (▲) represent deep Reference Boreholes used for geothermal gradient modeling; Circles (●) represent shallow Extension Boreholes. Grouping: Symbols are color-coded to indicate the environmental similarity pairing; each color group consists of one Reference Borehole and its corresponding Extension Boreholes used for parameter transfer (as described in Section 3.2); (b) Location map of study area in China, and; (c) Base map of permafrost distribution in the Northern Hemisphere (modified from Obu et al., 2019 [14]).
The study area exhibits distinct climatic gradients characterized by a northwest-to-southeast spatial pattern. Annual mean temperatures demonstrate a gradual increase from −5 °C in the northwestern sectors to 5 °C in the southeastern regions, accompanied by a concurrent decrease in annual temperature range from >35 °C to approximately 28 °C. Precipitation distribution reveals markedly contrasting spatial heterogeneity, with monsoon-dominated southeastern areas receiving >800 mm annual precipitation, contrasting sharply with <300 mm in the arid northwest. Winter precipitation constitutes 5–10% of the annual total, reflecting the region’s strong seasonal moisture partitioning. Snowpack characteristics show altitudinal differentiation, with maximum snow depths reaching 50 cm in mountainous terrain compared to ≤20 cm across plains. Persistent winter temperature inversions develop extensively throughout the region, typically exhibiting vertical extents of 500–1000 m. These inversion layers substantially restrict surface-atmosphere heat exchange processes, creating critical thermal boundary conditions for cryospheric interactions.
2.2. Materials
2.2.1. Compilation and Processing of Borehole Data
The dataset of ground temperature across the Northeast China permafrost regions consisted of a total of 104 boreholes (Figure 1b). For this dataset, 34 measurements were obtained from the Ministry of Science and Technology project “Investigation of Permafrost Baseline and Thawing Hazards in Northeast China’s High-Latitude Regions”. The remaining 70 measurements were compiled from published articles [32,33,34,35,36,37,38,39,40,41,42]. The observational period was from 2007 to 2023.
To generate continuous ground temperature time series and accurately estimate the permafrost thermal state (including the Depth of Permafrost Base, DPB), we implemented a standardized data processing workflow. It is important to note that while the DPB is relatively stable on an inter-annual scale, gaps in the raw ground temperature records can introduce biases into long-term thermal analyses. Therefore, our processing focused on reconstructing complete ground temperature profiles:
- 1.
- Reference boreholes processing for geothermal gradient modeling
Six deep boreholes (>20 m depth) were selected as reference sites for regional geothermal gradient reconstruction. These six reference boreholes were selected based on strict quality control (depth >20 m, absence of anthropogenic disturbance) and their strategic distribution across the major topographic and climatic units of the region, ensuring the spatial representativeness required for the subsequent Environmental Similarity Analysis. Raw monitoring data underwent cubic spline interpolation to reconstruct missing depth intervals and/or annual records, followed by outlier removal. Subsequently, long-term average geothermal profiles from 2007 to 2023 were calculated for each reference borehole, forming the basis for the refined geothermal gradient model. Based on these stable long-term profiles, the geothermal gradients were computed to accurately determine the DPB.
- 2.
- Extension boreholes processing for environmental similarity analysis
The remaining 98 boreholes (shallow holes <20 m depth and three deep boreholes exhibiting non-positive geothermal gradients) were classified as extension boreholes. These datasets underwent identical temperature interpolation and quality control procedures. The primary objective for these sites was to extract reliable Multi-Year Mean Ground Temperatures (MAGTs) at the depth of zero annual amplitude (ZAA). These processed MAGT data facilitated environmental similarity correlations to extrapolate the geothermal gradient model spatially and estimate the DPB for sites where direct deep measurements were unavailable.
After obtaining the long-term thermal profiles of deep boreholes from 2007 to 2023, we computed the geothermal gradients. To optimize stability and representation of regional permafrost heat transfer characteristics, gradients were computed at 9m depth intervals. This approach balances vertical resolution with statistical robustness in heterogeneous frozen ground environments.
2.2.2. Environmental and Climate Data
Fifteen environmental and climate variables were selected in the prediction of permafrost thickness using the RF method. These variables were derived from high-quality datasets available at present (Table 1).
Table 1.
Information on the variables used in this study.
To ensure data consistency and enable robust model training, all selected predictor variables were spatially resampled to a common resolution of 1 km. In terms of temporal alignment, the inherent temporal variability of certain factors was addressed through multi-year averaging to capture representative conditions and account for the relatively slow-changing nature of permafrost thickness.
The elevation at 1km resolution was obtained from a dataset compiled by Amatulli et al. [43]. Clay, sand and silt content data in the soils were obtained from the Chinese Academy of Sciences [44] with a spatial resolution of 1 × 1 km. In addition to soil texture, Depth to Bedrock (DTB, cm) is derived from the depth-to-bedrock map of China at a spatial resolution of 100 m [45]. Mean annual air temperature (TMP, ◦C) and precipitation (PRE, mm) from 2011 to 2020 were derived from the 1 km resolution monthly climate dataset for China [46]. The number of freezing degree days (FDDs) and thawing degree days (TDDs) based on ground surface temperature (GST) was calculated following the method of Zou et al. [47], and the data period was expanded to 2001–2021. The multiyear averaged maximum value of the normalized difference vegetation index (NDVI) from 2017 to 2021 was derived from the MOD13A2 products [48].
2.3. Methods
2.3.1. Reference Borehole Geothermal Model Construction
The geothermal gradient (GOT) is defined as the rate of change in ground temperature. The model is expressed as:
where T is the ground temperature and Z is the corresponding depth.
Given the complexity of geothermal gradient variation with depth in permafrost regions, traditional assumptions of constant or linear gradients no longer accurately reflect reality. To address this limitation, this study proposes a novel piecewise geothermal gradient model integrating a decay function to characterize the transition from shallow-layer thermal fluctuations to deep-layer stability.
The model is expressed as:
where Z denotes depth, H represents the stabilization depth, C is the stabilized geothermal gradient at depth, and parameters a and b govern the decay rate. This formulation effectively quantifies the progressive attenuation of near-surface thermal variability, aligning with observed depth-dependent gradient evolution in heterogeneous permafrost environments.
To account for regional heterogeneity in subsurface heat transfer processes, key parameters H (stabilization depth) and C (stabilized gradient) are dynamically parameterized across boreholes. A parameter space (H,C) is constructed, and an exhaustive search method is employed to optimize site-specific solutions. Model performance is evaluated using the coefficient of determination (R2) and root mean square error (RMSE) by comparing simulated and measured temperature profiles. This data-driven optimization enables the model to “learn” borehole-specific thermal signatures, ensuring accurate replication of deep geothermal temperature trends critical for permafrost characterization.
To demonstrate the parameterization process, the thermal profile for the NJY [49] reference borehole, optimized using the exhaustive search method, is mathematically expressed as:
where GOT denotes the ground thermal gradient (°C/m) and Z represents depth below surface (m).
This explicit formulation illustrates how the decay function (defined by parameters a and b) characterizes the transition from near-surface fluctuations to the stabilized gradient (C) at depth (H).
To predict the unobserved permafrost thickness, the optimized model is combined with the ground temperature at the depth of zero annual amplitude (ZAA). When the borehole ends above the permafrost base, the deep temperatures are extrapolated by solving:
where T(Z) is the ground temperature at depth Z; TZAA is the multi-year average ground temperature at the depth of zero annual amplitude (ZAA); and f(Z, a, b, H, C) represents the optimized geothermal gradient model derived in Equation (2).
The permafrost base (Hm) is identified as the depth where T(Z) = 0 °C, permitting thickness calculation via:
where H is permafrost thickness; Hm is the permafrost base; Ht denotes permafrost table.
If the active layer is included in permafrost stratification, thickness is derived directly as:
Through this approach, we have constructed a refined model capable of accurately simulating deep ground temperatures and thereby estimating permafrost thickness, starting from limited deep borehole data.
2.3.2. Geothermal Model Transfer to Extension Borehole
Permafrost geothermal conditions are governed by the complex interplay of climatic, topographic, and pedogenic factors that collectively define the cryostratigraphic environment. Building upon the foundational principle that “environmental homology dictates thermal regime homology” [50], we employ a spatial analogy approach to quantify environmental similarity between boreholes through Euclidean distance metrics (Equations (7) and (8)). Leveraging the principle of environmental homology, this methodology facilitates the transfer of geothermal parameters (Z, a, b, H, and C) from instrumented reference boreholes to extension boreholes with similar environmental characteristics, enabling indirect inference of deep thermal profiles. The technique is widely validated in cryospheric and geoscientific applications [51,52].
Initially, to enhance computational efficiency and robustness, Principal Component Analysis (PCA) was applied as a dimensionality reduction and feature extraction technique. This involved standardizing and then processing fifteen environmental and climate variables (as listed in Table 1) to identify a reduced set of six principal components (PCs). These PCs were then used as input for calculating multi-dimensional Euclidean distances between sampling locations and target points, quantifying environmental dissimilarity [53]:
where di,j is the Euclidean distance in the K-dimensional principal component space between the i-th reference borehole and the j-th target point, and PCi,t and PCj,t are their respective scores on the t-th principal component.
Subsequently, this distance metric is transformed into environmental similarity probability (0 < si,j < 1) through exponential decay modeling:
where si,j denotes the environmental similarity between the i-th sampling point and the j-th target point.
Crucially, while PCA-derived similarity aids in localized parameter transfer, the subsequent regional spatial extrapolation via Random Forest (RF) utilizes all original fifteen environmental and climate variables to capture their full predictive potential and complex interactions.
2.3.3. Random Forest Model
Although the aforementioned methods can estimate permafrost thickness for individual boreholes, this study employs the Random Forest method as the primary analytical tool to generate spatial distribution maps of permafrost thickness at the regional research scale.
The predictive workflow generates probabilistic thickness classifications through discrete interval modeling (15–35 m, 35–55 m, 55–75 m, 75–95 m, >95 m). This approach leverages both contemporary machine learning outputs and established empirical patterns, effectively mitigating extrapolation uncertainties in transition zones.
Model performance was comprehensively evaluated using multiple metrics, including accuracy, F1 score and confusion matrix, with precision assessed via 5-fold cross-validation.
2.3.4. Characterization of Permafrost Thickness
To investigate the spatial variability of permafrost thickness across diverse landscape settings, we analyzed its distribution with respect to key topographic and geographic variables (e.g., elevation, aspect, and slope). We employed a spatially explicit, area-weighted averaging methodology to quantify the average permafrost thickness within specific intervals or categories of these variables.
This analysis integrates the mapped permafrost thickness with geospatial predictors. For each unit of analysis (e.g., a specific elevation band, slope class, or aspect category), the permafrost thickness data were aggregated into discrete intervals. The spatial distribution of these thickness intervals within each category was quantified through pixel-based counting, establishing the fractional area coverage of each thickness class.
The mean permafrost thickness for any given category (unit) was calculated using the following area-weighted average formula:
where n represents the total number of permafrost thickness intervals. Here, wi denotes the weight assigned to the i-th permafrost thickness interval, which is determined by its fractional area coverage within the specific geomorphic unit. Mi is the preassigned representative midpoint value for the i-th permafrost thickness interval.
These midpoint values were established as follows: 0 m for intervals <15 m (assuming no permafrost), 25 m for 15–35 m, 45 m for 35–55 m, 65 m for 55–75 m, 85 m for 75–95 m, and 105 m for intervals >95 m. This approach ensures that units with larger spatial extents contribute proportionally more to the overall average.
To accurately assess the average thickness, we calculated two aggregated estimates. For this analysis, we assumed that if the estimated thickness is less than 15 m, it represents seasonally frozen ground (i.e., no permafrost). Consequently, the second estimate excluded these pixels to recalculate the average thickness based solely on the identified permafrost domain. This focused analysis aims to more precisely reveal the thermodynamic mechanisms of permafrost and its association with specific topographic features.
3. Results
3.1. Reference Boreholes Thermal Profiling Model and Validation
The core thermal parameterization scheme underpinning this methodology employs depth-dependent thermal gradient modeling to resolve subsurface heat transfer dynamics.
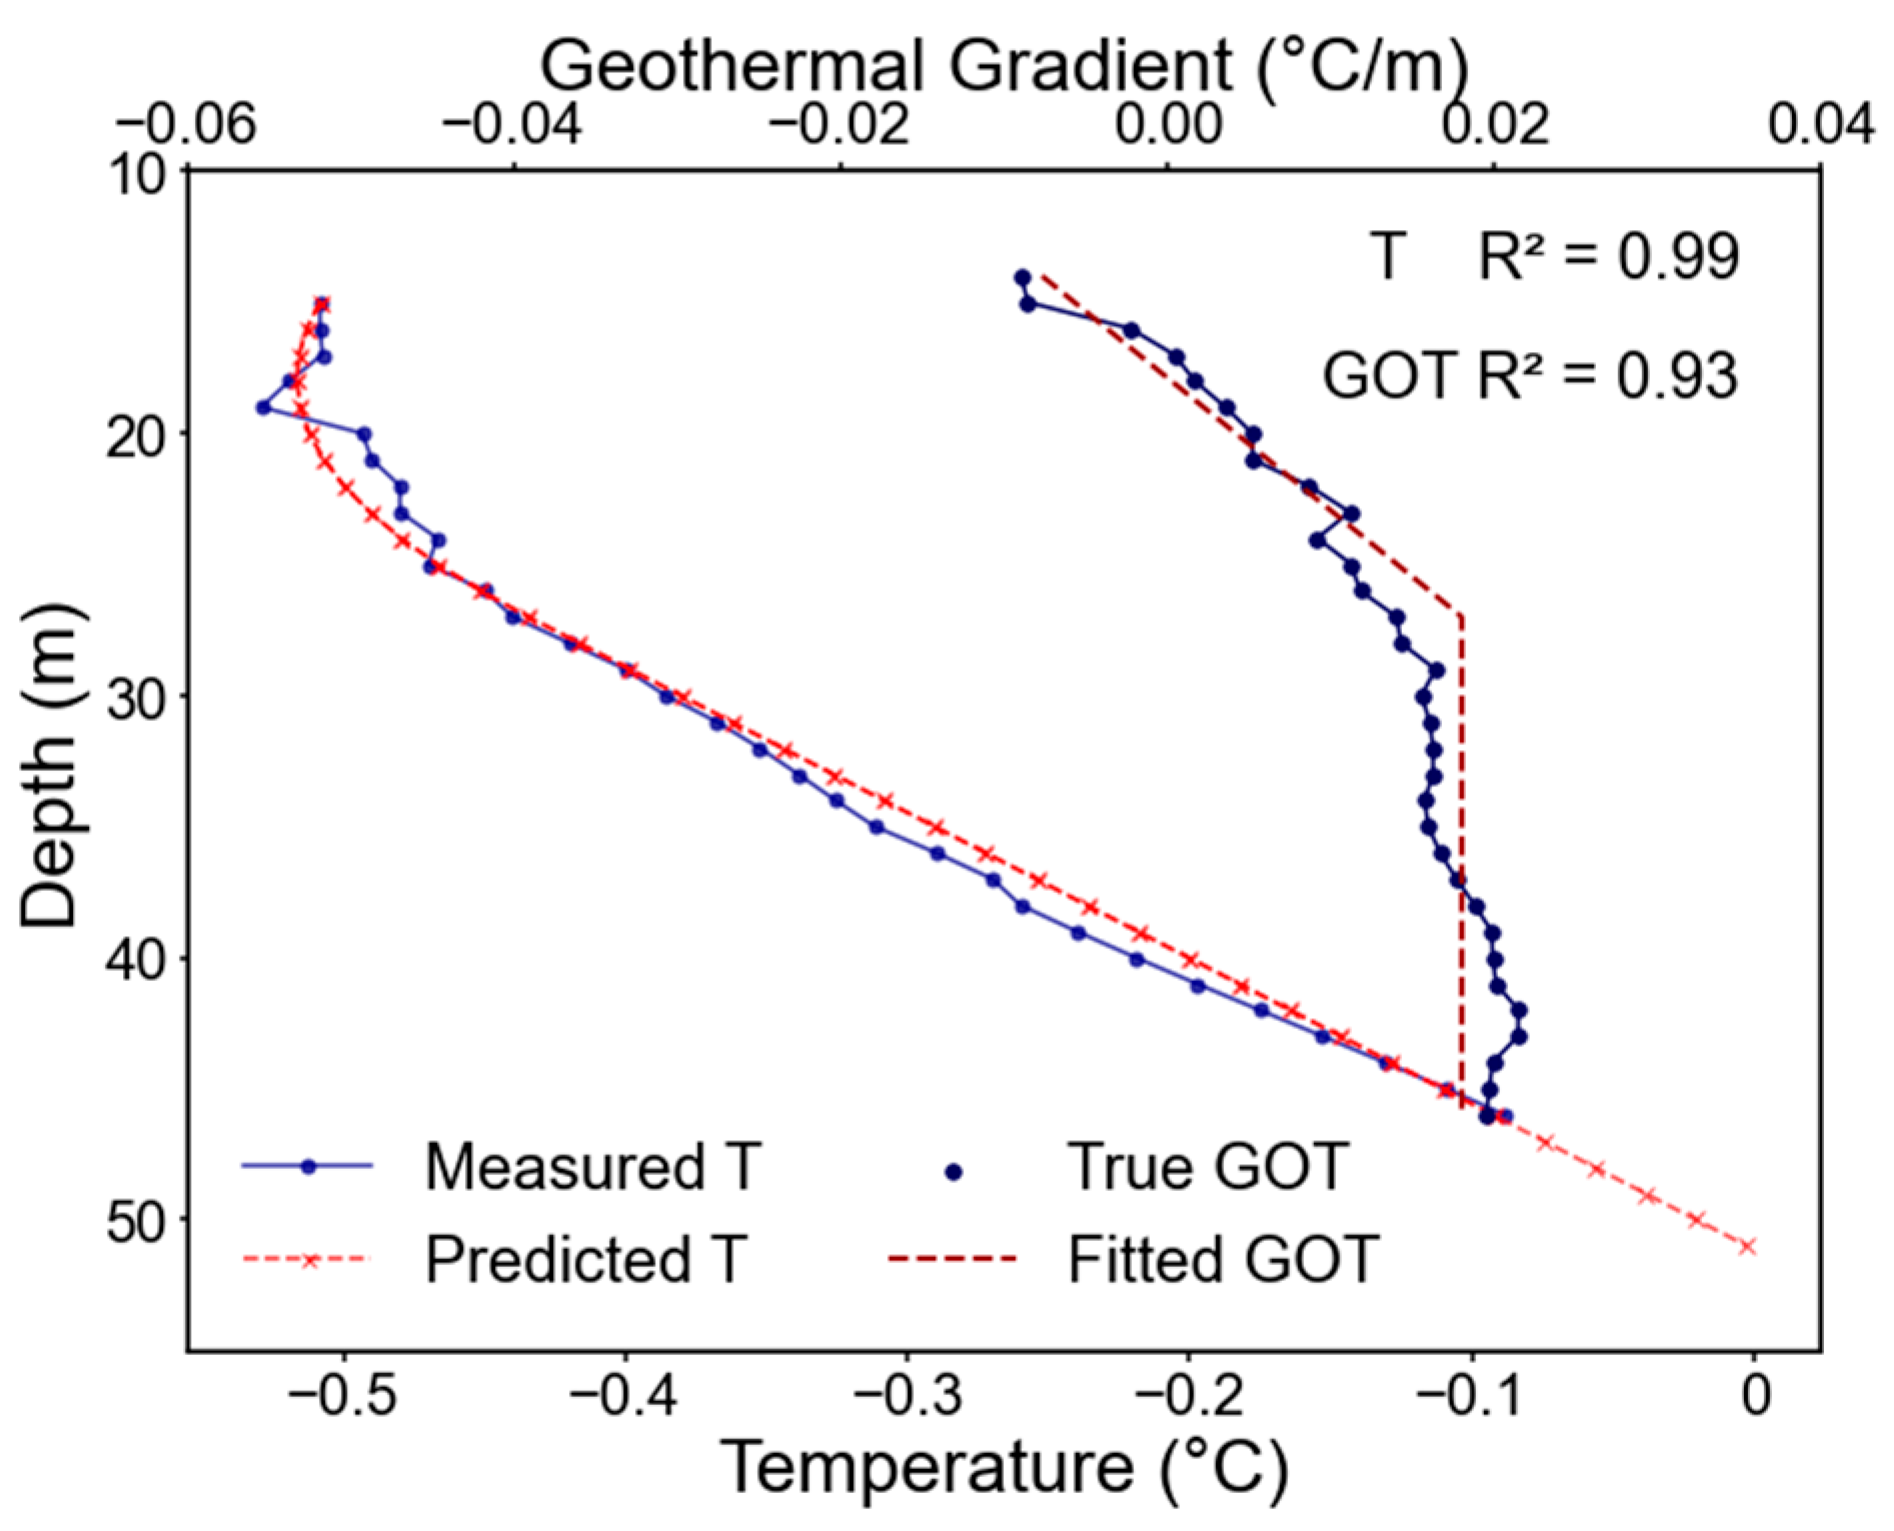
The thermal gradient model’s predictive capability was rigorously evaluated through comparative analysis of simulated temperature-depth profiles against co-temporal thermistor chain observations from geological boreholes (Figure 2). The predicted geothermal curve aligns well with the measured curve, and the stable geothermal depth of the predicted curve is essentially consistent with that of the measured curve. Overall, the geothermal gradient model developed in this study exhibits high accuracy and reliable trend prediction.
Figure 2.
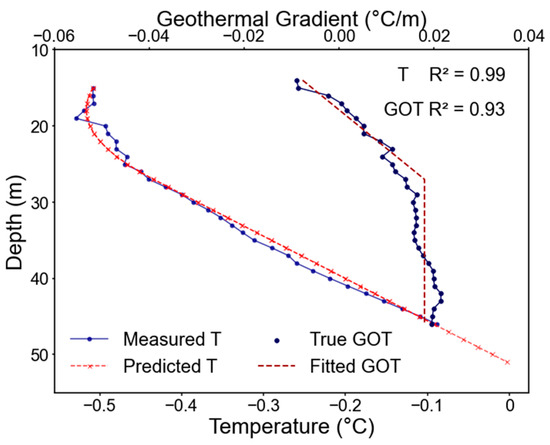
Comparison of measured and predicted curves of geothermal gradient and ground temperature of NJY borehole.
The parameters of the geothermal gradient model established based on measured ground temperature data from six reference holes are shown in Table 2. This model enables both forward prediction and backward extrapolation of ground temperature conditions within boreholes.
Table 2.
Model of each reference boreholes [38,40,49].
Cross-validation between modeled thermal profiles and borehole-measured permafrost thickness (Table 3) revealed exceptional agreement, with mean absolute errors <1% across all reference sites. This sub-meter level precision (>99% accuracy) confirms the reliability of the calibrated thermal gradient models for subsequent environmental similarity-based parameterization.
Table 3.
Error analysis of each reference boreholes.
3.2. Environmental Similarity-Driven Permafrost Thickness Extrapolation
This study implemented an environmental similarity-based parameter transfer framework to extrapolate thermal gradient models from deep reference boreholes to shallow extension boreholes. The workflow comprises three critical phases: (1) multi-covariate environmental similarity computation between target and reference boreholes using Equations (7) and (8); (2) donor-receiver pairing through maximum similarity selection (Figure 1); and (3) thermal regime reconstruction at extension boreholes through the models of each reference borehole.
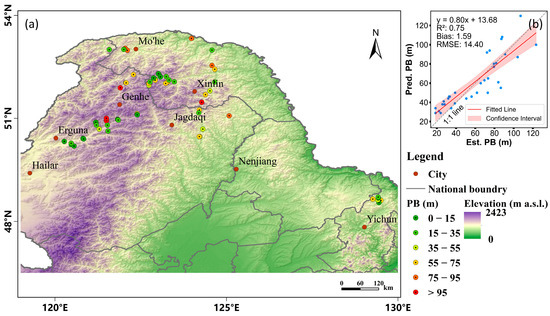
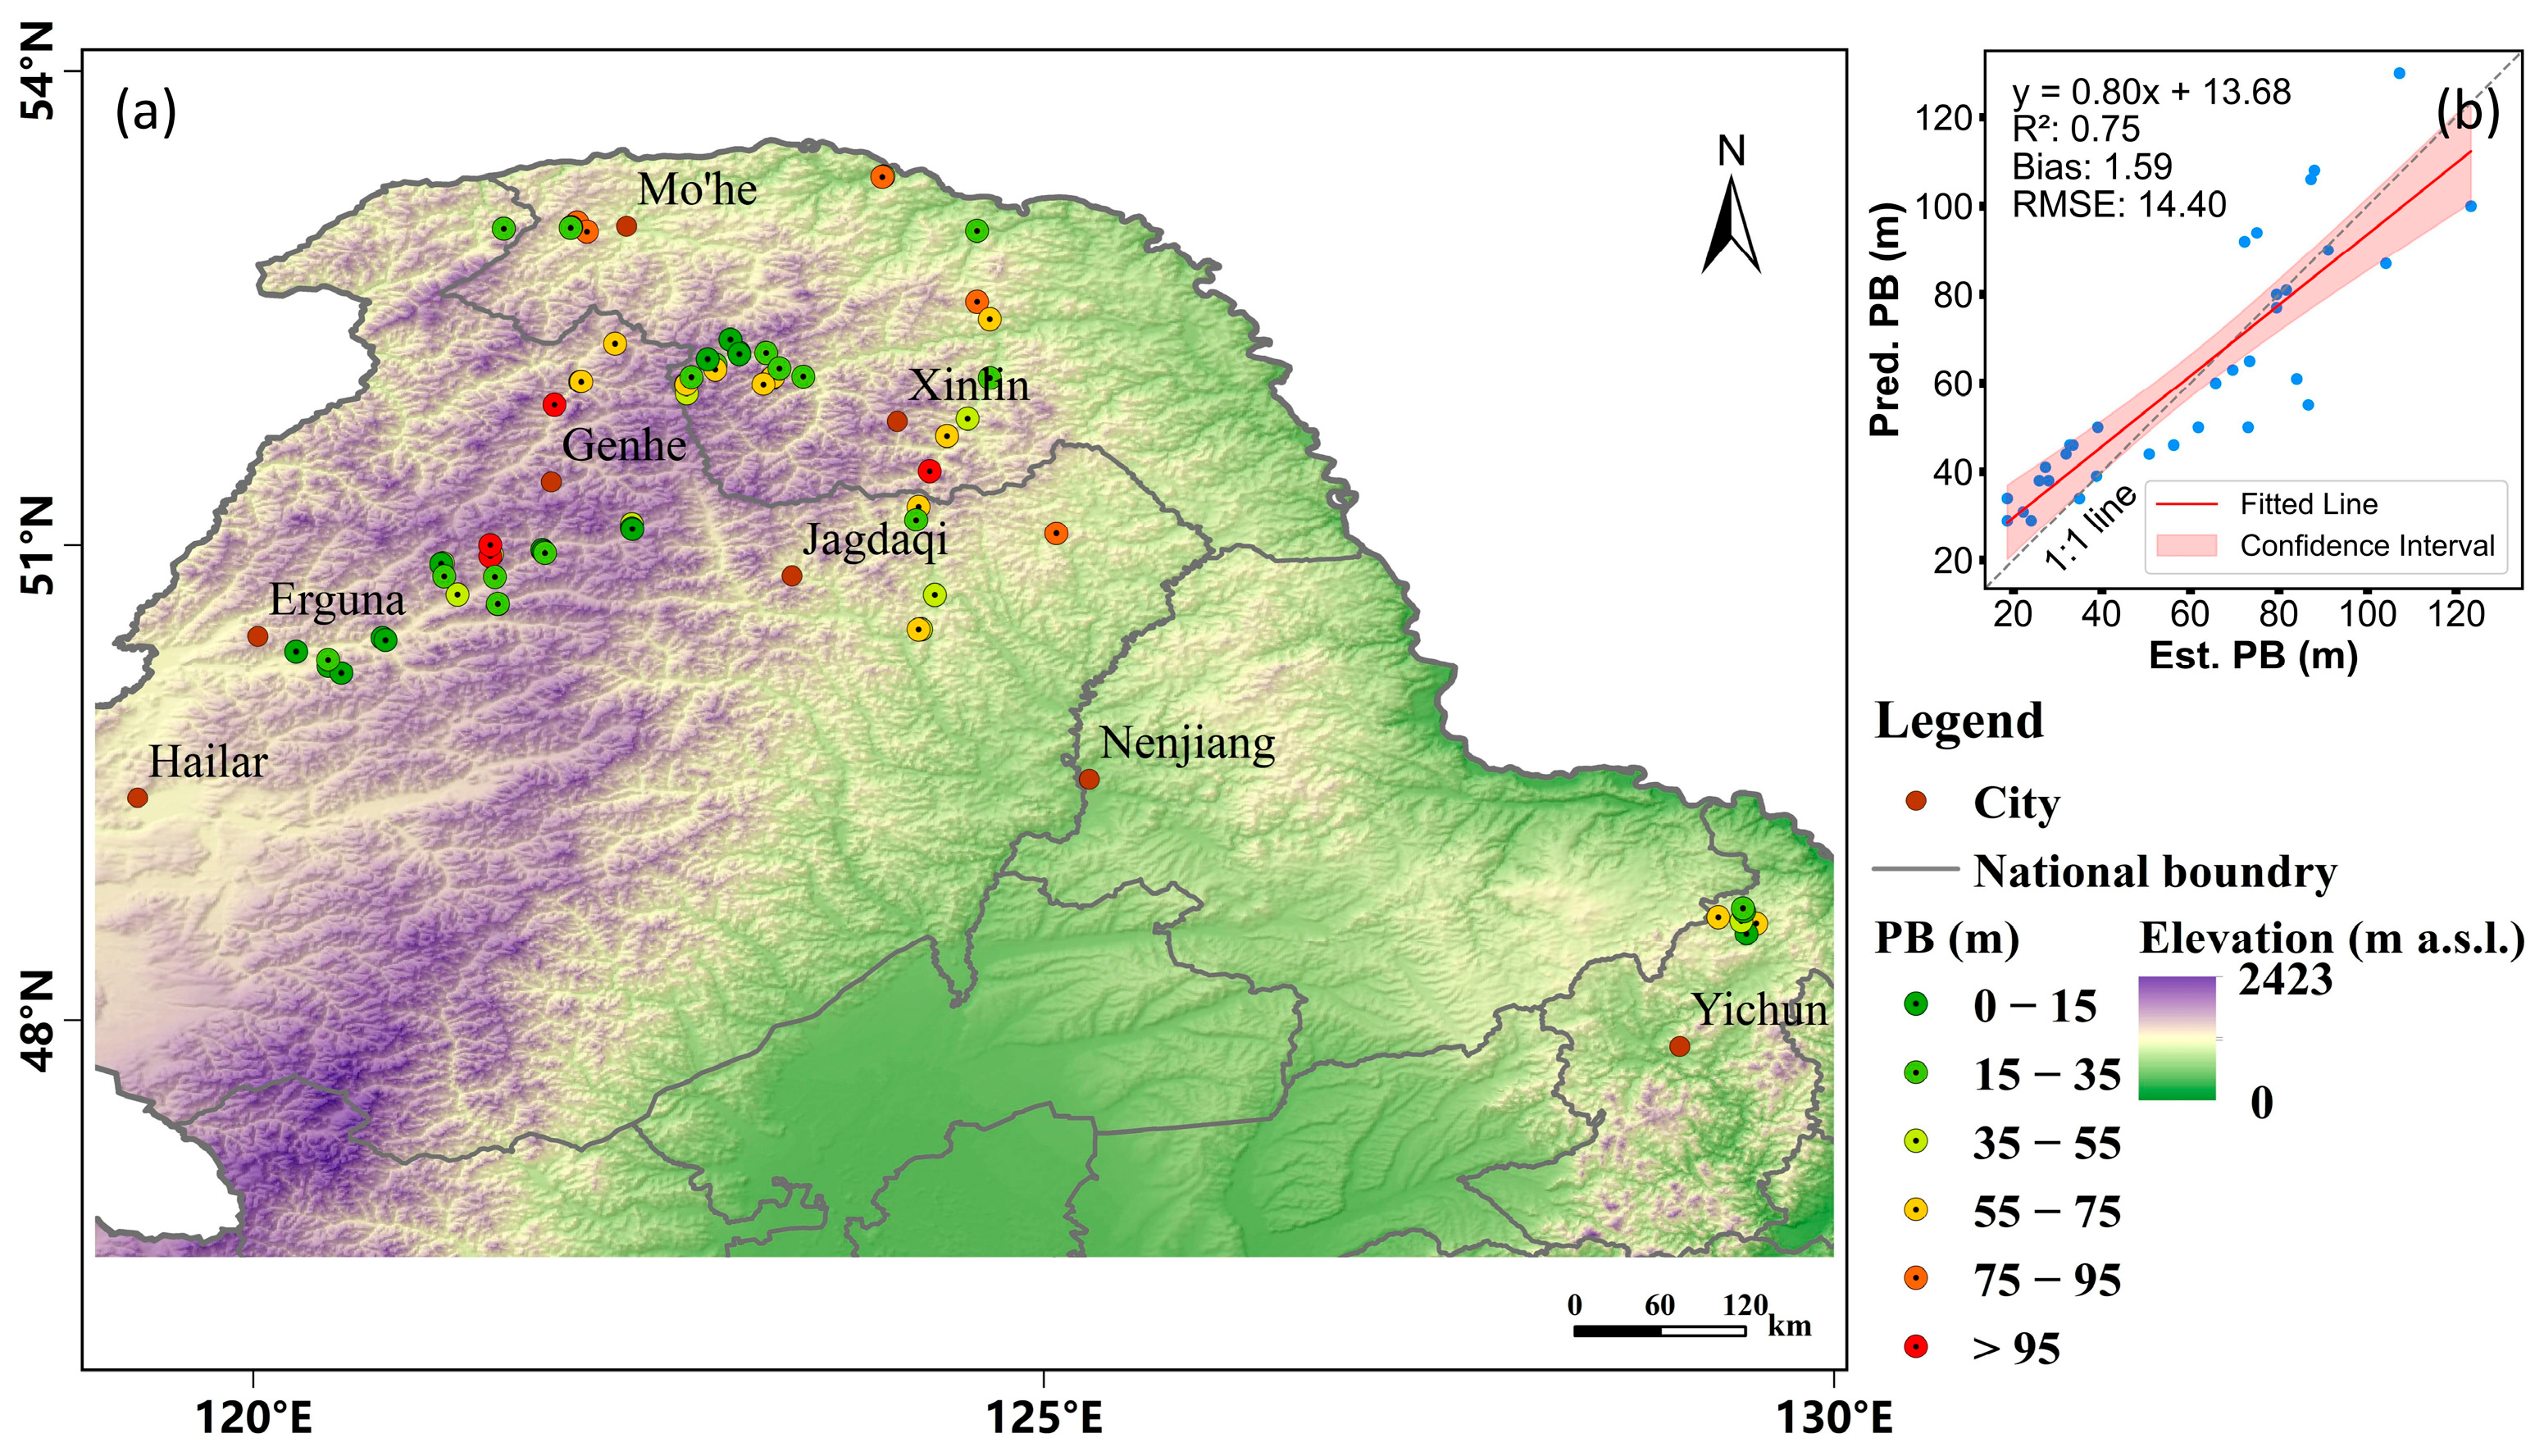
Figure 3a depicts the spatial distribution of the permafrost thickness of the extension boreholes. Statistics indicate that the average permafrost thickness across the entire area is 45.64 m, with 49% of the area having thicknesses concentrated within the 15–55 m range. Thicker permafrost predominantly occurs in the northern, high-latitude areas of the study region, while thinner permafrost is more widely distributed along the margins or southern parts of the permafrost zone.
Figure 3.
Spatial distribution of permafrost thickness in extension boreholes in Northeast China (a); Relationship between predicted permafrost thickness (Pred. PB) from our method and estimated permafrost thickness (Est. PB) from previous studies in extension boreholes (b). The 1:1 line is also shown for reference.
Figure 3b presents a scatterplot comparing our predicted permafrost thickness (Pred. PB) with estimated values (Est. PB) from previous site-specific surveys. It is important to note that these Est. PB values were derived using conventional linear extrapolation based on ground temperatures and local geothermal gradients measured in shallow boreholes. While these previous estimates serve as a valuable baseline for validation, they rely on the assumption of a constant geothermal gradient and cannot fully capture the non-linear deep thermal regimes often observed in this region (as discussed in Section 1). Therefore, we did not use them directly as ground truth but rather as a reference to verify the consistency of our method.
The fitted line is close to the 1:1 line, with a bias and RMSE of −1.59 and 14.40 m, respectively, indicating a close agreement between our predictions and the reference estimated values. Despite some errors, the overall trend and relative accuracy sufficiently support the macro-regional scale permafrost thickness estimation capabilities of our method.
3.3. Spatial Simulation of Permafrost Thickness Distribution Using Random Forest Model
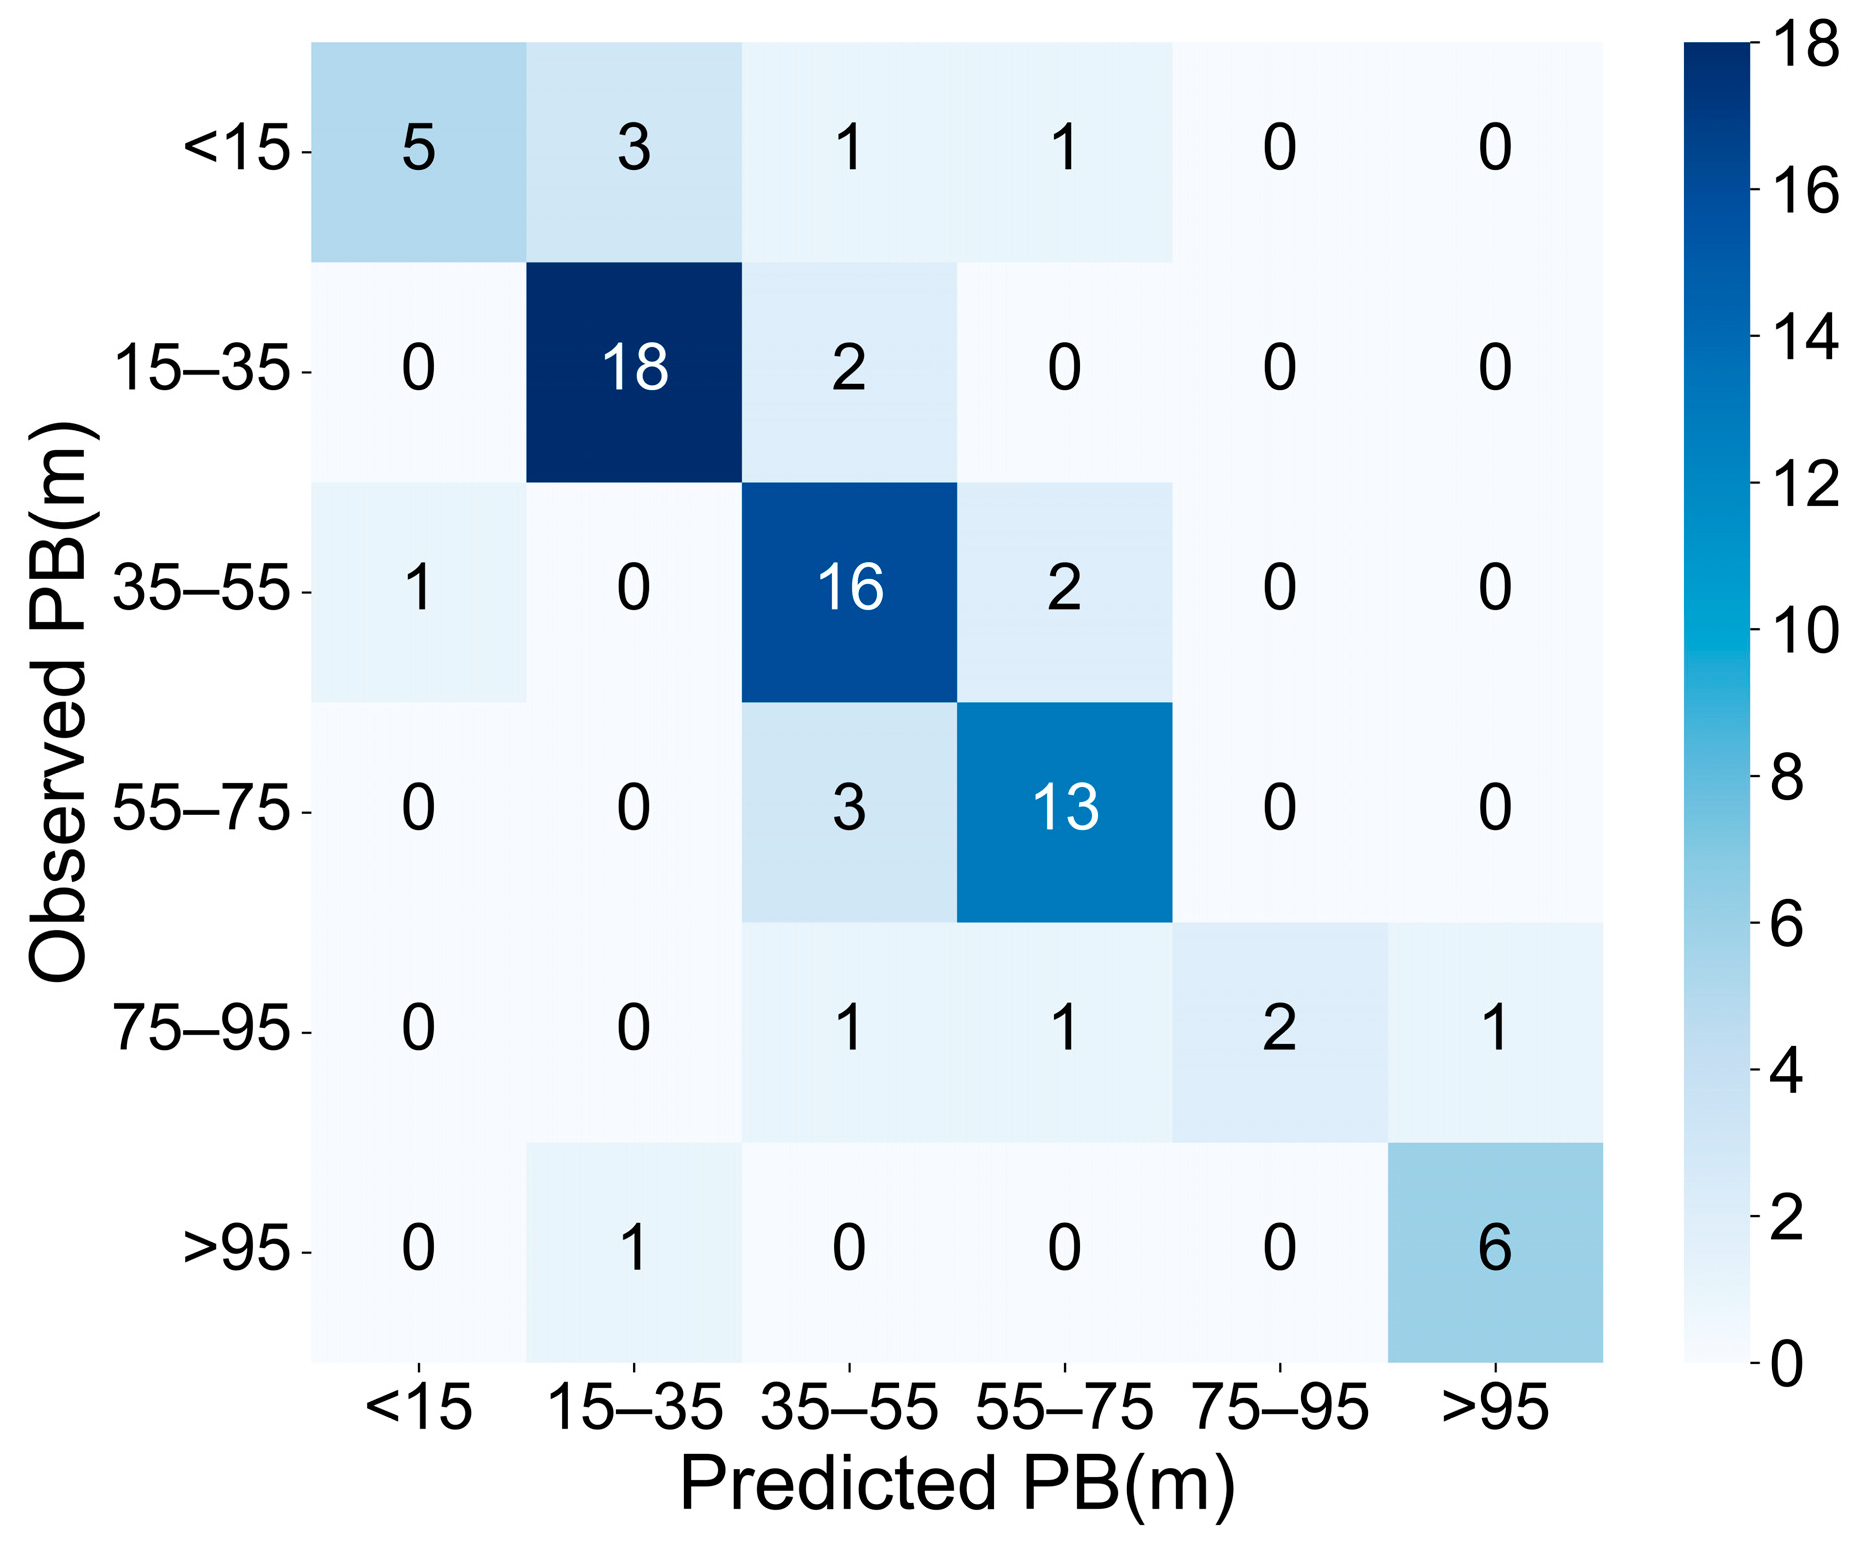
The random forest classification model developed to simulate the thickness distribution of permafrost in Northeast China shows strong prediction ability, and the overall classification accuracy reaches 0.77 through the synergistic fusion of the geothermal gradient model and the environmental similarity model.
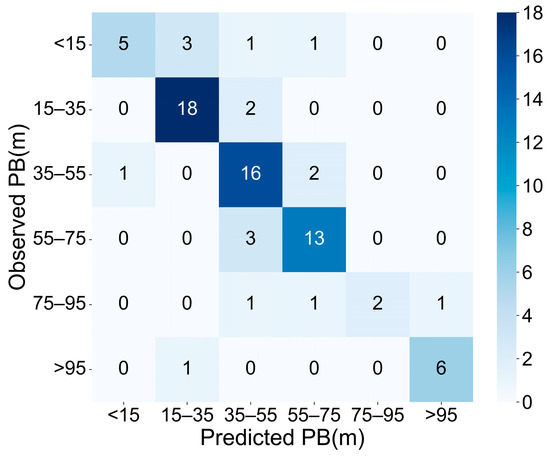
Figure 4 presents the confusion matrix comparing predicted and observed permafrost thickness values, visually demonstrating a high degree of agreement between the two sets of results. The predictions exhibited slight underestimations at high permafrost thickness values and overestimations at lower ones.
Figure 4.
Confusion matrix between predicted and observed permafrost thickness in Northeast China. The matrix displays the counts of observations falling into each combination of predicted and actual permafrost thickness categories. Diagonal elements represent correct predictions, while off-diagonal elements indicate misclassifications. The color intensity and the accompanying color bar indicate the frequency of occurrences within each cell, with darker blue representing higher counts.
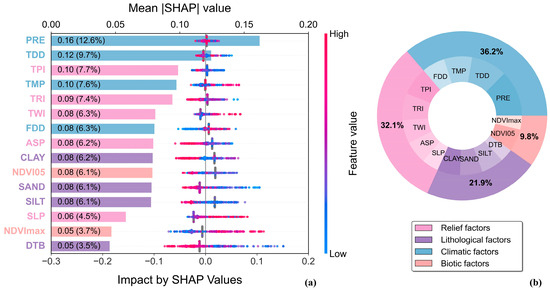
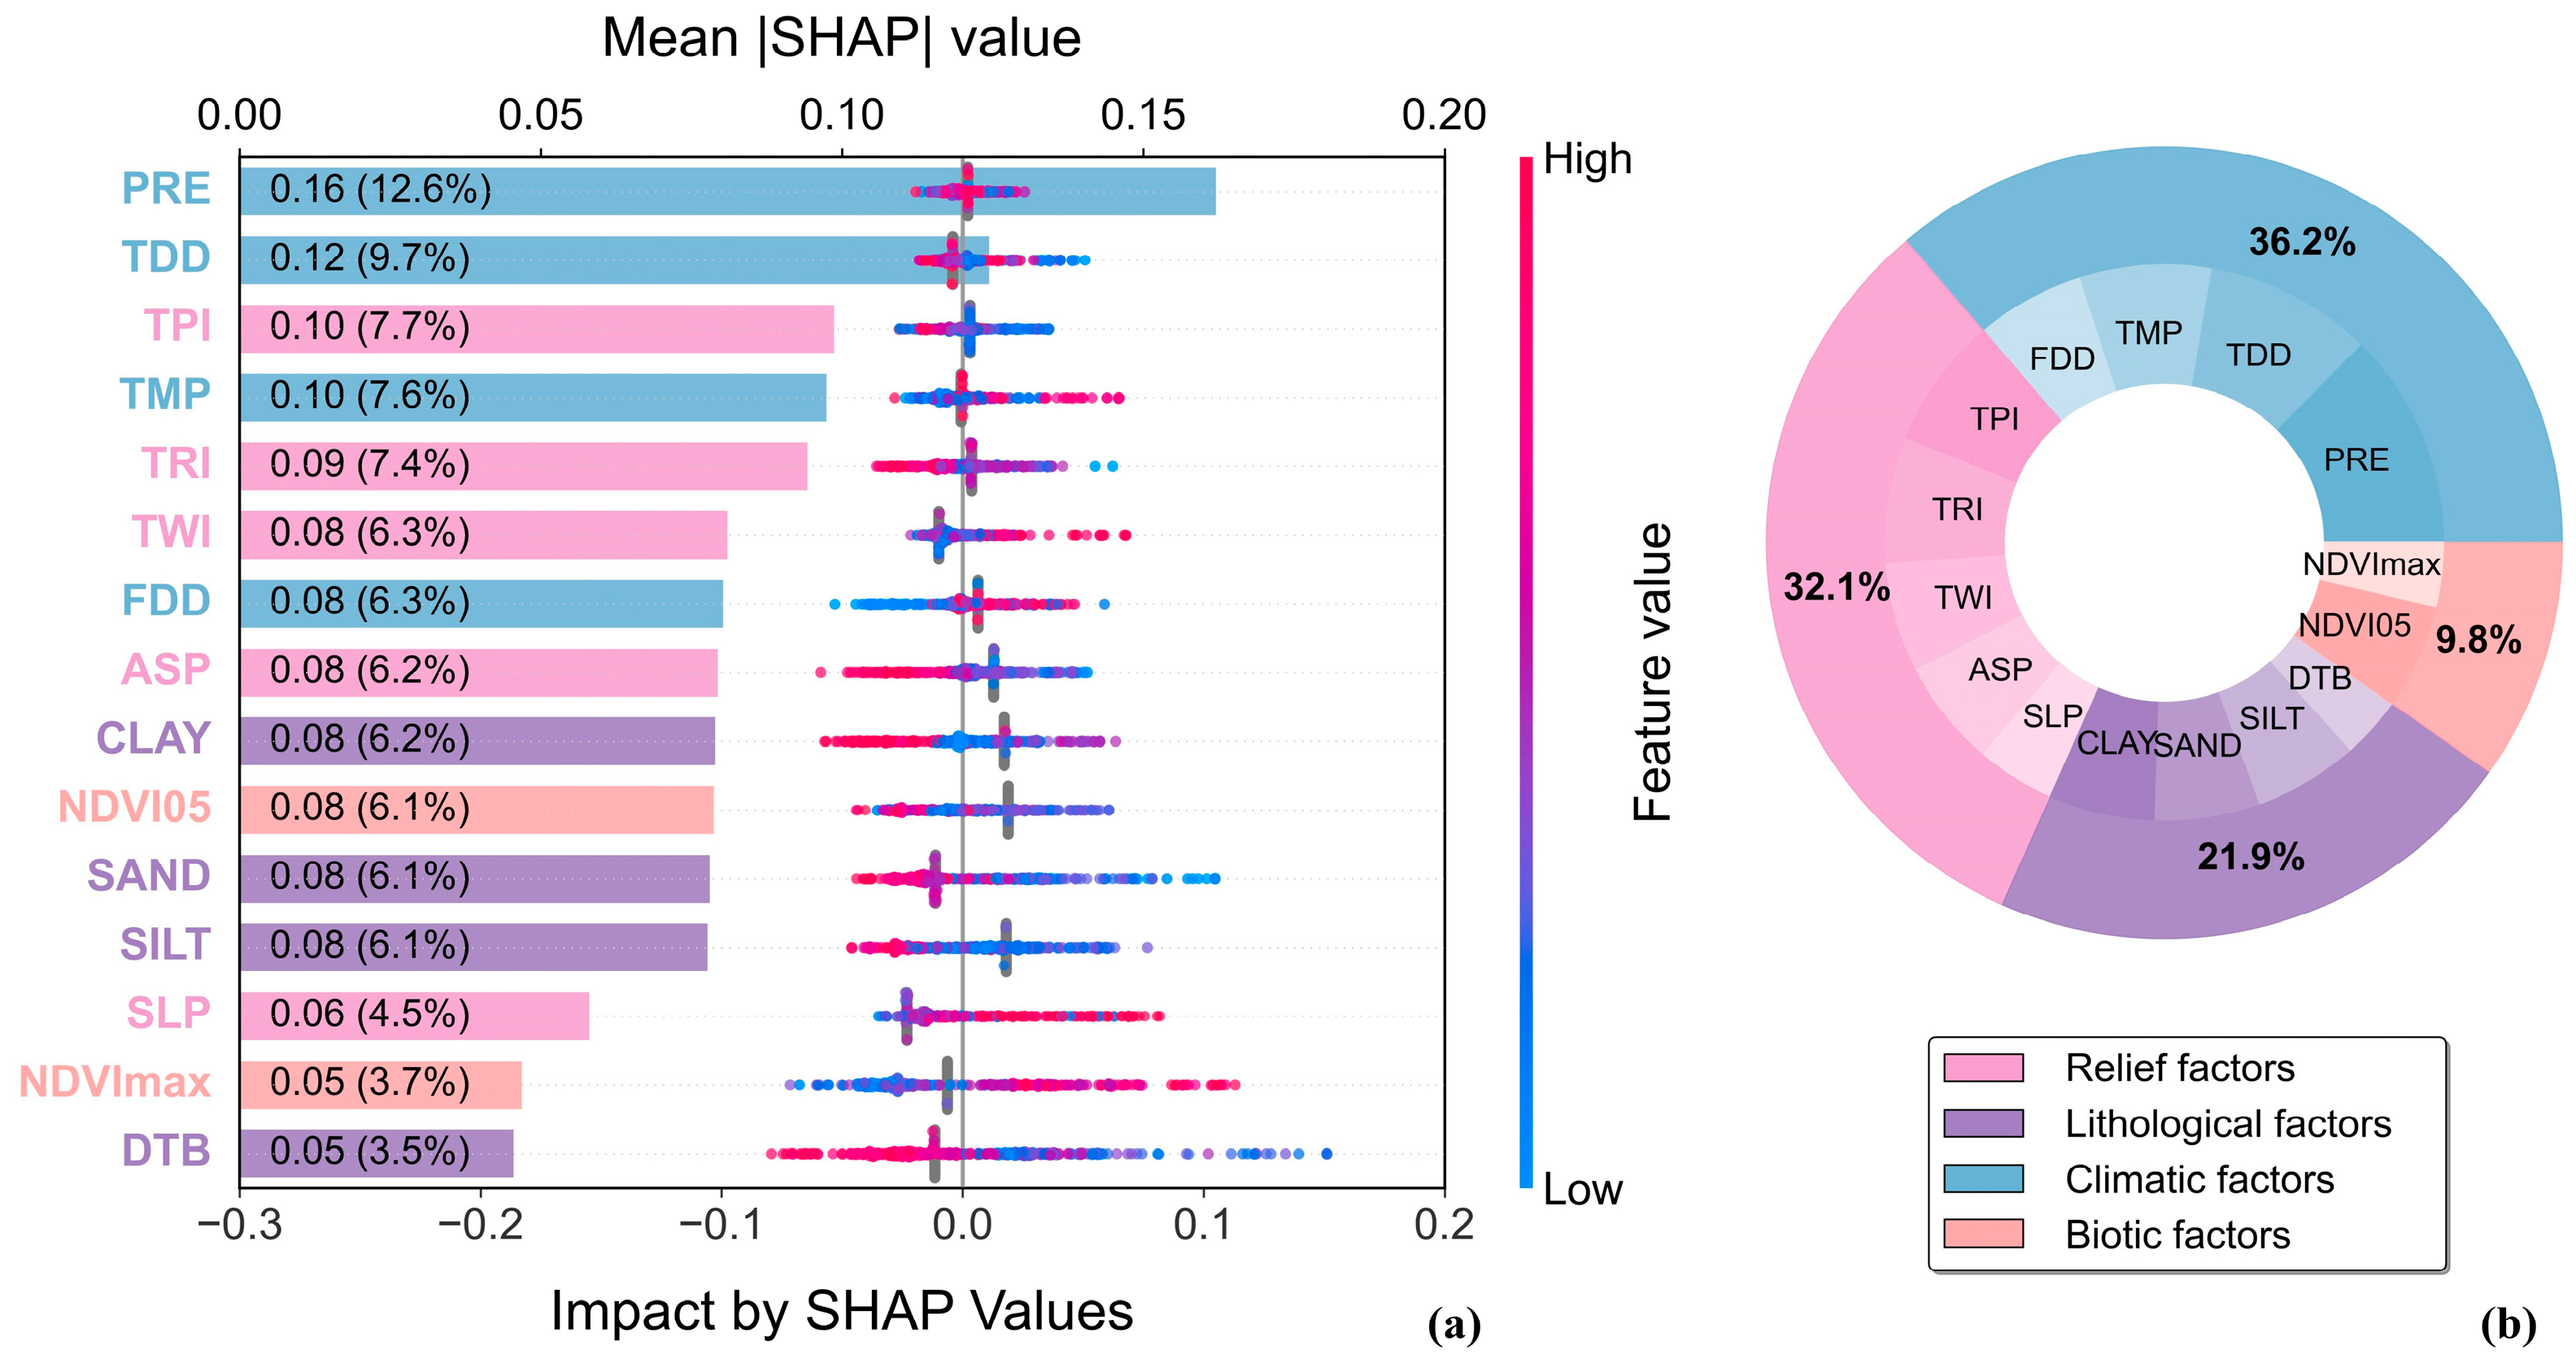
SHAP-based feature importance analysis (Figure 5) demonstrated that PRE, TDD and TPI dominated controls on permafrost thickness variation, whereas the other environmental and climate factors modified this influence at the regional scale.
Figure 5.
SHAP-based interpretation of feature contributions in the RF model. (a) Summary plot of the top-ranked predictors showing their average SHAP values and effect directions. Colors indicate feature values; (b) Grouped contribution analysis based on SHAP values. The inner ring shows individual variable importance, and the outer ring summarizes the relative contributions of four factor categories: relief (pink), lithological (purple), climatic (blue), and biotic (light pink).
3.4. Spatial Distribution Characteristics of Permafrost Thickness
3.4.1. General Characteristics
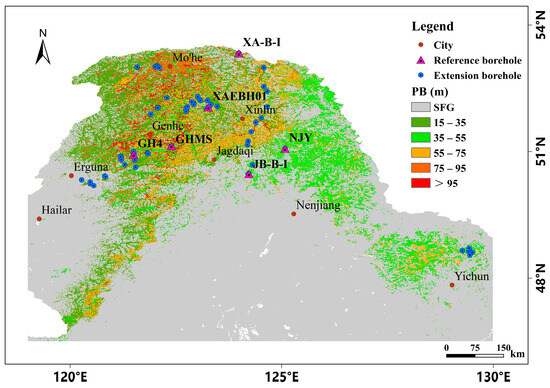
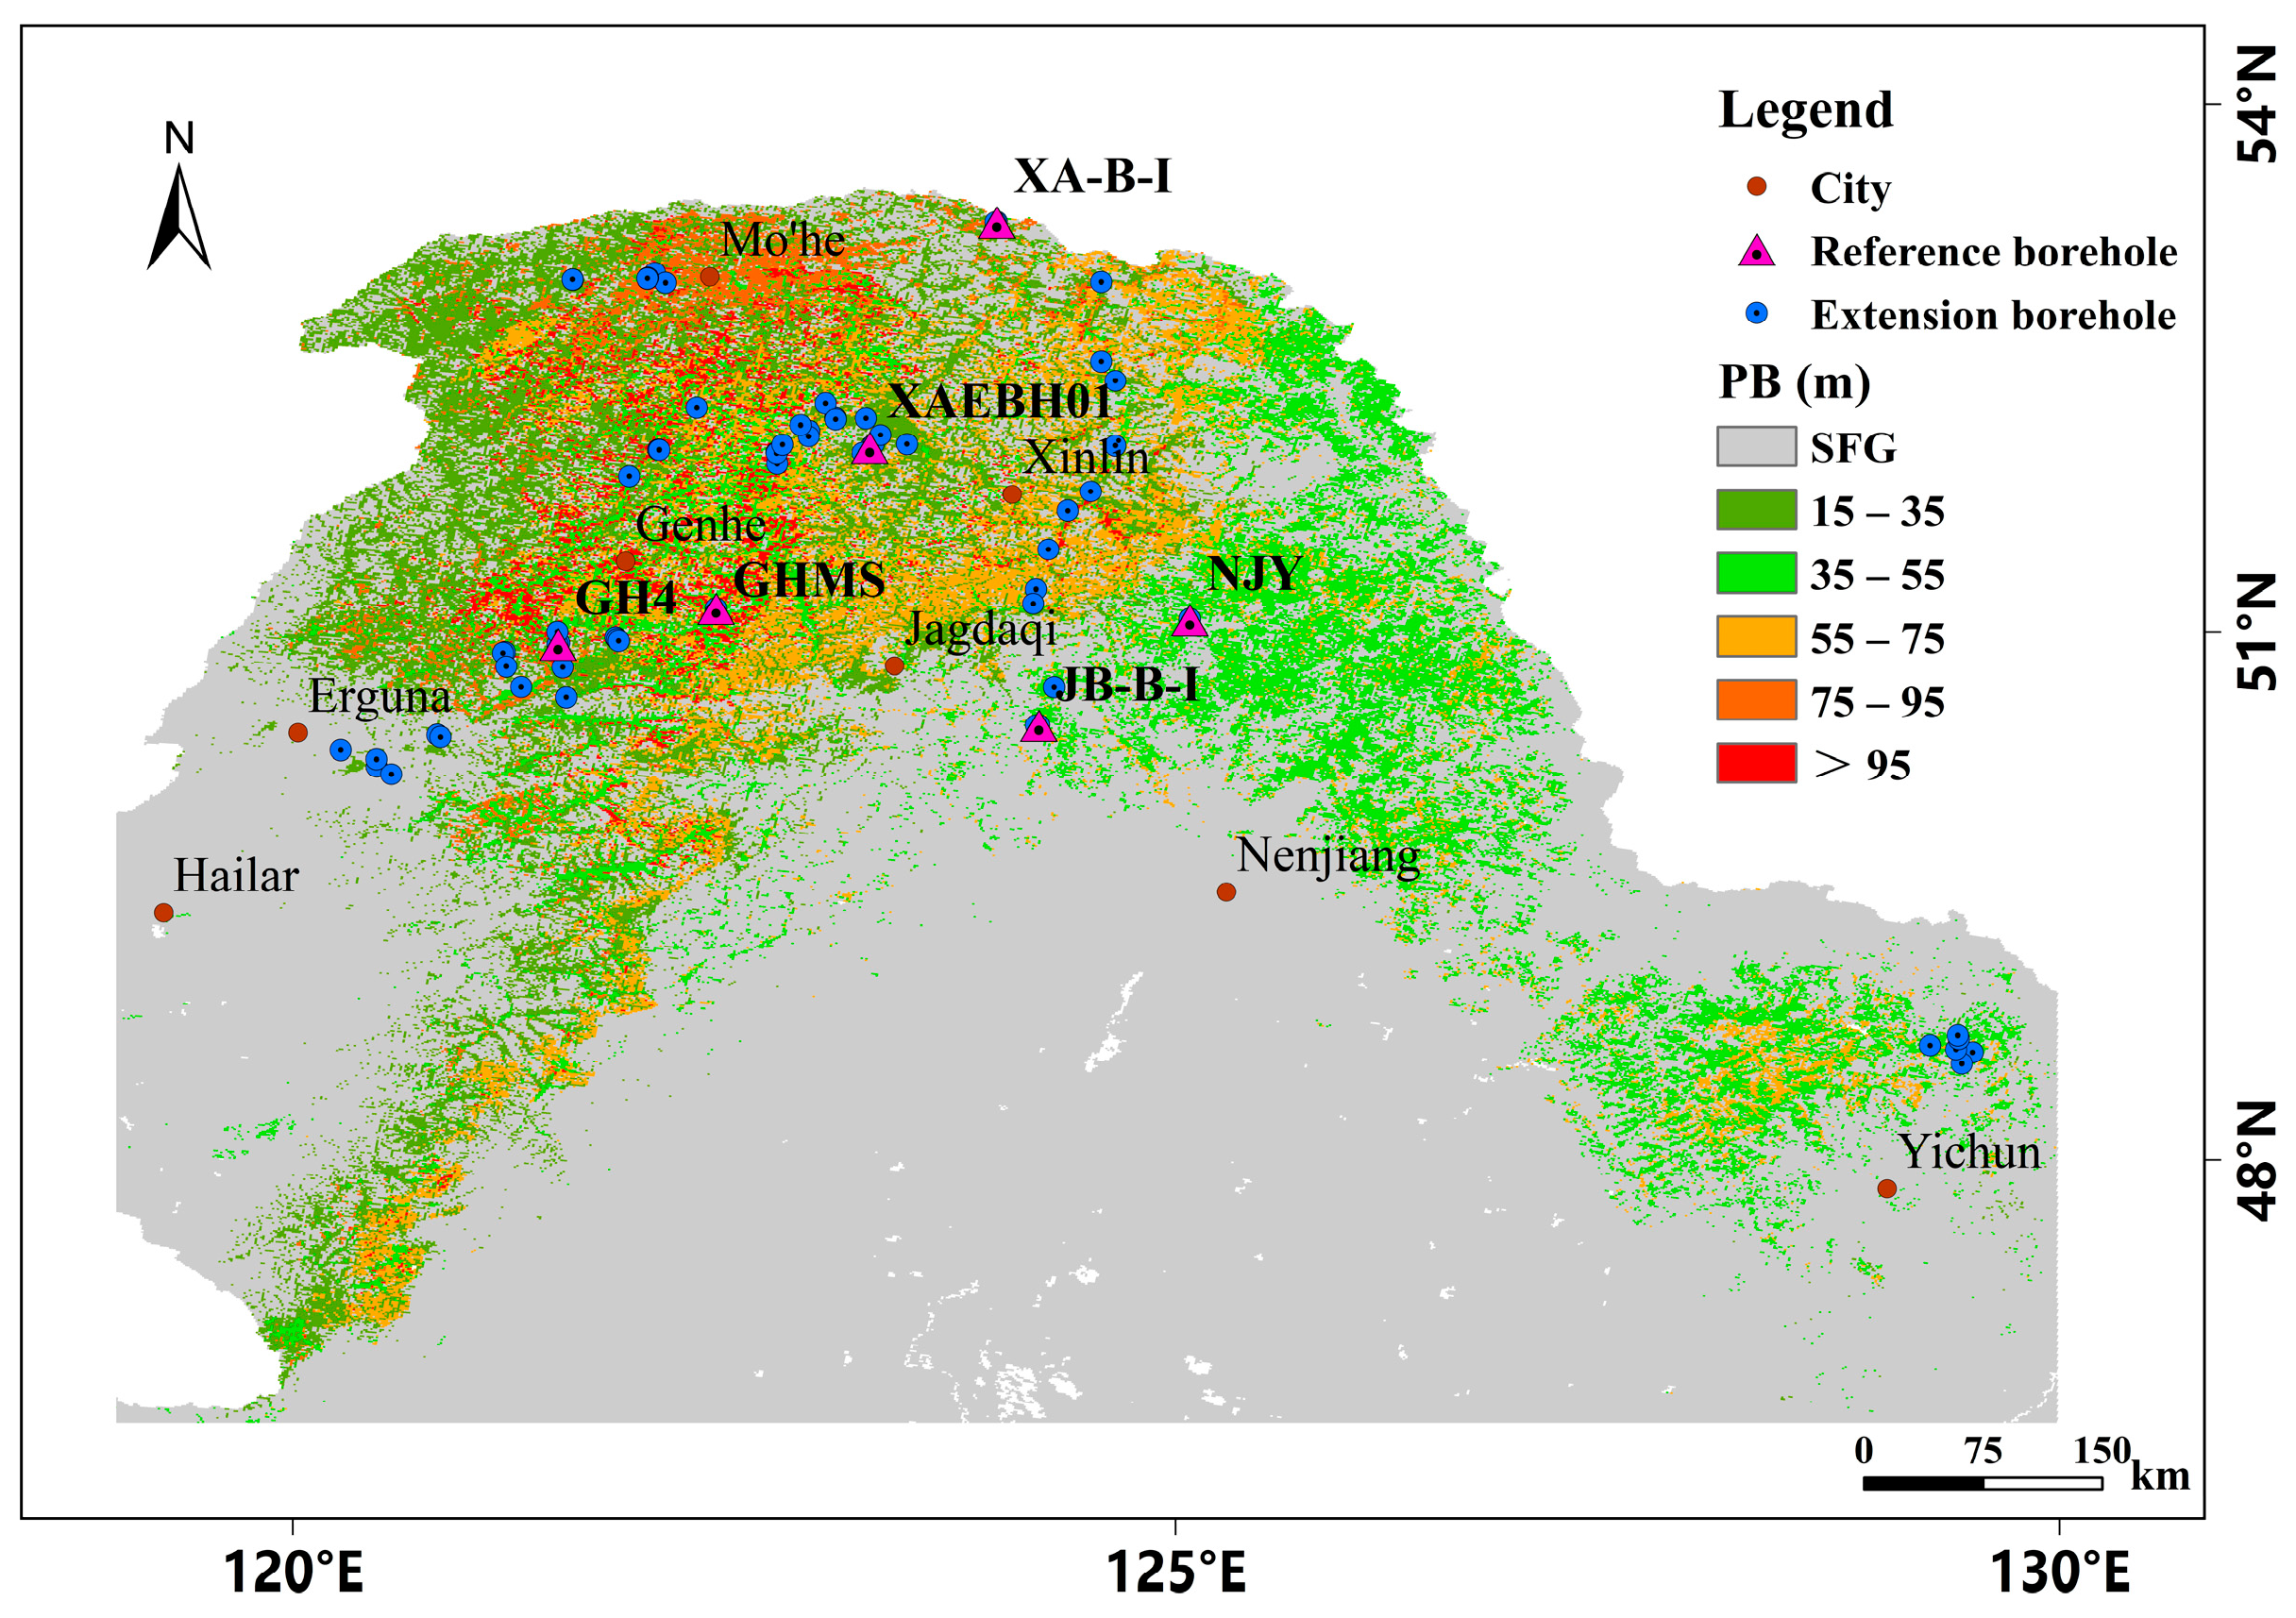
Figure 6 illustrates the spatial distribution patterns of the predicted permafrost thickness in Northeast China. Overall, the permafrost thickness exhibited a general trend of “thicker in the north and thinner in the south; thicker in the west and thinner in the east; thicker in mountainous areas and thinner in plains.” Thick permafrost layers (>75 m), represented by red-orange to dark red colors, are predominantly distributed in the northern Greater Khingan Mountains, particularly near the core mountainous regions, reflecting the combined influence of higher latitudes and colder climatic conditions. In contrast, thin permafrost layers (15–35 m), depicted in light green, are primarily concentrated in the southern and eastern margins of the study area, including parts of northern Inner Mongolia and the Lesser Khingan Mountains, where relatively warmer temperatures and lower elevations prevail. Intermediate thicknesses (35–75 m) transitionally occupy areas between these extremes, showing a gradual spatial progression aligned with the regional thermal and topographic gradients. This distribution pattern underscores the dominant controls of latitude, altitude, and local terrain on permafrost thickness variability across the region.
Figure 6.
Spatial distribution map of permafrost thickness in Northeast China.
The regions of permafrost covered an area of 1.32 × 10⁵ km2, accounting for approximately 18.76% of the total area of the Greater and Lesser Khingan Mountains. The average permafrost thickness is 47.71 ± 10 m. Permafrost thickness zoning statistics indicate that the area with permafrost thickness ranging from 15 to 35 m covered 4.67 × 10⁴ km2, accounting for 6.65% of the entire northeastern region. Areas with permafrost thicknesses of 35–55 m, 55–75 m, and 75–95 m covered 4.23 × 10⁴ km2, 2.86 × 10⁴ km2, and 0.65 × 10⁴ km2, respectively, representing 6.02%, 4.08%, and 0.93% of the total area. The area with permafrost thickness exceeding 95 m was 0.76 × 10⁴ km2, accounting for 1.09% of the total area.
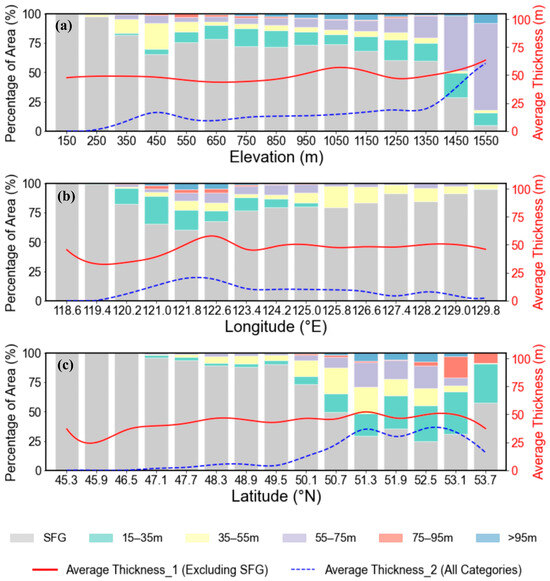
The spatial variations of permafrost thickness across Northeast China were analyzed along three geographical dimensions: elevation, longitude and latitude. Figure 7a illustrates the distribution of permafrost thickness at different elevations and the percentage of area. Area analysis reveals that approximately 60% of the permafrost thickness values increased in the elevation range of 500 to 1100m a.s.l. Generally, permafrost thickness demonstrated an increasing trend as elevation increased, but began to decrease once elevation surpassed 1100 m a.s.l. Meanwhile, the lapse rate of permafrost thickness was relatively low at lower elevations and increased as the elevation rose.
Figure 7.
Variations of permafrost thickness along elevation (a), longitude (b), and latitude (c) transects in Northeast China (the solid red line represents average permafrost thickness calculated excluding seasonally frozen ground, blue dashed line represents average permafrost thickness calculated across all categories, and the histogram represents the percentage of area). The average thickness for each category was calculated using the area-weighted average formula (Equation (9)).
The permafrost thickness in the west-to-east longitudinal direction increased, then decreased (Figure 7b). The highest average permafrost thickness occurs in the Greater Khingan Mountains (e.g., approximately 60 m in the longitude range of 121 to 123°E), representing the core area of the Greater Khingan Mountains. Conversely, the lowest permafrost thickness values were found in the westernmost regions.
Figure 7c illustrates the permafrost thickness trend in the latitudinal transect. The regional average permafrost thickness generally increased, with the highest values occurring near 51.3°N. These are primarily found in the northern part of the Greater Khingan Mountains and the adjacent northern section of the Lesser Khingan Mountains. These areas represent the coldest regions of Northeast China during winter, where permafrost is most extensive and deepest. The lowest permafrost thickness values occur near 45°N [6,54,55,56], a latitude that roughly delineates the southern boundary of permafrost in Northeast China. South of this latitude, climatic conditions are insufficient to sustain permafrost, with the region primarily characterized by seasonally frozen ground.
3.4.2. Permafrost Thickness Variation with Physiographic Factors
Due to the predominant mountainous terrain of the Greater and Lesser Khingan Mountains, and based on the results of the shape feature importance analysis where physiographic factors ranked as the second most significant factor, we utilized slope, aspect and topographic position index as physiographic indicators to assess the spatial distribution characteristics of the permafrost thickness. Considering the slope distribution pattern within the study areas, we aggregated the slope gradients into four classes: flat (slope < 2°), gentle (2 to 8°), moderate (8 to 17°), and steep (>17°) [57]. Aspect was classified into eight categories, each spaced at 45° intervals. Terrain position index was categorized into three types: valley (TPI < −0.5), flat land (−0.5 < TPI < 0.5), and ridge (TPI > 0.5). For statistical analysis, each permafrost thickness category was represented by its midpoint value.
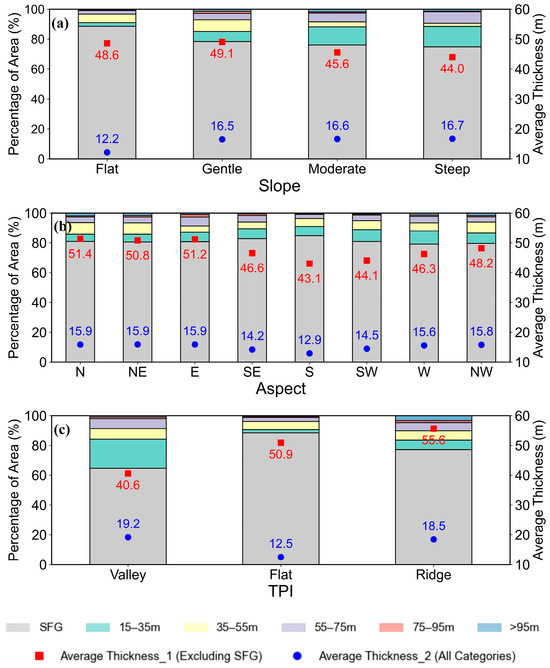
Figure 8a demonstrates an inverse relationship between slope gradient and permafrost thickness, with maximum mean thickness (49.1 m) occurring on gentle slopes, contrasting with minimum values (44.0 m) on steep slopes. This trend indicates that within the study area, gentle topography generally favors the formation and maintenance of thicker permafrost layers, whereas steeper slopes tend to result in thinner permafrost.
Figure 8.
The mean permafrost thickness for different slope gradients (a), aspect (b), and topographic position index (c) in Northeast China (the red squares represent average permafrost thickness calculated excluding seasonal frozen ground, blue dots represent average permafrost thickness calculated across all categories, and the histogram represents the percentage of area). The average thickness for each category was calculated using the area-weighted average formula (Equation (8)).
Additionally, slope aspect is a key factor influencing permafrost thickness. As depicted in Figure 8b, north-facing slopes, which receive less direct solar radiation (shaded slopes), experience lower surface heat gain and consequently maintain relatively cooler ground temperatures. This leads to a greater average permafrost thickness on these slopes. Conversely, south-facing slopes (sunny slopes) receive higher solar radiation, resulting in increased ground temperatures and potentially thinner permafrost.
TPI reveals a more complex topographic influence. Figure 8c indicates that permafrost in ridge environments exhibits a mean thickness of 55.6 m, which is significantly higher than that observed in flat environments (mean thickness of 50.9 m). This finding underscores the combined influence of topographic features on permafrost thermal regimes. It is important to note that the average permafrost thickness calculations in Figure 8 consider both SFG and permafrost layers (indicated by “Average Thickness_2,” blue dots), as well as excluding SFG and focusing on defined permafrost thickness classes (indicated by “Average Thickness_1,” red squares).
4. Discussion
4.1. Model Performance and Limitations
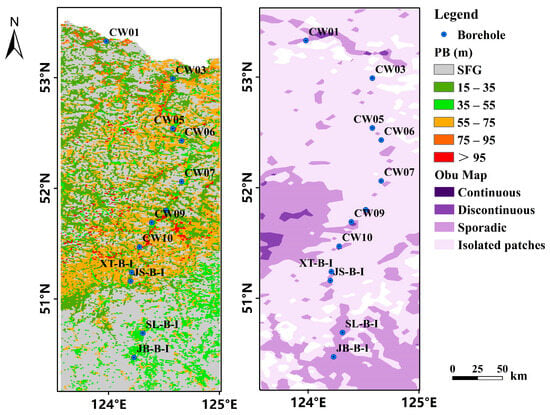
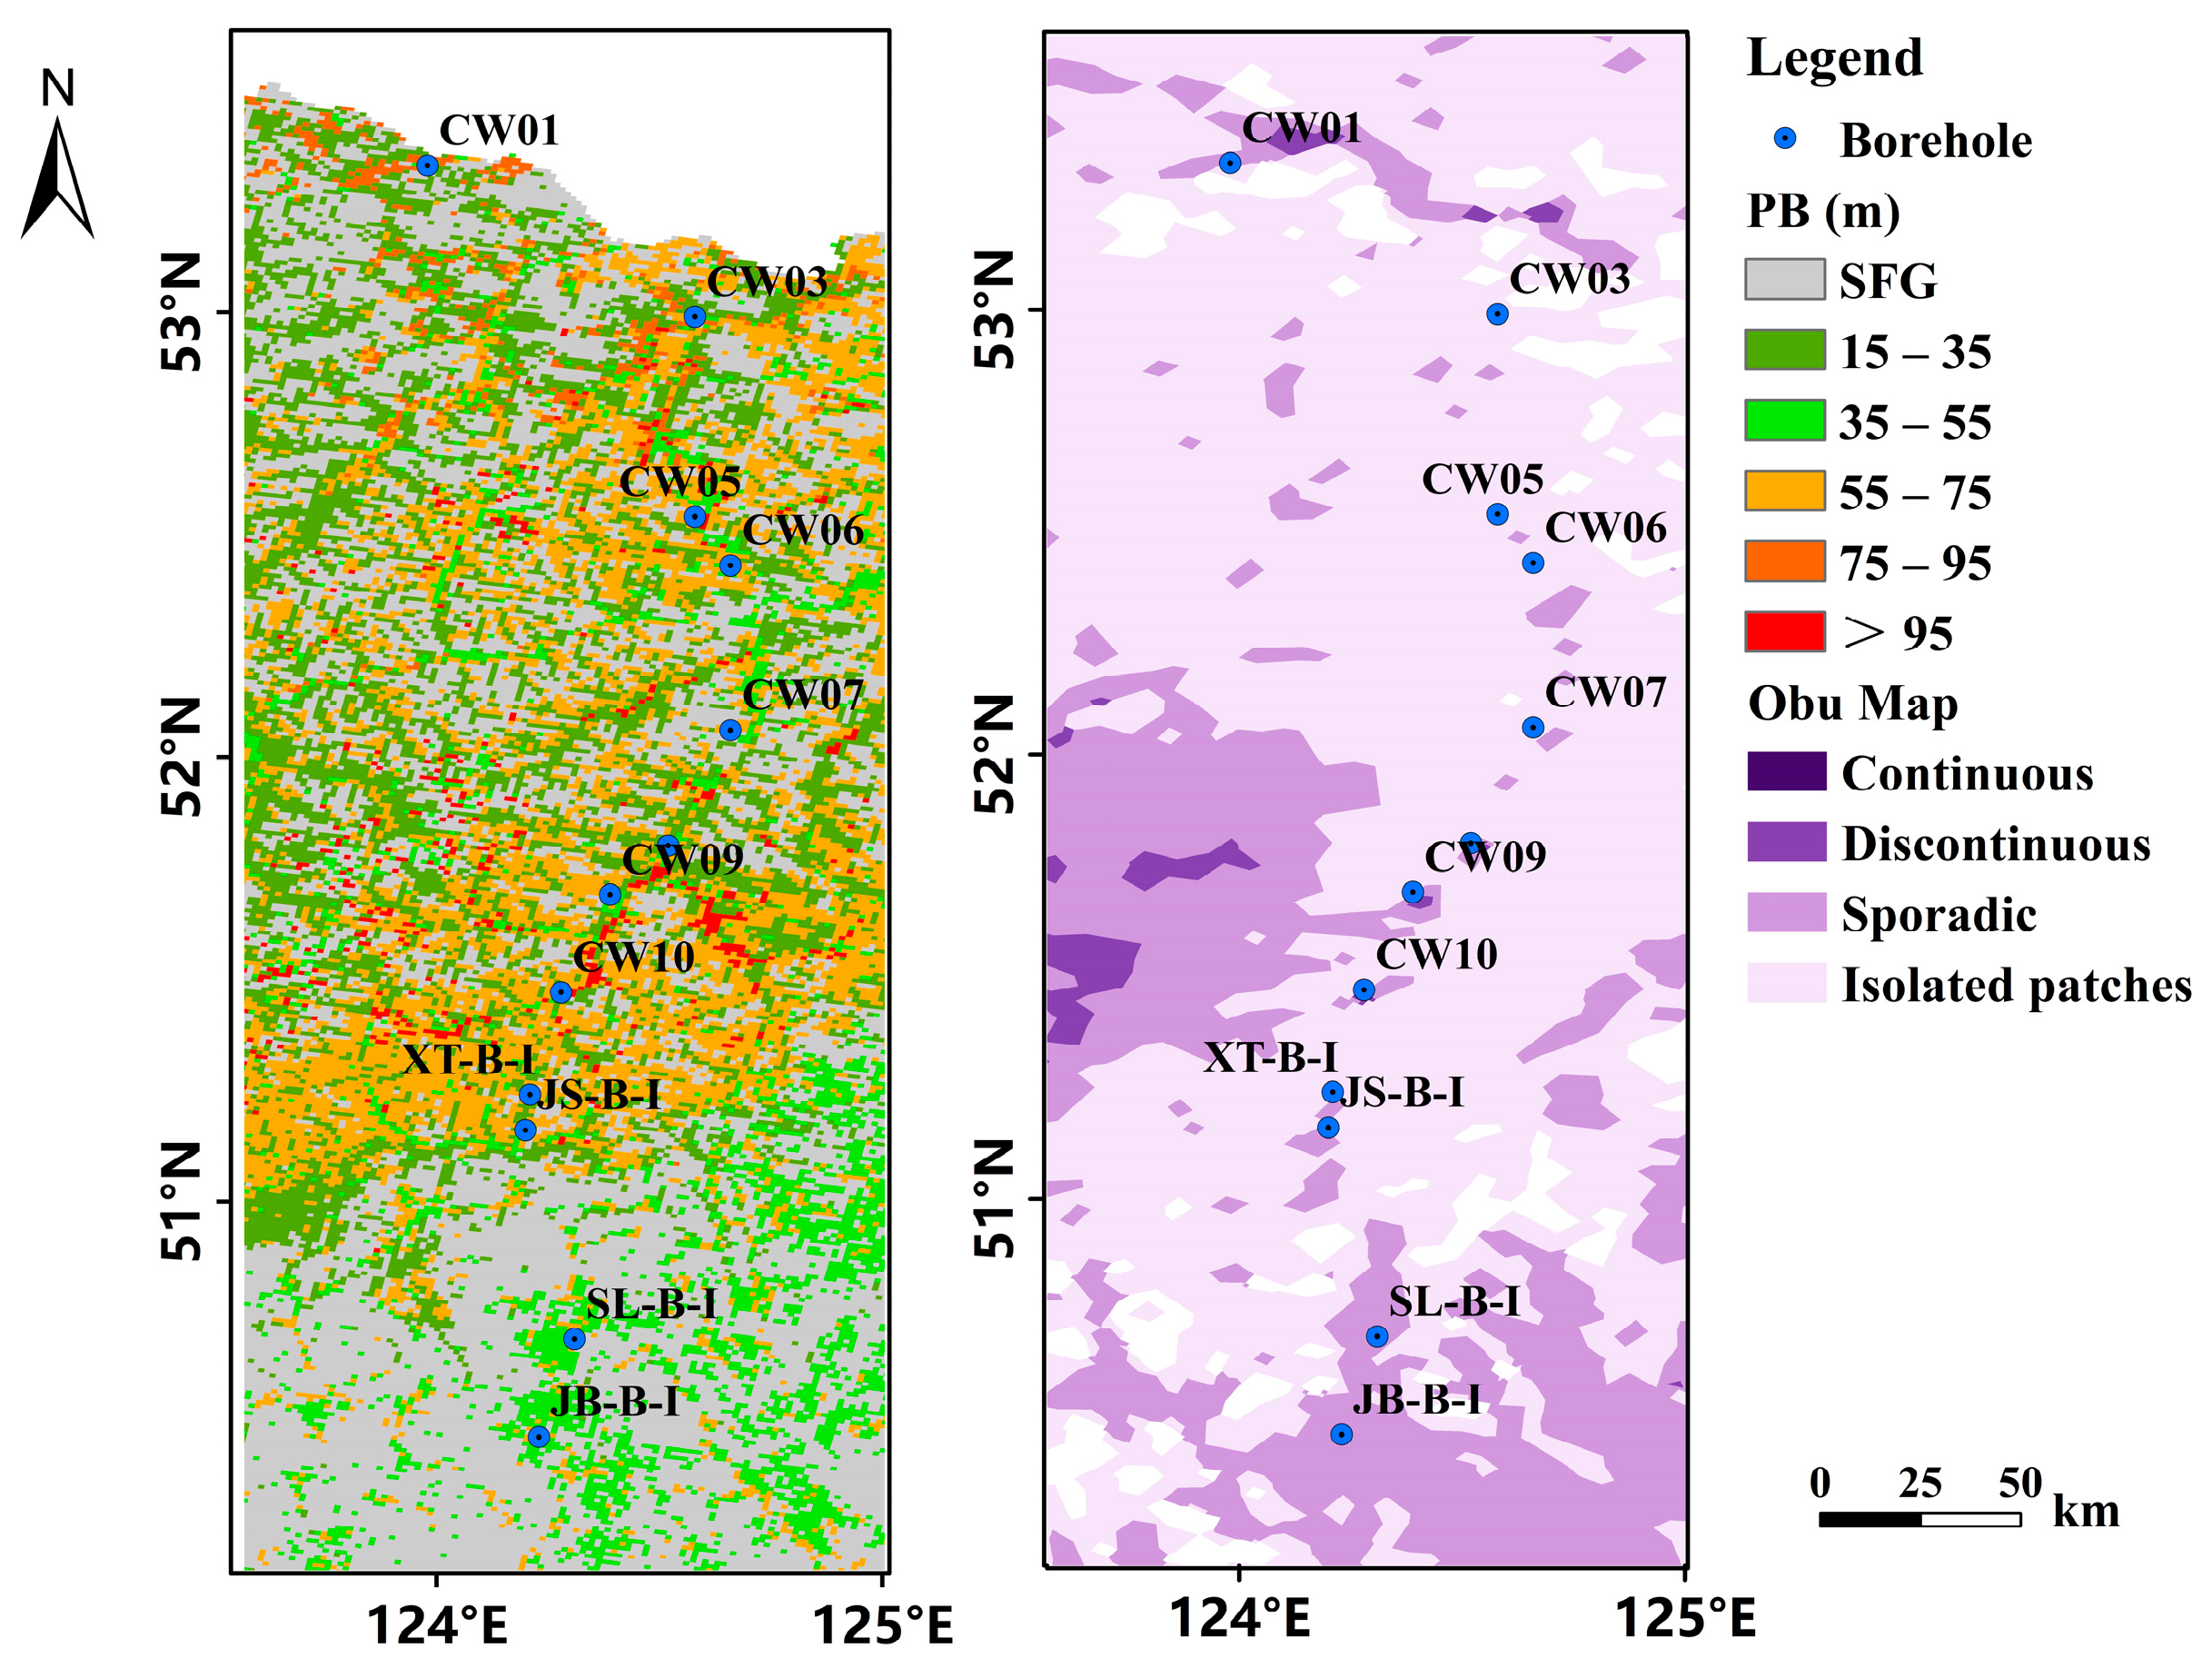
The simulated permafrost distribution patterns (Figure 7 and Figure 8) show general agreement with expected topography-hydrogeological interactions and field investigation results. To quantitatively assess model accuracy, we conducted a comprehensive evaluation incorporating comparisons with data from 12 pipeline-adjacent boreholes [35,40] and the OBU permafrost map [14]. Specifically, 91.7% of measurements in areas classified as Isolated patches and Discontinuous permafrost zones by the OBU classification [14] align with our predictions. This performance suggests an improvement over traditional “Sporadic” categorization systems in its ability to capture the complexity of thin-layer permafrost. The borehole-based analysis supports the framework’s applicability, particularly its capacity to resolve microscale permafrost discontinuities that are often undetectable by conventional classification schemes, despite the inherent single-point validation limitations. Figure 9 visually underscores this enhanced resolution by comparing our predicted permafrost thickness distribution with the broader classification of the OBU map, clearly highlighting the finer-scale variability captured by our approach, especially in regions with thin-layer permafrost. Table 4 further illustrates these comparisons, detailing individual borehole data and showing how our results provide more nuanced thickness ranges than the OBU map categories.
Figure 9.
Comparison of predicted permafrost thickness with the OBU map [14] in Northeast China, with borehole locations overlaid. The left panel displays the permafrost thickness distribution predicted by our model, where colors represent different thickness ranges: SFG (grey), 15–35 m (green), 35–55 m (light green), 55–75 m (orange), 75–95 m (reddish-orange), and >95 m (red). The right panel shows the permafrost distribution based on the OBU map [14], categorizing permafrost into Continuous (dark purple), Discontinuous (medium purple), Sporadic (light purple), and Isolated patches (white). Blue dots indicate the locations of boreholes, including the CW series, XT-B-I, JS-B-I, SL-B-I, and JB-B-I [40]. This figure highlights the finer-scale variability in permafrost thickness captured by our approach compared to the broader classification of the OBU map, particularly in regions with thin-layer permafrost.
Table 4.
Comparison between predicted and estimated permafrost thickness.
While the proposed permafrost thickness estimation framework exhibits robust predictive performance in the Greater and Lesser Khingan Mountains, several limitations warrant attention.
First, the reliance on geothermal gradient data from six reference boreholes, though strategically distributed across major terrain units, provides insufficient spatial density to fully capture subsurface heterogeneity in permafrost thermal regimes. Second, the principle of environmental similarity underpinning the geothermal gradient model (“similar environments correspond to similar geothermal gradients” [50]) oversimplifies complex thermogeological controls. Critically, the spatial heterogeneity of local geothermal heat flow (GHF), which dictates the lower boundary condition of the permafrost base, was not explicitly parameterized in the current framework. While we considered geothermal gradients from boreholes, the lack of a continuous GHF map means that deep heat sources, driven by crustal thickness, radioactive heat production, or tectonic activities, are treated as implicitly uniform or solely dependent on surface similarity. This omission may lead to significant misestimates in areas where high heat flow promotes basal thawing, regardless of surface cooling conditions.” Third, high spatiotemporal variability in surface factors (e.g., vegetation dynamics [58,59,60], snow cover [38], anthropogenic disturbances [61,62,63] and wildfire regimes [64,65]) directly affects surface variables such as NDVI and TPI. The inherent scale mismatch between rapidly changing surface conditions and the lagged response of permafrost thickness may lead to biases in environmental similarity assessments, particularly in areas where land cover undergoes drastic changes. Fourth, the use of climate and vegetation data averaged over multi-year periods or specific time windows means that our predicted permafrost thickness corresponds to the thermal state under a particular “climate-vegetation” average epoch. This approach overlooks the cumulative effects of decadal climate shifts or extreme climatic events on the long-term evolution of permafrost thickness, thus raising questions regarding the temporal representativeness of the predicted permafrost thickness. Finally, scale mismatches between coarse-resolution remote sensing data and localized borehole measurements may amplify prediction errors in critical zones (e.g., ice-rich permafrost or thaw-sensitive slopes).
To address these limitations, future efforts should prioritize multi-source data fusion (e.g., geophysical surveys and high-resolution remote sensing) to refine environmental factor characterization and resolve subsurface complexity. Hybrid modeling frameworks integrating physical constraints (e.g., heat conduction equations) could enhance generalization in data-scarce regions. The structural uncertainty associated with thermophysical properties could be mitigated by adopting scenario-based parameterization strategies or employing Bayesian approaches for parameter perturbation assessment. Additionally, systematic incorporation of transient surface variables (e.g., snow cover fraction and NDVI trends) may improve the representation of local thermal buffering effects.
Despite these challenges, the current framework demonstrates methodological viability for regional permafrost assessment. This work provides critical technical support for permafrost engineering design and resource assessments, while also establishing transferable protocols for application in other data-scarce regions globally.
4.2. Significance of Key Environmental Drivers on Permafrost Thickness
Our SHAP-based feature importance analysis clearly identified precipitation (PRE), thawing degree days (TDDs) and topographic position index (TPI) as the dominant controls on permafrost thickness variation in the Greater and Lesser Khingan Mountains. This finding highlights the crucial role of these local-scale factors in shaping the discontinuous permafrost landscape of northeastern China.
Specifically, increased precipitation enhances soil moisture, promoting vegetation growth and organic matter accumulation. The resulting increase in fine-grained soil particles and organic content strengthens the thermal semiconductor effect, leading to a greater thermal offset that favors permafrost preservation and thickness development. This mechanism is supported by studies such as Zhirkov et al. [66], who demonstrated that high-intensity autumn rainfall elevates soil moisture and ice content, reducing thaw depths through latent heat effects. Their findings further suggest that prolonged wetting trends can induce a cooling effect on the upper permafrost due to altered thermal conductivity and latent heat absorption, thereby enhancing permafrost stability and thickness in localized settings. Similarly, research on the Qinghai-Tibetan Plateau by Fang et al. [67] and Fu et al. [68] highlights that while increased precipitation may sometimes accelerate thawing by shortening the freezing period, it also reinforces soil moisture retention, which in turn promotes ice segregation and permafrost aggradation. Our study extends these insights by quantitatively linking precipitation to permafrost thickness across a broad region, emphasizing its role in sustaining thicker permafrost under favorable moisture and thermal offset conditions.
TDD, as a direct measure of accumulated heat, exerts a strong control on permafrost degradation, yet its interaction with other factors, particularly in discontinuous permafrost zones, remains critical for thickness variability. Higher TDD values indicate prolonged warming conditions, which directly accelerate active layer deepening and permafrost thinning. However, the spatial influence of TDD on permafrost thickness is not uniform, as its effects are often mediated by local moisture availability and vegetation cover. For instance, studies such as Peng et al. [69] have demonstrated that air temperature and ground surface temperature (closely linked to TDD) are negatively correlated with seasonal freeze depth. Our findings align with these observations, showing that TDD is a key determinant of permafrost thickness, particularly in regions where warming trends outpace the buffering effects of precipitation and organic insulation.
Meanwhile, TPI influences permafrost thickness by regulating local-scale water and heat redistribution. Topographic variations determine solar radiation exposure, snow accumulation, and drainage patterns, which collectively affect ground thermal conditions. This topographic modulation of microclimates explains the heterogeneous distribution of permafrost thickness, particularly the occurrence of isolated patches with anomalously thick permafrost amidst generally thinner and discontinuous formations. Previous studies, such as those by Grosse et al. [70] on Arctic permafrost and Kneisel et al. [71] on alpine permafrost, have demonstrated that terrain-induced variations in snow accumulation and drainage efficiency significantly influence ground thermal regimes, leading to localized permafrost aggradation even in warming climates.
The combined effects of precipitation, temperature, and topography create localized feedback loops that govern permafrost thickness. Enhanced soil moisture from precipitation, coupled with cooling from latent heat and thermal offset effects, can counteract warming trends in certain settings, allowing permafrost to persist or even thicken where conditions are favorable. Conversely, in areas with high TDD and poor moisture retention, permafrost thinning dominates. The interplay of these factors underpins the observed “small patches with large permafrost thickness” phenomenon, where microclimatic and hydrological conditions sustain isolated zones of robust permafrost amid a degrading landscape.
4.3. The Role of Altitude in Permafrost Thickness
The role of elevation in permafrost development within the Da Xing’anling Region has long been debated, with some studies suggesting limited altitudinal influence [72,73,74]. Our investigation into permafrost distribution within the study area has revealed a compelling pattern of increasing thickness with rising elevation, with an average permafrost thickness of 47.71 ± 10 m. The observed distribution demonstrates distinct heterogeneity, with “thicker permafrost in the north and west, thinner in the south and east, and greater in mountainous areas than in plains” (Figure 6). This pattern reveals critical elevation-dependent controls that previous borehole-based studies might have undercharacterized [72,73,74].
Detailed analysis of topographic controls demonstrates a nonlinear relationship between elevation and permafrost thickness. Below 1350 m a.s.l., permafrost thickness shows minimal elevation dependence, potentially due to thicker unconsolidated deposits and stronger moisture-mediated local controls that buffer thermal responses. However, beyond this altitudinal threshold, we observe accelerated thickening as shown in Figure 8a. This threshold effect corresponds with reduced overburden thickness, diminished hydrological influence, and enhanced atmospheric coupling conditions that amplify permafrost sensitivity to elevational temperature gradients.
Our findings align with refined previous mountain permafrost concepts. While Wu et al. [75] hypothesized colder, thicker permafrost at higher Qinghai-Tibet Plateau elevations, their limited high-altitude sampling parallels the historical undersampling above 1350 m in our study area. The 1350 m threshold identified here explains why earlier surveys confined to ridge tops [76] underestimated elevational controls—they seldom penetrated the critical elevation band where permafrost thickening becomes pronounced. Figure 8b,c substantiates this through spatial concordance between thick permafrost and high-elevation zones (>1350 m) in the western Greater Khingan Mountains, contrasting sharply with thin lowland permafrost.
Notably, the observed thinning of permafrost thickness above 1350 m (Figure 7a) deviates from the typical high-mountain pattern [77], indicating a unique altitude constraint mechanism in continental mountain environments—potentially related to the diminished insulating effect of precipitation-driven snowpack at summit elevations.
Our proposed altitudinal threshold effect, therefore, illuminates potential biases in previous research and highlights the novelty and significance of the current study. This work emphasizes that a comprehensive understanding of permafrost distribution necessitates detailed investigations in high-altitude areas, specifically focusing on reaching and surpassing observed altitudinal thresholds, to more thoroughly elucidate the formation mechanisms and spatial patterns of permafrost across diverse geographical contexts.
5. Conclusions
This study generated spatially continuous permafrost thickness estimates at a spatial resolution of nearly 1 km in the Greater and Lesser Khingan Mountains of Northeast China for the first time through a three-stage framework: geothermal gradient modeling using deep boreholes, permafrost thickness inversion from shallow boreholes, and spatial extrapolation via a random forest model (overall classification accuracy is 0.74). The regions of permafrost covered an area of 1.32 × 10⁵ km2 (excluding glacier and lake areas), accounting for approximately 18.76% of the total area of the Greater and Lesser Khingan Mountains. The average permafrost thickness is 47.71 ± 10 m, exhibiting a spatial pattern of “thicker in the north and west, thinner in the south and east, and greater in mountainous areas than in plains.” Further analysis revealed that precipitation played a dominant role in permafrost thickness variability, followed by surface thaw index and topographic position index. Physiographic factors, including slope gradient, aspect, and topographic position index, also demonstrably influenced permafrost thickness. Generally, gentler slopes and shaded aspects (e.g., north-facing) were associated with greater permafrost thickness, while steeper slopes and sunnier aspects tended to exhibit thinner permafrost. Ridge environments also generally supported thicker permafrost compared to flat terrain. This moisture-driven regime, coupled with topographic influences, explains the characteristic “small patches with great thickness” configuration of discontinuous permafrost in the region, where local heterogeneity creates sharp thickness contrasts over short distances. This comprehensive framework provides a new methodology for the assessment of deep geothermal characteristics in areas lacking extensive borehole observations, and offers important reference and data support for scientific research and infrastructure construction in high-latitude permafrost regions of Northeast China and even the northern hemisphere.
Author Contributions
Conceptualization, Y.L., G.L. and L.Z.; methodology, Y.L. and G.L.; formal analysis, Y.L. and G.L.; writing—original draft preparation, Y.L. and G.L.; writing—review and editing, Y.X., D.Z., E.D., X.J. and J.X.; supervision, L.Z.; funding acquisition, L.Z. and G.H. All authors have read and agreed to the published version of the manuscript.
Funding
This research was funded by the Basic Resources Survey Program of the Ministry of Science and Technology of China, grant numbers 2022FY100704 and 2022FY100702. The APC was funded by the Basic Resources Survey Program of the Ministry of Science and Technology of China.
Data Availability Statement
The raw data supporting the conclusions of this article will be made available by the authors on request.
Acknowledgments
We would like to express our gratitude to all of the teachers and students for their fieldwork contributions in collecting valuable in situ data during the fieldwork in Northeast China.
Conflicts of Interest
The authors declare no conflicts of interest. The funders had no role in the design of the study; in the collection, analyses, or interpretation of data; in the writing of the manuscript; or in the decision to publish the results.
References
- van Everdingen, R.O. Multi-Language Glossary of Permafrost and Related Ground-Ice Terms; National Snow and Ice Data Center: Boulder, CO, USA, 2005. [Google Scholar]
- Hjort, J.; Karjalainen, O.; Aalto, J.; Westermann, S.; Romanovsky, V.E.; Nelson, F.E.; Etzelmüller, B.; Luoto, M. Degrading permafrost puts Arctic infrastructure at risk by mid-century. Nat. Commun. 2018, 9, 5147. [Google Scholar] [CrossRef] [Scilit] [PubMed]
- Biskaborn, B.K.; Smith, S.L.; Noetzli, J.; Matthes, H.; Vieira, G.; Streletskiy, D.A. Permafrost is warming at a global scale. Nat. Commun. 2019, 10, 264. [Google Scholar] [CrossRef] [Scilit]
- Schuur, E.A.G.; McGuire, A.D.; Schädel, C.; Grosse, G.; Harden, J.W.; Hayes, D.J.; Hugelius, G.; Koven, C.D.; Kuhry, P. Climate change and the permafrost carbon feedback. Nature 2015, 520, 171–179. [Google Scholar] [CrossRef] [Scilit] [PubMed]
- Jin, H.; Sun, G.; Yu, S.; Jin, R.; He, R. Symbiosis of marshes and permafrost in Da and Xiao Hinggan Mountains in northeastern China. Chin. Geogr. Sci. 2008, 18, 62–69. [Google Scholar] [CrossRef] [Scilit]
- Jin, H.; Yu, Q.; Lü, L.; Guo, D.; He, R.; Yu, S.; Sun, G.; Li, Y. Degradation of permafrost in the Xing’anling Mountains, Northeastern China. Permafr. Periglac. Process. 2007, 18, 245–258. [Google Scholar] [CrossRef] [Scilit]
- Jin, H.; Wang, S.; Lü, L.; Yu, S. Features of permafrost degradation in Hinggan Mountains, Northeastern China. Sci. Geogr. Sin. 2009, 29, 223–228. [Google Scholar]
- Hou, Y.; Liu, M.; Zhao, C.; Wang, T. A study on the consistency and local characteristics of temperature evolution in Northeast China. J. Meteorol. Environ. 2019, 35, 69–76. [Google Scholar]
- Liu, G.; Wang, W.; Zhao, L.; Chen, J.; Pang, Q.; Wang, Z.; Du, E. Using transient electromagnetic method to sound permafrost depth in the West Kunlun Mountains. J. Glaciol. Geocryol. 2015, 37, 38–48. [Google Scholar]
- Cheng, G.; Zhao, L. The problems associated with permafrost in the development of the Qinghai-Xizang Plateau. Quat. Sci. 2000, 20, 521–531. [Google Scholar]
- Nelson, F.E.; Anisimov, O.A.; Shiklomanov, N.I. Subsidence risk from thawing permafrost. Nature 2001, 410, 889–890. [Google Scholar] [CrossRef] [Scilit] [PubMed]
- Zhang, T.; Frauenfeld, O.W.; Serreze, M.C.; Etringer, A.; Oelke, C.; McCreight, J.; Barry, R.G.; Gilichinsky, D.; Yang, D.; Ye, H. Spatial and temporal variability in active layer thickness over the Russian Arctic drainage basin. J. Geophys. Res. Atmos. 2005, 110, D16101. [Google Scholar] [CrossRef] [Scilit]
- Zimov, S.A.; Schuur, E.A.; Chapin, F.S., III. Permafrost and the global carbon budget. Science 2006, 312, 1612–1613. [Google Scholar] [CrossRef] [Scilit] [PubMed]
- Obu, J.; Westermann, S.; Bartsch, A.; Berdnikov, N.; Christiansen, H.H.; Dashtseren, A.; Delaloye, R.; Elberling, B.; Etzelmüller, B.; Kholodov, A. Northern Hemisphere permafrost map based on TTOP modelling for 2000–2016 at 1 km2 scale. Earth-Sci. Rev. 2019, 193, 299–316. [Google Scholar] [CrossRef] [Scilit]
- Wang, C.; Guo, D.; Zang, S. Thermal remote sensing for mapping the sub-Arctic permafrost and refining its southern limits. Int. J. Appl. Earth Obs. Geoinf. 2023, 118, 103235. [Google Scholar] [CrossRef] [Scilit]
- Zhang, Z.; Wu, Q.; Hou, M.; Tai, B.; An, Y. Permafrost change in Northeast China in the 1950s–2010s. Adv. Clim. Change Res. 2021, 12, 18–28. [Google Scholar] [CrossRef] [Scilit]
- Shan, W.; Zhang, C.; Guo, Y.; Qiu, L.; Xu, Z.; Wang, Y. Spatial distribution and variation characteristics of permafrost temperature in Northeast China. Sustainability 2022, 14, 8178. [Google Scholar] [CrossRef] [Scilit]
- Zhang, C.; Shan, W.; Liu, S.; Guo, Y.; Qiu, L. Simulation of spatiotemporal distribution and variation of 30 m resolution permafrost in northeast China from 2003 to 2021. Sustainability 2023, 15, 14610. [Google Scholar] [CrossRef] [Scilit]
- Yang, M.; Nelson, F.E.; Shiklomanov, N.I.; Guo, D.; Wan, G. Permafrost degradation and its environmental effects on the Tibetan Plateau: A review of recent research. Earth-Sci. Rev. 2010, 103, 31–44. [Google Scholar] [CrossRef] [Scilit]
- Lachenbruch, A.H.; Marshall, B.V. Changing climate: Geothermal evidence from permafrost in the Alaskan Arctic. Science 1986, 234, 689–696. [Google Scholar] [CrossRef] [Scilit]
- Williams, P.J.; Smith, M.W. The Frozen Earth: Fundamentals of Geocryology; Cambridge University Press: Cambridge, UK, 1989. [Google Scholar]
- French, H.M. The Periglacial Environment; John Wiley & Sons: Chichester, UK, 2017. [Google Scholar]
- Romanovsky, V.E.; Osterkamp, T.E. Interannual variations of the thermal regime of the active layer and near-surface permafrost in northern Alaska. Permafr. Periglac. Process. 1995, 6, 313–335. [Google Scholar] [CrossRef] [Scilit]
- Liu, G.; Zhao, L.; Xie, C.; Pang, Q.; Du, E.; Qiao, Y. Variation characteristics and impact factors of the depth of zero annual amplitude of ground temperature in permafrost regions on the Tibetan Plateau. J. Glaciol. Geocryol. 2016, 38, 1189–1200. [Google Scholar]
- Cheng, G.; Wang, S. On the zonation of high-altitude permafrost in China. J. Glaciol. Geocryol. 1982, 4, 1–17. [Google Scholar]
- Tong, C.; Wu, Q. Permafrost zonation of ground temperature and stability of engineering constructions in the western region, China. J. Glaciol. Geocryol. 1996, 18, 166–173. [Google Scholar]
- Osterkamp, T.E.; Romanovsky, V.E. Evidence for warming and thawing of discontinuous permafrost in Alaska. Permafr. Periglac. Process. 1999, 10, 17–37. [Google Scholar] [CrossRef] [Scilit]
- Haeberli, W.; Jeannette, N.; Lukas, A.; Reynald, D.; Isabelle, G.-R.; Stephan, G.; Ketil, I.; Christof, K.; Michael, K.; Marcia, P. Mountain permafrost: Development and challenges of a young research field. J. Glaciol. 2010, 56, 1043–1058. [Google Scholar] [CrossRef] [Scilit]
- Cheng, G.; Wu, T. Responses of permafrost to climate change and their environmental significance, Qinghai-Tibet Plateau. J. Geophys. Res. Earth Surf. 2007, 112, F02S03. [Google Scholar] [CrossRef] [Scilit]
- Smith, M.W.; Riseborough, D.W. Climate and the limits of permafrost: A zonal analysis. Permafr. Periglac. Process. 2002, 13, 1–15. [Google Scholar] [CrossRef] [Scilit]
- Zhou, Y.; Guo, D.; Qiu, G. Geocryology in China; Science Press: Beijing, China, 2000. [Google Scholar]
- Li, X.; Jin, H.; Wang, H.; Wu, X.; Huang, Y.; He, R.; Luo, D.; Jin, X. Distributive features of soil carbon and nutrients in permafrost regions affected by forest fires in northern Da Xing’anling (Hinggan) Mountains, NE China. Catena 2020, 185, 104304. [Google Scholar] [CrossRef] [Scilit]
- Wang, F.; Li, G.; Ma, W.; Mao, Y.; Mu, Y.; Serban, M.; Cai, Y. Permafrost warming along the Mo’he-Jiagedaqi section of the China-Russia crude oil pipeline. J. Mt. Sci. 2019, 16, 285–295. [Google Scholar] [CrossRef] [Scilit]
- He, R.; Jin, H.; Luo, D.; Li, X.; Zhou, C.; Jia, N.; Jin, X.; Li, X.; Che, T.; Yang, X. Permafrost changes in the Nanwenghe Wetlands Reserve on the southern slope of the Da Xing’anling–Yile’huli mountains, Northeast China. Adv. Clim. Change Res. 2021, 12, 696–709. [Google Scholar] [CrossRef] [Scilit]
- Chang, X.; Jin, H.; He, R.; Yang, S.; Yu, S.; Lv, L.; Guo, D.; Wang, S.; Kang, X. Advances in permafrost and cold regions environments studies in the Da Xing’anling (Da Hinggan) Mountains, northeastern China. J. Glaciol. Geocryol. 2008, 30, 176–182. [Google Scholar]
- Chang, X.; Tie, L.; Jin, H.; He, R.; Li, X.; Wang, Y. The features of permafrost in Xinlin forest area on eastern slope of the Greater Khingan Mountains. J. Glaciol. Geocryol. 2020, 42, 823–833. [Google Scholar]
- He, R.; Jin, H.; Luo, D.; Huang, Y.; Ma, F.; Li, X.; Wang, H.; Li, Y.; Jia, N.; Li, X. Changes in the permafrost environment under dual impacts of climate change and human activities in the Hola basin, northern Da Xing’anling Mountains, Northeast China. Land Degrad. Dev. 2022, 33, 1219–1234. [Google Scholar] [CrossRef] [Scilit]
- Chang, X.; Jin, H.; He, R.; Zhang, Y.; Li, X.; Jin, X.; Li, G. Permafrost changes in the northwestern Da Xing’anling Mountains, Northeast China, in the past decade. Earth Syst. Sci. Data 2022, 14, 3947–3959. [Google Scholar] [CrossRef] [Scilit]
- Li, X.; Jin, H.; Wang, H.; Jin, X.; Bense, V.F.; Marchenko, S.S.; He, R.; Huang, Y.; Luo, D. Effects of fire history on thermal regimes of permafrost in the northern Da Xing’anling Mountains, NE China. Geoderma 2022, 410, 115670. [Google Scholar] [CrossRef] [Scilit]
- Li, G.; Ma, W.; Wang, F.; Jin, H.; Alexander, F.; Chen, D.; Wu, G.; Cao, Y.; Zhou, Y.; Mu, Y. A newly integrated ground temperature dataset of permafrost along the China-Russia crude oil pipeline route in Northeast China. Earth Syst. Sci. Data Discuss. 2022, 14, 5093–5110. [Google Scholar] [CrossRef] [Scilit]
- Li, X.; Jin, H.; He, R.; Huang, Y.; Wang, H.; Luo, D.; Jin, X.; Lü, L.; Wang, L.; Li, W.h. Effects of forest fires on the permafrost environment in the northern Da Xing’anling (Hinggan) mountains, Northeast China. Permafr. Periglac. Process. 2019, 30, 163–177. [Google Scholar] [CrossRef] [Scilit]
- Chang, X.; Xiao, L.; Jin, H.; Li, X.; He, R.; Yu, T. Major features of permafrost in northern Da Xing’anling Mountains, Northeast China and their changes. J. Glaciol. Geocryol. 2025, 47, 126–138. [Google Scholar]
- Amatulli, G.; Domisch, S.; Tuanmu, M.-N.; Parmentier, B.; Ranipeta, A.; Malczyk, J.; Jetz, W. A suite of global, cross-scale topographic variables for environmental and biodiversity modeling. Sci. Data 2018, 5, 180040. [Google Scholar] [CrossRef] [Scilit] [PubMed]
- Data Center for Resources and Environmental Sciences; Chinese Academy of Sciences (RESDC). Spatial Distribution Data of Soil Texture in China; RESDC: Beijing, China, 1995; Available online: http://www.resdc.cn (accessed on 16 February 2026).
- Yan, F.; Shangguan, W.; Zhang, J.; Hu, B. Depth-to-bedrock map of China at a spatial resolution of 100 meters. Sci. Data 2020, 7, 2. [Google Scholar] [CrossRef] [Scilit] [PubMed]
- Peng, S.; Ding, Y.; Liu, W.; Li, Z. 1 km monthly temperature and precipitation dataset for China from 1901 to 2017. Earth Syst. Sci. Data 2019, 11, 1931–1946. [Google Scholar] [CrossRef] [Scilit]
- Zou, D.; Zhao, L.; Sheng, Y.; Chen, J.; Hu, G.; Wu, T.; Wu, J.; Xie, C.; Wu, X.; Pang, Q. A new map of permafrost distribution on the Tibetan Plateau. Cryosphere 2017, 11, 2527–2542. [Google Scholar] [CrossRef] [Scilit]
- Yang, J.; Dong, J.; Xiao, X.; Dai, J.; Wu, C.; Xia, J.; Zhao, G.; Zhao, M.; Li, Z.; Zhang, Y. Divergent shifts in peak photosynthesis timing of temperate and alpine grasslands in China. Remote Sens. Environ. 2019, 233, 111395. [Google Scholar] [CrossRef] [Scilit]
- Wei, C.; Wang, L.; He, R.; Zhao, X.; Liu, X.; Zhao, H.; Li, H. Analysis of Ground Temperature Monitoring in Permafrost Area of Nenjiang Source Wetland in Great Xing’an Mountains. J. Temp. For. Res. 2020, 3, 8–11. [Google Scholar]
- Hudson, B.D. The soil survey as paradigm-based science. Soil Sci. Soc. Am. J. 1992, 56, 836–841. [Google Scholar] [CrossRef] [Scilit]
- Qin, C.; An, Y.; Zhu, A.; Yang, L. Soil property mapping by combining spatial distance information into the Soil Land Inference Model (SoLIM). Pedosphere 2021, 31, 638–644. [Google Scholar] [CrossRef] [Scilit]
- Fan, X.; Fan, N.; Qin, C.; Zhao, F.; Zhu, L.; Zhu, A. Large-area soil mapping based on environmental similarity with adaptive consideration of spatial distance to samples. Geoderma 2023, 439, 116683. [Google Scholar] [CrossRef] [Scilit]
- Ma, F.; Du, C.; Zhou, J. A self-adaptive model for the prediction of soil organic matter using mid-infrared photoacoustic spectroscopy. Soil Sci. Soc. Am. J. 2016, 80, 238–246. [Google Scholar] [CrossRef] [Scilit]
- Zhang, Z.; Wu, Q.; Xun, X.; Wang, B.; Wang, X. Climate change and the distribution of frozen soil in 1980–2010 in northern northeast China. Quat. Int. 2018, 467, 230–241. [Google Scholar] [CrossRef] [Scilit]
- Zhang, Y.; Zang, S.; Li, M.; Shen, X.; Lin, Y. Spatial Distribution of Permafrost in the Xing’an Mountains of Northeast China from 2001 to 2018. Land 2021, 10, 1127. [Google Scholar] [CrossRef] [Scilit]
- Li, X.; Jin, H.; Sun, L.; Wang, H.; Huang, Y.; He, R.; Chang, X.; Yu, S.; Zang, S. TTOP-model-based maps of permafrost distribution in Northeast China for 1961–2020. Permafr. Periglac. Process. 2022, 33, 425–435. [Google Scholar] [CrossRef] [Scilit]
- Soil Science Division Staff. Soil Survey Manual; USDA Handbook 18; Ditzler, C., Scheffe, K., Monger, H.C., Eds.; Government Printing Office: Washington, DC, USA, 2017. [Google Scholar]
- Jin, H.; Ma, Q. Impacts of permafrost degradation on carbon stocks and emissions under a warming climate: A review. Atmosphere 2021, 12, 1425. [Google Scholar] [CrossRef] [Scilit]
- Wang, X.; Wen, L.; Li, J.; Guo, M. Research of vegetation phenology in permafrost regions of Greater Khingan Mountains based on MODIS EVI. J. Glaciol. Geocryol. 2023, 45, 1379–1390. [Google Scholar]
- Zhang, X.; Bai, X.; Hou, M.; Chen, Z.; Manzanedo, R.D. Warmer winter ground temperatures trigger rapid growth of Dahurian larch in the permafrost forests of northeast China. J. Geophys. Res. Biogeosciences 2019, 124, 1088–1097. [Google Scholar] [CrossRef] [Scilit]
- Hjort, J.; Streletskiy, D.; Doré, G.; Wu, Q.; Bjella, K.; Luoto, M. Impacts of permafrost degradation on infrastructure. Nat. Rev. Earth Environ. 2022, 3, 24–38. [Google Scholar] [CrossRef] [Scilit]
- Lin, F. Analysis On the Driving Force of the Permafrost Degeneration in Daxingalling. J. Arid Land Resour. Environ. 2002, 16, 44–47. [Google Scholar]
- He, R.; Jin, H.; Ma, W.; Cheng, G. Recent changes of permafrost and cold regions environments in the northern part of Northeastern China. In AGU Fall Meeting Abstracts; American Geophysical Union: Washington, DC, USA, 2008; Abstract GC11A-0673. [Google Scholar]
- Zhu, X.; Jia, G.; Xu, X. Accelerated rise in wildfire carbon emissions from Arctic continuous permafrost. Sci. Bull. 2024, 69, 2430–2438. [Google Scholar] [CrossRef] [Scilit] [PubMed]
- Natali, S.M.; Holdren, J.P.; Rogers, B.M.; Treharne, R.; Duffy, P.B.; Pomerance, R.; MacDonald, E. Permafrost carbon feedbacks threaten global climate goals. Proc. Natl. Acad. Sci. USA 2021, 118, e2100163118. [Google Scholar] [CrossRef] [Scilit]
- Zhirkov, A.; Permyakov, P.; Wen, Z.; Kirillin, A. Influence of rainfall changes on the temperature regime of permafrost in Central Yakutia. Land 2021, 10, 1230. [Google Scholar] [CrossRef] [Scilit]
- Fang, X.; Li, Z.; Cheng, C.; Fraedrich, K.; Wang, A.; Chen, Y.; Xu, Y.; Lyu, S. Response of freezing/thawing indexes to the wetting trend under warming climate conditions over the Qinghai-Tibetan Plateau during 1961–2010: A numerical simulation. Adv. Atmos. Sci. 2023, 40, 211–222. [Google Scholar] [CrossRef] [Scilit]
- Fu, C.; Hu, Z.; Yang, Y.; Deng, M.; Yu, H.; Lu, S.; Wu, D.; Fan, W. Responses of soil freeze–thaw processes to climate on the Tibetan Plateau from 1980 to 2016. Remote Sens. 2022, 14, 5907. [Google Scholar] [CrossRef] [Scilit]
- Peng, X.; Zhang, T.; Frauenfeld, O.W.; Wang, K.; Cao, B.; Zhong, X.; Su, H.; Mu, C. Response of seasonal soil freeze depth to climate change across China. Cryosphere 2017, 11, 1059–1073. [Google Scholar] [CrossRef] [Scilit]
- Grosse, G.; Jones, B.M.; Arp, C.D. Thermokarst lakes, drainage, and drained basins. Treatise Geomorphol. 2013, 8, 325–353. [Google Scholar]
- Kneisel, C.; Hauck, C.; Fortier, R.; Moorman, B. Advances in geophysical methods for permafrost investigations. Permafr. Periglac. Process. 2008, 19, 157–178. [Google Scholar] [CrossRef] [Scilit]
- Gruber, S. Derivation and analysis of a high-resolution estimate of global permafrost zonation. Cryosphere 2012, 6, 221–233. [Google Scholar] [CrossRef] [Scilit]
- Haeberli, W.; Beniston, M. Climate change and its impacts on glaciers and permafrost in the Alps. Ambio 1998, 27, 258–265. [Google Scholar]
- Romanovsky, V.E.; Drozdov, D.; Oberman, N.G.; Malkova, G.; Kholodov, A.L.; Marchenko, S.; Moskalenko, N.G.; Sergeev, D.; Ukraintseva, N.; Abramov, A. Thermal state of permafrost in Russia. Permafr. Periglac. Process. 2010, 21, 136–155. [Google Scholar] [CrossRef] [Scilit]
- Wu, Q.; Zhang, T.; Liu, Y. Permafrost temperatures and thickness on the Qinghai-Tibet Plateau. Glob. Planet. Change 2010, 72, 32–38. [Google Scholar] [CrossRef] [Scilit]
- Etzelmüller, B.; Frauenfelder, R. Factors controlling the distribution of mountain permafrost in the Northern Hemisphere and their influence on sediment transfer. Arct. Antarct. Alp. Res. 2009, 41, 48–58. [Google Scholar] [CrossRef]
- Noetzli, J.; Gruber, S.; Kohl, T.; Salzmann, N.; Haeberli, W. Three-dimensional distribution and evolution of permafrost temperatures in idealized high-mountain topography. J. Geophys. Res. Earth Surf. 2007, 112, F02S13. [Google Scholar] [CrossRef] [Scilit]

Disclaimer/Publisher’s Note: The statements, opinions and data contained in all publications are solely those of the individual author(s) and contributor(s) and not of MDPI and/or the editor(s). MDPI and/or the editor(s) disclaim responsibility for any injury to people or property resulting from any ideas, methods, instructions or products referred to in the content. |
© 2026 by the authors. Licensee MDPI, Basel, Switzerland. This article is an open access article distributed under the terms and conditions of the Creative Commons Attribution (CC BY) license.