


Highlights
What are the main findings?
- We quantified multi-decadal (2000–2024) spatiotemporal dynamics of LST, NDVI, and TVDI, identifying a 0–2 km core buffer with dominant lacustrine cooling and humidifying effects.
- We demonstrated that topographic gradients significantly govern the spatial heterogeneity and intensity of lake effects across the 10-km riparian zone.
What is the implication of the main finding?
- It provides a quantitative framework for assessing the synergistic buffering capacity of large plateau lakes and complex terrain against climate change in fragile ecosystems.
- It offers scientific decision support for targeted ecological conservation and precision water resource management within plateau lake basins based on identified spatial thresholds.
Abstract
As a critical climate regulator on the Qinghai–Xizang Plateau, Qinghai Lake exerts important influences on surrounding surface environmental conditions. Using MODIS remote sensing data and topographic information from 2000 to 2024, this study analyzed the spatiotemporal variations in land surface temperature (LST), normalized difference vegetation index (NDVI), and temperature vegetation dryness index (TVDI) in the 10-km riparian zone. The buffer was subdivided into five 2-km distance gradients to quantify the attenuation of lake effects and their interaction with topographic factors. The results indicate pronounced seasonal contrasts and distance-dependent differentiation of surface variables. LST exhibited clear seasonal variability, with peak values in the second and third quarters (Q2 and Q3). During Q2, the near-shore zone (0–2 km) remained notably cooler by approximately 2–3 °C (23.8 °C) than intermediate and distal zones (25.4–26.8 °C), indicating a moderate lake-related cooling effect during the early warm season. NDVI showed consistent seasonal phenology across all buffers, reaching maximum values in Q3, while mean NDVI values increased gradually with distance from the lake, ranging approximately from 0.48 in the near-shore zone to 0.51 in the distal zone. TVDI displayed distinct seasonal and spatial patterns, with relatively low and stable values in the near-shore zone throughout the year and a pronounced seasonal minimum in the distal zone during Q3 (0.57). These findings highlight strong seasonal and spatial heterogeneity of surface environmental conditions in the Qinghai Lake riparian zone. The observed patterns suggest that lake proximity and topographic gradients jointly influence hydrothermal conditions and vegetation dynamics at the landscape scale, providing quantitative evidence for understanding surface–environmental gradients in alpine lake systems.
1. Introduction
The Qinghai–Xizang Plateau (QXP), often referred to as the Third Pole, serves as a sensitive indicator and driver of global climate change [1,2,3]. Its hydrothermal balance and vegetation dynamics exert profound influences on the Asian monsoon system and regional ecological security [4,5,6]. As the largest inland saline lake on the northeastern QXP, Qinghai Lake is not only a vital ecological barrier for regional biodiversity but also a sentinel reflecting the environmental evolution of the plateau [7,8]. In recent years, as the trend toward a warm and humid climate has intensified across the QXP, the climatic, hydrological, and ecological processes of the Qinghai Lake Basin have undergone significant transformations [9,10].
With the development of the satellite data, accurate monitoring and evaluation of Land Surface Temperature (LST), Normalized Difference Vegetation Index (NDVI), and the resulting Temperature Vegetation Dryness Index (TVDI) are of paramount scientific importance for unraveling the response mechanisms of alpine ecosystems to climate change [11,12,13]. Leveraging advancements in remote sensing, numerous studies utilizing MODIS data have explored ecological changes in the basin. These studies have confirmed that rising temperatures and increased precipitation are the primary drivers advancing vegetation phenology and extending the growing season while noting that the rising water levels of Qinghai Lake have triggered a significant positive feedback loop within the surrounding wetland ecosystems [14,15,16]. By coupling the hydrological model with multi-source remote sensing and hydro-meteorological data, Li et al. [17] established a watershed-scale lake water balance framework, constructed Qinghai Lake water storage variations and quantitatively explained the recent lake level rise through increased basin-wide precipitation and runoff together with declining lake evaporation. Using Landsat/MODIS data of Qinghai Lake, Zhang et al. [15] found that the Forel–Ule index (FUI) first decreased then increased, with the FUI strongly correlated to water level, temperature, precipitation and runoff. Using multi-satellite data, Li et al. [18] developed a high-accuracy 30 m annual maximum NDVI method for the Qinghai Lake Basin, revealing the index’s north–south high/central-low spatial pattern. While previous studies have laid a solid foundation for understanding the Qinghai Lake Basin, several aspects of the refined mechanisms within the circum-lake buffer zone warrant further exploration [19,20,21]. Current research has extensively addressed basin-wide ecological patterns and isolated aquatic transitions, providing critical baseline data for the region [22,23,24,25,26,27]. However, these professional assessments often characterize the circum-lake area as a relatively uniform entity, which may not fully capture the nuanced lake effect—the non-linear attenuation of thermal and moisture regulation driven by the lake’s massive heat capacity and evapotranspiration with increasing distance [25]. Specifically, within the ecologically sensitive buffer zone, the spatial heterogeneity of LST, NDVI, and TVDI along fine-scale distance gradients remains to be more comprehensively quantified [28,29]. Moreover, while the roles of slope and aspect in solar radiation and soil moisture redistribution are well-recognized, the localized moderating influence of complex topography on microclimates presents an opportunity for deeper decoupling analysis [30,31]. Integrating topographic factors with the lake-distance effect could further clarify their relative contributions to ecological shifts [32]. Furthermore, given the sharp seasonal contrasts in alpine ecosystems, moving beyond annual means to examine divergent driving mechanisms—such as the transition from the spring freeze–thaw period to the peak summer growing season—could offer a more detailed understanding of the region’s hydrothermal response logic. To address these gaps, this study utilizes long-term MODIS time-series data (2000–2024) and high-resolution DEM data to focus on the 10-km buffer zone of Qinghai Lake. We constructed a multidimensional analytical framework integrating temporal, spatial, and topographic variables. The 10-km buffer was subdivided into five 2-km wide concentric gradient zones. Combined with slope and aspect factors, this study aims to: (1) analyze the interannual and seasonal (Q1–Q4) spatiotemporal evolution of LST, NDVI, and TVDI over the past 25 years; (2) quantify the spatial attenuation patterns of ecological variables along the distance gradient from the lake; and (3) characterize the spatiotemporal associations among the lake gradients, topographic factors, and surface environmental variables. The findings will reveal the spatiotemporal differentiation of the ecological environment surrounding this alpine lake, providing a scientific foundation for refined ecological management, drought risk early-warning, and the formulation of climate change adaptation strategies.
2. Study Area and Methods
2.1. Study Area
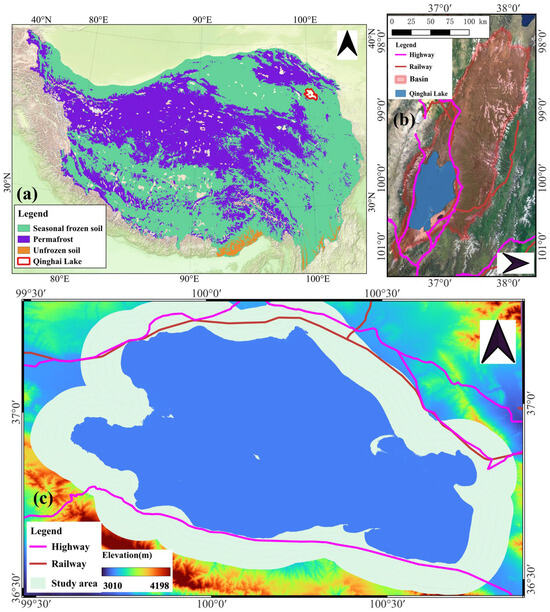
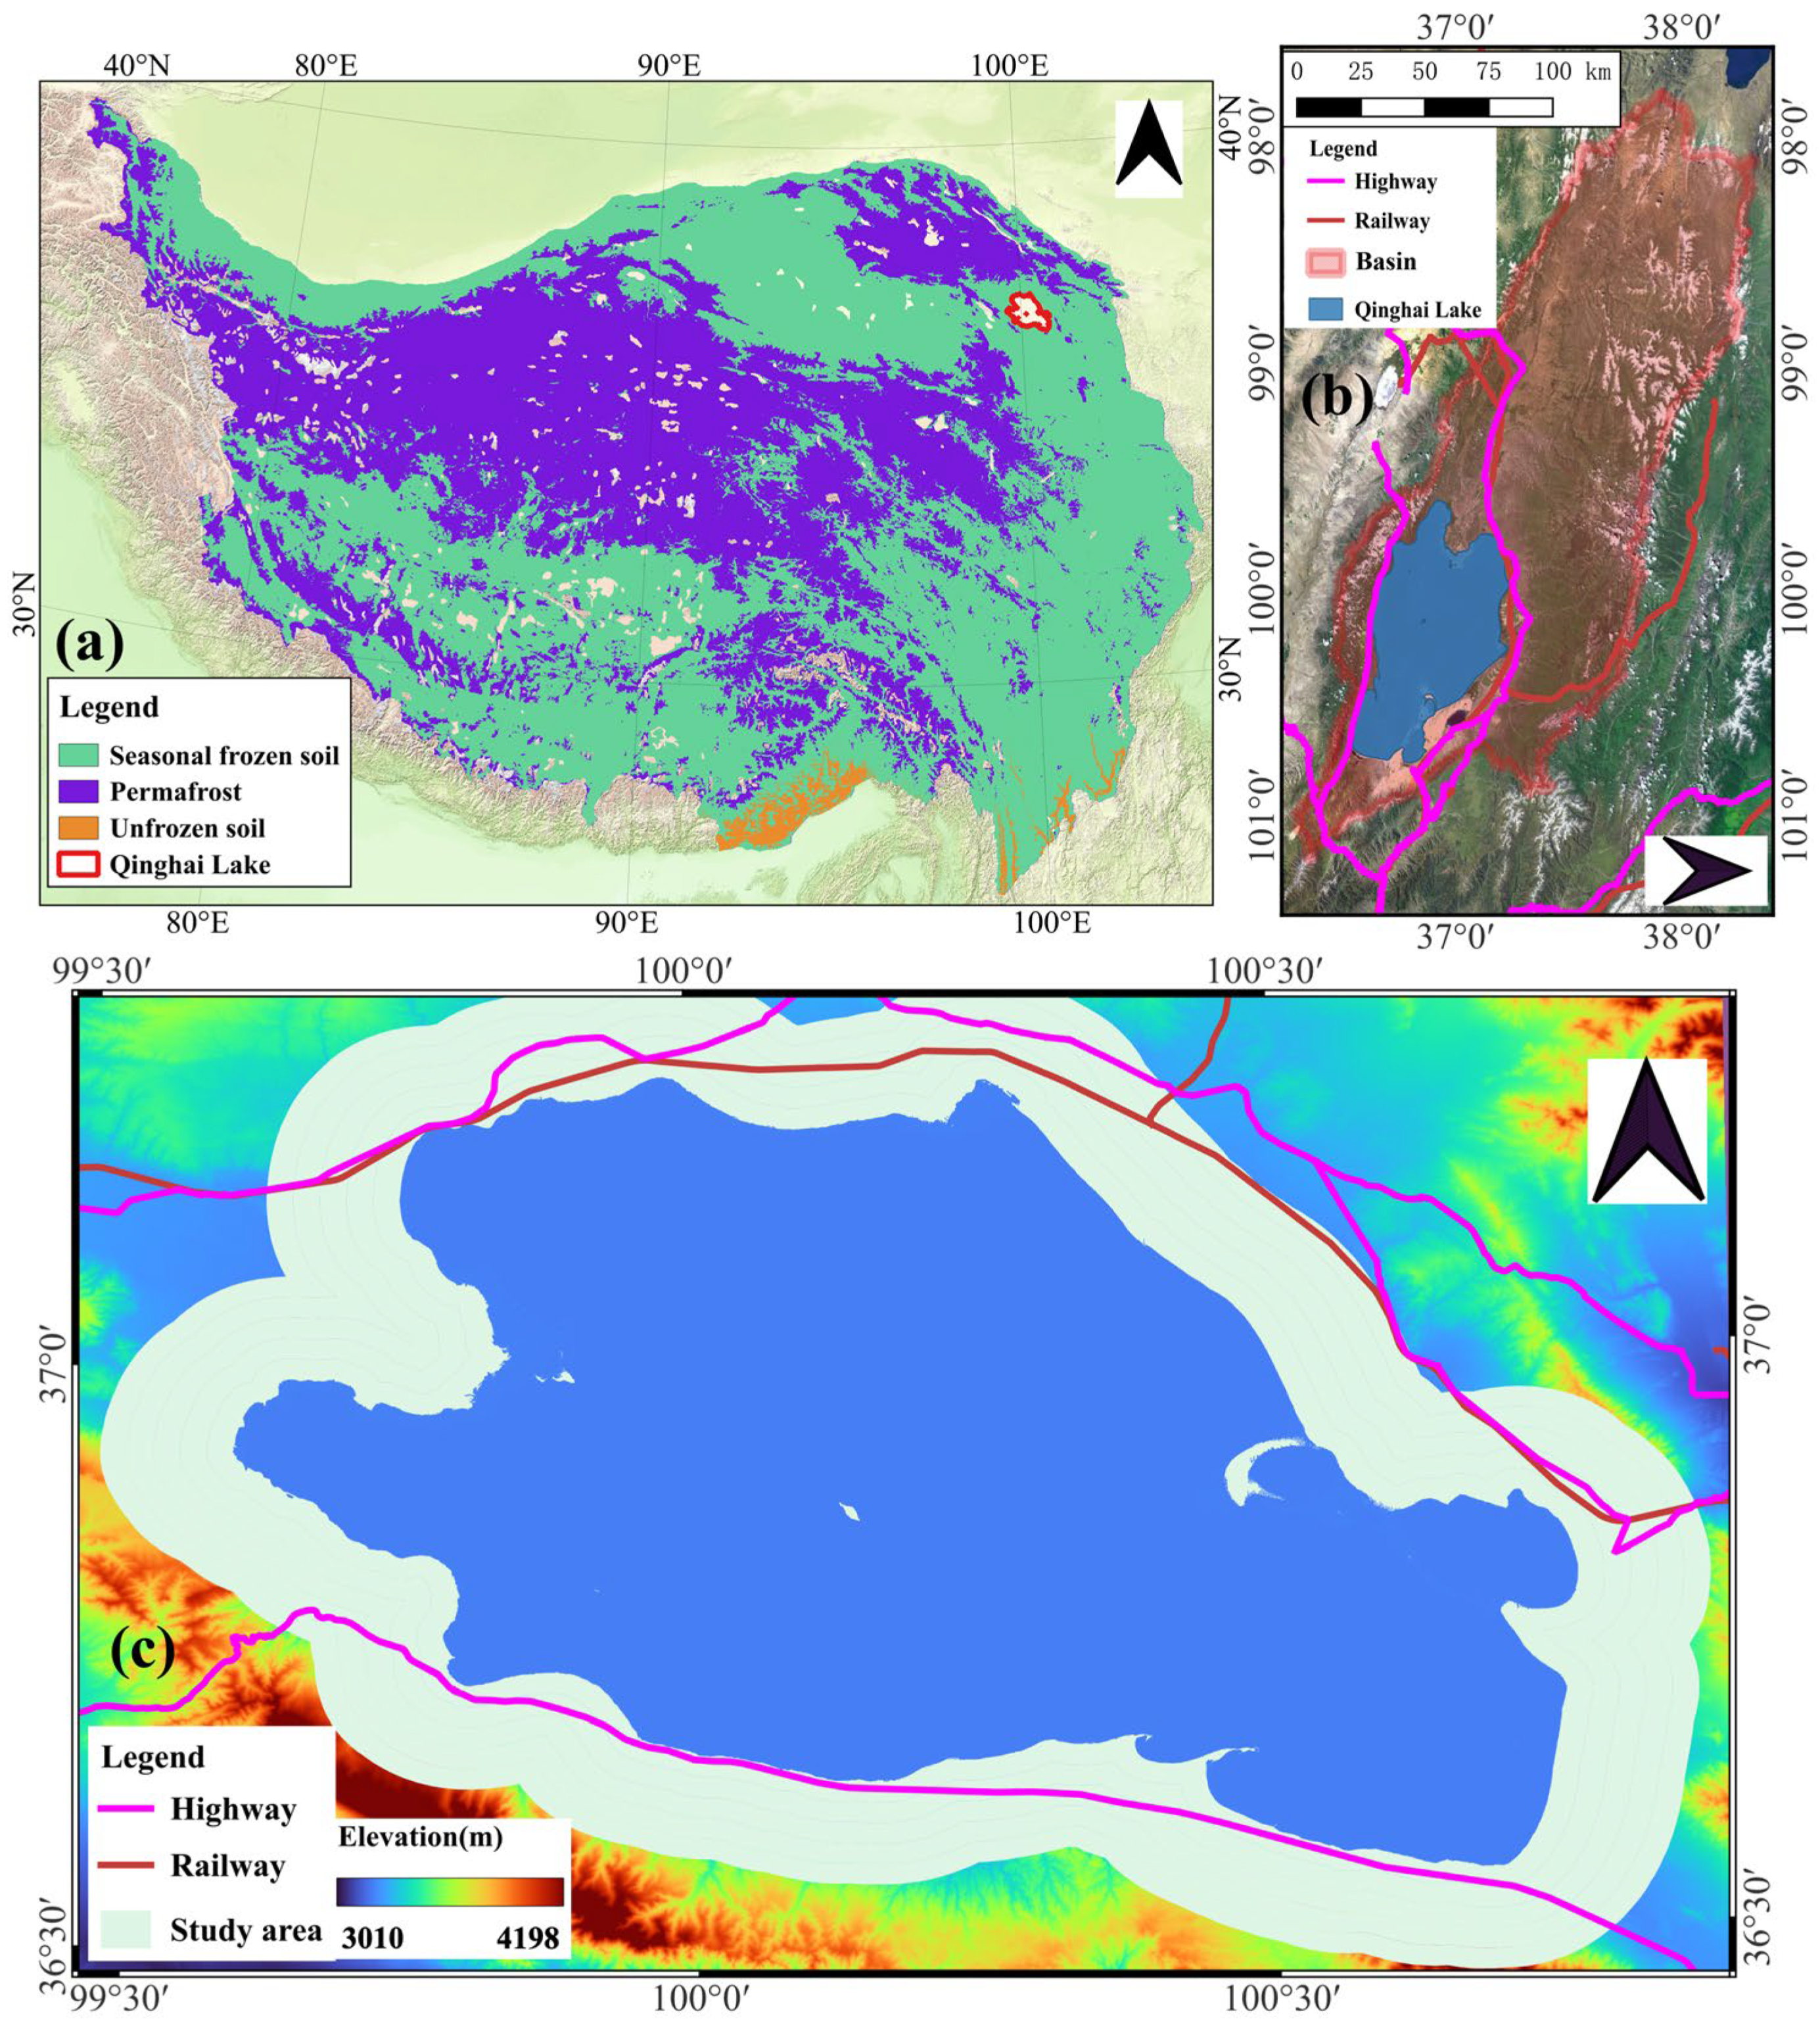
Qinghai Lake (36°32′–37°15′N, 99°36′–100°47′E), located in the northeastern part of the QXP, is China’s largest inland saline lake and serves as a critical indicator of alpine ecosystems and hydrological processes [22] (Figure 1a). This study focuses specifically on a 10-km annular buffer zone extending outward from the lake’s water boundary (Figure 1b). This region functions as a vital transition zone between the aquatic body and diverse terrestrial systems, including alpine meadows, alpine steppes, and localized sandy ecosystems. Within this buffer, hydrothermal conditions and ecological processes are exceptionally sensitive to the lake effect, broader climate change, and anthropogenic activities such as seasonal grazing.
Figure 1.
The overview of the study area (a) the permafrost distribution of QXP; (b) the satellite image of the Qinghai Lake basin; (c) the topography of the study area.
2.2. Data Sources and Preprocessing
The acquisition and preprocessing of all remote sensing data in this study were conducted on the Google Earth Engine (GEE) cloud computing platform, covering the period from January 2000 to December 2024. Land Surface Temperature (LST) data were derived from the MOD11A2 product(provided by NASA in GEE platform), while the Normalized Difference Vegetation Index (NDVI) was obtained from the MODIS/Terra 16-day composite product (MOD13A2), both featuring a spatial resolution of 1 km. Rigorous Quality Control (QC) masking was applied to all imagery within the GEE environment to ensure data integrity. Topographic information, including elevation, slope, and aspect, was extracted from the SRTM DEM dataset and resampled to a 1 km spatial resolution to match the MODIS products. Ultimately, the LST and NDVI datasets were aggregated into annual and quarterly means, specifically Q1 (Jan–Mar), Q2 (Apr–Jun), Q3 (Jul–Sep), and Q4 (Oct–Dec), and precisely clipped to the defined 10-km buffer mask surrounding Qinghai Lake.
All remote sensing data processing was conducted using the Google Earth Engine (GEE) platform. Land surface temperature (LST) data were obtained from the MODIS MOD11A2 product, and NDVI data were derived from the MOD13A2 product, both at a spatial resolution of 1 km. Quality control was applied using the MODIS quality assurance layers, and only pixels flagged as “good quality” were retained. Observations affected by cloud contamination or snow/ice cover were excluded, which is particularly important during the cold seasons (Q1 and Q4). No temporal gap-filling was applied; quarterly composites were calculated solely from valid observations.
2.3. Methods
2.3.1. Research Framework
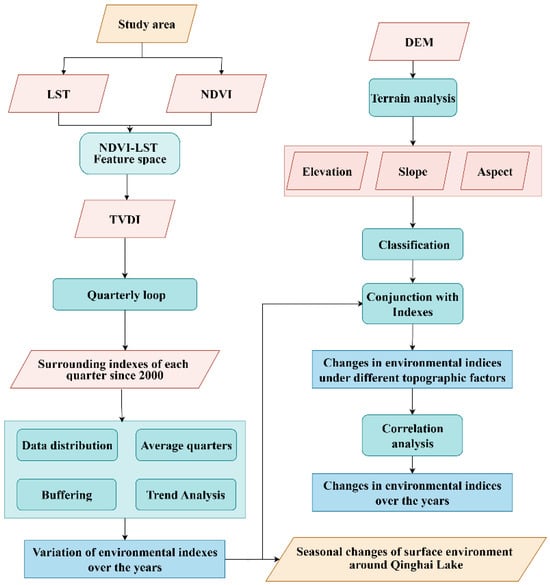
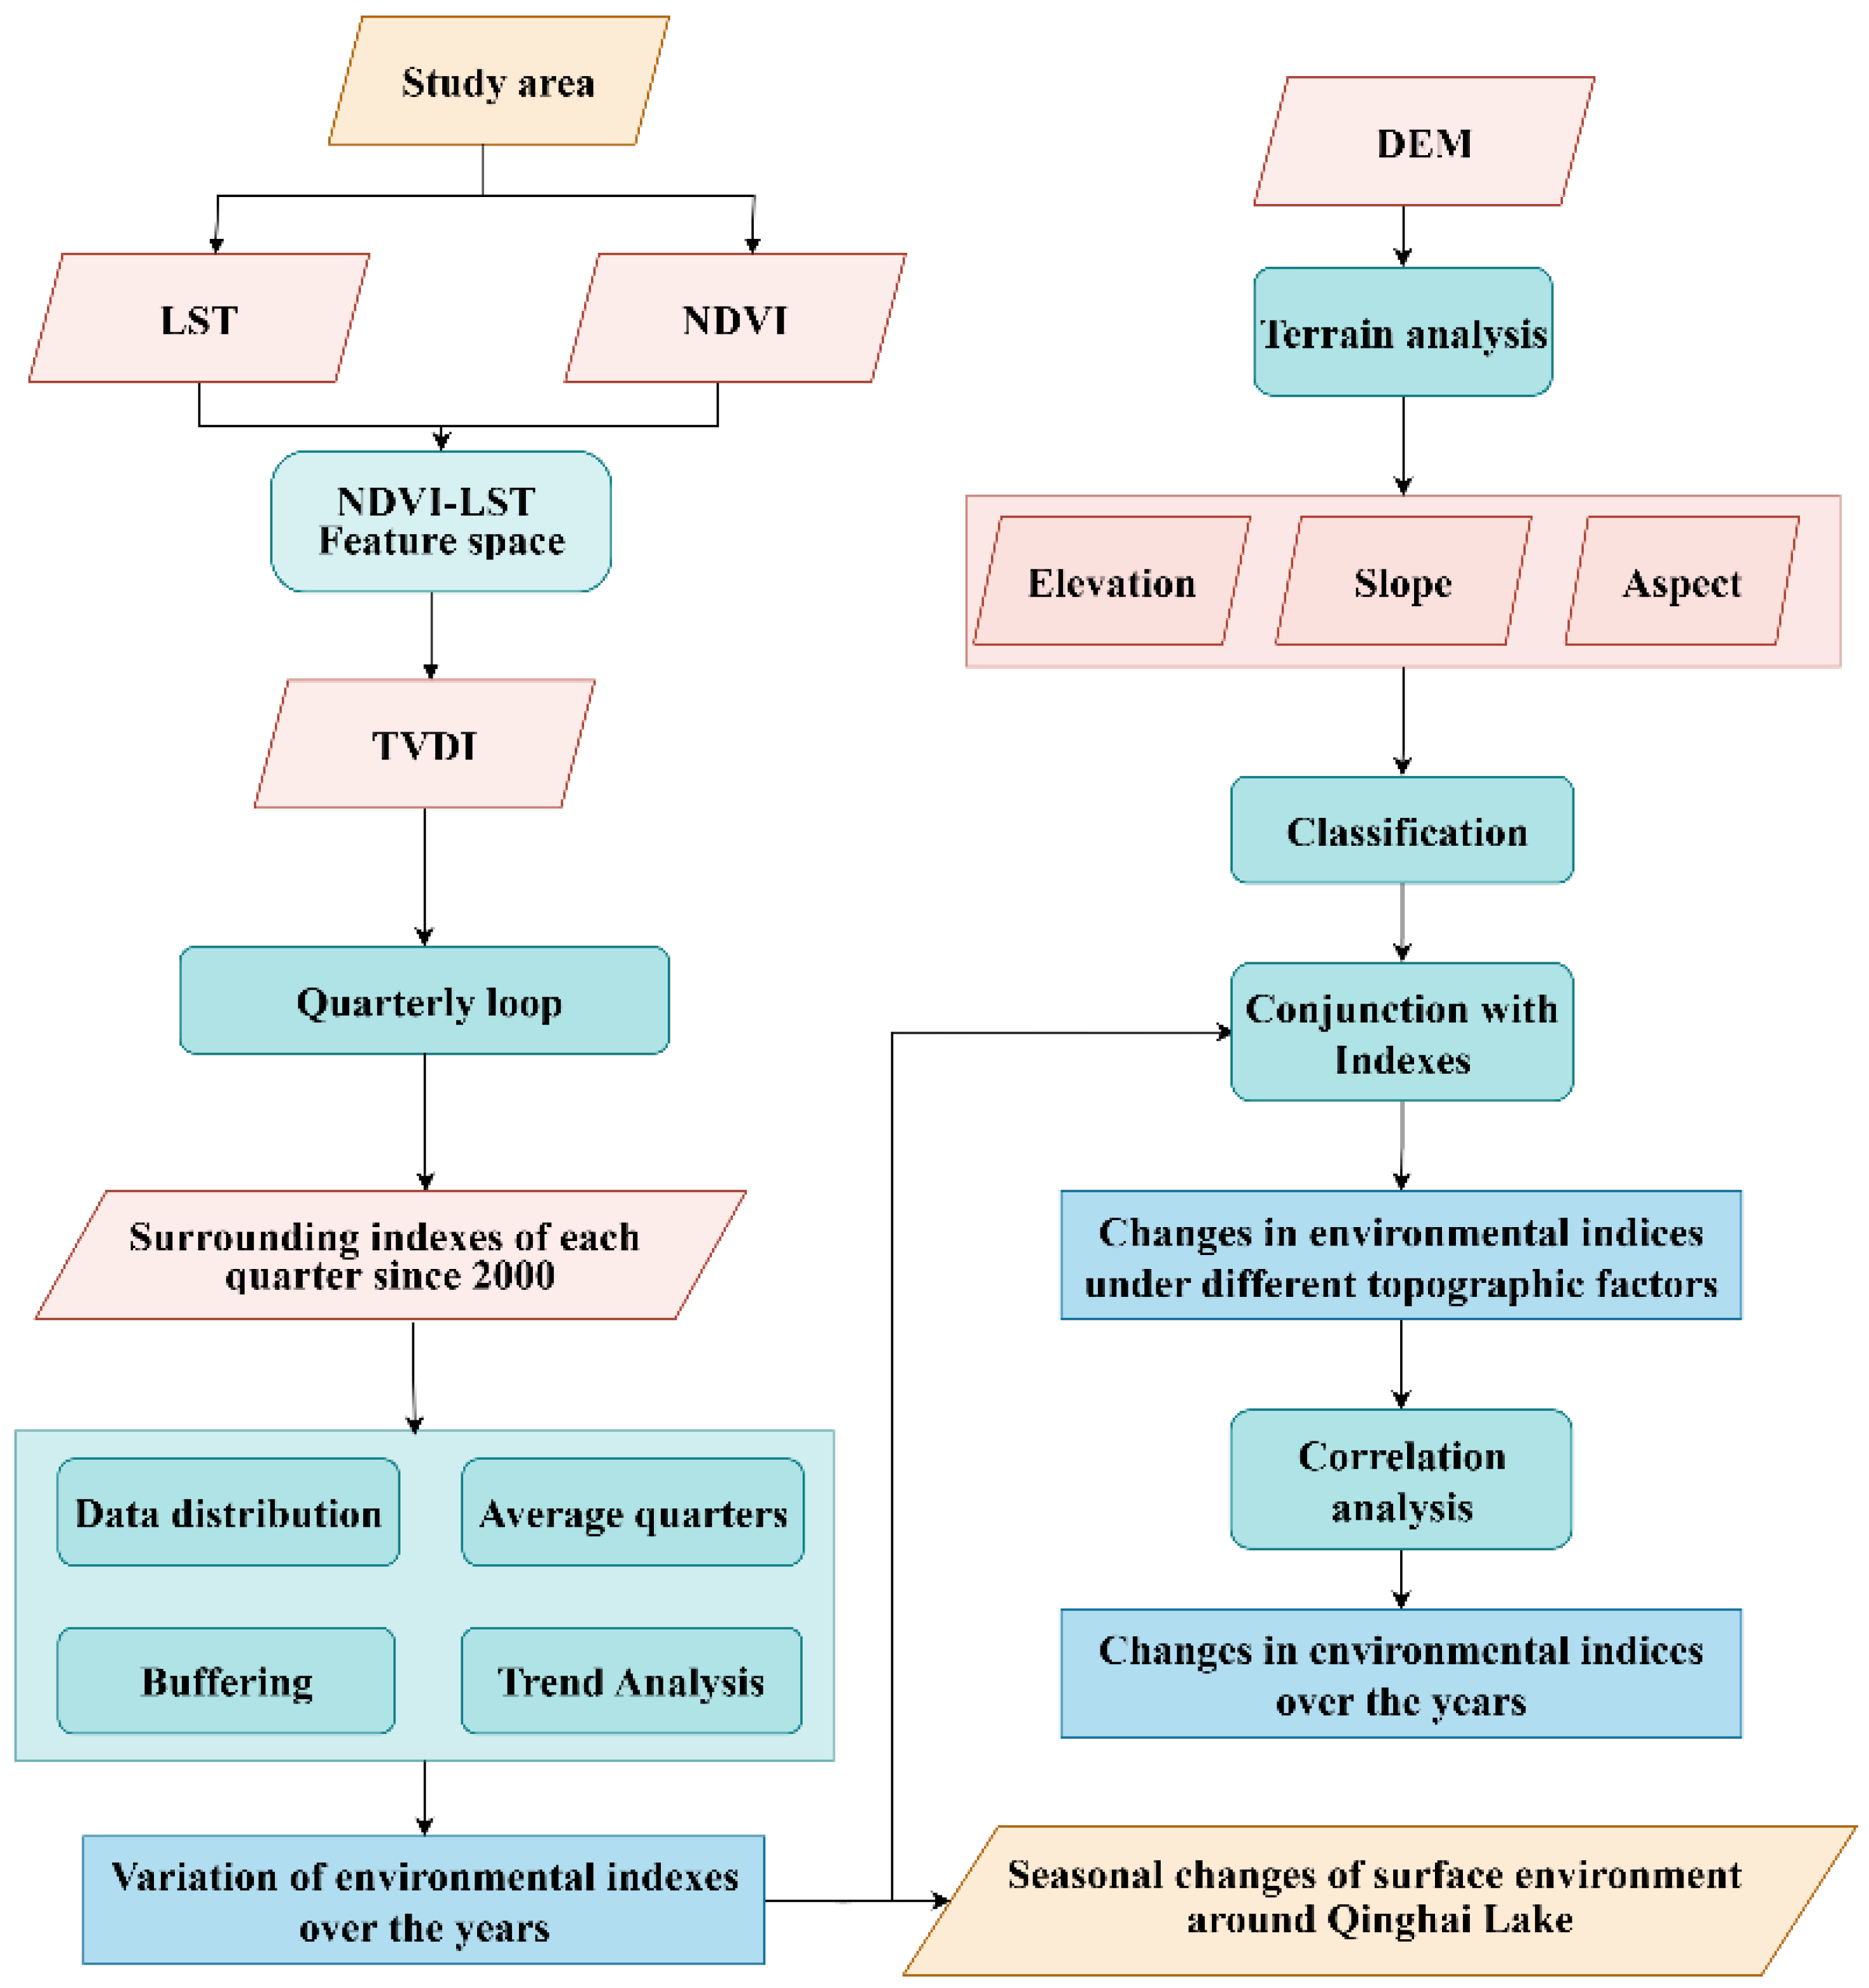
The technical workflow of this study follows a structured sequence encompassing data acquisition and preprocessing, core indicator construction, spatiotemporal and gradient analysis, and the exploration of coupling mechanisms. Initially, the acquisition, temporal aggregation, and spatial registration of MODIS and DEM data were executed on the GEE platform. Given our focus on seasonal-scale, regional patterns, we did not apply explicit QC-bit filtering. Instead, quarterly compositing and spatial aggregation were used to suppress random noise and isolated contaminated observations, yielding sufficiently robust signals for the objectives of this study. Following this, TVDI was constructed by integrating NDVI and LST datasets to characterize regional moisture deficit. Subsequently, based on the delineation of annular buffer zones and seasonal partitioning, interannual trend analysis, spatial gradient analysis, and seasonal dynamic assessments were conducted for all environmental variables; temporal trends were estimated using OLS linear regression with p-values, and because the analysis is at the seasonal (quarterly) scale, short-term persistence is reduced relative to monthly series, though some temporal autocorrelation may remain. Finally, by integrating topographic factors such as slope and aspect, correlation analyses were employed to elucidate the coupling mechanisms between the lake effect and topographic influences, thereby revealing the seasonal evolution of the surface environment surrounding Qinghai Lake (Figure 2).
Figure 2.
The research route.
2.3.2. Spatial Gradient and Temporal Segmentation
To quantify the distance-decay characteristics of the lake effect along the terrestrial depth, this study utilized GIS spatial analysis to delineate five equidistant annular buffer zones extending from the water boundary in 2022 of Qinghai Lake: 0–2 km, 2–4 km, 4–6 km, 6–8 km, and 8–10 km. At 1-km MODIS resolution, each 2-km annular buffer corresponds to approximately two pixels in radial width. Because the annuli extend around the lake perimeter, each zone contains a large number of pixels; therefore, we analyze spatially aggregated statistics (e.g., mean/median and distributional metrics) rather than pixel-scale gradients. This design is intended to capture the first-order, landscape-scale attenuation of the lake effect and is not intended to resolve fine-scale micro-topographic variability. This gradient-based framework facilitates the isolation and comparative analysis of the differentiated environmental responses between near-shore and distal areas. Temporally, the dataset was partitioned into four quarters to capture the sensitivity of alpine ecosystems to seasonal hydrothermal fluctuations: Q1 (Jan–Mar, the freeze–thaw period), Q2 (Apr–Jun, the early growing season), Q3 (Jul–Sep, the peak growing season), and Q4 (Oct–Dec, the senescence period).
2.3.3. Construction of the TVDI
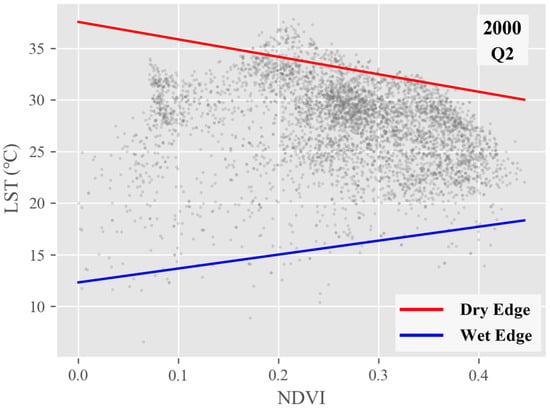
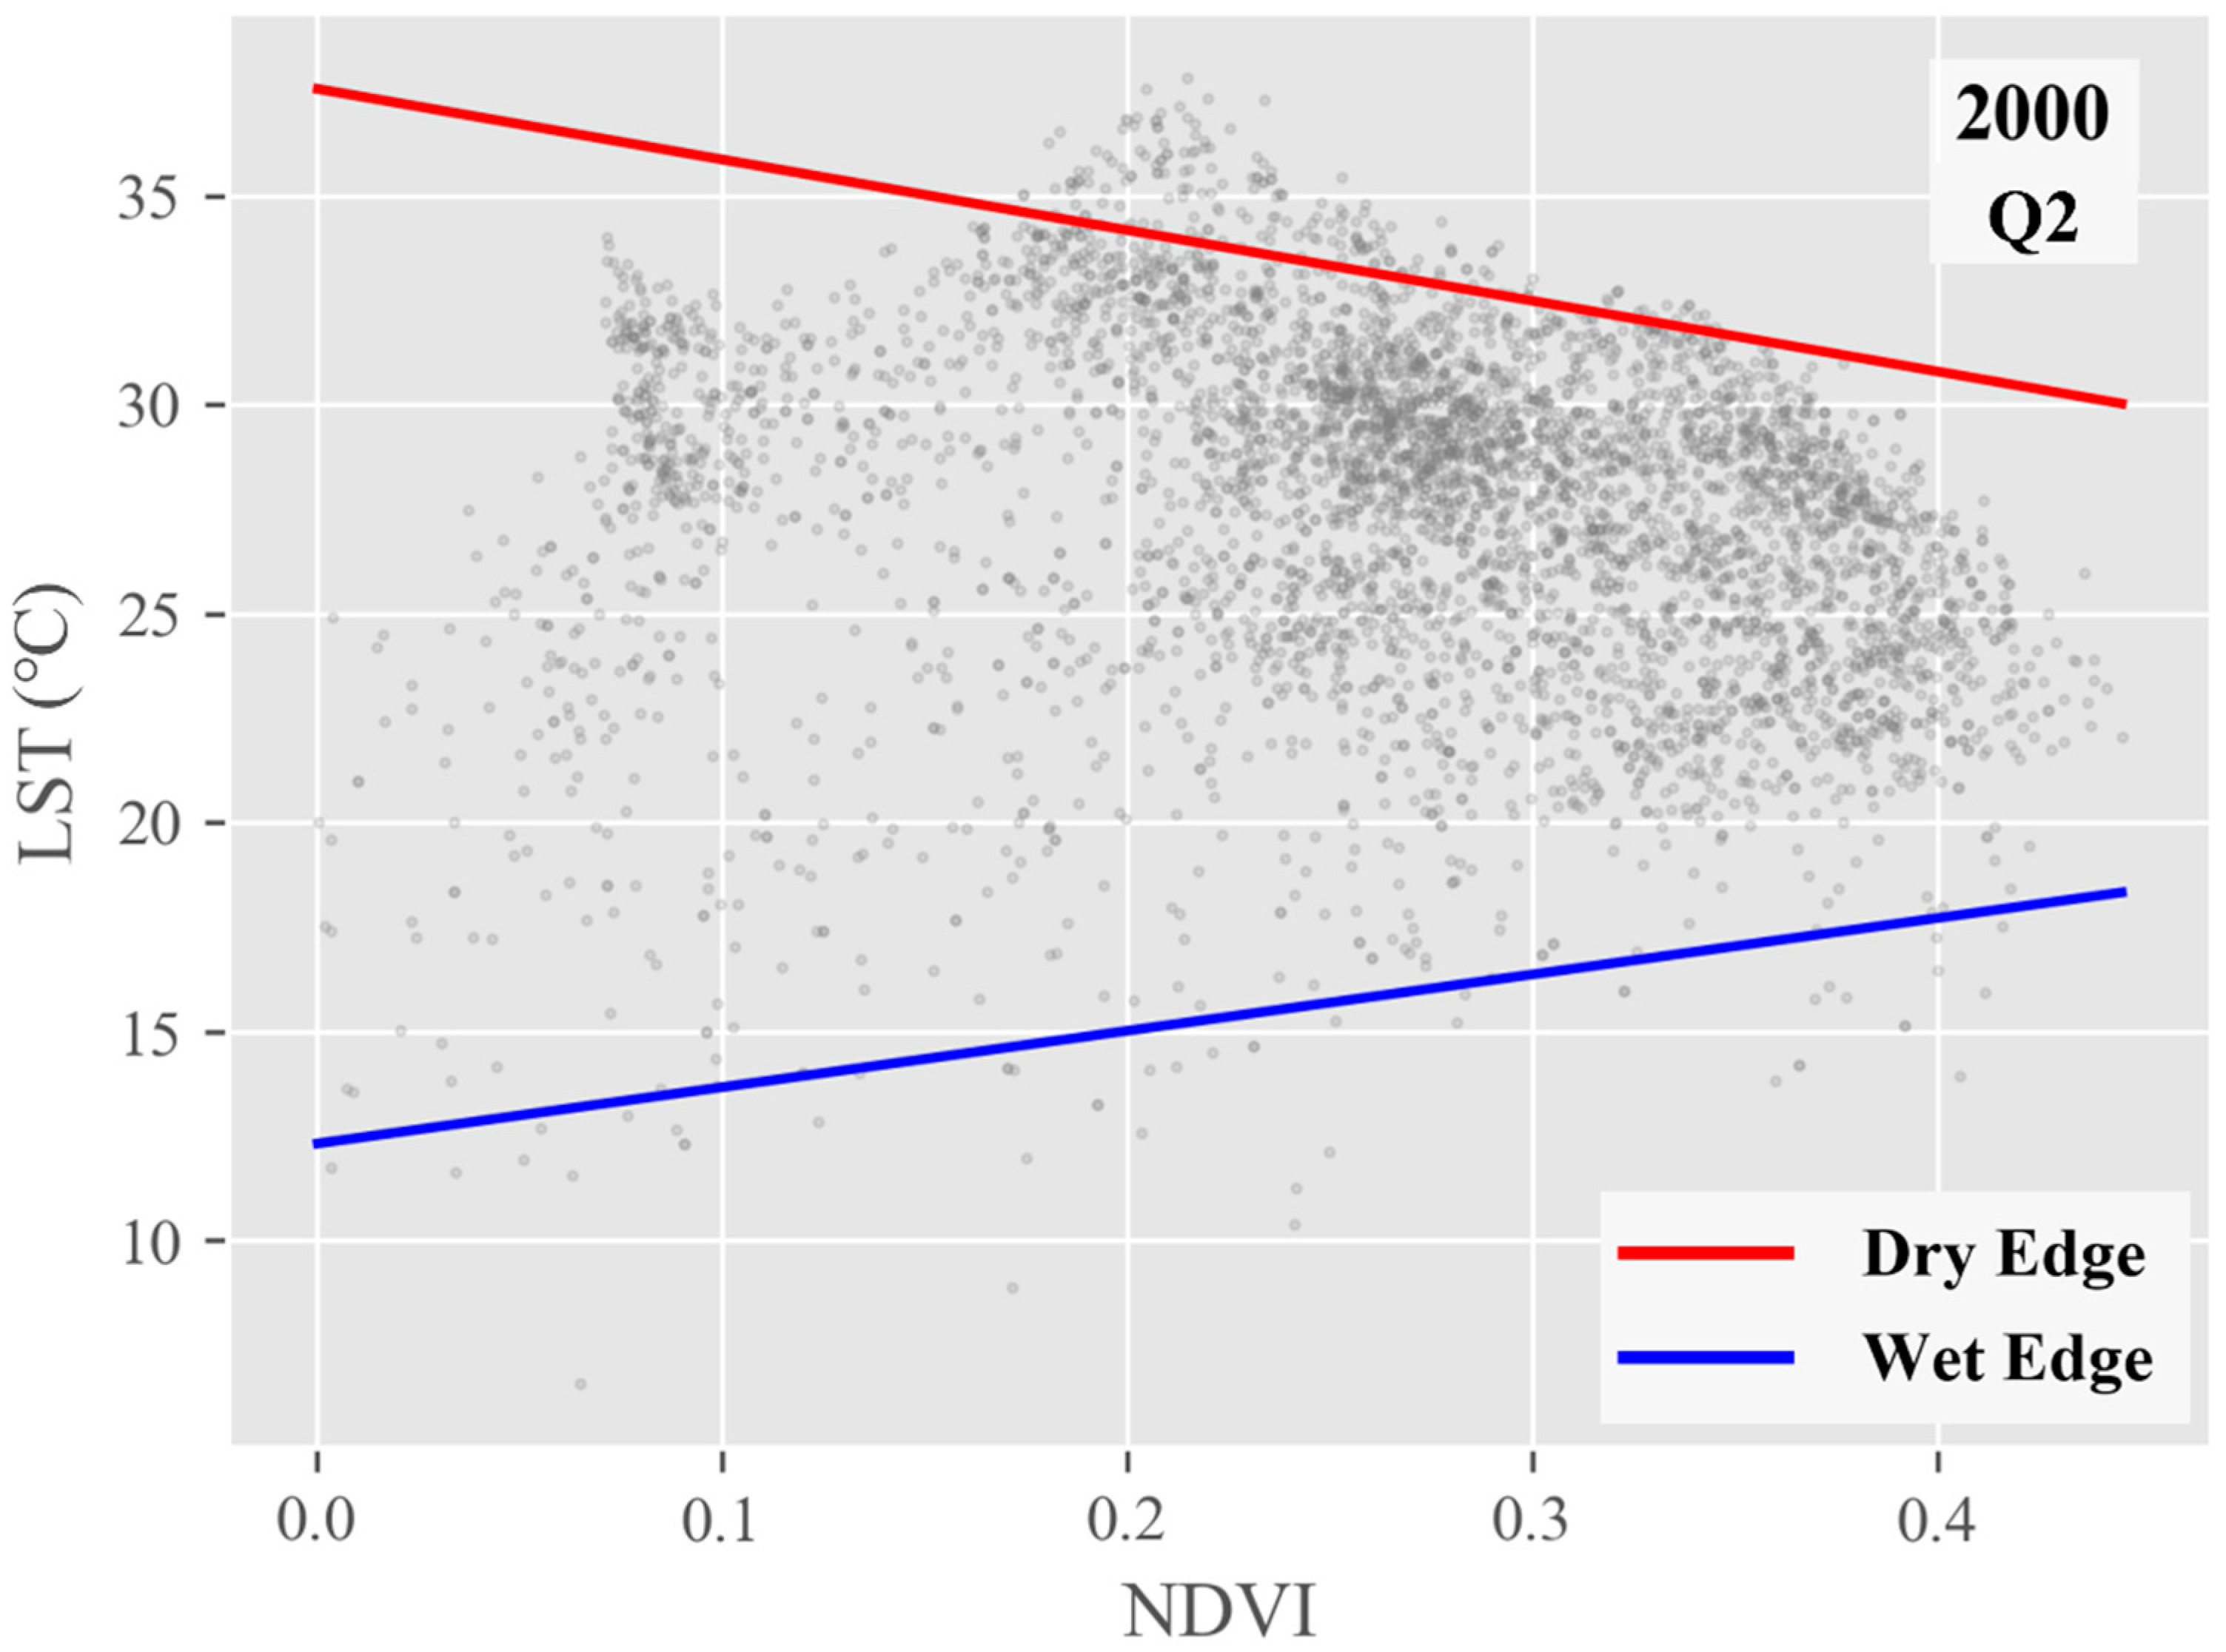
The TVDI was employed to assess soil moisture conditions across the study area, with its construction grounded in the NDVI-LST feature space [33]. This study adopted a quarterly modeling strategy, where NDVI-LST scatterplot analyses were performed independently for each quarter (Figures S1–S4). This approach ensures that the fitting equations for the dry edge () and the wet edge () accurately reflect the specific hydrothermal equilibrium of each season.
The TVDI values were calculated using the following formula:
In this equation, and represent the linear fitting results for a specific NDVI value. The TVDI ranges from 0 to 1, where higher values indicate increased levels of drought stress (Figure 3 and Figure S1–S4).
Figure 3.
NDVI-LST feature space.
2.3.4. Spatio-Temporal Trend and Gradient Analysis
The temporal dynamics of the surface environment were analyzed by calculating the annual and quarterly mean values of LST, NDVI, and TVDI from 2000 to 2024, focusing on their multi-year fluctuations and seasonal rhythms. On a spatial scale, statistical values for each variable were extracted across the five annular buffer zones to construct gradient curves based on the distance from the lake. This analysis aims to compare the environmental variations between near-shore and distal areas across different seasons, thereby quantifying the regulatory role of the lake effect on the surrounding hydrothermal balance and vegetation growth.
2.3.5. Correlation with Topography
Slope and aspect serve as continuous topographic variables that influence localized solar radiation and soil moisture redistribution. In this study, spatial correlation analyses were performed between quarterly LST, NDVI, and TVDI data and topographic factors (slope and aspect) to reveal the localized modulation effects of terrain on surface environmental variables. Specifically, aspect data were transformed using cosine or sine functions to effectively represent their periodic influence on solar radiation. Furthermore, the spatial correlation between the interannual trend slopes of each variable and the topographic factors was calculated to explore the underlying mechanisms by which terrain modulates the long-term evolution of ecological elements.
3. Results
3.1. Temporal Evolution Characteristics of the Surface Environment
3.1.1. Temporal Dynamics of LST
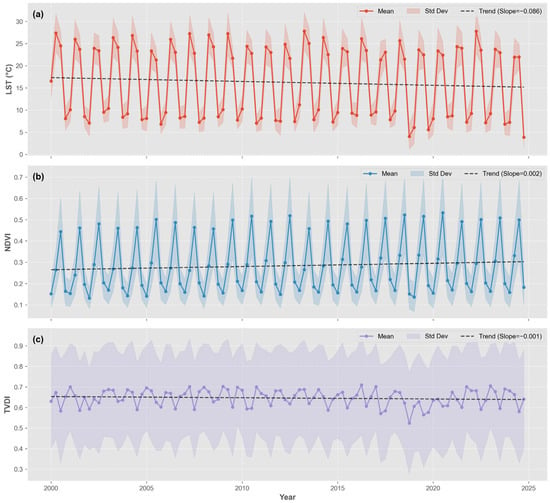
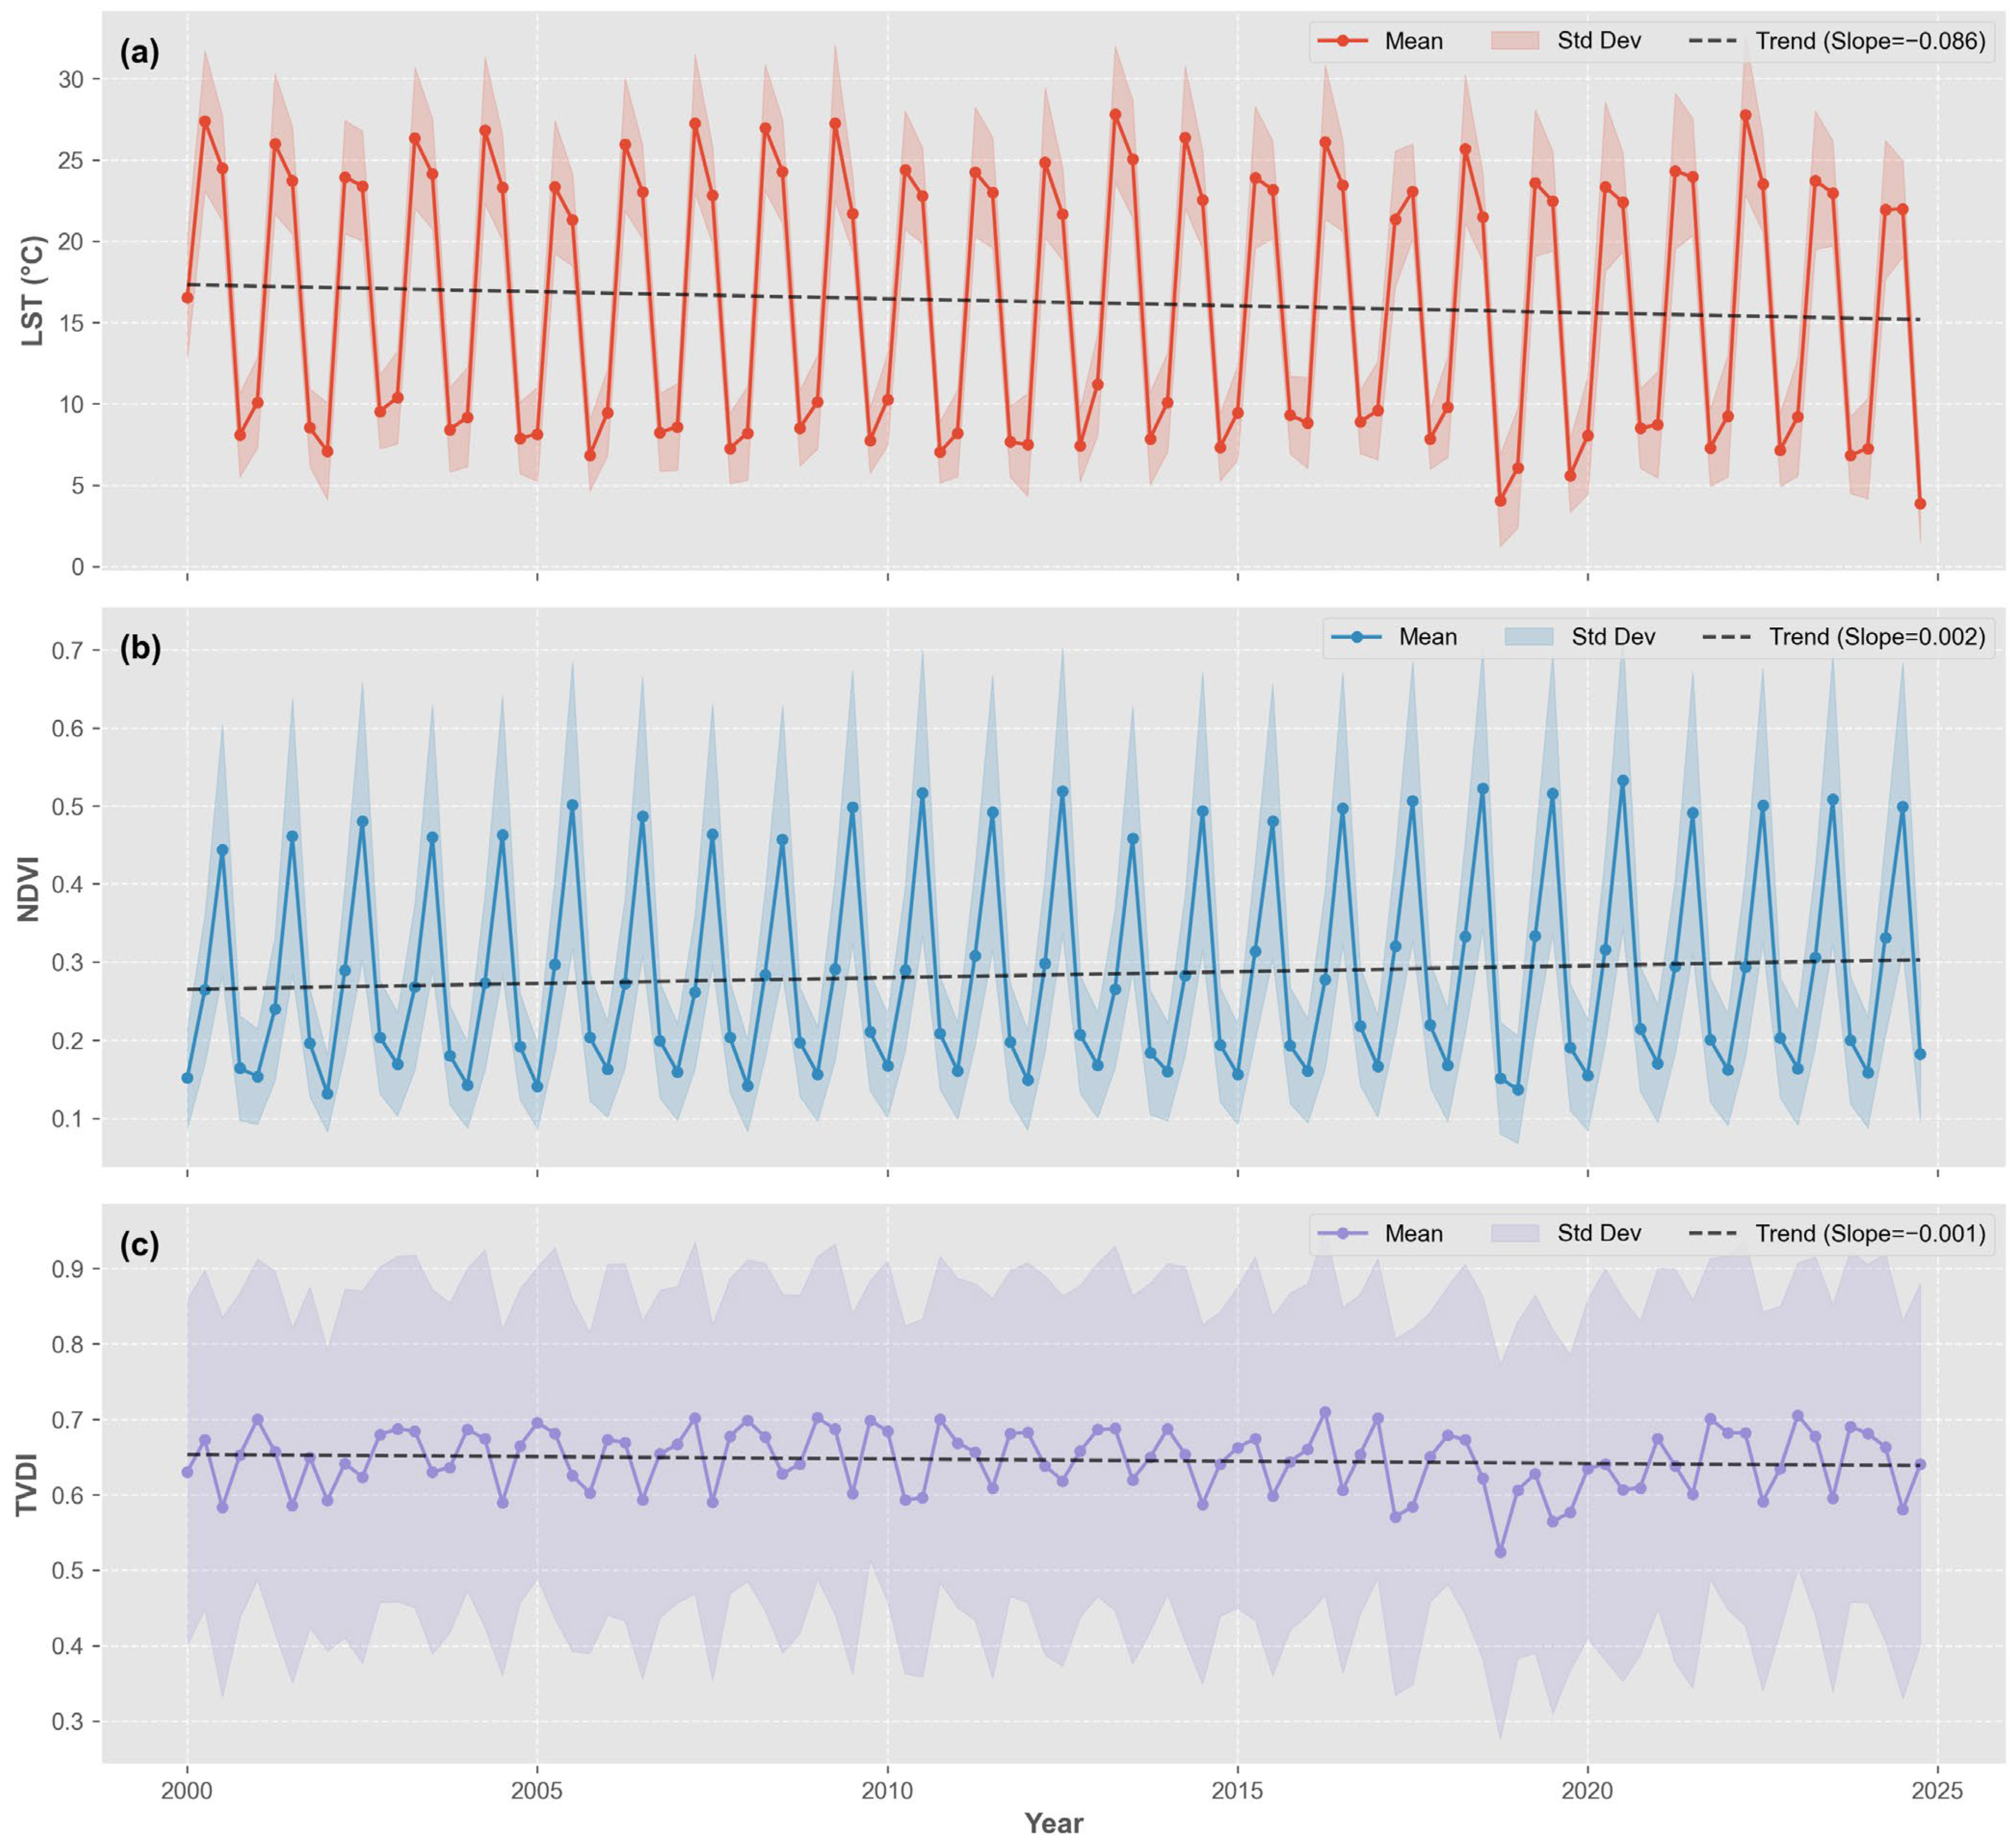
Based on the statistical data from 2000 to 2024, the LST within the study area exhibited pronounced seasonal differentiation and interannual fluctuations (Figure 4a). Among the four quarters, Q2 recorded the highest mean LST, with multi-year averages fluctuating between 22 °C and 28 °C, peaking in 2022 at 28 °C. The mean values for Q3 were slightly lower than those of Q2, primarily distributed within the 21 °C to 25 °C range. Conversely, Q1 showed the lowest LST averages coupled with intense interannual volatility, reaching a historical minimum of 6.5 °C in 2019. In terms of data dispersion, Q2 exhibited the largest standard deviation, fluctuation exceeds 4 °C, which indicates a highly heterogeneous spatial distribution of surface heat during this phase. Furthermore, maximum LST values frequently exceeded 35 °C during Q2, while minimum values dropped to approximately −6.7 °C during Q1.
Figure 4.
Temporal trends of environmental variables (a) LST trends; (b) NDVI trends; (c) TVDI trends.
3.1.2. Temporal Dynamics of NDVI
Over the study period, vegetation coverage exhibited a distinct upward trend. Q3, the peak growing season, saw mean NDVI values rise progressively from 0.45 in 2000 to over 0.51 by 2024, with a record high of 0.515 in Q3 2023. Similarly, the mean NDVI for Q2 increased from 0.27 in 2000 to 0.33 in 2024, reflecting a substantial improvement in vegetation conditions during the early growing season. Regarding extreme values, the maximum NDVI during Q3 consistently remained above 0.7, surpassing 0.8 in several years. Meanwhile, the standard deviation of the NDVI across all quarters remained relatively stable, with Q3 maintaining a variability of approximately 0.17 (Figure 4b).
3.1.3. Temporal Dynamics of TVDI
The TVDI characterizes the temporal dynamics of moisture deficits across the study area. From 2000 to 2024, Q2 recorded the highest mean TVDI (ranging from 0.57 to 0.7), indicating that surface drought stress is most pronounced during this period. In contrast, the mean TVDI for Q3 was relatively lower (0.56 to 0.63), suggesting a mitigation of drought conditions compared to Q2. Long-term sequences show frequent interannual fluctuations in TVDI. The mean values for TVDI exhibited a wide range of variation, with standard deviations consistently exceeding 0.2, signifying high spatial heterogeneity in moisture conditions in the study area. Across all quarters, minimum TVDI values approached 0.0, while maximums reached 1.0, reflecting a complete moisture gradient from hyper-humid to hyper-arid conditions within the study area (Figure 4c).
3.2. Statistical Distribution and Quarterly Variability Analysis
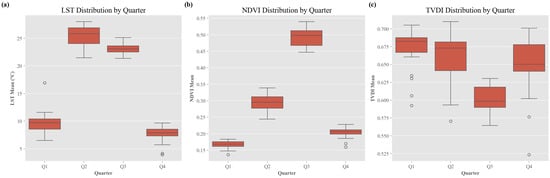
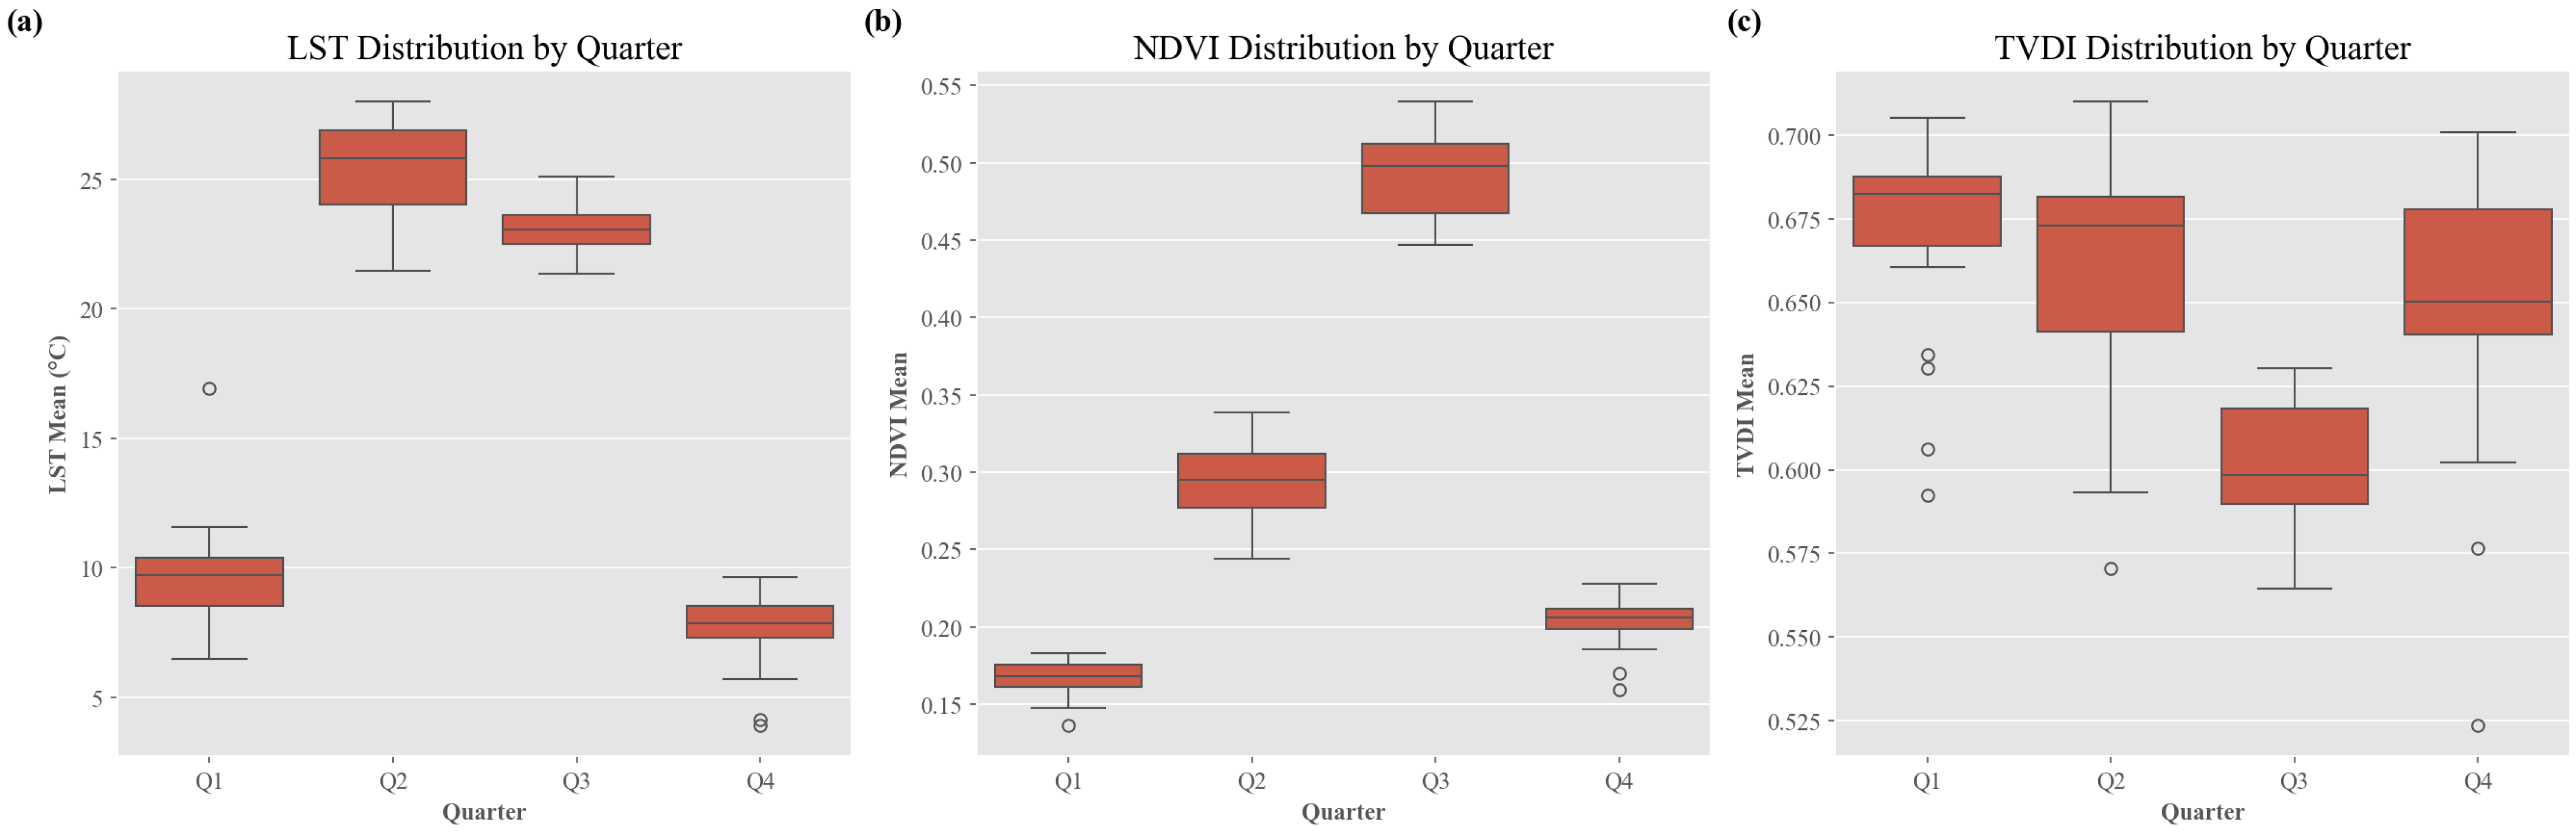
A comprehensive analysis of the quarterly boxplots for LST, NDVI, and TVDI quantitatively elucidates the seasonal fluctuations and numerical distribution characteristics of environmental variables over the 25-year study period (Figure 5). The quarterly distribution of LST reveals a distinct thermal gradient across the annual cycle. Median LST values in Q2 reached the highest annual level (approximately 27.5 °C), accompanied by an interquartile range significantly broader than that of other quarters. This indicates that surface thermal states during the spring-to-summer transition exhibit intense interannual volatility. In contrast, the temperature distribution in Q3 remained more concentrated, with a median slightly lower than that of Q2. The low-value ranges observed in Q1 and Q4 reflect the protracted cold environment characterizing the region for half of the year. The statistical distribution of NDVI characterizes the robust phenological rhythm inherent to the alpine ecosystem. Data for Q3 were significantly elevated compared to other seasons, with the median surpassing 0.5 and a narrow box width, suggesting that summer vegetation growth has maintained high stability over the past 25 years. Notably, prominent upper outliers in both Q2 and Q3 reflect that vegetation productivity in recent years has frequently exceeded historical conventional distribution limits, pointing toward a persistent greening trend. The distribution characteristics of TVDI reveal a significant seasonal shift in moisture stress. The Q2 distribution remained elevated with a median near 0.7, confirming that spring is the period of most severe drought stress within the study area. Upon entering Q3, the distribution range shifted downward and contracted significantly, indicating a uniform improvement in regional aridity following seasonal precipitation recharge. Furthermore, the extended box lengths for Q1 and Q4 reflect high interannual variability in surface moisture conditions during the non-growing season, primarily modulated by snow cover and freeze–thaw processes.
Figure 5.
The statistical distribution by quarter: (a) LST; (b) NDVI; (c) TVDI.
3.3. Characterization of Environmental Patterns
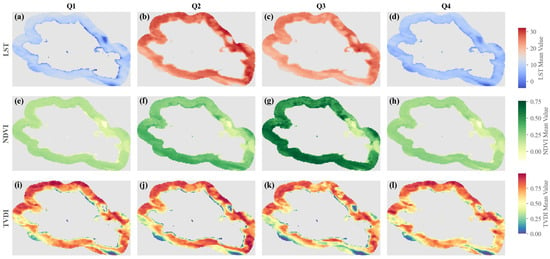
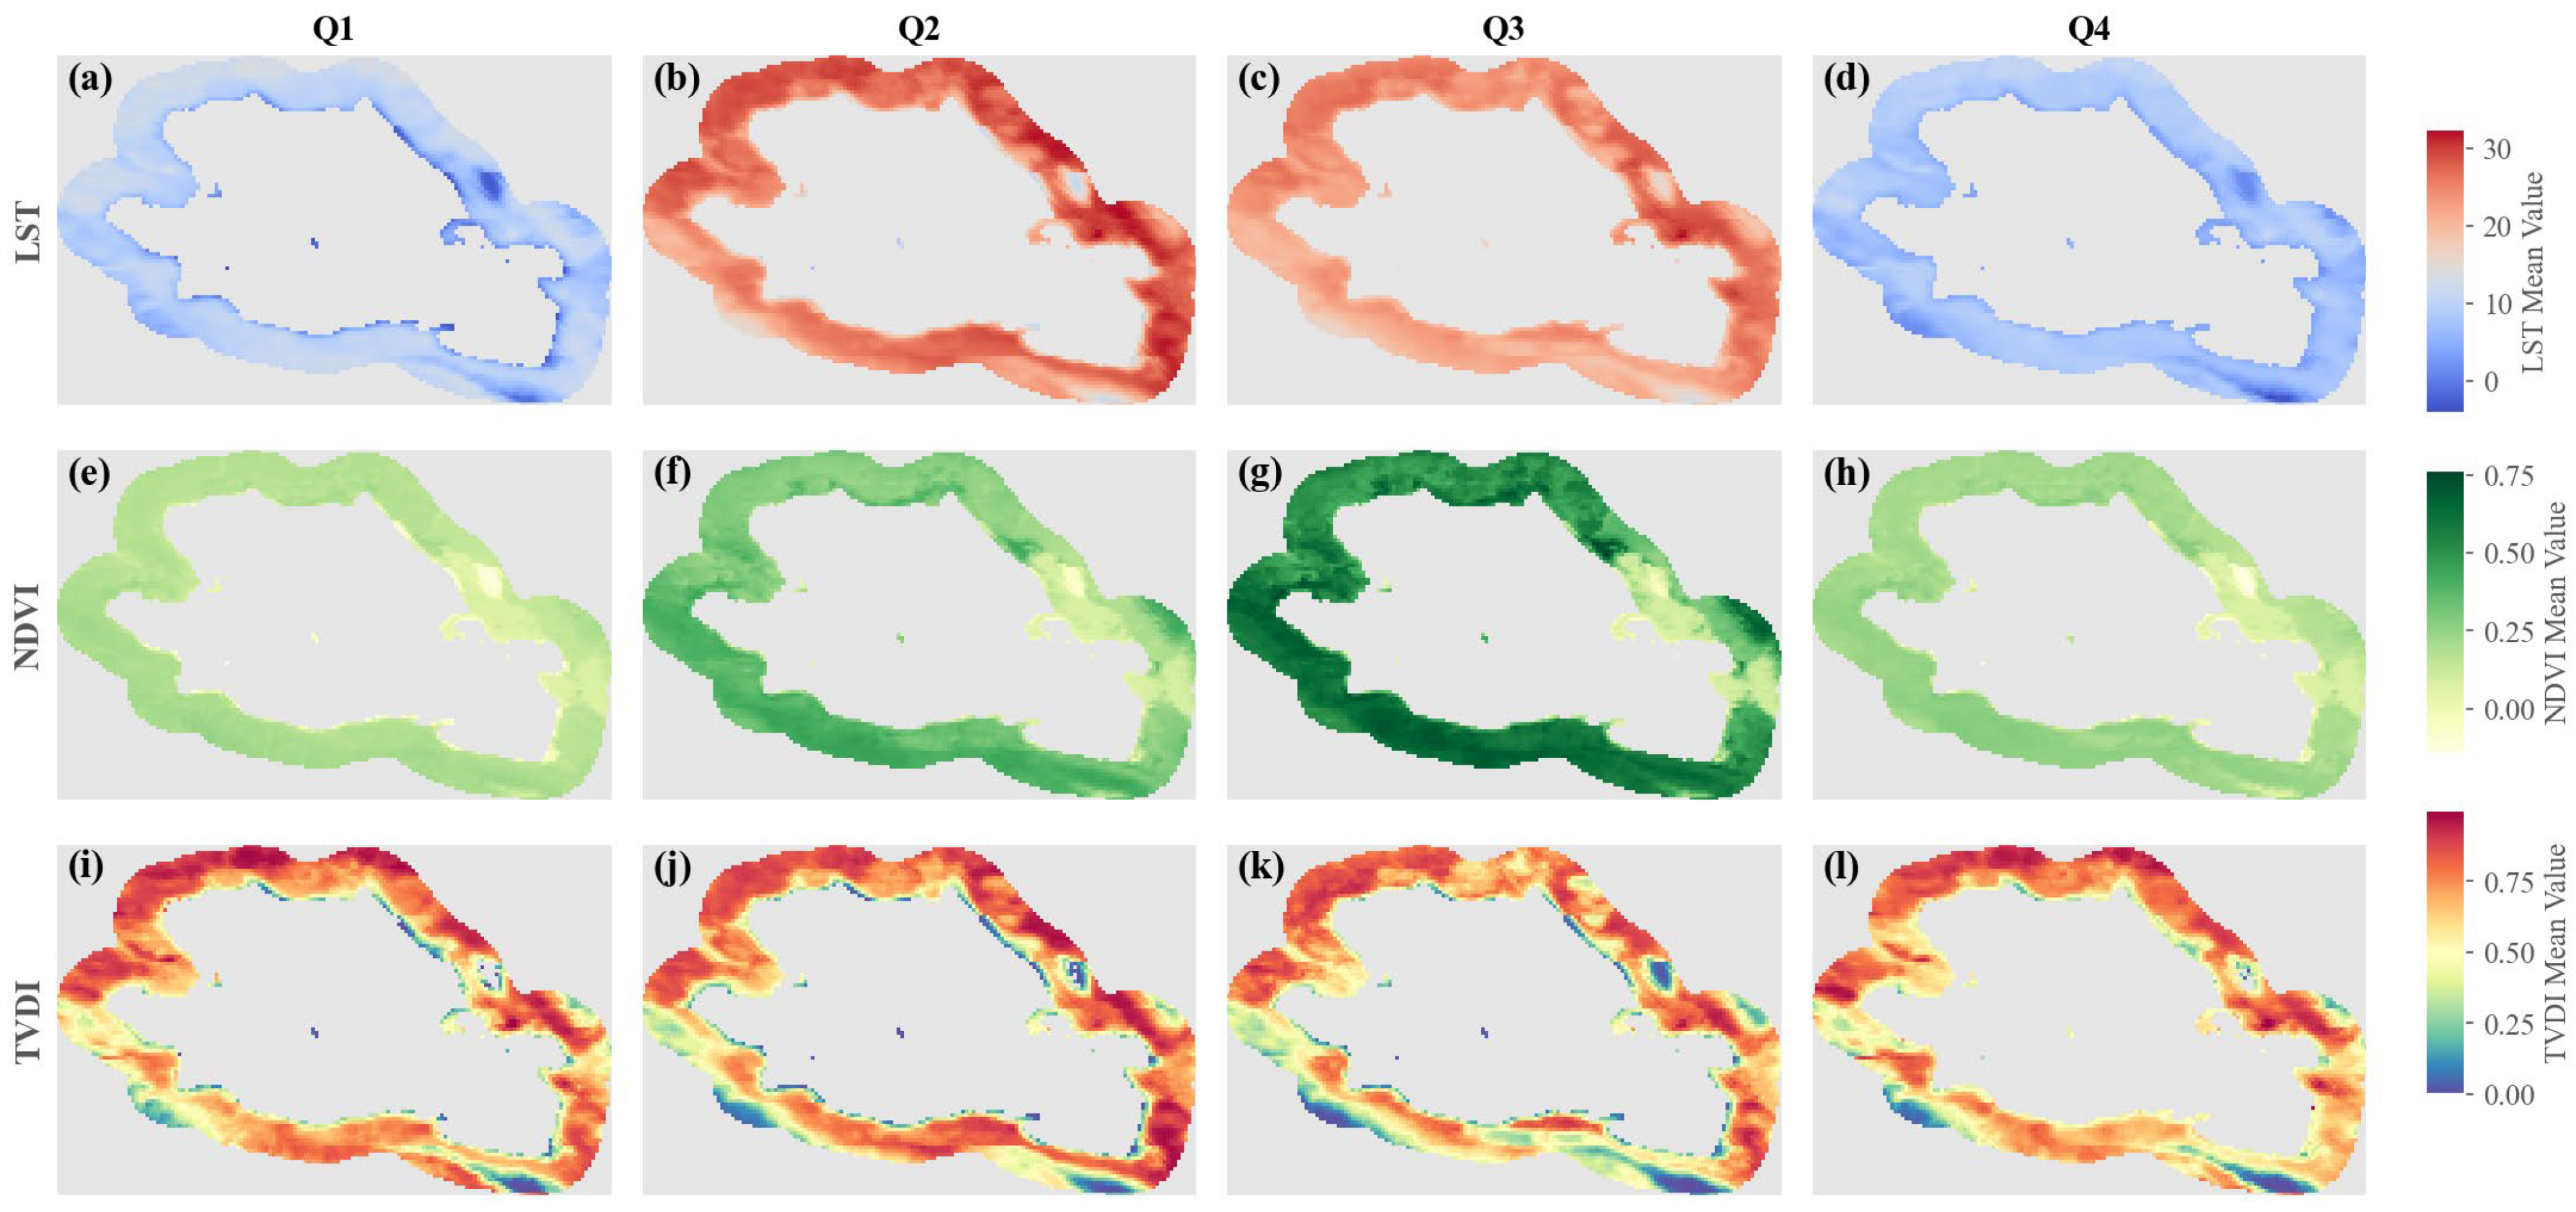
The spatial patterns of the LST, NDVI, and TVDI across the study area reveal a sophisticated interplay between seasonal succession and lake-mediated regulation. Thermal patterns exhibit a distinct expansion–contraction dynamic: the widespread high temperatures observed in Q2 (24 °C to 30 °C) transition into a conspicuous near-shore cooling belt in Q3. In this period, temperatures in the immediate riparian zone are lower than those in the distal hinterland, reflecting the lake’s potent summer thermal buffering (Figure 6a–d). Concurrently, vegetation growth displays a pronounced spatial heterogeneity; while NDVI remains at a baseline below 0.2 during the dormant periods of Q1 and Q4, it reaches peak productivity in Q3. During this peak season, high-coverage pixels (NDVI > 0.5, occasionally > 0.7) are concentrated in favorable microclimates, contrasting sharply with more arid sectors where values remain below 0.3 (Figure 6e–h). This ecological zonation is fundamentally driven by the regional moisture regime, which transitions from severe, domain-wide drought stress in Q1 and Q2 (TVDI > 0.75) to a state of significant mitigation in Q3. This relief is particularly evident within the circum-lake buffer and specific topographical moisture-retention zones, where the TVDI recedes to approximately 0.5. The consistent spatial convergence of TVDI hotspots with LST maxima and NDVI minima quantitatively underscores the decisive role of the hydrothermal balance in modulating the regional ecological landscape (Figure 6i–l).
Figure 6.
The environmental patterns of different quarters: (a–d) the spatial configurations of LST; (e–h) the spatial configurations of NDVI; (i–l) the spatial configurations of TVDI.
3.4. Interaction and Coupling Characteristics of Environmental Variables
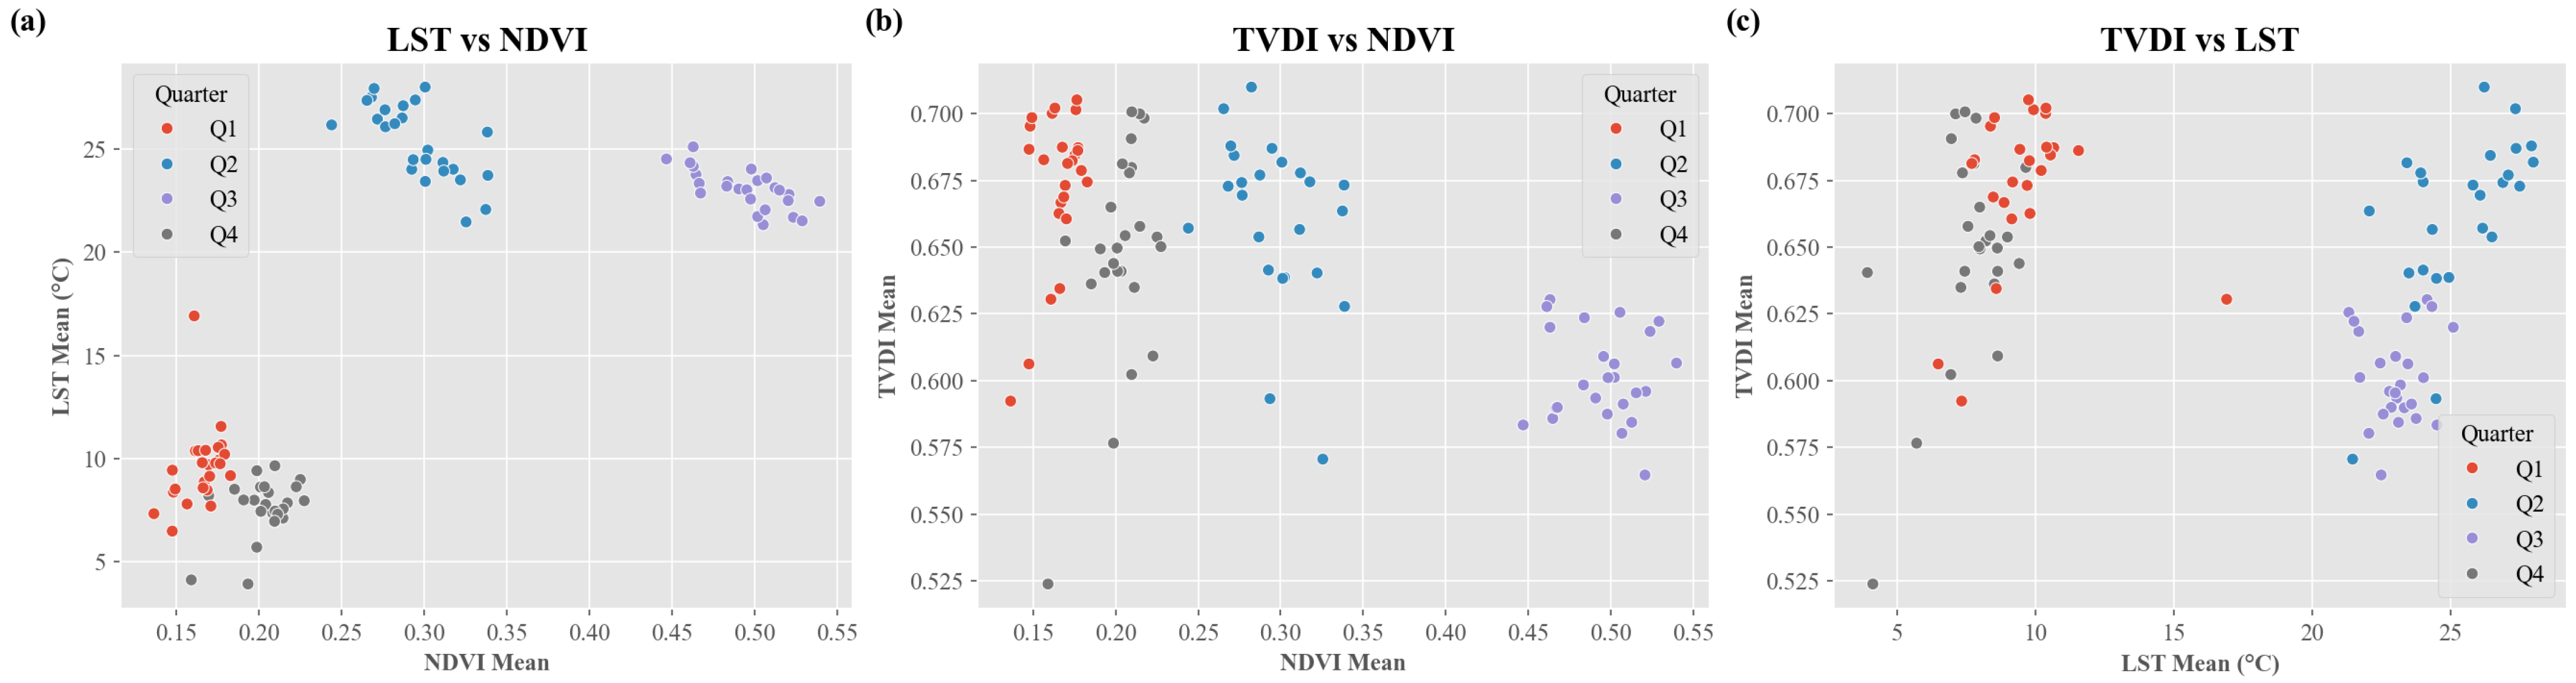
The bivariate scatterplots of LST, NDVI, and TVDI quantify the non-linear coupling and seasonal clustering of environmental variables. Across Figure 7 and Table S1, NDVI correlates positively with LST (r = 0.725, p < 0.001) and negatively with TVDI (r = −0.600, p < 0.001), while LST and TVDI show a weaker negative association (r = −0.231, p = 0.0209), consistent with a moisture-stress constraint on biomass. The LST–NDVI relationship suggests a thermal-threshold pattern, where the low-temperature limitation in Q1/Q4 shifts to a more favorable growth regime in Q3, in line with seasonal means (NDVI 0.297 in Q2 and 0.495 in Q3; TVDI 0.661 in Q2 and 0.601 in Q3). The seasonal migration of scatter points from a warm–dry cluster in Q2 to a cooler and wetter cluster in Q3 indicates that drought alleviation is an important contributor, rather than temperature alone, to peak-season vegetation expansion. The concurrent weakening of LST–TVDI coupling from Q2 to Q3 further suggests negative feedback in which dense vegetation may moderate surface heating through enhanced transpiration. Lagged correlation analysis based on quarterly means shows the strongest coupling at lag 0 (NDVI–LST: r = 0.725, p < 0.001; NDVI–TVDI: r = −0.600, p < 0.001), whereas lag-1 and lag-2 correlations are weaker and exhibit sign reversals (e.g., NDVI–LST: r = 0.540 at lag 1 and r = −0.759 at lag 2; NDVI–TVDI: r = 0.313 at lag 1 and r = 0.445 at lag 2; all p < 0.01). These shifts likely reflect the strong seasonal cycle in quarterly data; thus, the lagged results are interpreted as suggestive of potential asynchrony rather than definitive causality.
Figure 7.
Interaction of Environmental Variables: (a) LST vs. NDVI; (b) TVDI vs. NDVI; (c) TVDI vs. LST.
3.5. Topographic Modulation of Surface Environmental Variables
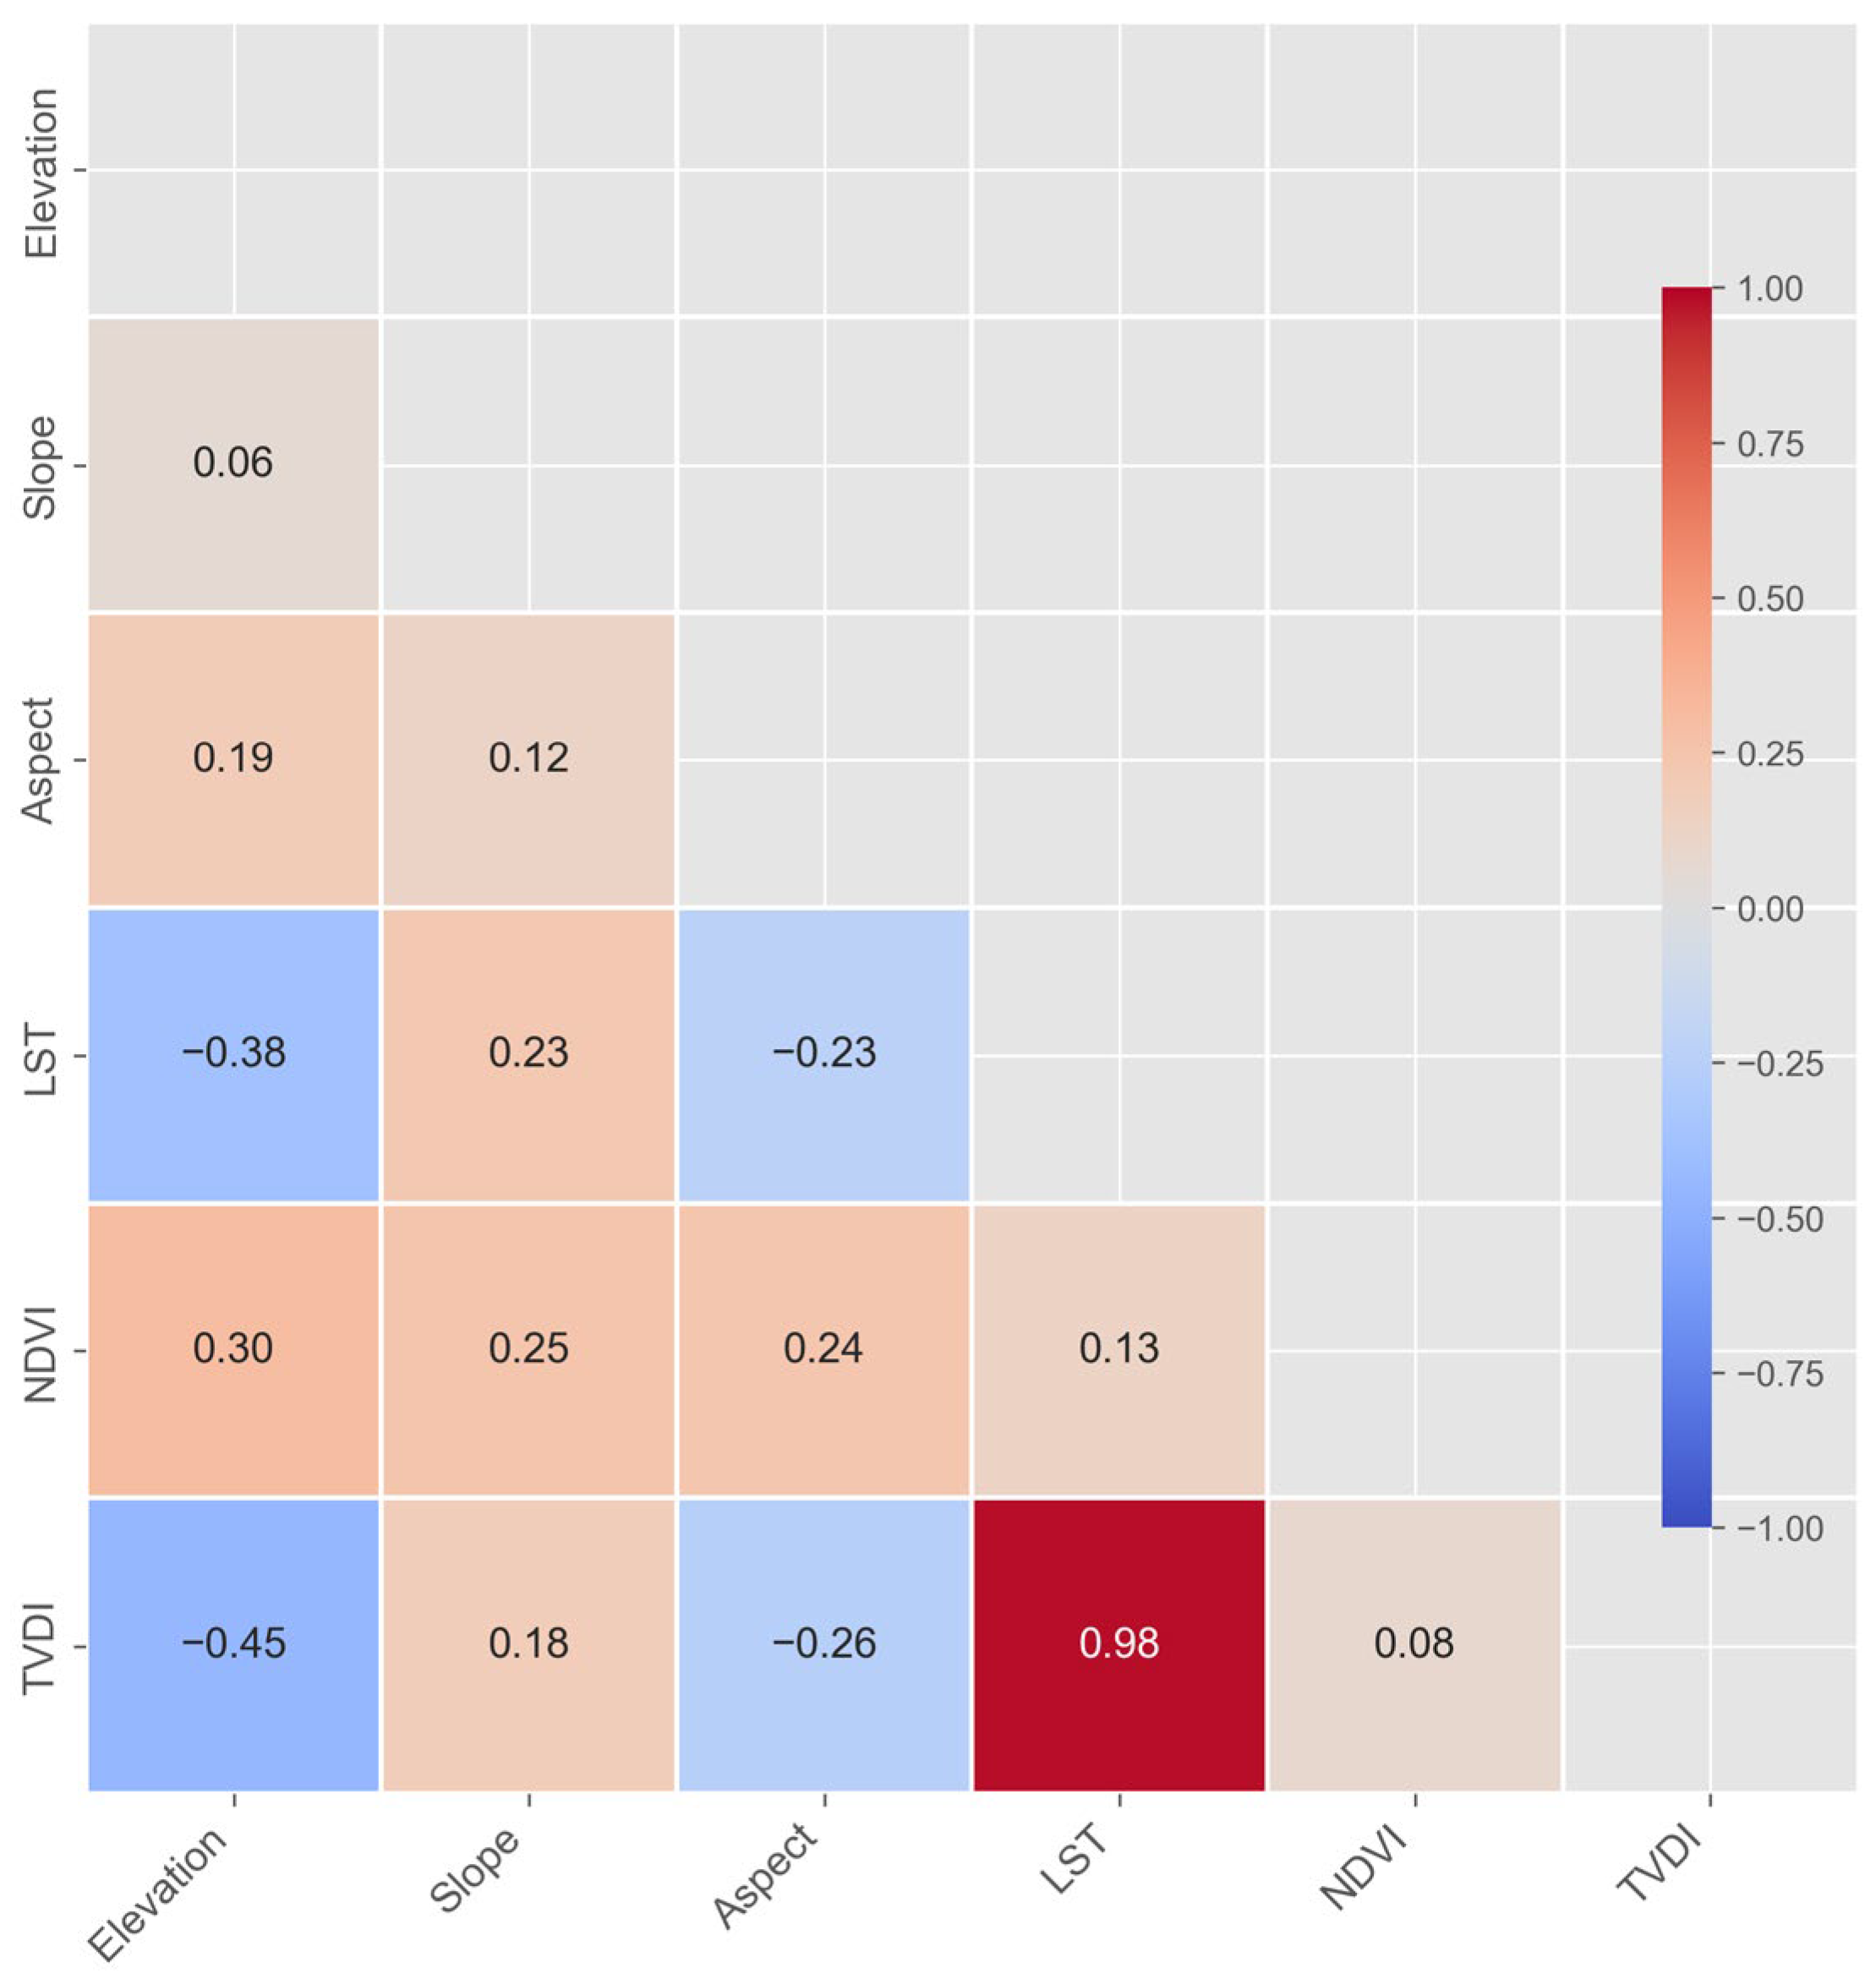
Quantitative spatial coupling between topographic determinants and surface variables reveals that elevation serves as the primary driver of the regional thermal landscape (r = −0.38 with LST). This correlation reinforces the principle of vertical zonality, where adiabatic cooling contributes to surface temperature declines at higher altitudes. Correspondingly, a robust negative correlation between elevation and TVDI (r = −0.45) indicates that lower evapotranspiration rates and potential orographic effects at high altitudes help alleviate moisture deficits. Vegetation dynamics exhibit positive sensitivity to topographic complexity, as evidenced by the correlations between NDVI and elevation (r = 0.30), slope (r = 0.25), and aspect (r = 0.24). These coefficients suggest that localized microclimatic niches facilitated by varied terrain promote biomass accumulation. Specifically, steeper slopes may harbor enhanced moisture retention due to topographic shading, thereby sustaining higher photosynthetic productivity. Furthermore, the inverse relationships between aspect and both LST (r = −0.23) and TVDI (r = −0.26) suggest the distinct hydrothermal partitioning between poleward and equatorward slopes. Ultimately, topographic factors serve as key spatial modulators, redistributing solar radiation and hydrological resources to shape the heterogeneous ecological patterns surrounding the lake (Figure 8).
Figure 8.
Correlation matrix between topographic factors and surface environmental variables in the Qinghai Lake riparian zone.
4. Discussion
4.1. Mechanisms of Topographic Forcing on Environmental Variables Surrounding Qinghai Lake
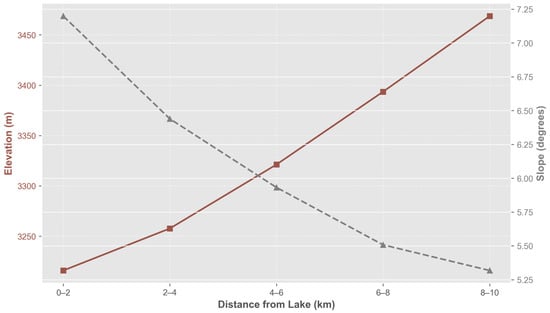
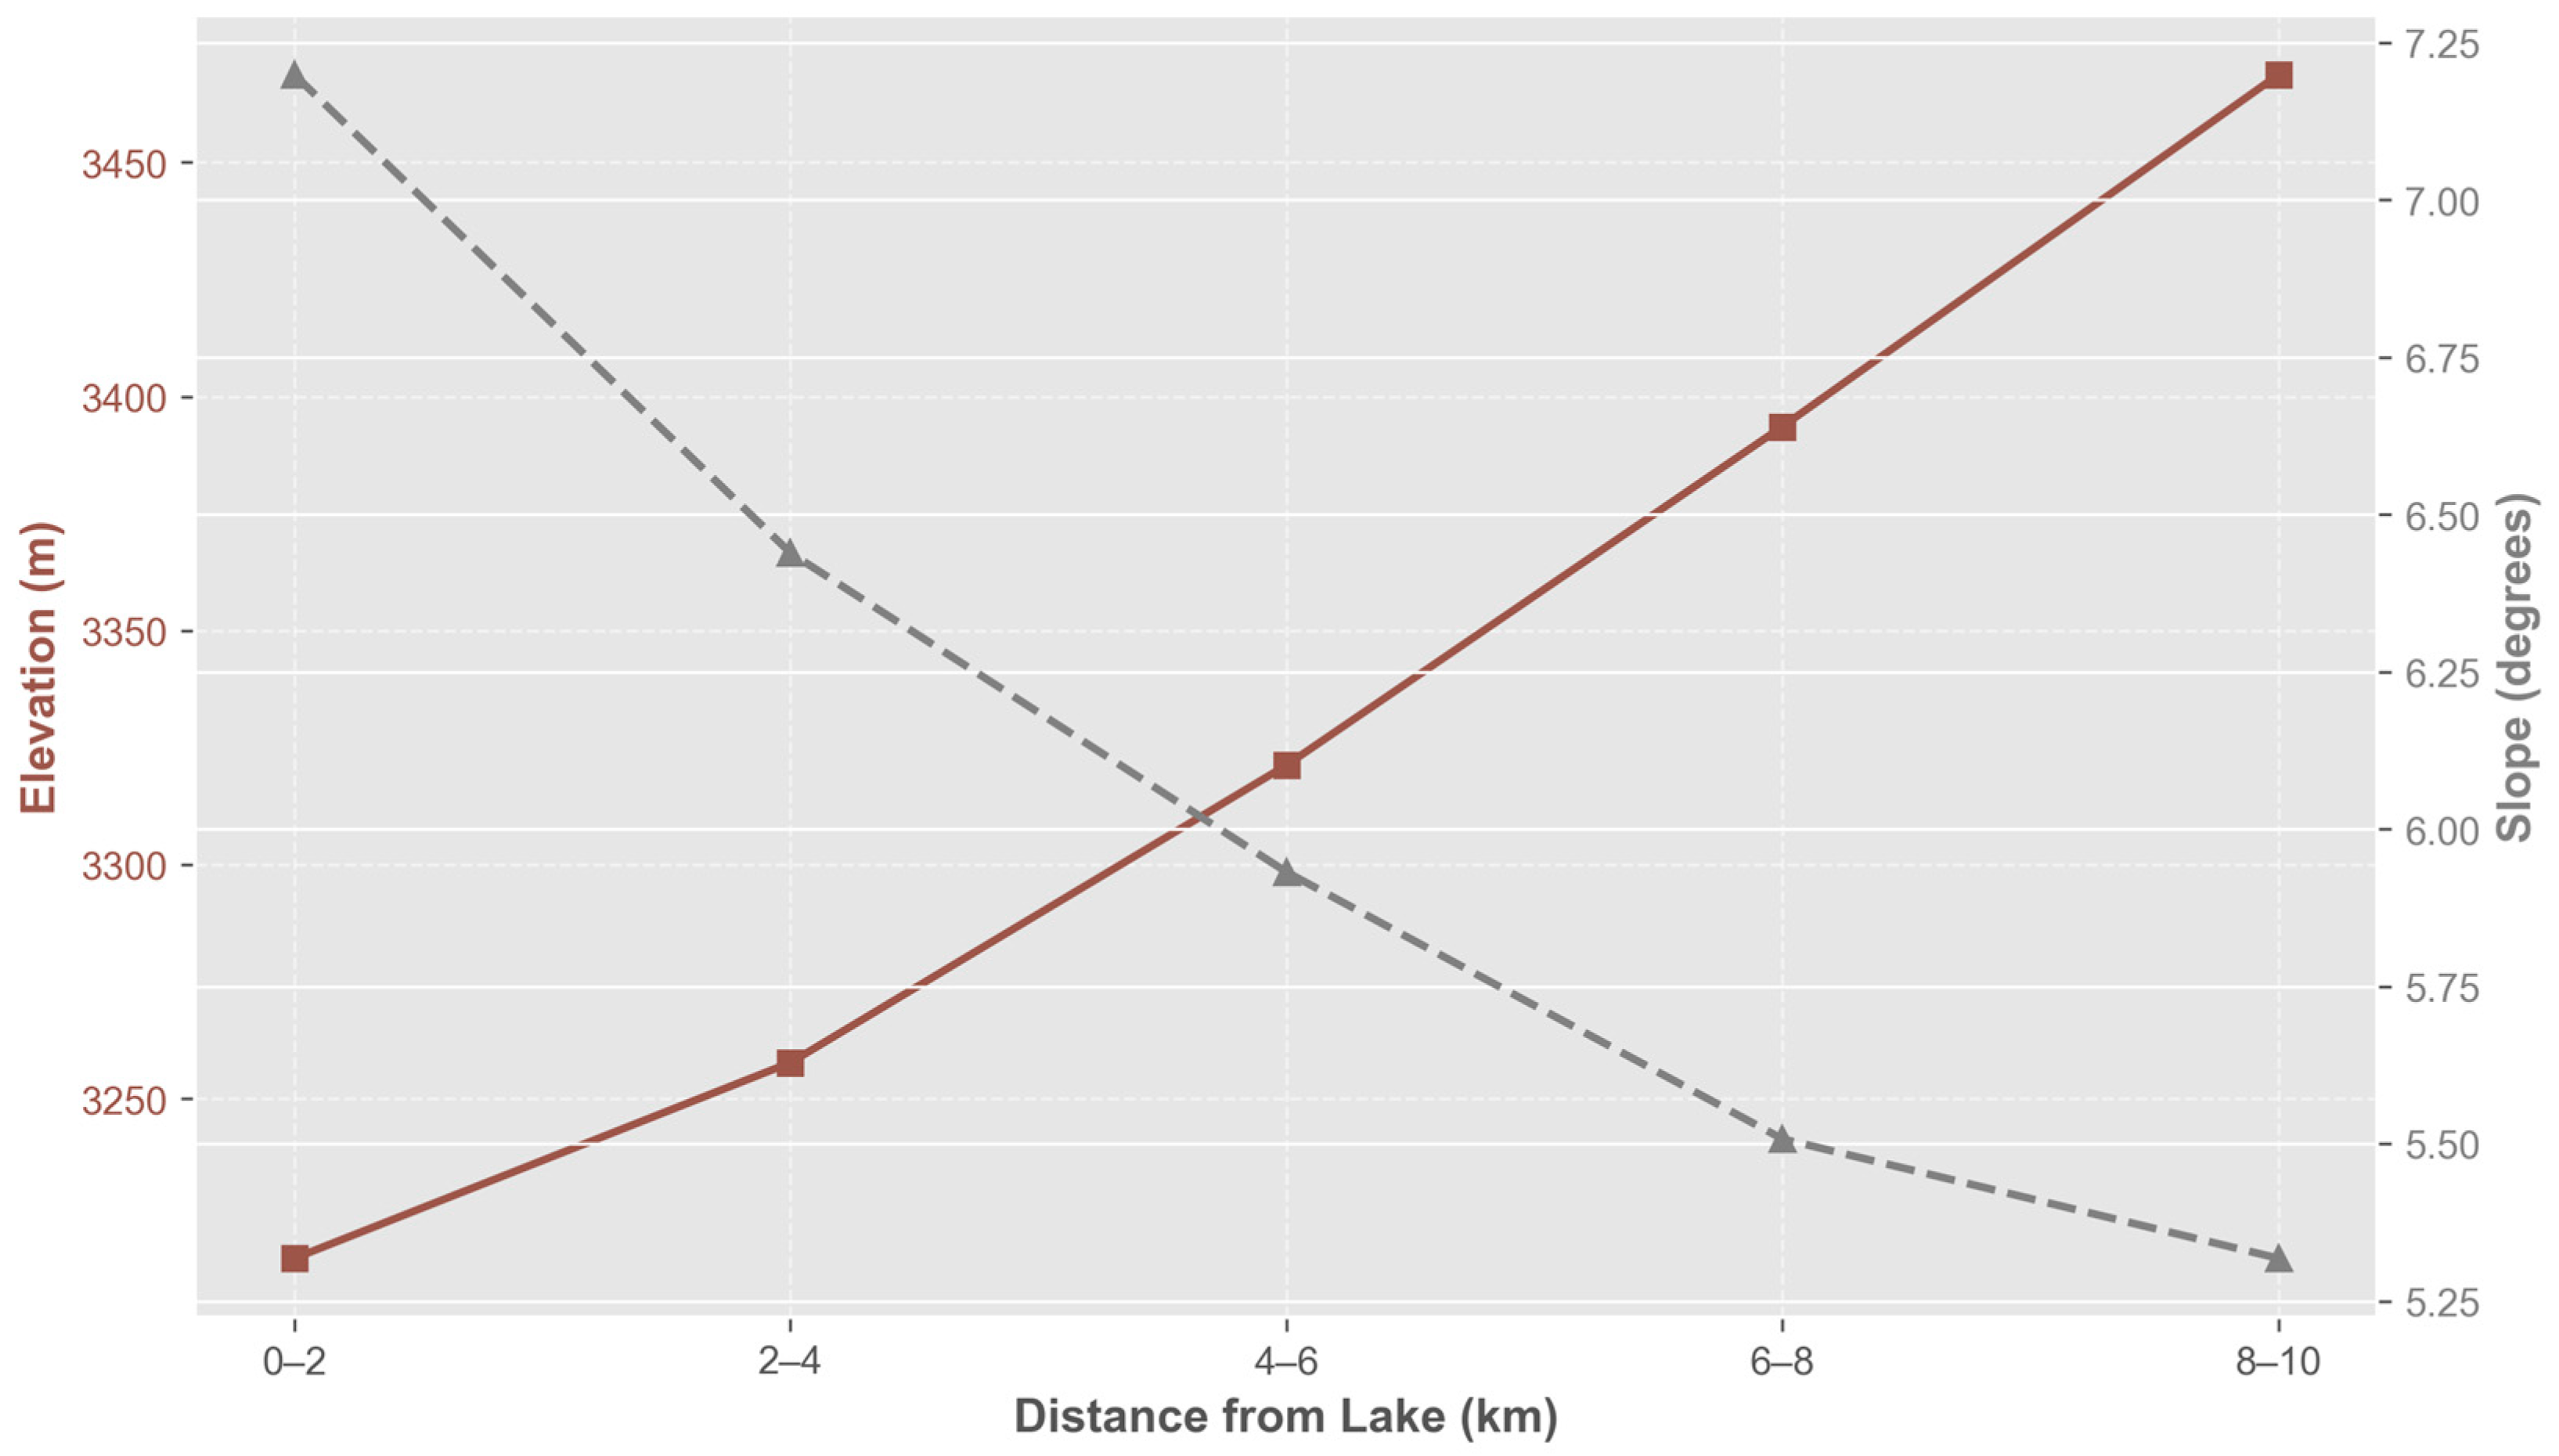
Topographic configurations establish the physical foundation for the spatial allocation of environmental variables within the study area. The terrain surrounding Qinghai Lake exhibits a pronounced gradient characterized by low-elevation steepness near the shore and high-elevation flatness in distal areas. Specifically, as the distance from the lake increases, the mean elevation rises steadily from below 3250 m to 3468 m, while the surface slope diminishes significantly from 7.2° to 5.3°. This topographic arrangement dictates divergent surface processes: although the riparian zone (0–2 km) is contiguous with the water body, its low-lying but steep terrain facilitates rapid runoff loss. In contrast, the high-altitude regions further inland feature more gradual slopes, favoring moisture infiltration and accumulation. This lake-to-inland topographic gradient provides the fundamental spatial framework for the redistribution of localized hydrothermal conditions, upon which environmental factors manifest distinct vertical zonation and synergistic response mechanisms (Figure 9).
Figure 9.
Topographic variations in elevation and slope along the distance-to-lake gradient.
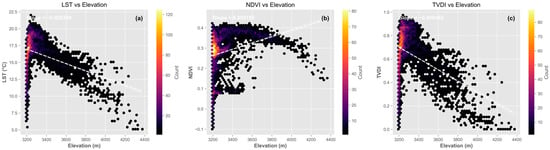
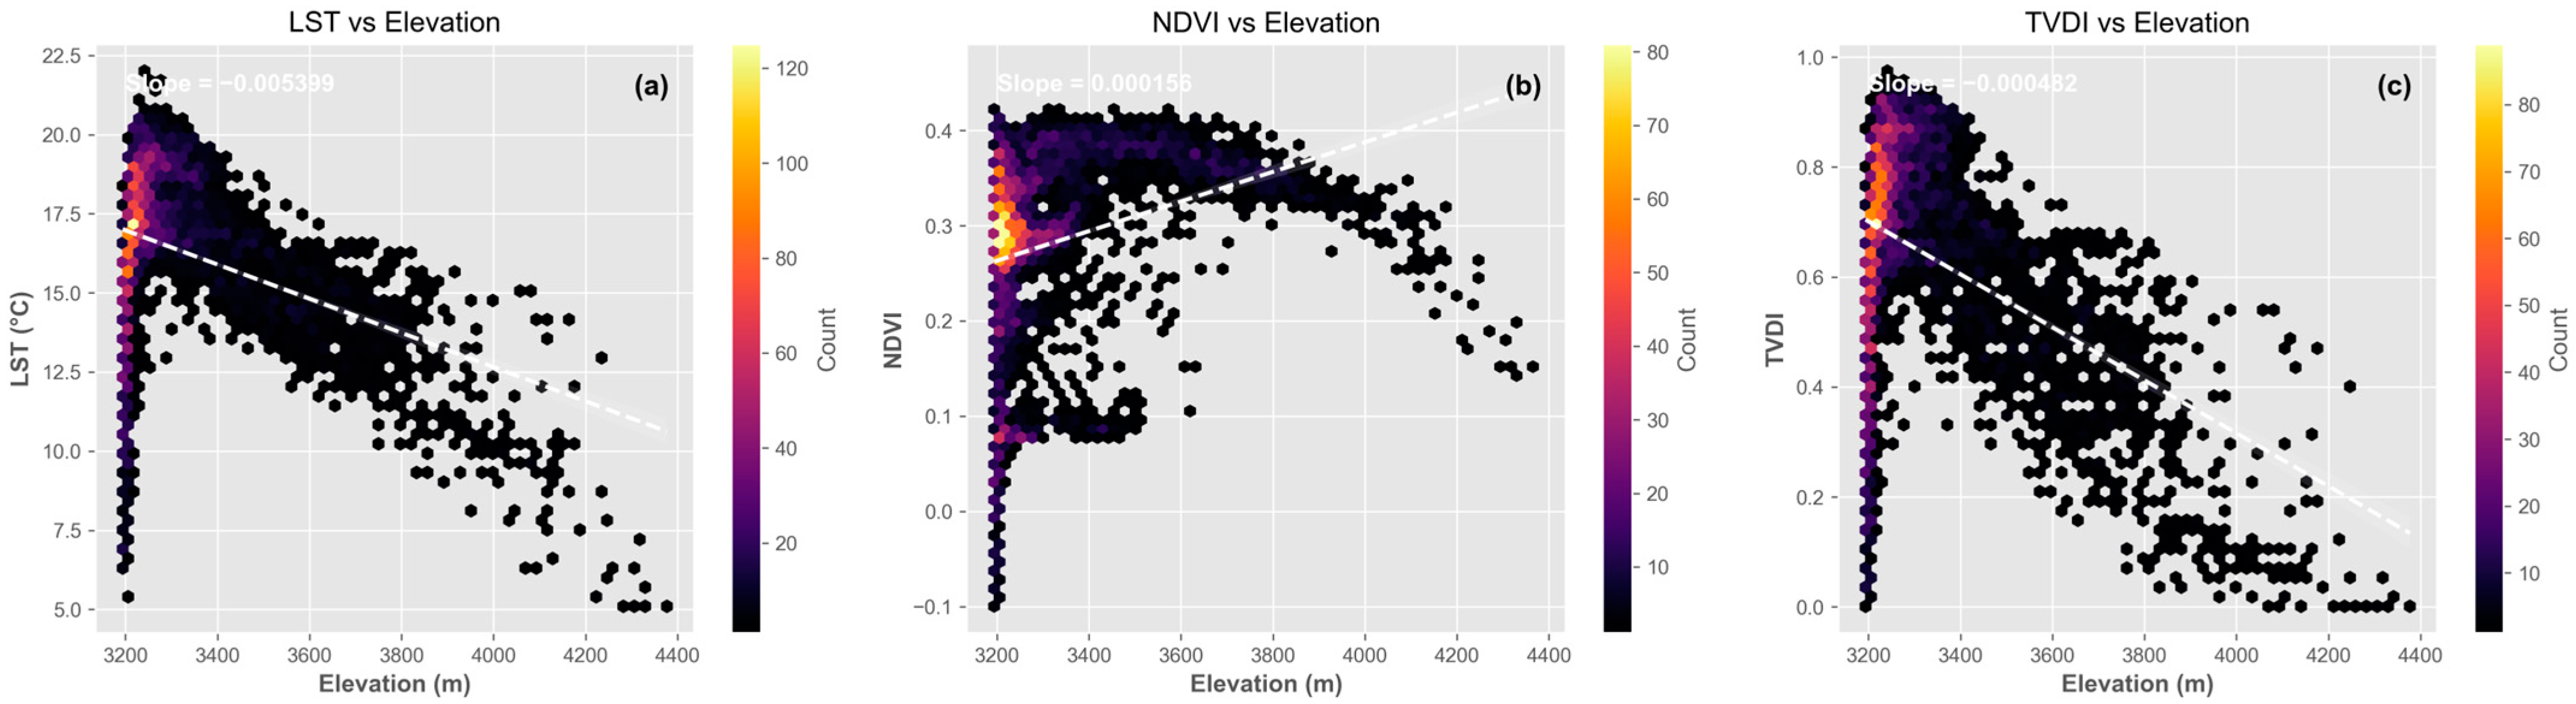
Density scatterplot regression analysis further substantiates the driving role of elevation in shaping microclimates and ecological patterns (Figure 10). Land Surface Temperature exhibits a pronounced vertical lapse rate with increasing altitude (r = −0.38), reflecting the inhibitory effect of elevation on heat accumulation. Crucially, moisture stress alleviates significantly as elevation rises (r = −0.45), while vegetation coverage demonstrates a corresponding upward trend (r = 0.30). This synergy of high altitude, reduced aridity, and enhanced vegetation is fundamentally a consequence of the coupling between topographic physical properties and climatic forcing. The lower temperatures associated with higher altitudes effectively diminish surface evapotranspiration rates. When coupled with the superior moisture retention of the flatter high-altitude terrain, these factors collectively mitigate regional moisture constraints. These findings underscore that, in the vicinity of Qinghai Lake, topography profoundly shapes the spatial differentiation of the ecological environment by modulating the dual processes of thermal attenuation and hydrological convergence.
Figure 10.
Density scatterplot regressions of elevation against LST, TVDI, and NDVI across the Qinghai Lake riparian zone (a) LST vs. Elevation; (b) NDVI vs. Elevation; (c) TVDI vs. Elevation.
4.2. Seasonal Rhythms and Spatio-Temporal Hydrothermal Regulation Mechanisms of Surface Environmental Variables
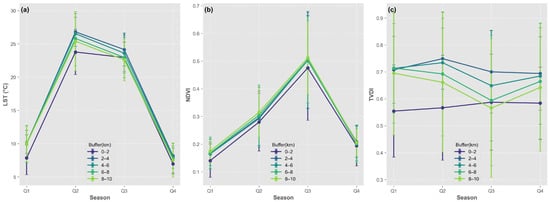
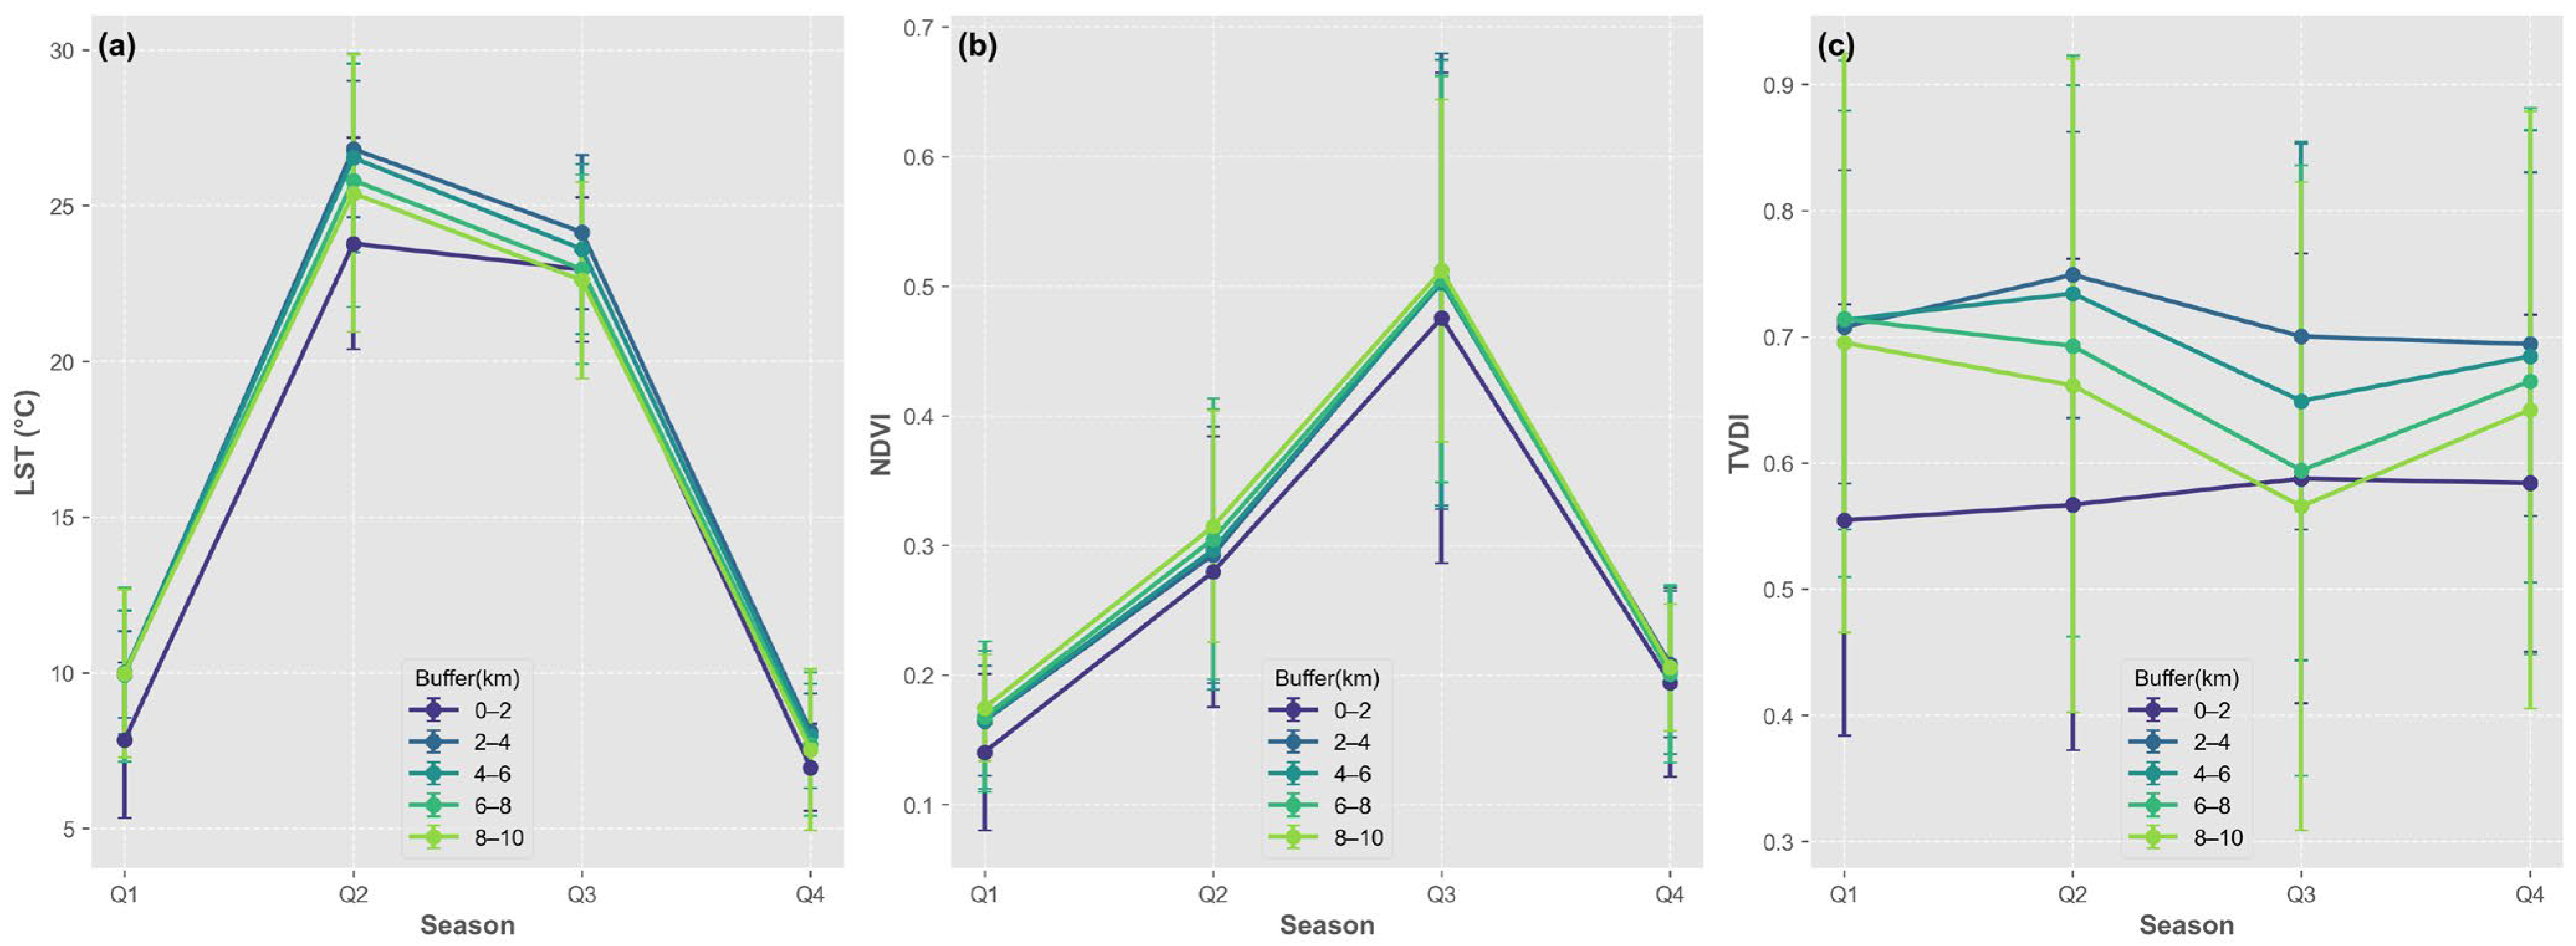
With the topographic gradient established as the physical framework, comparisons across distance-to-lake buffer zones reveal pronounced but differentiated hydrothermal patterns around Qinghai Lake (Figure 11). LST exhibits a distinct seasonal lake effect pattern. While LST in all buffer zones peaks during the second and third quarters (Q2, Q3), the near-shore zone (0–2 km) remains significantly cooler than distal areas during the peak summer heat, vividly illustrating the lake’s summer cooling effect. This thermal regulation diminishes with increasing distance and stabilizes during winter (Q4) as temperature differentials narrow, reflecting the compensatory role of lake-derived heat release for the coastal surface. Simultaneously, NDVI displays highly consistent seasonal phenological characteristics, peaking in Q3. However, during the peak growing season, vegetation coverage in the distal high-altitude flat zones (8–10 km) consistently outperforms the near-shore zone. This suggests that on a macro-growth scale, the promotion of vegetation by the high-altitude cold-moist effect and the water-retention capacity of flat terrain has surpassed the direct regulatory influence of the lake.
Figure 11.
Seasonal variations in LST, NDVI, and TVDI across different distance-to-lake buffer zones (a) LST; (b) NDVI; (c) TVDI.
The seasonal evolution of the TVDI reveals a complex interplay and spatio-temporal compensation between lake-derived moisture replenishment and topographic moisture retention. The near-shore zone (0–2 km) maintains low TVDI values with minimal fluctuations throughout the year, reflecting stable moisture security provided by direct lake infiltration and atmospheric moisture regulation, which facilitates a robust drought-resistant steady state. In contrast, the distal zone (8–10 km) experiences a significant decline in TVDI to its annual minimum during Q3, showcasing superior moisture interception capabilities driven by summer precipitation coupled with a low-evaporation, high-altitude environment. Meanwhile, the intermediate transition zones (2–6 km) undergo peak moisture stress during Q2, forming a seasonal “moisture vacuum” that is detached from direct lake replenishment yet remains below the high-altitude cold-moist threshold. In summary, the environment surrounding Qinghai Lake is driven by the seasonal coupling of lake thermal regulation and topographic vertical gradients, collectively constructing a complex ecogeographical pattern of near-shore stability and distal habitat optimization.
4.3. Evolution and Regime Shifts in the Basin Hydrological System Driven by Climate Warming and Humidification
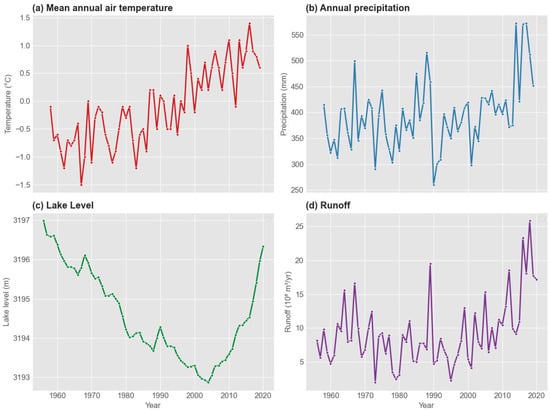
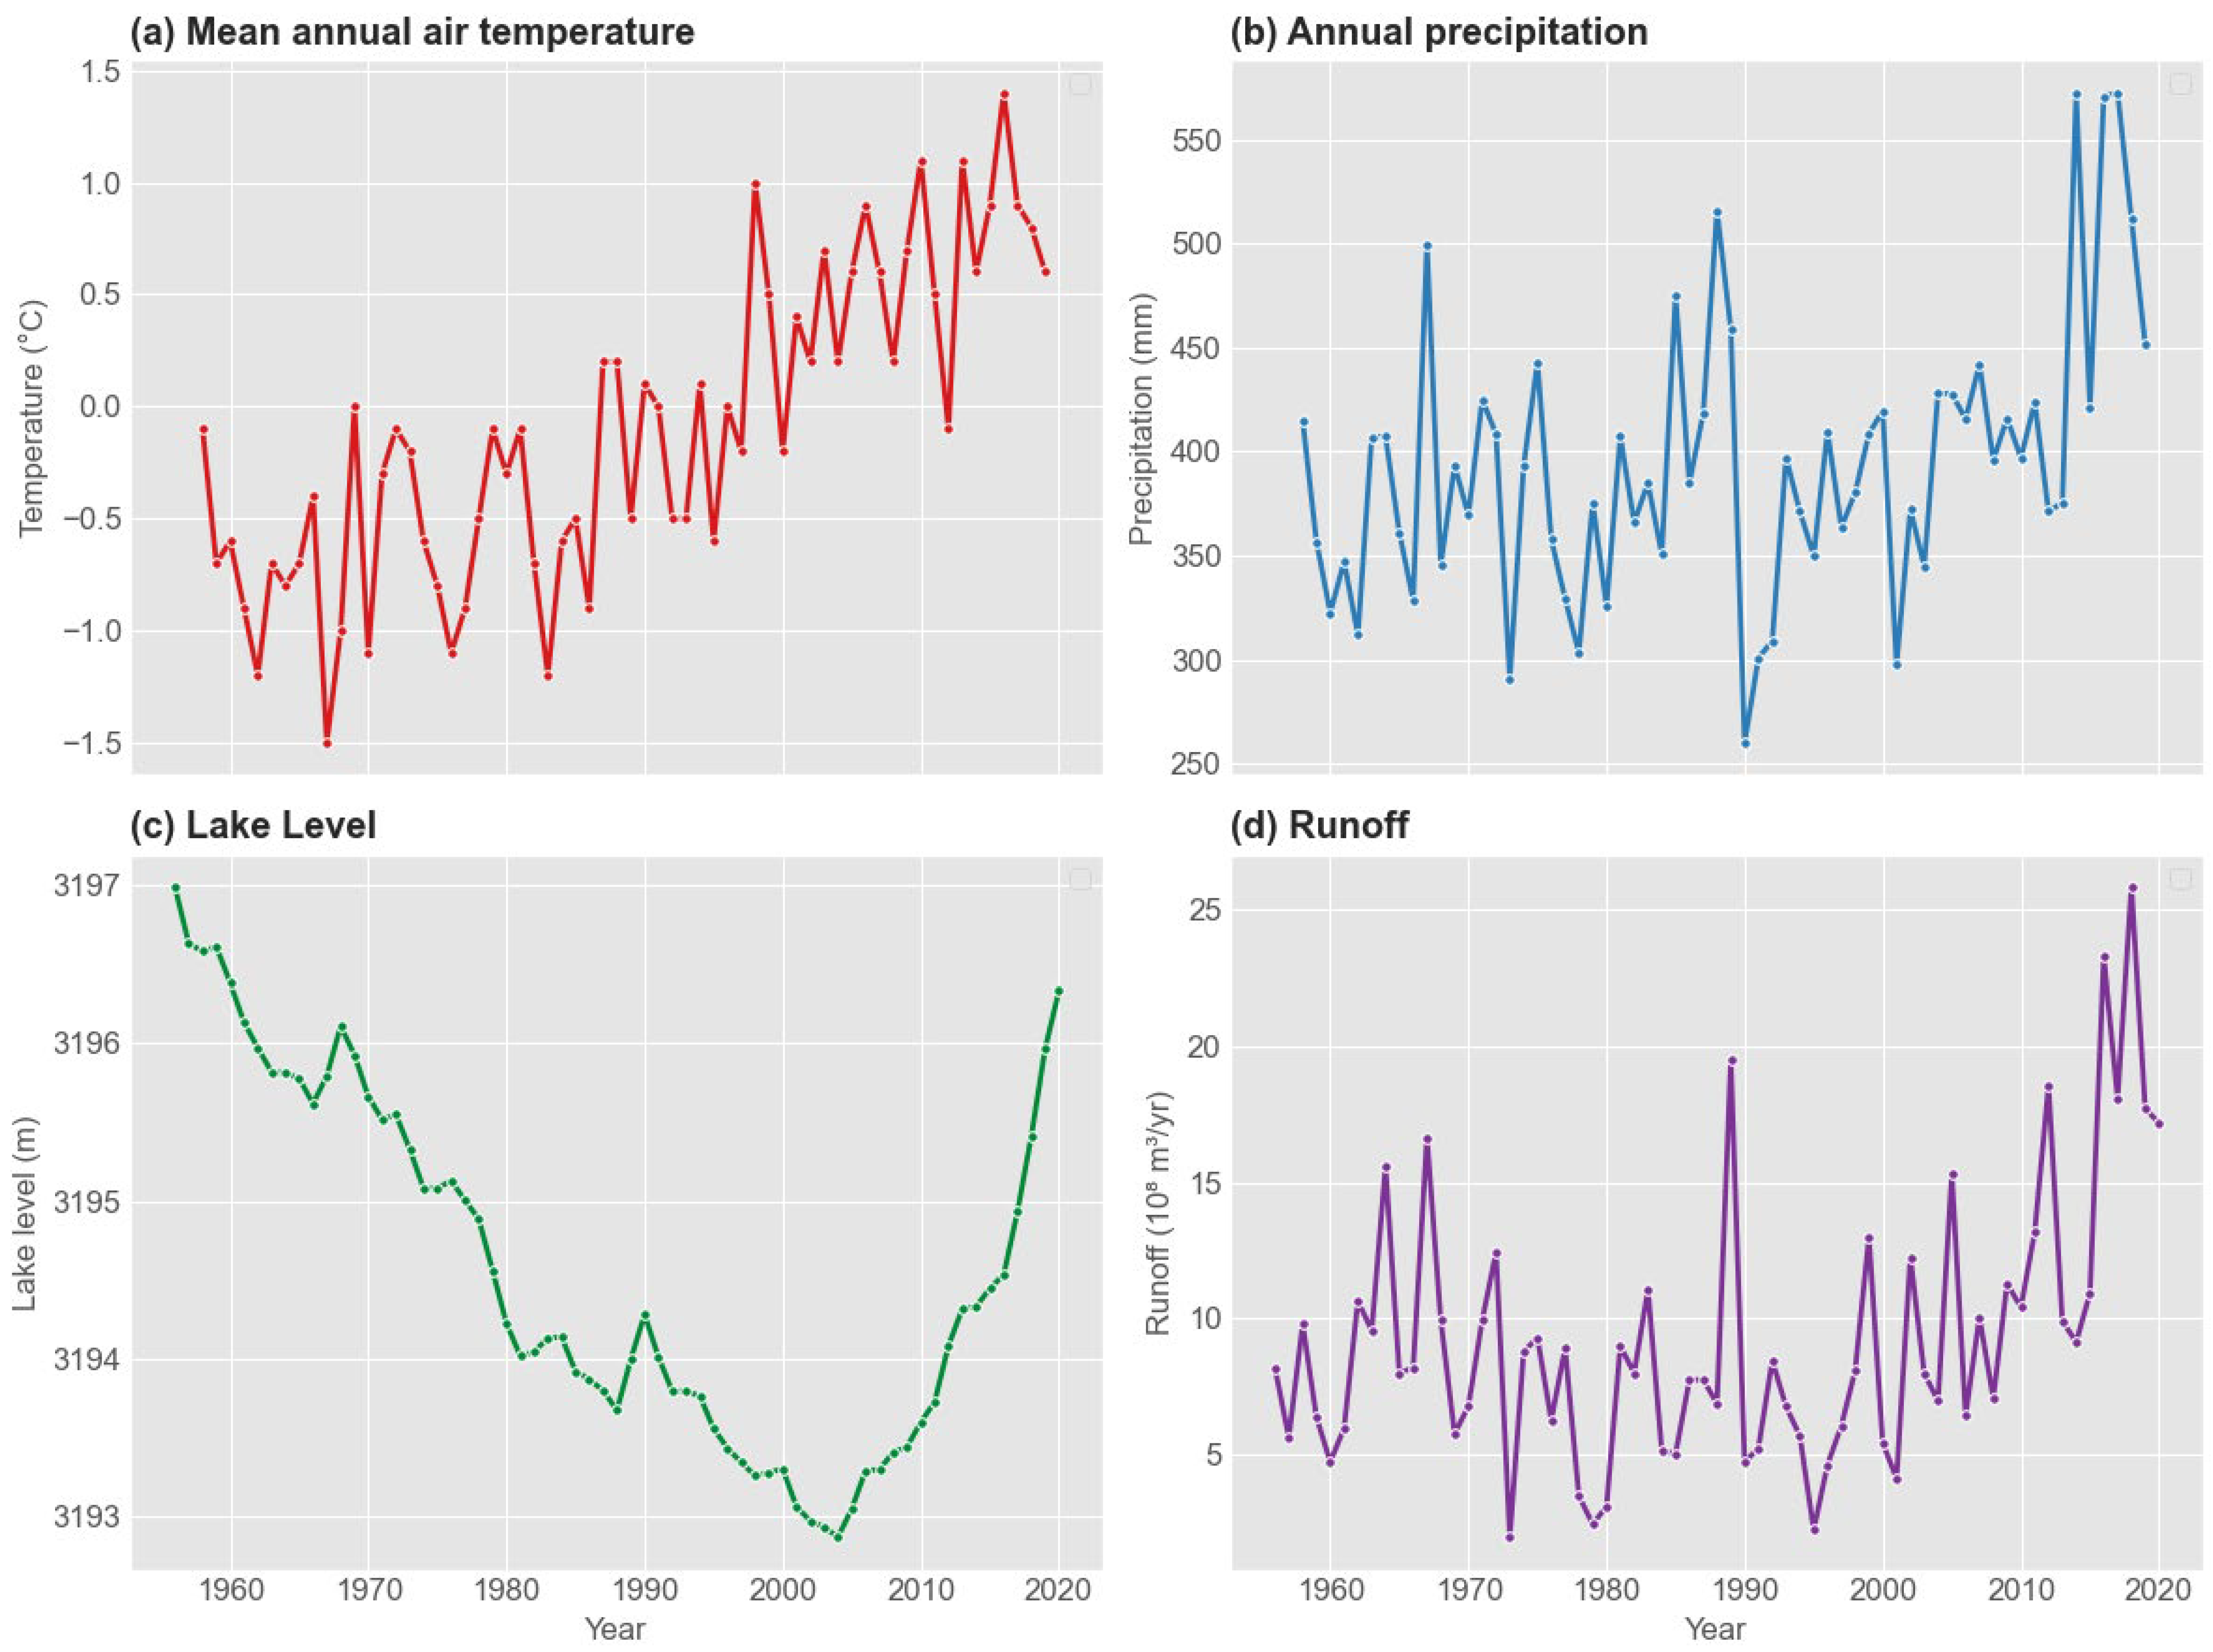
Integrated analysis of decadal observational data from the Qinghai Lake Basin elucidates a profound transition from a warm-dry to a warm-wet regime, defining the response logic of the localized hydrological system to global climate change [34] (Figure 12). Since 1958, the regional mean annual temperature has exhibited a significant fluctuating upward trend, with a marked acceleration in the warming rate after the late 1990s, first surpassing the 1.0 °C threshold in 1998. This warming process has not only altered the recharge structure of surface runoff by accelerating glacial and permafrost melt but has also established the thermal foundation for increased precipitation through intensified localized water vapor cycling. Monitoring data indicate that annual precipitation has fluctuated intensely and risen overall since the turn of the 21st century (Figure 12a,b). This coupled warming-wetting trend has disrupted the basin’s original water balance, serving as the fundamental driver for the ecological reversal of the lake system.
Figure 12.
Long-term variations in climate factors: (a) air temperature; (b) precipitation; (c) lake level; (d) runoff.
The trajectories of lake water levels and basin runoff delineate the sensitive feedback and lag effects of the hydrological system in response to climate transition. Following a prolonged decline, the water level of Qinghai Lake underwent a statistically discernible regime shift around 2004, initiating a period of sustained and rapid recovery (Figure 12c). This turning point is highly synchronized with the surge in runoff during the same period; for instance, runoff was only 19.4 × 10⁸ m3/yr in 1989, and subsequent sustained replenishment has led to a steady rebound from the 2004 minimum (Figure 12d). Integrating the established topographic framework with seasonal regulation mechanisms, it is evident that large-scale warming and wetting have reshaped the microclimatic gradients of the riparian zone from the outside in by increasing precipitation and runoff.
This long-term warming-wetting evolution, in conjunction with micro-scale topographic and seasonal regulation, constitutes the complex eco-geographical pattern of Qinghai Lake. When runoff replenishment driven by humidification exceeds the threshold of surface evaporative loss, the moisture accumulation capacity of high-altitude flat terrains is further enhanced, providing robust support for vegetation growth during Q3. This transition from contraction to expansion is not merely an incremental accumulation of water volume but a concentrated manifestation of the basin’s hydrological response to climate change. In summary, the dynamic evolution of the Qinghai Lake hydrological system, serving as sensitive feedback of the QXP’s climate regulator, indicates that alpine ecosystems are undergoing profound structural adjustments and habitat reorganization in response to rapid warming and wetting.
5. Conclusions
By integrating multi-source remote sensing data and topographic factors from 2000 to 2024, this study analyzed the spatiotemporal evolution of LST, NDVI, and TVDI around Qinghai Lake, elucidating the associated roles of topographic gradients, seasonal rhythms, and climate warming-humidification on the basin’s environment. The primary conclusions are as follows:
- (1)
- Surface environmental variables exhibit pronounced seasonal differentiation and synergistic evolution. LST reaches its thermal peak in Q2, while NDVI achieves its phenological maximum in Q3, reflecting a lagged response of the alpine ecosystem to thermal activation thresholds. The quarterly evolution of TVDI reveals a transition from domain-wide moisture stress in Q2 to seasonal drought mitigation in Q3. Bivariate coupling analysis confirms that once thermal requirements are met, the improvement of moisture conditions in summer serves as the key contributing factor for overcoming the vegetation growth bottleneck.
- (2)
- Topographic configurations and lake effects collectively shape regional microclimatic gradients. Topography drives heat redistribution via vertical lapse rates (r = −0.38 between LST and elevation) and facilitates moisture convergence through gradual slopes (r = −0.45 between TVDI and elevation). Simultaneously, the lake is associated with a significant summer cooling and humidifying effect, establishing a 0–2 km near-shore regulatory zone. In contrast, distal areas (8–10 km) are more strongly influenced by topographic-mediated cold-moist effects, constructing a composite landscape of “near-shore stability and distal optimization.”
- (3)
- Climate warming and humidification have co-occurred with a regime shift in the basin’s hydrological system. Since 2004, the water level of Qinghai Lake has transitioned from a prolonged decline to a rapid recovery, a hydrological shift synchronized with regional increases in temperature and precipitation. Large-scale warming and wetting have contributed to reshaped the basin’s hydrothermal balance by enhancing recharge efficiency in high-altitude regions. This profound structural adjustment indicates that the Qinghai Lake basin is undergoing a process of habitat reorganization and transition from contraction to expansion.
In summary, the evolution of the surface environment surrounding Qinghai Lake is the collective result of topographic forcing, seasonal thermal regulation, and regional climate warming and humidification. Topography establishes a heterogeneous spatial foundation by redistributing hydrothermal resources, while lake effects and climatic transitions dynamically reshape this pattern across multiple spatiotemporal scales. The regime shifts from a warm-dry to a warm-wet state has not only significantly enhanced the ecological carrying capacity of the basin but also endowed the region with greater environmental resilience. This study nevertheless has limitations: the 1-km MODIS resolution cannot resolve fine-scale micro-topographic gradients, and the use of a static 2022 shoreline does not capture interannual boundary migration associated with lake-level changes. The future work should incorporate time-varying shorelines with high-resolution data. The lack of multivariable controls also limits strict attribution of lake-distance effects versus topography. In addition, anthropogenic factors (e.g., seasonal grazing) were not explicitly quantified due to the absence of spatially explicit long-term data, and thus may act as potential confounders. Accordingly, the current conclusions should be interpreted as association-based evidence at seasonal and landscape scales. Future work should integrate higher-resolution sensors, time-varying lake boundaries, and in situ observations and apply multivariable/partial-correlation frameworks to refine shoreline-scale processes and improve the attribution of hydro-ecological drivers. These findings provide a representative paradigm for understanding the response mechanisms of alpine lacustrine systems to global change and offer critical scientific insights for the construction of ecological security barriers and the optimization of water conservation functions on the QXP.
Supplementary Materials
The following supporting information can be downloaded at: https://www.mdpi.com/article/10.3390/rs18040620/s1, Figures S1~S4: NDVI-LST feature space of each quarter; Table S1: The correlation coefficient and significance table of each quarter; Tables S2~S4: Statistical data of environmental indices in different seasons and buffer zones.
Author Contributions
Conceptualization, M.L.; methodology, Z.D.; software, Z.D.; validation, F.L.; formal analysis, C.S.; investigation, Z.D.; resources, F.L.; data curation, M.Z.; writing—original draft preparation, F.L. and Z.D.; writing—review and editing: M.L. and Z.D.; visualization, Y.G.; supervision, C.S.; project administration, F.L.; funding acquisition, F.L. All authors have read and agreed to the published version of the manuscript.
Funding
This research was supported by the Science and Technology Program of Lanzhou City (No. 2025-2-83), the Program of the Key Laboratory of Cryospheric Science and Frozen Soil Engineering (No. CSFSE-ZZ-2405), and the West Light Foundation of Chinese Academy of Sciences (Granted to Dr. Minghao Liu).
Data Availability Statement
The raw data supporting the conclusions of this article will be made available by the authors on request.
Conflicts of Interest
The authors declare no conflicts of interest.
References
- Chen, D.; Xu, B.; Yao, T.; Guo, Z.; Cui, P.; Chen, F.; Zhang, R.; Zhang, X.; Zhang, Y.; Fan, J.; et al. Assessment of past, present and future environmental changes on the Tibetan Plateau. Chin. Sci. Bull. 2015, 60, 3025–3035. [Google Scholar] [CrossRef] [Scilit]
- Li, X.; Cheng, G.D.; Jin, H.J.; Kang, E.; Che, T.; Jin, R.; Wu, L.Z.; Nan, Z.T.; Wang, J.; Shen, Y.P. Cryospheric change in China. Global Planet. Change 2008, 62, 210–218. [Google Scholar] [CrossRef] [Scilit]
- Peng, J.; Liu, Z.H.; Liu, Y.H.; Wu, J.S.; Han, Y.A. Trend analysis of vegetation dynamics in Qinghai-Tibet Plateau using Hurst Exponent. Ecol. Indic. 2012, 14, 28–39. [Google Scholar] [CrossRef] [Scilit]
- Ji, J.F.; Shen, J.; Balsam, W.; Chen, J.; Liu, L.W.; Liu, X.Q. Asian monsoon oscillations in the northeastern Qinghai-Tibet Plateau since the late glacial as interpreted from visible reflectance of Qinghai Lake sediments. Earth Planet. Sci. Lett. 2005, 233, 61–70. [Google Scholar] [CrossRef] [Scilit]
- Huang, K.; Zhang, Y.J.; Zhu, J.T.; Liu, Y.J.; Zu, J.X.; Zhang, J. The Influences of Climate Change and Human Activities on Vegetation Dynamics in the Qinghai-Tibet Plateau. Remote Sens. 2016, 8, 876. [Google Scholar] [CrossRef] [Scilit]
- Wang, Y.; Ren, Z.; Ma, P.P.; Wang, Z.M.; Niu, D.C.; Fu, H.; Elser, J.J. Effects of grassland degradation on ecological stoichiometry of soil ecosystems on the Qinghai-Tibet Plateau. Sci. Total Environ. 2020, 722, 137910. [Google Scholar] [CrossRef] [Scilit]
- Chen, F.H.; Wu, D.; Chen, J.H.; Zhou, A.F.; Yu, J.Q.; Shen, J.; Wang, S.M.; Huang, X.Z. Holocene moisture and East Asian summer monsoon evolution in the northeastern Tibetan Plateau recorded by Lake Qinghai and its environs: A review of conflicting proxies. Quat. Sci. Rev. 2016, 154, 111–129. [Google Scholar] [CrossRef] [Scilit]
- Liu, X.J.; Colman, S.M.; Brown, E.T.; Henderson, A.C.G.; Werne, J.P.; Holmes, J.A. Abrupt deglaciation on the northeastern Tibetan Plateau: Evidence from Lake Qinghai. J. Paleolimnol. 2014, 51, 223–240. [Google Scholar] [CrossRef] [Scilit]
- Li, X.Y.; Xu, H.Y.; Sun, Y.L.; Zhang, D.S.; Yang, Z.P. Lake-level change and water balance analysis at lake qinghai, west China during recent decades. Water Resour. Manag. 2007, 21, 1505–1516. [Google Scholar] [CrossRef] [Scilit]
- Fan, C.Y.; Song, C.Q.; Li, W.K.; Liu, K.; Cheng, J.; Fu, C.S.; Chen, T.; Ke, L.H.; Wang, J.D. What drives the rapid water-level recovery of the largest lake (Qinghai Lake) of China over the past half century? J. Hydrol. 2021, 593, 125921. [Google Scholar] [CrossRef] [Scilit]
- Luo, D.L.; Jin, H.J.; Marchenko, S.S.; Romanovsky, V.E. Difference between near-surface air, land surface and ground surface temperatures and their influences on the frozen ground on the Qinghai-Tibet Plateau. Geoderma 2018, 312, 74–85. [Google Scholar] [CrossRef] [Scilit]
- Luo, L.H.; Ma, W.; Zhuang, Y.L.; Zhang, Y.N.; Yi, S.H.; Xu, J.W.; Long, Y.P.; Ma, D.; Zhang, Z.Q. The impacts of climate change and human activities on alpine vegetation and permafrost in the Qinghai-Tibet Engineering Corridor. Ecol. Indic. 2018, 93, 24–35. [Google Scholar] [CrossRef] [Scilit]
- Zhang, S.Z.; Wu, S.F.; Ding, Z.K.; Niu, F.J.; Mu, Y.H. Local Surface Environmental Changes in a Basin in the Permafrost Region of Qinghai-Tibet Plateau Affected by Lake Outburst Event. Remote Sens. 2025, 17, 3392. [Google Scholar] [CrossRef] [Scilit]
- Zhang, G.Q.; Xie, H.J.; Yao, T.D.; Li, H.Y.; Duan, S.Q. Quantitative water resources assessment of Qinghai Lake basin using Snowmelt Runoff Model (SRM). J. Hydrol. 2014, 519, 976–987. [Google Scholar] [CrossRef] [Scilit]
- Zhang, W.Z.; Wang, S.L.; Zhang, B.; Zhang, F.F.; Shen, Q.; Wu, Y.H.; Mei, Y.; Qiu, R.T.; Li, J.S. Analysis of the water color transitional change in Qinghai Lake during the past 35 years observed from Landsat and MODIS. J. Hydrol. Reg. Stud. 2022, 42, 101154. [Google Scholar] [CrossRef] [Scilit]
- Li, Z.H.; Zhang, Z.J.; Xiong, S.Q.; Zhang, W.C.; Li, R. Lake Surface Temperature Predictions under Different Climate Scenarios with Machine Learning Methods: A Case Study of Qinghai Lake and Hulun Lake, China. Remote Sens. 2024, 16, 3220. [Google Scholar] [CrossRef] [Scilit]
- Li, Z.H.; Zhang, Z.J.; Zhang, W.C.; Li, Y.L. Modeling the lake water balance of a closed alpine basin using a fully distributed hydrological framework: A case study of Qinghai Lake, China. J. Hydrol. 2026, 666, 134824. [Google Scholar] [CrossRef] [Scilit]
- Li, M.; Wang, G.J.; Sun, A.H.; Wang, Y.K.; Li, F.; Liang, S.H. Monitoring Grassland Variation in a Typical Area of the Qinghai Lake Basin Using 30 m Annual Maximum NDVI Data. Remote Sens. 2024, 16, 1222. [Google Scholar] [CrossRef] [Scilit]
- Wang, X.L.; Liang, T.G.; Xie, H.J.; Huang, X.D.; Lin, H.L. Climate-driven changes in grassland vegetation, snow cover, and lake water of the Qinghai Lake basin. J. Appl. Remote Sens. 2016, 10, 036017. [Google Scholar] [CrossRef] [Scilit]
- Meng, S.J.; Tang, Z.Y.; Xue, Y.; Wu, X.T.; Li, C.G.; Wu, X.H. Relationship between Area Changes of Key Lakes and Evapotranspiration in Qinghai Province. Atmosphere 2024, 15, 1210. [Google Scholar] [CrossRef] [Scilit]
- Hou, P.F.; Qiu, S.K.; Wang, J.X.; Zhang, H.C.; Du, J. Long-term water level variations in Lake Qinghai and their climatic and human activities driving mechanisms. J. Hydrol. Reg. Stud. 2025, 61, 102755. [Google Scholar] [CrossRef] [Scilit]
- Zhang, G.Q.; Xie, H.J.; Duan, S.Q.; Tian, M.Z.; Yi, D.H. Water level variation of Lake Qinghai from satellite and ments under climate change. J. Appl. Remote Sens. 2011, 5, 053532. [Google Scholar] [CrossRef] [Scilit]
- Zhu, H.; Chen, K.J.; Li, M.J.; Hu, S.Q.; Zhang, G.Q.; Kuang, X.X.; Cui, W.F.; Zhang, S.P.; Liu, J.G. Terrestrial Water Storage Changes of Qinghai Lake on the Tibetan Plateau From Joint Inversion of GNSS and InSAR Data. Water Resour. Res. 2025, 61, e2024WR039503. [Google Scholar] [CrossRef] [Scilit]
- Fang, J.M.; Li, G.J.; Rubinato, M.; Ma, G.Q.; Zhou, J.X.; Jia, G.D.; Yu, X.X.; Wang, H.N. Analysis of Long-Term Water Level Variations in Qinghai Lake in China. Water 2019, 11, 2136. [Google Scholar] [CrossRef] [Scilit]
- Ma, Y.J.; Li, X.Y.; Liu, L.; Huang, Y.M.; Li, Z.; Hu, X.; Wu, X.C.; Yang, X.F.; Wang, P.; Zhao, S.J.; et al. Measurements and Modeling of the Water Budget in Semiarid High-Altitude Qinghai Lake Basin, Northeast Qinghai-Tibet Plateau. J. Geophys. Res-Atmos. 2018, 123, 10857–10871. [Google Scholar] [CrossRef] [Scilit]
- Wang, H.Y.; Dong, H.L.; Zhang, C.L.L.; Jiang, H.C.; Zhao, M.X.; Liu, Z.H.; Lai, Z.P.; Liu, W.G. Water depth affecting thaumarchaeol production in Lake Qinghai, northeastern Qinghai-Tibetan plateau: Implications for paleo lake levels and paleoclimate. Chem. Geol. 2014, 368, 76–84. [Google Scholar] [CrossRef] [Scilit]
- Tang, L.Y.; Duan, X.F.; Kong, F.J.; Zhang, F.; Zheng, Y.F.; Li, Z.; Mei, Y.; Zhao, Y.W.; Hu, S.J. Influences of climate change on area variation of Qinghai Lake on Qinghai-Tibetan Plateau since 1980s. Sci. Rep. 2018, 8, 7331. [Google Scholar] [CrossRef] [Scilit]
- Zhao, H.C.; Li, Y.; Chen, X.G.; Wang, H.R.; Yao, N.; Liu, F.G. Monitoring monthly soil moisture conditions in China with temperature vegetation dryness indexes based on an enhanced vegetation index and normalized difference vegetation index. Theor. Appl. Climatol. 2021, 143, 159–176. [Google Scholar] [CrossRef] [Scilit]
- Yuan, Y.P.; Ye, X.C.; Liu, T.T.; Li, X.H. Drought monitoring based on temperature vegetation dryness index and its relationship with anthropogenic pressure in a subtropical humid watershed in China. Ecol. Indic. 2023, 154, 110584. [Google Scholar] [CrossRef] [Scilit]
- Swift, L.W. Algorithm for Solar-Radiation on Mountain Slopes. Water Resour. Res. 1976, 12, 108–112. [Google Scholar] [CrossRef] [Scilit]
- Zhang, T.Q.; Yu, W.B.; Lu, Y.; Chen, L. Identification and Correlation Analysis of Engineering Environmental Risk Factors along the Qinghai-Tibet Engineering Corridor. Remote Sens. 2022, 14, 908. [Google Scholar] [CrossRef] [Scilit]
- Huang, F.; Chunyu, X.Z.; Wang, Y.K.; Zhang, X.; Qian, B.; Zhao, D.Y.; Xia, Z.Q. Impacts of Streamflow and Topographic Changes on Water Level during the Dry Season of Poyang Lake, China. J. Hydrol. Eng. 2020, 25, 05020001. [Google Scholar] [CrossRef] [Scilit]
- Sandholt, I.; Rasmussen, K.; Andersen, J. A simple interpretation of the surface temperature/vegetation index space for assessment of surface moisture status. Remote Sens. Environ. 2002, 79, 213–224. [Google Scholar] [CrossRef] [Scilit]
- Zhang, G.; Duan, S. Lakes as sentinels of climate change on the Tibetan Plateau. All Earth 2021, 33, 161–165. [Google Scholar] [CrossRef] [Scilit]
Disclaimer/Publisher’s Note: The statements, opinions and data contained in all publications are solely those of the individual author(s) and contributor(s) and not of MDPI and/or the editor(s). MDPI and/or the editor(s) disclaim responsibility for any injury to people or property resulting from any ideas, methods, instructions or products referred to in the content. |
© 2026 by the authors. Licensee MDPI, Basel, Switzerland. This article is an open access article distributed under the terms and conditions of the Creative Commons Attribution (CC BY) license.