


Highlights
- Developed localized empirical models for Chl-a, TSS, and SDD using Sentinel-2.
- Nine years of in situ data enhanced model calibration and validation.
- C2RCC-COMPLEX achieved superior performance in Alqueva Reservoir.
- Satellite-derived maps reveal drought and post-winter water quality trends.
Abstract
Monitoring water quality in large reservoirs is essential yet challenging, particularly in regions with limited in situ coverage. This study presents a robust methodology for integrating a decade-long in situ dataset (2014–2022) with Sentinel-2 multispectral imagery to develop and validate localized algorithms for water quality assessment in the Alqueva Reservoir, the largest artificial lake in Western Europe. Three atmospheric correction algorithms (C2RCC, C2X, C2X-COMPLEX) were evaluated, with C2RCC-COMPLEX identified as the most suitable for capturing the reservoir’s optical complexity, yielding the lowest RMSE for Total Suspended Solids (TSS: 2.4 g/m3) and Secchi Disk Depth (SDD: 0.85 m). Empirical models using Sentinel-2 bands 7 (783 nm), 6 (740 nm), and 8A (865 nm) demonstrated strong correlations (R2 ≈ 0.69–0.71) for Chlorophyll-a (Chl-a) with a range data of 0.1–65 mg/m3, TSS with a range data of 2–13.1 g/m3, and SDD with a range data of 0.4–8 m. Spatially explicit water quality maps illustrate the models’ capacity to capture distinct gradients and seasonal dynamics, e.g., elevated Chl-a (>30 mg/m3) and TSS (>7.5 g/m3) in the reservoir’s nutrient-rich northern section during drought (August 2022), and more uniform conditions following winter recovery (March 2019), with SDD exceeding 2 m near the dam. These results underscore the utility of Sentinel-2 for resolving spatial and temporal variability in optically complex inland waters. The proposed workflow offers a transferable, cost-effective framework for monitoring eutrophication risks and sediment dynamics under increasing hydrological variability.
1. Introduction
Water quality monitoring in large inland reservoirs remains a significant technical challenge, particularly in systems characterized by spatial and seasonal variability. While climate change and anthropogenic pressures provide important context, exacerbating eutrophication risks and altering hydrological regimes, the effective management of these water bodies depends on our capacity to monitor water quality efficiently and at scale. In Mediterranean reservoirs such as Alqueva, the largest artificial lake in Western Europe, water quality dynamics are complex and often driven more by episodic human activities, such as agricultural runoff or wastewater discharges, than by consistent seasonal patterns. While the region does exhibit strong seasonal contrasts, with dry summers and sporadic winter inflows, these climatic rhythms often interact with or are overshadowed by anthropogenic pressures, which can trigger abrupt shifts in sediment dynamics and algal growth [1]. High sediment loads during droughts, combined with seasonal blooms, create optical complexity that generic models fail to resolve [2].
Traditionally, monitoring of such water bodies is still done via in situ methods which, although essential for validating key parameters such as Chlorophyll-a (Chl-a), Total Suspended Solids (TSS), and Secchi Disk Depth (SDD), are often labor-intensive, costly, and spatially limited, especially in large or remote reservoirs [3,4,5]. Recent advances in satellite remote sensing offer a compelling alternative [6]. This approach has also been applied to the Alqueva Reservoir, where several studies have employed the Medium Resolution Imaging Spectrometer (MERIS) to estimate chlorophyll-a concentrations and cyanobacterial density [6], as well as water turbidity [7]. In parallel, Landsat imagery has been used to assess long-term variations in water surface extent associated with hydrological dynamics in this reservoir [8].
Platforms such as Sentinel-2, part of the European Copernicus program, provide high-resolution multispectral imagery capable of capturing optically relevant signals across vast inland water bodies [9,10,11]. Consequently, the number of remote sensing studies focused on Alqueva has increased substantially in recent years. For instance, Potes et al. [12] applied algorithms originally developed for MERIS to Sentinel-2 Level-2A imagery processed with Sen2Cor, an atmospheric correction scheme primarily designed for terrestrial surfaces. However, Rodrigues et al. [1] demonstrated that this correction approach is sub-optimal for the optically complex waters of Alqueva. To address this limitation, Neves et al. [11] adopted the Case-2 Regional Coast Colour (C2RCC) atmospheric correction scheme, specifically designed for inland and coastal waters, although without developing reservoir-specific retrieval algorithms. Such algorithm development was subsequently undertaken by Rodrigues et al. [13], who employed Sentinel-3 OLCI data to estimate Secchi disk depth, turbidity, chlorophyll-a, and phycocyanin concentrations in the Alqueva Reservoir.
However, applying remote sensing to inland waters, particularly those in optically complex or dynamic environments like Alqueva, remains methodologically demanding. Challenges include atmospheric interference, coarse temporal resolution of certain sensors, and the highly variable optical properties of different water bodies, which undermine the performance of generic algorithms [5,14]. Localized calibration and validation are therefore essential to achieve accurate, high-resolution water quality assessments in such contexts. Recent studies have begun addressing this gap through machine learning and region-specific modeling approaches, demonstrating the value of tailored solutions for eutrophication and sediment monitoring [15,16]. Consequently, there remains a clear need for a systematic methodological framework that integrates long-term in situ observations with high-resolution Sentinel-2 imagery, rigorously evaluates atmospheric correction strategies, and develops localized, specific models capable of capturing the pronounced spatial and temporal variability characteristic of large Mediterranean reservoirs.
This study responds to these methodological challenges by integrating a decade-long in situ dataset (2014–2022) with Sentinel-2 multispectral imagery to develop and validate localized algorithms for water quality monitoring in the Alqueva Reservoir. Specifically, we aim to (i) evaluate the performance of three atmospheric correction algorithms (C2RCC, C2X, and C2X-COMPLEX) to identify the most robust method for resolving the optical complexity of Alqueva Reservoir under varying hydrological conditions; (ii) develop localized empirical models linking Sentinel-2 spectral bands to key water quality parameters (Chl-a, TSS, SDD), focusing on spectral regions sensitive to algal biomass, suspended sediments, and light attenuation; (iii) illustrate model performance across contrasting hydrological conditions (e.g., severe droughts vs. post-winter recovery) to demonstrate the robustness and reliability of the models for dynamic monitoring. By bridging remote sensing capabilities with region-specific validation, this work advances monitoring frameworks for Mediterranean reservoirs, where traditional methods often fail to capture spatial and temporal variability in water quality, thus improving understanding of eutrophication risks and sediment dynamics.
2. Materials and Methods
2.1. Study Area and Field Data
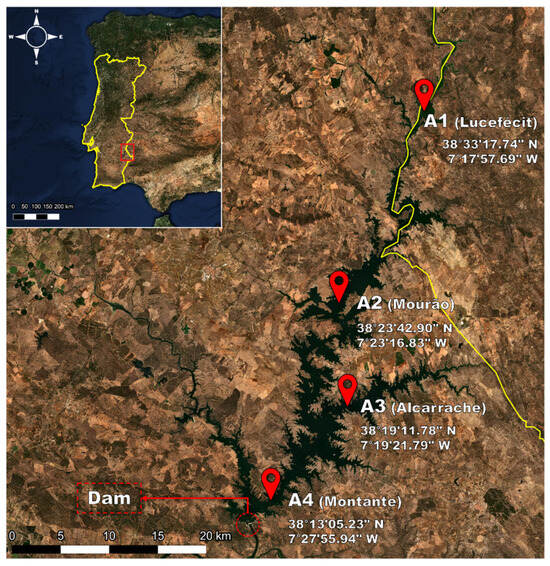
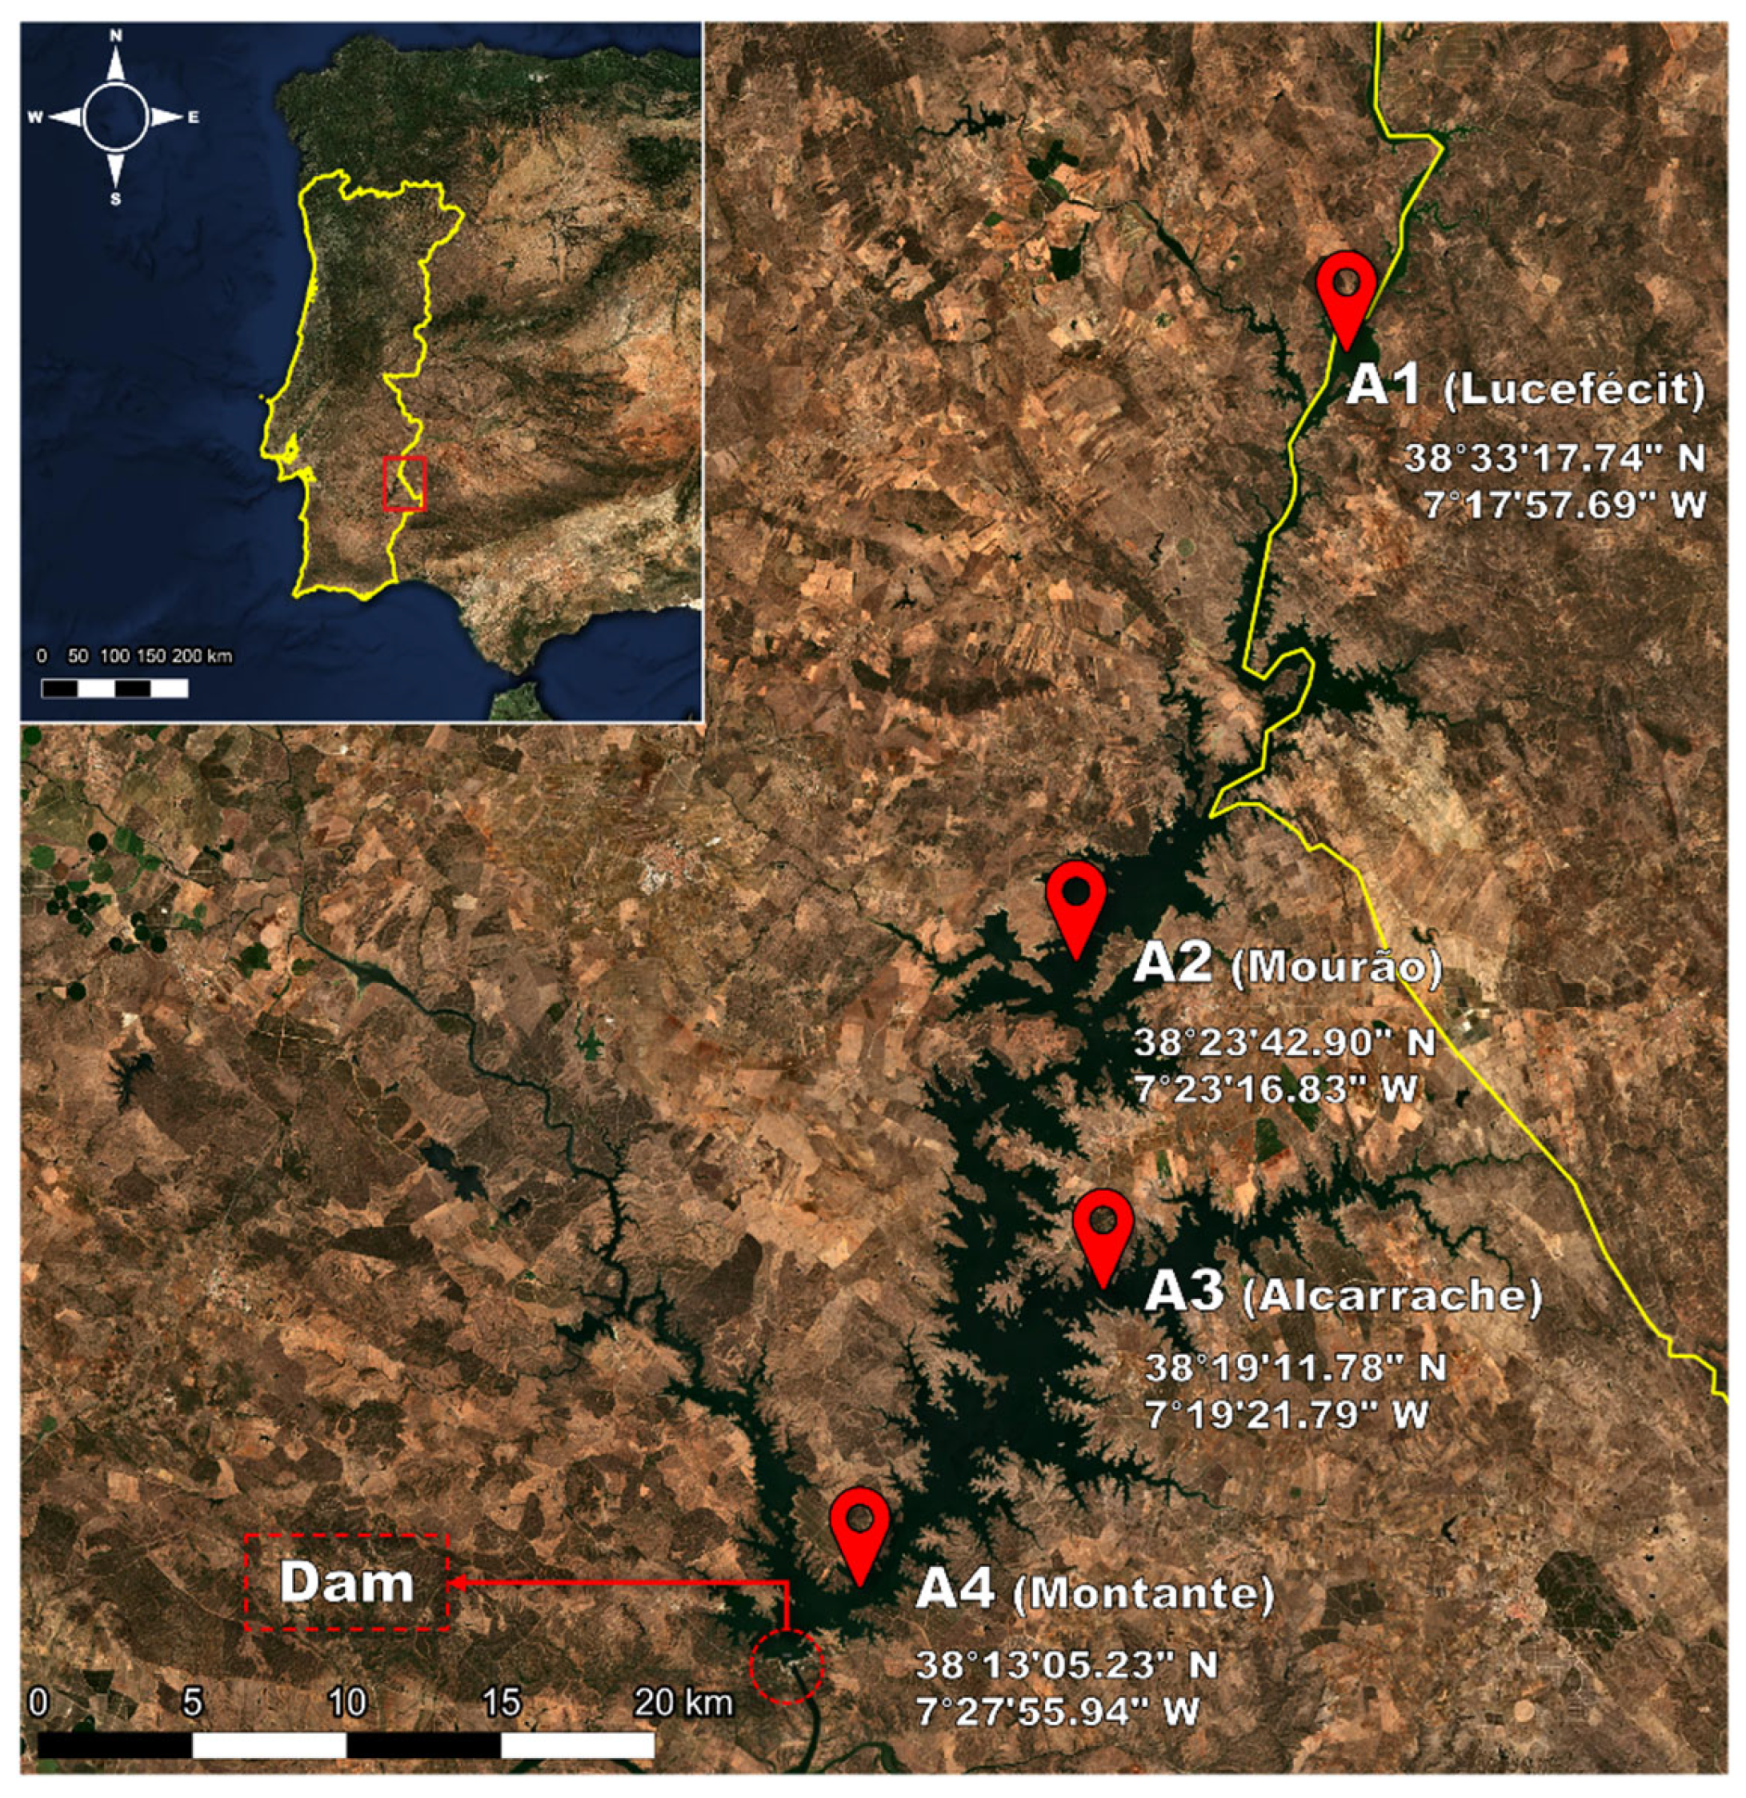
This research focuses on the Alqueva Reservoir, located on the main course of the Guadiana River in the Alentejo region of southern Portugal (Figure 1). As the largest artificial lake in Western Europe, the Alqueva covers an area of 250 km2, stretches 85 km in length, and has a maximum depth of 65 m [1]. It is the primary water source for southern Portugal, supporting public consumption, irrigation, industrial uses, energy production, and tourism [17]. The reservoir’s importance is increasingly critical for Alentejo, a region that often faces drought conditions lasting more than two years, with months of scant rainfall and summer temperatures soaring to between 25 °C and 45 °C from June to September [1].
Figure 1.
Location map of the Alqueva reservoir showing the position of the four in situ measurement sites. The red dots stands for the location of sampling sites.
In situ data was collected and provided by Empresa de Desenvolvimento e Infra-Estruturas do Alqueva (EDIA). Field campaigns were conducted between 2014 and 2022 at various floating station sampling sites (A1: Lucefécit; A2: Mourão; A3: Alcarrache; A4: Montante), selected to capture spatial variability across riverine, transitional, and lacustrine zones of the reservoir (Figure 1). Site A1 (Lucefécit) at the north is characterized by a river-like shape and frequent eutrophication, A2 (Mourão) lies near the center along the Guadiana River’s main path, A3 (Alcarrache) is located on the eastern side, at the juncture where the Alcarrache River flows into the reservoir, and A4 (Montante) is at the southern end near the dam, in the deepest area of the reservoir (Figure 1). The distribution of sampling sites along the entire longitudinal axis of such an elongated reservoir provides observations spanning a wide range of the studied variables. This longitudinal gradient reflects progressive changes in water properties: inflowing waters in the upstream (riverine) zone typically exhibit higher suspended matter and nutrient concentrations, which gradually decrease toward the dam area.
At each site, water quality variables were measured following standard limnological protocols NP 4327:1996 [18] and EN ISO 10260:1992 [19]:
- Chl-a (mg/m3) was determined using molecular absorption spectroscopy based on equations from Lorenzen [20].
- TSS (mg/m3) were estimated through gravimetry according to the methods described in PT MA116, at LABELEC-Estudos, Desenvolvimento e Actividades Laboratoriais, S.A.-EDP Labelec-Laboratório de Ambiente.
- SDD (m) was measured in situ with a Secchi Disk.
These field measurements were temporally matched with satellite observations, retaining only samples acquired within a ±3-day window of a cloud- and shadow-free Sentinel-2 overpass. This procedure resulted in 133 spatiotemporally coincident observations. The seasonal and spatial distribution of samples is summarized in Table 1. The greater availability of cloud-free imagery and more favorable field conditions during summer led to a higher number of observations in that season. Owing to occasional operational constraints, the final number of validated coincident measurements differed among biophysical variables, with 133 samples for chlorophyll-a, 81 for total suspended solids, and 88 for Secchi disk depth, all of which were used for the calibration and validation of the satellite-derived products.
Table 1.
Number of valid data points (n) per season and sampling location.
2.2. Sentinel-2 Imagery and Preprocessing
The satellite imagery used in this study was acquired by the Multispectral Instrument (MSI) onboard the Sentinel-2 mission satellites, which are part of the European Space Agency’s Copernicus Programme. The Sentinel-2 mission consists of two operational satellites, Sentinel-2A (launched in 2015) and Sentinel-2B (launched in 2017), with Sentinel-2C launched in 2024 to replace Sentinel-2A. The satellites operate in the same orbit, phased 180° apart, enabling global coverage of continental landmasses and large islands every five days with a swath width of 290 km [21]. The MSI sensor acquires imagery in 13 spectral bands, with spatial resolutions of 10 m (four bands), 20 m (six bands), and 60 m (three bands) (Table 2).
Sentinel-2 Level-1C (L1C) products were obtained through the Copernicus Browser portal of the European Space Agency [22]. These products are distributed as ortho-rectified images in the UTM/WGS84 projection and organized into tiles of 100 × 100 km. To support the calibration of empirical models for the estimation of water quality parameters, an initial dataset of L1C images acquired between 2015 and 2022 was compiled. Image selection was restricted to acquisition dates within ±3 days [23] of in situ sampling and to scenes with cloud cover below 30%. Based on these criteria, a total of 50 Sentinel-2 L1C images were selected for further analysis.
Table 2.
Band configuration and spatial resolution of Sentinel-2 satellites [24].
In this study, atmospheric correction was performed using the C2RCC processor, which has been identified as one of the most effective methods for converting top-of-atmosphere (TOA) reflectance into water-leaving reflectance (Rw) in inland and coastal water environments [21,25]. The C2RCC processor is freely available within the European Space Agency’s Sentinel Application Platform (SNAP). It comprises three neural-network-based configurations tailored to different optical conditions: the standard C2RCC (optimized for coastal and inland waters), Case-2 Extreme (C2X), designed for waters with extreme constituent concentrations, and C2X-Complex (C2X-C), adapted for optically more complex scenarios [26]. All three configurations were applied independently to the full Sentinel-2 dataset to enable a comparative assessment of their performance.
Default C2RCC parameter settings were adopted, including the internal aerosol model and standard values for salinity and ozone, which are appropriate for freshwater environments, with the exception of the elevation parameter which was adjusted to match local conditions.
In addition to atmospheric correction, the C2RCC processor provides estimates of several bio-optical variables, referred to as “automatic products,” which enable a comprehensive characterization of water quality. Chl-a serves as an indicator of phytoplankton biomass and primary productivity. TSS are associated with sediment load and directly influence turbidity and light availability within the water column [15]. Finally, the diffuse attenuation coefficient (Kd_Z90max) is a direct proxy for water transparency and has been shown to correlate closely with in situ Secchi disk depth (SDD) measurements [25].
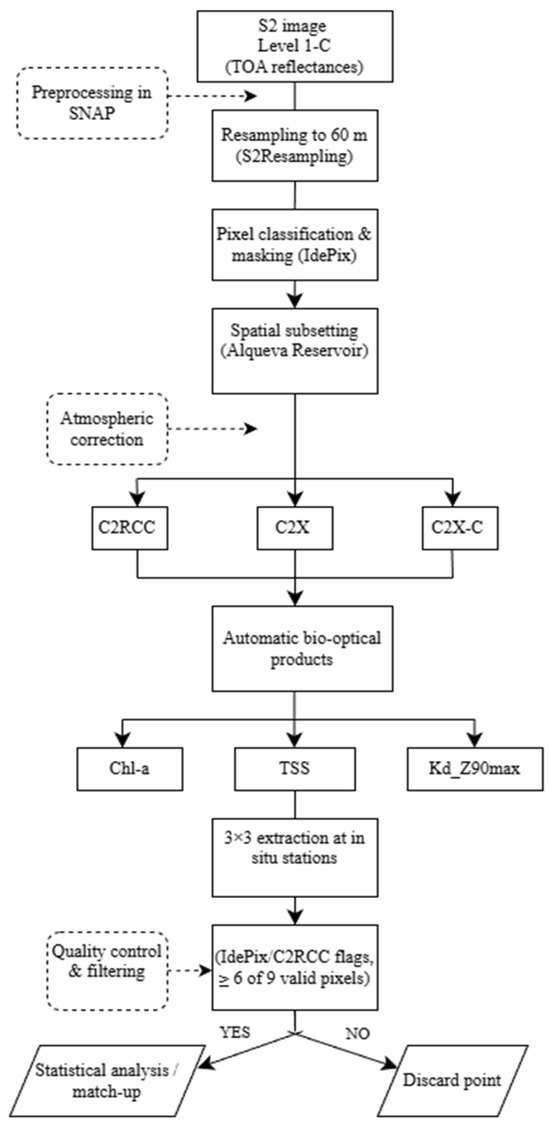
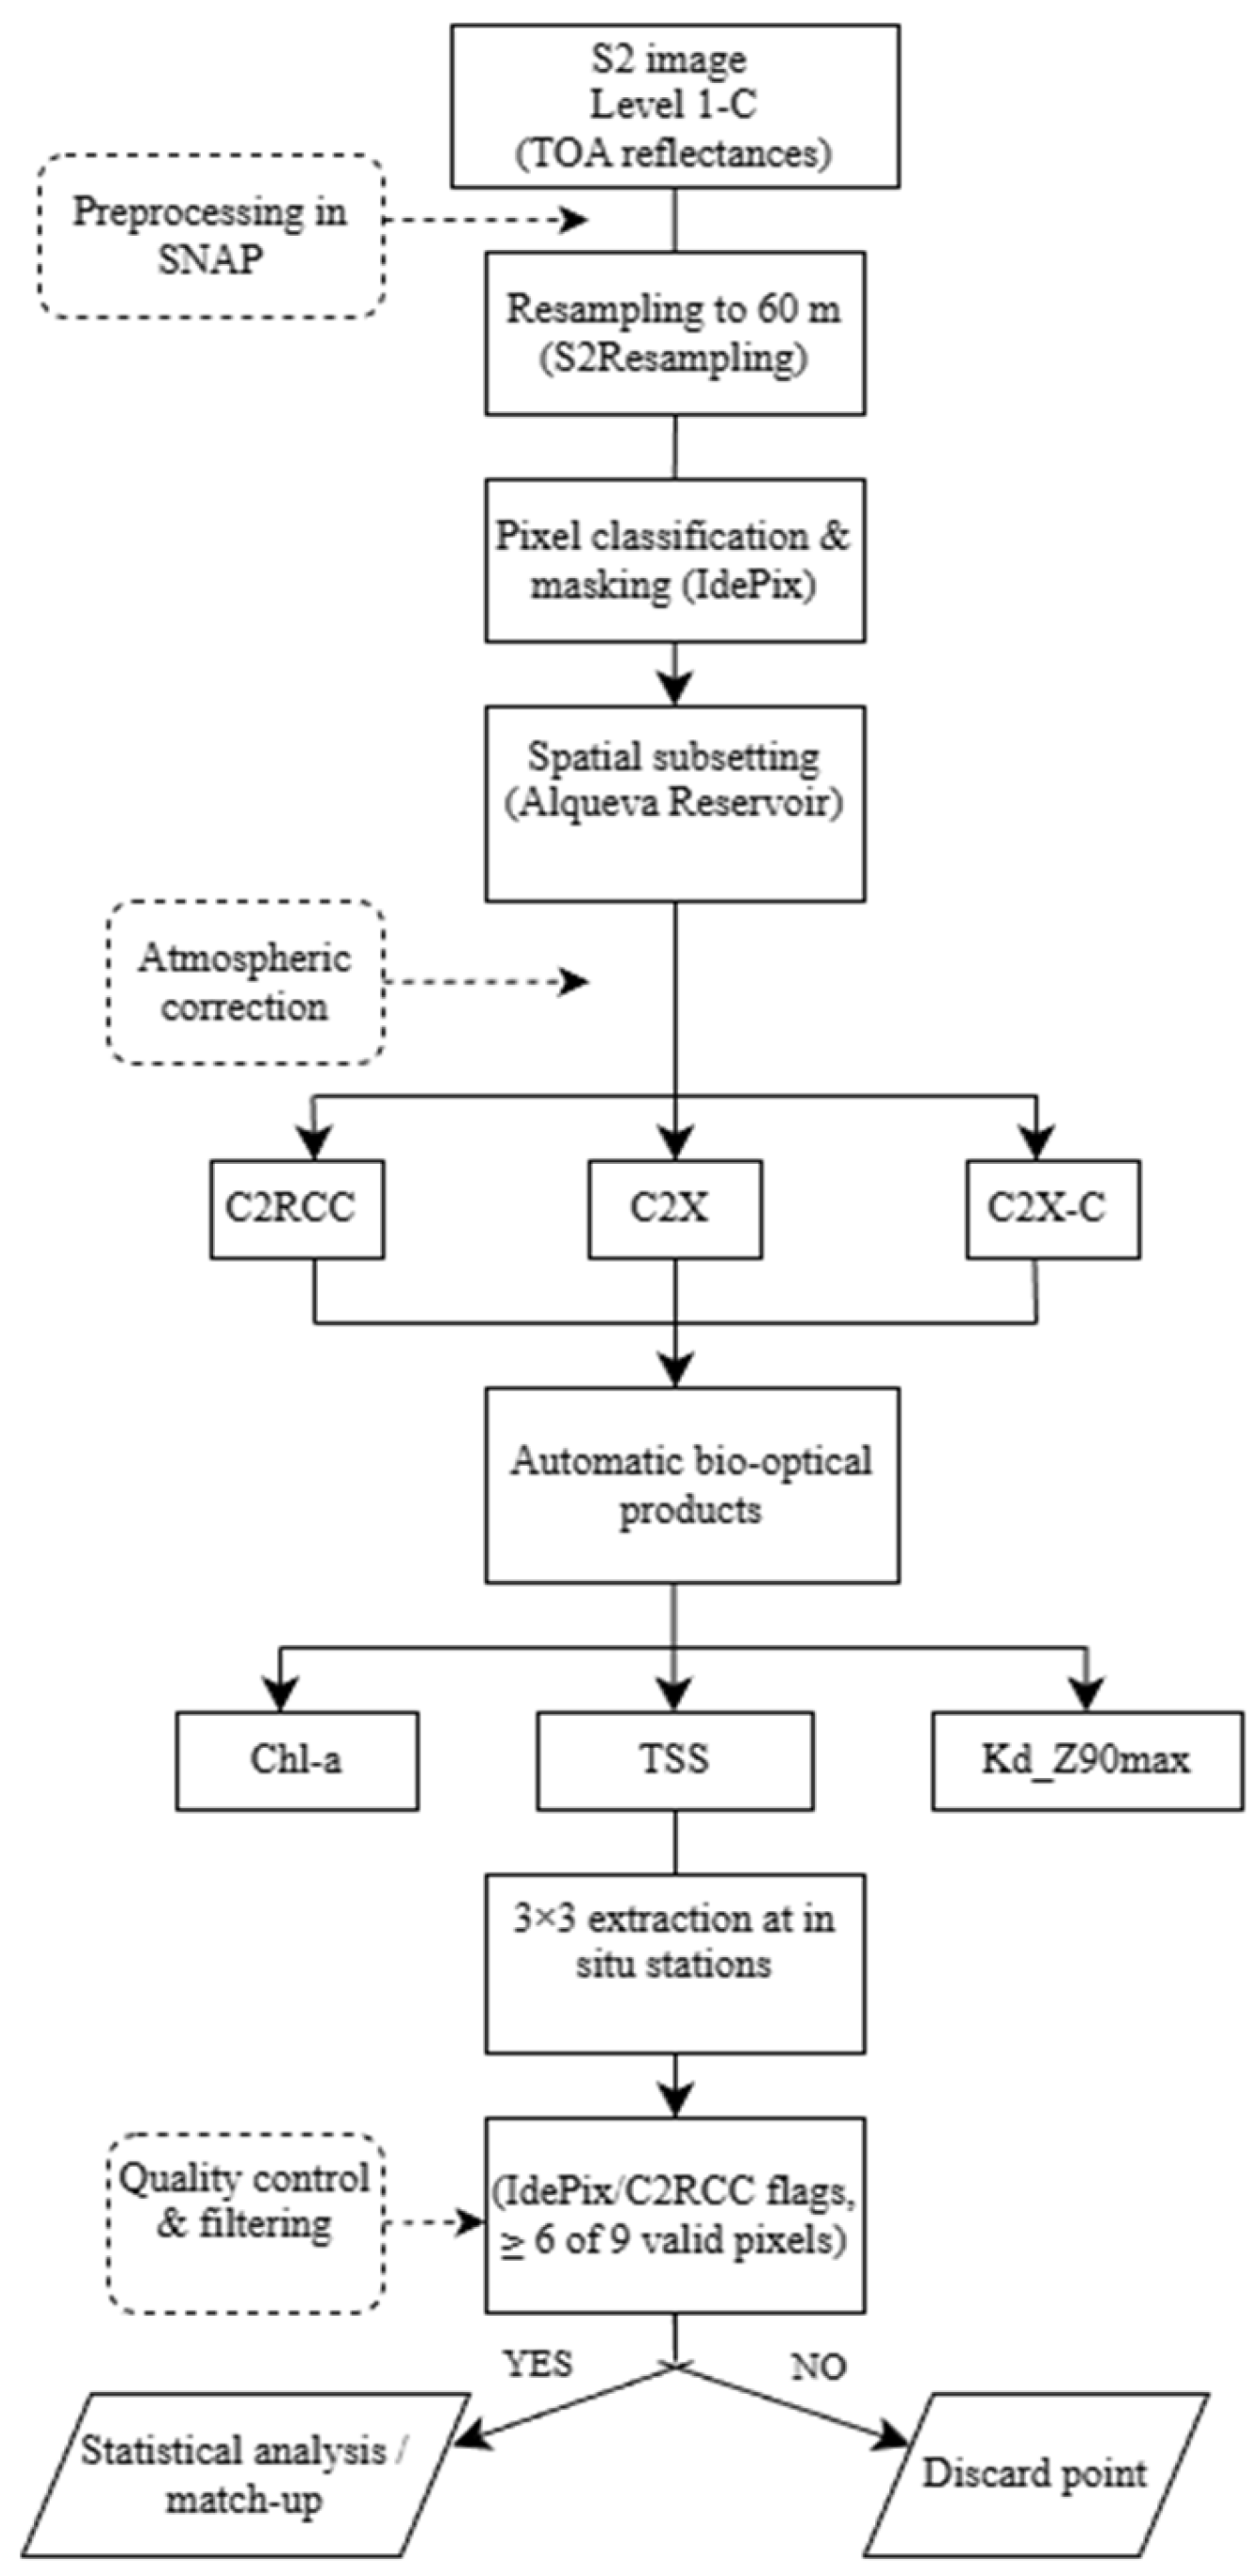
Image preprocessing was carried out using SNAP, both through its graphical user interface (GUI) and its command-line Graph Processing Tool (gpt) to optimize processing efficiency. Preprocessing followed four main steps:
- Resampling: All images were resampled to 60 m spatial resolution using the S2Resampling module with default parameters. This resolution was chosen intentionally to ensure consistency across all bands (10 m, 20 m, 60 m), specifically including the 60 m bands (such as B1 and B10) necessary for the aerosol and cirrus corrections performed by the C2RCC processor [21].
- Cloud and shadow masking (pixel classification): Cloud and shadow detection was performed using the IdePix module, a pixel-classification algorithm developed by the European Space Agency and integrated into SNAP, specifically designed for the Sentinel-2 MSI sensor [22]. IdePix automatically generates quality masks by identifying clouds, cloud shadows, and non-water pixels (land and coastline), thereby isolating optically valid water pixels for subsequent bio-optical processing. In this study, IdePix was applied using its default configuration, with the additional activation of the options “Write feature values to the target product” and “Compute cloud shadow”, and by setting the “Width of cloud buffer” parameter to two pixels. This configuration ensured a conservative screening of atmospheric contamination and a reliable delineation of valid water pixels [22,27].
- Spatial subsetting: Each image was spatially subset to a rectangular polygon encompassing the Alqueva Reservoir, excluding surrounding irrelevant areas. This step reduced computational demands and improved processing efficiency in subsequent analyses.
- Atmospheric correction: Atmospheric correction was applied using three neural-network-based processors: C2RCC, C2X, and C2X-C, generating three atmospherically corrected products per image. Default processor settings were used in all cases, except for the Elevation parameter, which was fixed at 136 m. This value corresponds to the mean elevation of the Alqueva Reservoir area, estimated using Google Earth.
Subsequently, the geographical coordinates of the in situ sampling sites were imported into each image’s .dim file using SNAP’s GUI. Pixel values were extracted with the Extract Pixel Values module, exporting all spectral bands to .csv format. Default settings were applied, except that “Window Size” was set to 3 and “Pixel value aggregation method” was set to no aggregation. As a result, pixel values surrounding each sampling site were extracted and compiled into a single dataset, where each row represents a pixel and each column corresponds to a spectral band of the processed Sentinel-2 product.
Quality filtering was then performed over two steps. First, all pixels flagged by Idepix with any of the conditions listed in Table 3 were removed, as they are considered invalid. Second, sampling sites were retained only if at least 6 out of 9 extracted pixels were valid (Figure 2). For each valid sampling site and acquisition date, the median spectral value was computed across pixels for each band. The median was preferred over the mean to mitigate the influence of outliers, particularly relevant when using the C2RCC processor, which is known to produce a “salt-and-pepper” effect whereby adjacent pixels exhibit highly variable values that deviate from the expected smooth spatial gradients in natural environments.
Table 3.
Applied quality flags of C2RCC and IDEPIX and their descriptions.
Figure 2.
Processes diagram for image processing.
2.3. Statistical Analysis and Empirical Modeling
All statistical analyses were conducted in Python (v3.10). The pandas library was used for data handling and organization, while NumPy and SciPy were employed for numerical and statistical computations. Statistical modeling was performed using the statsmodels package, and data visualization was carried out using Matplotlib and Seaborn.
To evaluate the relative performance of the three atmospheric correction configurations (C2RCC, C2X, and C2X-C), satellite-derived products of Chl-a, TSS and Kd_Z90max were compared against in situ measurements of Chl-a, TSS, and SDD. Root Mean Square Error (RMSE) was used as the primary performance metric, and the atmospheric correction processor yielding the lowest RMSE across all parameters was selected for subsequent analyses.
Using the best-performing atmospheric correction configuration, empirical models were developed to estimate Chl-a, TSS, and SDD directly from Sentinel-2 reflectance data. Model development was carried out using the Automated Radiative Transfer Models Operator (ARTMO) software package [28], specifically employing the Spectral Indices (SIs) tool, which enables the systematic evaluation of all possible band combinations and mathematical formulations.
Extracted Sentinel-2 reflectance values were rigorously aligned with the corresponding in situ measurements and compiled into a single text file (.txt), strictly following the input format required by ARTMO. This ensured a one-to-one correspondence between satellite-derived reflectance data and field observations for each sampling location and acquisition date.
ARTMO was used to test three types of spectral indices: Single Band (SB), Simple Ratio (SR = Ri/Rj), and Normalized Difference Index (NDI = (Ri − Rj)/(Ri + Rj)), combined with five regression models (linear, logarithmic, power, exponential, and polynomial). These indices were selected due to their widespread use in inland water remote sensing and their proven sensitivity to optically active constituents such as Chl-a and TSS in optically complex Case-2 waters [28,29]. And they also provide the smallest error and make physical sense.
Model calibration and validation were performed simultaneously using a k-fold cross-validation scheme (k = 10) implemented within ARTMO. In this approach, the dataset was randomly divided into ten subsets; in each iteration, nine folds were used for model calibration and the remaining fold for validation. This procedure was repeated until all subsets had been used for validation, ensuring that model performance metrics were not dependent on a specific data split.
Model performance was evaluated using the coefficient of determination (R2) and the Root Mean Square Error (RMSE). ARTMO automatically generates statistical output tables and correlation matrices ranking all tested index–regression combinations according to their mean R2 and RMSE values across all folds. For each water quality variable, the optimal model was selected based on the highest R2, lowest RMSE, its simplicity and physical explanation.
The optimal models for Chl-a, TSS, and SDD were applied to generate spatially resolved maps of these variables across the Alqueva reservoir, enabling analysis of their spatial distribution under varying hydrological and climatic conditions.
3. Results
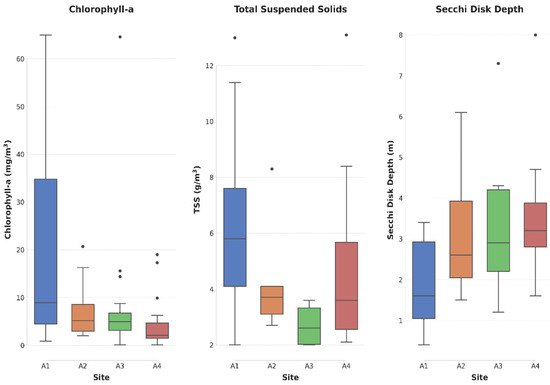
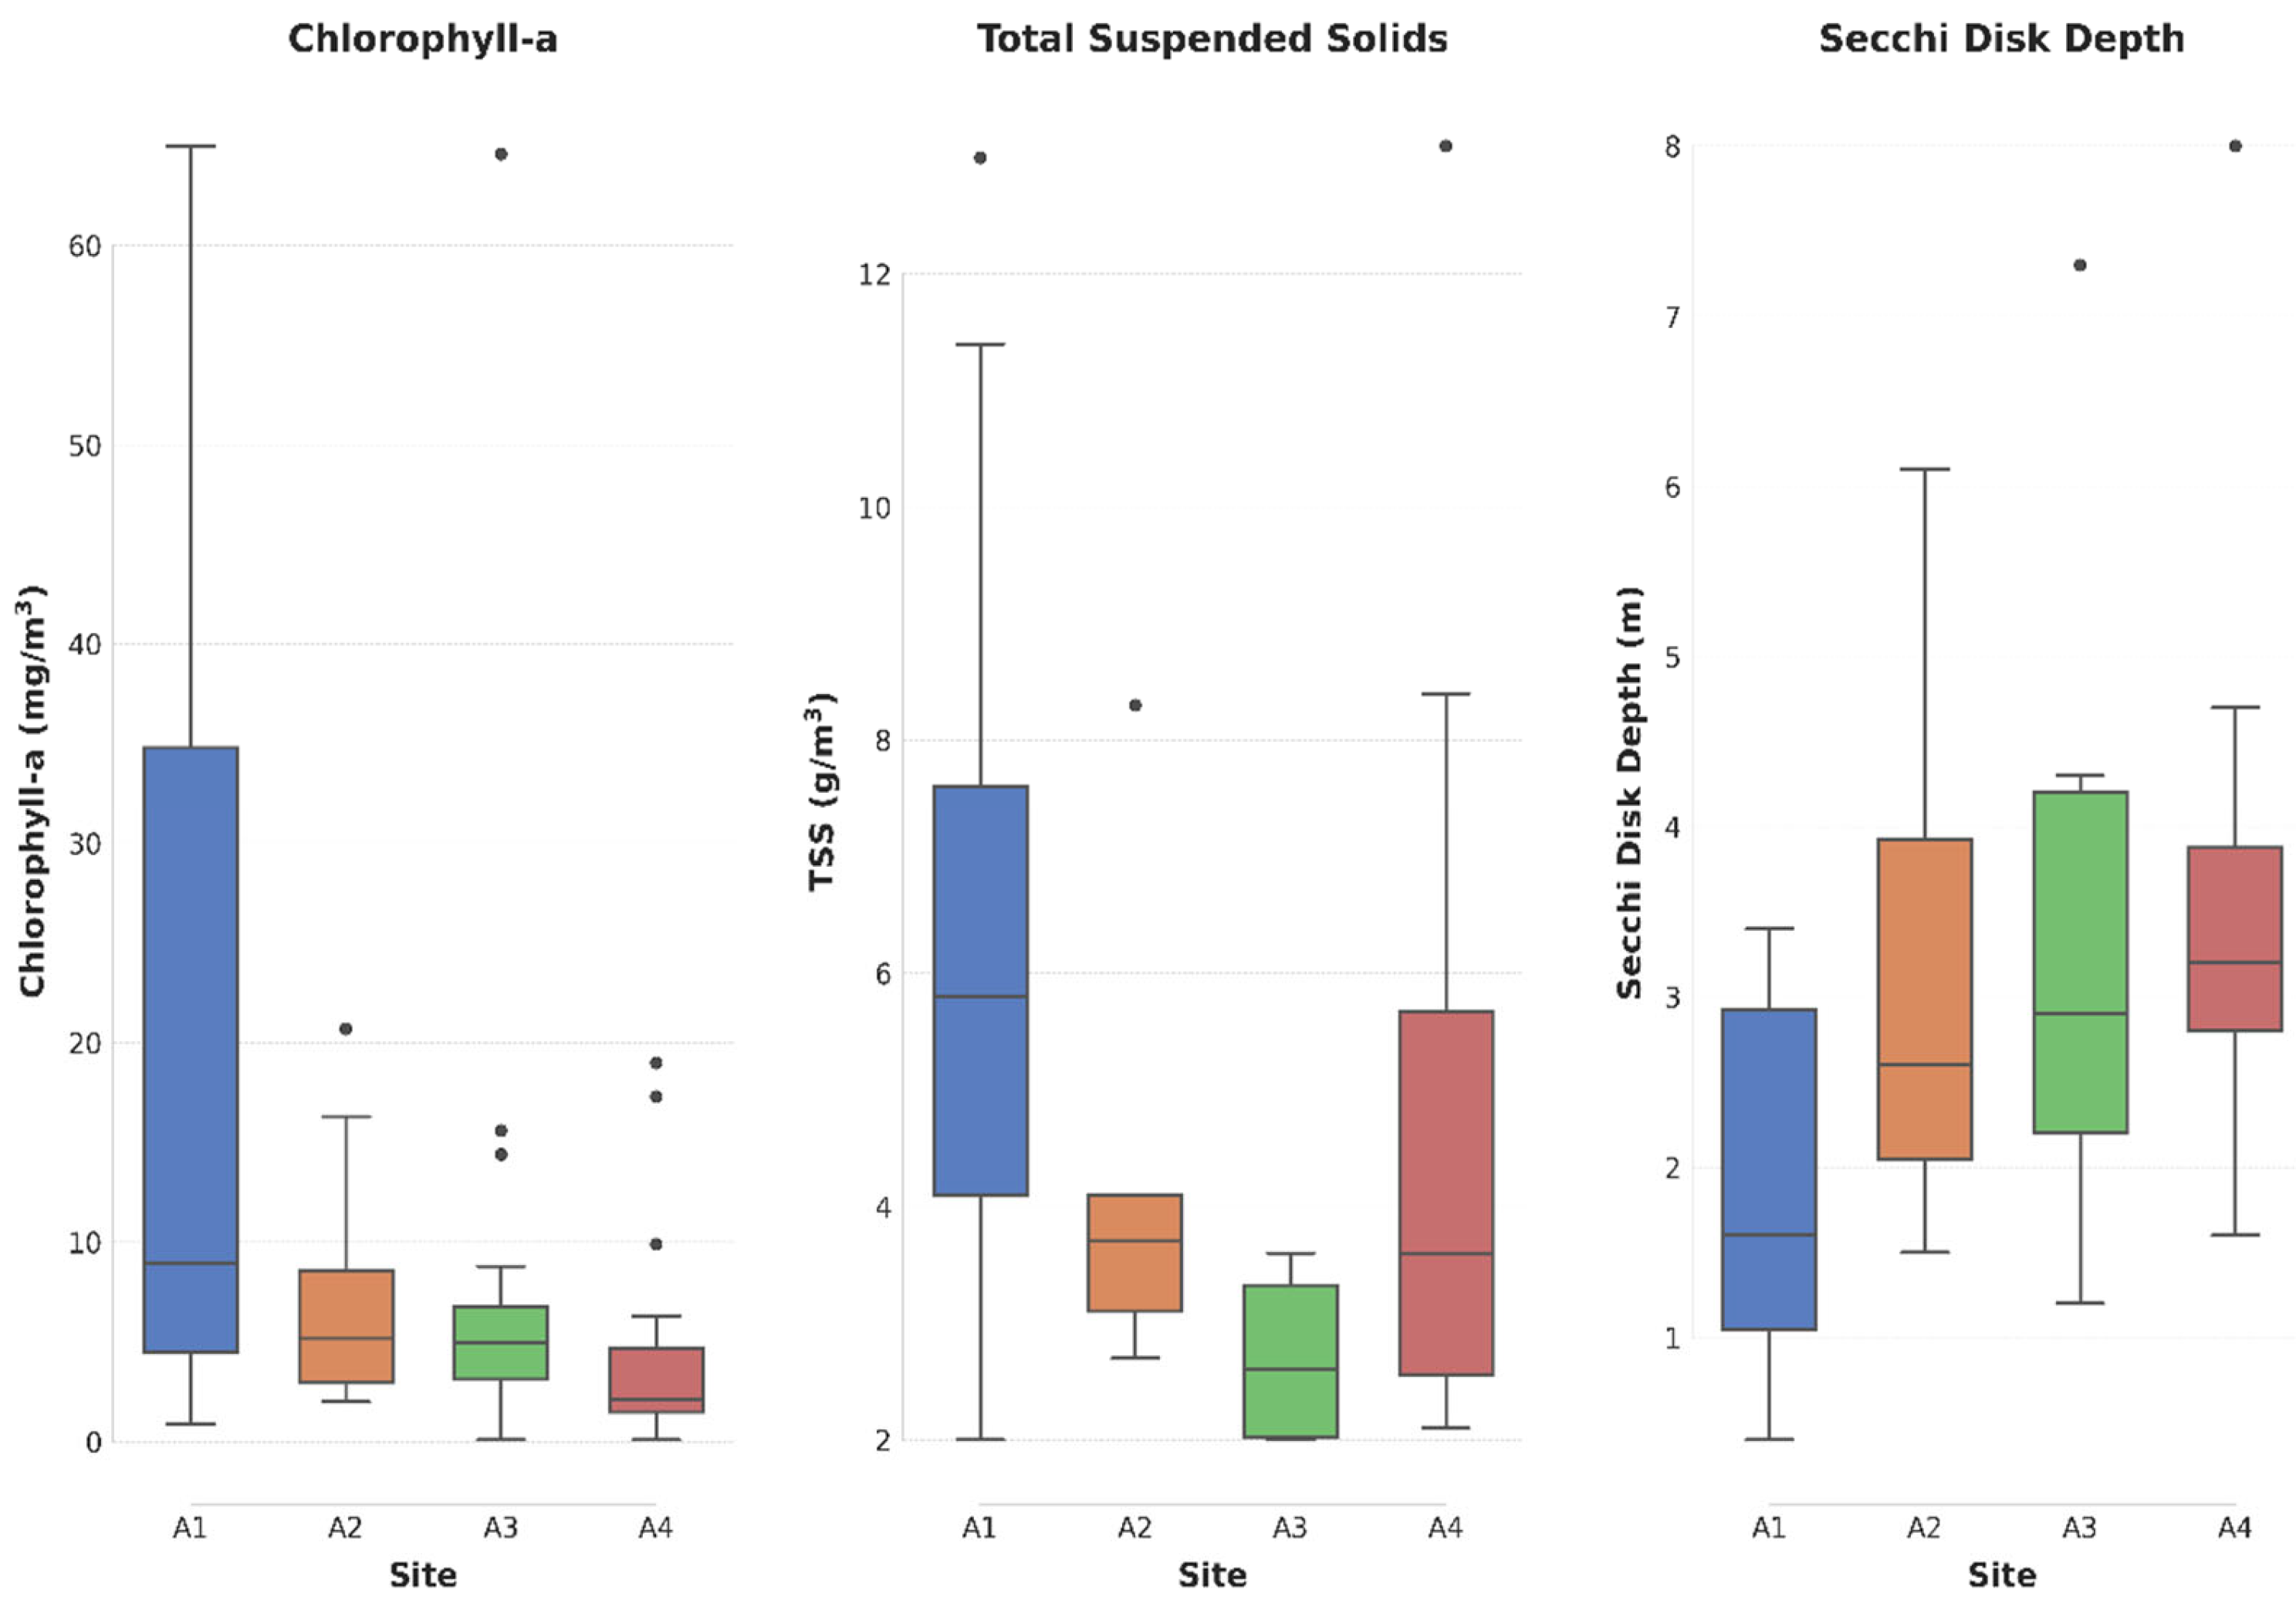
Figure 3 presents boxplots of the field data for the three studied variables at each sampling site. Field data revealed notable spatial variability: A1 (Lucefécit) exhibited the highest median Chl-a (8.95 mg/m3) and TSS (5.8 g/m3), and the lowest SDD (1.6 m), while A4 (Montante) showed the lowest Chl-a (2.1 mg/m3) and highest SDD (3.2 m) (see Figure 3).
Figure 3.
Boxplot of field data: Chlorophyll-a (left), Total Suspended Solids (center), and Secchi Disk Depth (right) at each sampling site (A1: Lucefécit-upstream (blue bars), A2: Mourão (orange bars), A3: Alcarrache (green bars), A4: Montante–near the dam (red bars)). The line inside each box represents the median, the whiskers indicate data dispersion excluding outliers, represented as dots–value significantly different from the interquartile range.
Table 4 summarizes the RMSE results for each C2RCC version and variable when comparing in situ measurements with the corresponding values from atmospheric correction products. Although three atmospheric correction processors were used, the inherent optical properties training ranges of C2RCC are low and do not cover the full range of in situ data obtained in the Alqueva reservoir. Therefore, among the C2X and C2X-C processors, the statistics are more favorable for C2X-C. Although C2X showed the lowest RMSE for Chl-a (9.73 mg/m3), the C2X-C version presented the lowest RMSE values for both TSS (5.29 g/m3) and SDD (1.06 m). Consequently, the COMPLEX version was selected as the most suitable atmospheric correction for water quality estimation in Alqueva using Sentinel-2.
Table 4.
RMSE values among each atmospheric correction product and in situ water quality parameter (Chl-a = Chlorophyll a, TSS = Total Suspended Solids; SDD = Secchi Disk Depth). The background color indicates the smallest errors in each variable.
3.1. Empirical Model Performance and Optimal Band Selection
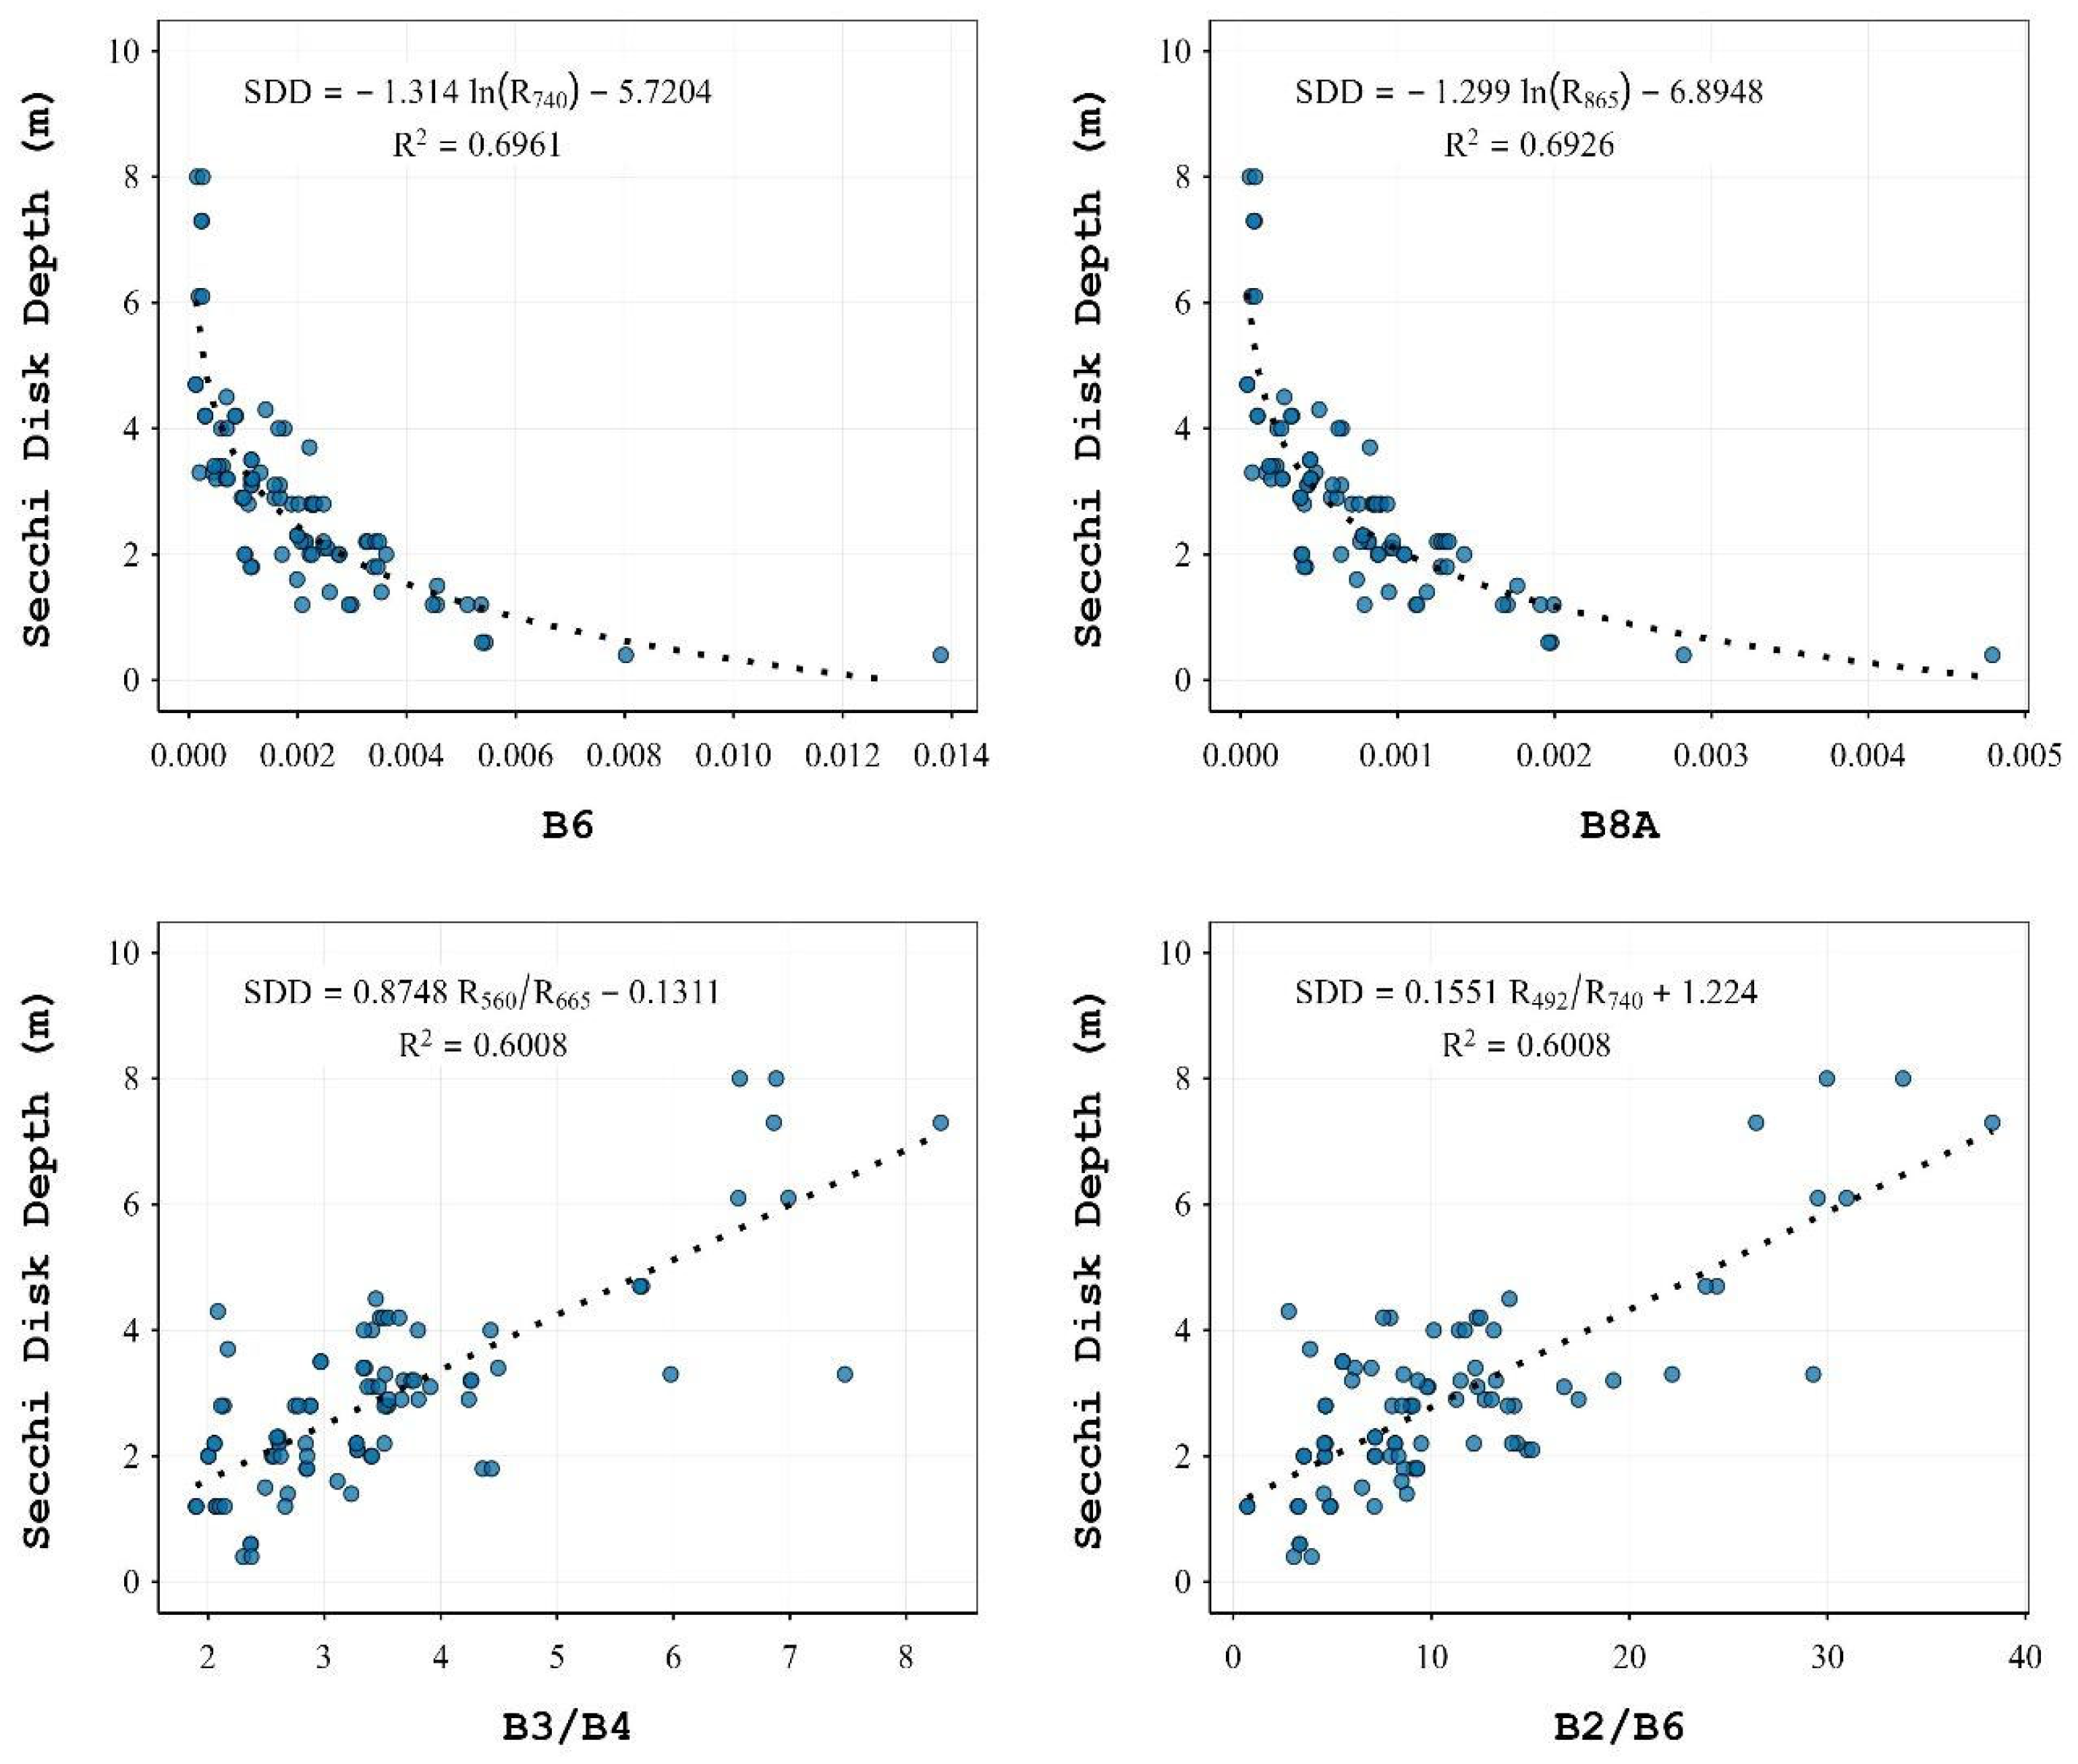
A thorough quality control procedure was carried out to identify the valid coincidences between satellite observations and in situ measurements. Following this process, 133 satellite–in situ matchups were obtained for Chl-a, 81 for TSS, and 88 for SDD. These data were then used in the cross-validation phase. The empirical models showed good performance in estimating Chl-a, TSS, and SDD from Sentinel-2 imagery. The models with the highest predictive ability are reported in Table 5, Table 6 and Table 7 and Figure 4, Figure 5 and Figure 6, together with their regression type, R2, and RMSE.
Table 5.
Best correlations between spectral indices and in situ Chl-a (mg/m3). Column ‘Index’ indicates the type of spectral index used, where SB = Single Band; SR = Simple Ratio (SR = Ri/Rj); and NDI = Normalized Difference Index (NDI = (Ri − Rj)/(Ri + Rj)).
Table 6.
Best correlations between spectral indices and in situ TSS. Column ‘Index’ indicates the type of spectral index used, where SB = Single Band; SR = Simple Ratio (SR = Ri/Rj); and NDI = Normalized Difference Index (NDI = (Ri − Rj)/(Ri + Rj)).
Table 7.
Best correlations between spectral indices and in situ SDD. Column ‘Index’ indicates the type of spectral index used, where SB = Single Band; SR = Simple Ratio (SR = Ri/Rj); and NDI = Normalized Difference Index (NDI = (Ri − Rj)/(Ri + Rj)).
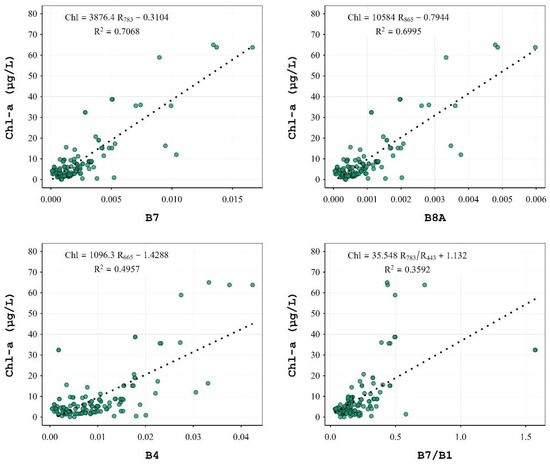
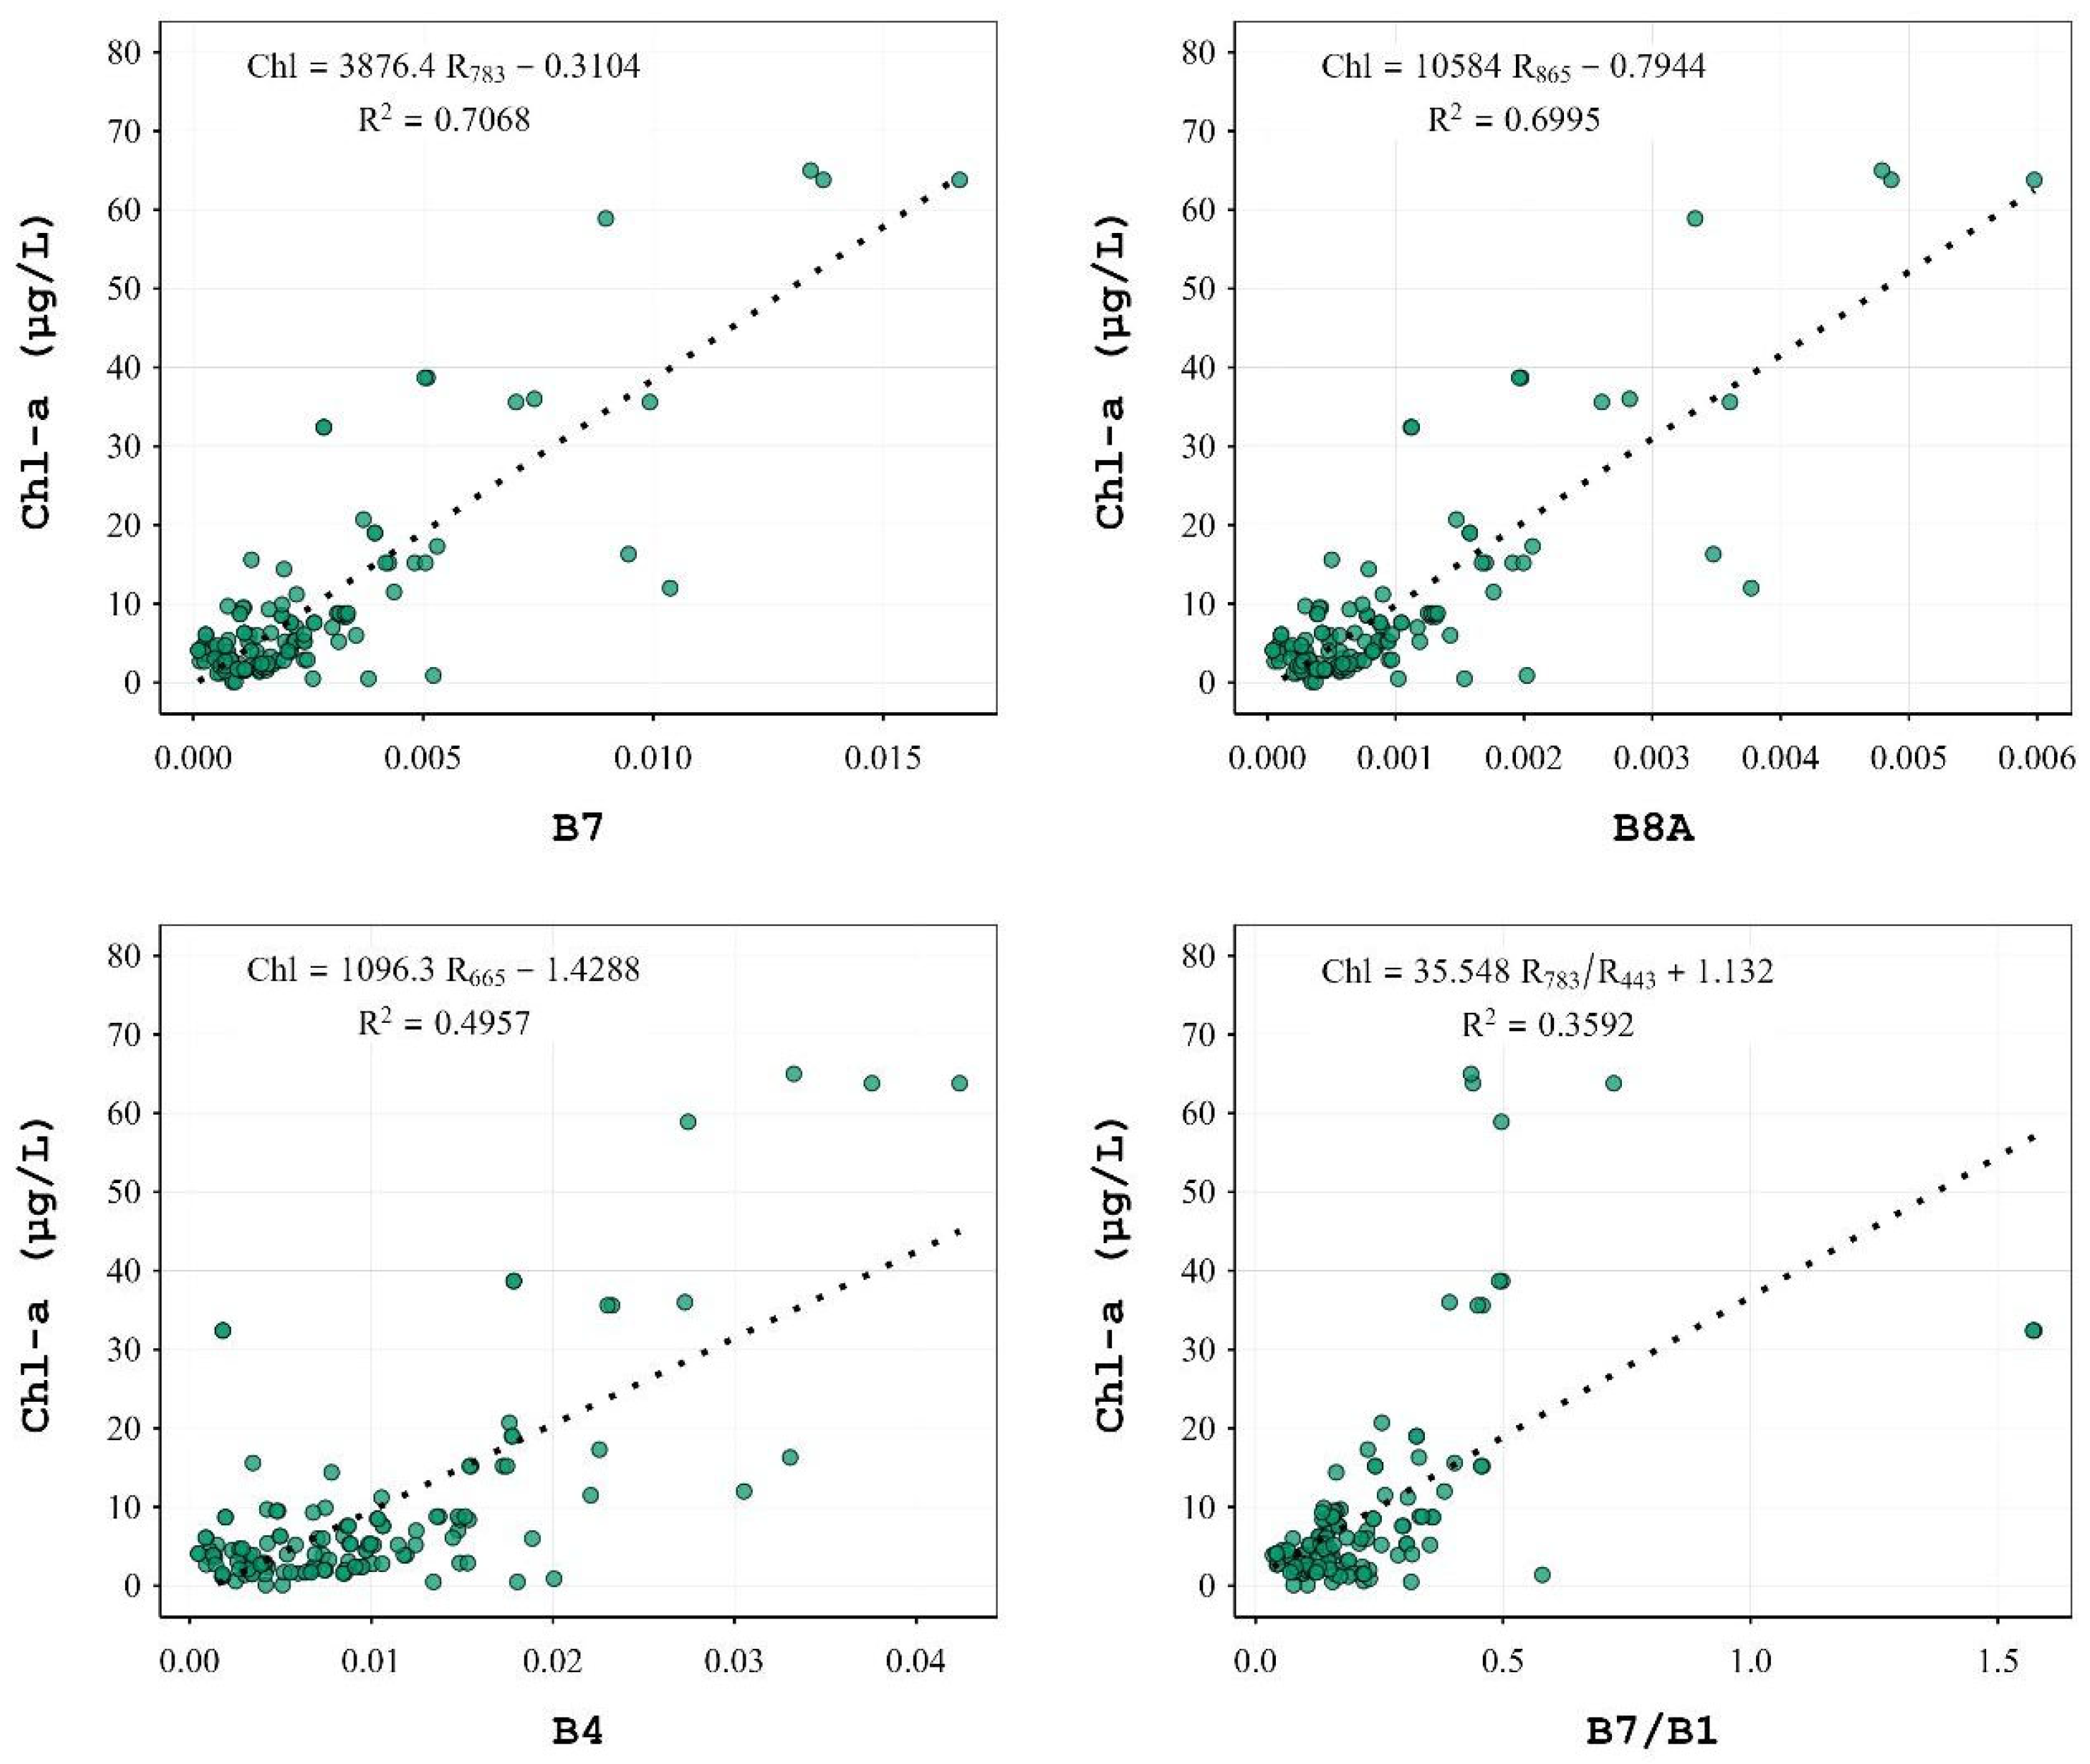
Figure 4.
Linear regression between in situ Chl-a as a function of spectral indices with C2X-C.
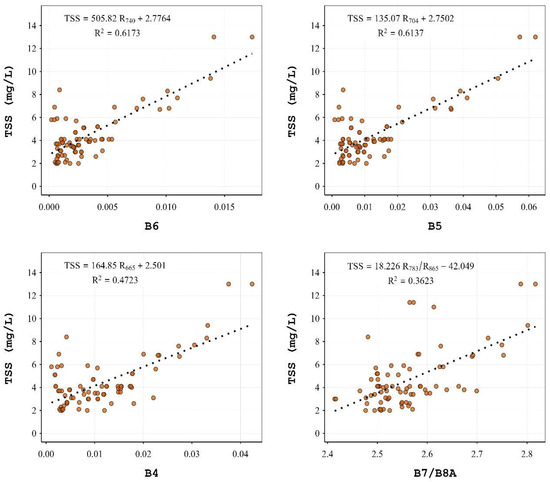
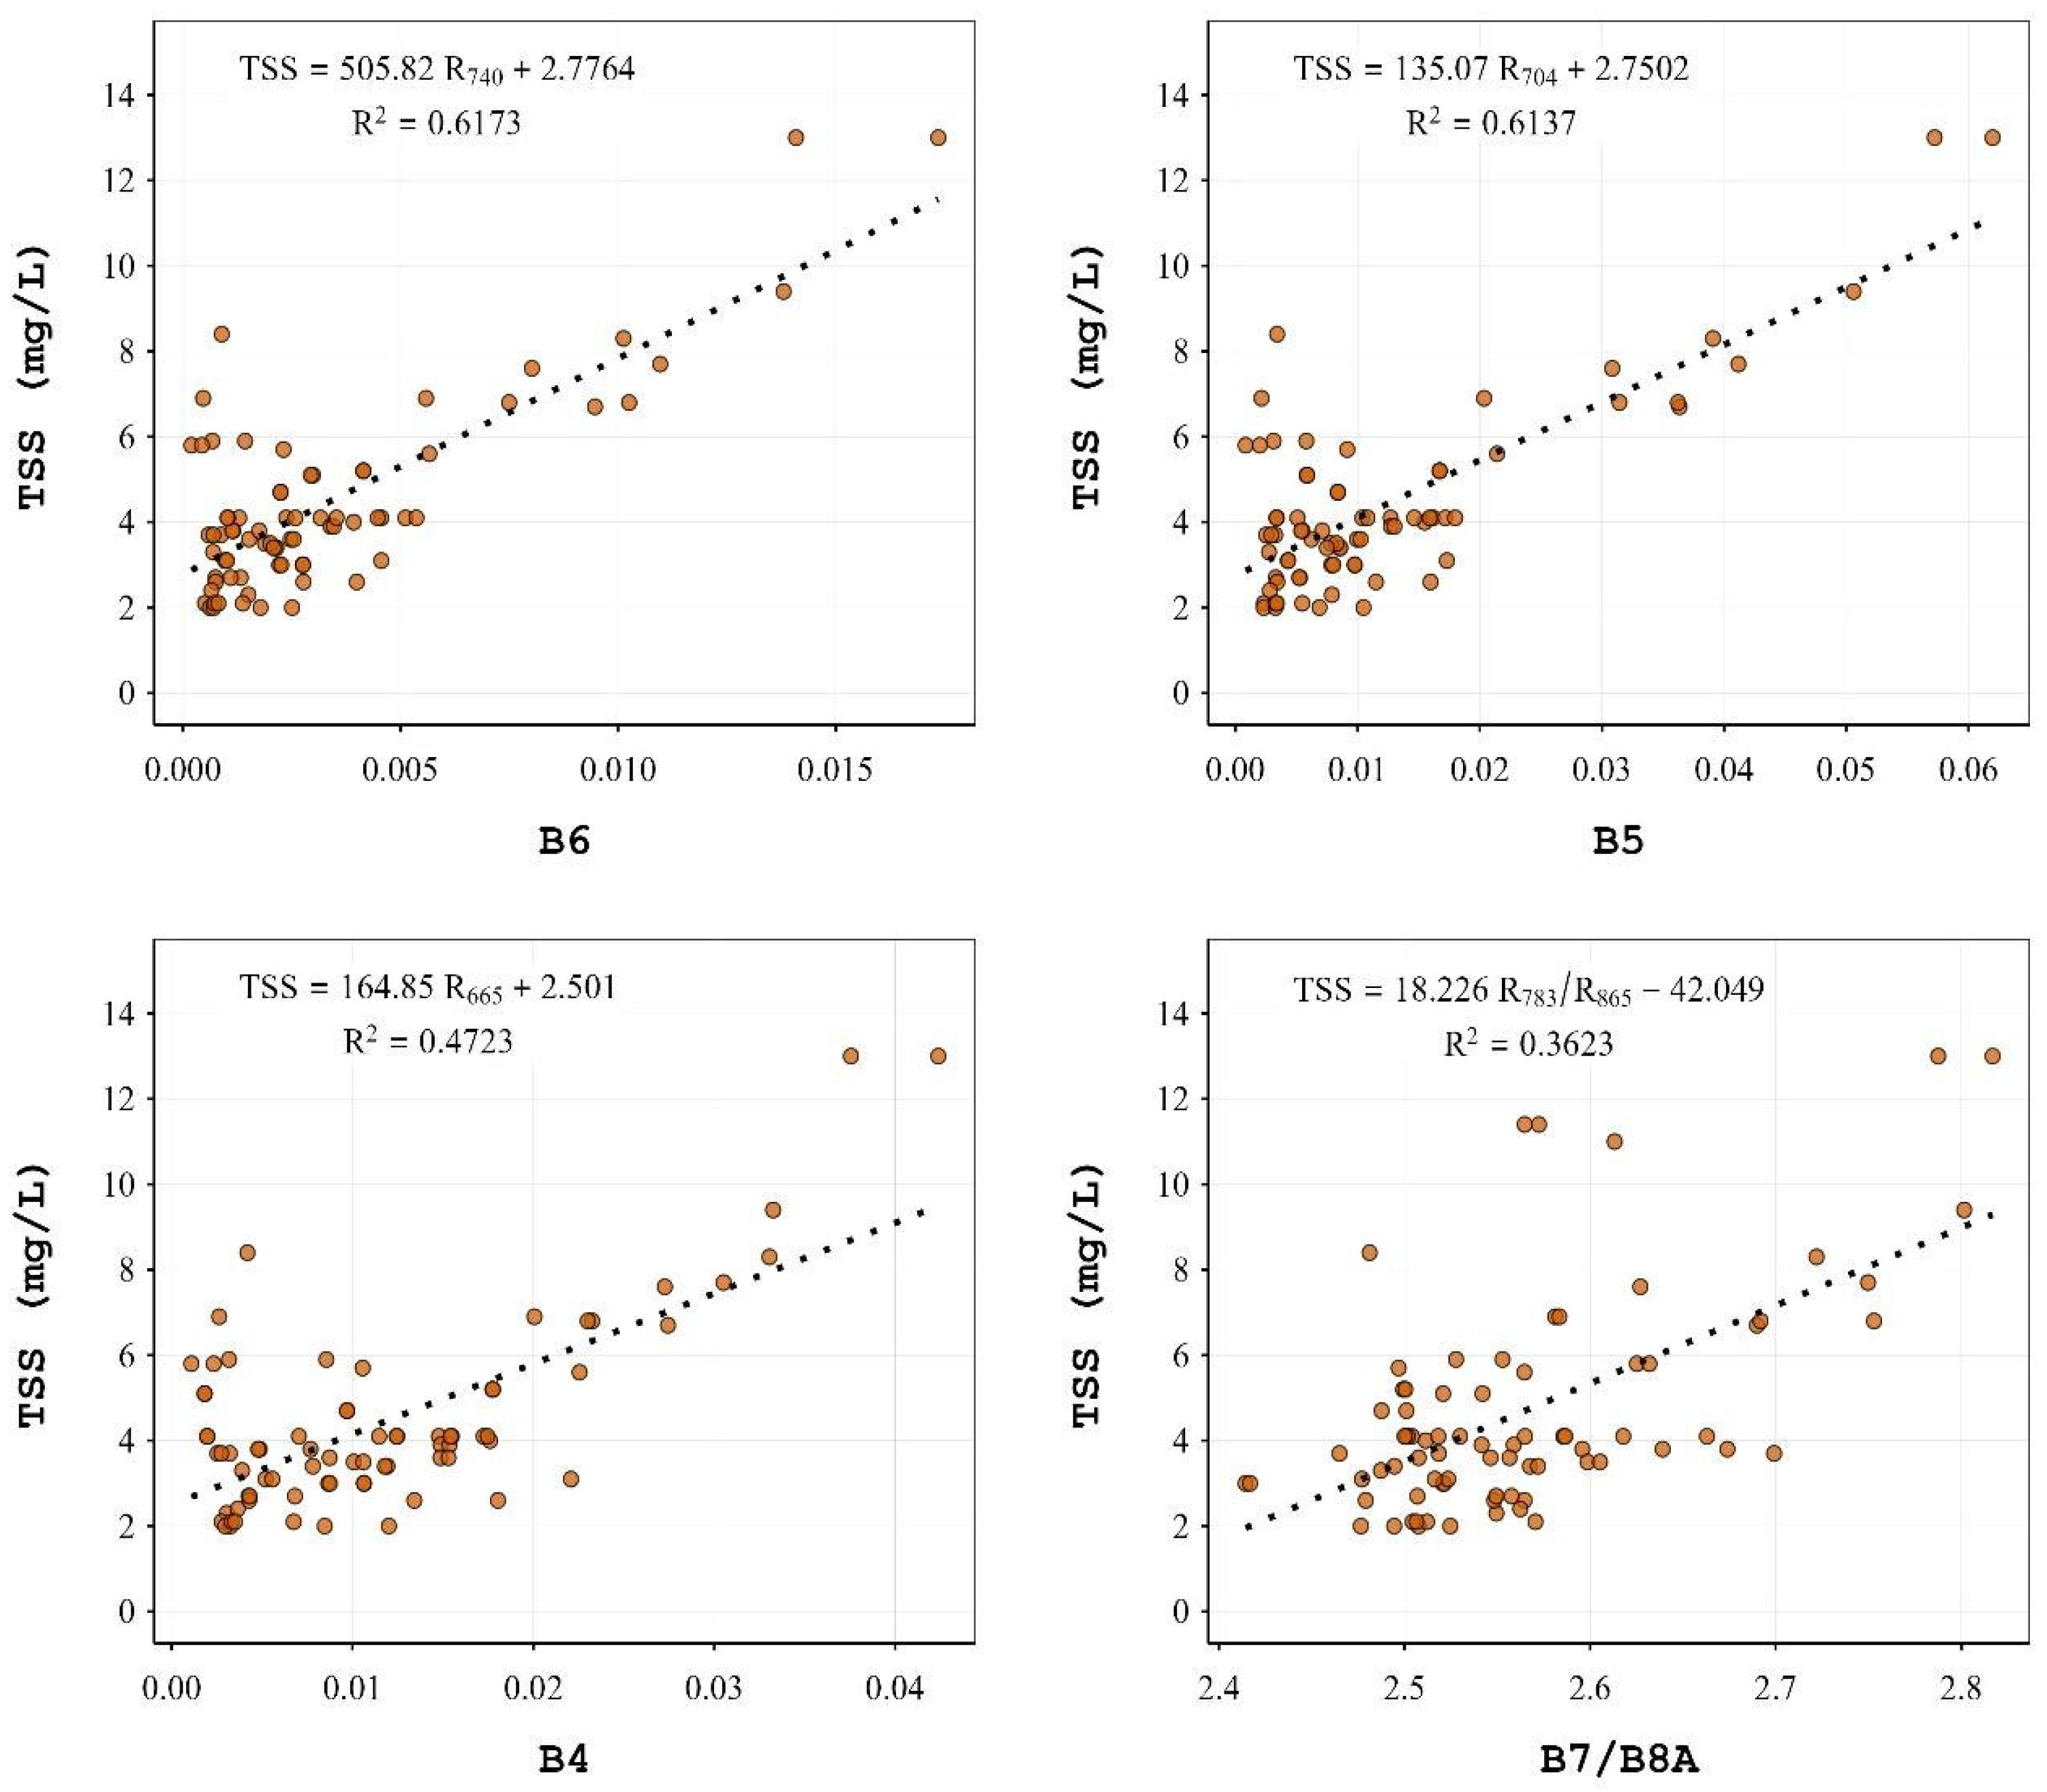
Figure 5.
Linear regression between in situ TSS as a function of spectral indices with C2X-C.
Figure 6.
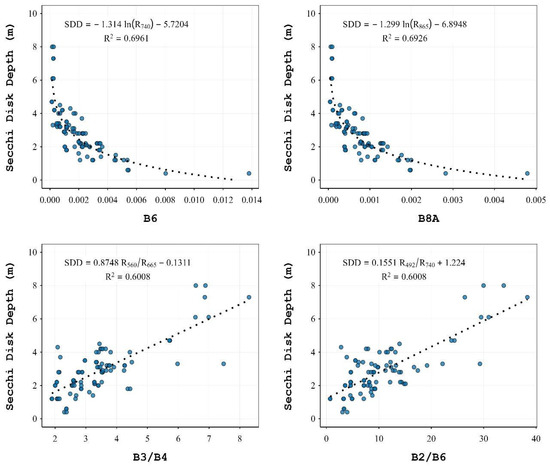
Linear regression between in situ SDD as a function of spectral indices with C2X-C.
For Chl-a, the best model was a linear regression using Band 7 (783 nm), with an R2 of 0.7068 and RMSE of 8.26 mg/m3:
Chl-a (mg/m3) = 3876.4 × R783 − 0.3104
Other high-performing models included bands 8A and 4, with slightly lower R2 values.
For TSS, the top model was also linear, using Band 6 (740 nm), yielding an R2 of 0.6173 and RMSE of 2.4 g/m3:
TSS (g/m3) = 505.82 × R740 + 2.7764
A nearly equivalent performance was obtained with Band 5 (704 nm).
For SDD, the best-performing model used a logarithmic relationship with Band 8A (865 nm), with an R2 of 0.6926 and RMSE of 0.85 m:
SDD (m) = −1.299 × ln(R865) − 6.8948
Although Band 6 produced a marginally higher R2, it resulted in negative values for high reflectance in turbid waters. Therefore, Band 8A was selected due to its greater physical consistency and predictive stability across the water quality gradient. In summary, the final empirical models selected for mapping water quality variables using Sentinel-2 and C2X-C correction were Band 7 for Chl-a (Equation (1)), Band 6 for TSS (Equation (2)) and Band 8A for SDD (Equation (3)).
To understand the model applicability under the heterogeneity conditions of the Alqueva reservoir, the RMSE for each sampling site was calculated (Table 8). The highest RMSE for Chl-a was reached at sites A1 and A3, for TSS was at A1 and A4, and for SDD was at A3 and A4. All of them are the sites with higher values in the respective variables (see Figure 3).
Table 8.
RMSE values among in situ water quality parameters at each sampling site. Values calculated using Equations (1)–(3).
3.2. Application of Empirical Models Under Different Hydrological Conditions
To illustrate the applicability of the developed empirical models under varying hydrological scenarios, Sentinel-2 images from 22 August 2022 (a severe drought), and 16 March 2019 (post-winter rains), were selected. These dates represent seasonal extremes and demonstrate how water quality in Alqueva responds to hydrological and climatic variability.
Maps of Chl-a, TSS, and SDD were generated using Equations (1)–(3), applied to the respective Sentinel-2 images. Figure 7 displays water quality maps from 22 August 2022, during a summer drought marked by record temperatures (>40 °C) and 80% below-average rainfall [30]. The resulting water stagnation led to pronounced spatial gradients across the reservoir:
- Chl-a and TSS concentrations were highest in the northern riverine arms (e.g., A1: Lucefécit-upstream), exceeding 30 mg/m3 and 7.5 g/m3, respectively.
- These values progressively decreased toward the southern dam-proximal areas, where Chl-a and TSS dropped below 10 mg/m3 and 4.5 g/m3, respectively.
- SDD exhibited the opposite trend, with low values (<0.5 m) in the north and higher values (~2 m) in the south.
Wider areas of the reservoir showed lower Chl-a and TSS, while narrow, river-like zones consistently had higher concentrations. This spatial heterogeneity reflects both hydrodynamic differences and sediment/nutrient accumulation patterns during drought.
Figure 7.
Sentinel-2 images over the Alqueva reservoir, on 22 August 2022 (drought), with maps of water quality variables overlayed, displaying Chl-a concentration (left), TSS concentration (center), and SDD (right).
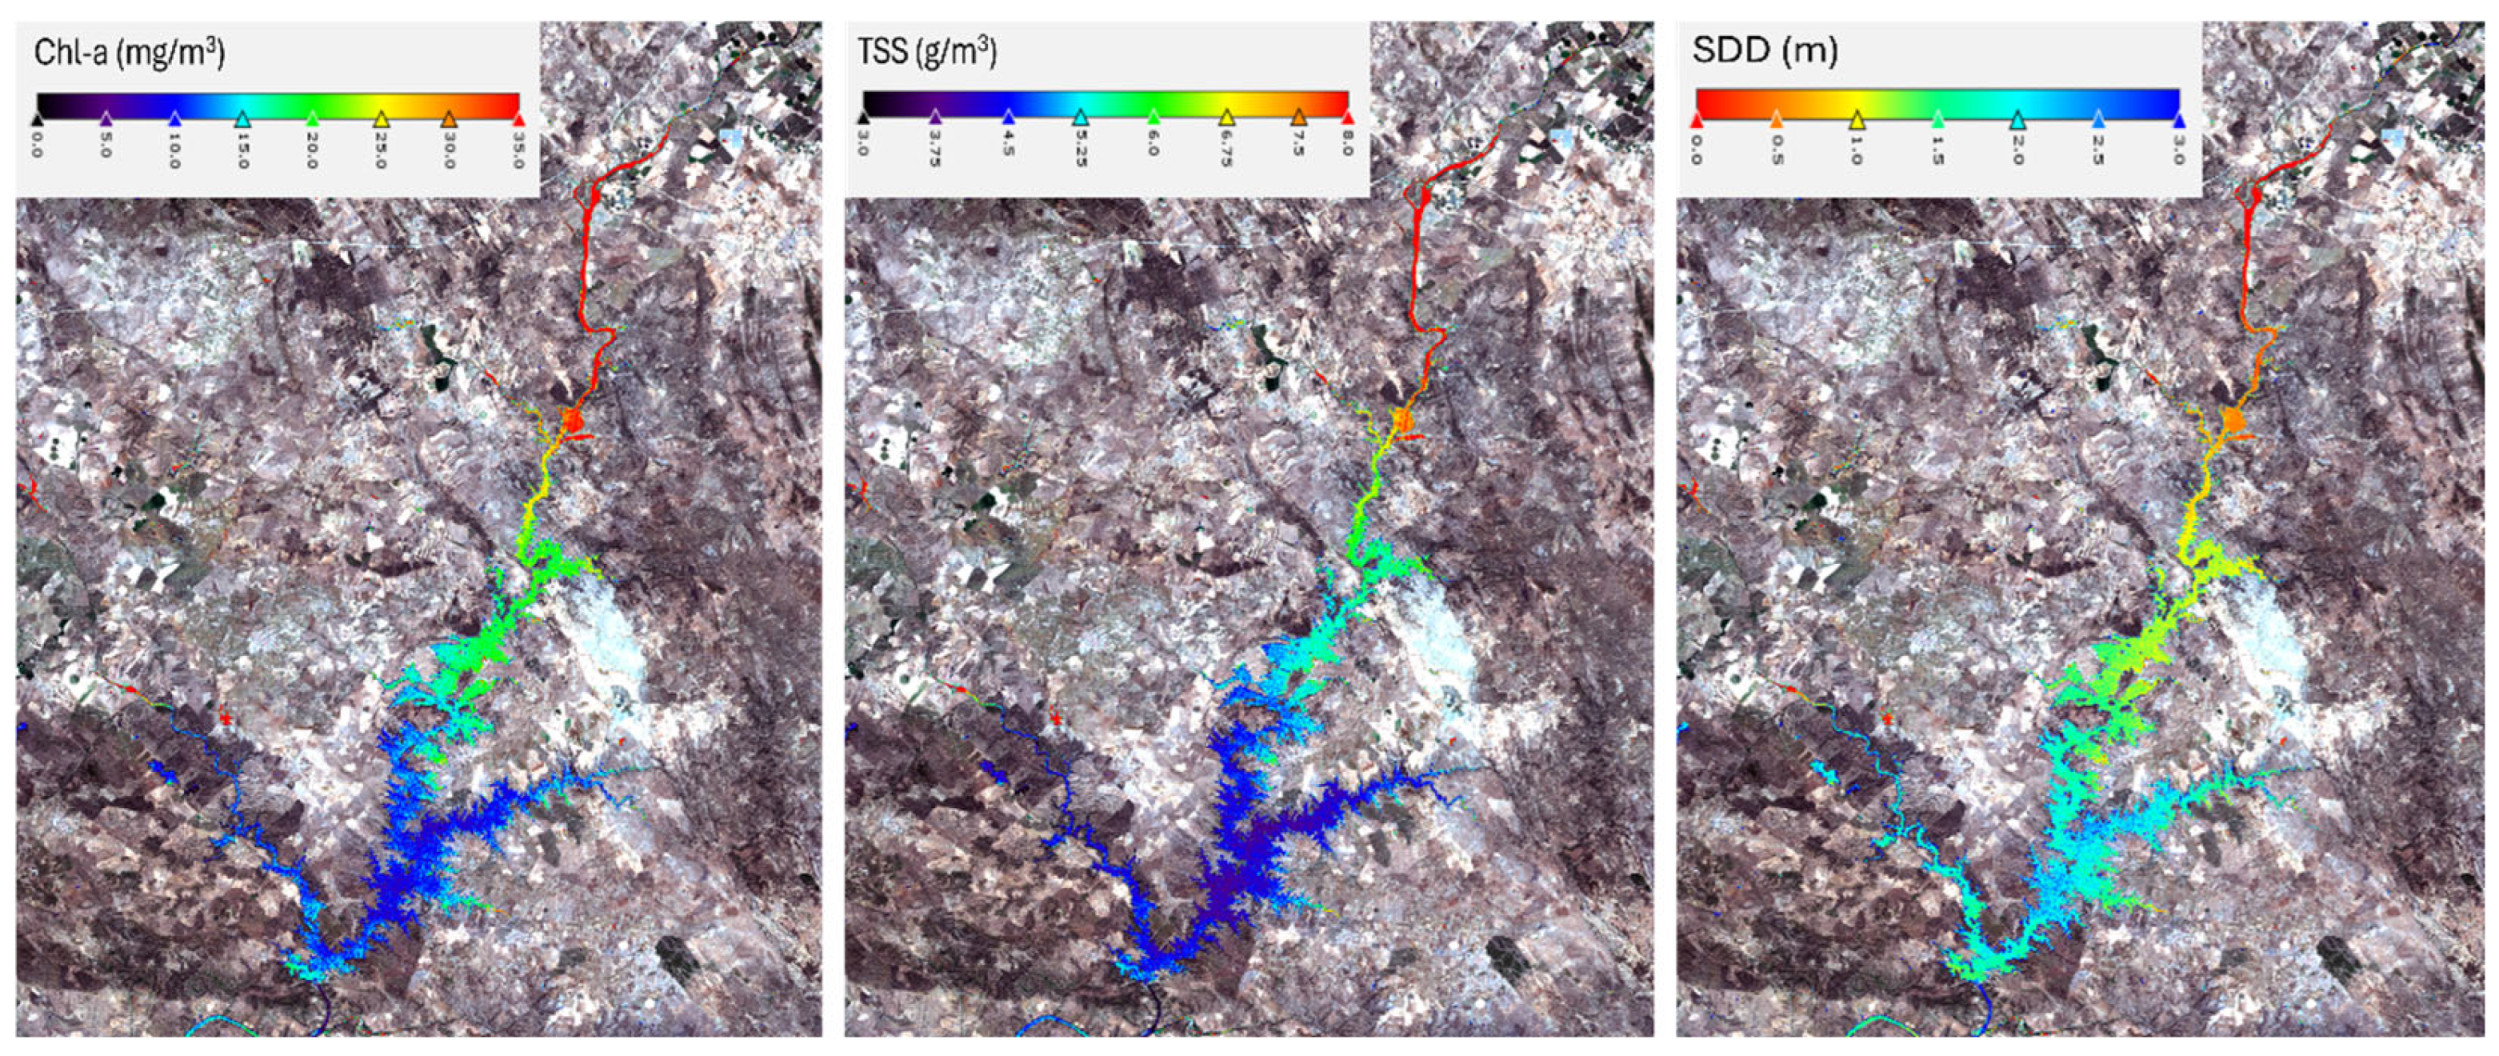
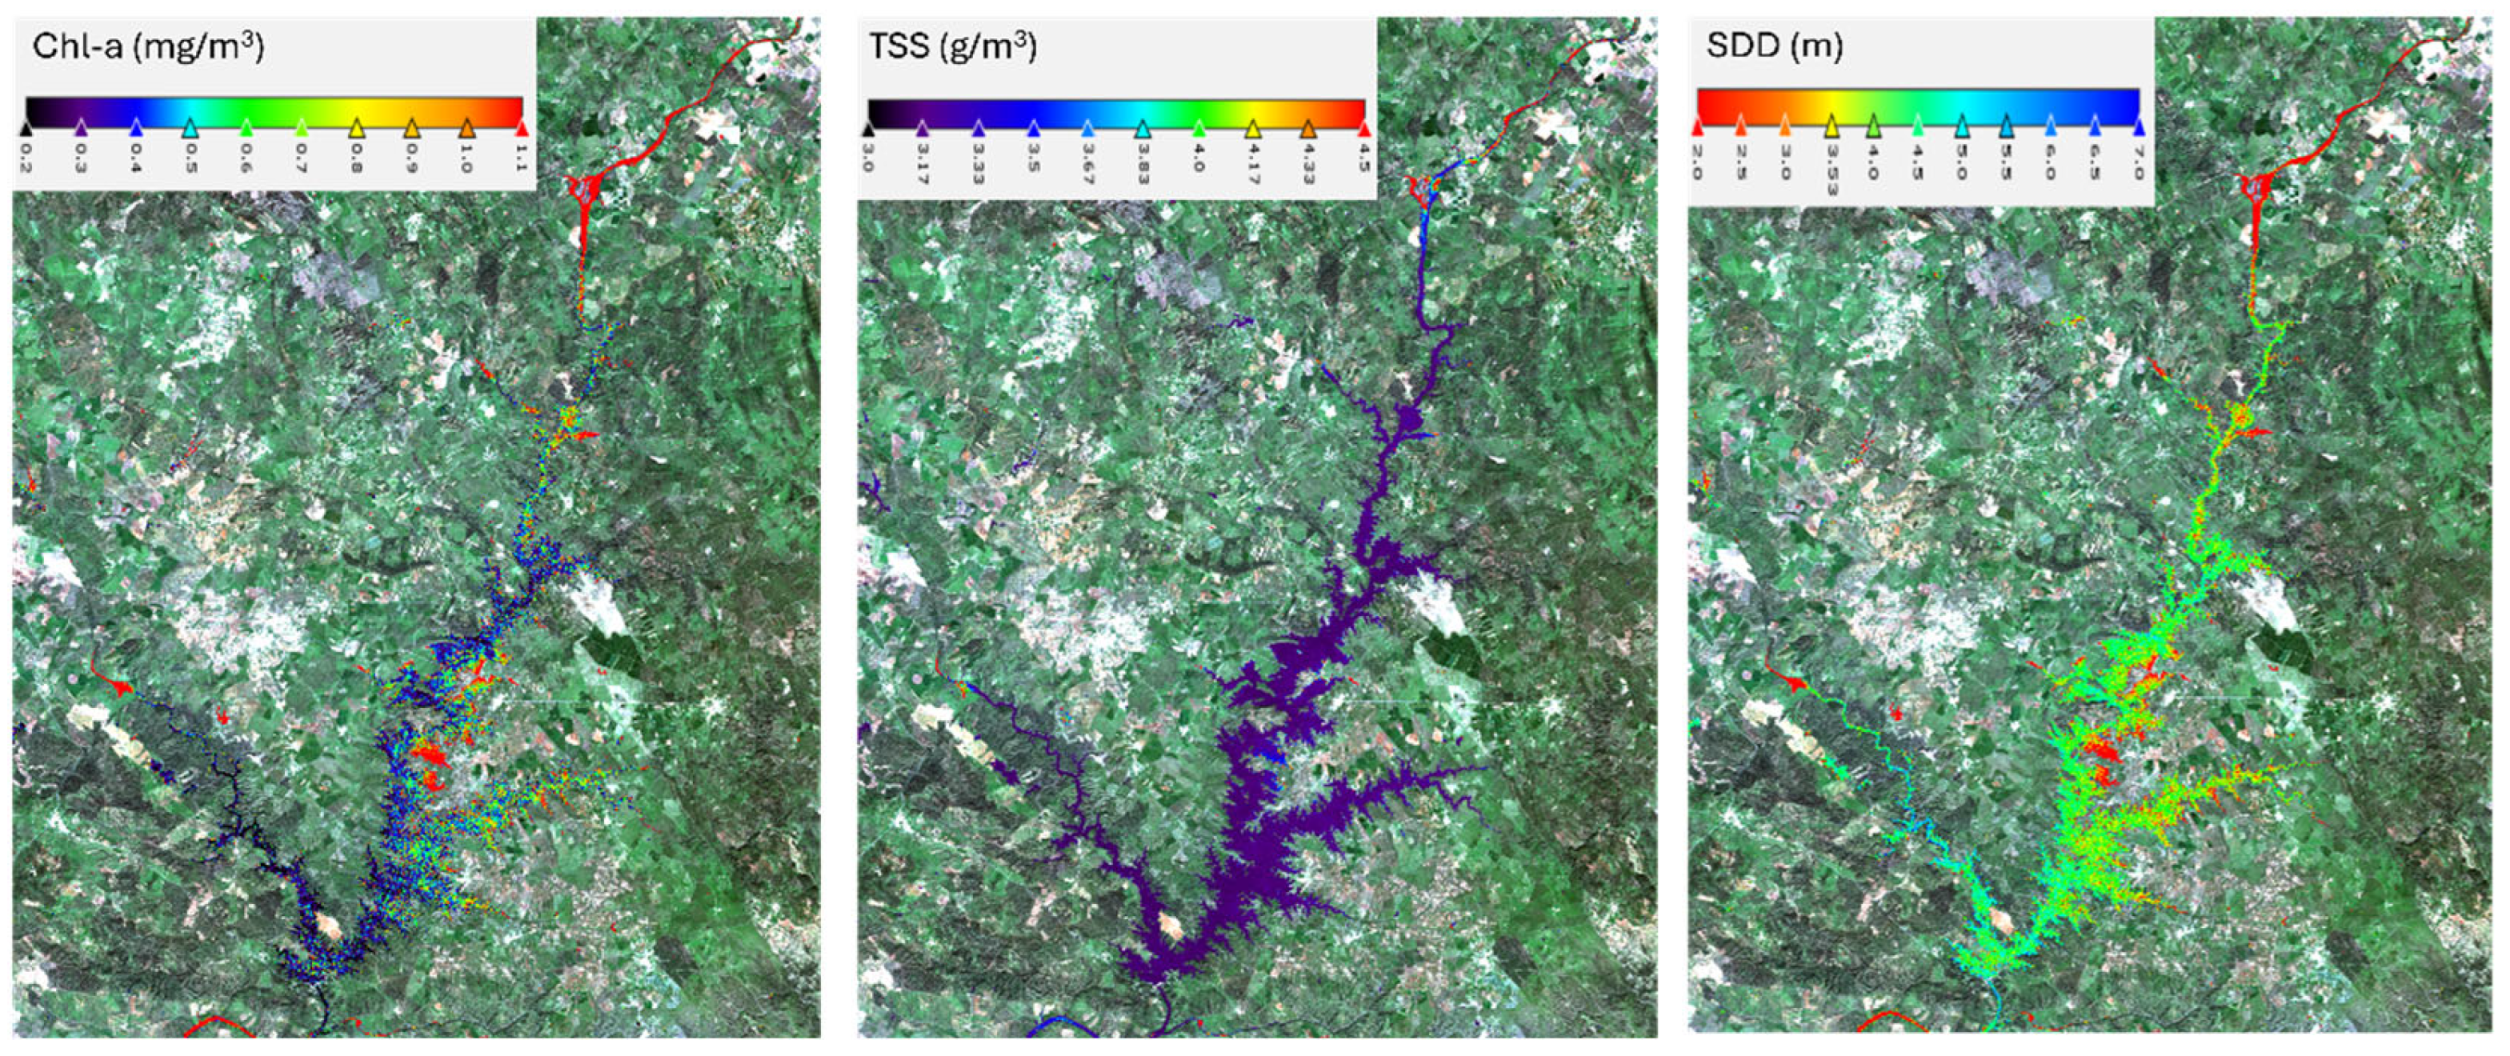
Figure 8 shows thematic maps derived from 16 March 2019, after a near-average winter [31] with replenished inflows. Spatial variability in all three parameters was substantially reduced compared to the 2022 image:
- Chl-a values mostly ranged between 0.2–0.4 mg/m3 across the reservoir, with slightly elevated values (>1 mg/m3) in stagnant northern arms.
- TSS values remained below 3.5 g/m3, and SDD reached values of 4–5 m in the central and southern areas.
- Despite the overall homogeneity, areas with slowed flow, such as meandering sections or river inflows, continued to exhibit slightly elevated Chl-a and TSS and reduced SDD.
These patterns emphasize that while winter inflows mitigate eutrophication and turbidity, morphological constraints can create persistent hotspots of reduced water quality.
Figure 8.
Sentinel-2 images over the Alqueva reservoir, on 16 March 2019 (post-winter), with maps of water quality variables overlayed, displaying Chl-a concentration (left), TSS concentration (center), and SDD (right).
4. Discussion
This study successfully developed localized algorithms to estimate Chl-a, TSS, and SDD in the Alqueva Reservoir using Sentinel-2 imagery. The results confirm the feasibility of monitoring water quality through remote sensing, addressing the critical need for region-specific calibrations in Mediterranean climates, where traditional methods face limitations in spatial coverage and sampling frequency [32].
The C2X-C atmospheric correction was found to be the most suitable for the Alqueva Reservoir, outperforming other versions (C2RCC and C2X) in recovering TSS and SDD, although it showed higher RMSE for Chl-a compared to C2X. This finding highlights the importance of selecting atmospheric correction methods tailored to each context, as Mediterranean reservoirs exhibit unique optical properties influenced by seasonal sediment loads and algal dynamics [1,33]. The empirical models derived from Sentinel-2 bands Band 7 (783 nm) for Chl-a, Band 6 (740 nm) for TSS, and Band 8A (865 nm) for SDD achieved strong correlations (R2 = 0.69–0.71), demonstrating the value of utilizing spectral regions sensitive to phytoplankton absorption (red edge) and suspended particle scattering (NIR) [14].
Spatially explicit thematic maps revealed sharp gradients during the drought (August 2022), with elevated Chl-a (>30 mg/m3) and TSS (>7.5 g/m3) levels in the northern shoreline sections (A1), while clearer conditions were observed near the dam (A4). These patterns align with Mediterranean hydroclimatic dynamics: summer water stagnation concentrates nutrients and sediments in shallow zones dependent on inflow, while winter inflows (March 2019) homogenize water quality, reducing Chl-a concentration (<1 mg/m3) and enhancing clarity (SDD > 5 m). These contrasts validate the capability of Sentinel-2 to resolve climate-driven extremes, which is crucial for managing eutrophication risks exacerbated by droughts [34,35]. The inverse relationship between SDD and turbidity metrics underscores light attenuation as a key indicator of ecological stress in nutrient-rich areas [36]. This study, in conjunction with previous research, demonstrates that remote sensing is an effective tool for assessing water quality in Mediterranean reservoirs, although with variability in the effectiveness of atmospheric correction algorithms depending on the specific optical conditions of each water body [1,21,37,38].
By integrating a decade of in situ data with high-resolution satellite imagery, this study bridges gaps in traditional monitoring, which struggles to capture spatial variability [3]. The localized algorithms outperformed the C2RCC default products, highlighting the limitations of generic neural networks in optically complex waters [5]. For instance, the automatic Chl-a product (RMSE = 14.8 mg/m3) was less accurate than the empirical model (RMSE = 8.26 mg/m3), likely due to the training of C2RCC in coastal waters rather than Mediterranean inland waters. This result is consistent with the findings of Warren et al. [39], who emphasized the need to adapt atmospheric correction to specific regional contexts.
From a management perspective, the results suggest that Sentinel-2 monitoring could provide crucial information for planning mitigation measures during drought periods [40,41]. Early identification of eutrophication-prone areas would allow for the implementation of strategies such as nutrient load reduction or controlled water flow in specific zones [42]. Spatially explicit maps provide valuable information for reservoir management: during droughts, targeted monitoring of northern areas can mitigate risks of algal blooms, while post-winter periods allow for assessing sediment redistribution and clarity recovery. These capabilities are essential for Alqueva, where water scarcity and eutrophication threaten agriculture and biodiversity [17]. Furthermore, the model’s responsiveness to climatic extremes supports the European Water Framework Directive’s mandate, promoting dynamic, large-scale water quality assessments.
Despite using a 3-day matching window and 60 m resolution, this does not necessarily result in temporal mismatches or large differences due to spatial aggregation. A recent study by Schröder et al. [23], ‘Exploring Spatial Aggregations and Temporal Windows for Water Quality Match-Up Analysis Using Sentinel-2 MSI and Sentinel-3 OLCI Data’, demonstrated that varying spatial aggregations and temporal windows yield similar accuracies and biases. Moreover, although the 60 m resolution may overlook fine-scale variability in narrow inflows, C2RCC processors produce images with a salt-and-pepper effect, and using a 60 m resolution is preferable because it integrates larger areas and averages reflectance values. Furthermore, since the study area is a very large reservoir, substantial changes over short distances are not expected.
However, during high precipitation and cloud cover, persistent cloudiness can obscure reservoir visibility, rendering satellite images unusable and widening this temporal window. Future research in great body waters could integrate sensors with higher temporal resolution (such as Sentinel-3 OLCI) to enhance dynamic monitoring capabilities through improved temporal coverage and also employ machine learning techniques to address nonlinear optical interactions.
Long-term validation under changing climatic conditions, such as the intensifying droughts projected for southern Portugal [43], will be essential to ensure the model’s robustness. On the other hand, factors such as sunglint and adjacency effects can influence the satellite signal, affecting the accuracy of atmospheric correction algorithms [44]. In this context, alternative algorithms, such as ACOLITE, have been developed specifically to correct for sunglint and reduce adjacency effects in Sentinel-2 imagery, as widely documented [45]. Similarly, studies evaluating the performance of correctors such as ICOR have reported promising results in atmospheric correction in continental waters, suggesting that a systematic comparison between these methods and C2RCC could lead to significant improvements in water quality parameter estimation [39,46]. In future investigations, the integration of these alternative algorithms with machine learning techniques and the combined use of sensors with higher temporal and radiometric resolution will allow for a more robust approach to both sunglint and adjacency effects. This approach could not only improve the accuracy of empirical models but also facilitate the generation of water quality maps with greater capacity to detect rapid changes under extreme climatic conditions.
The transferability of empirical bio-optical models across different aquatic systems remains a recognized challenge, particularly in optically complex Mediterranean reservoirs. The equations derived in this study are site-specific and should not be directly extrapolated to other lakes or reservoirs with distinct optical characteristics. However, the methodological approach—based on long-term in situ data, systematic evaluation of Sentinel-2 band combinations (e.g., B6, B7, B8A), and robust regression techniques—is transferable. When applied to other reservoirs under comparable climatic-hydrological conditions, the proposed framework can be effectively adapted through local validation and recalibration using in situ observations.
Inland waters are highly complex systems whose behavior depends on multiple variables; therefore, empirical algorithms, although robust, are often limited to the specific regions and datasets from which they are derived [47]. Consequently, while the methodological framework of this work may be transferable to other water bodies, the algorithms may not always perform with the same accuracy. For application elsewhere, algorithms should be validated with in situ data and recalibrated if necessary to maintain accuracy.
The operational procedures for applying the methodological framework in Alqueva reservoir follow these steps: Level-1C images are downloaded and opened in SNAP, the C2X-C processor is executed, and Equations (1)–(3) are applied. Pixels influenced by coastal proximity, clouds and shadows, and sunglint are excluded to minimize potential sources of uncertainty and ensure robust results.
5. Conclusions
This study successfully demonstrated the integration of Sentinel-2 multispectral imagery with localized empirical algorithms to monitor water quality in the Alqueva Reservoir, a critical water source in drought-prone southern Portugal.
The C2X-C atmospheric correction emerged as the most effective method for addressing the optical complexities of Alqueva reservoir, outperforming other versions (C2RCC and C2X) in retrieving Total Suspended Solids (TSS) and Secchi Disk Depth (SDD). We have developed empirical models using Sentinel-2 bands 7 (783 nm), 6 (740 nm), and 8A (865 nm) for Chl-a, TSS and SDD, respectively, with RMSE values of 8.26 mg/m3, 2.4 g/m3, and 0.85 m. This provides an operational method that can be applied quickly and easily to water quality studies of the Alqueva reservoir.
Spatially explicit maps revealed pronounced north–south gradients during severe drought (August 2022), with Chl-a exceeding 30 mg/m3 and TSS > 7.5 g/m3 in nutrient-retentive northern zones, contrasting with clearer conditions near the southern dam. Post-winter recovery (March 2019) showed homogenized water quality, underscoring Sentinel-2’s capacity to resolve climate-driven extremes. These findings highlight the framework’s utility in supporting adaptive management strategies under the Water Framework Directive, particularly for eutrophication risk assessment in Mediterranean reservoirs.
The operational procedures for applying the methodological framework are a solid basis for future multitemporal and process-oriented analyses.
Future studies should prioritize integrating higher-frequency sensors (e.g., Sentinel-3 OLCI) to address cloud-related data gaps and capture rapid water quality dynamics. Machine learning techniques could improve nonlinear retrievals of interacting optical parameters, while systematic comparisons of atmospheric correction algorithms (e.g., ACOLITE, ICOR) may enhance accuracy. Expanding validation to multi-year datasets under intensifying drought scenarios, as projected for southern Portugal, would ensure model robustness. Investigating sunglint correction methods and adjacency effect mitigation could further refine reflectance retrievals. Finally, extending this framework to other Mediterranean reservoirs and incorporating additional parameters (e.g., dissolved organic matter, cyanobacteria) would broaden its applicability for comprehensive water quality management.
Author Contributions
Conceptualization, V.H.N., G.P. and S.C.A.; Data curation, V.H.N., L.S.-P. and J.D.; Formal analysis, V.H.N., G.P., J.D., L.S.-P. and S.C.A., Methodology, V.H.N., G.P., J.D., L.S.-P. and S.C.A.; Software, V.H.N., L.S.-P., J.D. and G.P.; Supervision, X.S.-P., G.P., J.D. and S.C.A., Writing—original draft preparation, V.H.N., L.S.-P., G.P., J.D. and S.C.A.; Writing—review and editing, X.S.-P., V.H.N., G.P., J.D., L.S.-P. and S.C.A. All authors have read and agreed to the published version of the manuscript.
Funding
This research was funded by national funds through FCT-Fundação para a Ciência e a Tecnologia, I.P., and by the European Commission’s Recovery and Resilience Facility, within the scope of UID/04423/2025 (https://doi.org/10.54499/UID/04423/2025), UID/PRR/04423/2025 (https://doi.org/10.54499/UID/PRR/04423/2025), and LA/P/0101/2020 (https://doi.org/10.54499/LA/P/0101/2020). Project “2Qua-Water Quality and Quantity, the challenge for the present and future” (https://doi.org/10.54499/2023.17517.ICDT), which is supported by national funds through the Foundation for Science and Technology (FCT, Portugal) and European funds, through COMPETE2030 (COMPETE2030-FEDER-0691700), also supports this research. This study had the support of FCT through the project LA/P/0069/2020 granted to the Associate Laboratory ARNET https://doi.org/10.54499/LA/P/0069/2020. This work was also supported by the “Contrato-Programa” UID/04050/2025 funded by FCT I.P. https://doi.org/10.54499/UID/04050/2025.
Data Availability Statement
The datasets during and/or analyzed during the current study are available from the corresponding author on reasonable request.
Acknowledgments
The authors thank Empresa de Desenvolvimento e Infra-Estruturas do Alqueva (EDIA) for providing the in situ long-term monitoring data.
Conflicts of Interest
The authors declare no conflicts of interest.
Abbreviations
| AC | Atmospheric Correction |
| ARTMO | Automated Radiative Transfer Models Operator |
| CDSE | Copernicus Data Space Ecosystem |
| Chl-a | Chlorophyll-a |
| C2RCC | Case-2 Regional Coast Color (algorithm) |
| C2X | Alternative version of the C2RCC atmospheric correction algorithm |
| C2X-COMPLEX (or C2X-C) | The complex version of the C2X atmospheric correction algorithm |
| ESA | European Space Agency |
| IDEPIX | (Tool for pixel-based quality flagging in Sentinel-2 imagery) |
| IPMA | Instituto Português do Mar e da Atmosfera |
| LABELEC | LABELEC–Estudos, Desenvolvimento e Actividades Laboratoriais (associated with EDP Labelec) |
| MSI | Multispectral Instrument |
| NDI | Normalized Difference Index |
| OLCI | Ocean and Land Color Instrument |
| RMSE | Root Mean Square Error |
| SB | Single Band |
| SNAP | Sentinel Application Platform |
| SR | Simple Ratio |
| SDD | Secchi Disk Depth |
| TSS | Total Suspended Solids |
| UTM | Universal Transverse Mercator |
| WFD | Water Framework Directive |
| WGS84 | World Geodetic System 1984 |
| Kd_Z90max | The depth at which 90% of light is attenuated |
References
- Rodrigues, G.; Potes, M.; Costa, M.J.; Novais, M.H.; Marcha, A.; Salgado, R.; Morais, M. Temporal and Spatial Variations of Secchi Depth and Diffuse Attenuation Coefficient from Sentinel-2 MSI over a Large Reservoir. Remote Sens. 2020, 12, 768. [Google Scholar] [CrossRef] [Scilit]
- Rocha, J.; Carvalho-Santos, C.; Diogo, P.; Beça, P.; Keizer, J.J.; Nunes, J.P. Impacts of climate change on reservoir water availability, quality and irrigation needs in a water scarce Mediterranean region (Southern Portugal). Sci. Total Environ. 2020, 736, 139477. [Google Scholar] [CrossRef] [Scilit]
- Kachroud, M.; Trolard, F.; Kefi, M.; Jebari, S.; Bourrié, G. Water Quality Indices: Challenges and Application Limits in the Literature. Water 2019, 11, 361. [Google Scholar] [CrossRef] [Scilit]
- Chawla, I.; Karthikeyan, L.; Mishra, A.K. A review of remote sensing applications for water security: Quantity, quality, and extremes. J. Hydrol. 2020, 585, 124826. [Google Scholar] [CrossRef] [Scilit]
- Llodrà-Llabrés, J.; Martínez-López, J.; Postma, T.; Pérez-Martínez, C.; Alcaraz-Segura, D. Retrieving water chlorophyll-a concentration in inland waters from Sentinel-2 imagery: Review of operability, performance and ways forward. Int. J. Appl. Earth Obs. Geoinf. 2023, 125, 103605. [Google Scholar] [CrossRef] [Scilit]
- Potes, M.; Costa, M.J.; da Silva, J.C.B.; Silva, A.M.; Morais, M. Remote sensing of water quality parameters over Alqueva Reservoir in the south of Portugal. Int. J. Remote Sens. 2011, 32, 3373–3388. [Google Scholar] [CrossRef] [Scilit]
- Potes, M.; Costa, M.J.; Salgado, R. Satellite remote sensing of water turbidity in Alqueva reservoir and implications on lake modelling. Hydrol. Earth Syst. Sci. 2012, 16, 1623–1633. [Google Scholar] [CrossRef] [Scilit]
- Teodoro, A.; Rios, S.; Ferreira, D. Land use/land cover changes and flooding surface estimation in Alqueva (Portugal) using 18 years of Landsat data. In Earth Resources and Environmental Remote Sensing/GIS Applications II; SPIE: Bellingham, WA, USA, 2011; Volume 8181, pp. 250–261. [Google Scholar]
- Yang, H.; Kong, J.; Hu, H.; Du, Y.; Gao, M.; Chen, F. A review of remote sensing for water quality retrieval: Progress and challenges. Remote Sens. 2022, 14, 1770. [Google Scholar] [CrossRef] [Scilit]
- Bangira, T.; Matongera, T.N.; Mabhaudhi, T.; Mutanga, O. Remote sensing-based water quality monitoring in African reservoirs, potential and limitations of sensors and algorithms: A systematic review. Phys. Chem. Earth Parts A/B/C 2024, 134, 103536. [Google Scholar] [CrossRef] [Scilit]
- Neves, V.H.; Pace, G.; Delegido, J.; Antunes, S.C. Chlorophyll and Suspended Solids Estimation in Portuguese Reservoirs (Aguieira and Alqueva) from Sentinel-2 Imagery. Water 2021, 13, 2479. [Google Scholar] [CrossRef] [Scilit]
- Potes, M.; Rodrigues, G.; Penha, A.M.; Novais, M.H.; Costa, M.J.; Salgado, R.; Morais, M.M. Use of Sentinel 2—MSI for water quality monitoring at Alqueva reservoir, Portugal. Proc. Int. Assoc. Hydrol. Sci. 2018, 380, 73–79. [Google Scholar] [CrossRef] [Scilit]
- Rodrigues, G.; Potes, M.; Penha, A.M.; Costa, M.J.; Morais, M.M. The Use of Sentinel-3/OLCI for Monitoring the Water Qual-ity and Optical Water Types in the Largest Portuguese Reservoir. Remote. Sens. 2022, 14, 2172. [Google Scholar] [CrossRef] [Scilit]
- Gitelson, A.A.; Dall’Olmo, G.; Moses, W.; Rundquist, D.C.; Barrow, T.; Fisher, T.R.; Gurlin, D.; Holz, J. A simple semi-analytical model for remote estimation of chlorophyll-a in turbid waters: Validation. Remote Sens. Environ. 2008, 112, 3582–3593. [Google Scholar] [CrossRef] [Scilit]
- Mondal, I.; Jha, I.; Hossain, S.A.; De, A.; Altuwaijri, H.A.; Jose, F.; De, T.K.; Lu, Q.O.; Minh, N.N. Variability of bio-optical properties of Sundarbans mangrove estuarine ecosystem using elemental analysis, Sentinel-3 OLCI imageries and Neural Network models. Adv. Space Res. 2025, 75, 2028–2047. [Google Scholar] [CrossRef] [Scilit]
- Karmakar, J.; Mondal, I.; Hossain, S.A.; Jose, F.; Pichuka, S.; Ghosh, D.; De, T.K.; Lu, Q.O.; Elkhrachy, I.; Nguyen, N.M. Analyzing spatio-temporal variability of aquatic productive components in Northern Bay of Bengal using advanced machine learning models. Ocean. Coast. Manag. 2024, 251, 107074. [Google Scholar] [CrossRef] [Scilit]
- Tomaz, A.; Palma, P.; Fialho, S.; Lima, A.; Alvarenga, P.; Potes, M.; Salgado, R. Spatial and temporal dynamics of irrigation water quality under drought conditions in a large reservoir in Southern Portugal. Environ. Monit. Assess. 2020, 192, 93. [Google Scholar] [CrossRef] [Scilit]
- NP 4327/1996; Qualidade da Água: Doseamento da Clorofila a e dos Feopigmentos por Espectrofotometria de Absorção Molecular. Instituto Português da Qualidade: Monte de Caparica, Portugal, 1997.
- ISO 10260:1992; Water Quality: Measurement of Biochemical Parameters: Spectrometric Determination of the Chlorophyll-a Concentration. International Organization for Standardization: Geneva, Switzerland, 1992.
- Lorenzen, C.J. Determination of chlorophyll and pheo-pigments: Spectrophotometric equations. Limnol. Oceanogr. 1967, 12, 343–346. [Google Scholar] [CrossRef] [Scilit]
- Lehmann, M.K.; Schütt, E.M.; Hieronymi, M.; Dare, J.; Krasemann, H. Analysis of recurring patchiness in satellite-derived chlorophyll a to aid the selection of representative sites for lake water quality monitoring. Int. J. Appl. Earth Obs. Geoinf. 2021, 104, 102547. [Google Scholar] [CrossRef] [Scilit]
- ESA (European Space Agency). Copernicus Data Space Ecosystem Browser. 2025. Available online: https://browser.dataspace.copernicus.eu (accessed on 10 June 2025).
- Schröder, T.; Schmidt, S.I.; Kutzner, R.D.; Bernert, H.; Stelzer, K.; Friese, K.; Rinke, K. Exploring spatial aggregations and temporal windows for water quality match-up analysis using Sentinel-2 MSI and Sentinel-3 OLCI data. Remote Sens. 2024, 16, 2798. [Google Scholar] [CrossRef] [Scilit]
- Drusch, M.; Del Bello, U.; Carlier, S.; Colin, O.; Fernandez, V.; Gascon, F.; Hoersch, B.; Isola, C.; Laberinti, P.; Martimort, P.; et al. Sentinel-2: ESA’s optical high-resolution mission for GMES operational services. Remote Sens. Environ. 2012, 120, 25–36. [Google Scholar] [CrossRef] [Scilit]
- Soriano-González, J.; Urrego, E.P.; Sòria-Perpinyà, X.; Angelats, E.; Alcaraz, C.; Delegido, J.; Ruíz-Verdú, A.; Tenjo, C.; Vicente, E.; Moreno, J. Towards the combination of C2RCC processors for improving water quality retrieval in inland and coastal areas. Remote Sens. 2022, 14, 1124. [Google Scholar] [CrossRef] [Scilit]
- Ayala-Izurieta, J.E.; Beltrán Dávalos, A.A.; Jara Santillán, C.A.; Godoy Ponce, S.C.; Van Wittenberghe, S.; Verrelst, J.; Delegido, J. Spatial and Temporal Analysis of Water Quality in High Andean Lakes with Sentinel-2 Satellite Automatic Water Products. Sensors 2023, 23, 8774. [Google Scholar] [CrossRef] [Scilit]
- Binet, R.; Bergsma, E.; Poulain, V. Accurate Sentinel-2 inter-band time delays. ISPRS Ann. Photogramm. Remote Sens. Spat. Inf. Sci. 2022, 1, 57–64. [Google Scholar] [CrossRef] [Scilit]
- Rivera, J.P.; Verrelst, J.; Delegido, J.; Veroustraete, F.; Moreno, J. On the Semi-Automatic Retrieval of Biophysical Parameters Based on Spectral Index Optimization. Remote Sens. 2014, 6, 4927–4951. [Google Scholar] [CrossRef] [Scilit]
- Shi, X.; Gu, L.; Jiang, T.; Zheng, X.; Dong, W.-F.; Tao, Z. Retrieval of Chlorophyll-a Concentrations Using Sentinel-2 MSI Imagery in Lake Chagan Based on Assessments with Machine Learning Models. Remote Sens. 2022, 14, 4924. [Google Scholar] [CrossRef] [Scilit]
- IPMA—Instituto Português do Mar e da Atmosfera. Boletim Sazonal—Verão 2022; IPMA: Lisbon, Portugal, 2022. [Google Scholar]
- IPMA—Instituto Português do Mar e da Atmosfera. Boletim Climatológico Sazonal—Inverno 2018/2019; IPMA: Lisbon, Portugal, 2019. [Google Scholar]
- Politi, E.; Brito, A.C.; Lebreton, C.; Falcini, F. Listening to stakeholders: Development of water quality indicators for transitional environments using satellite data. Ocean. Coast. Manag. 2024, 253, 107140. [Google Scholar] [CrossRef] [Scilit]
- Pereira-Sandoval, M.; Urrego, P.; Ruíz-Verdú, A.; Tenjo, C.; Delegido, J.; Sòria-Perpinyà, X.; Vicente, E.; Soria, J.; Moreno, J. Calibration and validation of algorithms for the estimation of chlorophyll-a concentrations and Secchi depth in inland waters with Sentinel-2. Limnetica 2019, 38, 471–487. [Google Scholar] [CrossRef] [Scilit]
- Mosley, L.M. Drought impacts on the water quality of freshwater systems; Review and integration. Earth-Sci. Rev. 2015, 140, 203–214. [Google Scholar] [CrossRef] [Scilit]
- Zhang, Y.; Li, M.; Dong, J.; Yang, H.; Van Zwieten, L.; Lu, H.; Alshameri, A.; Zhan, Z.; Chen, X.; Jiang, X. A critical review of methods for analyzing freshwater eutrophication. Water 2021, 13, 225. [Google Scholar] [CrossRef] [Scilit]
- León-Palmero, E.; Reche, I.; Morales-Baquero, R. Atenuación de luz en embalses del sur-este de la Península Ibérica. Ing. Agua 2019, 23, 65–75. [Google Scholar] [CrossRef] [Scilit]
- Doña, C.; Caselles, V.; Sánchez, J.M.; Ferri, A.; Camacho, A. Herramienta para el estudio del estado de eutrofización de masas de agua continentales. Rev. Teledetec. 2011, 36, 40–50. [Google Scholar]
- Sharaf, N.; Bresciani, M.; Giardino, C.; Faour, G.; Slim, K.; Fadel, A. Using Landsat and in situ data to map turbidity as a proxy of cyanobacteria in a hypereutrophic Mediterranean reservoir. Ecol. Inform. 2019, 50, 197–206. [Google Scholar] [CrossRef] [Scilit]
- Warren, M.A.; Simis, S.G.H.; Martinez-Vicente, V.; Poser, K.; Bresciani, M.; Alikas, K.; Spyrakos, E.; Giardino, C.; Ansper, A. Assessment of atmospheric correction algorithms for the Sentinel-2A MultiSpectral Imager over coastal and inland waters. Remote Sens. Environ. 2019, 225, 267–289. [Google Scholar] [CrossRef] [Scilit]
- Scarpetta, M.; Spadavecchia, M.; Affuso, P.; D’Alessandro, V.I.; Giaquinto, N. Use of the SNOWED Dataset for Sentinel-2 Remote Sensing of Water Bodies: The Case of the Po River. Sensors 2024, 24, 5827. [Google Scholar] [CrossRef] [Scilit] [PubMed]
- Atasever, Ü.; Abbas, H.H. Drought Monitoring in Burdur Lake Using Sentinel-2 Images. Niğde Ömer Halisdemir Üniv. Mühendis. Bilim. Derg. 2024, 13, 882–891. [Google Scholar] [CrossRef] [Scilit]
- Liu, T.; Guo, Z.; Li, X.; Xiao, T.; Liu, J.; Zhang, Y. Monitoring Water Quality Parameters Using Sentinel-2 Data: A Case Study in the Weihe River Basin (China). Sustainability 2024, 16, 6881. [Google Scholar] [CrossRef] [Scilit]
- Zittis, G.; Bruggeman, A.; Lelieveld, J. Revisiting future extreme precipitation trends in the Mediterranean. Weather. Clim. Extrem. 2021, 34, 100380. [Google Scholar] [CrossRef] [Scilit]
- Wang, Q.; Zhu, L.; Wang, D.; Li, D.; Liu, W.; Si, Y.; Zhu, L.; Li, J.; Duan, H.; Shen, M. Assessment of Atmospheric Correction Algorithms for Correcting Sunglint Effects in Sentinel-2 MSI Imagery: A Case Study in Clean Lakes. Remote Sens. 2024, 16, 3060. [Google Scholar] [CrossRef] [Scilit]
- Vanhellmont, Q.; Ruddick, K. Acolite for Sentinel-2: Aquatic Applications of MSI Imagery. ESA Spec. Publ. 2016, 740, 55. [Google Scholar]
- Katsoulis-Dimitriou, S.; Lefkaditis, M.; Barmpagiannakos, S.; Kormas KAr Kyparissis, A. Comparison of iCOR and Rayleigh atmospheric correction methods on Sentinel-3 OLCI images for a shallow eutrophic reservoir. PeerJ 2022, 10, e14311. [Google Scholar] [CrossRef] [Scilit]
- Matthews, M.W. A current review of empirical procedures of remote sensing in inland and near-coastal transitional waters. Int. J. Remote Sens. 2011, 32, 6855–6899. [Google Scholar] [CrossRef] [Scilit]

Disclaimer/Publisher’s Note: The statements, opinions and data contained in all publications are solely those of the individual author(s) and contributor(s) and not of MDPI and/or the editor(s). MDPI and/or the editor(s) disclaim responsibility for any injury to people or property resulting from any ideas, methods, instructions or products referred to in the content. |
© 2026 by the authors. Licensee MDPI, Basel, Switzerland. This article is an open access article distributed under the terms and conditions of the Creative Commons Attribution (CC BY) license.