1. Introduction
Land subsidence is mainly induced by human activities; in particular, the compression of aquifer systems caused by long-term groundwater overexploitation is the fundamental cause of severe land subsidence and ground fissure disasters in numerous basins across China, such as the Beijing Plain, the North China Plain, and the Linfen–Yuncheng Basin [
1,
2,
3]. Geological structures, fault activity, urbanization processes, and underground engineering have further exacerbated the subsidence trend. Within geological strata, aquitards are the most active zones for subsidence due to their slow drainage capacity and strong compressibility. The subsidence process is also accompanied by significant three-dimensional crustal deformation [
4], with vertical movement dominating and horizontal movement being non-negligible, especially in areas with active ground fissures [
5,
6]. The hazards caused by land subsidence are extensive and far-reaching: it not only causes building damage, uneven settlement of roads and bridges, breakage of underground pipelines, and triggers ground cracks, but also may alter regional drainage patterns, increase the risk of floods and other disasters, and threaten the safety of infrastructure such as high-speed railway lines [
7,
8,
9]. In regions like Xi’an and Taiyuan, engineering structure designs (e.g., high-speed railway subgrade types) even need to be adjusted in response to subsidence, to avoid major engineering accidents caused by uneven foundation settlement [
3,
5,
10].
Synthetic Aperture Radar Interferometry (InSAR) technology, as an efficient and accurate ground deformation monitoring method, has been widely applied in land subsidence research in recent years [
11,
12]. Compared with traditional leveling or GPS monitoring methods, InSAR possesses significant advantages, including non-contact measurement, large-scale coverage, all-weather operation, and millimeter-level accuracy. It can acquire continuous and high-density deformation information without relying on ground points [
1,
12,
13]. Multi-temporal InSAR technologies (e.g., PS–InSAR, SBAS–InSAR) can effectively suppress the impacts of atmospheric disturbances and orbital errors, generate subsidence time series, and reconstruct long-term, gradual ground subsidence processes [
4,
14,
15]. By integrating ascending and descending data, InSAR can also invert vertical and horizontal two-dimensional deformations, providing a scientific basis for subsidence mechanism analysis, ground fissure identification, and disaster risk assessment [
11,
16,
17].
For long-term series data, such as rainfall and water level data, seasonal fluctuations, long-term trend changes, and a certain degree of random disturbance usually coexist simultaneously. To effectively identify and model these components, researchers have proposed and developed various time-series decomposition and analysis methods, such as SARIMA (Seasonal Autoregressive Integrated Moving Average Model) [
18], Grey Seasonal Model [
19], and Seasonal Trend Decomposition [
20,
21]. Among these time-series analysis methods, the seasonal trend decomposition technique has gained widespread attention due to its ability to reveal potential structural patterns in the sequence and provide clear and interpretable decomposition results. One of the most representative methods is Seasonal Trend Decomposition (STL) based on Local Weighted Regression (LOESS). This method adopts LOESS as a smoothing technique to decompose the original time series into three components: Trend, Seasonal, and Residual. Compared with traditional decomposition methods, STL not only boasts higher computational efficiency and strong robustness, but also can flexibly adapt to non-linear trends and time-varying seasonal characteristics. Thus, it has been widely applied in time-series prediction tasks by combining with regression models, neural networks, and other fitting methods.
This study focuses on the land subsidence issue in the Linfen–Yuncheng Basin, making full use of high-resolution SAR images with long time series to systematically explore the spatiotemporal evolution characteristics and driving mechanisms of subsidence. To address the limitations of single SAR data in fine-scale monitoring, this study integrates multi-source high-resolution data from C-band Sentinel-1A and Radarsat-2, enhancing the stability and accuracy of line-of-sight deformation monitoring. The research mainly includes four aspects: (i) constructing a high spatiotemporal resolution land subsidence monitoring dataset covering basin areas based on multiple types of SAR images, achieving full coverage and high-density observation of regional subsidence processes; (ii) combining Global Navigation Satellite System (GNSS) data to validate the accuracy of multi-source InSAR results and obtain a line-of-sight deformation field that is consistent and reliable at the basin scale; (iii) introducing the Seasonal Trend Decomposition method to separate and analyze the long-term trend term and periodic seasonal term in time-series deformation, revealing the long-term evolution characteristics and seasonal fluctuation rules of subsidence; (iv) conducting correlation analysis on the evolution of land subsidence based on the intensity of groundwater extraction and the distribution of fault structures, and explore the response mechanism and differential performance of subsidence in different regions to groundwater utilization and structural conditions. The research results can provide scientific support for groundwater resource management, fault structure activity research, and regional geological hazard prevention and control.
2. Study Area and Materials
2.1. Study Area
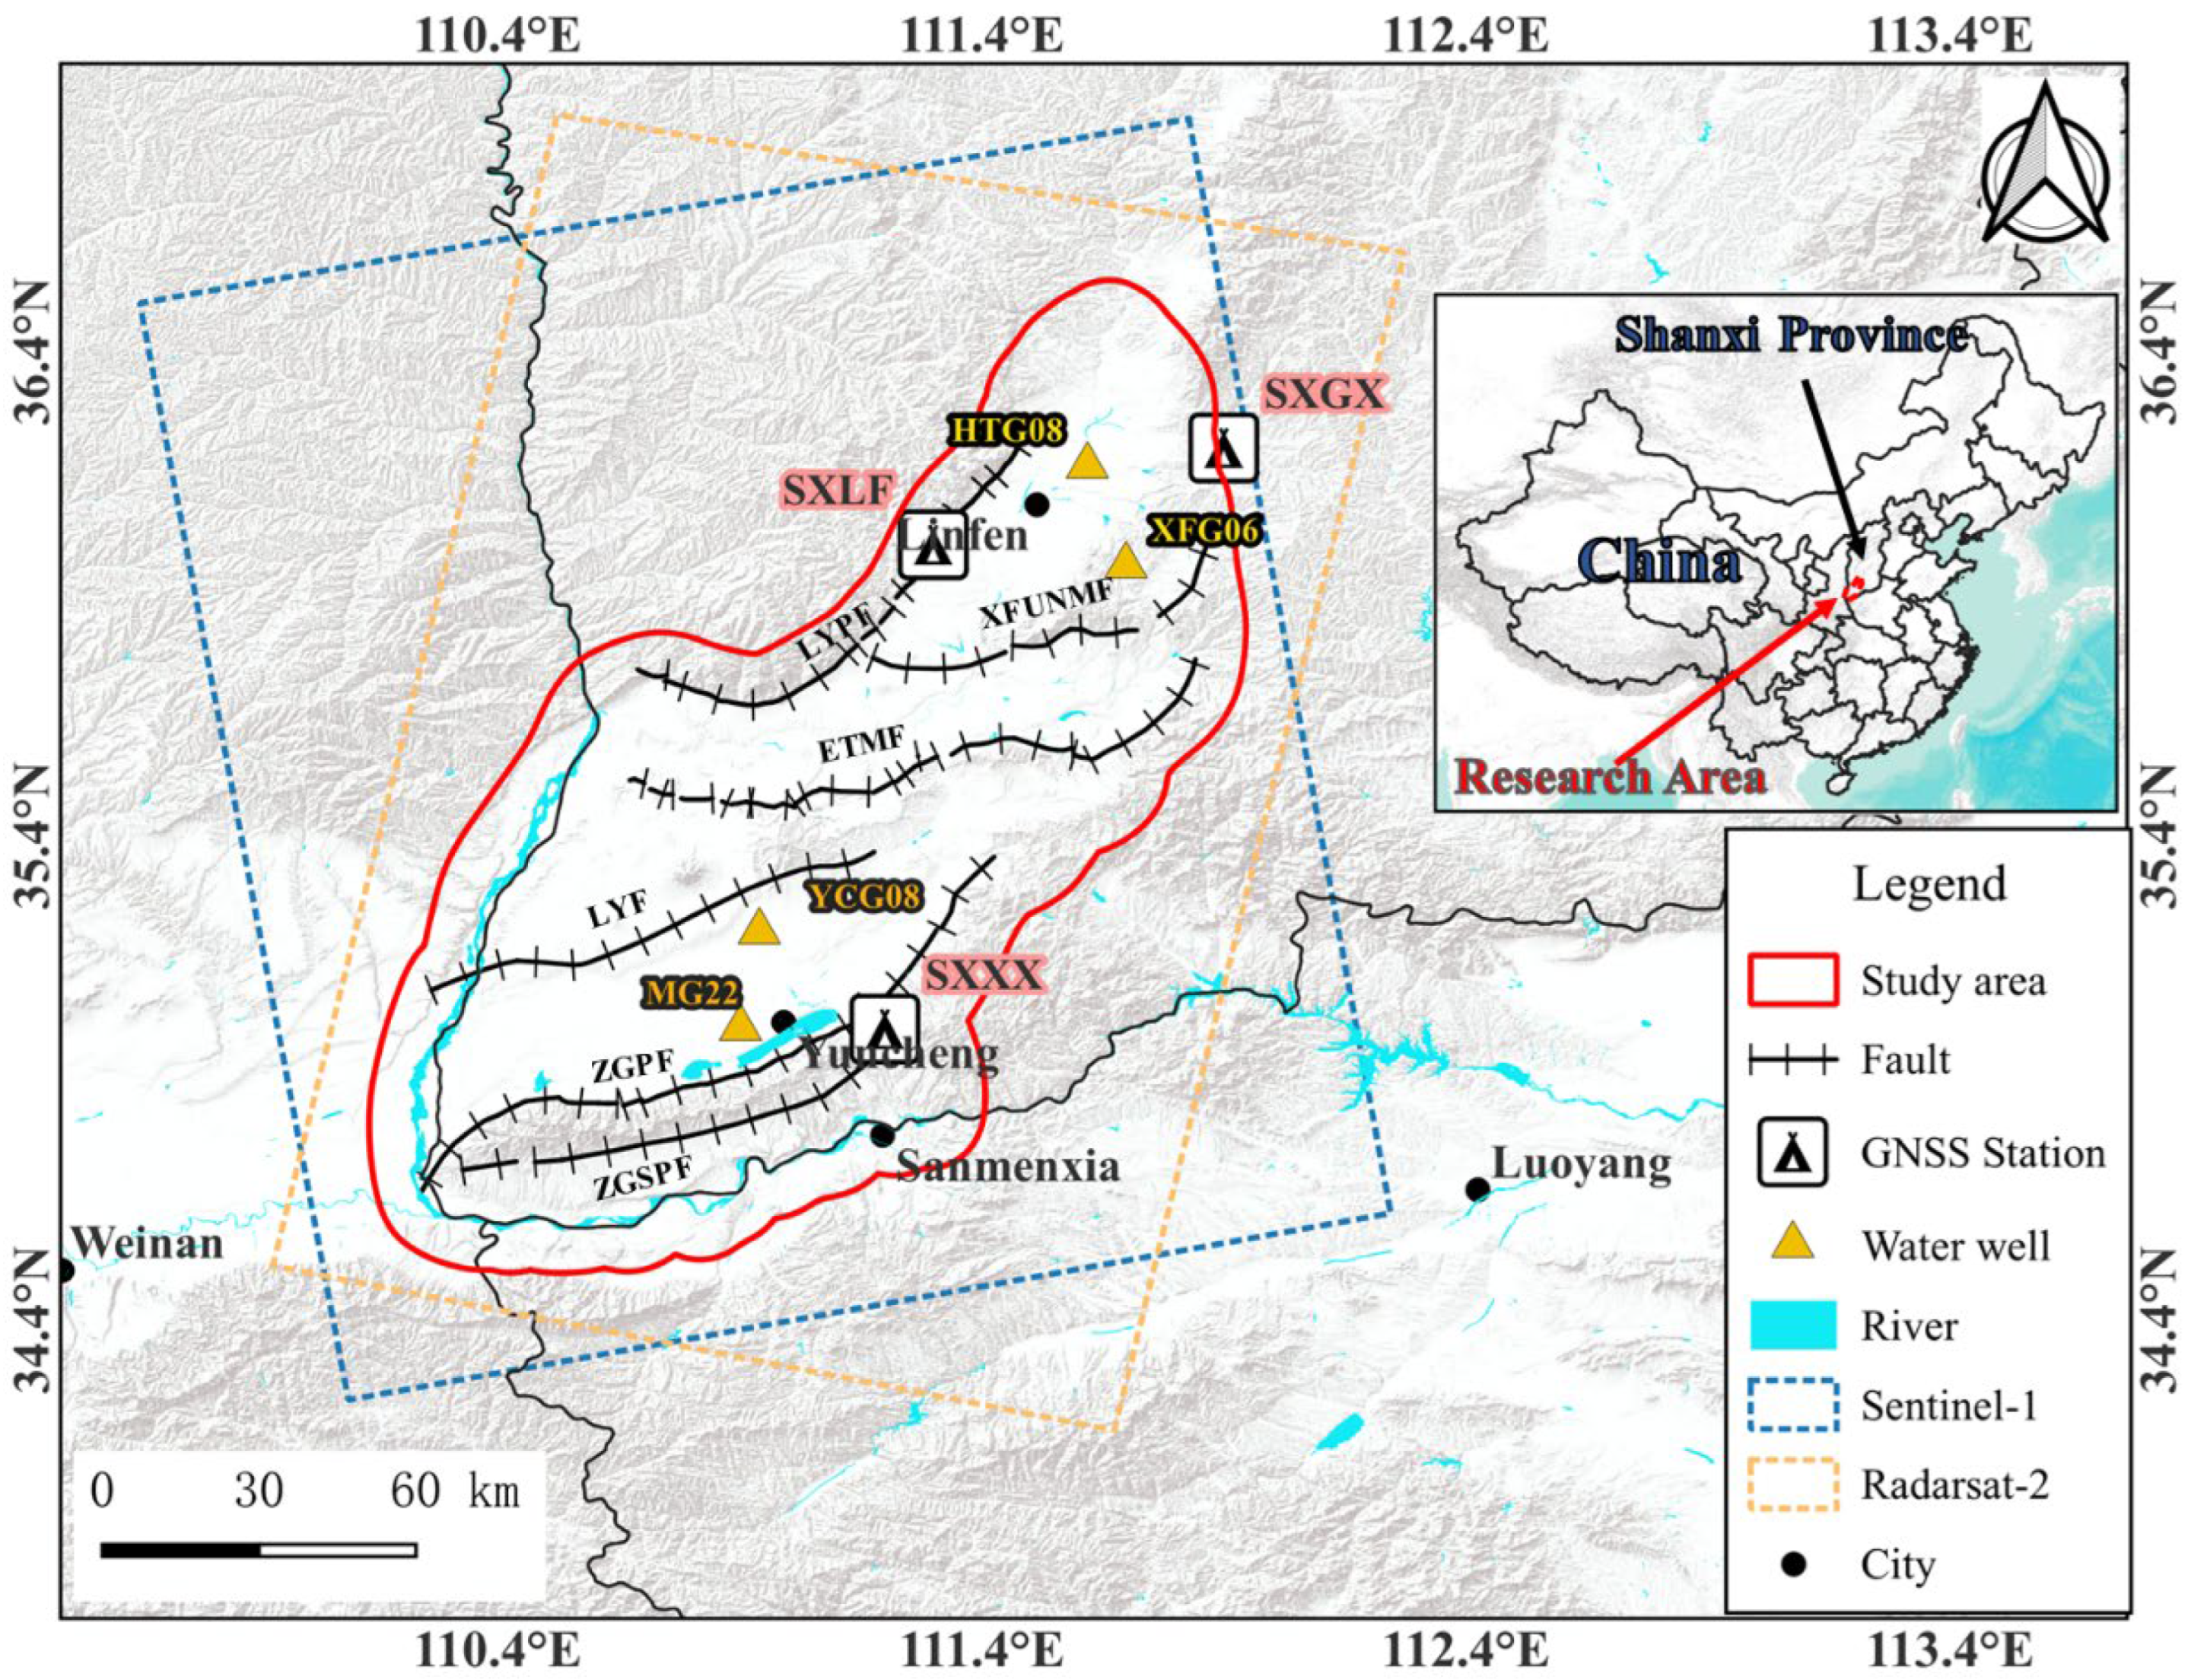
The Linfen–Yuncheng Basin is located in central China and belongs to the Shanxi graben system. It is an important component of the southern section of the Graben system, as shown in
Figure 1. The region is located at the intersection of the Ordos Block, the North China Block, and the South China Block, with frequent tectonic activity and earthquake occurrences. A large number of Cenozoic active faults are developed on the edge of the basin, such as the Jiaocheng Fault, Huoshan Fault, Zhongtiao Mountain Fault, and Luojian Mountain Front Fault, which constitute the main tectonic background of land subsidence and ground fissures [
3]. The Jiaocheng Fault, Huoshan Fault, Zhongtiao Mountain and Luojian Front Faults all developed in the extensional tectonic setting of the Fen-Wei Basin and are dominated by extensional normal faults. Of these, the Jiaocheng and Huoshan Faults are generally oblique-slip in nature, with superimposed normal and strike-slip components, whereas the Zhongtiao Mountain and Luojian Front Faults are most distinctly characterized by pure normal faulting. The edge of the basin is mainly surrounded by the Lvliang Mountains, Taihang Mountains, Zhongtiao Mountains, and Qinling Mountains, while the middle is filled with aeolian loess and lacustrine sediments. The Quaternary sedimentary layer is as thick as 600–1300 m. In recent years, due to the dual effects of tectonic stress and overexploitation of groundwater, large-scale land subsidence and the development of ground fissures have occurred in different sub-areas of the Linfen–Yuncheng Basin. The basin has a strong dependence on groundwater, and in recent years, the sharp increase in industrial and agricultural water consumption has led to a significant decline in groundwater levels. Typical areas such as Jiaocheng, Luojian Mountain Front, and Kouzhen have an average annual decline of 1–2.2 m, exacerbating uneven subsidence of strata and the expansion of ground fissures.
2.2. Data Source
In this study, SAR images from two C-band SAR satellites, Sentinel-1A and Radarsat-2, were selected to realize high-precision and long-term monitoring of ground deformation in the Linfen–Yuncheng Basin. Sentinel-1A adopts the Interferometric Wide-swath (IW) mode, with a spatial resolution of about 20 m and a monitoring period from 12 March 2017 to 15 June 2024, yielding a total of 86 images with ascending mode; Radarsat-2 data uses the Extra Fine (XF) mode, with a spatial resolution of 5 m and a coverage period from 21 January 2017 to 3 May 2025, yielding a total of 110 images with descending mode. The complementary use of two types of SAR data not only improves the spatial resolution and temporal density of deformation monitoring, but also provides solid data support for the subsequent decomposition of trend items and seasonal items, as well as the identification of mutation points in time-series analysis.
To improve the accuracy of InSAR deformation inversion and further explore the influencing factors of ground subsidence in detail, this study incorporates various auxiliary data for comprehensive analysis. The Digital Elevation Model (DEM) employs SRTM data [
22] for terrain phase removal and geometric correction in InSAR interferometric processing; GNSS continuous observation station data are used to verify the accuracy and stability of InSAR inversion results; meanwhile, groundwater level time-series data from multiple monitoring wells in the study area are collected to analyze the coupling relationship between ground subsidence and groundwater dynamics.
3. Methods
3.1. InSAR Data Processing Methods
The SAR data employed in this study encompasses two distinct SAR imaging modes: Radarsat-2 data was acquired via the traditional Stripmap mode, while Sentinel-1A data was obtained based on the TOPS (Terrain Observation by Progressive Scans) imaging mode. In contrast to the Stripmap mode, the azimuth-direction scanning of the antenna in the TOPS mode induces variations in the Doppler center frequency within a range of approximately 4.4–5.2 kHz, which imposes higher requirements on registration accuracy, requiring a resolution of approximately 1/1000 pixel to ensure the continuity of phase information [
7,
23]. Additionally, Sentinel-1A images exhibit small overlapping regions between bursts, and are prone to temporal decorrelation effects during long-term sequence registration, thereby elevating the risk of registration failure. To address these challenges, this study adopted a series of improved processing flow within the Sentinel-1A data processing workflow: (i) utilizing the traditional intensity cross-correlation method for coarse registration in the range direction; (ii) performing differential interferometric processing in the overlapping area of bursts; (iii) applying multi-looking to the interferometric results to reduce noise; (iv) introducing low-coherence pixel masks and adaptive filtering to enhance coherence; (v) conducting phase unwrapping and estimating the azimuth phase offset of the overlapping area; (vi) uniformly distributing the calculated offset across the entire overlapping area. Ultimately, based on the aforementioned registration and interferometric processing flow, a total of 485 pairs of interferometric images were generated, including 110 scenes of Radarsat-2 data and 86 scenes of Sentinel-1A data, which correspond to 254 RADARSAT-2 interferograms and 231 Sentinel-1A interferograms. This establishes a robust data foundation for time-series line-of-sight deformation analysis based on SBAS–InSAR results.
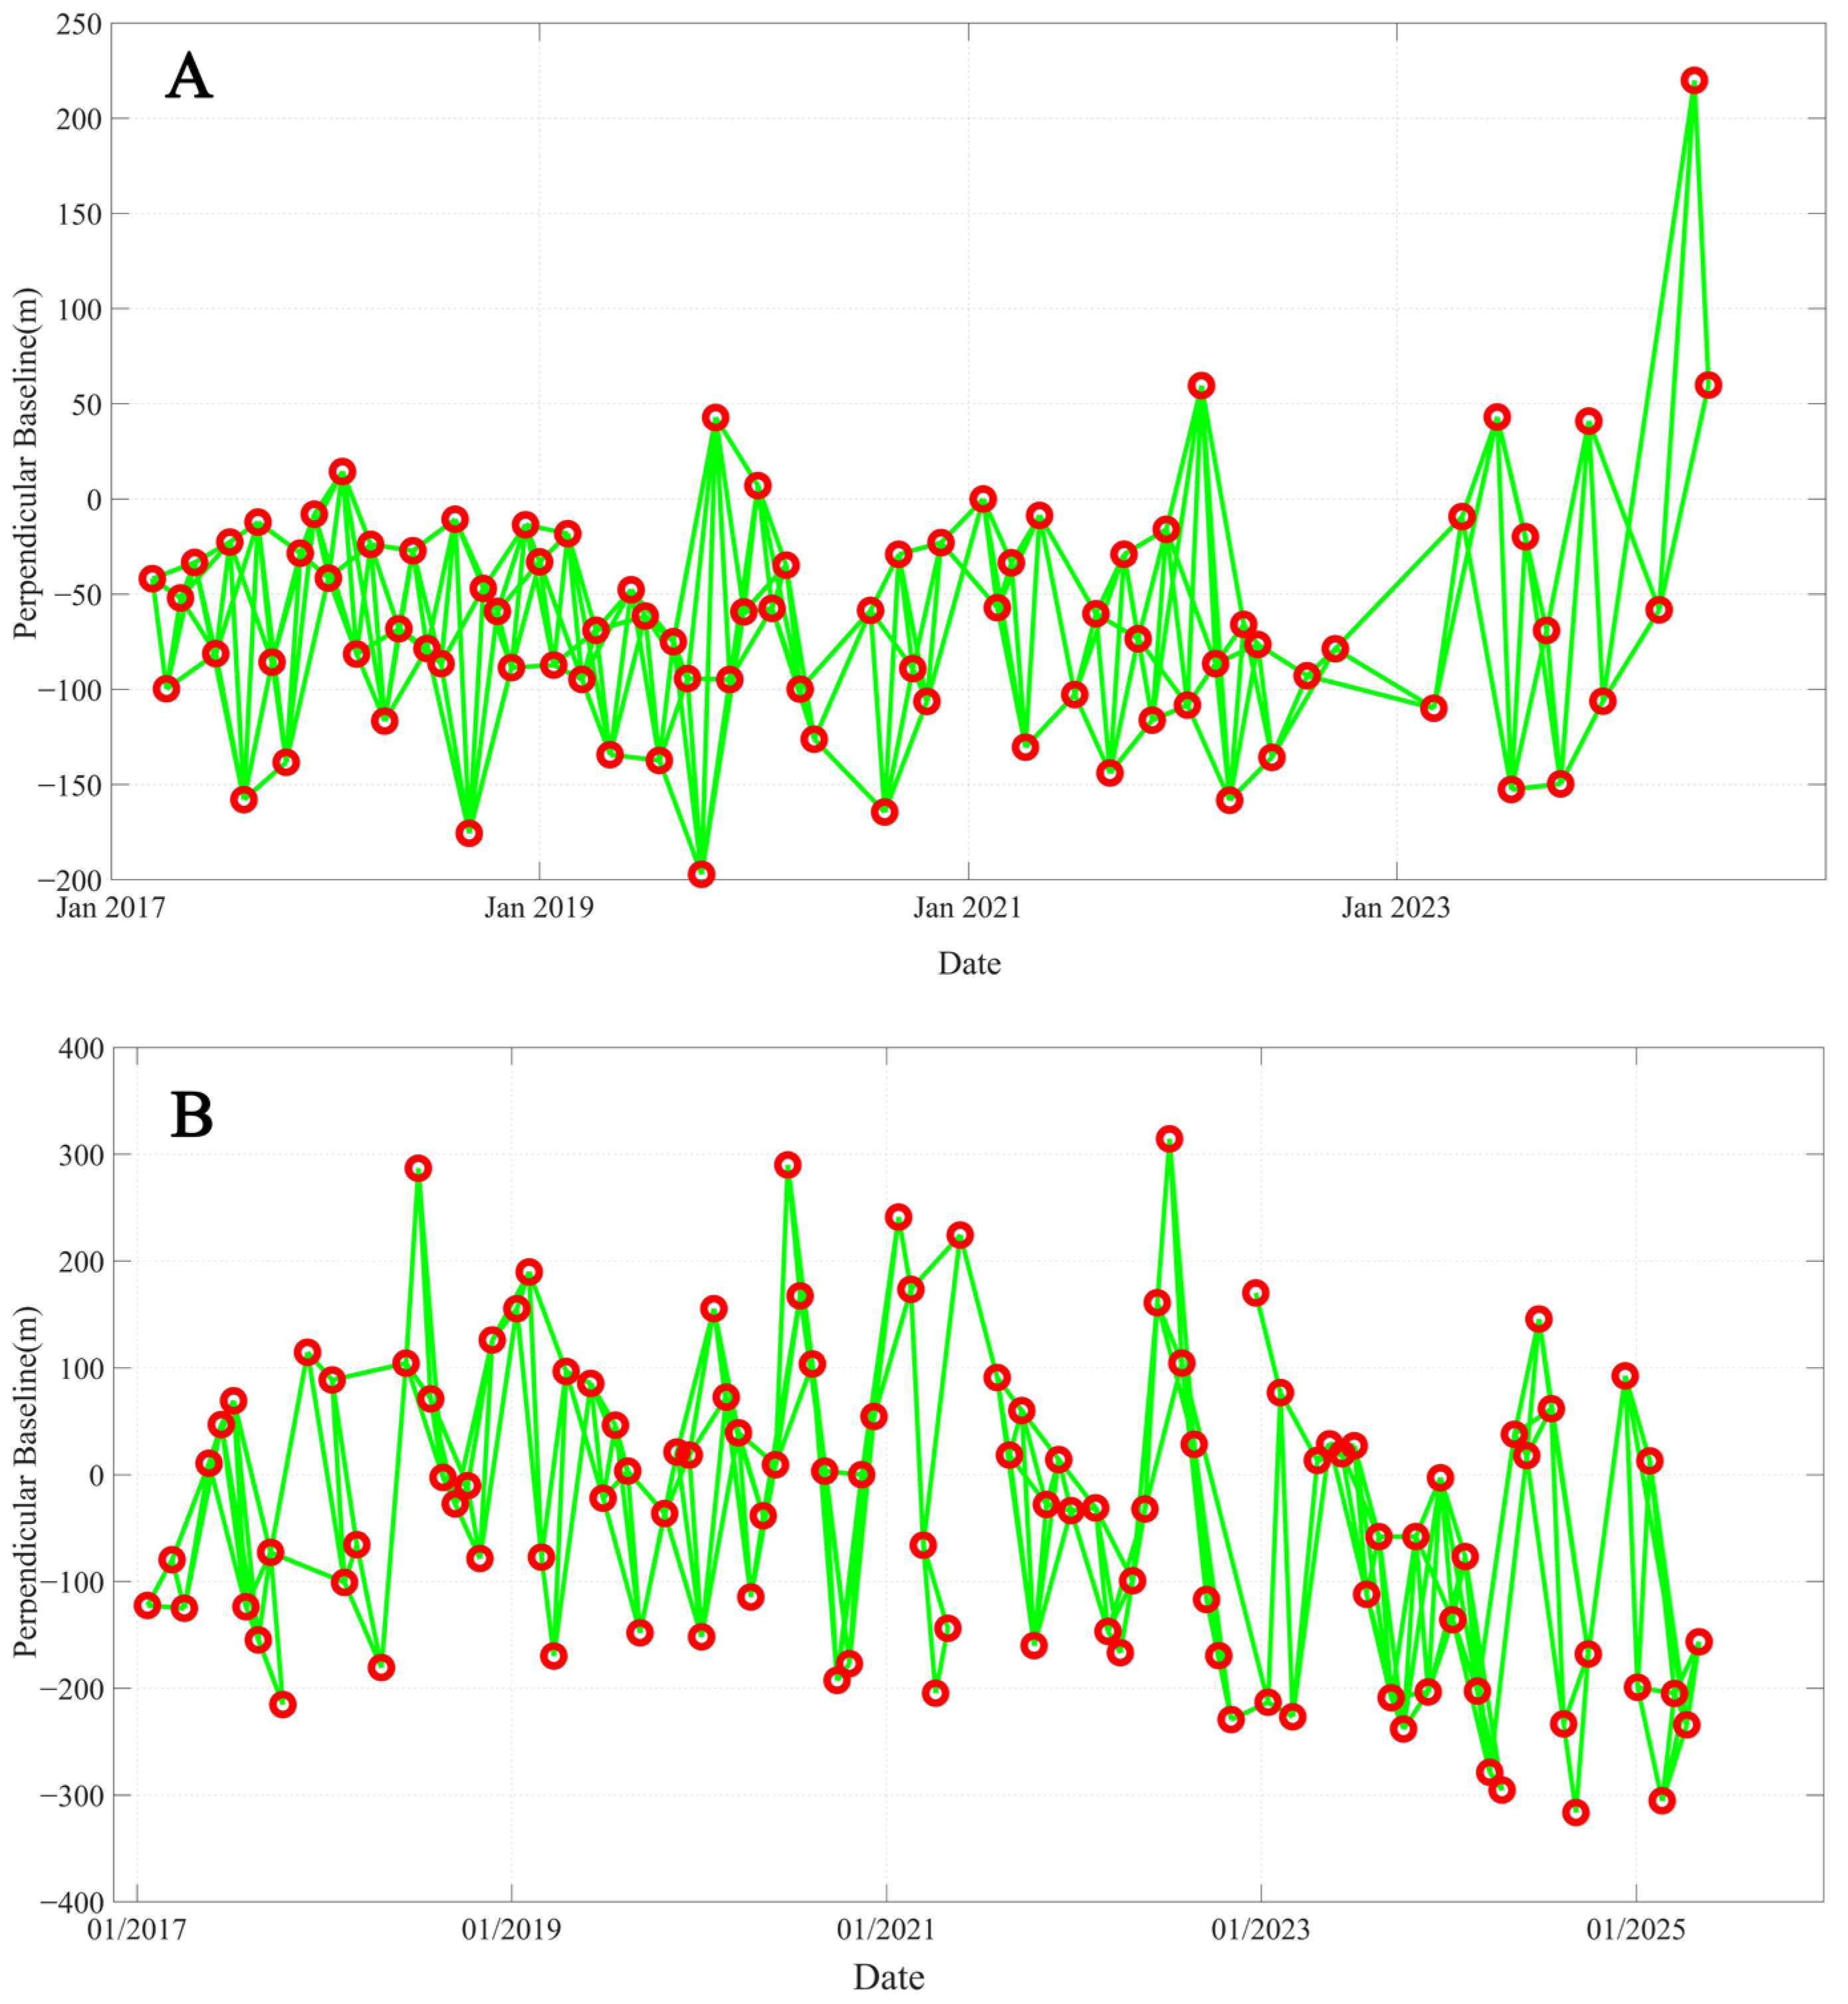
In the process of generating interferograms, the differences in spatial resolution, temporal resolution, and orbital positioning accuracy between Radarsat-2 and Sentinel-1A data were fully considered. A differentiated spatiotemporal baseline constraint processing flow was adopted to ensure the quality of the interferometric results, as shown in
Figure 2. Specifically, the spatial baseline constraint of RADARSAT-2 was set to less than 300 m and that of Sentinel-1A to less than 200 m, while the temporal baseline was controlled within 72 days for both types of data. To further improve the accuracy of registration and interferometry, this study incorporates Sentinel-1A precise orbit data for orbit correction, and employs SRTM-DEM to remove terrain phases from interferometric phases, effectively reducing the interference of orbit errors and terrain undulations on deformation inversion.
This study employs the small baseline subset (SBAS–InSAR) technique to invert and analyze time-series line-of-sight deformation. In the processing workflow, a combination of high-low pass filtering was adopted to correct for atmospheric delay error [
24,
25,
26,
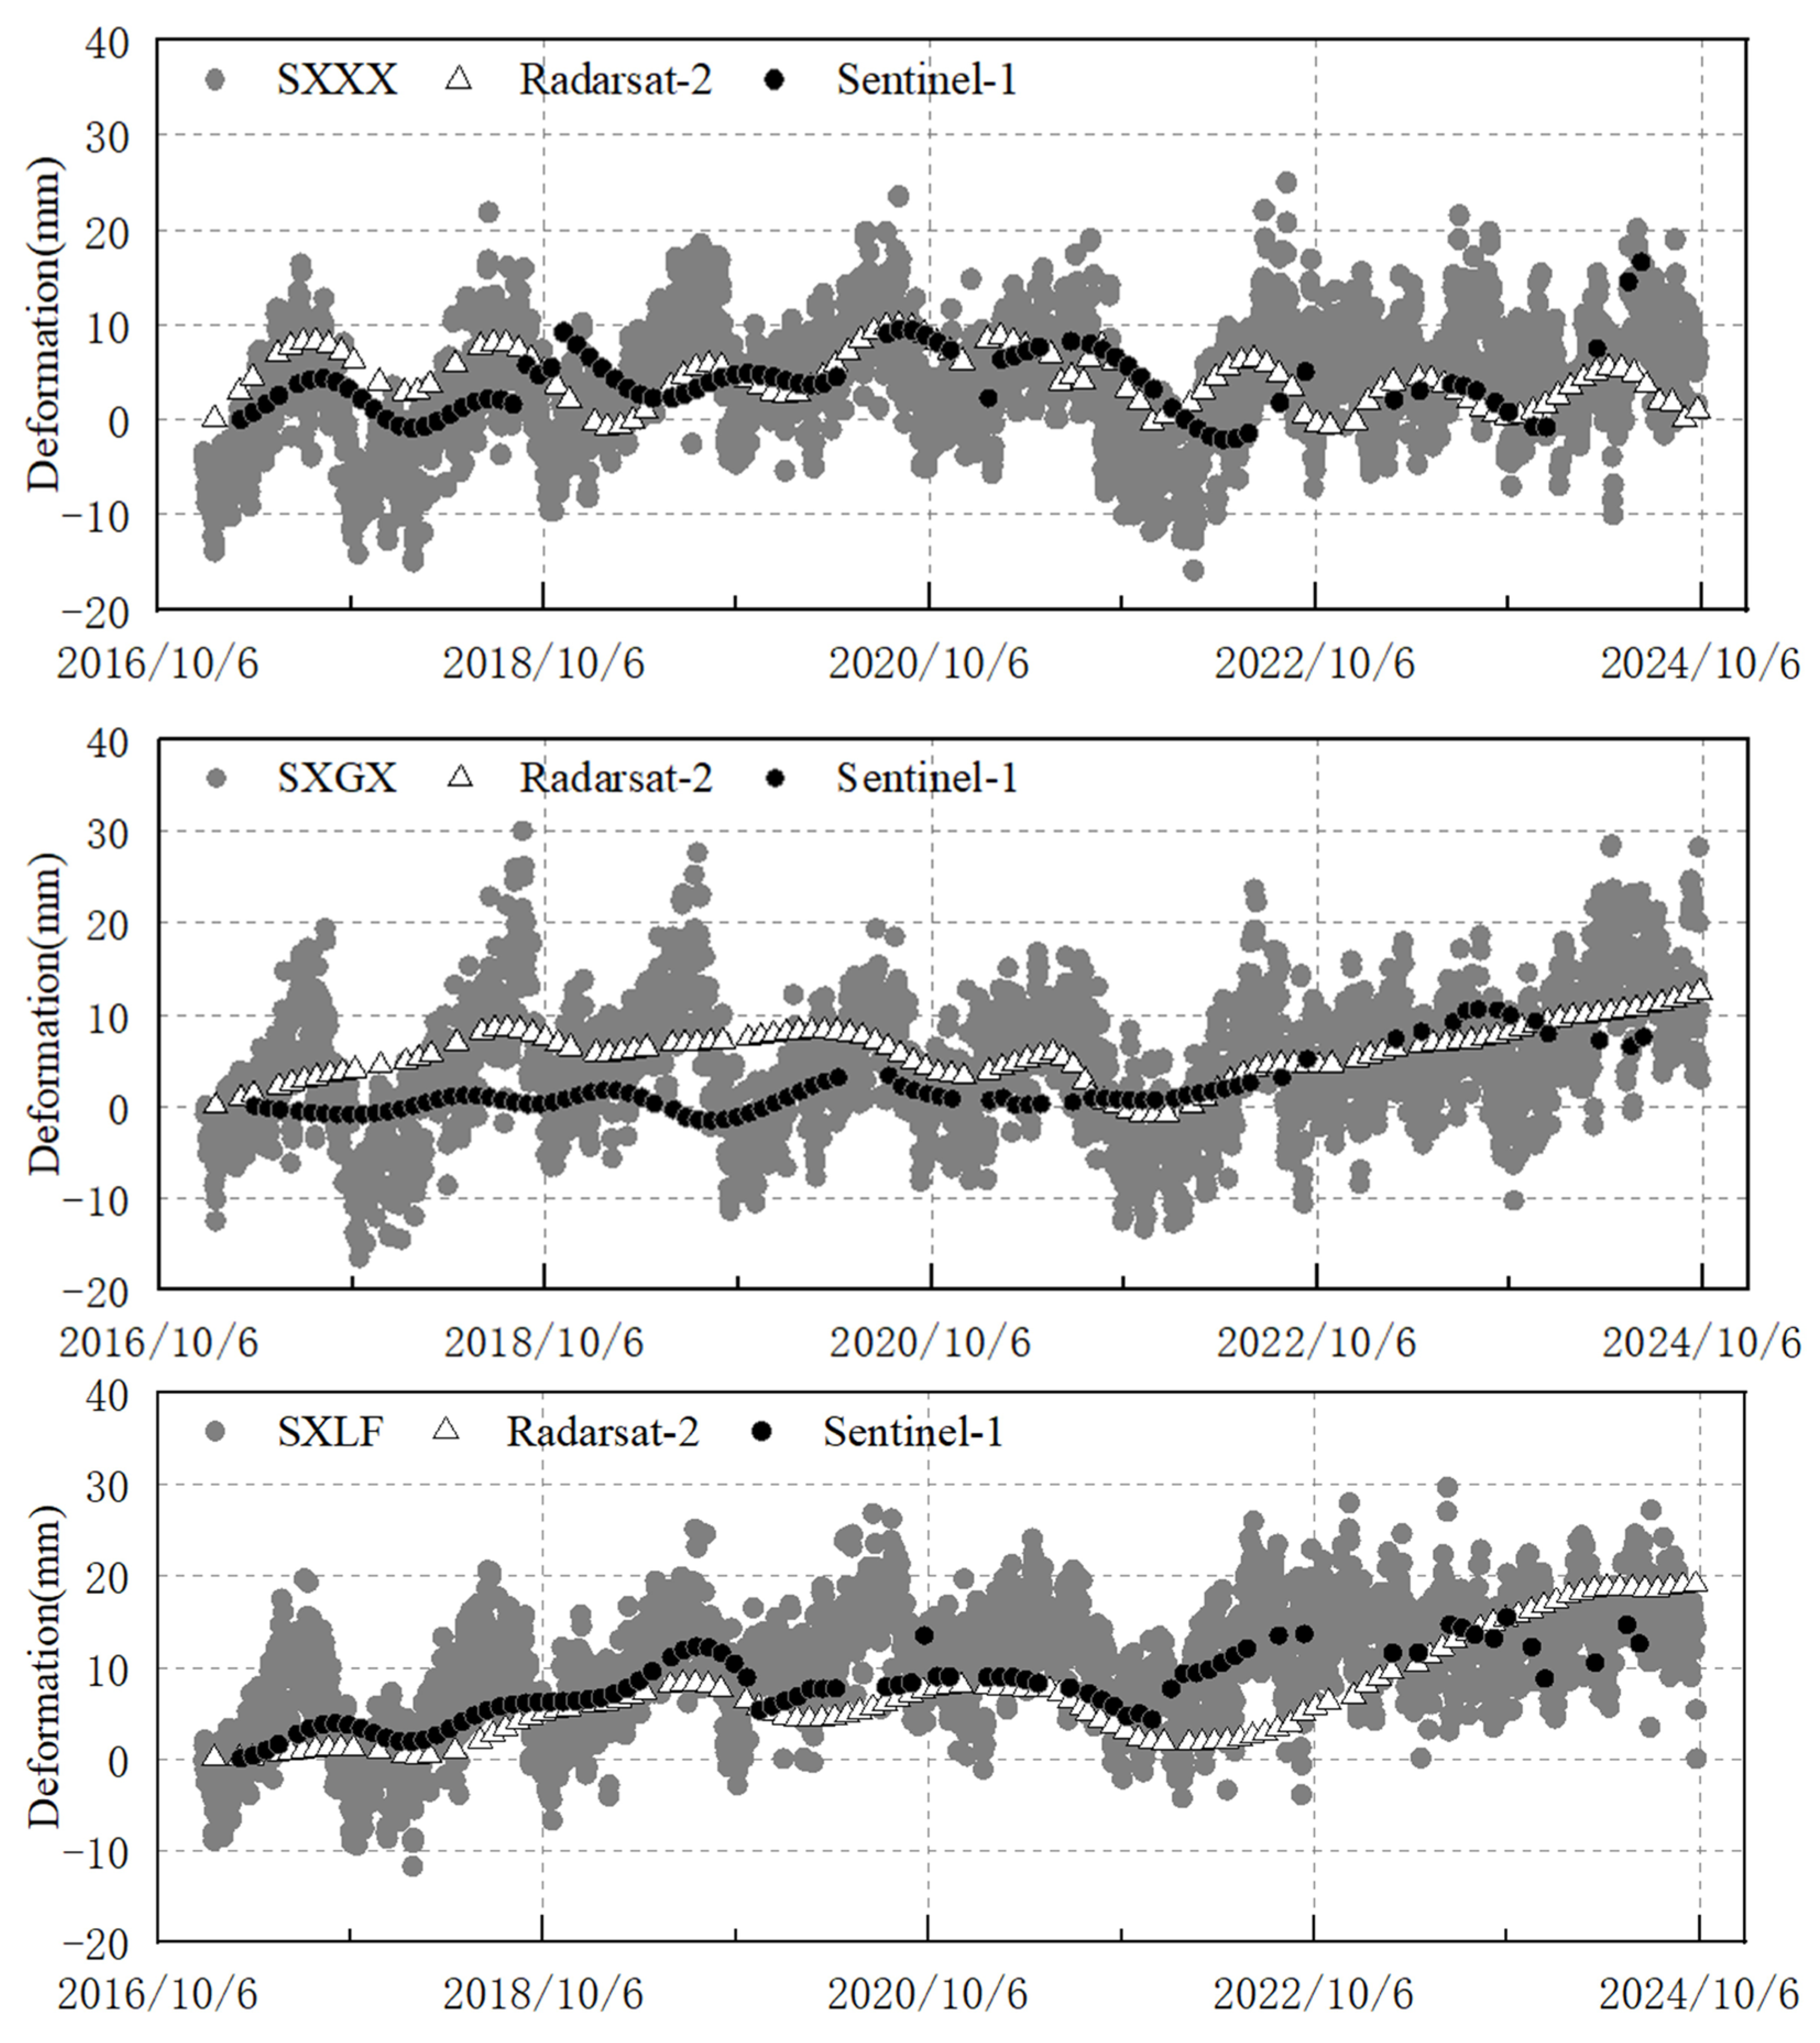
27]. By suppressing the atmospheric phase components characterized by strong spatial correlation but weak temporal correlation, the influence of atmospheric delay on the deformation results was extracted and eliminated. The selection of reference point is based on the average coherence coefficient distribution and existing geological background data, with priority given to regions featuring stable long-term coherence and no obvious deformation characteristics as a reference point. To verify the reliability of InSAR inversion results, GNSS observation data was further incorporated for comparative analysis. The GNSS data was sourced from the National Seismological Science Data Center of the China Earthquake Administration. The simultaneous observation results of three monitoring stations, SXXX, SXGX, and SXLF, within the study area were selected. The spatial distribution of the monitoring stations is depicted in
Figure 1.
3.2. Seasonal Trend Decomposition Based on LOESS
The STL model is a time-series decomposition method that utilizes robust locally weighted regression for smoothing [
28,
29,
30]. When estimating the value of a response variable, a subset of data from the neighborhood of its predictor variable is first selected. On this subset, weighted least squares is then employed to perform linear or quadratic regression, thereby reducing the weights of values distant from the estimation point. Finally, the value of the response variable can be estimated via a local regression model. Typically, the entire curve is fitted using this point-by-point calculation approach to achieve more accurate decomposition of the time series.
In time-series decomposition, LOESS can be used to separate the following three components:
Among them, is the observation value of the original time series over time t; the trend term represents the long-term trend of change; , the seasonal term, represents cyclical changes; the residual term refers to non-systematic components.
LOESS achieves trend estimation by performing locally weighted polynomial fitting within the neighborhood of each predicted point. For each time point
t, the LOESS fitting model is as follows:
Among them, is the fitting value in time t; is the collection of observation points that are close in t; is the local polynomial (usually linear or quadratic) used to fit observations within a neighborhood. For the weight function, a cubic weight function is usually used: , where d is the window bandwidth.
LOESS decomposition usually includes the following steps:
(1) Estimate trend term : Smooth the original sequence using LOESS;
(2) Estimate the seasonal term in the sequence after removing the trend term : perform LOESS smoothing on the same position points within each cycle;
(3) Residual term calculation: ;
(4) Iterative adjustment and can be used to improve decomposition accuracy.
During the STL decomposition of time-series data, the window lengths for the trend and seasonal components are determined based on the sampling interval of the time-series and the physical properties of the research object. Both the InSAR and groundwater time-series employed in this study are monthly-scale data with distinct annual periodic characteristics. For STL decomposition, the seasonal component window length is set to 12 (corresponding to the annual cycle), and the trend component window length is set to 25 to capture long-term variation features. The filtering bandwidth is implicitly controlled by the aforementioned window lengths, eliminating the need for additional strong smoothing constraints.
4. InSAR Monitoring Results and Spatiotemporal Line-of-Sight Deformation Characteristics
4.1. SAR Monitoring Results
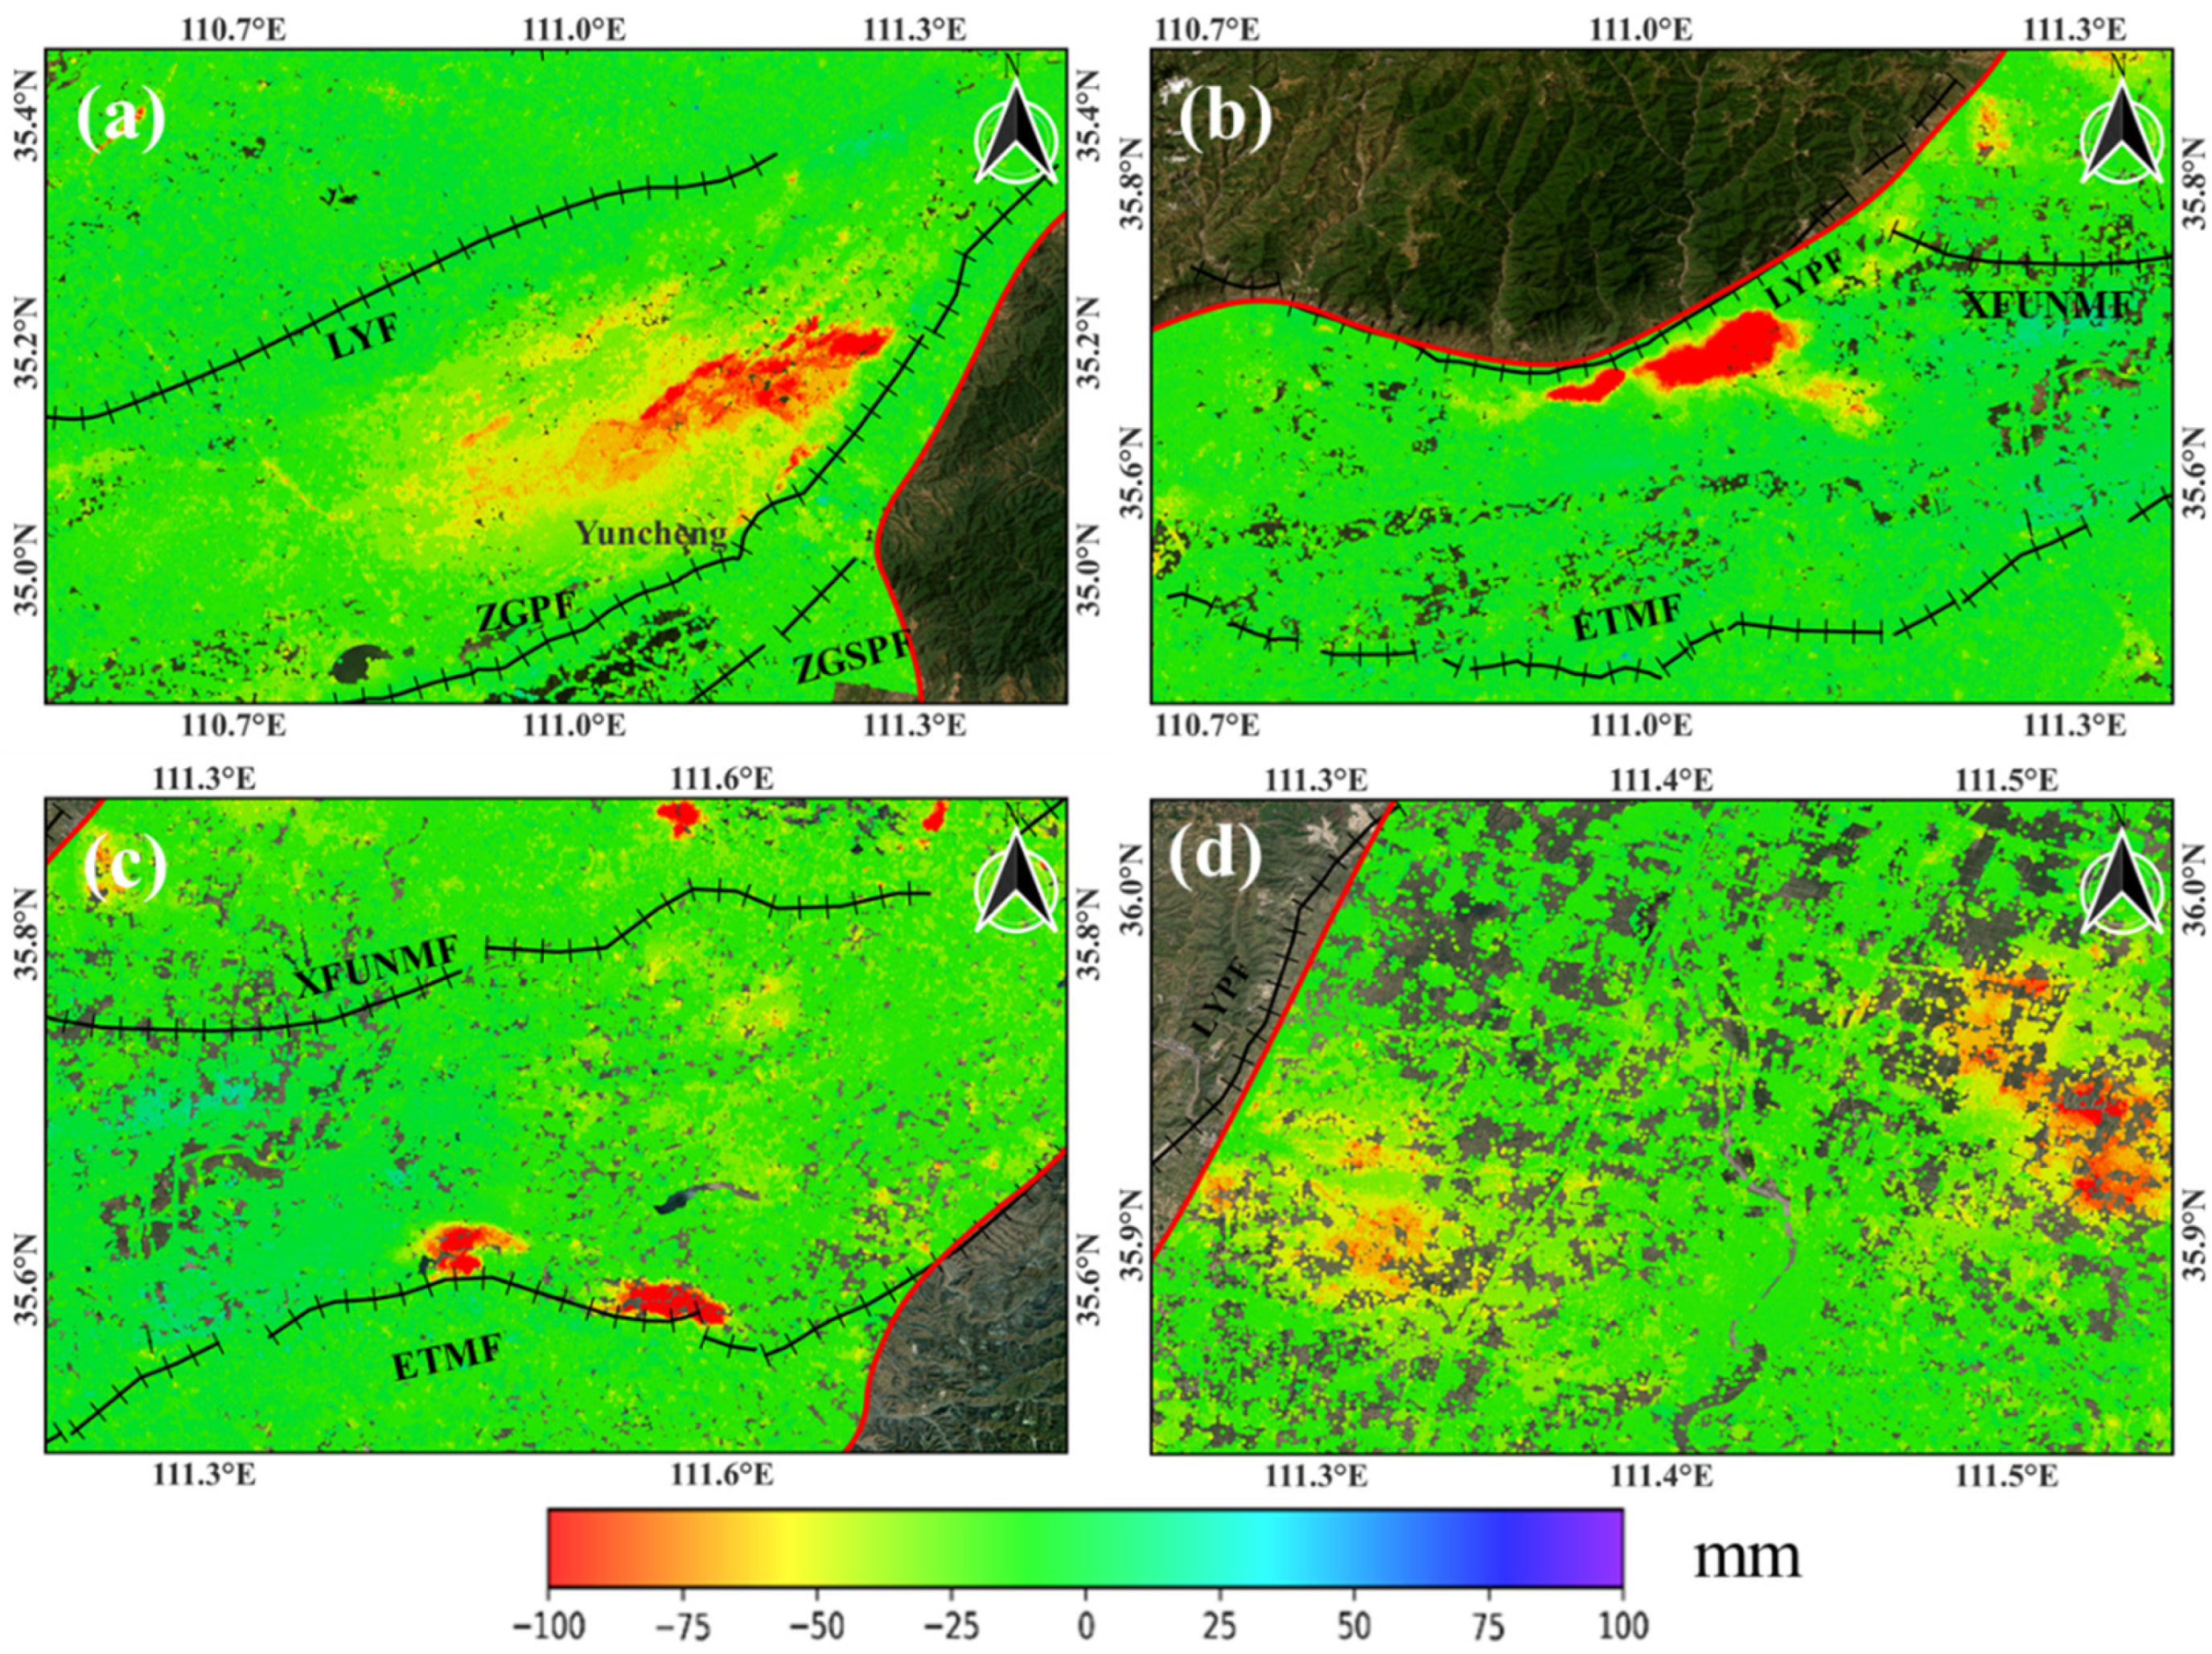
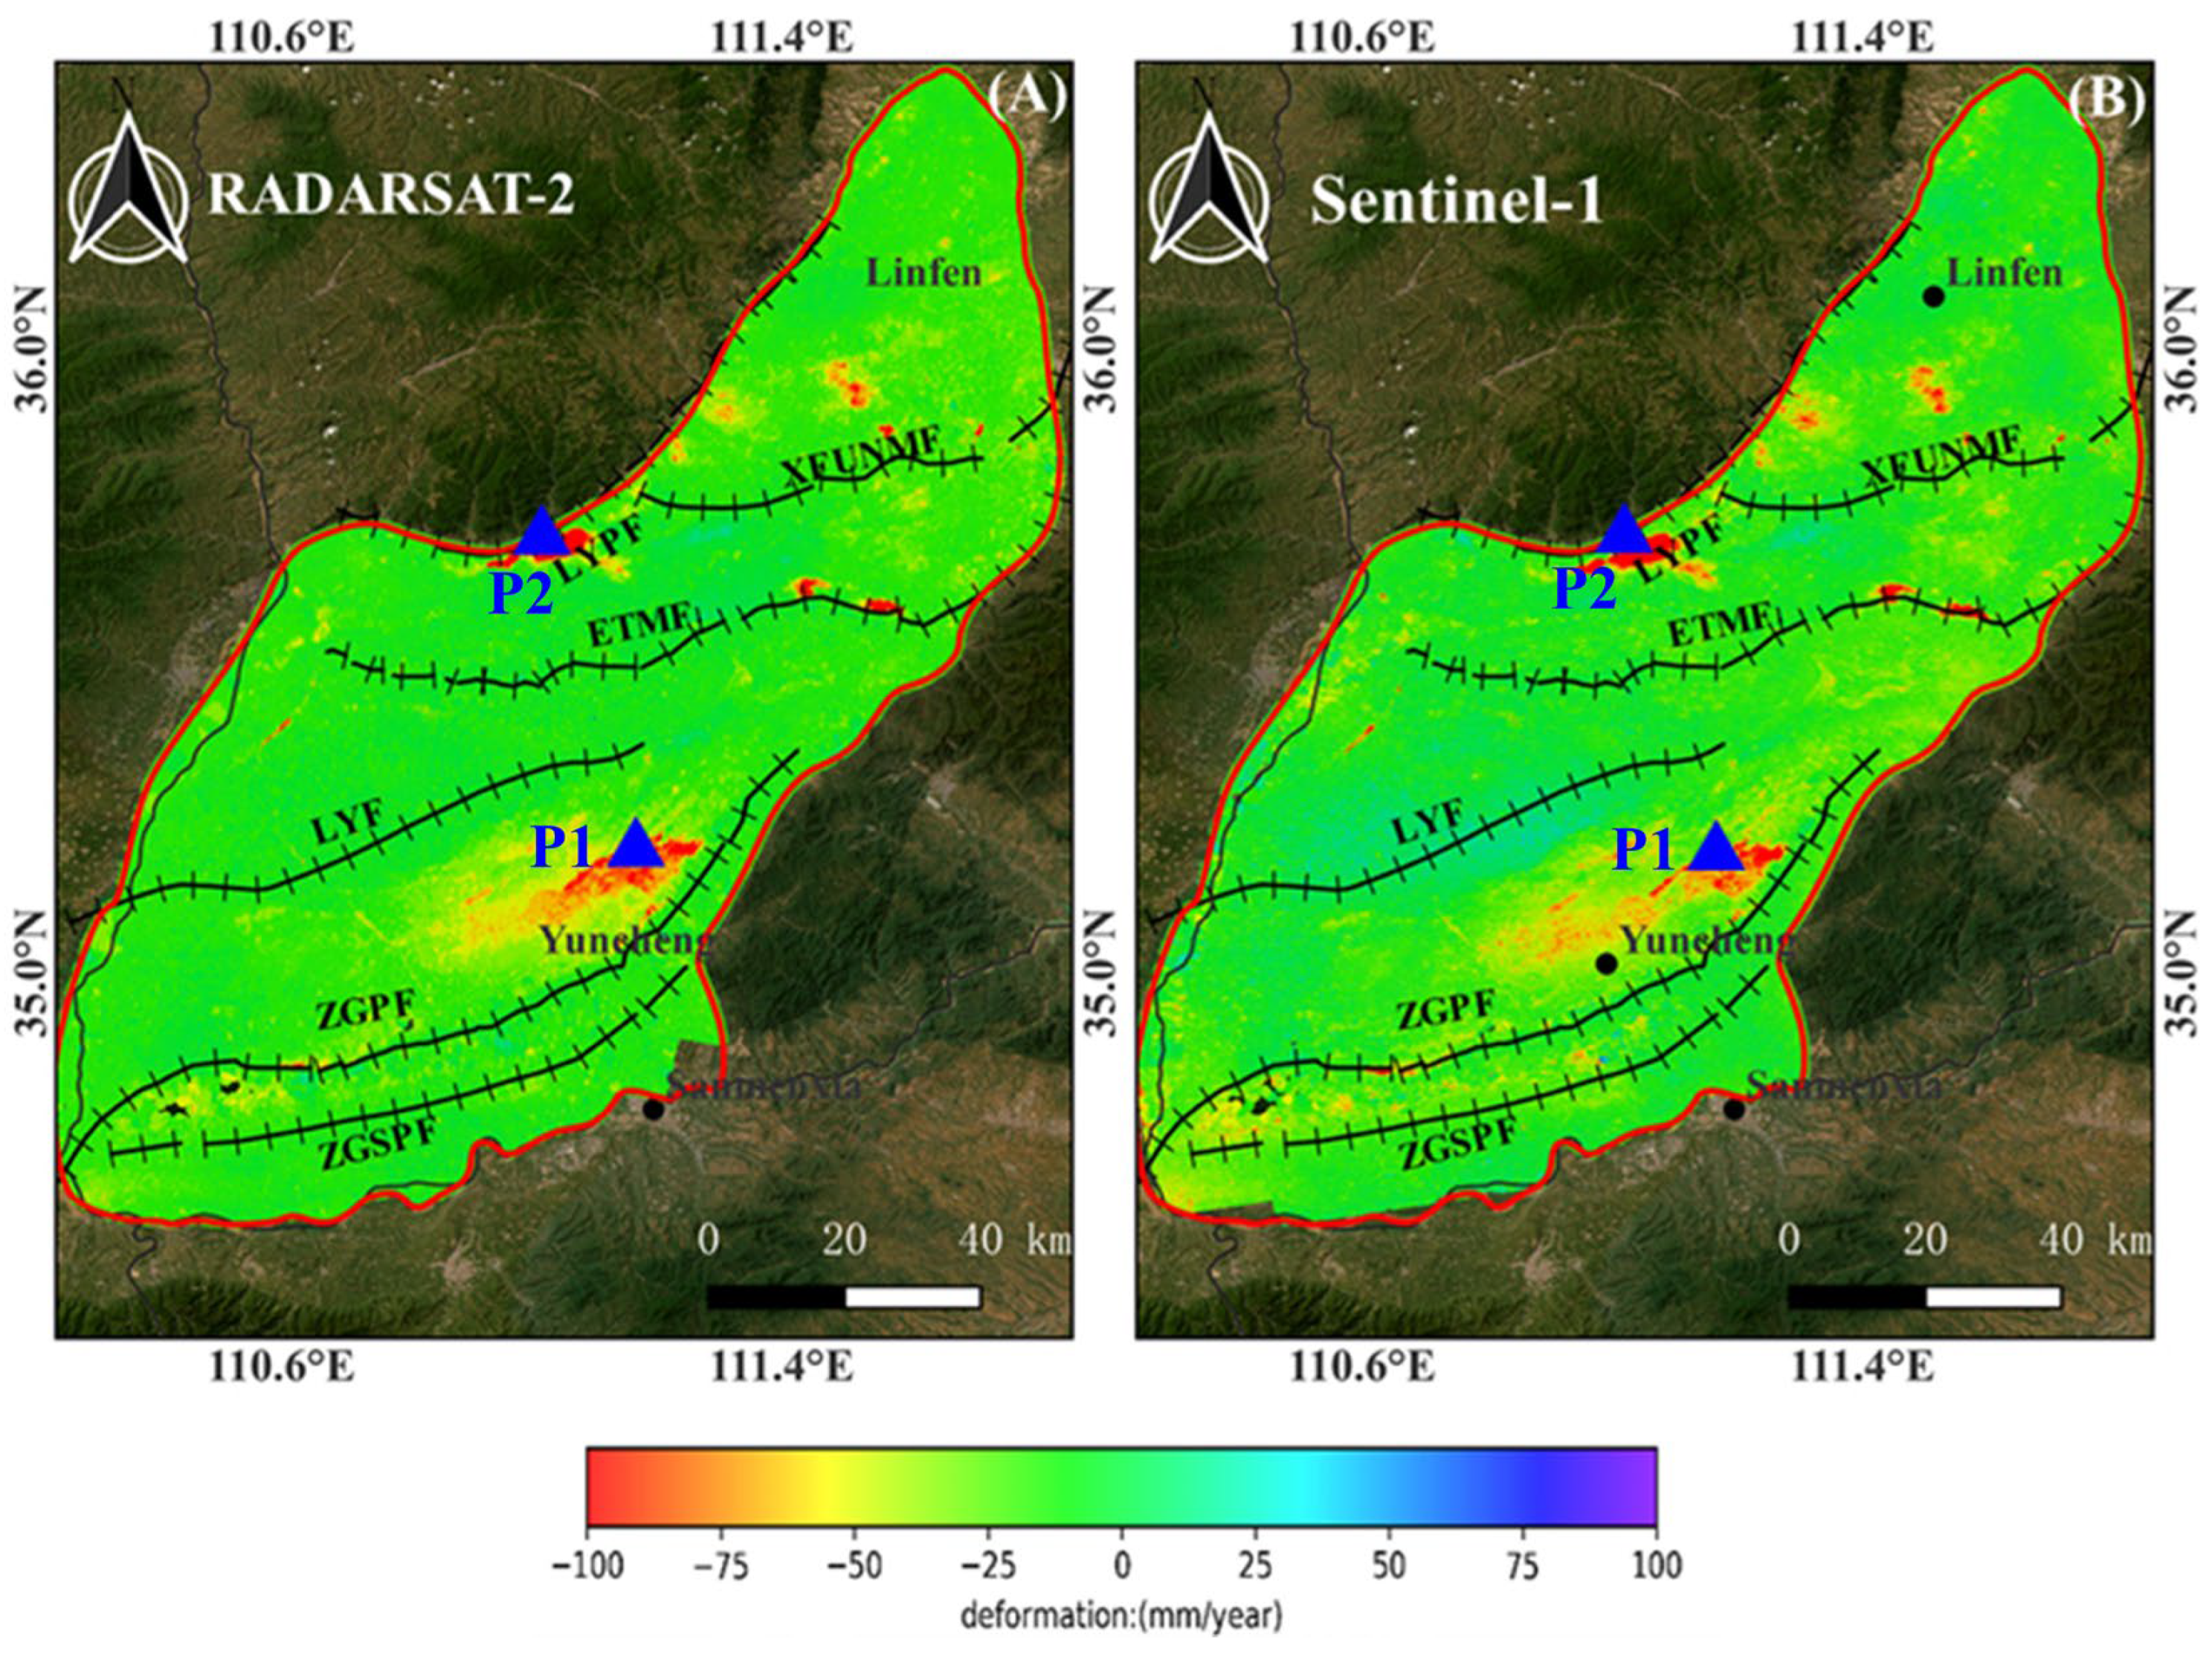
The annual average deformation rate field derived from the inversion of Radarsat-2 and Sentinel-1A data is presented in
Figure 3, which is superimposed with Google optical images of the study area and the locations of major fault structures. Since the dominant deformation direction of land subsidence is primarily manifested as a vertical component, this study did not perform decomposition processing in the line-of-sight direction for the InSAR inversion results to avoid introducing additional uncertainties during the deformation decomposition process. Blue (positive values) indicates uplift, while red (negative values) indicates subsidence. To facilitate the comparison of data from these two different observation methods, the deformation results obtained from GNSS stations were converted into the line-of-sight deformation corresponding to InSAR (
Figure 4). Specifically, the three-component velocities of GNSS station deformation results are projected onto the SAR LOS direction corresponding to each observation station, thus ensuring the reliability of the comparative analysis. The conversion relationship is as follows:
where
is the incidence angle of the microwaves transmitted from the satellite;
β is the angle of the satellite flight direction;
,
, and
are the deformations of GPS observations in the north–south, east–west, and vertical directions, respectively.
A comparative analysis of the monitoring results from the two types of sensors (
Figure 3) reveals that the line-of-sight deformation time-series of Radarsat-2 and Sentinel-1A exhibit high consistency in their overall trend, particularly showing good correspondence in the main settlement fluctuation stages, with correlation coefficients of 0.79, 0.87, and 0.68, respectively. The RMSE between the two sets of InSAR data and GNSS observations ranges approximately from 6 to 9 mm, and the MAE is roughly 5 to 7 mm, which verifies the stability and reliability of multi-source InSAR results. Furthermore, the GNSS monitoring results are highly consistent with the overall trend of the InSAR time series, capably depicting the main evolutionary characteristics of the subsidence process in the study area. This further confirms the applicability and accuracy of the InSAR method for subsidence monitoring in this study.
Through a comprehensively analysis of the spatial distribution of fault structures, three typical subsidence zones within the Linfen–Yuncheng Basin were identified, laying a foundation for further investigation of the causes and spatial variations of regional subsidence.
The Yuncheng–Xia County deformation zone is located at the southeastern edge of the basin, within the alluvial plain between the Zhongtiao Mountain Front Fault (eastern side) and the Linyi Fault (western side). Geologically, this area is a low-lying region with a trench-like structure bounded by the two faults. It is characterized by shallow groundwater depth and intensive agricultural and industrial groundwater extraction, making it a typical area of groundwater overexploitation. InSAR inversion results indicate that this area experiences extensive and large-magnitude land subsidence: the maximum subsidence rate of Sentinel-1A reaches −58 mm/year, which is consistent with the Radarsat-2 monitoring result of −53 mm/year. The subsidence center is distributed in an elliptical pattern, with its long-axis direction roughly aligned with the fault strike, reflecting the fault-controlled characteristics of ground subsidence.
The Jishan–Xinjiang County deformation area is situated at the western edge of the basin, adjacent to the Luoyun Mountain Front Fault. Its landform is characterized as a transition zone from a gentle piedmont slope to an alluvial fan, with thick layers of loose sediment covering the strata and favorable permeability. The subsidence rate gradient in this area is significant, showing a belt-like deformation feature extending along the fault boundary toward the basin interior. The average annual subsidence rates derived from the two types of SAR data are closely consistent, ranging from −96 to −97 mm/year, ranking it among the most severely subsiding areas in the entire basin. Analysis of the fault location reveals that ground deformation in this area has a significant spatial coupling relationship with the Luoyun Mountain Fault. It is speculated that the differential block activity on both sides of the fault and the uneven exploitation of groundwater resources have jointly contributed to the intense surface subsidence in this region.
Scattered subsidence areas in the northern part of the basin are mainly distributed across counties including Xiangfen, Quwo, and Fushan, located at the northern edge of the basin. Fault activity here is relatively weak, resulting in scattered and non-contiguous ground deformation distribution. InSAR results indicate the presence of multiple small-scale subsidence funnels in the region, with average annual subsidence rates generally ranging from −10 to −30 mm/year. Although the subsidence magnitude is moderate, the subsidence duration is relatively long, and the subsidence rate in some areas exhibits a slowly increasing trend.
4.2. Field Verification
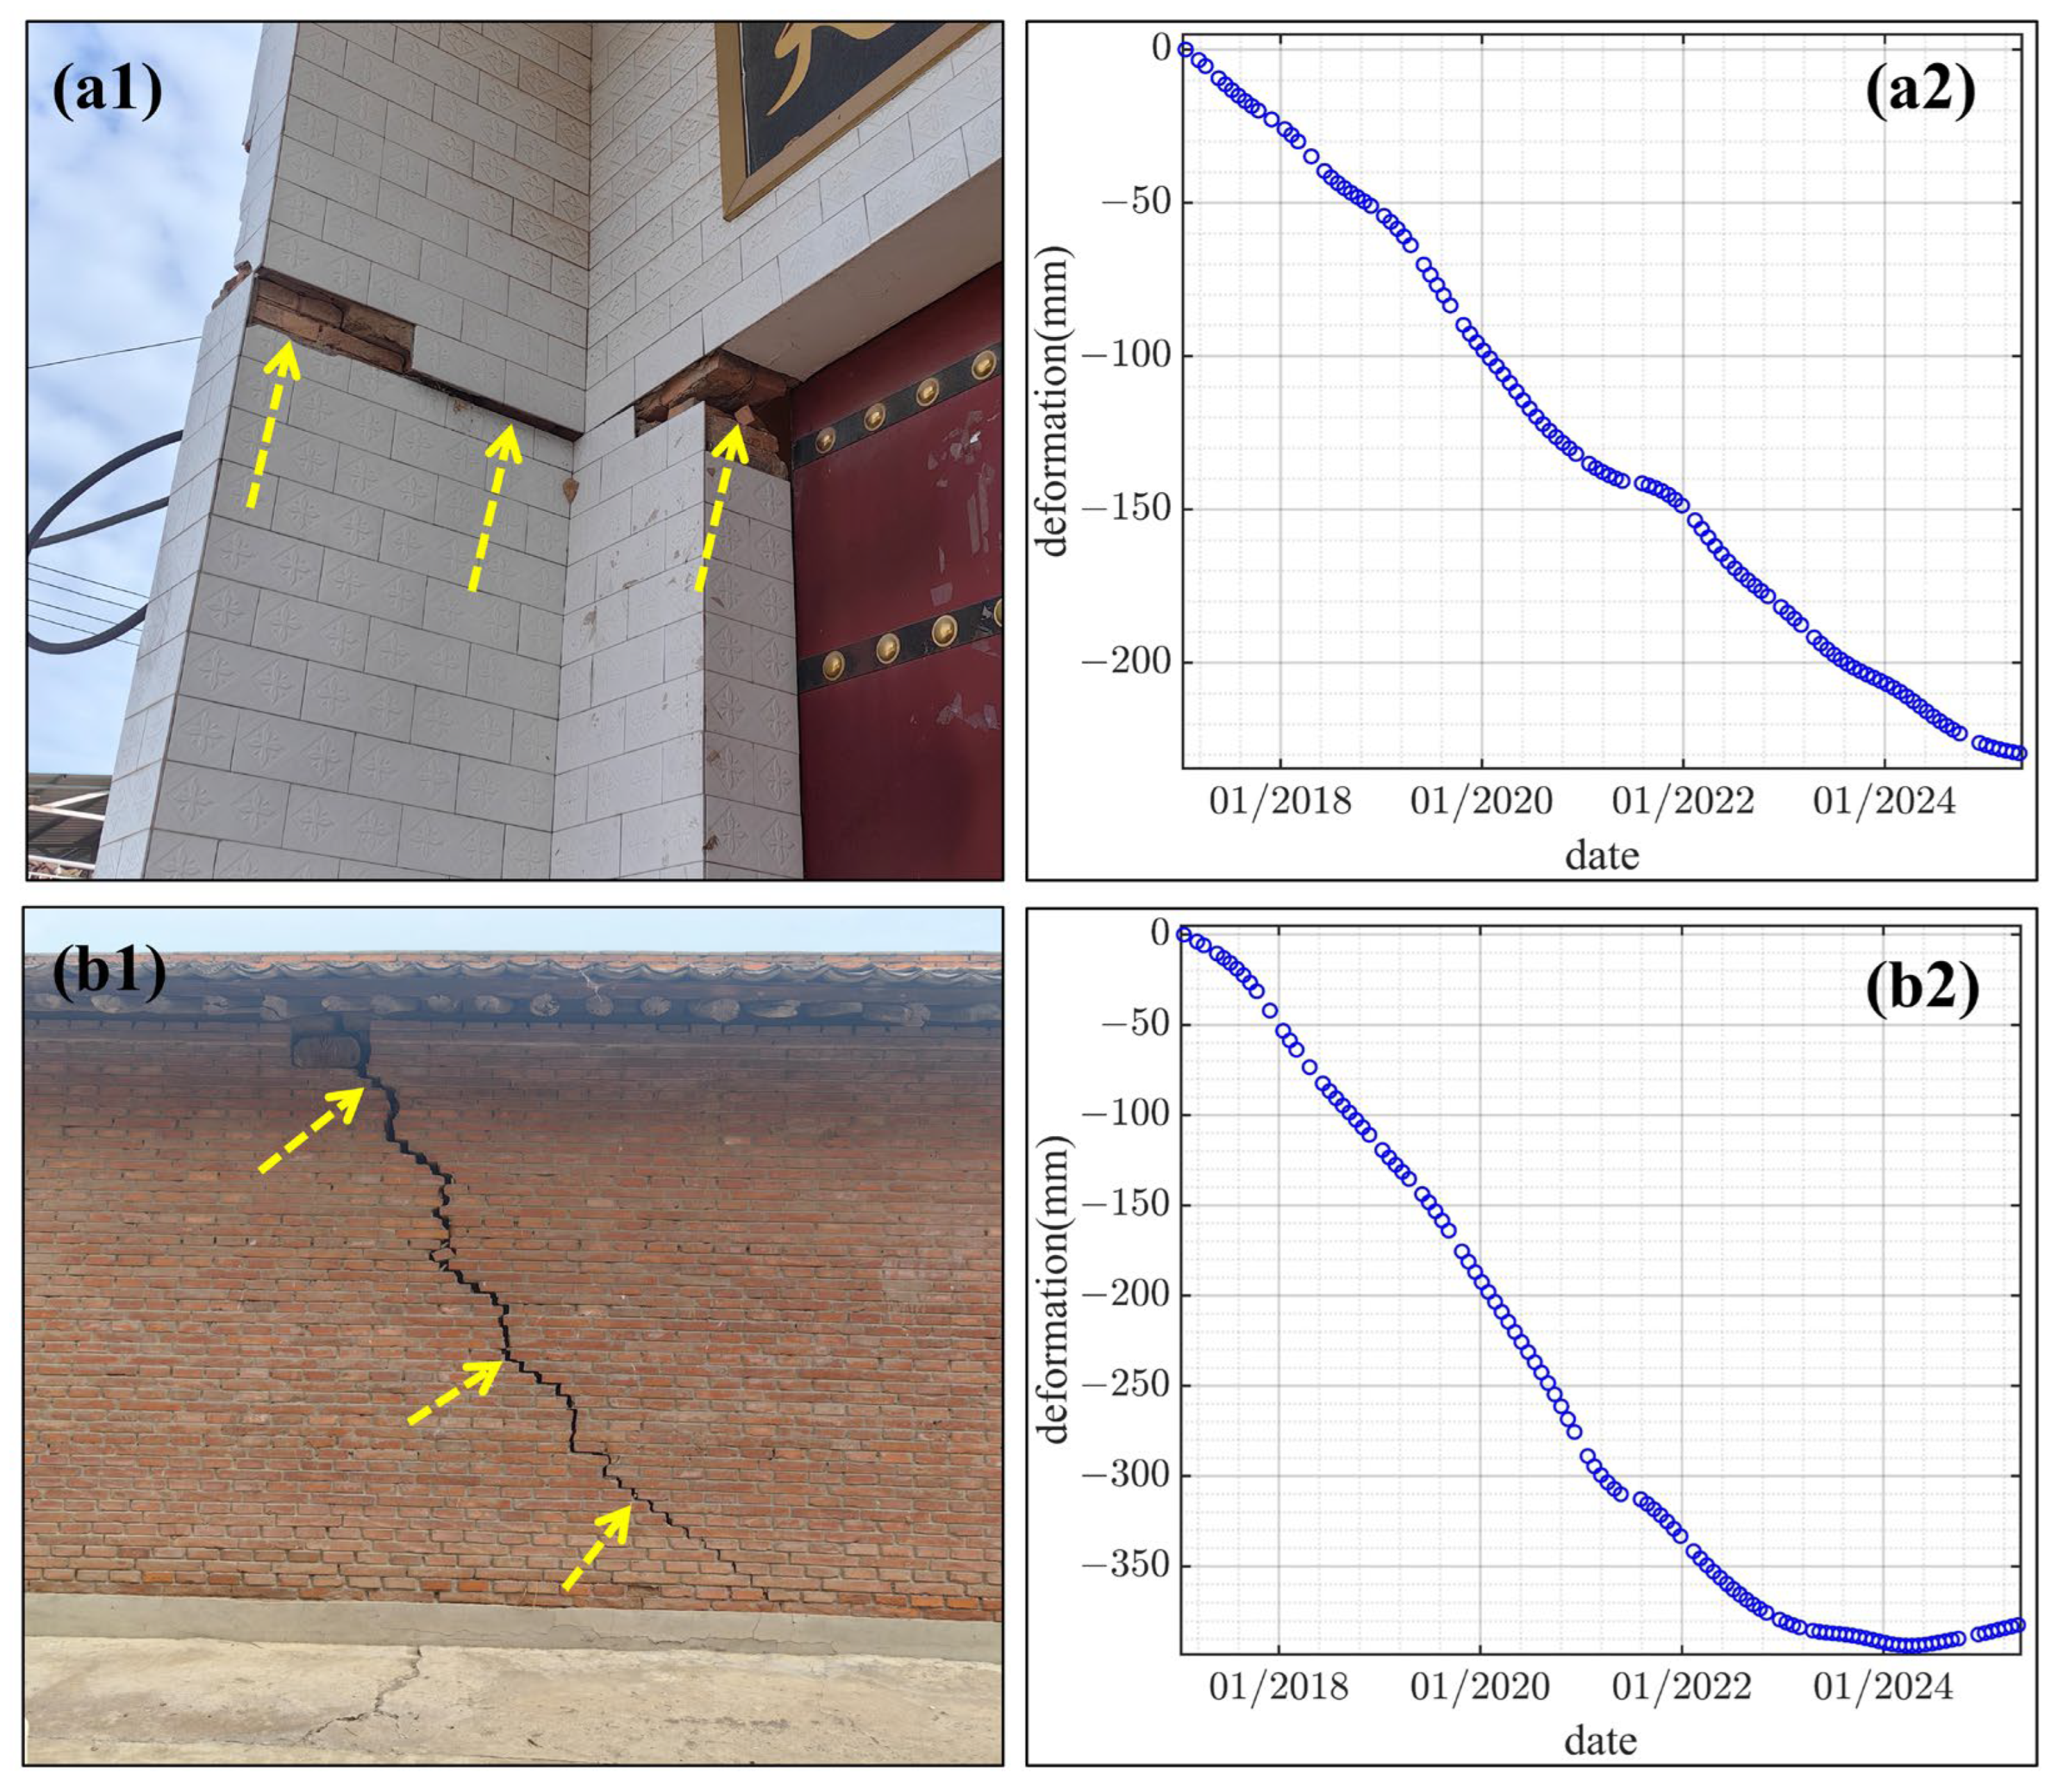
In order to verify the reliability of InSAR monitoring results, this study selected two important subsidence zones for on-site verification. The verification locations are shown in points P1 and P2 in
Figure 3. Point P1 is located in Yuwang Village, Yuwang Town, the Yanhu–Xia County subsidence area, with specific latitude and longitude coordinates of 111.1584°E and 35.1815°N. During the monitoring period, the cumulative subsidence at this point reached 230 mm, with an average subsidence rate of nearly 30 mm/year. The on-site verification results are shown in
Figure 5(a1), and the InSAR time series deformation curve is shown in
Figure 5(a2). Point P2 is located in Xuejiazhuang Village, Xishe Town, and the Xinjiang–Jishan subsidence area, with specific latitude and longitude coordinates of 110.9708°E and 35.6613°N. During the monitoring period, the cumulative subsidence at this point reached 382 mm, with an average subsidence rate of about 46 mm/year. The on-site verification results are shown in
Figure 5(b1), and the InSAR temporal deformation curve is shown in
Figure 5(b2). From the photos, it can be seen that there are obvious signs of ground subsidence and crack development near the two settlement points, posing a serious threat to surrounding residential buildings, roads, and other structures, further verifying the reliability of InSAR processing results.
4.3. Analysis of Seasonal Characteristics of Deformation
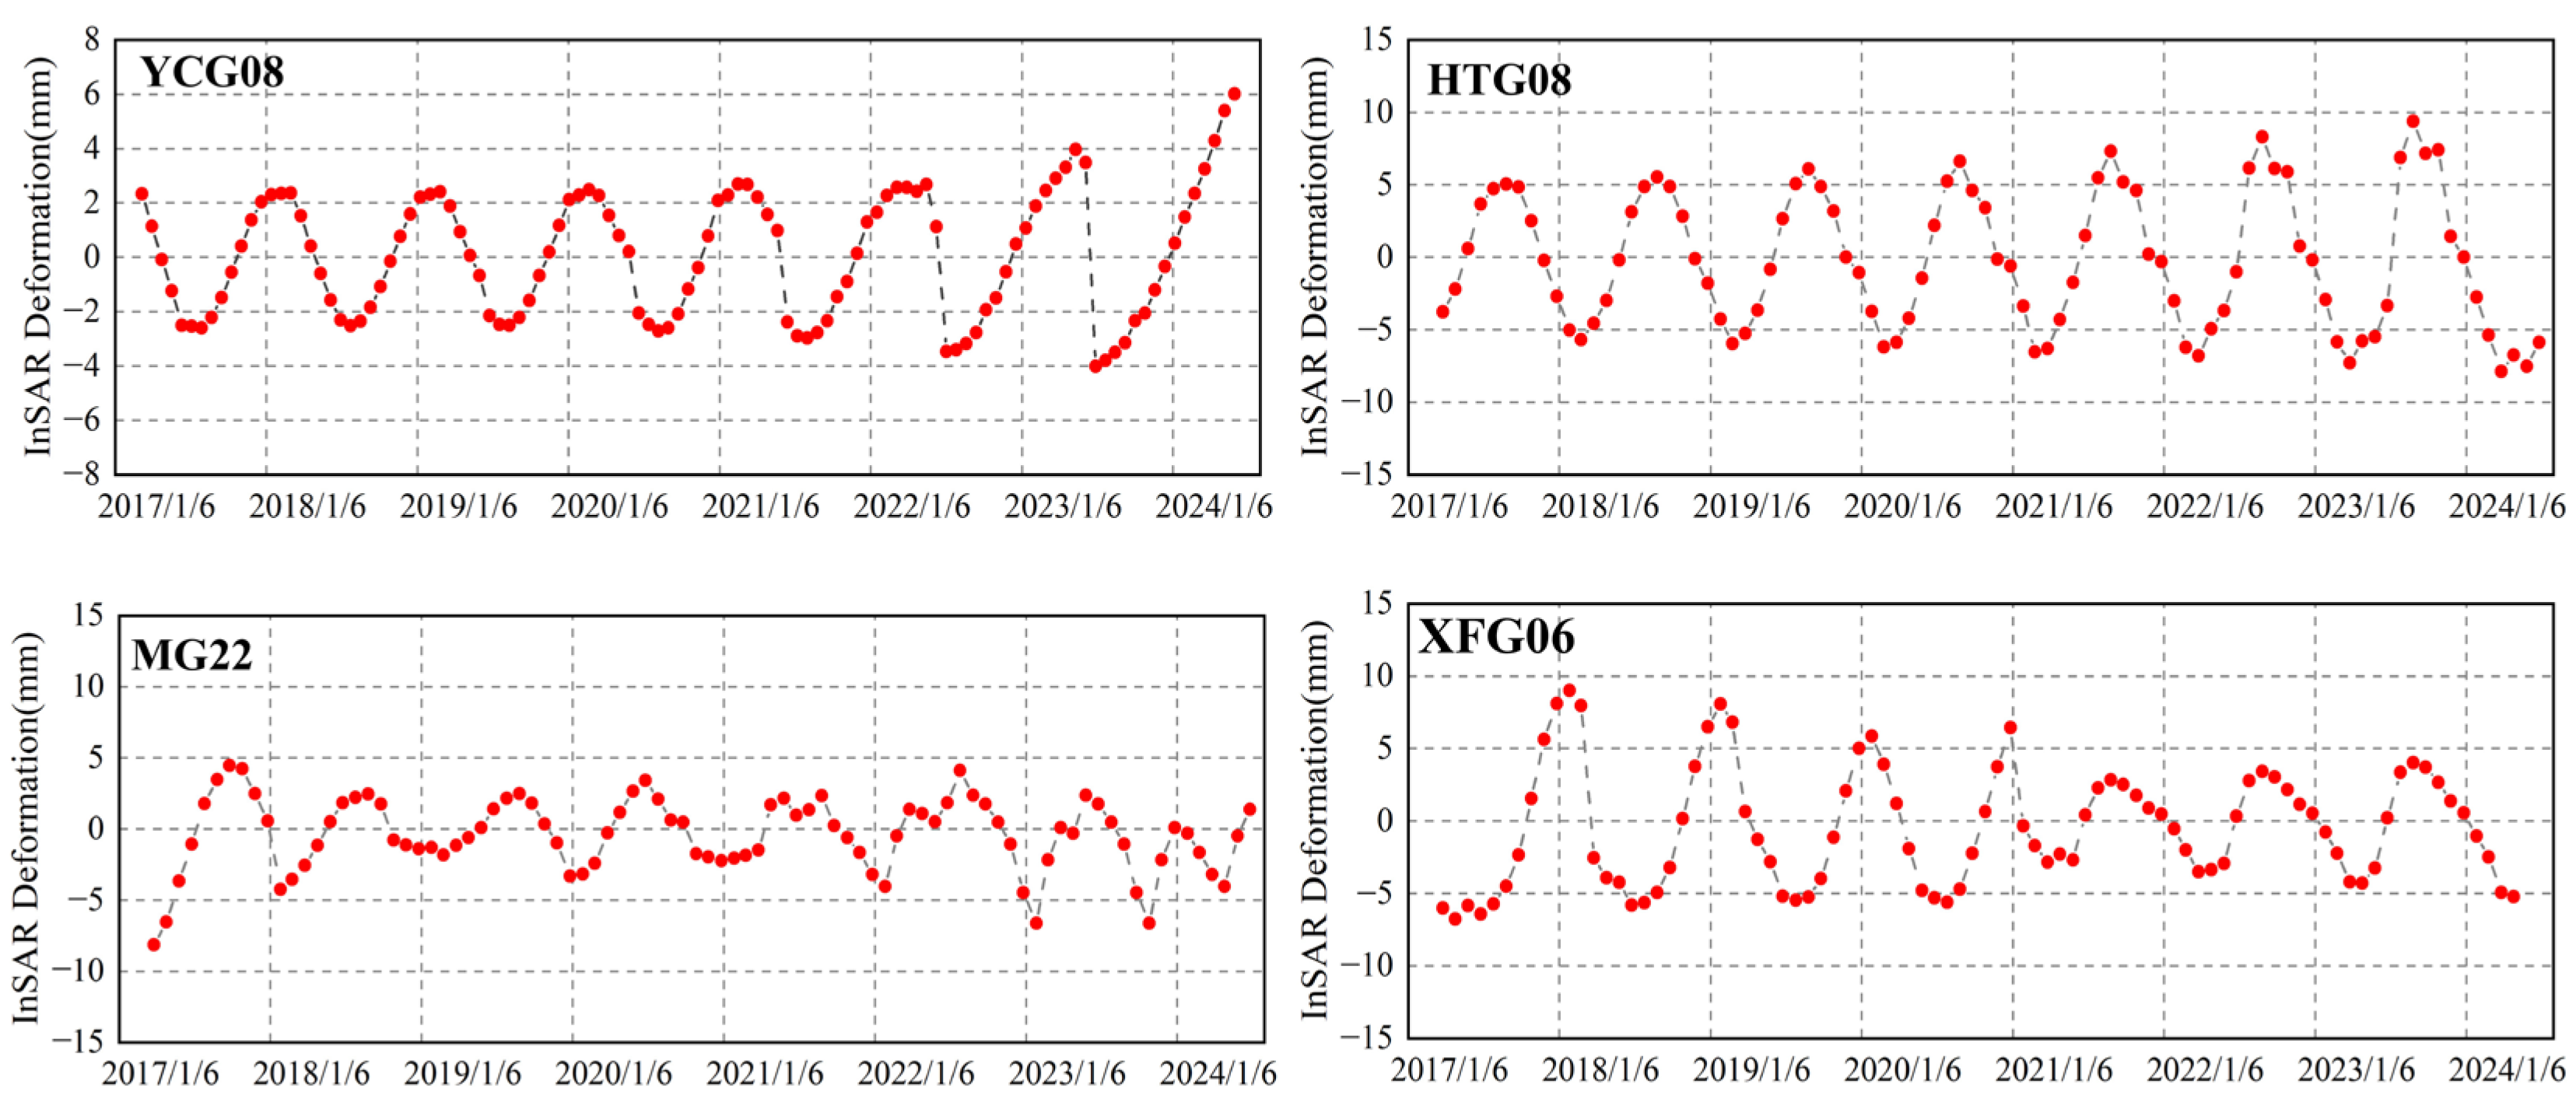
To further uncover the periodic patterns of ground deformation in the study area, this study selected InSAR deformation time-series data from four typical hydrological monitoring points (YCG08, HTG08, Mingguan 22, and XFG06) in the central part of the basin, and conducted time-series decomposition analysis based on the deformation decomposition model described in
Section 3.2. By extracting annual periodic components, the seasonal variation characteristics during the subsidence process can be effectively separated and identified. The analysis results are presented in
Figure 6.
The analysis results of deformation time-series from the four monitoring points, YCG08, HTG08, Minguan 22, and XFG06, indicate that surface deformation in the study area exhibits distinct annual periodic variation characteristics. Overall, the deformation process can be roughly divided into three stages: the first stage is from March to September each year, during which the surface deformation continues to decrease with a prominent subsidence trend. Multiple points show stable and significant negative changes in this period, demonstrating that this stage is the main occurrence period of annual subsidence. The second stage lasts from September to November, where the rate of ground deformation slows down, and the subsidence amplitude of some points tends to stabilize. The deformation process gradually transitions to a turning point, during which the overall deformation curve flattens or even approaches stability. The third stage extends from December to March of the following year, during which ground deformation converts from negative to positive, showing a clear rebound trend. Most points experience an increase in deformation values during this period, reaching the positive peak of the annual deformation in March of the following year, thus forming a complete annual deformation cycle.
These periodic variations exhibit a certain degree of consistency across different monitoring points, with obvious rhythmic and stage-specific characteristics of the deformation process. This indicates that ground deformation in the study area possesses good temporal regularity.
5. Interpretation of InSAR Results
5.1. The Response Relationship Between Ground Subsidence and Groundwater Level
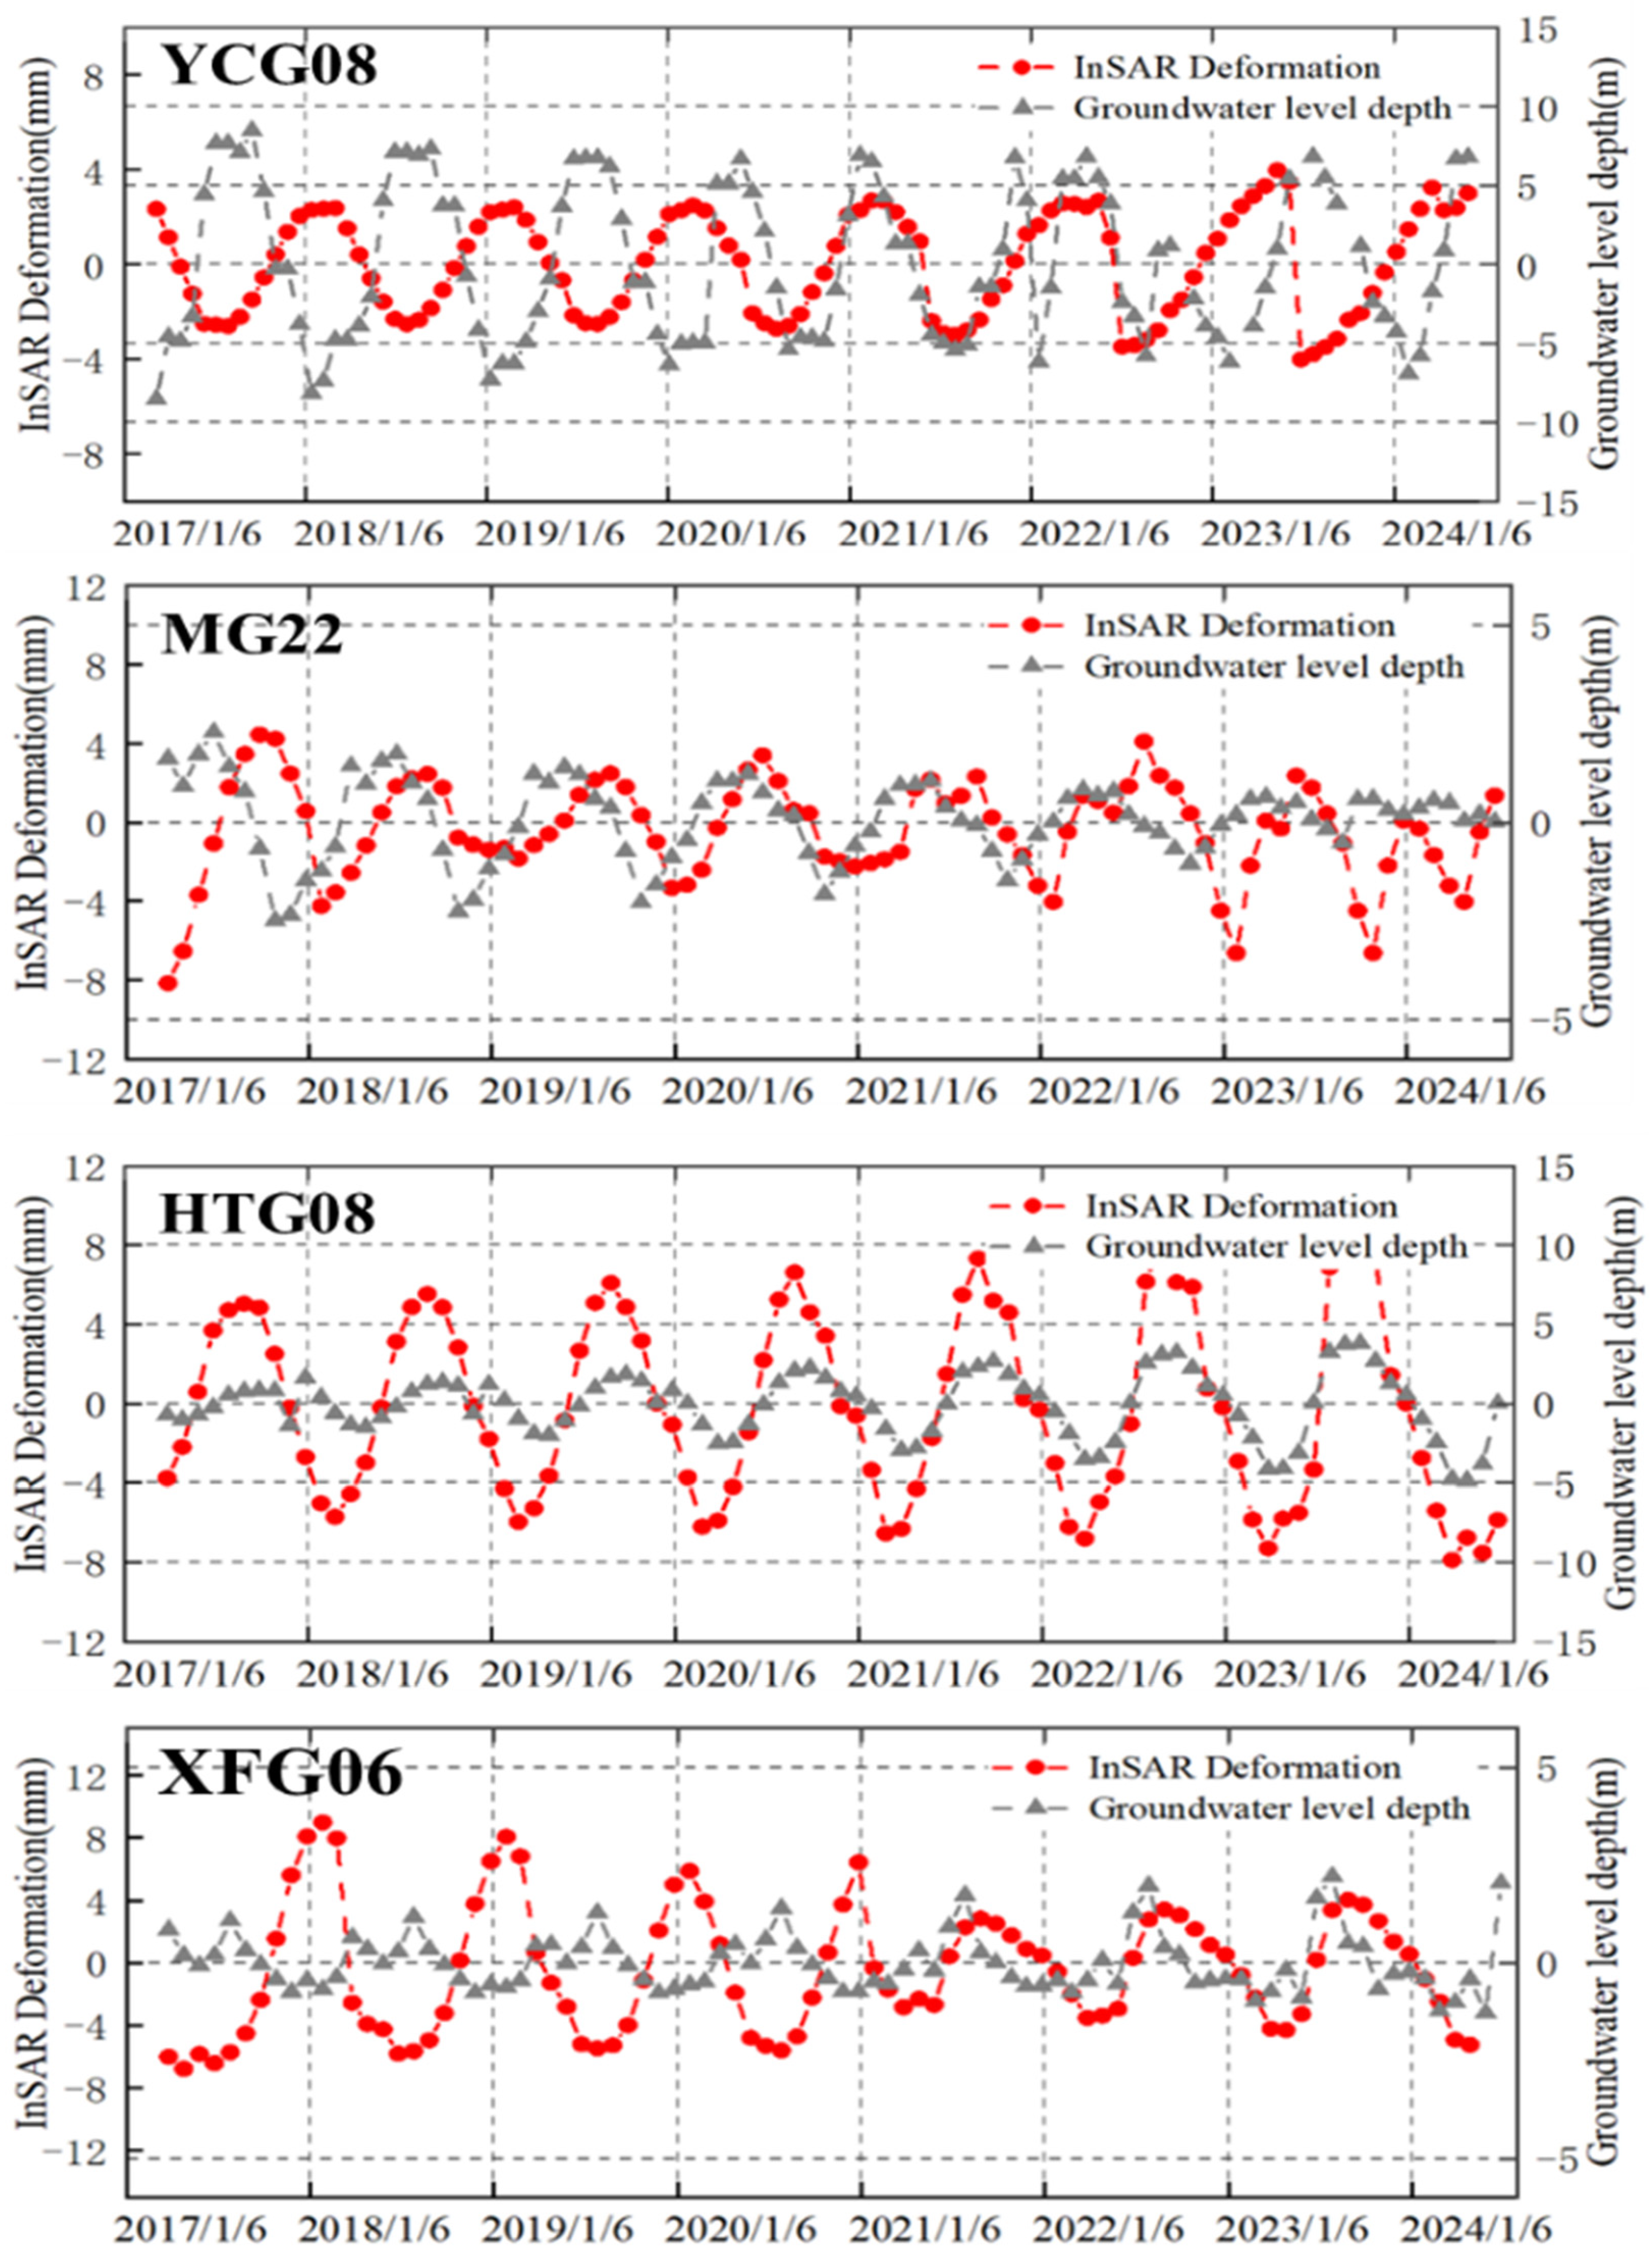
By integrating groundwater monitoring data with InSAR monitoring results, the seasonal subsidence and groundwater level variation patterns of the four monitoring points in the study area were analyzed (
Figure 7). The results show that the deformation amplitude of each point and its response relationship with groundwater fluctuations exhibit certain differences. For the YCG08 point, the seasonal subsidence amplitude ranges from −4.01 to 3.97 mm, corresponding to a groundwater level variation range of −8.53 to 8.49 m. The subsidence is basically synchronized with the groundwater level change, showing a significant positive correlation. Furthermore, the curve graph reveals a short lag time, indicating that the ground deformation in this area responds rapidly to groundwater level fluctuations. The subsidence amplitude of the HTG08 point ranges from −7.88 to 9.37 mm, with groundwater level varying from −4.85 to 3.80 m. Its ground deformation amplitude is larger than that of YCG08, exhibiting strong seasonal fluctuations. Cross-correlation results indicate a slightly longer lag time, suggesting the presence of a moderately thick weak permeable layer in this area, which induces a certain delay in the response of ground deformation to groundwater fluctuations. For the Mingguan 22, the subsidence amplitude ranges from −8.15 to 4.45 mm, and the groundwater level varies from −2.48 to 2.29 m. Although the groundwater level variation is relatively small, the ground subsidence shows high fluctuations, and cross-correlation analysis demonstrates a relatively short lag time. The subsidence amplitude of the XFG06 point ranges from −6.77 to 8.99 mm, with groundwater level varying from −1.27 to 2.21 m. Its deformation time series shows weak temporal correlation with groundwater level variations, and the maximum lag time identified by cross-correlation analysis is larger than those of the other three monitoring points.
The analysis results indicate that the lag time between the subsidence values of YCG08 and Minguan 22 and groundwater level changes is relatively short, while the lag time for HTG08 and XFG06 is significantly longer. This discrepancy is mainly attributed to differences in aquifer types at the monitoring points: YCG08 and Minguan 22 are groundwater monitoring points, characterized by shallow aquifer burial depth and high permeability. Groundwater level fluctuations can be transmitted to the surface within a short period, triggering rapid reversible deformation responses. In contrast, HTG08 and XFG06 are monitoring points of middle-deep confined groundwater, located in deeper weak permeable layers or compressible soil layers. Changes in pore pressure require a long time to propagate to the surface, resulting in a significant lag in deformation response.
Overall, a certain positive correlation exists between the subsidence of the four monitoring points and groundwater level changes in the time series, but differences in response time reflect distinct geological structure control mechanisms: high-permeability aquifers exhibit a rapid response, while weak permeable or thick compressible layers show significant delays. This difference is consistent with the “compression lag effect” proposed in existing studies, which refers to the combined effect of irreversible compression induced by long-term groundwater overexploitation and reversible deformation caused by seasonal water level fluctuations, governing the spatiotemporal evolution characteristics of ground deformation.
5.2. The Influence of Structural Control and Fault Distribution on Subsidence Distribution
From the perspective of deformation rate spatial distribution, the annual average deformation rate fields obtained by Radarsat-2 and Sentinel-1A data exhibit high consistency in the distribution range and morphology of major subsidence areas, indicating that the two types of SAR data have good complementarity and reliability in ground deformation detection. The Linfen–Yuncheng Basin is situated in the southern segment of the Fen-Wei Fault Zone, and its subsidence spatial distribution characteristics are significantly controlled by multiple active faults, particularly by the superposition of basin boundary faults and internal secondary faults. Several important fault zones are developed in the study area, including the Zhongtiao Mountain Front Fault, Linyi Fault, Emei Tai Fault, and Luoyun Mountain Front Fault. These faults not only define the structural framework of the basin, but also directly influence the location of the subsidence centers and the spatial distribution characteristics of subsidence intensity. It is evident that the formation and evolution of regional land subsidence are largely dominated by fault activity and its spatial distribution characteristics.
As illustrated in
Figure 8, the influence of structural control and fault distribution on subsidence exhibits distinct boundary effects and zoning characteristics. It is clearly observed that the distribution direction of the subsidence zone is highly consistent with fault strike and the variation in subsidence intensity is positively correlated with fault activity. This phenomenon indicates that land subsidence in the Linfen–Yuncheng Basin does not exhibit homogeneous expansion, but rather follows a spatial distribution characteristics of “fault-controlled zoning and differential subsidence” under structural constraints.
(I) In the southern part of the basin, the Zhongtiao Mountain Front Fault and the Linyi Fault constitute important boundaries for subsidence distribution. These two faults have formed distinct structural zones along the north–south direction, inducing deformation and subsidence distribution differentiation with the faults as the boundaries. The subsidence amplitude south of the fault is significantly larger, reflecting more intense crustal extension and tectonic subsidence, while the area north of the fault is relatively stable with smaller subsidence. This boundary effect indicates that the Zhongtiao Mountain Front Fault and the Linyi Fault play a watershed-like structural control role in the basin subsidence spatial distribution characteristics.
(II) In the northern part of the basin, the Luoyun Mountain Front Fault, the Emei Tai Fault, and other secondary faults synergistically control the shape and boundaries of the subsidence zone. Studies have shown that the subsidence zone in the front of the Luoyun Mountain Fault corresponds well to surface deformation, and fault activity coupled with differential uplift/subsidence effects significantly intensifies the uneven subsidence in the northern part of the basin. Meanwhile, the Emei Tai Fault has formed a transitional zone between subsidence and stability at the basin edge, and its activity characteristics have to a certain extent exacerbated the asymmetry of surface deformation distribution.
(III) Overall, the spatial distribution of subsidence in the study area is highly spatially coupled with the main fault zones. Subsidence zones tend to extend along the faults and exhibit significant differences on either side of the fault: the lower part of the fault (basin direction) is more likely to form a subsidence center, while the upper part (mountain direction) is characterized by relatively weak uplift or subsidence. This discrepancy not only reveals the dynamic characteristics of basin extension under fault control, but also reflects the close correlation between crustal activity and subsidence evolution.
It should be emphasized that tectonic structures, including major boundary faults in the Linfen–Yuncheng Basin, primarily act as long-term geological boundary conditions that control the spatial framework and zonation of land subsidence, rather than serving as direct driving factors of short-term deformation observed by InSAR. At the decadal timescale (≤10 years) captured by the present InSAR observations, active faulting is unlikely to generate measurable land subsidence signals comparable to those induced by intensive groundwater abstraction. Instead, fault systems influence subsidence indirectly by governing sediment thickness, stratigraphic architecture, and the spatial configuration of aquifer systems, thereby modulating the sensitivity of different zones to groundwater withdrawal. Therefore, the land subsidence spatial distribution characteristics identified in this study should be understood as a result of the combined effects of long-term tectonic constraints on basin structure and short-term anthropogenic disturbances, with excessive groundwater extraction being the primary driving factor behind the increased rate of land subsidence and localized accelerated development of subsidence in recent years.
5.3. The Revealing of Settlement Mechanism by Time-Series Trend Decomposition Characteristics
By decomposing the InSAR deformation data of the Linfen–Yuncheng Basin from 2017 to 2025 into time-series components, the multi-scale evolutionary characteristics of regional subsidence can be revealed. Firstly, in terms of the long-term trend component, significant subsidence zones in the central and southern parts of the basin can be clearly identified. Overall, the subsidence rate in the southern part of the Yuncheng Basin generally ranges from −20 to −35 mm/year, with local maximum subsidence rates exceeding −40 mm/year, while the subsidence rate in the northern part of the Linfen Basin is generally less than −15 mm/year. This difference is closely associated with Quaternary sedimentary layer thickness, groundwater extraction intensity, and fault zones’ activity. Secondly, in the periodic component, deformation is mainly manifested as seasonal fluctuations closely related to groundwater extraction and agricultural irrigation. The typical subsidence amplitude in summer reaches 10–20 mm, while in winter or when irrigation is reduced, there is a rebound of 5–10 mm, reflecting the typical compression characteristics of “elastoplastic” strata. This seasonal signal is particularly prominent in the Yuncheng Basin, with an interannual amplitude generally approximately 30% higher than that in the Linfen Basin, indicating the strong regulatory effect of local groundwater resource exploitation on ground deformation. Finally, several local sudden deformation signals can be observed in the deformation sequence, with amplitudes usually ranging from 20 to 50 mm. These signals may be associated with mining activities, ground fissure development, or local geological disturbances induced by heavy rainfall. These non-linear and sudden events highlight the complexity of subsidence mechanisms and reflect the overlapping effects of tectonic factors, sedimentary environments, and human activities. In summary, time-series decomposition not only clarifies the background controlling role of long-term structural and geological subsidence, but also distinguishes the contributions of periodic and sudden factors across different spatial scales, providing multi-dimensional evidence for understanding the mechanism of basin subsidence.
6. Discussion
Based on long-term InSAR data, this study systematically reveals the comprehensive characteristics of land subsidence in the Linfen–Yuncheng Basin in terms of spatial distribution, temporal evolution, and driving mechanisms. The results indicate that the formation of land subsidence is not the result of a single factor, but rather the product of the coupling of groundwater extraction, human activity intensity, and existing tectonic–sedimentary conditions. The characteristics of subsidence centers spreading along major active faults and significantly intensifying in the footwall of the faults are in good agreement with previous research results, further confirming the key role of fault structures in controlling the spatial zoning and intensity differences of subsidence.
Compared to previous studies, this study relies on a longer-timescale InSAR monitoring sequence and combines the STL time-series decomposition method to gain a clearer understanding of seasonal deformation characteristics and differences in aquifer response. The phreatic aquifer mainly experiences rapid and reversible elastic subsidence, while the confined aquifer exhibits significant lagging deformation and a higher proportion of inelastic compression. This differential response provides new quantitative evidence for understanding the regulatory mechanism of groundwater systems on land subsidence.
It is worth noting that the significant abnormal subsidence observed in the area north of Jishan is difficult to directly explain by tectonic activity on the InSAR observation scale over the past decade. Although this area is controlled by the tectonic system of the Fen–Wei Basin, and fault activity mainly serves as a long-term geological background condition that constrains sediment thickness and aquifer structure, the observed intensified subsidence is more likely to be closely related to the long-term high-intensity groundwater extraction in the Jishan–Hejin heavy industrial area. Continuous groundwater overextraction leads to a decline in the water level of confined aquifers and inelastic compression of thick sediments, thereby forming significant subsidence signals on the surface. The above results indicate that when analyzing subsidence mechanisms based on short-term InSAR data, it is necessary to strictly distinguish between the magnitudes of influence driven by tectonic background control and human activities. Due to the sparse distribution of groundwater monitoring wells in this area and the lack of continuous water level data, it is still difficult to quantitatively constrain the relationship between groundwater level changes and subsidence response, which to some extent limits the depth of the mechanistic analysis.
Meanwhile, this study still has certain limitations and uncertainties. Firstly, the InSAR inversion results primarily reflect line-of-sight deformation information, and a complete three-dimensional deformation decomposition has not yet been conducted, potentially underestimating the horizontal displacement components near active faults. Secondly, groundwater monitoring data are relatively limited in spatial distribution, making it difficult to comprehensively depict the fine differences in local hydrogeological conditions. Furthermore, the specific causes of the local anomalous deformation signals identified in the STL residual term may be related to factors such as mining disturbance, ground fissure activity, or heavy rainfall. However, due to the lack of high-temporal-resolution auxiliary data, it is currently difficult to uniquely attribute these signals to specific causes.
7. Conclusions
This study introduces the STL method based on long-term InSAR monitoring data to systematically analyze the long-term trend, seasonal variation, and sudden deformation characteristics of land subsidence in the Linfen–Yuncheng Basin. The trend component effectively reveals the dominant spatial distribution characteristics of subsidence at the basin scale, indicating that structural boundaries such as the Zhongtiao Mountain Front Fault and Linyi Fault exert a decisive control on subsidence distribution: the subsidence in the lower part of the fault is significantly stronger than that in the upper part, and the subsidence rate in the southern graben type structural area generally exceeds −20 mm/year, while the northern area with thinner sedimentary layers exhibits significantly weaker subsidence. The separation of seasonal components further demonstrates the elastoplastic response characteristics of the strata in the study area, particularly reflected in the rapid reversible subsidence of the unconfined aquifers and the delayed deformation of the confined aquifers. This not only highlights the direct regulatory effect of groundwater extraction intensity on surface deformation, but also reveals the differences in hydrogeological response of different aquifer systems. In addition, local abnormal deformation signals extracted from the residual terms of STL decomposition indicate that short-term non-linear deformation processes persist in some regions of the study area. Based on the analysis of human activity intensity, geological conditions, and environmental factors in the study area during the same period, such abnormal deformation may be associated with mining disturbances, ground fissure activity, or heavy rainfall events. However, due to the limitations of existing data types and spatiotemporal resolution, uncertainties remain regarding their specific causes. The relevant results suggest that the regional land subsidence process is influenced by multiple natural and anthropogenic factors, reflecting the multi-source superposition effect and complexity of the subsidence mechanism. Through this comprehensive identification framework based on time-series decomposition, this study not only clarifies the hierarchical relationship among tectonic factors, sedimentary conditions, and groundwater exploitation in the evolution of ground subsidence, but also reveals the coupling law between subsidence spatial zoning and seasonality. This provides novel evidence and analytical perspectives for understanding the formation and evolution mechanism of subsidence in the Linfen–Yuncheng Basin. Future research can be further expanded on the existing basis: on the one hand, high-precision 3D deformation inversion can be conducted by integrating InSAR and GNSS data from ascending and descending orbits, so as to deepen the understanding of the contributions of fault activity and horizontal displacement to the subsidence process; on the other hand, InSAR deformation sequences can be coupled with groundwater numerical models to construct a process simulation framework of “groundwater dynamics change-induced formation compression and ground deformation”, which characterizes the relative weights of reversible and irreversible deformations from a mechanistic perspective. In addition, by analyzing external disturbance factors such as extreme rainfall and earthquakes, it is expected to improve the capability of identifying local abnormal deformation and predicting disaster risks. In summary, the introduction of STL decomposition not only enhances the depth of deformation mechanism interpretation, but also provides more logical and operational scientific support for regional groundwater management, ground fissure prevention, and geological hazard monitoring.
Author Contributions
Conceptualization, Y.W. and L.C.; methodology Y.W. and P.J.; software, Y.W., W.L., and C.H.; validation, Y.W. and Z.L.; formal analysis, Y.W., P.J., W.L., and Z.L.; investigation, Y.W. and L.C.; writing—original draft preparation, Y.W.; writing—review and editing, Y.W., L.C., P.J., W.L., and Z.L.; funding acquisition, L.C. All authors have read and agreed to the published version of the manuscript.
Funding
This research was funded by Key Research and Development Fund of the Chinese Academy of Sciences (grant number E2H2010402).
Data Availability Statement
The data presented in this study are available on request from the corresponding author due to a non-disclosure agreement.
Acknowledgments
The authors gratefully acknowledge MacDonald, Dettwiler and Associates LTD (MDA) and the European Space Agency (ESA) for providing the time-series InSAR datasets of Radarsat-2 and Sentinel-1A, respectively. The authors also extend thanks to the developers of the StaMPS-4.1-beta software for making the open-source time-series InSAR processing algorithm publicly available. Additionally, the authors appreciate the Western Deformation Data Sub-center of the National Seismological Science Data Sharing Center (Second Monitoring Center of the China Earthquake Administration) for the provision of GNSS observation data.
Conflicts of Interest
The authors declare no conflicts of interest.
References
- Chen, B.; Gong, H.L.; Chen, Y.; Zhou, C. Land Subsidence and Its Relation with Groundwater Aquifers in Beijing Plain of China. Sci. Total Environ. 2020, 735, 139111. [Google Scholar] [CrossRef] [Scilit]
- Zhang, Y.; Wu, H.; Kang, Y.; Zhu, C. Ground Subsidence in the Beijing-Tianjin-Hebei Region from 1992 to 2014 Revealed by Multiple SAR Stacks. Remote Sens. 2016, 8, 675. [Google Scholar] [CrossRef] [Scilit]
- Zhao, C.; Liu, C.; Zhang, Q.; Lu, Z.; Yang, C. Deformation of Linfen-Yuncheng Basin (China) and Its Mechanisms Revealed by Π-RATE InSAR Technique. Remote Sens. Environ. 2018, 218, 221–230. [Google Scholar] [CrossRef] [Scilit]
- Ferretti, A.; Prati, C.; Rocca, F. Permanent scatterers in SAR interferometry. IEEE Trans. Geosci. Remote Sens. 2001, 39, 8–20. [Google Scholar] [CrossRef] [Scilit]
- Long, D.; Yang, W.; Scanlon, B.R.; Zhao, J.; Liu, D.; Burek, P.; Pan, Y.; You, L.; Wada, Y. South-to-North Water Diversion Stabilizing Beijing’s Groundwater Levels. Nat. Commun. 2020, 11, 3665. [Google Scholar] [CrossRef] [Scilit]
- Zhou, C.; Gong, H.; Chen, B.; Gao, M.; Shi, M. Land Subsidence Response to Different Land Use Types and Water Resource Utilization in Beijing-Tianjin-Hebei, China. Remote Sens. 2020, 12, 457. [Google Scholar] [CrossRef] [Scilit]
- Sowter, A.; Amat, M.; Cigna, F.; Marsh, S.; Athab, A.; Alshammari, L. Mexico City Land Subsidence in 2014–2015 with Sentinel-1A IW TOPS: Results Using the Intermittent SBAS (ISBAS) Technique. Int. J. Appl. Earth Obs. Geoinf. 2016, 52, 230–242. [Google Scholar] [CrossRef] [Scilit]
- Fernandez, J.; Prieto, J.F.; Escayo, J.; Camacho, A.G.; Mallorqui, J.J. Modeling the two-and three-dimensional displacement field in Lorca, Spain, subsidence and the global implications. Sci. Rep. 2018, 8, 14782. [Google Scholar] [CrossRef] [Scilit]
- Li, Z.W.; Yang, Z.F.; Zhu, J.J.; Hu, J.; Wang, Y.J.; Li, P.X.; Chen, G.L. Retrieving three-dimensional displacement fields of mining areas from a single InSAR pair. J. Geod. 2015, 89, 17–32. [Google Scholar] [CrossRef] [Scilit]
- Zhao, C.; Zhang, Q.; Yang, C.; Zhang, J.; Liu, Y. Different scale land subsidence and ground fissure monitoring with multiple InSAR techniques over Fenwei basin, China. Proc. Int. Assoc. Hydrol. Sci. 2015, 372, 305–309. [Google Scholar] [CrossRef] [Scilit]
- Castellazzi, P.; Arroyo-Dominguez, N.; Martel, R.; Calderhead, A.I.; Normand, J.C.L.; Gárfias, J.; Rivera, A. Land subsidence in major cities of Central Mexico: Interpreting InSAR-derived land subsidence mapping with hydrogeological data. Int. J. Appl. Earth Obs. Geoinf. 2016, 47, 102–111. [Google Scholar] [CrossRef] [Scilit]
- Gao, M.; Gong, H.; Li, X.; Chen, B.; Zhou, C.; Shi, M.; Guo, L.; Chen, Z.; Ni, Z.; Duan, G. Land subsidence and ground fissures in Beijing Capital International Airport (BCIA): Evidence from Quasi-PS InSAR Analysis. Remote Sens. 2019, 11, 1466. [Google Scholar] [CrossRef] [Scilit]
- Devin, L.; Thomas, J. Review: Regional land subsidence accompanying groundwater extraction. Hydrogeol. J. 2011, 19, 1459–1486. [Google Scholar] [CrossRef] [Scilit]
- Lanari, R.; Mora, O.; Manunta, M.; Mallorqui, J.; Berardino, P.; Sansosti, E. A small-baseline approach for investigating deformations on full-resolution differential SAR interferograms. Geosci. Remote Sens. IEEE Trans. 2004, 42, 1377–1386. [Google Scholar] [CrossRef] [Scilit]
- Wang, F.; Wang, F.; Peng, J.; Lu, Q.; Meng, Z.; Qiao, J. Multi-dynamic mechanisms of ground fissures on marginal mountainous region in the Fenwei Basin, China. Bull. Eng. Geol. Environ. 2025, 84, 138. [Google Scholar] [CrossRef] [Scilit]
- Chaussard, E.; Wdowinski, S.; Cabral-Cano, E.; Amelung, F. Land subsidence in central Mexico detected by ALOS InSAR time-series. Remote Sens. Environ. 2014, 140, 94–106. [Google Scholar] [CrossRef] [Scilit]
- Ng, A.H.; Ge, L.; Li, X.; Abidin, H.Z.; Andreas, H.; Zhang, K. Mapping land subsidence in Jakarta, Indonesia using persistent scatterer interferometry (PSI) technique with ALOS PALSAR. Int. J. Appl. Earth Obs. Geoinf. 2012, 18, 232–242. [Google Scholar] [CrossRef] [Scilit]
- Lu, Y.Y.; Ke, C.Q.; Jiang, H.J.; Chen, D.L. Monitoring urban land surface deformation (2004–2010) from InSAR, groundwater and levelling data: A case study of Changzhou city, China. J. Earth Syst. Sci. 2019, 128, 159. [Google Scholar] [CrossRef] [Scilit]
- Zhang, Y.; Zhang, J.; Wu, H.; Lu, Z.; Sun, G.T. Monitoring of urban subsidence with SAR interferometric point target analysis: A case study in Suzhou, China. Int. J. Appl. Earth Obs. Geoinf. 2011, 13, 812–818. [Google Scholar] [CrossRef] [Scilit]
- Lanari, R.; Bonano, M.; Pepe, A.; Euillades, L.; Berardino, P.; Sansosti, E. SBAS-based satellite orbit correction for the generation of DInSAR time-series: Application to RADARSAT-1 data. IEEE Trans. Geosci. Remote Sens. 2011, 49, 5150–5165. [Google Scholar] [CrossRef] [Scilit]
- Minati, F.; Costantini, M.; Falco, S.; Malvarosa, F.; Vecchioli, F. Persistent scatterer pairs (PSP) approach in very high resolution SAR interferometry. In 8th European Conference on Synthetic Aperture Radar; VDE: Berlin, Germany, 2011. [Google Scholar]
- Farr, T.G.; Kobrick, M. Shuttle radar topography mission produces a wealth of data. Eos Trans. Am. Geophys. Union 2013, 81, 583–585. [Google Scholar] [CrossRef] [Scilit]
- Yague-Martinez, N.; Prats, P.; Rodriguez Gonzalez, F.; Brcic, R.; Shau, R.; Geudtner, D.; Eineder, M.; Bamler, R. Interferometric processing of Sentinel-1A TOPS data. IEEE Trans. Geosci. Remote Sens. 2016, 54, 2220–2234. [Google Scholar] [CrossRef] [Scilit]
- Li, Z.W.; Cao, Y.; Wei, J.; Duan, M.; Wu, L. Time-series InSAR ground deformation monitoring: Atmospheric delay modeling and estimating. Earth Sci. Rev. 2019, 192, 258–284. [Google Scholar] [CrossRef] [Scilit]
- Mallorquí, J.J.; Duque, S.; Monells, D.; Blanco-Sánchez, P. The Coherent Pixels Technique (CPT): An Advanced DInSAR Tech-nique for Nonlinear Deformation Monitoring. In Earth Sciences and Mathematics; Birkhäuser: Basel, Switzerland, 2008; Volume 165, pp. 1167–1193. [Google Scholar] [CrossRef] [Scilit]
- Biggs, J.; Wright, T.; Lu, Z.; Parsons, B. Multi-interferogram method for measuring interseismic deformation: Denali Fault, Alaska. Geophys. J. Int. 2007, 170, 1165–1179. [Google Scholar] [CrossRef] [Scilit]
- Fialko, Y.; Kaneko, Y.; Tong, X.; Sandwell, D.T.; Furuya, M. Interseismic deformation and creep along the central section of the North Anatolian Fault (Turkey): InSAR observations and implications for rate-and-state friction properties. J. Geophys. Res. Solid Earth 2013, 118, 316–331. [Google Scholar] [CrossRef] [Scilit]
- Zhou, W.; Jiang, R.; Ding, S.; Cheng, Y.; Tao, H. A novel grey prediction model for seasonal time series. Knowl.-Based Syst. 2021, 229, 107363. [Google Scholar] [CrossRef] [Scilit]
- Cleveland, W.P.; Tiao, G.C. Decomposition of Seasonal Time Series: A Model for the Census X-11 Program. J. Am. Stat. Assoc. 1976, 71, 581–587. [Google Scholar] [CrossRef]
- Cleveland, R.B.; Cleveland, W.S. STL: A seasonal-trend decomposition procedure based on Loess. J. Off. Stat. 1990, 6, 3–73. [Google Scholar]
| Disclaimer/Publisher’s Note: The statements, opinions and data contained in all publications are solely those of the individual author(s) and contributor(s) and not of MDPI and/or the editor(s). MDPI and/or the editor(s) disclaim responsibility for any injury to people or property resulting from any ideas, methods, instructions or products referred to in the content. |



 ,
,