


Highlights
What are the main findings?
- Near-nadir Ka-band Radar Interferometer (KaRIn) sensor onboard the Surface Water Ocean Topography (SWOT) mission is effective for retrieving the location of freshwater ice cover prior to and during melt, and can quantify the timing of water-clear-of-ice (WCI), which has been challenging to resolve at moderate-incidence angles using synthetic aperture radar due to similar backscatter intensities for ice and water during melt.
- Ka-band backscatter revealed a considerable contrast for melting ice versus open water. The timing of the phase change from ice to water was retrieved for Lhù’ààn Mǟn (Kluane Lake, Canada) using the Dynamic Threshold Variability Method (DTVM), using SWOT KaRIn as input, and is compared to near-daily optical PlanetScope acquisitions and thermodynamic lake ice modeling. WCI was retrieved at 100 and 500 m resolutions during SWOT’s fast sampling phase, which acquired data on a daily basis during the spring and summer of 2023. At 11 Points of Interest, the DTVM 25th percentile had the highest agreement, with 100 m tessellation WCI RMSE of 1.2 days (95% confidence interval of 0.6–1.7 days) and MAE of 0.8 days (95% confidence interval of 0.4–1 day). For 500 m, the RMSE was 1.2 days (95% confidence interval of 0.7–1.8 days) and MAE of 0.9 days (95% confidence interval of 0.5–1.5 days). When the DTVM was compared to PlanetScope for the whole lake for the 100 m tessellation, the 50th threshold percentile had the lowest MAE and smallest bias, with RMSE of 8.7 days and MAE of 3.2 days, and the 500 m tessellation had RMSE of 7.5 days and MAE of 2.8 days.
What are the implications of the main findings?
- The method presented in this study presents a foundation to use SWOT Ka-band backscatter to better identify the timing of WCI, as previous threshold-based methods for C- and X-band SAR are confounded by melting ice and wind-roughened water.
- The ability to better discriminate between melting ice and open water using SWOT reveals the potential for Ka-band discrimination between ice cover and open water during complete melt out of larger lakes, as well as the potential to contribute to retrospective ice-cover products and phenology climate records.
Abstract
Following the launch of the Surface Water Ocean Topography (SWOT) mission, data collected during the calibration/validation “fast sampling” phase were acquired daily for select swaths, presenting a unique opportunity to monitor ice break-up for Lhù’ààn Mǟn (Kluane Lake, Yukon Territory, Canada) using the Ka-band Radar Interferometer (KaRIn). The KaRIn pixel cloud product is designed to provide backscatter and surface elevation for open water; however, it effectively discriminates ice-covered regions on the lake. In this study, the efficacy of the KaRIn pixel cloud product is evaluated for the retrieval of the timing of water-clear-of-ice (WCI), an ice phenology parameter that has proven difficult to resolve using co- or cross-polarized synthetic aperture radar. The Dynamic Threshold Variability Method (DTVM) is evaluated against optical remote sensing from near-daily PlanetScope acquisitions, and is also within the physically plausible range of lake-wide melt out dates simulated by the one-dimensional thermodynamic Canadian Lake Ice Model (CLIMo). At 11 Points of Interest (POIs), SWOT observed the transition from break-up to water-clear-of-ice phase from 23 May 2023 to 30 May 2023, a total of 8 days, with an RMSE of 1.2 days (95% confidence interval of 0.6–1.7 days), and a Mean Absolute Error (MAE) of 0.8 days (95% confidence interval of 0.4–1 days) for WCI derived using the Dynamic Threshold Variability Method (DTVM) at a tessellated resolution of 100 m. When comparing PlanetScope WCI to the DTVM using the 50th percentile of thresholds for all 100 m tessellation pixels across the lake, the RMSE is 8.69 days, with an MAE of 3.15 days. While SWOT has since transitioned to the science phase (21-day repeat pass), the use of KaRIn during the fast sampling phase to retrieve WCI presents the opportunity to discriminate between melting freshwater ice and open water during the break-up season that previous SAR observations have had difficulty resolving.
1. Introduction
Lake ice phenology, including the timing of freeze-onset (FO), complete freeze-over (CFO), melt-onset (MO), water-clear-of-ice (WCI), and ice cover duration, has been used as a direct proxy for monitoring a change in climate over periods of time, from decades to centuries [1]. From 1971 to 2020, observations indicate that, globally, ice cover duration has decreased by an average of 9 days per decade [1]. There are regional differences in ice phenology trends in North America, with predominantly earlier FO in Québec, and earlier melt in western and Arctic Canada, associated with temperature and downwelling longwave radiation trends from 2004 to 2019 [2]. Latitudinally, the largest reductions in ice cover duration are observed in mid-latitude lakes compared to sub-Arctic or Arctic environments, as winter temperatures are closer to the 0 °C isotherm and small temperature changes significantly affect ice development [1].
Lake ice is considered as a thematic product of “Lakes” as an essential climate variable (ECV) by the Global Climate Observing System (GCOS) because the main drivers of ice development and thickness are air temperature and snow depth, both parameters that are fluctuating considerably under a changing climate, and the magnitude of change is occurring at a higher rate in Arctic regions [3,4]. According to GCOS, the target temporal resolution for tracking Lake Ice Cover (km2) is 3–7 days, and the breakthrough resolution is daily, inherently resolving the needed retrieval of FO, CFO, MO, and WCI to be daily as well. Concurrently, the horizontal resolution of Lake Ice Cover retrieval target level is 1 km, with a breakthrough of 100 m [5]. Breakthrough values are identified as the level that would result in considerable improvement for research applications.
Lake ice cover and the timing of ice phenology events (e.g., FO, CFO, MO, and WCI) have been retrieved using several remote sensing methods, each with their own benefits and limitations. Freeze-onset (FO) is the first date that the sensor is able to detect ice on the lake, which may be limited by the sensor type and spatial resolution. Complete freeze-over (CFO) is the date that the sensor detects no open water following FO. Melt onset (MO) is the date that sufficient moisture is present either in the overlying snowpack or on the ice surface that modifies the observed sensor signal, and WCI is the date in which the pixel, polygon or lake extent is completely open water. In this research, WCI is investigated at the tessellated pixel level within a lake. Optical sensors have been used to track ice phenology, exploring the tradeoff of daily acquisitions at high spatial resolution (e.g., PlanetScope at 3 m) [6], to moderate resolution scenes acquired daily to sub-daily (Moderate Resolution Imaging Spectroradiometer (MODIS) between 250 m and 1000 m). Regardless of the number, resolution or repeat-pass of optical satellites, the main drawback is the reliance on reflected light both reaching the surface and the sensor without being affected by atmospheric interference, cloud cover or polar darkness. Optical sensors have been successful in retrieving overall ice phenology [7,8]; however, the distinction of the timing of WCI compared to thin ice is difficult due to reflectance-based detection algorithms misclassifying wet ice surface conditions during melt [9].
Passive microwave (PMW) radiometers have been extensively utilized for tracking ice phenology events because the source of the signal is independent of incoming solar radiation and is affected by the temperature and emissivity of the medium. The brightness temperature (Tb) measures the emission of energy between 6.6 and 91 GHz depending on the platform’s available sensors, available at grid spacings between 3.125 km and 25 km, beginning in 1978 from the National Snow and Ice Data Center (NSIDC) [10]. Common Lake Ice Cover and thickness algorithms utilize two main frequency channels: 19 and 37 GHz. 19 GHz (K-band) Tbs are sensitive to thickening ice during the winter season, as the emission for thicker ice includes less radiometrically-cold water; however, it lacks sensitivity for thin ice covers [11]. Tbs at 37 GHz are emitted closer to the surface, resulting in greater sensitivity to thin ice [12,13]. While PM emission from ice-covered lakes are a function of ice thickness, the use of passive microwave for ice cover retrieval during freeze- or break-up are restricted to large lakes due to its low spatial resolution on the order of kilometers.
Addressing the spatial resolution limitation of PMW, synthetic aperture radar (SAR) observations can be acquired without solar illumination, but at a much higher spatial resolution due to the synthesizing of a longer antenna using Doppler principles. SAR has a spatial resolution comparable to optical systems (5 m to 250 m) with the same spatial versus temporal resolution tradeoff. Several studies have investigated the efficacy of ice phenology retrieval using various frequencies, most commonly at X- [14] and C-bands, [15,16,17,18,19,20,21]. Identifying the specific timing of FO and WCI is difficult across these wavelengths because observations acquired at moderate-incidence angles (e.g., 20–40 degrees) often present high backscatter for wind-roughened open water that can be misidentified as ice [19,22]. The lower temporal resolution of typical active microwave sensors (24 days for Radarsat-2, 8 days commonly for Radarsat Constellation Mission in winter standard coverage) also increases uncertainty for the retrieved timing of WCI, with the exception of high-Arctic polar regions where sun-synchronous overlaps of SAR constellations (e.g., Sentinel-1A/B/C, Radarsat Constellation Mission) result in near-daily acquisitions [19].
The recent launch of SWOT and the onboard Ka-band Radar Interferometer (KaRIn) (35.75 GHz) possesses both the advantages of passive and active microwave sensors while also addressing their shortcomings [23]. Like PMW sensors, the calibration/validation “fast sampling” phase during SWOT’s spin up to the science phase of data collection acquired daily KaRIn data for select swaths. Concurrently, KaRIn’s bi-static orientation produces vector-based point data (e.g., the pixel cloud) of backscattered intensity and phase, generating surface elevation at a spatial resolution of 5–10 m and 15–25 m in the along- and cross-track directions, respectively, addressing the passive microwave low spatial resolution limitation. Additionally, KaRIn is acquired at 35.75 GHz, the wavelength commonly used by PMW freshwater ice phenology and ice cover fraction retrieval algorithms [24]. KaRIn uses near-nadir (0.6–4°) incidence angles, showing sensitivity to the presence of ice cover, reducing backscatter by approximately 10 dB lower than for open water while retaining coherence in both scenarios [25]. The objectives of this study are to (1) explore the behavior of KaRIn backscatter during the ice-covered to open-water transition during the fast sampling phase of the SWOT satellite in Spring 2023, and (2) apply and evaluate a threshold-based backscatter tracking algorithm, the Dynamic Threshold Variability Method (DTVM), to retrieve the timing of water-clear-of-ice at a 100 m spatial resolution, using high resolution optical acquisitions for evaluation and thermodynamic lake ice model simulations for additional comparison. This study is among the first to apply KaRIn acquisitions for the retrieval of freshwater lake ice cover and tracking the timing of WCI.
2. Materials and Methods
2.1. Study Site
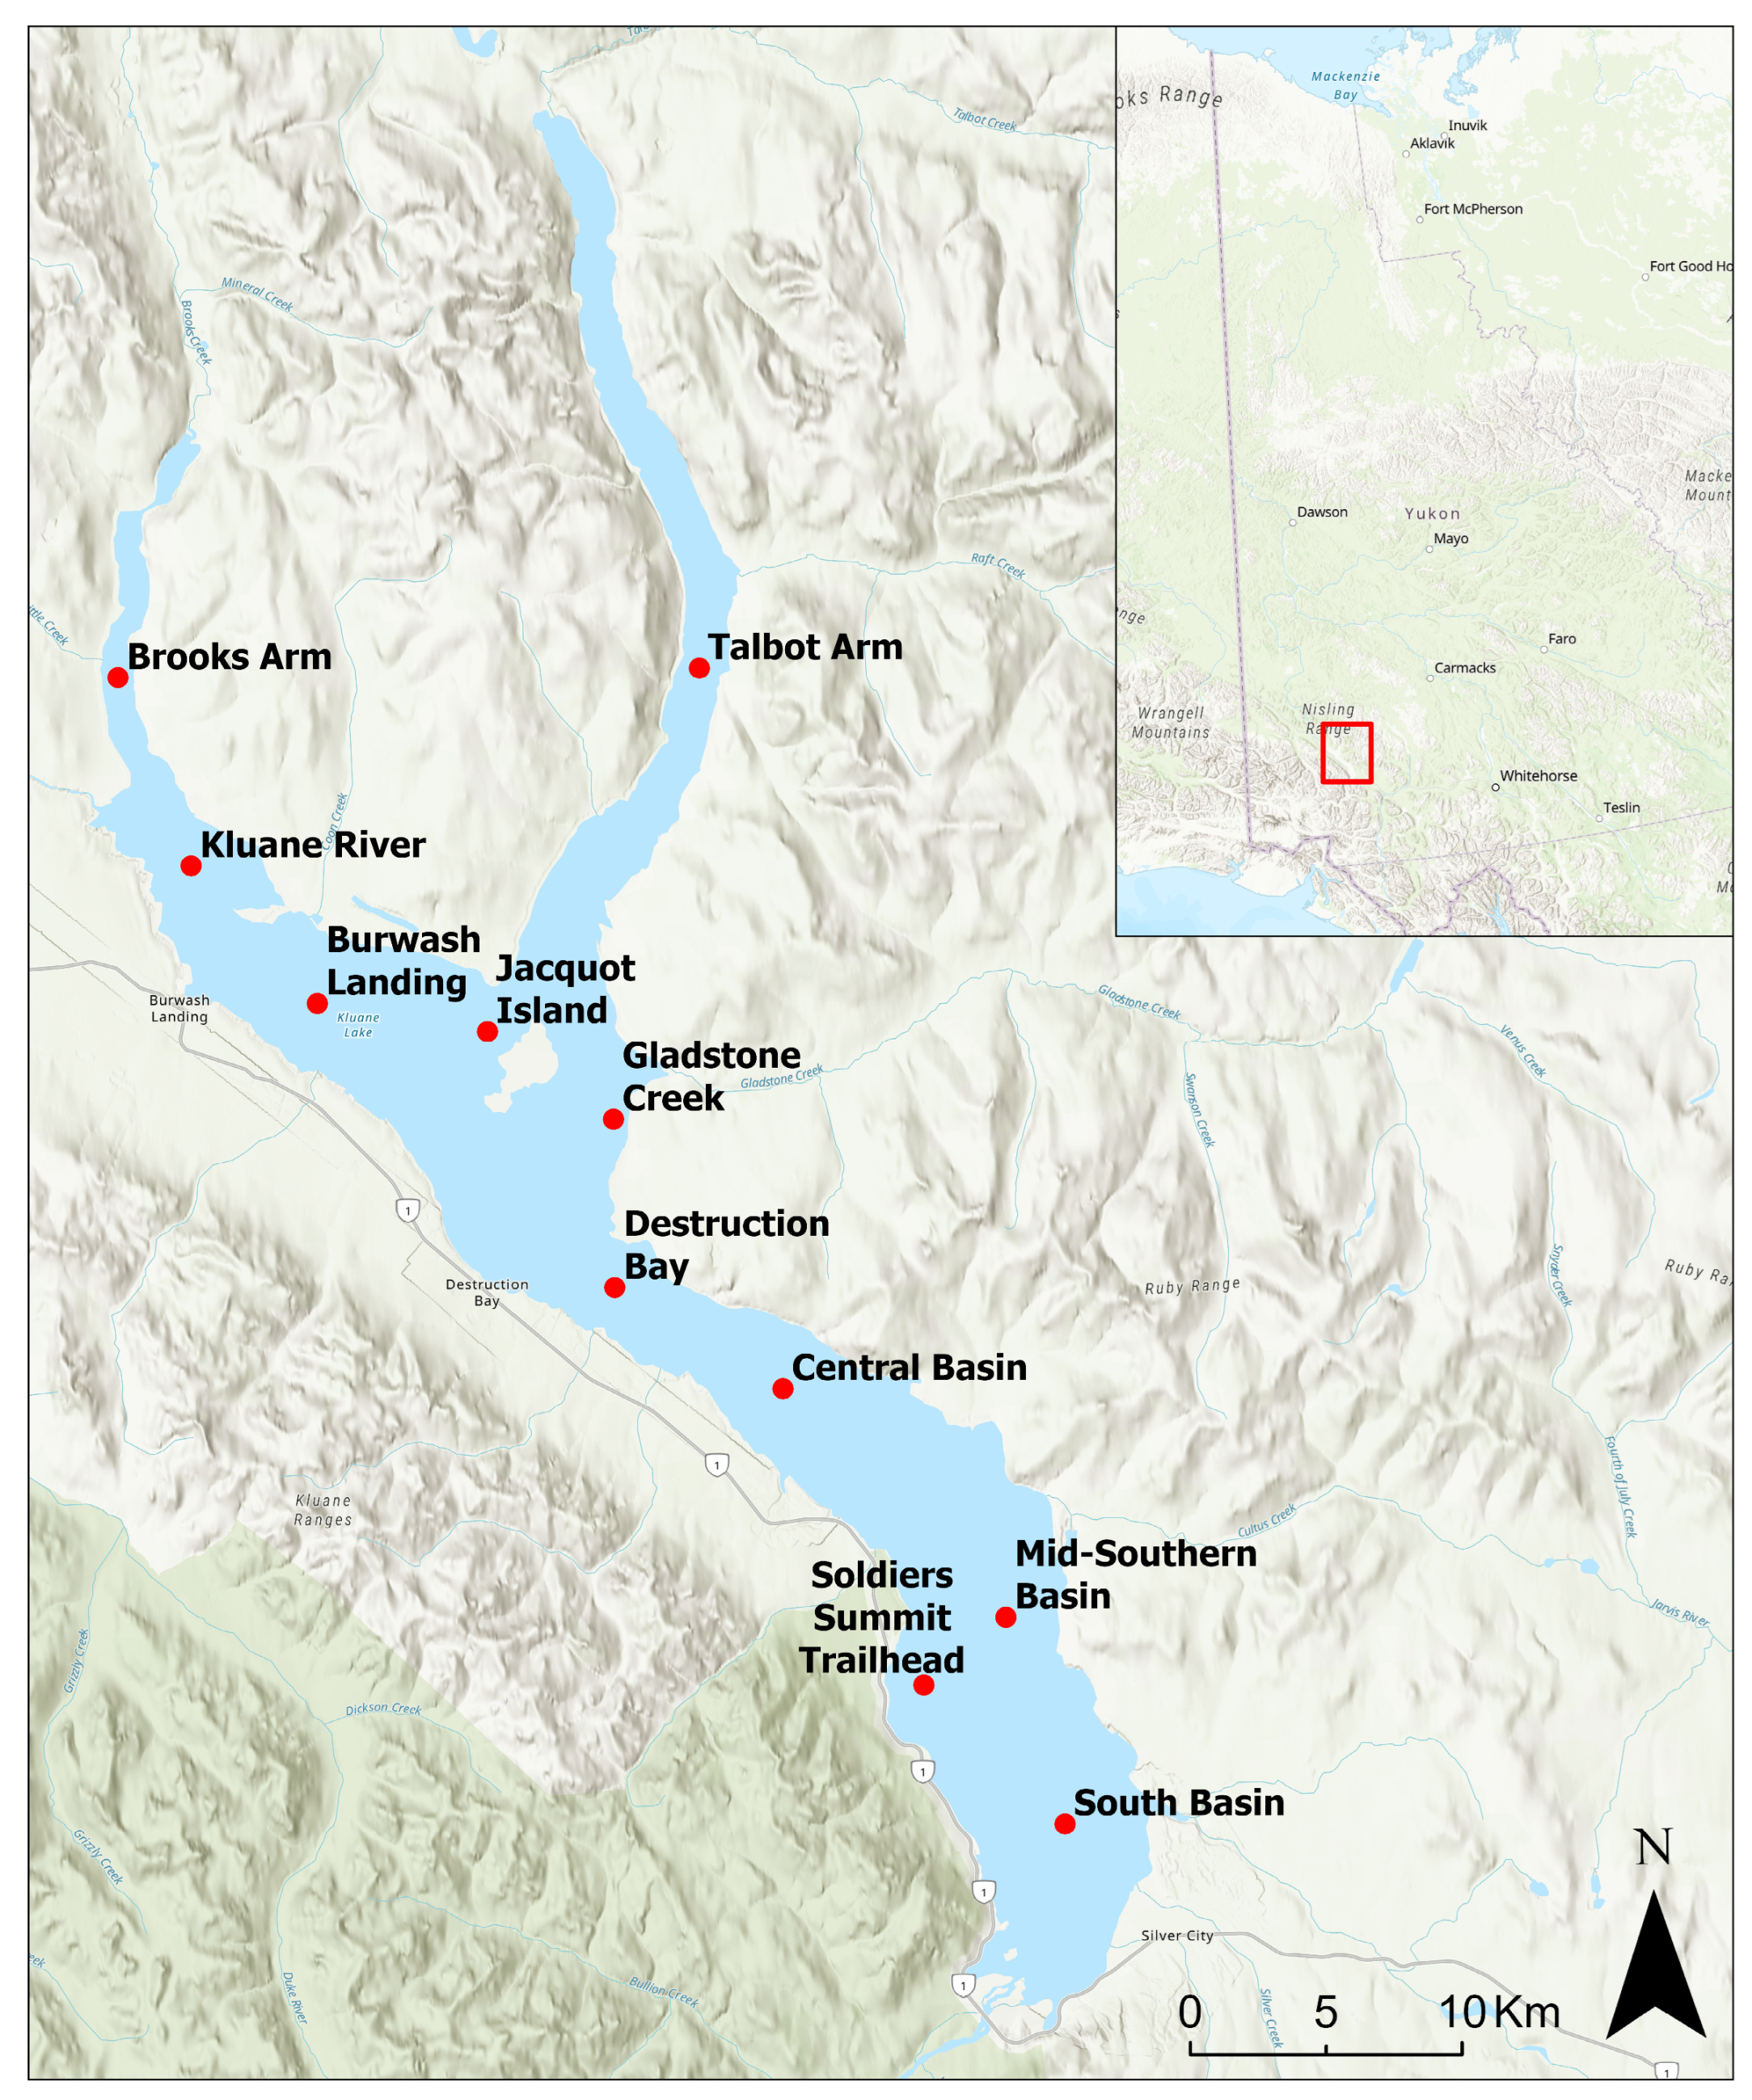
The study site for assessment of the retrieval of WCI using SWOT is Lhù’ààn Mǟn (Kluane Lake), the largest lake in Yukon, Canada (61°14′N, 138°40′W), located in the southwestern portion of the Territory at the foot of the St. Elias Mountains in its rain shadow. The lake is situated within the traditional territories of the Kluane First Nation and White River First Nation and sits on the border of Champagne and Aishihik First Nations (Figure 1). For the local community, the lake provides access for cultural activities and fishing, and in the winter the lake ice provides travel access to trapping lines, hunting grounds, cabins and businesses for the local citizens [26,27].
The region surrounding Kluane Lake is typified by a semi-arid continental climate with winter average temperatures of −15.4 °C and summer average temperatures of 12.1 °C according to the 1991–2020 normals from the Haines Junction weather station (WMO ID: 71505, accessed from https://climate.weather.gc.ca/climate_normals on 1 May 2026; Environment and Climate Change Canada, 2026). Precipitation in the region in summer averages 170–200 mm and winter snowfall averages 0.25–0.60 m; however, the strong southerly katabatic winds off the Kaskawulsh glacier redistributes snow on Kluane Lake, with several sections exhibiting exposed ice throughout the winter season [28]. According to the 1966–1996 normal, Kluane Lake freezes approximately 23rd of November, ranging from 6 November–6 December, and exhibits WCI approximately 7 June, ranging from 25 May–20 June, with an average maximum ice thickness of 1.3 m [29]. Apart from temperature variability, the orientation of Kluane Lake and bathymetry (where the northern and southern basins are shallower and deeper, respectively) result in a range of FO and MO dates, with the southern basin commonly freezing up to a month later than the north.
Figure 1.
Lhù’ààn Mǟn (Kluane Lake) (61°14′N, 138°40′W) located 260 km northwest of Whitehorse in Yukon Territory in the traditional territory of Kluane First Nation and White River First Nation, and borders the Champagne and Aishihik First Nation. Points of Interest (POI) (red points) for backscatter observation are distributed in a latitudinal gradient on the lake.
2.2. Data
2.2.1. Surface Water Ocean Topography (SWOT)
The Surface Water Ocean Topography (SWOT) mission was launched in 2022, led by the National Aeronautics and Space Administration (NASA), Centre National d’Etudes Spatiales (CNES), with components provided by the Canadian Space Agency (CSA) and the UK Space Agency (UKSA). Onboard SWOT is KaRIn, an innovative near-nadir (0.6–4° incidence angle) interferometric synthetic aperture radar (InSAR) [30]. While the main objective of the KaRIn sensor is to retrieve surface water elevation of inland water bodies, the pixel cloud product has been shown to be sensitive to ice-covered regions, presenting a contrasting backscatter regime to open water [25].
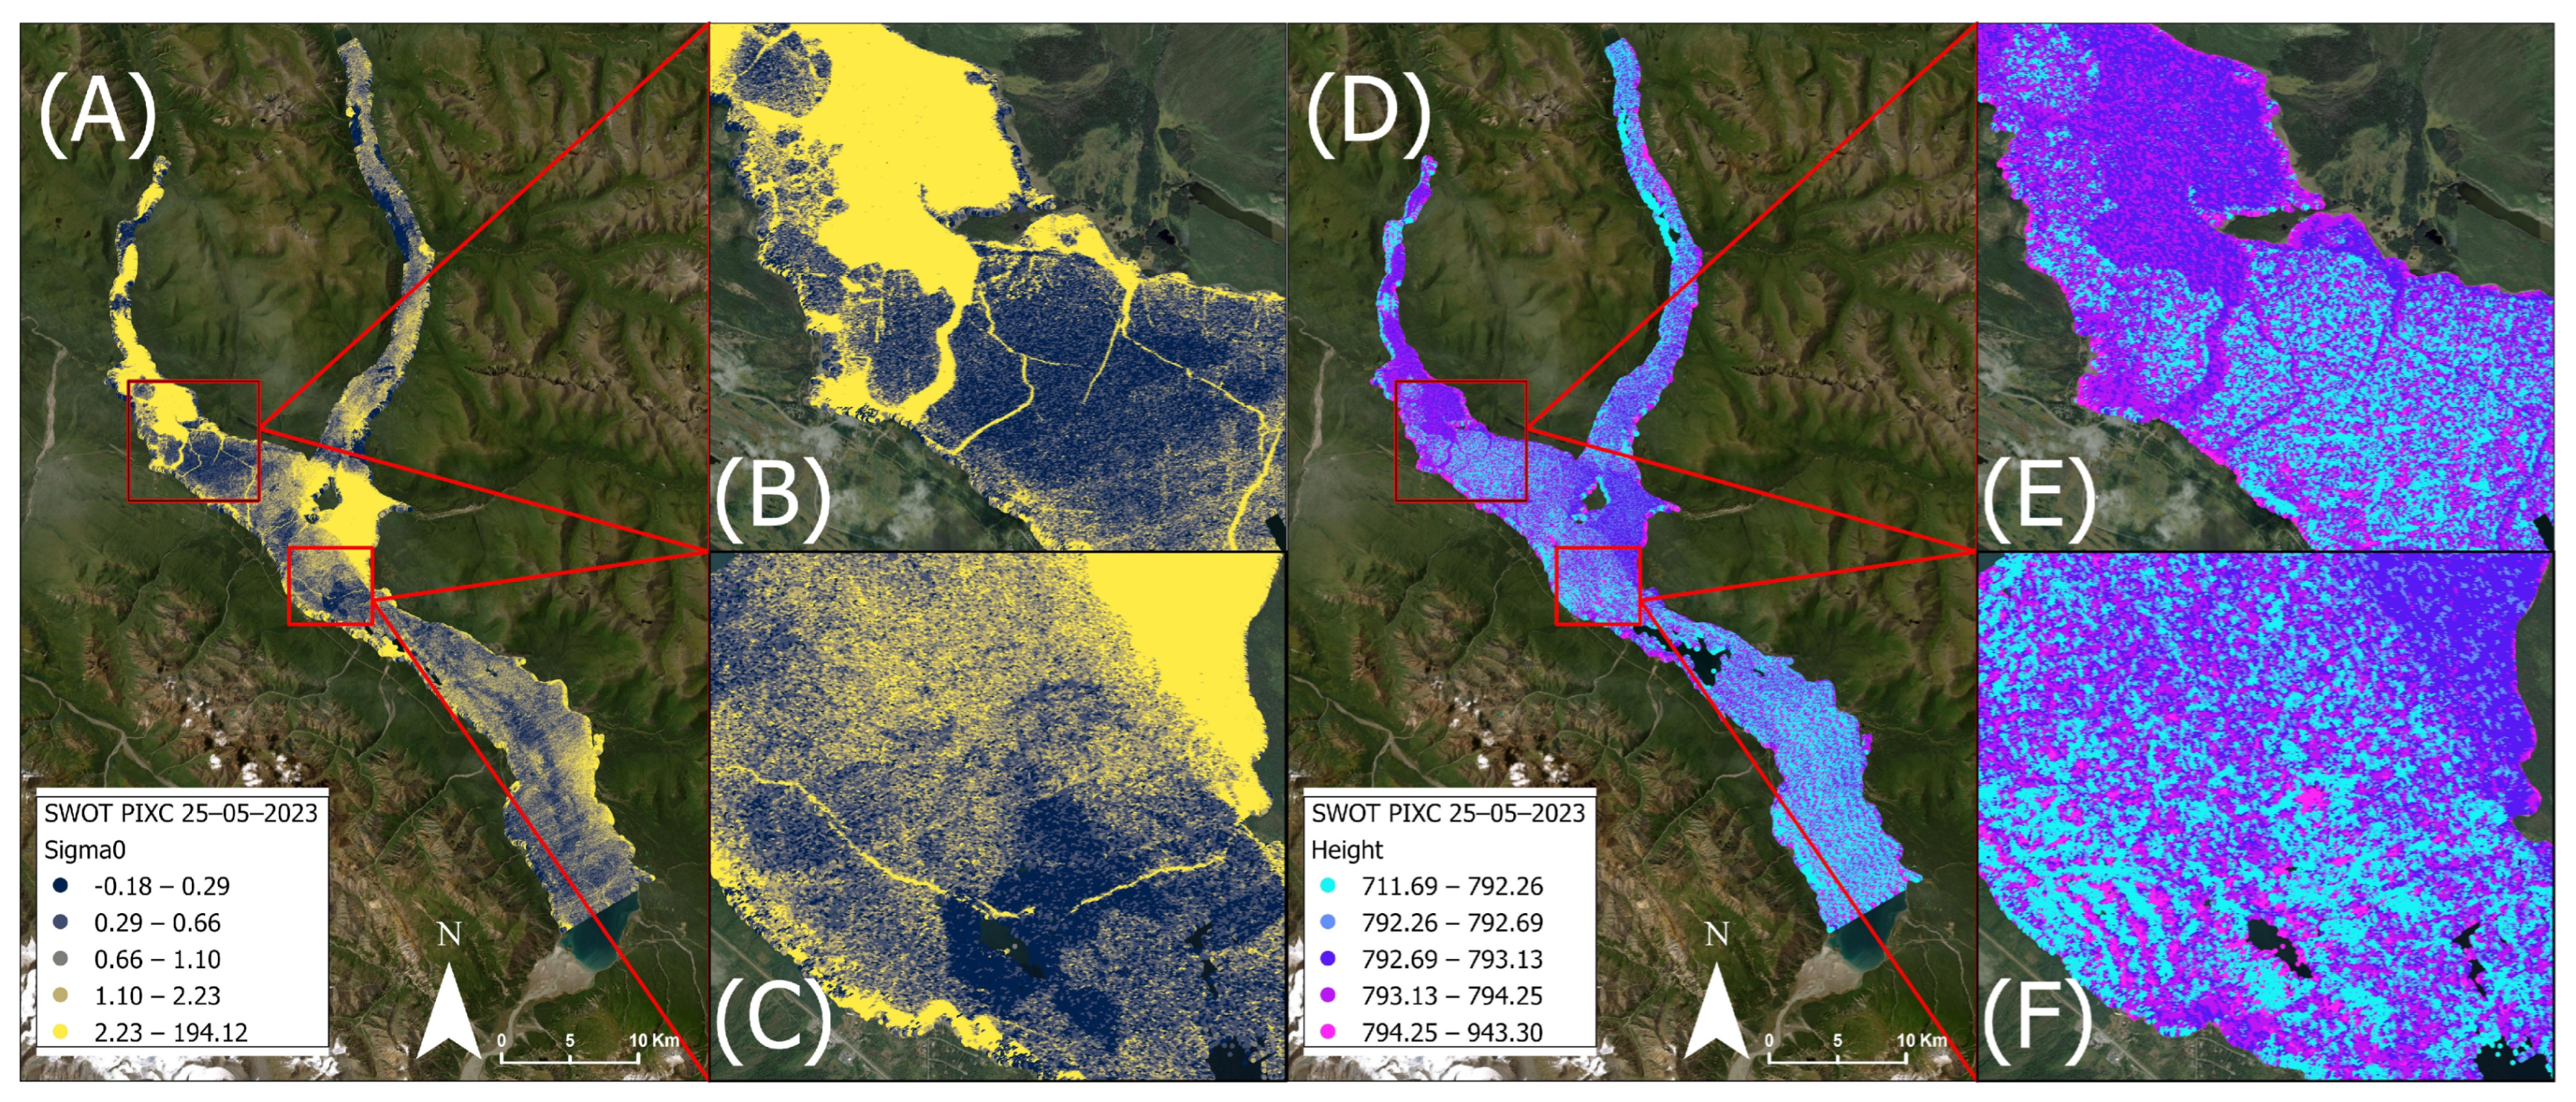
A time series of daily KaRIn acquisitions from the SWOT satellite are utilized in this analysis. This study utilizes the water mask pixel cloud product Version D (SWOT_L2_HR_PIXC_D, 10.5067/SWOT-PIXC-D) acquired during the calibration/validation fast sampling phase (Pass 026, Tile 045R), providing daily observations from 29 March 2023 to 10 July 2023 (n = 99) (downloaded from NASA PODAAC (https://podaac.jpl.nasa.gov/dataset/SWOT_L2_HR_PIXC_D, URL accessed on 15 August 2025)) [31]. The parameters extracted from the NETCDF-4 files are backscatter (“sig0”), surface elevation (“height”), incidence angle (“inc”), phase noise standard deviation (“phase_noise_std”), and pixel quality flag (“classification”, which provides the user with reliable open-water detection, but for ice-covered regions is commonly classified as “dark water”). The spatial resolution of the product is ~5–10 m along track and ~15–25 m cross-track. Observations within the tile were clipped by a 50 m inward buffer of Kluane Lake’s shoreline to ensure no mixed pixel effects from the surrounding dense spruce forest. KaRIn backscatter and surface elevation for Kluane Lake are shown in Figure 2. There is a gap in the SWOT acquisitions from 19 May 2023 to 22 May 2023 associated with a single event, an upset of the solid state recorder according to the SWOT significant event log available at https://podaac.jpl.nasa.gov/SWOT-events/SWOT_events.html (URL accessed 1 October 2025).
The incidence angle range for Pass 026, Tile 045R on Kluane Lake extended in the across-track longitudinally. Across this incidence angle range the backscatter is more stable for ice-covered observations, and more pronounced for when observing open water. To evaluate the effect of incidence angle on backscatter, a multiple linear regression analysis was performed for ice-covered (4 April 2023) and open-water (2 June 2023) acquisitions with backscatter and longitude as dependent variables. For the ice-covered period, the slope of backscatter is 1.62 dB/degree with a 95% confidence interval of 1.58 to 1.66/degree (n = 896,619 points), and −6.34 dB/degree with a 95% confidence interval of −6.53 to −6.14 dB/degree for open water (n = 893,460 points). For the range in incidence angles observed on Kluane Lake (2.13 degrees), the corresponding effects in backscatter as a function of incidence angle are 3.4 dB and 11.2 dB for ice-covered and open water, respectively. However, incidence angle normalization is not applied in this analysis because the DTVM is applied for individual tessellated pixels across the range of acquisition dates, where incidence angles remain consistent throughout the analysis period per pixel. The method does not reference values from other pixels in the dataset, and is therefore not sensitive to changes in the backscatter due to incidence angle effects. The application of this method allows for limited preprocessing to observe intra-lake WCI locations.
SWOT heights are provided from the NETCDF as the interferometric height above the WGS84 reference ellipsoid, and has been corrected to orthometric heights above the 2013 Canadian Geodetic Vertical Datum (CGVD) using the Canadian Gravimetric Geoid (CGG) 2013a grid. The average translation in separation from the WGS84 ellipsoid to the CGG2013a geoid for the Kluane Lake region is −12.58 m.
Figure 2.
Example of SWOT PIXC product for backscatter (A–C) and surface elevation (D–F) for 25 May 2023 during ice break-up on Kluane Lake. (B,C) show that areas of open water exhibit higher backscatter than regions that are ice-covered, but melting. Surface elevation (E,F) showcase generally higher surface elevation for open water, with a great degree of variability (albeit lower elevation) for ice-covered regions, with striping features oscillating between high and low elevations.
2.2.2. PlanetScope Optical Data
PlanetScope analytic 8-band harmonized imagery collected over Kluane Lake are calibrated and orthorectified to provide optical surface reflectance to be used in quantitative analysis (Figure 3). A total of 10 scenes were downloaded from the Planet Explorer archive between the period of 7 May 2023 to 30 May 2023 (Table 1). While daily scenes were available, surface melt and evaporation in the spring resulted in many cloudy days obscuring the ice surface greater than 25% of the overall image extent and were subsequently not included in the analysis. Of the PlanetScope imager listed in Table 1, clouds do not obscure the POIs on Kluane Lake with the exception of POI 6 (Gladstone Creek) on 20 May 2023. The spatial resolution of the imagery is 3 × 3 m, and used to evaluate the thermal status of the lake surface, whether open water is present or absent. PlanetScope’s 8-band imagery covers the range of coastal blue to near-infrared wavelengths, from 431 to 885 nm. The scaling factor of 0.0001 was applied to convert the digital number to surface reflectance. All PlanetScope pixels within the 100 m radius buffer of each of the POIs were extracted and aggregated to preserve the original spatial resolution and extent of the data, obtaining median surface reflectance values used to determine the timing of open-water occurrence coincident to SWOT-derived observations.
Figure 3.
Examples of PlanetScope data during the melt period for Kluane Lake. Panels (A–C) were acquired on 16 May 2023, and panels (D–F) on 26 May 2023. Panels (B,E) exhibit the region surrounding Burwash Landing and the Kluane River, the outflow of the lake and shallowest region, resulting in early melt and first presence of open water. Panels (C,F) showcases the general flow of the lake during advanced melt, with remnant ice pans moving towards the Kluane River. Imagery © 2023 Planet Labs PBC.
Table 1.
Date and UDM2 metadata of PlanetScope acquisitions used in the analysis to assess the timing of melt on Kluane Lake. * 20 May 2023 and 26 May 2023 have the highest cloud covers of the scenes acquired and are included for posterity to have observations between 20 May 2023 and 30 May 2023. The high cloud cover fraction and associated cloud shadow resulted in anomalous reflectance masked as less snow/ice presence compared to reality.
2.2.3. Weather Data for Ice Simulation Input and Wind Analysis
Meteorological data required to run the thermodynamic ice model are sourced from the automated weather station located adjacent to the Kluane Lake Research Station (KLRS), situated on the southeast shoreline of the lake along the Silver City airstrip (61.02759°N, 138.41045°W) (Table 2). Input data, including air temperature, relative humidity, and wind speed were downloaded from the KLRS weather station for 1 January 2020 to 1 January 2024 to simulate the 2022–23 winter season because the model needs at minimum one calendar year to simulate lake temperature profiles that would be present in Fall of 2022. Gaps in the data were filled using the European Centre for Medium-Range Weather Forecast (ECMWF) Reanalysis 5th Generation (ERA-5) product, which assimilates meteorological observations with satellite and weather station data to provide gridded hourly estimates of meteorological variables which were averaged to daily values. Inputs unavailable from KLRS (e.g., cloud cover) were directly downloaded from ERA-5 to be used as input to CLIMo. Dry and wet snow densities were set at 300 and 450 kg/m3 according to in situ data collection in March 2023 prior to SWOT overpasses, and the lake mixing depth was calculated and set at 13 m based on area and bathymetry information and calculations provided by [32].
Table 2.
Inputs to the CLIMo model and sources of data used for gap-filling when the KLRS weather station did not collect observations.
The basis for the SWOT observation of open water hinges on signal backscatter from wind-roughened water, with at minimum 3 m s−1 required to produce signal sensitivity [33]. The veracity of the DTVM method to retrieve WCI relies on the ability to discriminate between melting ice and open water, and not mistakenly identify high-wind events for WCI during the melt season. Daily average wind speed data from the Burwash Landing Airport (61.370°, −139.032°) is extracted from Environment and Climate Change Canada’s Historical Data portal (WMO ID: 71001, accessed https://climate.weather.gc.ca/historical_data/search_historic_data_e.html on 1 May 2026), and is analyzed against the number of dates with DTVM WCI flags to determine the potential influence of wind as a confounding factor to WCI retrievals. The Burwash Landing weather station was used for comparison because the KLRS weather station did not have complete coverage of daily wind observations in the open water season later than 15 June 2023.
2.3. Methods
The overall processing chain of data curation, preparation, processing, and evaluation of the SWOT PIXC product to retrieve WCI during the fast sampling phase is provided in Figure 4.
Figure 4.
Process flow diagram of SWOT PIXC Version D acquisitions from the fast sampling phase, the datasets compared against DTVM-retrieved WCI timing (e.g., PlanetScope and Canadian Lake Ice Model). The calibration, processing and evaluation of the methods are detailed in Section 2.3.
2.3.1. SWOT Data Preparation
A total of eleven locations across the lake are identified as Points of Interest (POI) to observe changes in backscatter prior to and during the melt season, with the name and reason for each location provided in Table 3.
Table 3.
Points of Interest (sites) on Kluane Lake and their associated reason for observation during the time-series of SWOT data.
Point values for backscatter (σ0), derived standard deviation of backscatter, and median of surface elevation (height) are extracted from the SWOT KaRIn acquisitions from the PIXC point cloud product within each 100 m cell for each daily acquisition and provided as a time series during SWOT’s fast sampling phase. Backscatter is used as input in the DTVM retrievals, while surface elevation is provided to showcase its behavior during ice melt and WCI. Boxplots representing the range of values observed for all POIs are shown in Figure 5. Active microwave studies observing ice phenology relate substantial changes in backscatter (typically a drop) with the presence of increased moisture within the snowpack which increases the absorption of the incoming microwave signal [19]. Sustained positive daily temperatures at KLRS are observed starting on 27 April 2023. The most pronounced shifts during the melt and WCI season are observed in the standard deviation of backscatter and pixel cloud product classification flags (Figure 5A,C). The shifts are not observed to be associated with the timing of sustained above-freezing daily air temperatures, which exhibits an approximate 1–2 dB drop. Rather, the pronounced shift in backscatter dynamics is observed as an increase in backscatter appearing to coincide with the timing of the location being WCI (standard deviation and median increases of 10 and 20 dB, respectively). From 18 May 2023 to 26 May 2023, the points classified as “dark water” (Class 5) flip with “open water” (Class 4) as ice disappears and open water emerges (Figure 5C). The evaluation of this supposition is presented in Section 3, but this result is presented here to provide the basis of the tracking of WCI through the use of the Dynamic Threshold Variability Method (DTVM). All processing of SWOT netcdf data and application of the DTVM was performed using Python version 3.11.16.
Figure 5.
(A) Average daily air temperature (KLRS), daily wind speed (Burwash Landing) and standard deviation of backscatter observed, and (B) distribution of height values at the 100 m buffer of the POIs. The increase in standard deviation associated with the increase in the proportion of open water starts on 23 May 2023. The increase in air temperature above 0 °C does not correspond with an immediate increase in backscatter standard deviation. The PIXC point classification frequency is provided in (C), showcasing the misclassification of frozen regions as dark water prior to increase in backscatter standard deviation, coinciding with WCI.
2.3.2. Lake-Wide Water-Clear-of-Ice Retrieval
Two square-tessellated polygon shapefiles were generated at 100 m and 500 m spatial resolutions, projected in UTM zone 7 N: 100 m tessellation to emulate the SWOT Level 2 KaRIn High Rate Raster Product (SWOT_L2_HR_Raster_D), and 500 m for computational efficiency and to compare the lake-wide outputs. To assess the intra-lake timing of WCI, the pixel cloud point data within each of the 100 m and 500 m tessellated polygons were clipped for each SWOT acquisition. The standard deviation of backscatter for each acquisition was extracted from the points within each tessellated cell and appended to the table, producing a shapefile with a daily time series of backscatter variability at 100 and 500 m resolutions.
2.3.3. Dynamic Threshold Variability Method
For each tessellation cell, the Dynamic Threshold Variability Method (DTVM) is followed to track changes in backscatter between acquisitions to retrieve the timing of WCI. DTVM has been chosen to identify WCI in Kluane Lake because it has been applied to diurnal passive microwave brightness temperature time series at 37 GHz, similar to SWOT’s daily 35 GHz KaRIn acquisitions during the fast sampling phase to retrieve the timing of melt from data that has considerable variability [34,35]. Typical melt onset (MO) studies incorporate a threshold as the signifier of melt onset [17,18,19,36]. The DTVM avoids fixed thresholds by using a range of thresholds to identify the timing of melt from a series of potential melt dates combined with statistical information about the range of dates that exceed the assigned threshold. The DTVM has been demonstrated to be adept at detecting phase changes in the observed medium where slight deviations in diurnal values represent the timing of melt [35]. In SWOT data, the backscatter variability increases slightly when ice is breaking up and then large increases lag behind WCI, making the DTVM suited for this application.
For medium-sized lakes, an algorithm that incorporates multiple WCI dates is crucial because moving ice pans can result in a pixel being clear of ice one day and ice-covered the next due to floating ice following wind or water currents. Essentially, the DTVM is designed to describe when the data within a time series begins to behave differently, in this case shifting from a frozen to an open waterbody. As discussed in [35], the DTVM is processed over a time series of data, whether passive or active microwave through five main steps:
- A time series of backscatter variability (standard deviation) is calculated within a 100 and 500 m pixel tessellated across Kluane Lake.
- A total of 500 thresholds is calculated between 2.5% to 95% of the maximum variability observed within the time series. Variability endpoints of 2.5% and 95% are used to reduce the influence of extreme noise within the observed standard deviation of backscatter for open water.
- For each threshold created in Step 2, the time series of backscatter variability is scanned to identify potential WCI dates where the standard deviation exceeds each threshold.
- The interquartile range (IQR) between the 25th and 75th percentiles of potential WCI dates is calculated. The range of the IQR determines the confidence level for the WCI retrieval where small IQR indicates that the WCI date is distinct within the time series, and vice versa. A large IQR is interpreted as a time series where the backscatter standard deviation exceeds then drops below the observed threshold multiple times, obscuring the true WCI date.
- The dates corresponding to the 25th, 50th and 75th percentiles are extracted as potential WCI dates from the IQR.
The DTVM is run for each polygon in Kluane Lake for both the 100 m and 500 m tessellations to produce a map showing the intra-lake WCI variability for SWOT fast sampling phase during the Cal/Val period from 29 March 2023 to 10 July 2023. A visual representation of the application of the DTVM is provided in Figure 6, where the green horizontal lines represent the 500 threshold values obtained for the SWOT backscatter, the blue vertical lines represent the timing of thresholds being crossed, and the red vertical line being the retrieved WCI date for an individual pixel. For this analysis, the WCI date tracking start date is DOY 91 (1 April 2023), with the IQR maximum of 25 days.
Figure 6.
Backscatter standard deviation for pixel located near Burwash Landing (61.361°N, 138.827°W) processed by the DTVM. (a) shows the time series for the entire Cal/Val period. The horizontal green lines represent the series of thresholds, the blue vertical lines represent the dates at which thresholds are hit, and the red vertical line marks the 25th percentile of the distribution of candidate WCI dates ((b) histogram), which is taken as the retrieved WCI date. The histogram in the lower panel shows the 500 potential WCI dates, and the red shaded regions represent the interquartile range (modified from [35] using SWOT data).
2.3.4. Evaluation of DTVM: PlanetScope
WCI dates are extracted from PlanetScope surface reflectance from the blue and green bands combined with the Normalized Difference Vegetation Index (NDVI), calculated through
where RNIR and RRED are the surface reflectance for near-infrared light (band 8) and red light (band 6), respectively. NDVI values range from −1 to 1. Reflectance is extracted for a 100 m radius buffer surrounding each POI, consistent with the polygon size and location used to extract backscatter when applying the DTVM to SWOT PIXC data. The POI is considered to be open water when the time series for the median of both the blue and green reflectance is less than 0.05 and the median NDVI is greater than −0.05 (n = 3486 pixels), consistent with thresholds applied for surface water extent extraction using PlanetScope reflectance [6]. The green and blue reflectance as well as the NDVI time series are shown in Figure 7 to highlight the characteristic drop in reflectance associated with open water exposure, and an increase in NDVI as red and near-infrared reflectance equalize with ice disappearance.
Figure 7.
Blue and green reflectance (A,C) and derived NDVI (B,D) time series extracted from 8-band PlanetScope acquisitions during the transition from melting ice to WCI during the study period, with the thresholds for open water provided as the red hashed line. POIs 1–6 are presented in (A,B), showcasing sites located in the northern portion of the lake where sites become WCI earlier than POIs 7–11 located in the central and southern basins, shown in (C,D), to be able to clearly denote differences in reflectance patterns among POIs. Note: High reflectance values for POI 6 on 20 May 2023 are the result of cloud cover contamination consistent with high cloud concentration reported in the metadata (Table 1).
The PlanetScope-derived WCI date for each POI is defined as the first cloud-free observation where the reflectance thresholds indicate open-water conditions. The difference in days between DTVM-derived WCI and PlanetScope-derived WCI are calculated to evaluate the performance of the DTVM, where positive values indicate that the DTVM retrieved a later date than observed by Planetscope, while negative values indicate an earlier DTVM-derived date. Mean Absolute Error (MAE) and Mean Bias Error (MBE) are calculated from the differences in the WCI dates, and Root Mean Square Error (RMSE) from the squared differences across the POIs.
Despite near-daily PlanetScope acquisitions, cloud cover resulted in multi-day gaps between the last ice-covered observation and the first day with open water; therefore, the exact WCI could not always be observed. The true WCI is assumed to occur within the interval between the clear sky acquisitions of the last-ice and first open-water observation. PlanetScope-derived WCI should therefore be interpreted as the earliest confirmation of open water rather than the exact date of transition between ice cover and WCI. Since PlanetScope data is interval-censored (i.e., has gaps in the acquisition record), interval-aware logic is used; if the derived DTVM date falls between the day following the last-ice observation and the next date where open water is observed, the error is assumed to be consistent with the gap in observations and assigned an error value of 0 days. Within the PlanetScope observation gap the true error is unknown and cannot be demonstrated to be earlier, later, or exactly the same as the DTVM.
To quantify the 95% confidence intervals for MAE and RMSE, a nonparametric bootstrap is applied to the retrieved WCI error values [37]. Samples of all possible unique combinations are generated using the observed WCI error distribution retrieved from the POI. The RMSE and MAE are computed for each bootstrap run, using the 2.5 and 97.5th percentiles of the output distributions to identify the 95% confidence intervals. Since the POIs are located on the same lake during the same break-up event, the 95% confidence intervals are analogous to uncertainty among sampling locations as opposed to independent ice break-up events.
The POI provides a detailed snapshot of PlanetScope reflectance, but to assess the accuracy of the DTVM percentile selection across the lake at the spatial scale of the tessellations, an interval-aware assessment of the DTVM-retrieved WCI is performed. The timing of WCI conditions are identified using the same thresholds for NDVI and blue and green surface reflectance, which are then aggregated to the 100 m and 500 m tessellation spatial resolutions calculating the number of pixels classified as open water within each cell. Once a proportion of 0.9 of PlanetScope pixels are classified as open water in the cell, it is identified as WCI, following criterion established in [38]. As with the POI, since the true timing of WCI is assumed to occur between the last ice-covered observation and the first open water, WCI is represented with final outputs of the interval between the date of the final observation that is classified as ice, and the date of first observation classified as WCI.
The PlanetScope interval-aware WCI dates are compared to the 25th, 50th, and 75th percentile WCI-retrieved candidate dates. For DTVM WCI dates that fall within the interval-aware period (between last-ice and first open water) are assigned an error of 0. Dates before or after the interval are calculated equivalent to the number of days outside of the first or last dates in the interval boundaries, and assessed using the MAE and RMSE.
2.3.5. Comparison to Canadian Lake Ice Model-Derived WCI
The Canadian Lake Ice Model (CLIMo) is a one-dimensional thermodynamic model that has been used extensively in sub-Arctic and Arctic regions to simulate the timing of ice phenological events and overall ice thickness [15,39,40,41,42,43]. For Kluane Lake, the timing of FO, MO, and WCI are simulated for the 2022–2023 winter season. A full description of the model is provided in [40], which is based on the one-dimensional heat conduction equation that allows for the penetration of solar radiation [44]:
where ρ is density (kg m−3), Cp is the specific heat capacity, T is the temperature (K), t is time (s), z is the vertical coordinate (m), FSW is the downwelling, shortwave heat fluxes in Wm−2, I0 is the fraction of shortwave radiation flux that penetrates the surface, α is the surface albedo, and K is the bulk extinction coefficient.
The portion of the model relevant to the timing of FO and MO is the surface energy budget that incorporates the mixing depth of the lake, because CLIMo is run for all seasons to simulate the temperature gradient of the lake when temperatures begin to drop in the fall. The surface energy budget in CLIMo that incorporates the mixing depth is provided by:
where ρw is the water density (1000 kg m−3), Cpw is the specific heat capacity of pure water, dmix is the effective mixed layer depth (m), Tmix is the lake mixed layer temperature (K), and F0 is the net heat flux absorbed at the surface.
CLIMo is run for a series of snow cover scenarios representing a proportion of the snow observed on terrestrial weather stations. Snow on lakes is typically a fraction of snow on land compared to where the meteorological station data collected measurements [43]. Sub-arctic studies running CLIMo typically assume a fractional snow input of 50–60% of the snow observed on land [43,45]. Kluane Lake is unique in that it is situated at the base of the Kaskawulsh glacier, resulting in sustained windy weather caused by katabatic winds, often resulting in wind-induced dust storms and plumes [46]. In winter, these winds redistribute snowfall off the ice more efficiently, resulting in predominantly bare ice. Therefore, CLIMo has been run with 0%, 20%, 50%, and 100% snow cover scenarios. The 0 and 100% snowfall scenarios represent the plausibility range of LIT and WCI dates that could possibly be present based on the thermodynamic envelope.
CLIMo is forced using weather data collected from a combination of data sources according to their availability and run from January 2020 to spin up a full annual cycle of lake ice simulation prior to the target of 2022–23 to precondition the vertical thermal structure of the lake. Air temperature, humidity, precipitation, and wind speed are obtained from the Kluane Lake Research Station. Cloud cover fraction, a value not commonly observed at automated weather stations, was collected from ERA-5. Fixed inputs to CLIMo are mixing depth (10 m) as the basin average over the summer turnover period, dry and wet snow densities (300 and 450 kg m−3, respectively), and latitude (61.2°).
2.3.6. Wind Influence on DTVM WCI Detection
To determine if the DTVM WCI threshold crossing flags occurred as a result of high-wind events or if the wind is concentrated within the likely break-up to WCI transition period, daily average wind speed at the Burwash Landing Airport automated weather station is compared against the derived 50th percentile threshold crossing dates for each 100 m tessellated cell identified during step 4 of DTVM, described in Section 2.3.2. A comparison was conducted separately for the three distinct periods during the fast sampling phase as defined by the plausible WCI dates simulated by CLIMo: pre break-up (prior to 20 May 2023), the transition period between break-up and WCI (21 May 2023 to 1 June 2023), and post-WCI (2 June 2023 to 11 July 2023). Pearson correlation analysis was applied to quantify the relationships between daily wind speed and number of cross dates within the tessellation for each period, and a Kruskal–Wallis test was applied to compare differences in the proportion of WCI threshold flags during each period.
3. Results
3.1. SWOT Backscatter at Points of Interest
Figure 8 shows the backscatter standard deviation for each of the Points of Interest (n = 11) during melt and into WCI. For all sites prior to WCI, the backscatter variability is below 5 dB, but once open water is visible to SWOT, the backscatter variability increases to values greater than 10 and exceeding 20 dB. Site 3 (Kluane River) is the first site to exhibit high backscatter standard deviation on 23 May 2023. The Kluane River outlet is the region of the shallowest water depths of approximately 2 m compared to up to 70 m in the southern basin [27]. Figure 8 splits the Points of Interest up into northern and southern sites for clarity and similar break-up characteristics. The north basin of the lake exhibits melt earlier (POI 1–6), which may be attributed to its shallower depth and Kluane river outlet resulting in greater circulation. Of the sites in the northern basin, POI 1 and 4 (Talbot Arm and Burwash Landing) backscatter does not increase until 27 May 2023, when a stark increase of 25 and 7 dB is observed, respectively. POIs 2, 5, and 6 (Brooks Arm, Jacquot island and Gladstone Creek) exhibit increases in backscatter variability on 25 May 2023. In Figure 8B, the first POI to increase is the northernmost (POI 7, Destruction Bay), located off the coast of the town of Destruction Bay on 26 May 2023. For the next three POIs south of Destruction Bay (POI 8–10, central basin, mid-southern basin, and Soldier’s Trailhead), backscatter variability increased the next day (27 May 2023), and the southernmost POI (South Basin) the following day (28 May 2023).
Figure 8.
SWOT backscatter standard deviation for POIs 1–11, highlighting the transition from ice-covered to WCI. The top panel showcases the northernmost sites on Kluane Lake which melt out earliest due to (A) their proximity to river outflow and (B) shallowest depths. When open water appears, SWOT’s backscatter variability increases considerably, which can be used as a metric to retrieve the timing of WCI across the lake. Note: two POIs (1, 6) have much larger backscatter standard deviation values compared to the rest of the observations at 61.5 and 72.6 dB for 31 May 2023 and 1 June 2023, respectively.
3.2. PlanetScope WCI Evaluation
PlanetScope optical imagery is used both qualitatively and quantitatively to identify melt dynamics in Kluane Lake. The progression of melt for the north and south basins of the lake is shown in Figure 9 and Figure 10, exhibiting the DTVM WCI-retrieved date for Kluane River (POI 3) and Soldier’s Trailhead (POI 10), respectively. These sites were chosen as they encompass the earliest and latest observed WCI in the data record, 23 May 2023 and 30 May 2023. At Kluane River, regions of WCI observed in Figure 9B (14 May 2023) are resolved well by the 100 m DTVM (pictured in blue or navy blue, Figure 9A), which is the earliest WCI observed in the lake, associated with the shallowest bathymetry, and is close in proximity to the outflow of the lake into Kluane River. Large regions of open water observed by the DTVM, and small leads and cracks on the scale of <30 m wide are also captured effectively. In Figure 9C, the open water in the northeast portion of the image is resolved in both the PlanetScope and DTVM. On 26 May 2023 (the last PlanetScope image before the lake is completely ice free), thin, nearly transparent ice floes are still resolved by the SWOT DTVM (appearing bright yellow in Figure 9A).
Figure 9.
Progression of melt observed using PlanetScope acquisitions on 14 May 2023, 23 May 2023 and 26 May 2023 (B–D) for POI 3: Kluane River. DTVM WCI (A) retrieved dates using the 25th percentile of thresholds based on the timing of increased backscatter variability exhibit agreement to early melt in the north–central region of the image (14 May 2023) and sustained ice flows resolved in the western portion of (C) on 23 May 2023. Imagery © 2023 Planet Labs PBC.
Figure 10.
Progression of melt observed using PlanetScope acquisitions at POI 10: Soldier’s Trailhead on 20 May 2023, 26 May 2023 and 30 May 2023 (B–D). DTVM WCI using the 25th percentile of thresholds (A) exhibit agreement to the late melt stages on the lake, from 23 May 2023 to 30 May 2023. Some areas were obscured by cloud or not within the acquisition extent on 26 May 2023 (C), but the region immediately surrounding the POI was visible. Imagery © 2023 Planet Labs PBC.
In the southern basin of Kluane Lake, the latest timing of WCI is observed offshore of Soldier’s Summit Trailhead, between 26 May 2023 and 30 May 2023, according to Planetscope acquisitions (Figure 10C,D). From 20 May 2023 to 26 May 2023 (Figure 10B,C) melt occurs in the open portion of the basin, with the bay near Soldier’s Summit Trailhead shielded from the katabatic winds from the south allowing for ice to remain present. Cloud obscures some of the 26 May 2023 acquisition, but the DTVM is able to resolve an open lead in the northern portion of the bay.
3.3. DTVM Percentile Selection
Table 4 reports the RMSE and MAE using the 25th, 50th and 75th percentiles of the DTVM IQR during the WCI retrieval using the DTVM on the standard deviation of observed backscatter for 100 m and 500 m tessellated grids at the 11 POI, with lake-wide values provided in Table 5. For the 11 POIs, the DTVM-derived dates at the 25th percentile using the interval-censored framework resulted in an RMSE of 1.2 days and MAE of 1.2 days, respectively, while the 50th and 75th percentiles demonstrated much larger error metrics due to later WCI retrievals, greater than 10 days. When the interval-censored framework is calculated in the opposite direction, where the WCI is assumed to be the last possible date prior to the PlanetScope WCI observation, the RMSE and MAE increase slightly (100 m RMSE increases from 1.2 to 1.6, and MAE from 0.8 to 1.2). The RMSE and MAE values for the 50th and 75th percentiles remain unchanged regardless of the directionality of interval-censored error calculations.
Table 4.
Interval-censored evaluation of DTVM WCI performance to the 25th, 50th, and 75th for POIs on Kluane Lake. Values within brackets represent the interval-censored framework that references the last possible date of ice cover disappearing as opposed to the first possible date. The 50th and 75th percentile RMSE and MAE are the same for both interval-censored frameworks.
Table 5.
Interval-aware comparison of PlanetScope WCI for 100 m and 500 m DTVM at 25, 50 and 75 percentiles. The 50th percentile exhibits the lowest MBE, MAE, and agreement to within 7 days of PlanetScope-estimated WCI.
Table 6 reports the WCI dates based on the blue, green, and NIR reflectance thresholds from the PlanetScope acquisitions compared to the DTVM algorithm output in Julian day of year (DOY). PlanetScope acquisitions were missing or had too-cloud-covered DOYs 144, 145, 147, and 148, while the DTVM had WCI dates fall on those days for five POIs (1, 2, 4, 6, 9, and 11). The only POIs that had a difference between PlanetScope and DTVM greater than 1 day in both best- and worst-case interval-censored analysis was POI 8. POI 8 is located in the central basin of Kluane Lake, where ice pans persisted throughout the WCI period as a function of lateral flow transporting ice northward with katabatic-induced winds from the south. As a result, POI 8 PlanetScope thresholds observed WCI on DOY 146 but the DTVM WCI-retrieved date is 149. The Mean Bias Error (MBE) between DTVM and PlanetScope-derived WCI is 0.6 days. The bootstrapped resampling for the best-case interval-censored 100 m tessellation resulted in an RMSE of 1.2 days with a 95% confidence interval of 0.6–1.7 days, and an MAE of 0.8 days with a 95% confidence interval of 0.4–1.4 days. The 500 m tessellation resulted in an RMSE of 1.2 days with 95% confidence interval of 0. 7–1.8 days, and an MAE of 0.9 with a 95% confidence interval of 0.5–1.5 days. For the worst-case interval-censored scenario, the 100 m tessellation resulted in an RMSE of 1.6 with 95% confidence interval of 0.9–2.1 days, and the 500 m produced an RMSE of 1.7 with a 95% confidence interval of 1.1–2.2 days.
Table 6.
PlanetScope-derived WCI Julian day of year (DOY) compared to the DTVM algorithm using the 25th percentile. Note that between DOY 143 and 150, PlanetScope imagery was not available for DOYs 144, 145, 147 and 149 due to cloud cover.
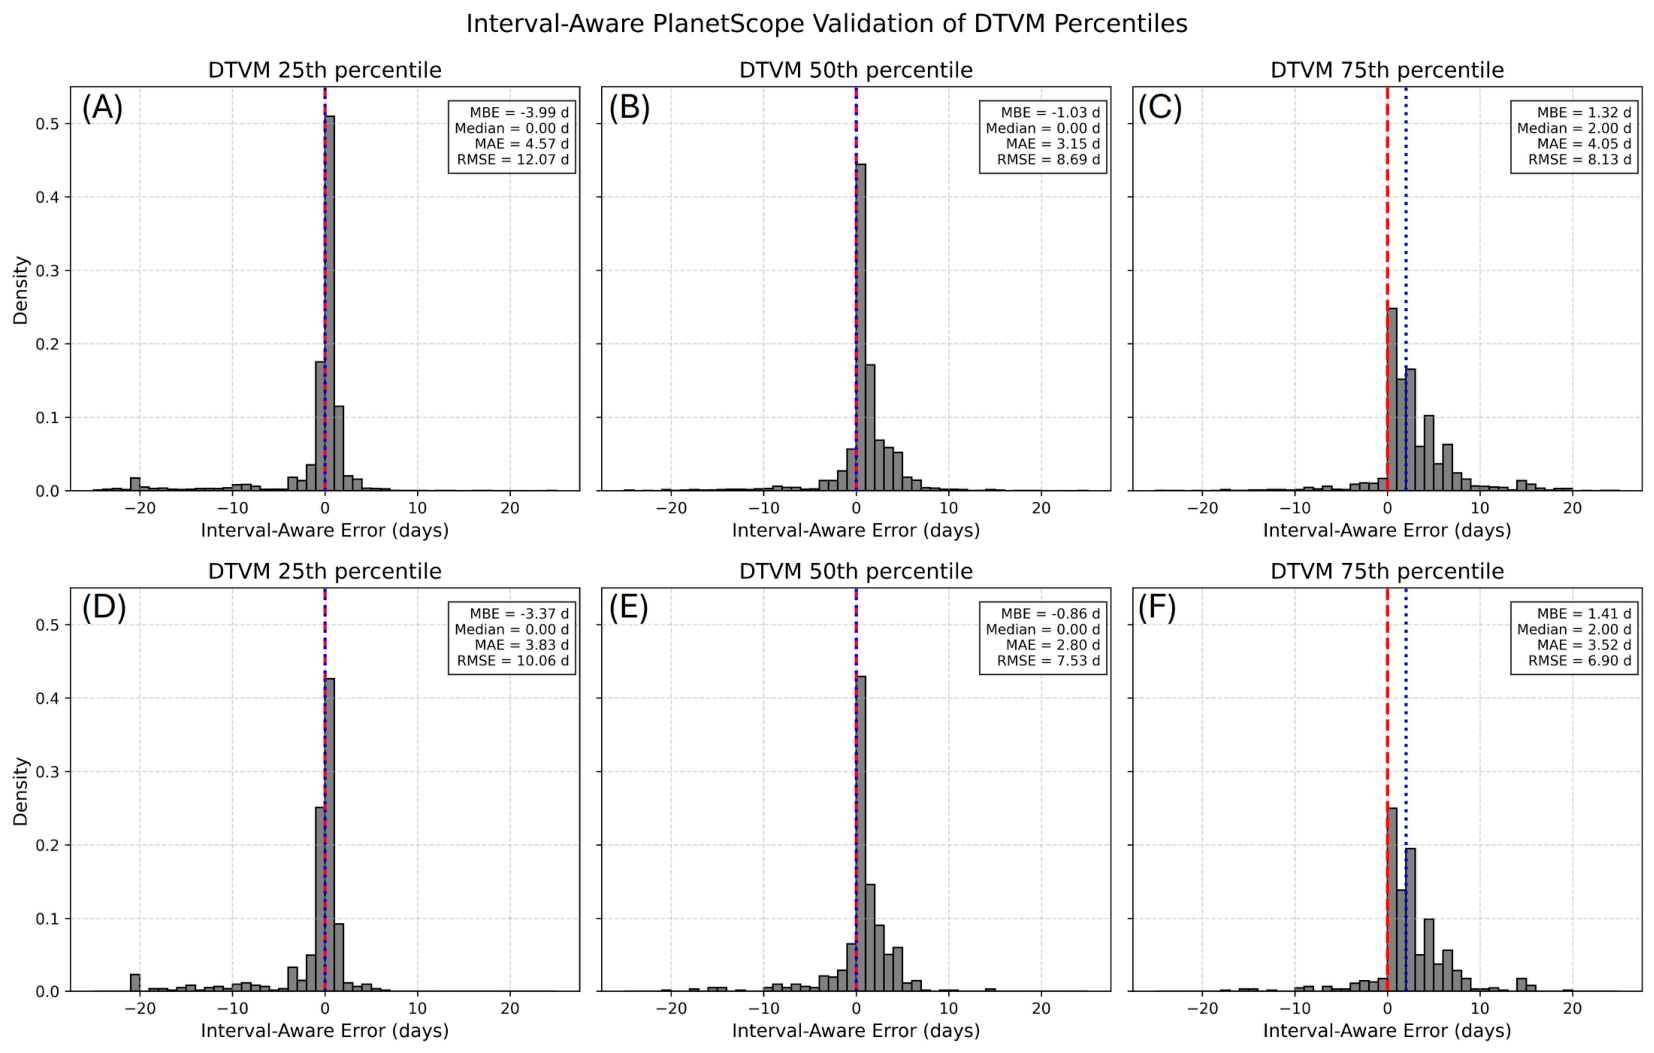
When comparing the PlanetScope WCI to the DTVM across the entire lake, interval-aware logic was also applied similar to the 11 POIs (Figure 11). Consistent with the 11 POIs, the 100 m tessellation WCI retrievals at the 25th percentile exhibits the highest exact agreement for WCI dates (47.6%) and the highest agreement within +/−3 days (82.7%), compared to the 50th percentile WCI dates (42.9%) and +/−3 day agreement (81.2%). However, when using all available PlanetScope pixels across the lake, the DTVM 25th percentile reported a MBE of 4 days earlier than observed by the PlanetScope interval, compared to the 50th percentile of 1 day earlier. Concurrently, the 50th percentile produced the lowest MAE of 3.2 days. The 75th percentile generally produced the lowest agreement within +/−3 days (64.6%).
For the 500 m tessellation the WCI evaluation metrics are similar in sign and magnitude, with the DTVM 25th percentile exhibiting the highest agreement within +/−3 days (81.4%) and MBE (−3 days), retrieving WCI early compared to PlanetScope observations. The lowest MAE (2.8 days) and RMSE (7.3 days) at 500 m are observed for the DTVM 50th percentile, with the highest percentage of agreement within +/−7 days (93.3%) compared to the 25th (87%) and 75th percentiles (90.9%). While the 25th percentile provided the smallest error metrics for the 11 POI, the 50th percentile exhibits the lowest error across the lake.
Figure 11.
Probability density function of interval-aware errors for the whole lake comparing DTVM to PlanetScope WCI at 100 m (A–C) and 500 m (D–F) spatial resolutions. The red hashed line represents an interval-aware error of 0 days, while the blue hashed line represents the median value of the DTVM to Planetscope WCI comparison.
3.4. CLIMo-Simulated WCI Comparison
For the four snow cover scenarios, the thermodynamic modeling of ice on Kluane Lake using CLIMo indicates the beginning of melt starting on 29 April 2023 for simulations with 100% of the snow present, and 2 May 2023 with 0% or no snow (Table 7). Similarly, scenarios with snow cover resulted in the earlier WCI dates of 20 May 2023, 21 May 2023, and 22 May 2023 for 100, 50, and 20% snow cover scenarios (Table 7). Conversely, with no snow on the ice, the ice column is able to grow uninsulated, reaching a maximum ice thickness of 1.38 m, taking an additional 10 days to melt compared to the other scenarios. The range of WCI dates simulated by CLIMo is added to Figure 12 and Figure 14, and 15 as blue bars to aid in comparisons with backscatter and DTVM-derived WCI dates from SWOT backscatter.
Table 7.
Melt onset and WCI dates generated by CLIMo for Kluane Lake. The 0% snow cover scenarios exhibit both the latest melt onset and WCI, with 100% snow cover exhibiting the earliest WCI due to the potential insulation of the snowpack to limit ice development.
Figure 12.
CLIMo simulation of Kluane Lake using KLRS meteorological observations and ERA-5 as input and four snow cover scenarios (0%, 20%, 50%, 100%) to simulate the range of expected WCI dates (20 May 2023 and 1 June 2023 for 100% and 0% snow cover scenarios).
3.5. Wind Influence on DTVM WCI Detection Dates
To investigate the influence of wind on the DTVM-derived WCI detection dates, correlation analyses and Kruskal–Wallis tests were applied to the number of pixels that exhibited WCI threshold crossing at the 50th percentile in the DTVM processing chain and the average wind speed recorded at the Burwash Landing Airport weather station. In the pre-break-up period (before 20 May 2023), DTVM threshold crossings were infrequently observed, with a mean daily value of 29 cells of the potential 36,495 cells available in the 100 m tessellation. During this period, a weak significant correlation of r = 0.29 (p = 0.04) is observed. During the transition period between break-up and WCI (21 May 2023 to 1 June 2023), the number of daily DTVM threshold crossings increased over ten-fold, with a daily average of 2956 cells, but did not show a significant correlation with wind speed (r = −0.21, p = 0.57) (Figure 13). Post WCI (after 2 June 2023), there was a drop in threshold crossing, with an average of 145 cells per day (r = −0.21, p = 0.203) despite several strong wind events. The Kruskal–Wallis H statistic among the three sample periods is H = 26.49, p = 0.2 × 10⁻⁶, denoting that the DTVM threshold crossing dates are associated with the phase change of the medium from ice-covered to open water, rather than being influenced by strong wind variability.
Figure 13.
Number and timing of DTVM WCI thresholds (bars) reported per day for the 1°0 m tessellation of Kluane Lake compared against average daily wind speed gusts observed at Burwash Landing Airport (red line). The observation period is sub-divided into phase-related groups: pre-break-up (before 20 May 2023) represented as blue bars, WCI transition (21 May 2023 to 1 June 2023, yellow shaded region), and post-WCI (after 2 June 2023) (green bars), and the timing of phase change do not appear to be linked to periods of strong wind.
3.6. DTVM Water-Clear-of-Ice-Dates
Figure 14A,B presents boxplots of backscatter intensity and variability, with derived height and CLIMo simulation outputs in Figure 14C,D. SWOT σ0 of ice-covered regions is much lower than that of open water. The median σ0 for the POIs from the first SWOT acquisition on 29 March 2023 to 25 April 2023 is 3.3 dB with a standard deviation of 1 dB. Backscatter for open water (from 5 June 2023 to 10 July 2023) stand in contrast to the ice-covered period, with a median of 15.1 dB and standard deviation of 12.2 dB, a difference of 11.8 dB, which is on the order of fifteen times the returned power in linear units from open water compared to ice.
Sustained melt begins with multiple days with average air temperatures above the freezing point (0 °C), which starts on 29 April 2023 according to CLIMo simulations (Table 7). During the next four days following MO, SWOT σ0 drops from 4 dB to 1 dB. Following the drop on 1 May 2023, there is a rebound of the backscatter during the melt season, with median values of 1.2 increasing to 2.9 dB before finally dropping until WCI occurs. During the melt period, SWOT elevation retrievals exhibit the largest departures from the mean surface elevation of 780.6 m, a notable observation during the transition from ice-covered to open water.
The most pronounced change in σ0 and σ0 standard deviation is observed during the period when pixels within the lake are transitioning from ice-covered to WCI. Both the σ0 intensity and standard deviation incrementally increase each day starting on 23 May 2023 and plateau when the lake is completely clear of ice on 30 May 2023 or 1 June 2023, as retrieved by PlanetScope imagery and CLIMo, respectively (Figure 14A and Figure 14B).
Figure 14.
Behavior of SWOT backscatter variability and height in the context of the timing of melt onset and WCI. Panels (A,B) showcase the increase in backscatter and its standard deviation when ice melts completely and open water is revealed. Panel (C) showcases the consistency of corrected heights throughout the ice-on and ice-off seasons. Panel (D) shows the timing of CLIMo-simulated ice melt with 0% and 100% snow cover scenarios.
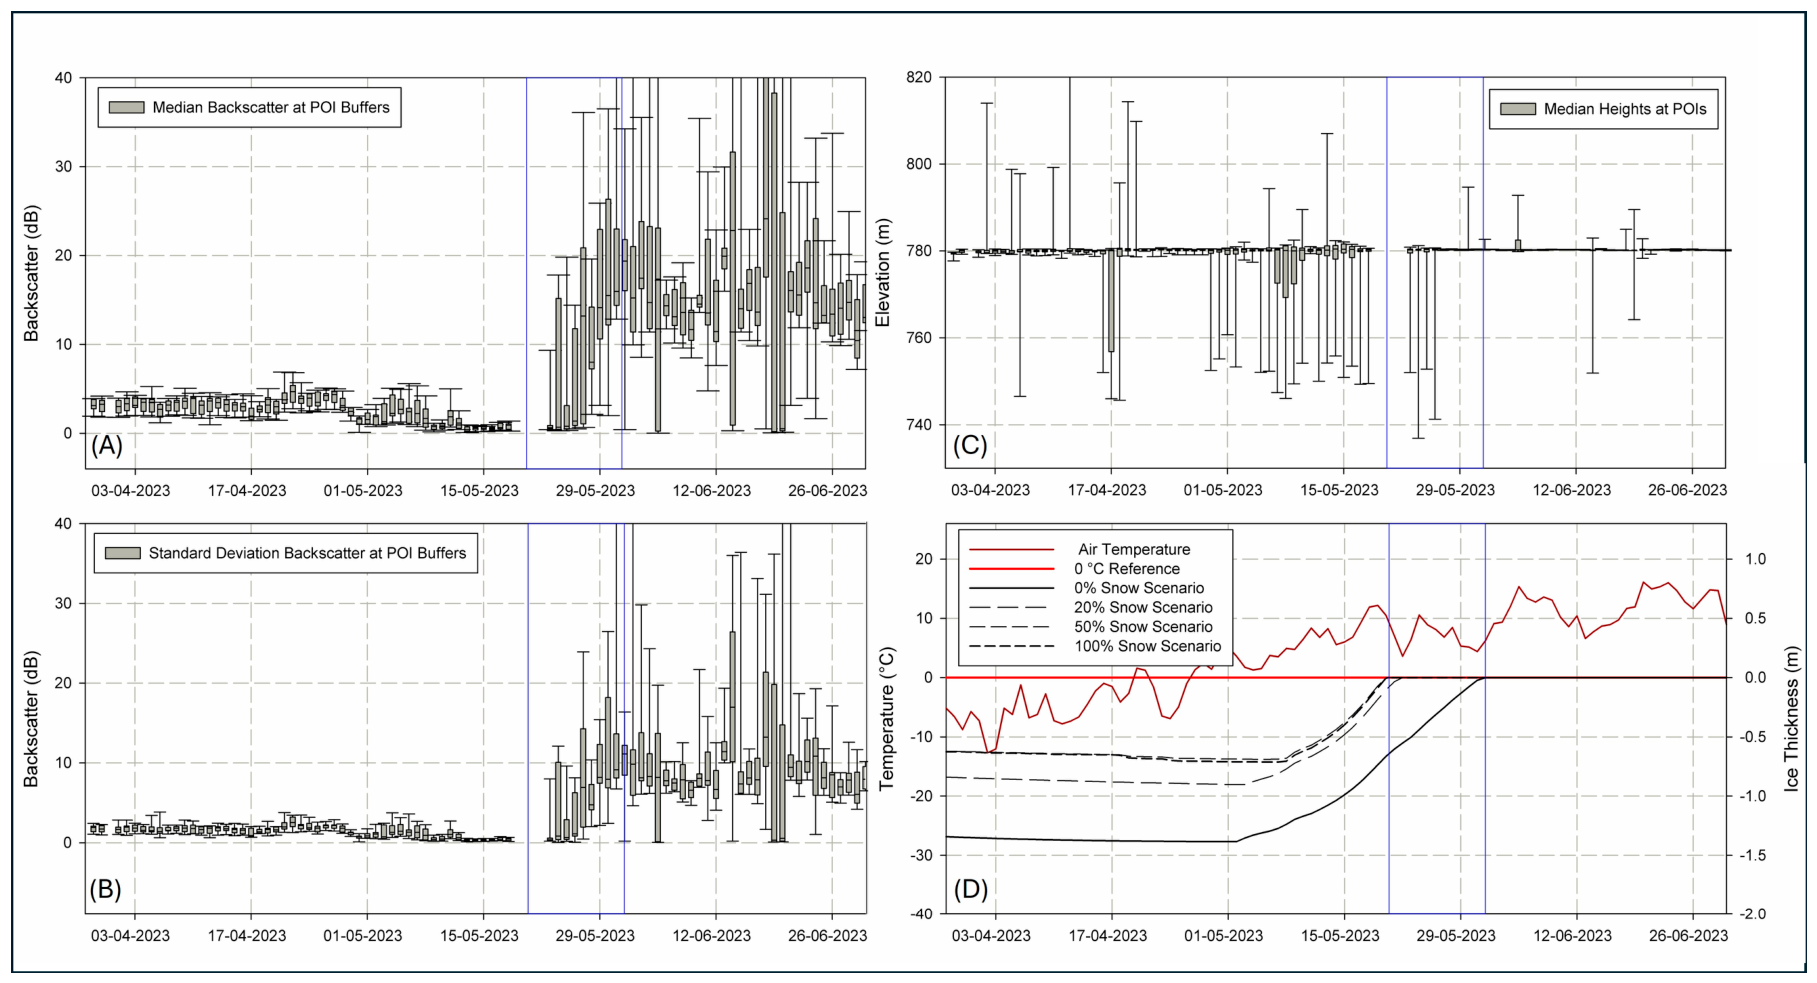
Figure 15.
Range of expected CLIMo-simulated WCI compared to the DTVM 50th percentile retrieved dates spatially distributed throughout Kluane Lake at 100 m and 500 m resolutions. The blue bars denote the CLIMo 100% and 0% snow cover scenario WCI dates, which are also the most commonly observed by SWOT.
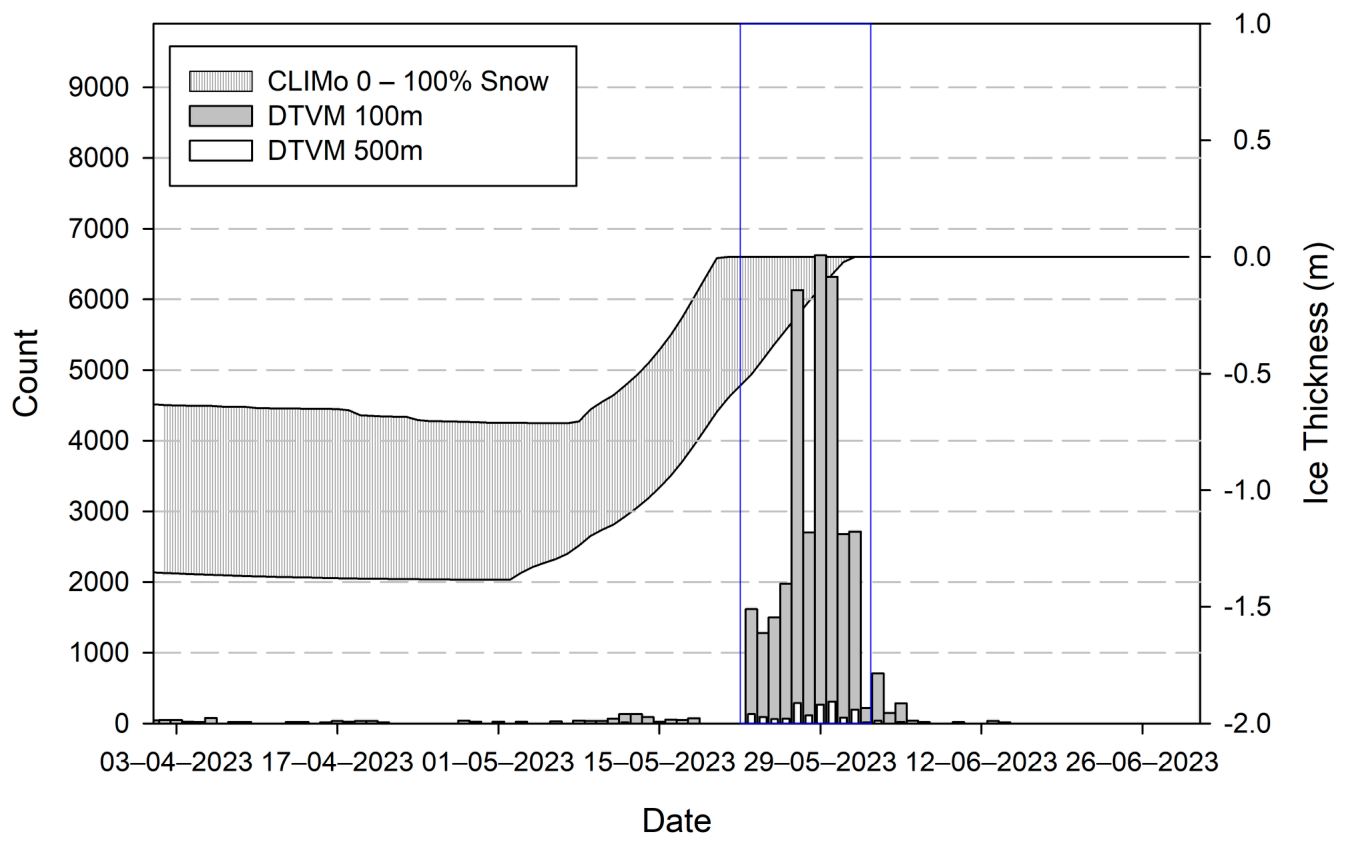
Of the 36,623 grid cells in the DTVM 100 m WCI 50th percentile output, 91.6% are observed to be within the expected WCI dates simulated by the 0% and 100% CLIMo snow cover scenarios (20 May 2023 and 1 June 2023, respectively), with 4.2% occurring before, and 4.2% after (Table 8 does not report DTVM between 18 May 2023 and 22 May 2023 because of a gap in SWOT data acquisitions). Expectedly, the 500 m grid exhibits a similar distribution; 87.7% of cells are within the same date range, with 7.6% pixels flagged before, and 4.7% after.
Table 8.
Pixel counts associated with WCI on Kluane Lake extracted by the DTVM using the 50th percentile threshold and a broad description of the location the majority of WCI pixels were observed.
The most commonly observed WCI date for the 100 m tessellations is 29 May 2023 (18.1%), corresponding to melt throughout the main basin and southern portion of Talbot arm. At 500 m, the most commonly observed WCI date is 30 May 2023, corresponding to melt occurring in the South Basin and Soldier’s Trailhead. The retrieved 100 m WCI dates are unimodal, with 59.5% of cells with dates ranging from 27 May 2023 to 30 May 2023 when regions surrounding Jacquot Island, the main basin and Talbot Arm are WCI (Figure 15).
Figure 16A,B shows the output of the DTVM at the 50th percentile of thresholds when applied to the pixel cloud points within each pixel of the 100 m and 500 m tessellation for Kluane Lake. The general patterns for WCI in the DTVM show that melt occurs first in regions of considerable hydrologic inflow and outflow. Gladstone Creek (POI 6) and Destruction Bay (POI 7) have large creeks that converge snowmelt from surrounding high altitude regions, and Kluane River (POI 3) is the main region of outflow and the shallowest portion of the lake. Regions that exhibit the latest WCI are the most sheltered from wind and snowmelt inflow. The 100 m DTVM WCI product shows the location of cracks and leads that expose open water; however, some noise is present as ice pans move laterally due to wind and convective movement.
Figure 16.
DTVM algorithm output for WCI using the 50th percentile threshold for 100 m (A) and 500 m (B) tessellations for Kluane Lake.
The distribution of 500 m WCI dates derived from the DTVM at the 50th percentile exhibit a slight skew towards dates earlier than 23 May 2023 (7.6% of 500 m tessellated cells). These cells are regionally clustered to the shoreline where bathymetry is shallow (e.g., Kluane River outflow), and regions where large tributaries and valleys act as pour points of snowmelt input to the lake (e.g., Congdon Creek, Bock’s Creek, Lewis Creek, and Gladstone Creek). Less than 1% of the 100 m tessellated cells had WCI later than the CLIMo-simulated last day of ice cover (>1 June 2023), and are also spatially clustered in the northernmost regions of Talbot Arm (Table 8).
4. Discussion
The application of the DTVM to retrieve WCI is predicated upon the understanding that backscatter exhibits contrasting patterns between open water and floating ice. Consistent with [25], open water and ice-covered regions were separated by approximately 10 dB, with backscatter hovering between 5 dB and 15 dB for ice-covered and open-water regions, respectively. During melt, there is an oscillatory behavior in the backscatter, where the distribution of backscatter for the POIs during snowmelt exhibits a drop in backscatter from an average of 3 dB on 27 April 2023 to 1 dB on 30 April 2023 during the early period of above-freezing daily average air temperatures, followed by a rebound to 3 dB on 4 May 2023 (Figure 5A). This is also reflected in the classification flags of the pixels, showing a swap in the amount of dark water (green) and open water (red) during melt. This relative increase in the backscatter standard deviation is likely the reason for the relatively larger RMSE and negative MBE in the DTVM 25th percentile when comparing PlanetScope to the entire lake, as meltwater in the snow or on the lake surface is incorrectly flagged as open water [47,48], confounding the WCI retrieval, and why the DTVM 50th percentile produced the best error metrics (Table 5). The oscillatory behavior during MO has been noted in daily backscatter observations of large lakes (Great Bear Lake, Great Slave Lake) using Quikscat (13.4 GHz, 8–10 km spatial resolution) and hypothesized to be the result of increased moisture within the snowpack overlying the lake ice, with the oscillation being the result of the transition from the pendular to the funicular snow regime prior to ice melt [35]. The impact of snow depth and snow water equivalent on KaRIn backscatter and height deviations are a much-needed point of exploration in future research.
Compared to studies observing MO and WCI using daily PMW Tbs, the impact of the transition period between ice-covered and open water phases on the Tbs is the clearest diagnostic window for detecting WCI. Concurrent to the increase in backscatter standard deviation observed in Figure 5 and Figure 8 for Kluane Lake, the monotonic 36 GHz Tb decrease observed during the transition to open water observed for large freshwater lakes occurs over a period of several days, not suddenly [12,24,49]. This study showcases the similar application of ~35 GHz observations to retrieve WCI, but at a much higher spatial resolution compared to PMW studies (100 m vs. 3.125 km).
The DTVM offers the selection of candidate dates through the percentage of thresholds crossed within the IQR. For lower percentiles such as 25%, the DTVM produced earlier break-up dates, and higher percentiles in the IQR (75th percentile) produced later WCI retrievals compared to PlanetScope surface reflectance. The Mean Bias Error in the 100 m and 500 m tessellations reflected the progressive shift in WCI retrieval, with MBE of −4 and −3.4 for the 25th percentile, and an MBE of 1.3 and 2.0 for the 75th percentile, respectively. The 50th percentile produced the lowest MAE and smallest absolute bias, achieving exact date agreement with 41.3% of PlanetScope WCI-retrieved dates, and the highest agreement for WCI within +/−7 days (93.3%). The smaller MBE, MAE, and RMSE associated with the 11 POI is expected, as the POI are placed in central locations in regions of the lake basins. When performing the analysis on the whole lake, the assessment captures a larger variability in break-up and WCI timing across greater spatial scales. Regional effects, including earlier break-up due to snowmelt inflow from rivers, streams or groundwater can result in error outliers, which increase RMSE values.
Comparing the 100 m to 500 m DTVM WCI retrievals, the 100 m resolution captures cracks and leads, resulting in a lower proportion of cells being misclassified as WCI prior to 23 May 2023. The 500 m phenology product smooths the WCI variability over the cracks, but results in greater early WCI detection (7.6%). Hydrodynamically, the 100 m product would be more informative to sub-basin hydrological applications, but is more computationally intensive. At 100 m, the DTVM captures advanced melt where ice pans are floating and no longer in a structured consolidated ice cover. Ice motion during advanced melt can result in the loss of the location of the ice edge or shape of floes and appear as noise within the DTVM output, but can still provide an intra-lake indication of break-up dynamics. The location and timing of ice break-up has also been linked to the location of cracks and pressure ridges, which allow for increased potential solar radiation absorption and locations for the drainage of surface meltwater, influencing large-scale break-up patterns [50]. Noting the location of pressure ridges from backscatter in alternate data sources more sensitive to ice composition (e.g., Sentinel-1 or RCM C-band) is an avenue of future research.
The 500 m product may be more appropriate when scaling the ice phenology product generation to include the processing of all lakes within a SWOT tile. For context, each daily KaRIn observation of Kluane Lake contains 1.15 million points. KaRIn acquisitions have been acknowledged to be a noisy product, and it is common practice to incorporate 68% of the height or backscatter observations from the mean [51]. The PIXC data in the analysis presented here has not applied this filter to investigate the efficacy of the DTVM to retrieve WCI with an “off the shelf” approach to the PIXC product, but is an avenue of future research.
When evaluating the DTVM-derived WCI to PlanetScope acquisitions, bootstrap resampling was applied despite the smaller sample size to provide a quantitative assessment of the expected confidence interval of RMSE (0.6–1.7 days) and MAE (0.4–1.4 days), indicating general agreement within 3 days between the SWOT DTVM and PlanetScope-derived WCI dates. These estimates require cautious interpretation because the PlanetScope WCI dates represent the first clear-sky confirmation of open water rather than the exact timing of WCI, with the maximum gap of 3 days occurring at Site 8 in the south end of the lake.
The thermodynamic envelope of potential WCI dates simulated by CLIMo with 0–100% snow cover scenarios are in agreement with the PlanetScope WCI evaluation, with completely open water observed in the optical imagery on 30 May 2023, and less than 5% of DTVM-retrieved WCI dates using the 50th percentile thresholds after 31 May 2023 at both the 100 and 500 m resolutions. CLIMo simulations of Kluane Lake ice thickness have been reported to agree with a low fraction (e.g., 0–20%) of the recorded snowfall at the KLRS meteorological station [52]. In this study, 0–20% snow cover simulations resulted in WCI between 22 May 2023 to 1 June 2023, a period in which the 100 m DTVM also retrieved 91.6% of WCI pixels on the lake. It is important to note that while the 0–100% snow cover scenarios aligned with PlanetScope WCI, CLIMo cannot represent spatial melt gradients driven by inflows and outflows from a lake. As such, POIs like the Kluane River are expected to exhibit disagreement with earlier WCI than simulated through CLIMo because of moving water and shallow bathymetry, and should not be viewed as erroneously captured by the DTVM.
The 50th percentile of DTVM thresholds produced RMSE and MAE of 8.7 and 3.2 days relative to PlanetScope WCI retrievals, and is comparable to other studies that observe lake ice break-up using Sentinel-1 C-band acquisitions evaluated with MODIS surface reflectance (RMSE of 3.4 days and MAE of 3.1) [53]. It is important to consider that [53] obtains RMSE from multiple sites over a 16-year period, whereas in this analysis, the varying WCI dates are retrieved intra-lake, and contains increased variance as a result of including locations with varying break-up dynamics, horizontal flow, snowmelt and river inputs to the ice on a day-to-day basis.
While SWOT does not maintain daily acquisitions during the science phase from July 2023 to present (2026), this study highlights the utility of SWOT PIXC data to observe the distinction between open water and freshwater ice and lay the foundation for future integration of Ka-band in ice cover products. High-latitude regions that have SWOT orbital overlap have a higher frequency of observation than the 21-day temporal revisit, and pairing Ka-band acquisitions with additional SAR observations that are sensitive to ice thermal status such as Sentinel-1 or RCM may provide further error reduction in the timing of WCI or melt-onset.
The lack of in situ measurements during WCI dates is a limitation throughout the literature as it is logistically difficult to retrieve safely. Studies have commonly used trail- or web-cameras to track the timing of WCI [41,54]; however, those observations are restricted to the shoreline, where floating ice pans in the central basin of a lake would not be captured. This study incorporates datasets both observing and simulating ice cover to reduce the impact of the lack of in situ measurements.
Future improvements to the DTVM when scaling the algorithm to retrieve WCI for multiple lakes within a SWOT tile will likely include additional preprocessing steps, including the application of incidence angle normalization, especially for large lakes that extend throughout the cross-track where considerable ranges of incidence angles are observed. The impact of incidence angle has not been observed to be considerable in this analysis since the application of the DTVM tracks changes in backscatter variability for tessellated regions without considering neighboring pixels; however when multiple lakes are included in the DTVM, incidence angle normalization will be necessary.
5. Conclusions
SWOT’s “fast sampling” phase presents a unique opportunity to monitor ice break-up for a medium-sized lake with a single-day repeat pass. Based on the timing of WCI observed by the SWOT satellite at 11 POIs, the transition from break-up to WCI took, from 23 May 2023 to 30 May 2023, a total of 8 days. The understanding of backscatter patterns for open water versus ice-covered regions presented in this study will allow for ice cover product generation in addition to retrieving WCI across the lake. The near-nadir incidence angles used by KaRIn result in open water returning higher backscatter intensity than consolidated or melting ice, which is opposite of most common sensors utilized in lake ice phenology retrievals (X-, C-band) where ice is brighter than calm water. This complementary scattering response suggests an opportunity for data fusion or machine learning models to combine existing and future off-nadir microwave missions with SWOT for improved ice parameter retrieval.
Lake ice cover ECVs require 1 day for temporal resolution and 100 m for horizontal resolution for breakthrough values. For the 11 POIs observed in this study, the application of the 25th percentile of the DTVM for the 100 m tessellated SWOT PIXC product acquired during the fast sampling phase achieved an RMSE and MAE of 1.2 and 0.8 days for WCI, with confidence intervals of 0.6–1.7 days for RMSE and 0.4–1.4 days for MAE. At 500 m, the RMSE for WCI at the 11 POIs was 1.21 days (95% confidence interval of 0.67 and 1.76) and the MAE was 0.91 (95% confidence interval of 0.45–1.45 days).
When the DTVM was applied to interval-censored PlanetScope acquisitions across the whole lake, the RMSE and MAE increased—12.1 and 4.57 for the 25th percentile, and 8.7 and 3.2 for the 50th percentile, where early melt on the snow or ice surface triggers the DTVM thresholds but does not reflect WCI.
The SWOT sampling phase has since transitioned to the science phase of acquisitions with a temporal revisit of 21 days. It is unlikely that the repeat pass for the science phase of SWOT observations would be able to document break-up dynamics at the temporal resolution presented in this study, although the science phase repeat pass increases with latitude, where lakes with latitudes between 30 and 60° are observed 2–4 times per cycle, increasing to 5–6 times for latitudes > 60° [55]. The confluence of SWOT swath overlap in high latitudes present an opportunity for future studies focused on small lakes across the Arctic region.
Author Contributions
Conceptualization, G.E.G. and C.R.D.; methodology, G.E.G.; evaluation, G.E.G. and H.K.; formal analysis, G.E.G.; investigation, G.E.G., C.R.D. and H.K.; resources, G.E.G. and C.R.D.; data curation, G.E.G. and H.K.; writing—original draft preparation, G.E.G.; writing—review and editing, G.E.G., C.R.D. and H.K.; visualization, G.E.G.; supervision, G.E.G. and C.R.D.; project administration, G.E.G.; funding acquisition, G.E.G. and C.R.D. All authors have read and agreed to the published version of the manuscript.
Funding
This research was funded by the Canadian Space Agency through the Research Opportunities in Space Science (ROSS) 23SUESLAKE, and Dr. Gunn’s Natural Sciences and Engineering Research Council of Canada Discovery Grant.
Data Availability Statement
SWOT pixel cloud (PIXC) data is available on NASA’s Physical Oceanography Distributed Active Archive Center (PO.DAAC) in netcdf format (https://podaac.jpl.nasa.gov/SWOT, URL accessed on 1 October 2025). Value-added, including post processed backscatter and surface elevation products are available from the authors by request.
Acknowledgments
The authors would like to thank the citizens and employees of the Kluane First Nation, including Sam White, for their continued help and thoughts to ensure safe data collection and continued thoughtful sharing of knowledge about Kluane Lake for this research and for the years to come. During the preparation and processing of the data, the CRYOSWOT working group was instrumental in communicating the updates and news about SWOT data reprocessing by CNES.
Conflicts of Interest
Author Claude R. Duguay is the funder of the company H2O Geomatics. The remaining authors declare that the research was conducted in the absence of any commercial or financial relationships that could be construed as a potential conflict of interest.
Abbreviations
The following abbreviations are used in this manuscript:
| CGG | Canadian Gravimetric Geoid |
| Cal/Val | Calibration/Validation period |
| CLIMo | Canadian Lake Ice Model |
| CNES | Centre National d’Etudes Spatiales |
| CSA | Canadian Space Agency |
| DOY | Day of Year |
| DTVM | Dynamic Threshold Variability Method |
| ECV | Essential Climate Variable |
| ERA-5 | European Centre for Medium-Range Weather Forecast (ECMWF) Reanalysis 5th Generation |
| FO | Freeze Onset |
| GCOS | Global Climate Observing System |
| GHz | Gigahertz |
| IQR | Inter Quartile Range |
| KaRIn | Ka-band Radar Interferometer |
| MAE | Mean Absolute Error |
| MBE | Mean Bias Error |
| MO | Melt Onset |
| MODIS | Moderate resolution Imaging Spectroradiometer |
| NASA | National Aeronautics and Space Administration |
| NSIDC | National Snow and Ice Data Center |
| PMW | Passive Microwave |
| PO.DAAC | Physical Oceanography Distributed Active Archive Center |
| POI | Points of Interest |
| RMSE | Root Mean Square Error |
| SAR | Synthetic Aperture Radar |
| SWOT | Surface Water Ocean Topography |
| UKSA | United Kingdom Space Agency |
| WGS | World Geodetic System |
| WCI | Water-Clear-of-Ice |
| σ0 | Sigma naught, or backscatter |
References
- Basu, A.; Culpepper, J.; Blagrave, K.; Sharma, S. Phenological Shifts in Lake Ice Cover Across the Northern Hemisphere: A Glimpse Into the Past, Present, and the Future of Lake Ice Phenology. Water Resour. Res. 2024, 60, e2023WR036392. [Google Scholar] [CrossRef] [Scilit]
- Dauginis, A.A.; Brown, L.C. Recent Changes in Pan-Arctic Sea Ice, Lake Ice, and Snow-on/off Timing. Cryosphere 2021, 15, 4781–4805. [Google Scholar] [CrossRef] [Scilit]
- Previdi, M.; Smith, K.L.; Polvani, L.M. Arctic Amplification of Climate Change: A Review of Underlying Mechanisms. Environ. Res. Lett. 2021, 16, 093003. [Google Scholar] [CrossRef] [Scilit]
- Roebeling, R.A.; Bojinski, S.; Poli, P.; John, V.O.; Schulz, J. On the Determination of GCOS ECV Product Requirements for Climate Applications. Bull. Am. Meteorol. Soc. 2025, 106, E868–E893. [Google Scholar] [CrossRef] [Scilit]
- Global Climate Observing System (GCOS). The 2022 GCOS ECVs Requirements, 2022 Edition—Updated in 2025; GCOS-245; World Meteorological Organization: Geneva, Switzerland, 2025; Available online: https://library.wmo.int/idurl/4/58111 (accessed on 1 May 2026).
- Kuhn, C.; John, A.; Lambers, J.H.R.; Butman, D.; Tan, A. Arctic-Boreal Lake Phenology Shows a Relationship between Earlier Lake Ice-out and Later Green-Up. Remote Sens. 2021, 13, 2533. [Google Scholar] [CrossRef] [Scilit]
- Cai, Y.; Ke, C.Q.; Yao, G.; Shen, X. MODIS-Observed Variations of Lake Ice Phenology in Xinjiang, China. Clim. Change 2020, 158, 575–592. [Google Scholar] [CrossRef] [Scilit]
- Zhang, S.; Pavelsky, T.M.; Arp, C.D.; Yang, X. Remote Sensing of Lake Ice Phenology in Alaska. Environ. Res. Lett. 2021, 16, 064007. [Google Scholar] [CrossRef] [Scilit]
- Heinilä, K.; Mattila, O.P.; Metsämäki, S.; Väkevä, S.; Luojus, K.; Schwaizer, G.; Koponen, S. A novel method for detecting lake ice cover using optical satellite data. Int. J. Appl. Earth Obs. Geoinf. 2021, 104, 102566. [Google Scholar] [CrossRef] [Scilit]
- Brodzik, M.J.; Long, D.G.; Hardman, M.A. Calibrated Passive Microwave Daily EASE-Grid 2.0 Brightness Temperature ESDR (CETB) Algorithm Theoretical Basis Document Version 2.1; NSIDC MEaSUREs Project White Paper: Boulder, CO, USA, 2024. [Google Scholar] [CrossRef]
- Lemmetyinen, J.; Derksen, C.; Pulliainen, J.; Strapp, W.; Toose, P.; Walker, A.; Tauriainen, S.; Pihlflyckt, J.; Kärnä, J.P.; Hallikainen, M.T. A Comparison of Airborne Microwave Brightness Temperatures and Snowpack Properties across the Boreal Forests of Finland and Western Canada. IEEE Trans. Geosci. Remote Sens. 2009, 47, 965–978. [Google Scholar] [CrossRef]
- Kang, K.K.; Duguay, C.R.; Howell, S.E.L. Estimating Ice Phenology on Large Northern Lakes from AMSR-E: Algorithm Development and Application to Great Bear Lake and Great Slave Lake, Canada. Cryosphere 2012, 6, 235–254. [Google Scholar] [CrossRef] [Scilit]
- Kang, K.K.; Duguay, C.R.; Lemmetyinen, J.; Gel, Y. Estimation of Ice Thickness on Large Northern Lakes from AMSR-E Brightness Temperature Measurements. Remote Sens. Environ. 2014, 150, 1–19. [Google Scholar] [CrossRef] [Scilit]
- Antonova, S.; Duguay, C.R.; Kääb, A.; Heim, B.; Langer, M.; Westermann, S.; Boike, J. Monitoring Bedfast Ice and Ice Phenology in Lakes of the Lena River Delta Using TerraSAR-X Backscatter and Coherence Time Series. Remote Sens. 2016, 8, 903. [Google Scholar] [CrossRef] [Scilit]
- Duguay, C.R.; Pultz, T.J.; Lafleur, P.M.; Drai, D. RADARSAT Backscatter Characteristics of Ice Growing on Shallow Sub-Arctic Lakes, Churchill, Manitoba, Canada. Hydrol. Process. 2002, 16, 1631–1644. [Google Scholar] [CrossRef] [Scilit]
- Tian, B.; Li, Z.; Engram, M.J.; Niu, F.; Tang, P.; Zou, P.; Xu, J. Characterizing C-Band Backscattering from Thermokarst Lake Ice on the Qinghai-Tibet Plateau. ISPRS J. Photogramm. Remote Sens. 2015, 104, 63–76. [Google Scholar] [CrossRef] [Scilit]
- Surdu, C.M.; Duguay, C.R.; Pour, H.K.; Brown, L.C. Ice Freeze-up and Break-up Detection of Shallow Lakes in Northern Alaska with Spaceborne SAR. Remote Sens. 2015, 7, 6133–6159. [Google Scholar] [CrossRef] [Scilit]
- Murfitt, J.; Brown, L.C.; Howell, S.E.L. Evaluating RADARSAT-2 for the Monitoring of Lake Ice Phenology Events in Mid-Latitudes. Remote Sens. 2018, 10, 1641. [Google Scholar] [CrossRef] [Scilit]
- Murfitt, J.; Duguay, C.R. Assessing the Performance of Methods for Monitoring Ice Phenology of The World’s Largest High Arctic Lake Using High-Density Time Series Analysis of Sentinel-1 Data. Remote Sens. 2020, 12, 382. [Google Scholar] [CrossRef] [Scilit]
- Guo, L.; Zheng, H.; Wu, Y.; Zhang, T.; Wen, M.; Fan, L.; Zhang, B. Responses of Lake Ice Phenology to Climate Change at Tibetan Plateau. IEEE J. Sel. Top. Appl. Earth Obs. Remote Sens. 2020, 13, 3856–3861. [Google Scholar] [CrossRef] [Scilit]
- Dezyani, S. Assessing the Compact Polarimetric Capabilities of the RADARSAT Constellation Mission for Monitoring Sub-Arctic Lake Ice Dynamics. Master’s Thesis, University of Waterloo, Waterloo, ON, Canada, 2024. Available online: https://hdl.handle.net/10012/21382 (accessed on 3 March 2026).
- Sobiech, J.; Dierking, W. Observing Lake- and River-Ice Decay with SAR: Advantages and Limitations of the Unsupervised k-Means Classification Approach. Ann. Glaciol. 2013, 54, 65–72. [Google Scholar] [CrossRef] [Scilit]
- Biancamaria, S.; Lettenmaier, D.P.; Pavelsky, T.M. The SWOT mission and its capabilities for land hydrology. Surv. Geophysics. 2016, 2, 117–147. [Google Scholar] [CrossRef] [Scilit]
- Cai, Y.; Duguay, C.R.; Ke, C.Q. A 41-Year (1979–2019) Passive-Microwave-Derived Lake Ice Phenology Data Record of the Northern Hemisphere. Earth Syst. Sci. Data 2022, 14, 3329–3347. [Google Scholar] [CrossRef] [Scilit]
- Trudel, M.; Gribi, T.; Siles, G.; Biancamaria, S.; Fjørtoft, R. Impact of Ice, Snow, Wind, and Rain on Swot Water Detection over Canadian Lakes during Cal/Val. In Proceedings of the International Geoscience and Remote Sensing Symposium (IGARSS); Institute of Electrical and Electronics Engineers Inc.: New York, NY, USA, 2024; pp. 3180–3183. [Google Scholar]
- McKnight, E. Characterizing and Monitoring the Water Properties and Dynamics of Lhù’ààn Män (Kluane Lake), Yukon, in the Face of Climate Change. Arctic 2017, 70, 435–440. [Google Scholar] [CrossRef] [Scilit]
- McKnight, E.A.; Swanson, H.; Brahney, J.; Hik, D.S. The Physical and Chemical Limnology of Yukon’s Largest Lake, Lhù’ààn Mân’ (Kluane Lake), Prior to the 2016 ‘Aäy Chù’ Diversion. Arct. Sci. 2021, 7, 655–678. [Google Scholar] [CrossRef] [Scilit]
- Krebs, C.J.; Boutin, S.; Boonstra, R.; Murray, D.L.; Jung, T.S.; O’Donoghue, M.; Gilbert, B.S.; Kukka, P.M.; Taylor, S.D.; Morgan, T.; et al. Long-Term Monitoring in the Boreal Forest Reveals High Spatio-Temporal Variability among Primary Ecosystem Constituents. Front. Ecol. Evol. 2023, 11, 1187222. [Google Scholar] [CrossRef] [Scilit]
- Krebs, C.J.; Boonstra, R. The Kluane Region. In Ecosystem Dynamics of the Boreal Forest: The Kluane Project; Krebs, C., Boutin, S., Boonstra, R., Eds.; Oxford University Press: New York, NY, USA, 2001; pp. 9–24. [Google Scholar]
- Fjørtoft, R.; Gaudin, J.M.; Pourthié, N.; Lalaurie, J.C.; Mallet, A.; Nouvel, J.F.; Martinot-Lagarde, J.; Oriot, H.; Borderies, P.; Ruiz, C.; et al. KaRIn on SWOT: Characteristics of near-Nadir Ka-Band Interferometric SAR Imagery. IEEE Trans. Geosci. Remote Sens. 2014, 52, 2172–2185. [Google Scholar] [CrossRef] [Scilit]
- NASA/JPL SWOT Science Team. SWOT Level 2 Water Mask Pixel Cloud Data Product, Version D [Data Set]; NASA Physical Oceanography Distributed Active Archive Center (PO.DAAC): Pasadena, CA, USA, 2023. [Google Scholar] [CrossRef]
- Cruikshank, D.R. The Relationship of Summer Thermocline Depth to Several Physical Characteristics of Lakes; Data Report; Western Region, Department of Fisheries and Oceans: Winnipeg, MB, Canada, 1984; 1245; 33p. [Google Scholar]
- Fayne, J.V.; Smith, L.C. How does wind influence near-nadir and low-incidence Ka-band radar backscatter and coherence from small inland water bodies? Remote Sens. 2023, 15, 3361. [Google Scholar] [CrossRef] [Scilit]
- Tedesco, M. Snowmelt Detection over the Greenland Ice Sheet from SSM/I Brightness Temperature Daily Variations. Geophys. Res. Lett. 2007, 34. [Google Scholar] [CrossRef] [Scilit]
- Marshall, S.; Scott, K.A.; Scharien, R.K. Passive Microwave Melt Onset Retrieval Based on a Variable Threshold: Assessment in the Canadian Arctic Archipelago. Remote Sens. 2019, 11, 1304. [Google Scholar] [CrossRef] [Scilit]
- Howell, S.E.L.; Brown, L.C.; Kang, K.K.; Duguay, C.R. Variability in Ice Phenology on Great Bear Lake and Great Slave Lake, Northwest Territories, Canada, from SeaWinds/QuikSCAT: 2000–2006. Remote Sens. Environ. 2009, 113, 816–834. [Google Scholar] [CrossRef] [Scilit]
- Tibshirani, R.J.; Efron, B. An introduction to the bootstrap. Monogr. Stat. Appl. Probab. 1993, 57, 1–33. [Google Scholar]
- Liu, C.; Huang, H.; Hui, F.; Zhang, Z.; Cheng, X. Fine-resolution mapping of pan-arctic lake ice-off phenology based on dense sentinel-2 time series data. Remote Sens. 2021, 13, 2742. [Google Scholar] [CrossRef] [Scilit]
- Brown, L.C.; Duguay, C.R. The fate of lake ice in the North American Arctic. Cryosphere 2011, 5, 869–892. [Google Scholar] [CrossRef] [Scilit]
- Duguay, C.R.; Flato, G.M.; Jeffries, M.O.; Ménard, P.; Morris, K.; Rouse, W.R. Ice-Cover Variability on Shallow Lakes at High Latitudes: Model Simulations and Observations. Hydrol. Process. 2003, 17, 3465–3483. [Google Scholar] [CrossRef] [Scilit]
- Brown, L.C.; Duguay, C.R. A Comparison of Simulated and Measured Lake Ice Thickness Using a Shallow Water Ice Profiler. Hydrol. Process. 2011, 25, 2932–2941. [Google Scholar] [CrossRef] [Scilit]
- Morris, K.; Jeffries, M.; Duguay, C. Model Simulation of the Effects of Climate Variability and Change on Lake Ice in Central Alaska, USA. Ann. Glaciol. 2005, 40, 113–118. [Google Scholar] [CrossRef] [Scilit]
- Gunn, G.E.; Duguay, C.R.; Brown, L.C.; King, J.; Atwood, D.; Kasurak, A. Freshwater Lake Ice Thickness Derived Using Surface-Based X- and Ku-Band FMCW Scatterometers. Cold Reg. Sci. Technol. 2015, 120, 115–126. [Google Scholar] [CrossRef] [Scilit]
- Maykut, G.A.; Untersteiner, N. Some Results from a Time-Dependent Thermodynamic Model of Sea Ice. J. Geophys. Res. 1971, 76, 1550–1575. [Google Scholar] [CrossRef] [Scilit]
- Robinson, A.L.; Ariano, S.S.; Brown, L.C. The Influence of Snow and Ice Albedo towards Improved Lake Ice Simulations. Hydrology 2021, 8, 11. [Google Scholar] [CrossRef] [Scilit]
- Sayedain, S.A.; O’Neill, N.T.; King, J.; Hayes, P.L.; Bellamy, D.; Washington, R.; Engelstaedter, S.; Vicente-Luis, A.; Bachelder, J.; Bernhard, M. Detection and Analysis of Lhù’ààn Man’ (Kluane Lake) Dust Plumes Using Passive and Active Ground-Based Remote Sensing Supported by Physical Surface Measurements. Atmos. Meas. Tech. 2023, 16, 4115–4135. [Google Scholar] [CrossRef] [Scilit]
- Zhao, Y.; Fu, J.; Pang, Z.-G.; Jiang, W.; Zhang, P.; Qi, Z. Validation of Inland Water Surface Elevation from SWOT Satellite Products: A Case Study in the Middle and Lower Reaches of the Yangtze River. Remote Sens. 2025, 17, 1330. [Google Scholar] [CrossRef] [Scilit]
- Karami, A.; Baghdadi, N.; Nasrallah, Y.; Bazzi, H.; Cazals, C.; Oubanas, H.; Normandin, C.; Frappart, F. SWOT pixel cloud elevation accuracy assessment over synthetic small water bodies. Eur. J. Remote Sens. 2026, 59, 2695384. [Google Scholar] [CrossRef] [Scilit]
- Du, J.; Kimball, J.S.; Duguay, C.; Kim, Y.; Watts, J.D. Satellite Microwave Assessment of Northern Hemisphere Lake Ice Phenology from 2002 to 2015. Cryosphere 2017, 11, 47–63. [Google Scholar] [CrossRef] [Scilit]
- Zhang, J.; He, P.; Hu, X.; Liu, Z. Dynamic Lake Ice movement on Lake Khovsgol, Mongolia, revealed by time series displacements from pixel offset with Sentinel-2 optical images. Remote Sens. 2021, 13, 4979. [Google Scholar] [CrossRef] [Scilit]
- Mzoughi, A.; Trudel, M.; Biron, P.M.; Choné, G.; Siles, G.L. Assessment of SWOT water surface elevations for flood monitoring of a narrow river (<50 m width). Hydrol. Earth Syst. Sci. 2026, 30, 4141–4155. [Google Scholar] [CrossRef] [Scilit]
- Fatt, J. Lake Ice Thickness Retrieval from SWOT and Legacy Spaceborne SAR Altimetry. Master’s Thesis, University of Waterloo, Waterloo, ON, Canada, 2026. Available online: https://hdl.handle.net/10012/22811 (accessed on 3 August 2026).
- Tuttle, S.E.; Roof, S.R.; Retelle, M.J.; Werner, A.; Gunn, G.E.; Bunting, E.L. Evaluation of satellite-derived estimates of lake ice cover timing on Linnévatnet, Kapp Linné, Svalbard using in-situ data. Remote Sens. 2022, 14, 1311. [Google Scholar] [CrossRef] [Scilit]
- Brown, D.R.N.; Arp, C.D.; Brinkman, T.J.; Cellarius, B.A.; Engram, M.; Miller, M.E.; Spellman, K.V. Long-Term Change and Geospatial Patterns of River Ice Cover and Navigability in Southcentral Alaska Detected with Remote Sensing. Arct. Antarct. Alp. Res. 2023, 55, 2241279. [Google Scholar] [CrossRef] [Scilit]
- Wang, J.; Pottier, C.; Cazals, C.; Battude, M.; Sheng, Y.; Song, C.; Sikder, M.S.; Yang, X.; Ke, L.; Delhoume, M.; et al. The surface water and ocean topography mission (SWOT) prior lake database (PLD): Lake mask and operational auxiliaries. Water Resour. Res. 2025, 61, e2023WR036896. [Google Scholar] [CrossRef] [Scilit]
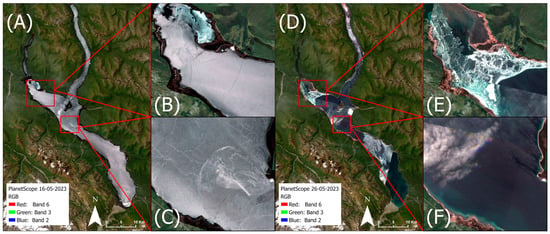
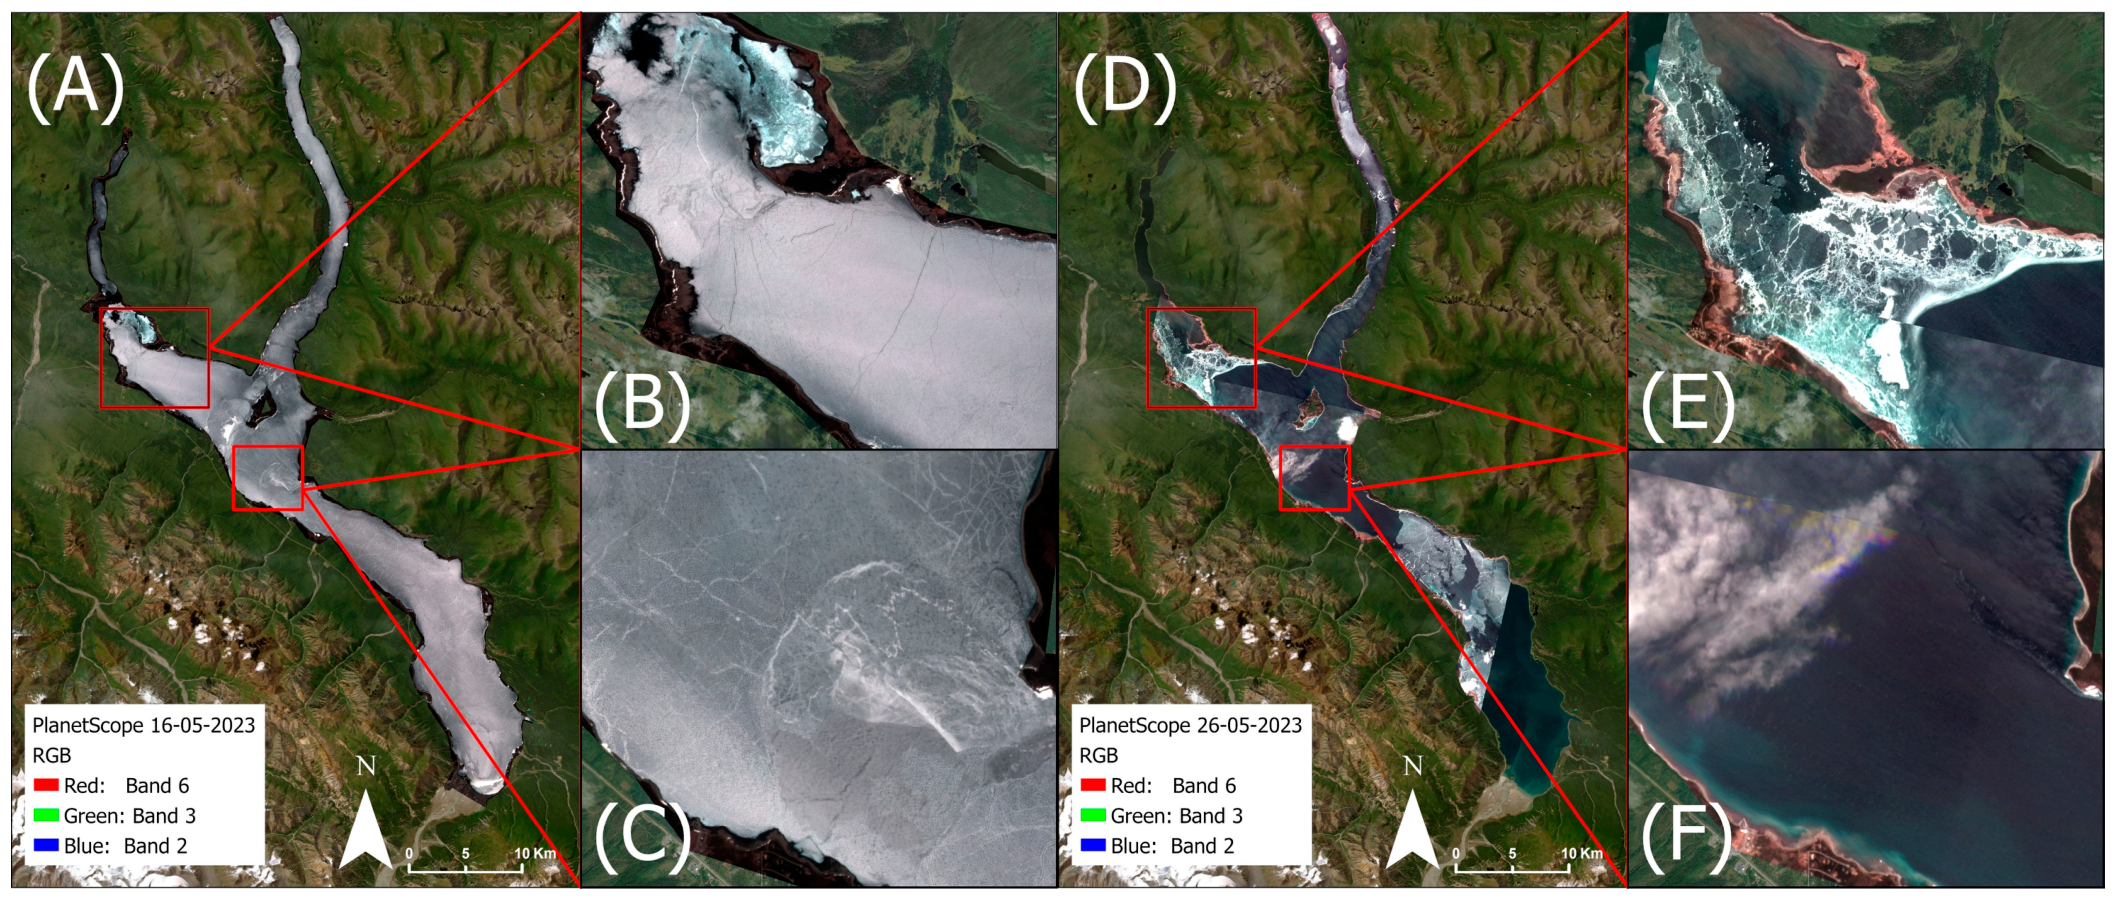
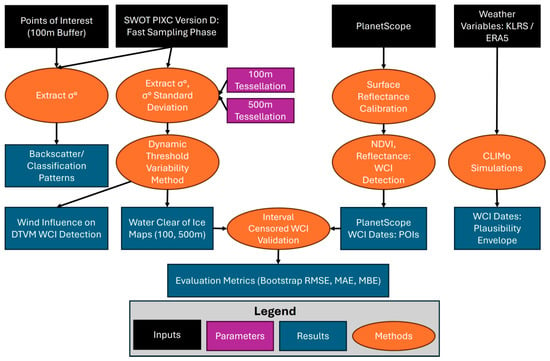
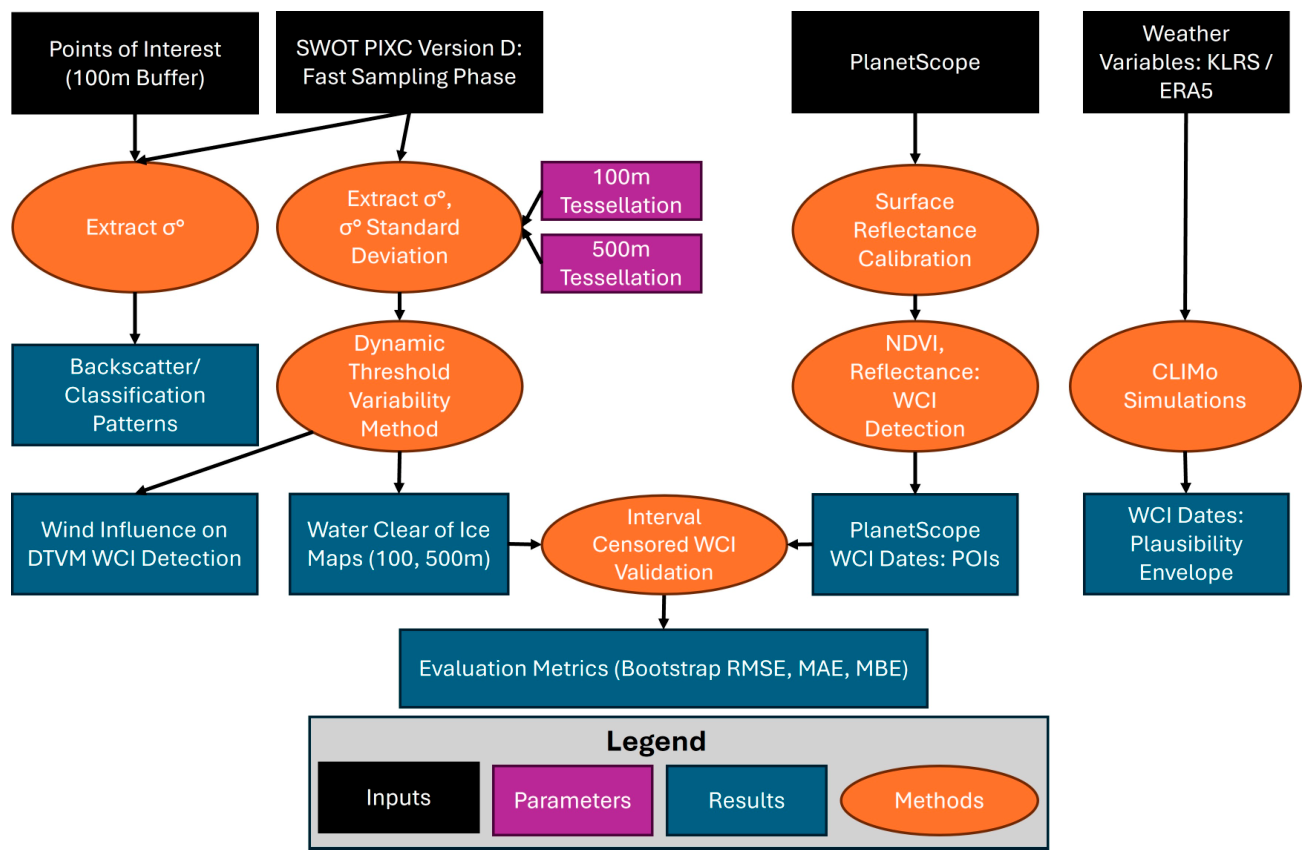
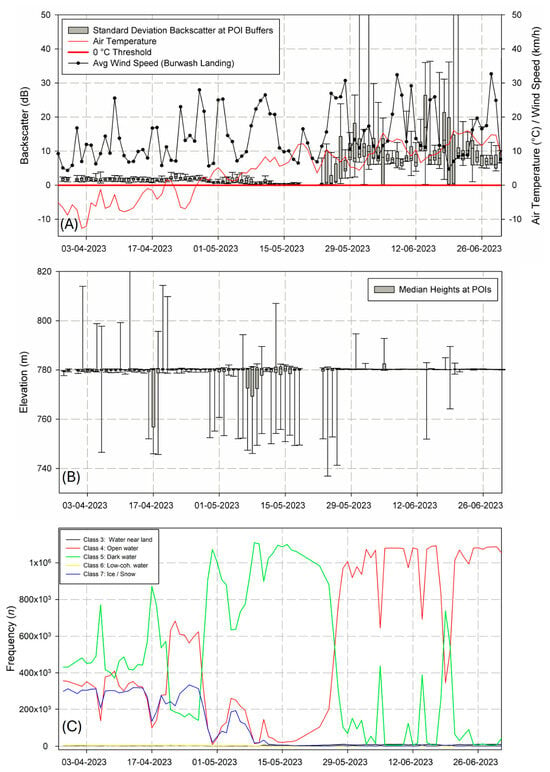
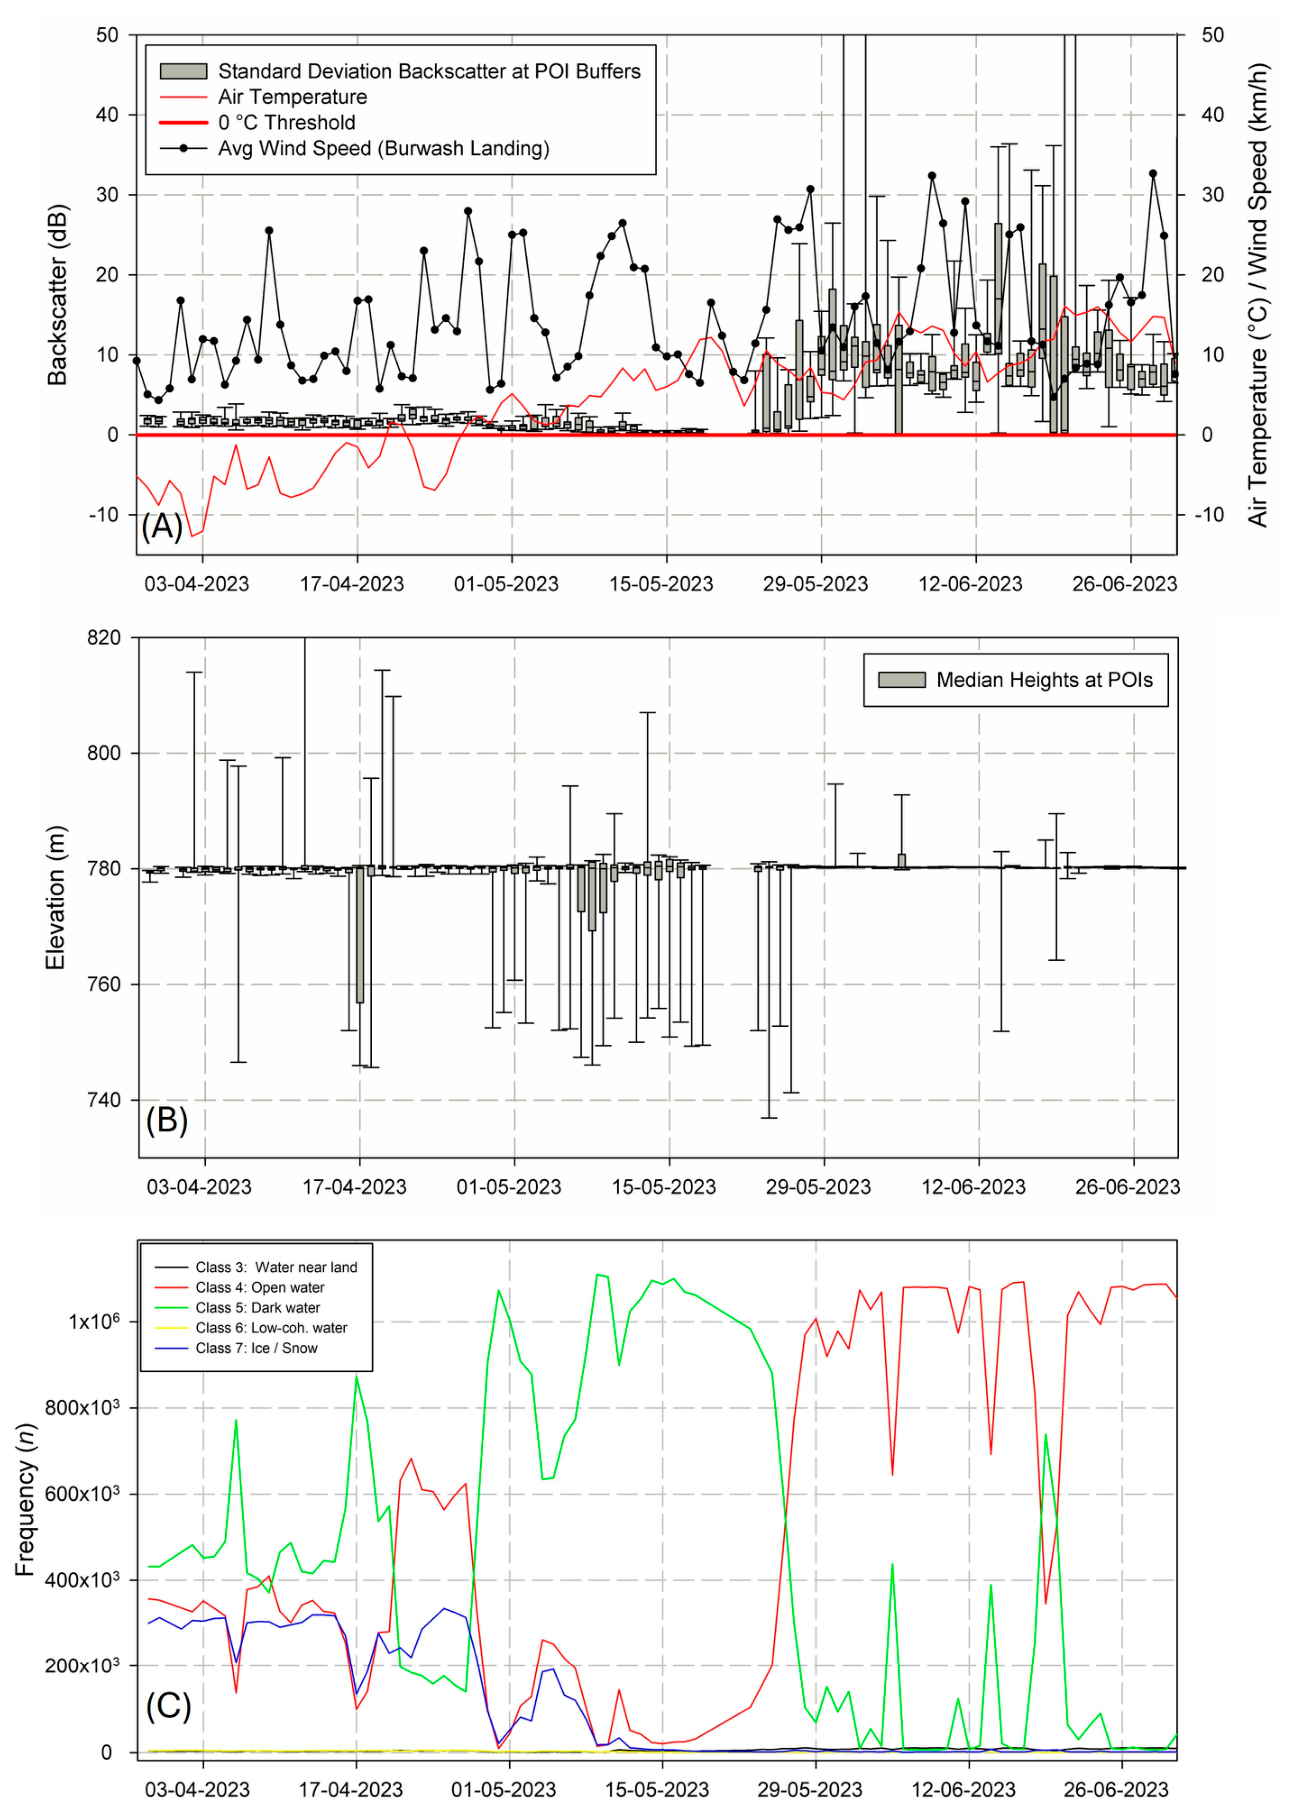
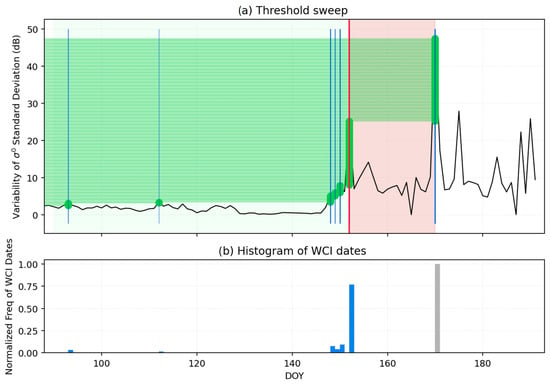
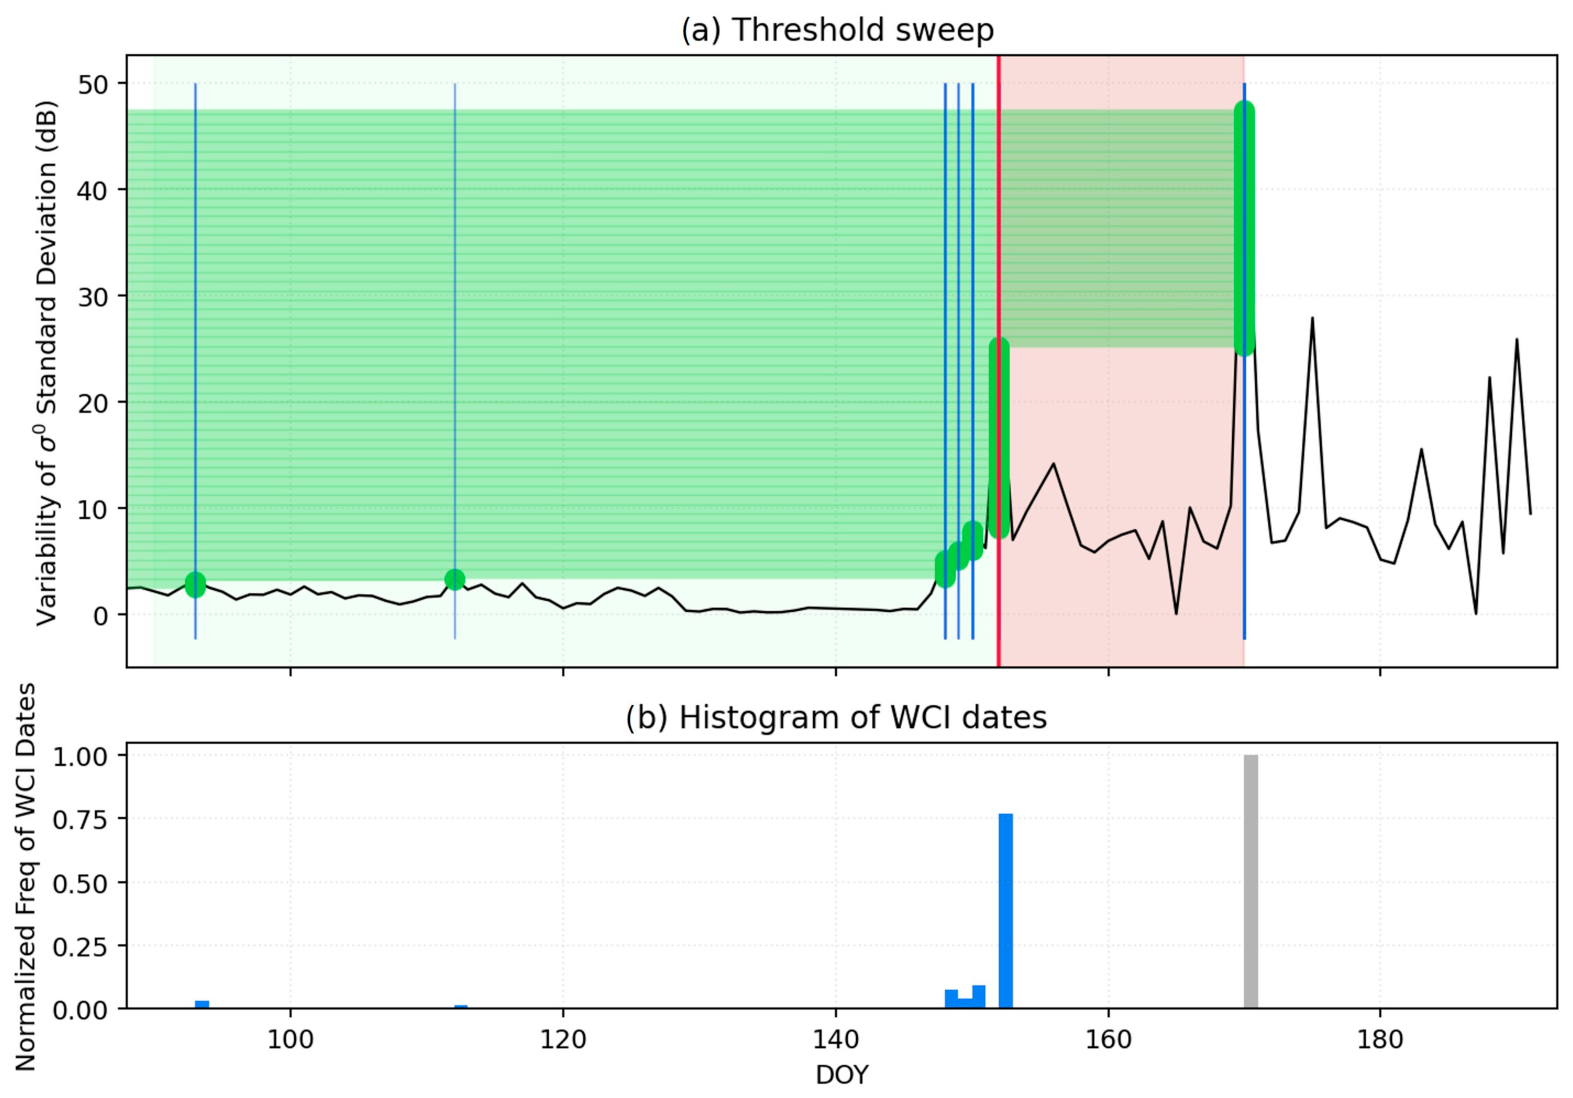
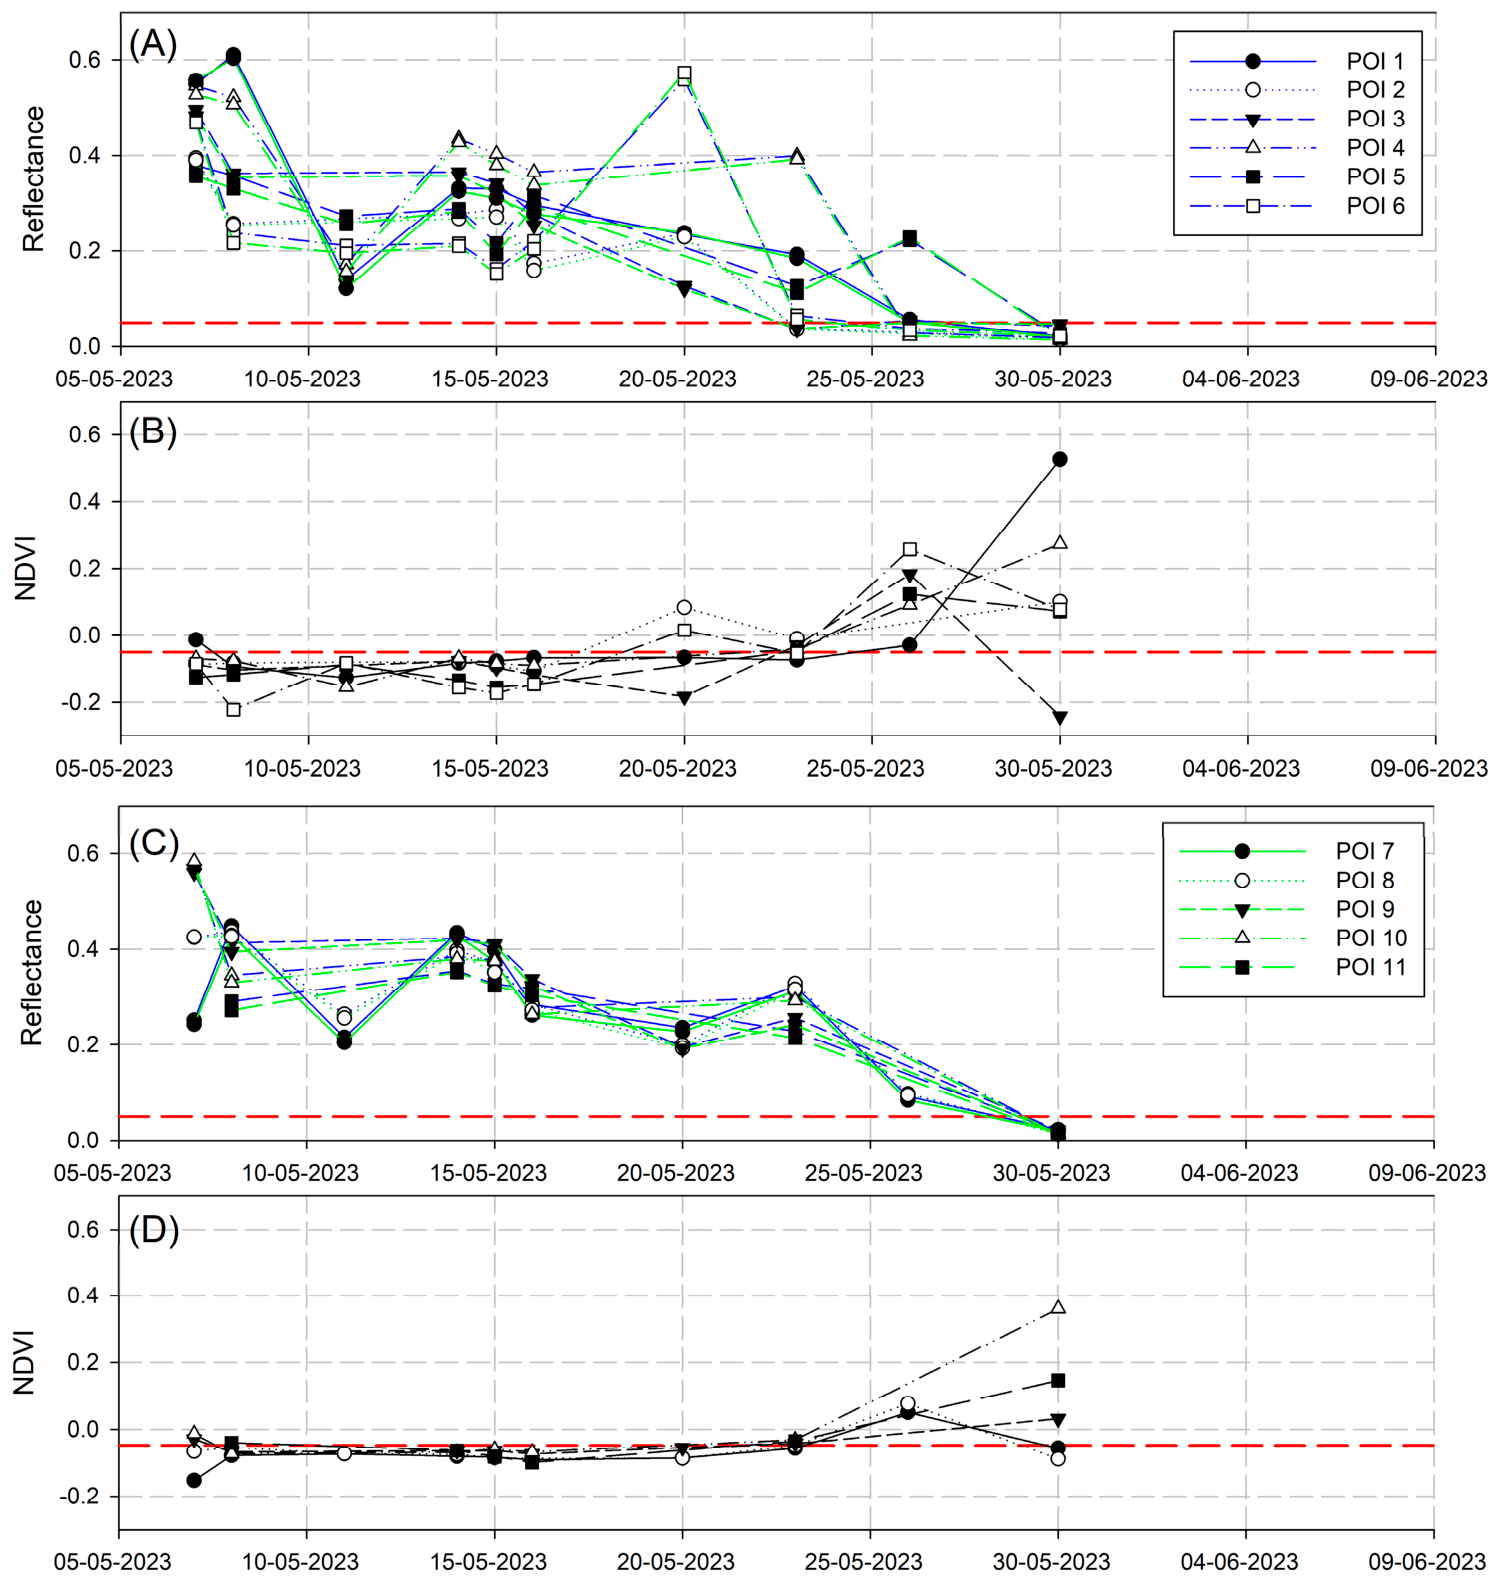
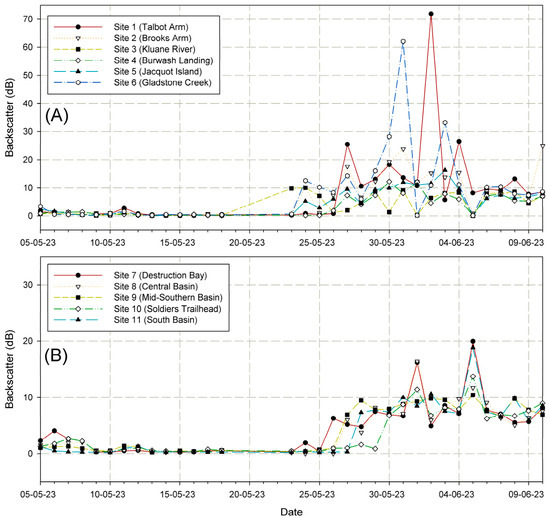
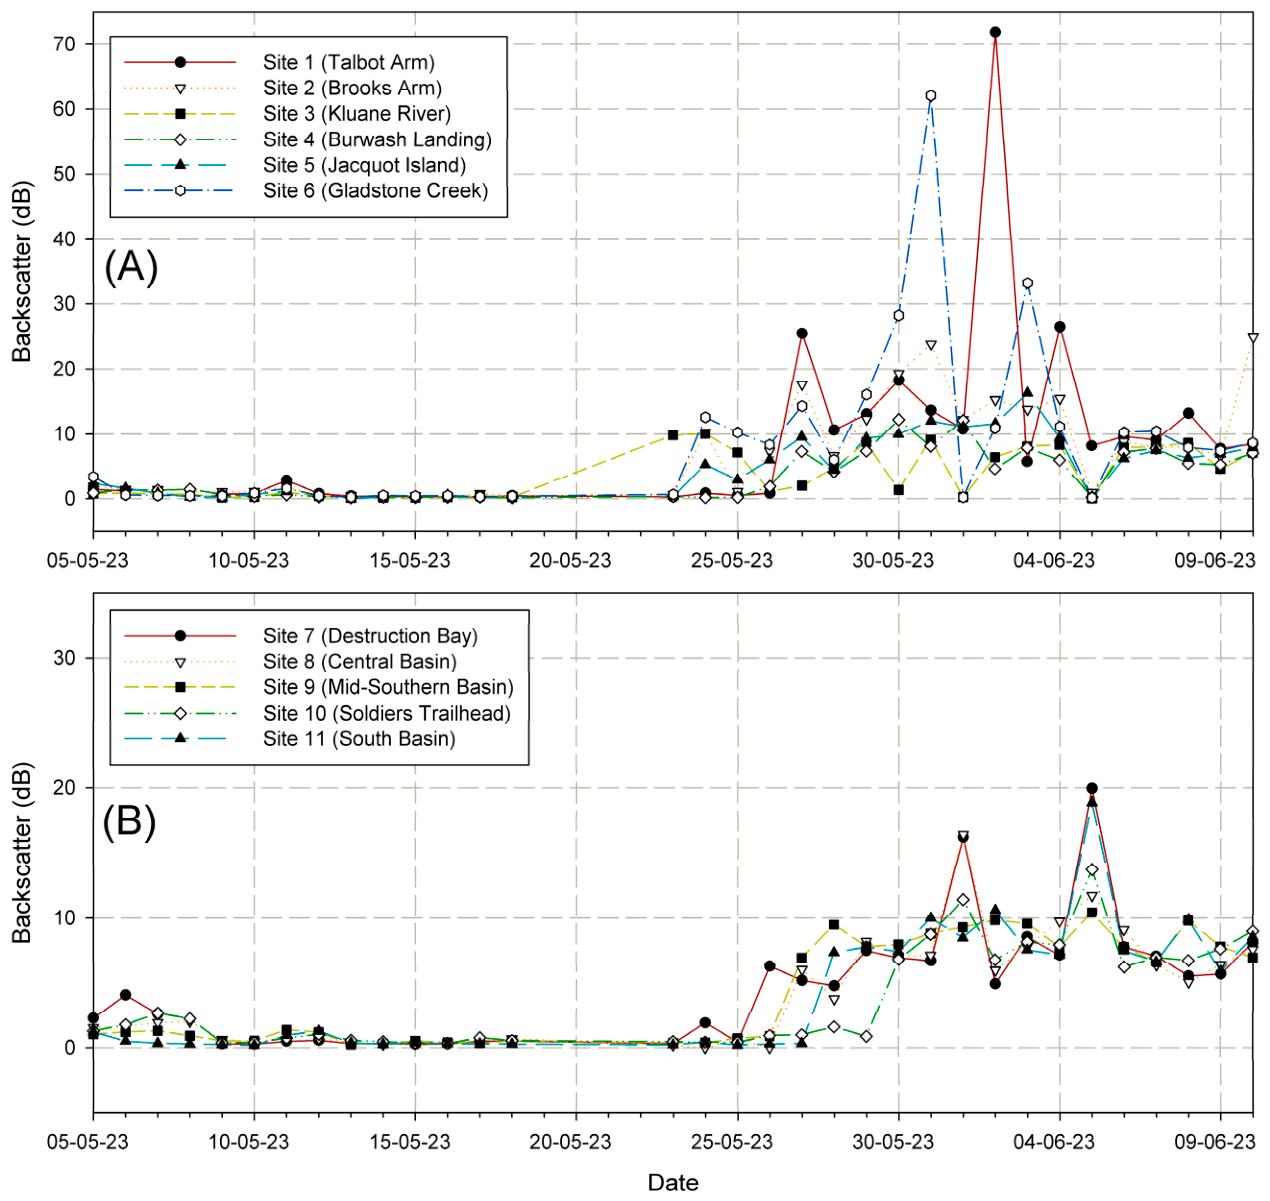
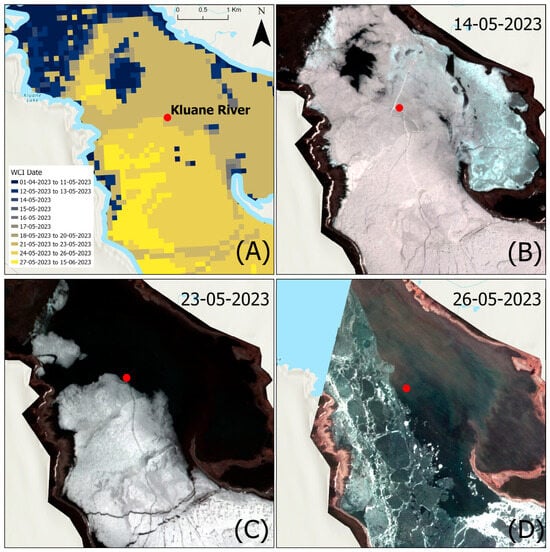
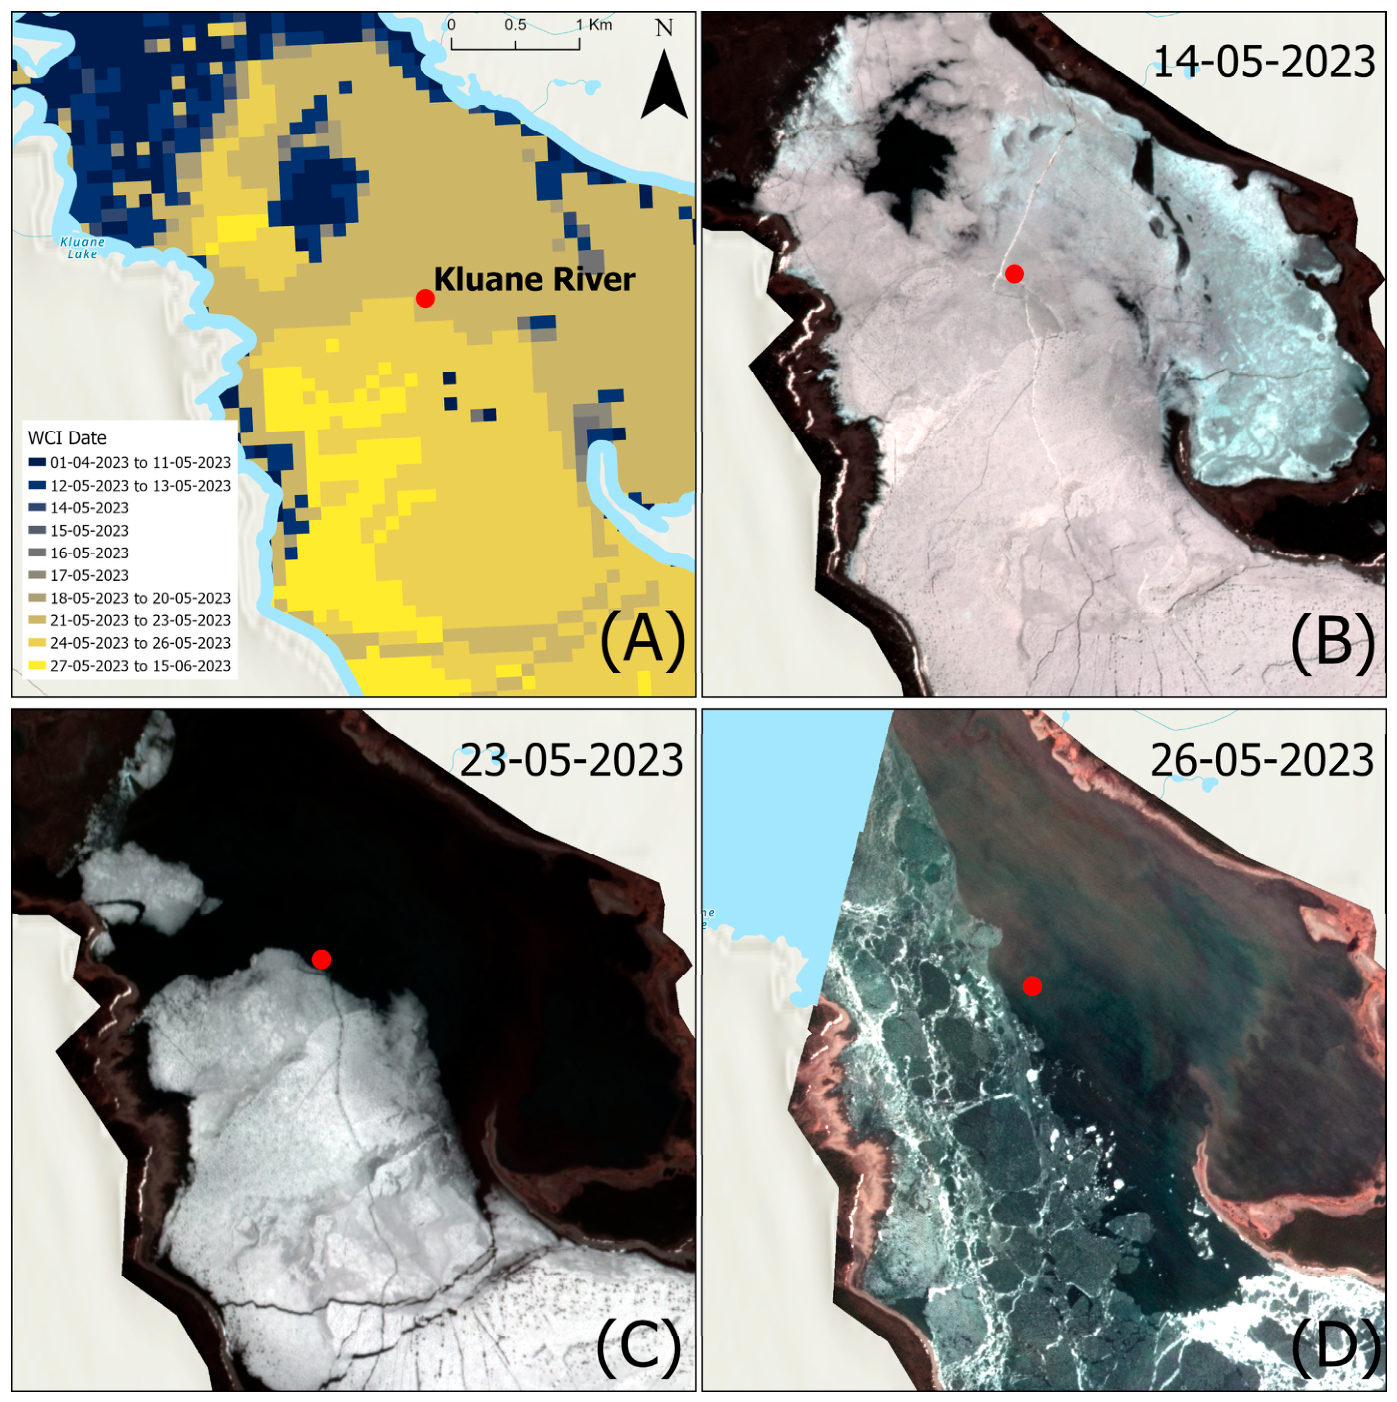
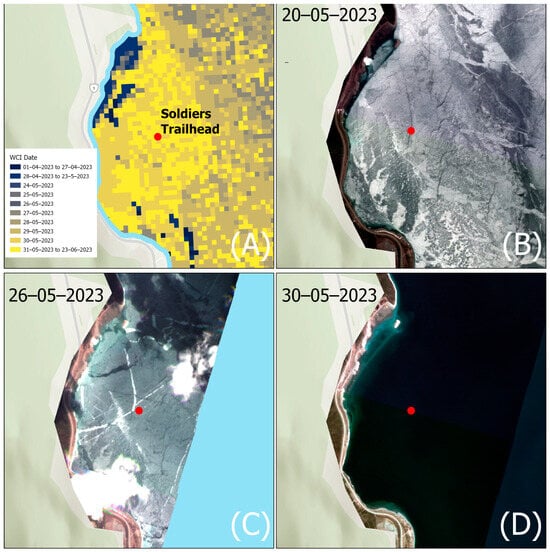
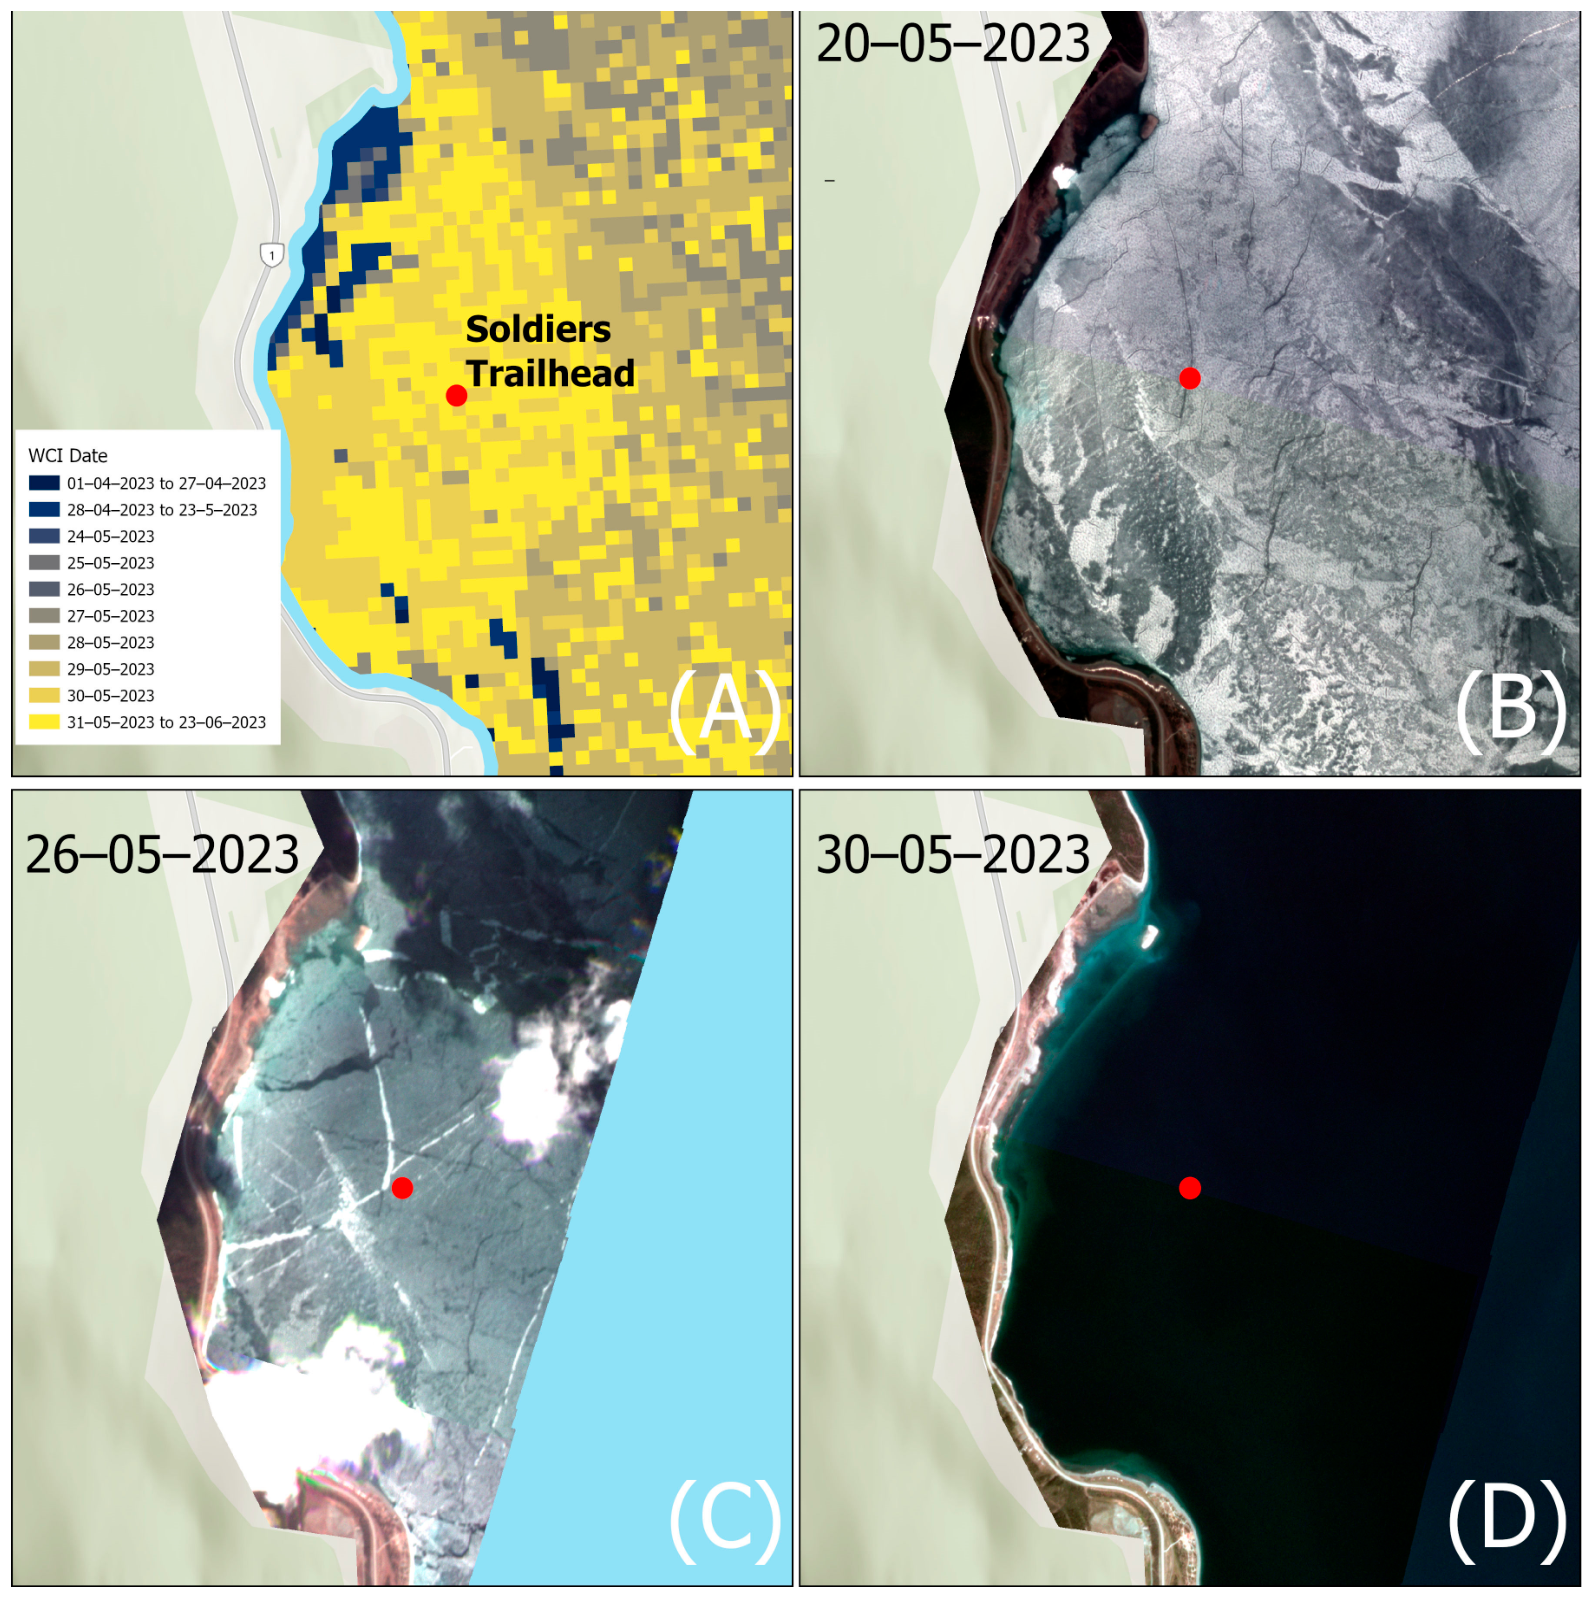
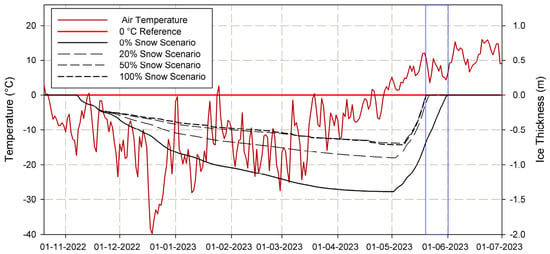
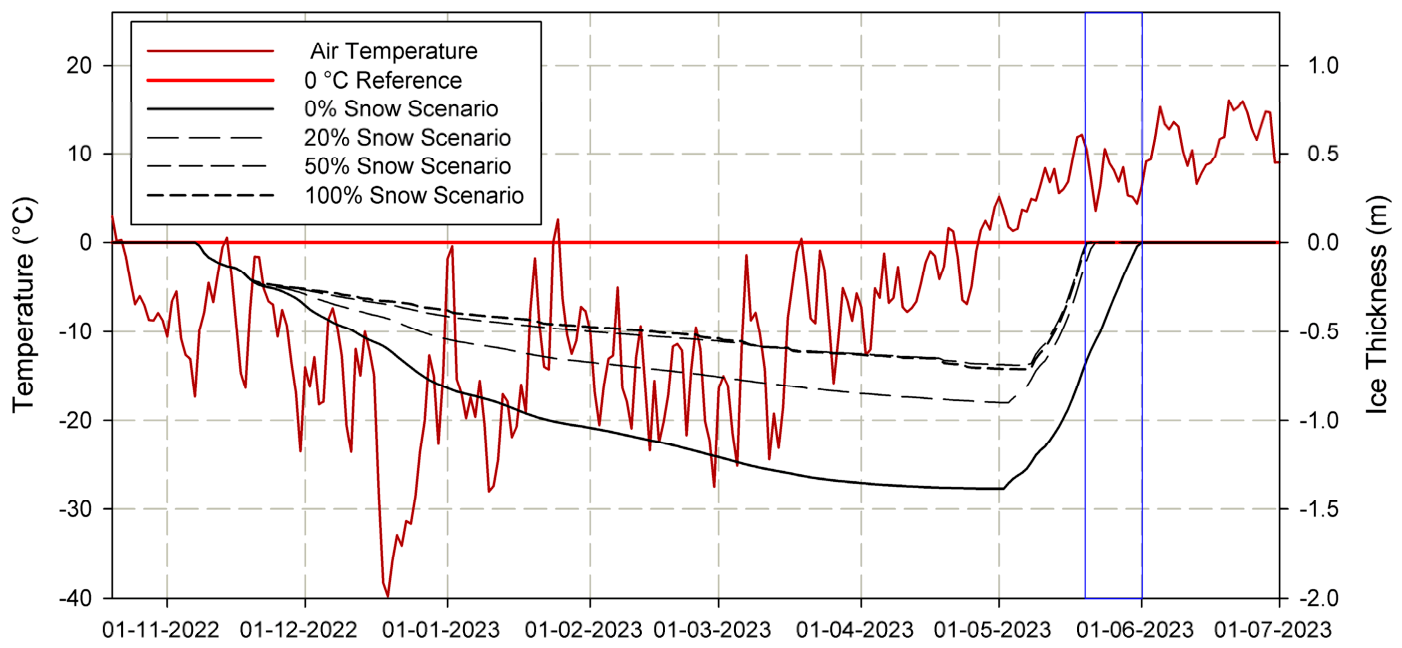
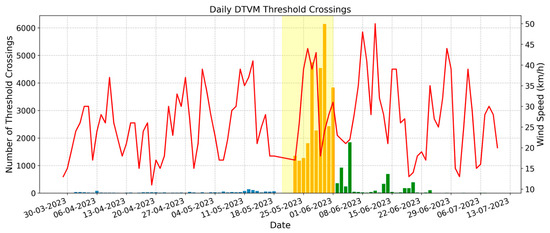
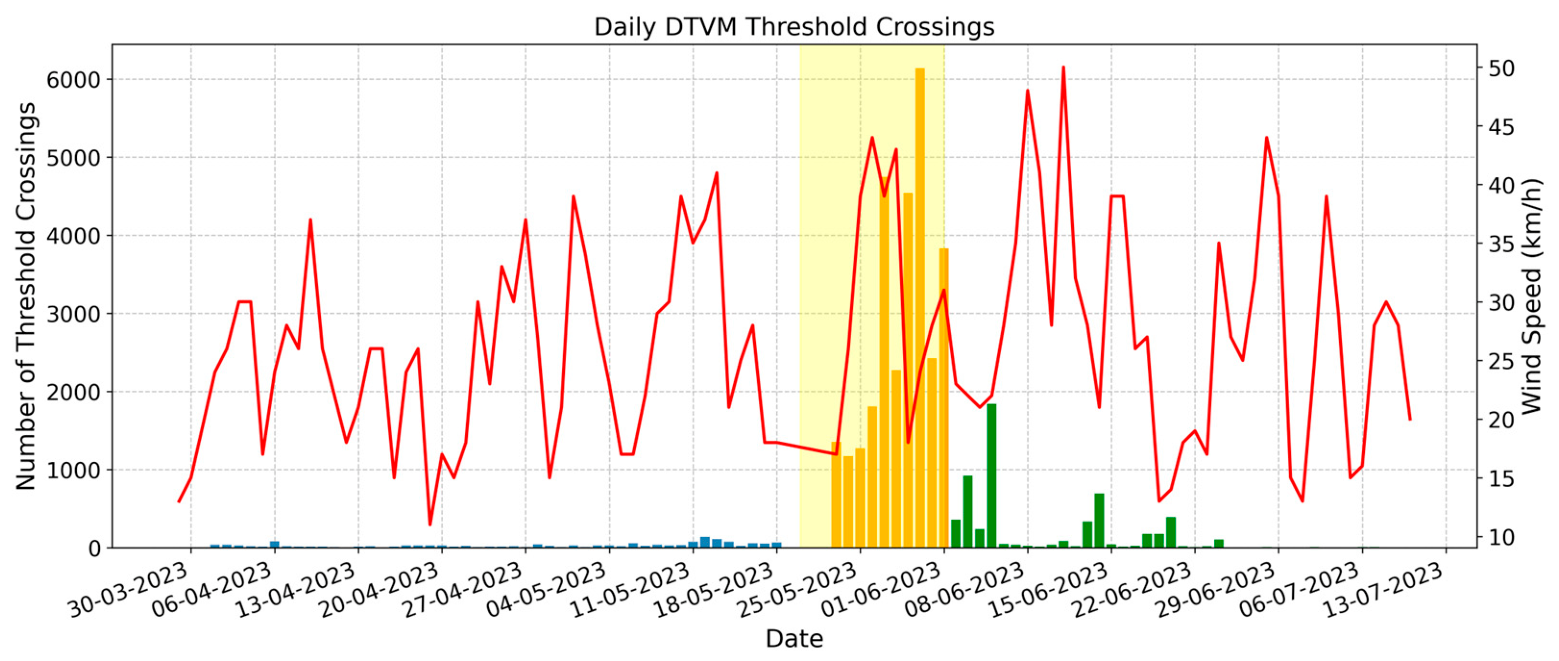
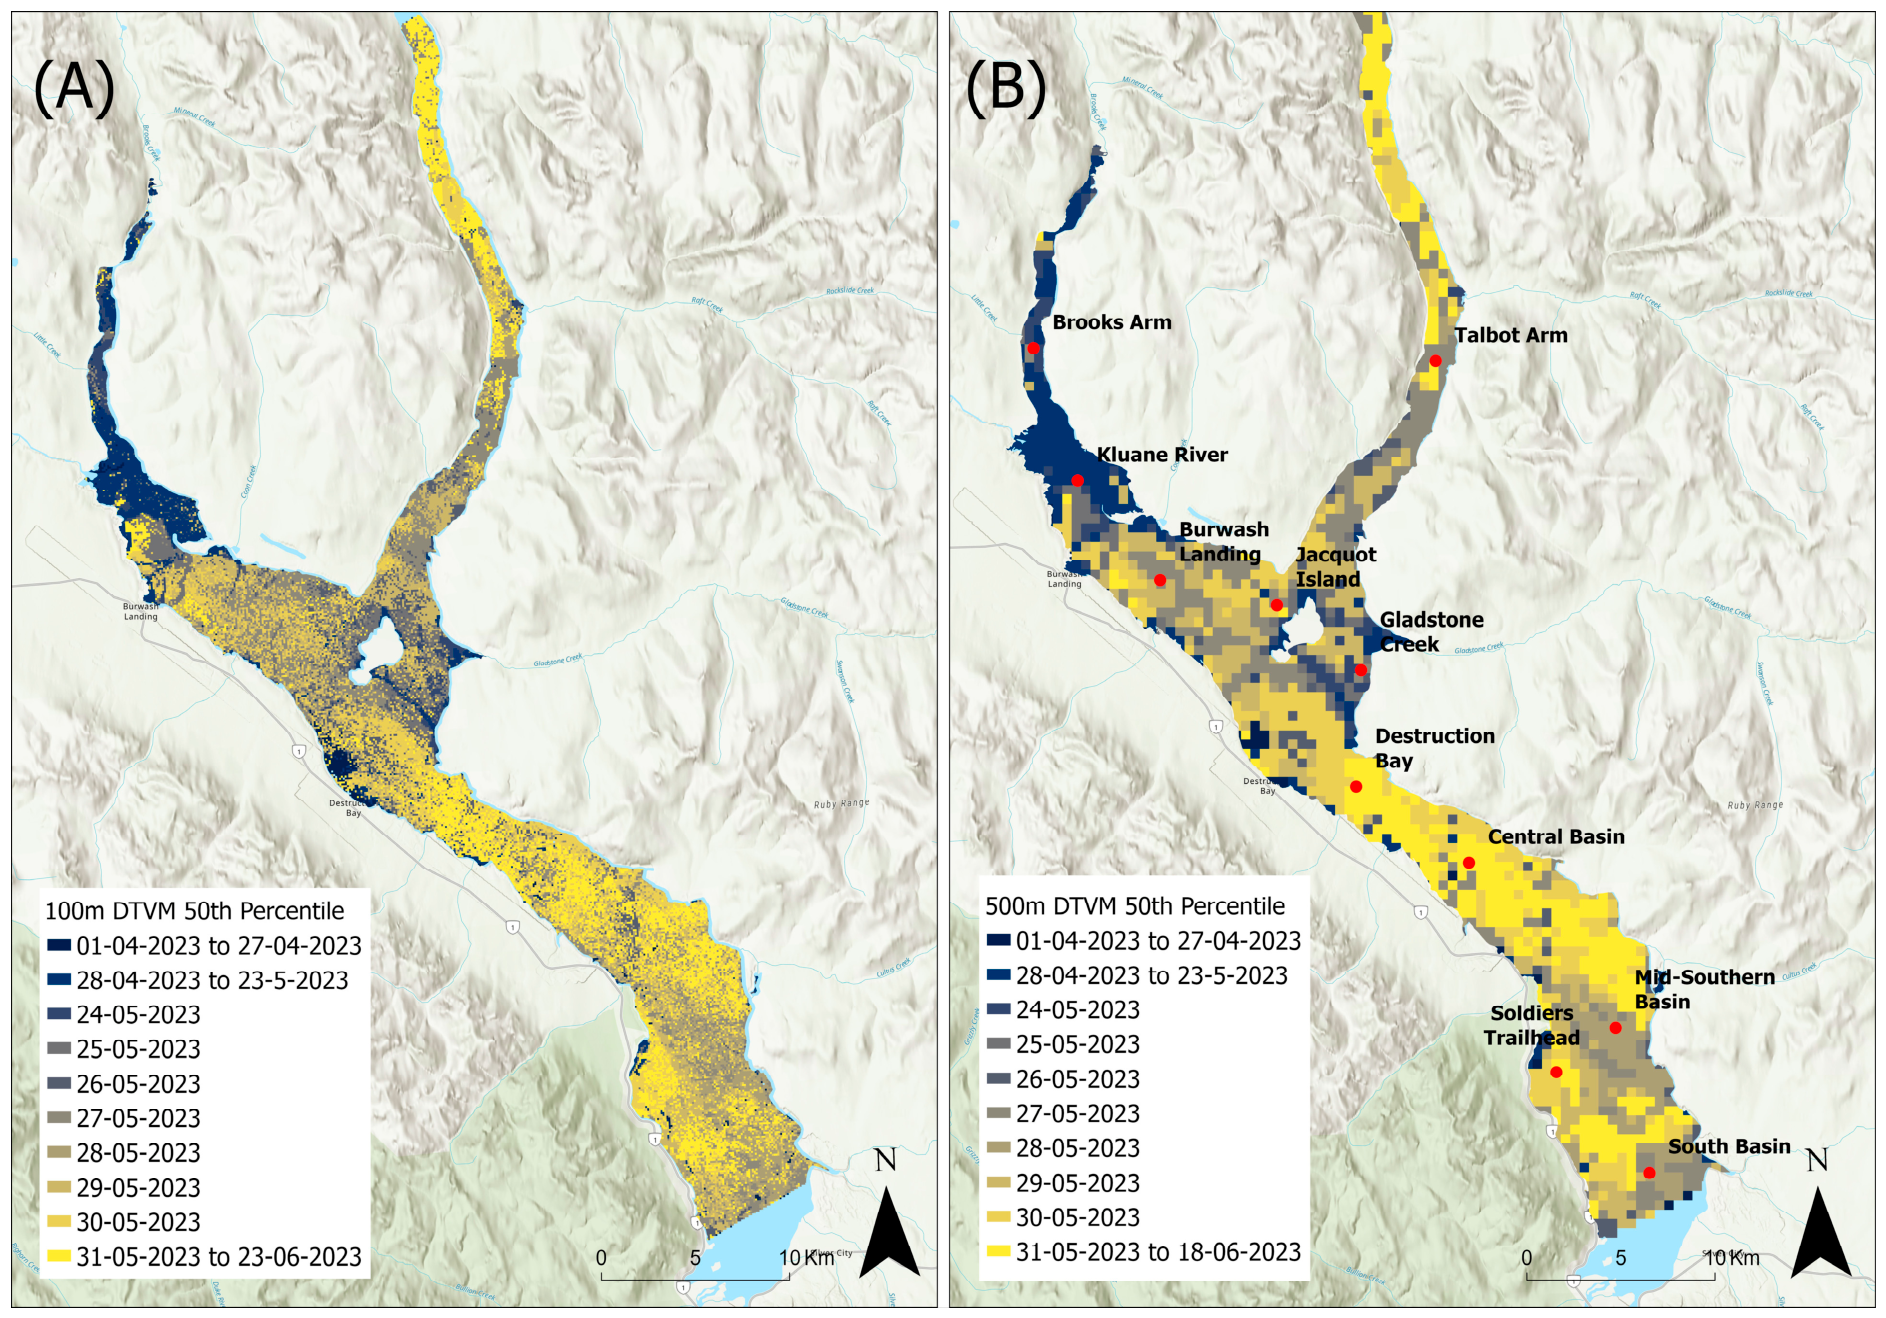

Disclaimer/Publisher’s Note: The statements, opinions and data contained in all publications are solely those of the individual author(s) and contributor(s) and not of MDPI and/or the editor(s). MDPI and/or the editor(s) disclaim responsibility for any injury to people or property resulting from any ideas, methods, instructions or products referred to in the content. |
© 2026 by the authors. Licensee MDPI, Basel, Switzerland. This article is an open access article distributed under the terms and conditions of the Creative Commons Attribution (CC BY) license.