


Highlights
What are the main findings?
- All the four satellite SIC products are generally able to capture the evolution of the sea ice conditions around Svalbard, but differ in their accuracy in determining the ice edge and MIZs.
- SAR and low-frequency AMSR2 channels are effective for determining the lower bound of MIZ, whereas high-frequency AMSR2 channels are more suitable for detecting the upper bound of MIZ.
What are the implication of the main findings?
- Depending on the concerned metrics, application of different SIC products may have different skills for monitoring and prediction of MIZs. A careful selection of the products is highly desirable.
- Accurate determination of MIZs may require significant advancements in satellite observation technologies, retrieval algorithms, and more robust methods for integrating multiple sources.
Abstract
Marginal ice zone (MIZ) is a transitional region between dense pack ice and open water. It is a highly dynamic zone under strong interactions among the atmosphere, ocean, sea ice and waves, playing a crucial role in the polar climate system and ecosystem. Accurate determination of MIZ is, therefore, essential for advancing our understanding, modeling and prediction of the polar climate system and ecosystem. In this paper, we introduce and apply a comprehensive suite of MIZ-related metrics to evaluate the performance of four satellite-derived high-resolution operational sea ice concentration (SIC) products in characterizing the MIZs around Svalbard, using the Norwegian ice chart as reference. The metrics used for evaluation include sea ice extent (SIE), MIZ extent (MIZE), MIZ position, MIZ width, length of ice edge (LIE), integrated ice edge error (IIEE), integrated MIZ error (IME), ice edge distance error (IEDE), and MIZ width error (MWE). The evaluation is based on two years of daily SIC data (2024–2025) from four products, including the Bremen AMSR2 SIC data from the University of Bremen (Bremen SIC), the resolution-enhanced AMSR2 SIC (RE SIC) and Multisensor SIC products (Multisensor SIC) from the Norwegian Meteorological Institute, and the Automated Sea Ice Product (ASIP) from the Copernicus Marine Environment and Monitoring Service (CMEMS) (ASIP SIC). To be consistent with the Norwegian ice chart, the MIZ is defined as MIZ70 and MIZ90, corresponding to SIC thresholds of up to 0.7 and 0.9, respectively. The evaluation results demonstrate that all four satellite SIC products generally capture the evolution of the sea ice conditions around Svalbard well, but differ in their accuracies in characterizng the sea ice edge and MIZs. On the whole, the ASIP product agrees best with the ice chart in describing the sea ice edge and MIZ70 through a large number of metrics, in particular the primary metrics IIEE and IME70. The Bremen SIC product tends to overlook areas with low SIC, leading to a significant underestimate of SIE and a large IIEE. However, it provides an overall close agreement with the ice chart in the MIZE90. The RE SIC product exhibits good performance in capturing the SIE, but tends to notably overestimate the MIZE. Multisensor provides the closest agreement with the ice chart for the IME90, MWE90 and , and ranks as the second-best product for the IIEE, IME70 and . Our results suggest that SAR and low-frequency AMSR2 channels are especially effective for determining the lower bound of the MIZ, while high-frequency AMSR2 channels are more suitable for detecting the upper bound. In addition, the complex summer surface conditions pose significant challenges for satellite sensors in determining the ice edge and MIZ, resulting in large IEDE and MWE during this period. The results highlight both the capabilities and limitations of satellite-based data in characterizing the MIZ, particularly under the challenging summer conditions. Accurate delineation of MIZs may require significant advancements in satellite observation technologies, retrieval algorithms, and more robust methods for integrating multiple sources.
1. Introduction
Marginal ice zone (MIZ) refers to the region of sea ice cover influenced by waves and swell penetrating into the ice from the open ocean [1]. It is a transitional zone between dense pack ice and open water, with the width varying from zero to over hundreds of kilometers. Typical MIZs are found along the southern edges of the Arctic ice pack in the Bering Sea, Greenland Sea, Barents Sea, and Baffin Bay, and along the entire northern edge of the Antarctic sea ice cover [2].
MIZ is a highly dynamic region characterized by strong interactions among the atmosphere, ocean, sea ice and waves. It frequently undergoes intense processes such as rapid sea ice freezing/melting [3,4], mesoscale ocean and atmosphere eddies [5,6], turbulence [7,8], ocean upwelling and downwelling [2,9], therefore, playing a crucial role in the polar climate system. Due to the relatively low sea ice concentration (SIC) and sea ice thickness, the MIZ is also an area much more navigable than the inner dense pack ice, making it an important region for maritime activities [10]. Ocean waves and swell are the primary source of energy for ice breakup in the MIZ and are, therefore, the key driver determining its properties and extent [11,12,13]. The relatively small ice floes in the MIZ play an important role in shaping the mechanical properties of the ice, affecting its response to winds, ocean waves, and ocean currents [14,15]. These small ice floes have a significant effect on the summer sea ice melting, due to the increased lateral perimeters compared to large ice floes over the same area [16]. Therefore, the MIZ not only modulates local processes but also has far-reaching implications for polar climate, seasonal ice cycle, and the overall ice mass balance in the polar regions.
MIZ is a critical region in the polar ocean ecosystems. Extensive phytoplankton blooms, which thrive in the nutrient-rich waters of the MIZ, form the base of the food web and provide a vital food source for a wide variety of species [17]. The MIZ also serves as a crucial habitat for a diverse range of ice-dependent species, such as seals, walruses, and polar bears [18], which use the patchy ice for hunting, breeding, and shelter. Additionally, many seabird species rely on the MIZ for foraging, and Arctic cetaceans like narwhals and belugas use it as a key area for prey and as a refuge from waves. Due to the climate change, changes in the MIZ extent (MIZE) and its physical properties could significantly impact the ecosystems by altering food webs, affecting breeding and hunting grounds for marine mammals, and shifting species distributions [19]. The vital role of MIZ in supporting the diverse species and maintaining the polar ecosystem underscore its importance in the climate-driven transformations, emphasizing the need for continued research and conservation efforts to protect this fragile and essential region.
The sea areas around Svalbard are important for Norwegian marine activities such as shipping, fisheries, tourism, and oil and gas explorations [20]. With the ongoing global warming and retreat of the Arctic sea ice, there has been a remarkable expansion in operational seasons and navigational areas [21]. Sea ice around Svalbard, particularly in the Fram Strait and Barents Sea, presents a major marine hazard and is strongly affected by the atmosphere circulation [22,23], and by the northward warm Atlantic Water [24,25]. Consequently, the sea ice conditions in this area are frequently subject to rapid and complex changes, resulting in rapid and significant variations in the MIZ. High-resolution accurate monitoring and prediction of the MIZ is, therefore, essential to ensure the safety and efficiency of operations in these regions [26,27]. Numerical experiments show that the skill of MIZ prediction is highly dependent on the quality of the initial MIZ conditions [27], underscoring the critical need for precise and reliable observations of the MIZ.
The extensive spatial coverage of the MIZ and the harsh Arctic environment make in-situ observations of the MIZ both extremely challenging and prohibitively expensive. Therefore, remote sensing has become the primary approach for observing the MIZ, based mostly on passive microwave SIC products [28,29,30]. Three high-resolution operational SIC products have been used to study the atmosphere, ocean and sea ice around Svalbard [27,31,32,33,34]. These include the Advance Microwave Scanning Radiometer 2 (AMSR2) SIC from the University of Bremen (Bremen SIC) [35,36], the resolution-enhanced AMSR2 SIC (RE SIC) [37,38] and the Multisensor SIC [39] from the Norwegian Meteorological Institute. In late 2024, a new high-resolution SIC product, the Automated Sea Ice Product (ASIP) [40], became operational under the Copernicus Marine Environment and Monitoring Service (CMEMS). These products generally use the passive microwave radiometer (PMW) and/or Synthetic Aperture Radar (SAR), which can easily penetrate clouds, fog, rain, and polar darkness, thus, ensuring continuous year-round observations.
However, the PMW has its own fundamental limitations. Thin, newly formed ice has an intermediate microwave signature between open water and thick, snow-covered ice [41]. This often causes the PMW sensors misclassifying thin ice as open water, thus, underestimating the SIC and, therefore, SIE. During summer, melt ponds on the ice surface mimics the microwave signature of open water. This would lead the PMW sensors to misinterpret ponded ice as open water, therefore, underestimating the SIC [42], and increasing the possibility to overestimate the MIZE. Such biases are not considered in the previous studies on the MIZ climatology [28,29,30]. This is generally acceptable for climate studies, particularly when the focus is on the historical trend. However, operational marine activities such as shipping and marine oil and gas explorations would require much higher accuracy and higher spatial resolution for safety purposes.
SAR measures surface backscatter. It provides highly detailed imagery and is unaffected by clouds or solar illumination, but faces its own challenges. Calm open water and smooth new ice can appear nearly identical in backscatter intensity. In addition, the radar reflection from ice and open water can change drastically depending on local factors like wind, surface roughness and snow moisture. During summer, melting ice, wet snow and melt ponds absorb or scatter radar signals in complex ways. Consequently, deriving SIC from SAR often requires manual interpretation by ice analysts or advanced AI and deep-learning models [40,43]. By contrast, ice charts are produced by experienced analysts based on a variety of satellite observations. Although its quality varied by personal experience, it is generally a more reliable method in the determination of sea ice edge and MIZ. However, its coarse resolution in the SIC space inherently confines the accuracy in describing the ice conditions and fine features in sea ice, thus, limiting the MIZ prediction skill when being assimilated [27]. Therefore, there is a great need to identify a high-resolution satellite product that can accurately describe the MIZ distribution.
The main purpose of this study is to evaluate the performance of the four high-resolution operational SIC products in observing the MIZ around Svalbard, with an aim of identifying the most suitable MIZ product for operational analysis and prediction. Currently two types of MIZ have been defined, namely traditional MIZ and dynamical MIZ [26]. The traditional MIZ is defined solely based on the SIC, whereas the dynamical MIZ considers the impact of waves and can be approximated through a parameterization with combined SIC and SIT [13,26]. Due to the lack of systematic observations of the dynamical MIZ, this study evaluates the MIZ using the traditional MIZ, which has been available in operational ice services for decades.
MIZ has been described by many metrics. Extent, width and position have been the main metrics for describing the MIZs in the previous studies [28,29,30]. These metrics are useful in characterizing the MIZ climatology and trend. However, they are less appropriate for evaluating the data quality, as they are unable to capture the spatial consistency between two datasets. By contrast, IIEE and IME follow closely the mismatches between two MIZs, so they are more suitable for describing the data quality against a reference dataset. In this study, we introduce a comprehensive suite of metrics to evaluate the four satellite products in determining the MIZ. We hope such a systematic evaluation would also be beneficial for later studies.
The paper is organized as follows. The four satellite products are described in Section 2, together with the Norwegian ice chart. The evaluation metrics are formularized in Section 3, and the evaluation results are presented in Section 4. In Section 5, we summarize the main results and discuss the limitations and other relevant issues. The conclusions are given in Section 6.
2. Data
The study area is highlighted by the thick rectangle in Figure 1. It is the model domain of the Barents-2.5km, an operational ocean and sea ice forecast model at the Norwegian Meteorological Institute [31,33,34]. Barents-2.5km has a horizontal grid resolution of 2.5 km and does not include ocean and sea ice information in the Baltic Sea. To keep consistency, we have also excluded the sea ice in the Baltic Sea in this study.
Figure 1.
Study area: Barents-2.5km model domain shown by the thick rectangle. The grid numbers of the domain are 739 × 949, with the grid length of 2.5 km.
We use the four high-resolution operational remote sensing SIC products mentioned above for evaluation of MIZ in the years 2024–2025. The Bremen SIC and RE SIC rely solely on the AMSR2 observations, while the Multisensor SIC and ASIP SIC utilize both AMSR2 and SAR observations. The Norwegian sea ice charts are used as the reference. To ensure compatibility across datasets, all the SIC data are interpolated to the Barents-2.5km model grid using the nearest neighbor method.
2.1. Bremen AMSR2 SIC
The version 5.4 of the Bremen AMSR2 SIC (Bremen SIC) is used in this study. It applies the Arctic Radiation and Turbulence Interaction Study (ARTIST) Sea Ice (ASI) algorithm, which primarily relies on the polarization difference of 89 GHz channels [35],
where is the brightness temperature, V and H are the vertical and horizontal polarizations. The algorithm uses fixed tie points for 0% () and 100% () SIC, with a standard implementation of for 100% (closed ice) and for 0% (open water). The SIC between open water and 100% ice cover is determined following a third-order polynomial of P. To mitigate the atmospheric influence, the gradient ratios of low-frequency channel pairs are checked against the thresholds [35,36]. Finally, all ASI SICs with corresponding Bootstrap SICs are set to zero [36]. The product is gridded on a polar stereographic grid (EPSG code 3411, Arctic) with a grid resolution of 3.125 km [36]. The uncertainty is not included in the dataset, but can be calculated following the same procedure as in [35], which sums from three sources: radiometric error from the bright temperature, variability of the tie points, and atmospheric opacity. The standard deviation of the derived SIC is highest in the open water and lowest in the very close drift ice, being about 0.25 when SIC = 0, and about 0.057 when SIC = 1.
2.2. Resolution-Enhanced AMSR2 SIC
The resolution-enhanced AMSR2 SIC (RE SIC) is derived by merging two independent AMSR2 SIC products [37,38] through a simple pan-sharpening method [44]
where and are two SIC products with the algorithms developed in the ESA Climate Change Initiative (CCI) project. Both of them apply a hybrid SIC algorithm to combine two optimized algorithms for low and high SIC conditions [37]. The utilizes three low-frequency channels (19V, 37H and 37V), offering SIC fields with reduced measurement uncertainties but at a coarse spatial resolution. The uses measurements solely from the near 90 GHz channels (89H and 89V), providing SIC fields with a higher spatial resolution but large measurement uncertainties. The resolution enhancement is achieved by adding the difference between the high-resolution and its blurred component to the coarser resolution (Equation (2)). This RE SIC product has high spatial resolution while maintaining relatively low measurement uncertainty [38]. The RE SIC data has two products: daily and sub-daily. The daily data is available from January 2022 until May 2025, whereas the sub-daily data is available from October 2023. For this study, we use the sub-daily data in 2024 and 2025, and use the daily data as a supplement when the sub-daily data is unavailable.
2.3. Multisensor SIC
The Multisensor SIC is generated by merging the AMSR2 SIC and SAR data from Sentinel-1 using the optimal interpolation with a variational analysis approach [39]. The AMSR2 SIC here is the same as the one used for the RE SIC (see Equation (2)). The SAR data used are Sentinel-1 dual-polarized (HH/HV polarization combination) recorded in extra wide swath mode of 410 km and a spatial resolution of 93 × 87 m (pixel spacing of 40 × 40 m). The variational analysis is based on techniques commonly used in data assimilation for meteorological models, with the purpose to minimize a cost-function. The cost-function is formulated as the sum of costs from the different satellite SIC products, along with a contribution from the results of the previous data analysis. The uncertainty of each satellite observation, based on the probability of correct classification of the SAR and AMSR2 data, is used as a weight of the respective observations during the merging process. The Multisensor SIC is daily, with a spatial resolution of 1 km and a polar stereographic projection grid.
2.4. ASIP SIC
The Automated Sea Ice Product (ASIP) within the CMEMS is a high-resolution (1 km), machine-learning-based data product used to map and monitor sea ice in the Arctic and Antarctic [40], developed primarily by the Danish Meteorological Institute (DMI). This product leverages satellite radar imagery (SAR) to identify SIC, stage of development, and floe sizes on a granular level. The selected Arctic L4 SIC product here is based on the L3 SIC product retrieved from Sentinel-1 and Radarsat Constellation Mission SAR imagery and the AMSR2 data using a deep learning algorithm, gap-filled with OSI SAF EUMETSAT SIC products. ASIP uses all the available frequencies from the AMSR2 sensor, (6.9, 7.3, 10.7, 18.7, 23.8, 36.5, 89.0 GHz) in H/V polarization (Mitsubishi Electric Corporation, Tokyo, Japan). The automated interpretation of sea ice and water signatures is done using the DMI-ASIP model that has been trained with regional ice charts produced at the DMI Greenland Ice Service and the Canadian Ice Service.
2.5. Norwegian Ice Chart
The Norwegian ice chart is produced daily on working days through manual interpretation of satellite data and supplementary observations such as coastal station and ship reports [45]. The charting process integrates diverse satellite observations to obtain an accurate depiction of the sea ice edge and MIZ. Since the ice charting began in 1967, it has undergone significant advancements, incorporating higher spatial resolution and all-weather capable sensors. The primary satellite data used include the weather-independent SAR data from Sentinel-1, RADARSAT-2, and RADARSAT Constellation Mission. In addition, visual and infrared data from METOP, NOAA Advanced Very High Resolution Radiometer (AVHRR), NOAA Visible Infrared Imaging Radiometer Suite (VIIRS), and Sentinel-3 instruments, such as the Ocean and Land Colour Instrument (OLCI) and Sea and Land Surface Temperature Radiometer (SLSTR), are also utilized under cloud-free conditions. These satellites provide multiple daily coverages of the charting area, enabling the production of a scale-free, vectorized ice chart with a nominal resolution of less than 400 m. For the Copernicus Marine Service, a rasterized NetCDF-format version is also produced, resampled to a 1 km grid spacing [46]. The combination of advanced satellite technology and manual interpretation ensures a high-quality, detailed representation of daily sea ice conditions.
Figure 2 shows a typical winter sea ice condition in the European Arctic. The sea area is divided into seven distinct ice categories: ice-free, open water, very open drift ice, open drift ice, close drift ice, very close drift ice, and fast ice. The corresponding lower and upper bounds for these ice categories are shown in Table 1. It is worth noting that this classification is slightly different from the World Meteorological Organization (WMO) standard classification [1]. For practical applications, the mean value of the lower and upper bounds is employed to represent the SIC for each ice category. In addition, key ice-related parameters such as sea ice extent (SIE) and MIZ are also included in Table 1. The superscripts 70 and 90 represent the upper bounds of the MIZ defined as SIC = 0.7 and 0.9, respectively.
Figure 2.
A typical Norwegian ice chart showing winter sea ice conditions in the European Arctic. The black lines show the areas with available satellite images from Sentinel-1 or RadarSat-2. The red lines show the sea surface temperature isolines.
Table 1.
Typical sea ice categories based on ice concentration together with common ice features defined by the Norwegian ice chart. SIE denotes sea ice extent, and MIZ70 and MIZ90 represent the MIZ with the upper bounds of SIC at 0.7 and 0.9, respectively.
3. Evaluation Metrics
3.1. Sea Ice Extent (SIE) and MIZ Extent (MIZE)
SIE is generally defined as the total surface area of the ocean where SIC . Similarly, MIZE is commonly defined as the total surface area of the ocean where SIC . However, the numbers for these bounds do not have a clear physical interpretation. To be consistent with the classification used in the Norwegian ice chart (see, e.g., Figure 2), we define the SIE as
where A denotes the whole model domain, and the variable C is determined as follows,
where a denotes SIC, and represents the SIC at the sea ice edge, being the demarcation between open water and very open drift ice in the ice chart (Table 1). Similarly we define the MIZE as
where c is determined as follows,
where the lower bound is the SIC at the sea ice edge, and the upper bound is set as 0.7 for MIZ70 and 0.9 for MIZ90. These two upper bounds are used to approximate the traditional upper bound of 0.8, which is not employed in the ice categories of the Norwegian ice chart. Such a redefinition provides a clearer physical interpretation. As discussed in [26,47], the lower bound of 0.1 denotes the demarcation between open water and ice (very open drift ice), while the upper bounds of 0.7 and 0.9 correspond to the transitions between open drift ice and close drift ice, and between close drift ice and very close drift ice, respectively. Open drift ice is characterized by numerous leads and unconnected ice floes, whereas close drift ice consists primarily of connected floes. Setting the upper bound at 0.7 for MIZ has practical implications for navigation, as it effectively highlights the regions with lower risks.
3.2. Length of Ice Edge (LIE)
LIE is calculated following [48], where the ice edge locations are first determined based on the following condition
where are the indices of the 2D gridded SIC, and ∧ is the logical AND operator. The length through an individual edge grid cell is calculated by counting the number, n, of the neighboring edge grid cells (, and ) in the same product [48]
where l is the grid length of the square grid cell, being 2.5 km in the present Barents-2.5km model domain. Thus, LIE is the sum over all the edge grid cells
3.3. MIZ Width (MW)
The MIZ width can be estimated following [28,29]
3.4. MIZ Position
The MIZ position can be calculated by the average of its spatial locations (longitude and latitude ) in the MIZ [28]
When all the grid areas are the same—for example, in the present Barents-2.5km model domain—the MIZ position is simply the arithmetic averages of the longitude and latitude in the MIZ. For simplicity, we neglect the overbar and use and to represent the MIZ position in the text below.
3.5. Integrated Ice Edge Error (IIEE)
The IIEE is determined following [49]
where A denotes the whole model domain, C is determined following Equation (4), the subscripts f and r denote the estimate (here the four satellite observations) and the reference (here the Norwegian ice chart). In general, the reference dataset should be of higher quality for the compared property. The first term on the right side of Equation (13) denotes the overestimate, and the second term denotes the underestimate.
3.6. Ice Edge Distance Error (IEDE)
While the IIEE measures the area of mismatch between two fields, the IEDE assesses the mean distance between two ice edges. The average IEDE can be calculated [48]
where and are the estimated and reference LIEs, respectively. An alternative estimate of the IEDE is to use the instead of the average such that
Here and are the average and reference IEDEs.
3.7. Integrated MIZ Error (IME)
3.8. MIZ Width Error (MWE)
Similar to the IEDE, we introduce MWE to represent the mean width error of IME. Thus, we get the average MWE, which is normalized by the average ,
and the reference MWE, which is normalized by ,
4. Results
In this section, we evaluate the four satellite-derived high-resolution operational SIC products (Bremen, RE, Multisensor and ASIP) from 2024–2025, using the metrics described in Section 3. Unlike reprocessed data, operational data often contain some defects, resulting in incomplete datasets. However, these data are also the main base of operational services, as reprocessed data is generally unavailable at the near-real time. Therefore, evaluation of operational data is of its own significance. To perform a fair evaluation, we have employed the following data refinement. First, the ice along the mainland Norwegian coast is removed. Secondly, the sea ice in Kara Sea is removed in the calculation of the time series of the metrics, but still maintained when showing the spatial distributions for completeness. Such removals do not affect the overall presentation of the MIZ around Svalbard, but can mitigate possible bias in some of the products. Thirdly, a nearest-neighbor interpolation method is used to fill the coastal grids when there were no observations. Finally, we only use the data consistent with the Norwegian ice chart, which is only available on working days. Consequently, we obtained 490 daily data for the years 2024–2025.
4.1. Typical Daily MIZ Distribution
Figure 3 illustrates a typical daily SIC distribution during the winter season, highlighting significant differences between MIZ70 and MIZ90 (cf. Figure 3a,f). The total area of MIZ90 is notably larger than that of MIZ70, particularly in the Greenland Sea, Barents Sea and west of Franz Josef Land. The four satellite SIC products generally capture the MIZ characteristics demonstrated by the ice chart, though with varying degrees of accuracy. For instance, the Bremen SIC apparently underestimates the MIZ, both for MIZ70 (Figure 3a vs. Figure 3b) and MIZ90 (Figure 3f vs. Figure 3g), with the most pronounced underestimation in the southern Greenland Sea. By contrast, the RE SIC tends to slightly overestimate the MIZ in both MIZ70 and MIZ90, particularly to the east of Svalbard for the MIZ70 (cf. Figure 3a,c), and to the west and north of Svalbard for the MIZ90 (cf. Figure 3f,h). The Multisensor and ASIP SIC products exhibit a tendency to underestimate the MIZ, in particular to the east of Svalbard and in Fram Strait for the MIZ70 (Figure 3a vs. Figure 3d,f), and in the Greenland Sea and Fram Strait for the the MIZ90 (Figure 3f vs. Figure 3i,j). In addition, there is a long and narrow MIZ along the west coast of Novaya Zemlya in both MIZ70 and MIZ90, but it appears together with dense pack ice in the Bremen, RE and Multisensor products, and is nearly missing in the ASIP product.
Figure 3.
Daily SIC distributions from observations (Ice chart, Bremen, RE, Multisensor and ASIP) with MIZ70 (a–e) and MIZ90 (f–j) on 19 February 2024. The ice cover is separated into dense pack ice (red), MIZ (yellow) and open water (light blue). The blue lines show the ice edge of the ice chart, and the green lines show the demarcation between MIZ and dense pack ice of the ice chart.
The difference between MIZ70 and MIZ90 represents the area of close drift ice, where the SIC ranges from 0.7 to 0.9. Within the extensive regions of dense pack ice, patches of close drift ice are evident in the Bremen and Multisensor products for MIZ90 (Figure 3g,i). By contrast, such patches are absent in the ice chart (Figure 3f) and only sporadically present in the RE SIC product (Figure 3h), and rare in the ASIP SIC product. This discrepancy can likely be attributed to the data sources used by these products. The Bremen and Multisensor SIC rely on AMSR2 high-frequency (89 GHz) channels, whereas RE and ASIP incorporate lower-frequency AMSR2 channels as well as the high-frequency channel data. The exclusive use of AMSR2 high-frequency channels may also contribute to the notable underestimation of the ice edge in the Greenland Sea and east of Franz Josef Land observed in the Bremen product.
4.2. Sea Ice Extent (SIE)
Figure 4 illustrates the calculated SIEs and the biases during 2024–2025. It is seen that all the products show a clear seasonal cycle in the SIE, with the maximums in early April and the minimums in mid-September (Figure 4a). The mean SIEs show small variations across the four satellite products. The Bremen SIC product reports the lowest mean SIE (9.03 × 10⁵ km2), while the RE SIC product shows the largest mean SIE (9.69 × 10⁵ km2).
Figure 4.
Seasonal evolution of the SIEs in the Barents-2.5km domain during 2024–2025: (a) SIE, and (b) Bias of SIE. The biases of the SIE are calculated via the satellite observations (Bremen, RE, Multisensor and ASIP)—Ice chart.
The biases indicate that all the satellite products predominantly underestimate the SIE compared to the ice chart, with overestimation occasionally observed in the RE product. Among the four products, the RE product demonstrates a remarkably smaller SIE bias (−0.22 × 10⁵ km2) than the others, suggesting that the RE SIE is statistically more consistent with the ice chart SIE. ASIP has the second lowest SIE bias (−0.34 × 10⁵ km2) to the ice chart, which is noticeably smaller than Multisensor (−0.55 × 10⁵ km2). Bremen has the largest underestimate in the SIE, reaching about −0.89 × 10⁵ km2. These results suggest that the low-frequency AMSR2 channels may play an important role in determining the sea ice edge. As described in Section 2, RE and ASIP use both high- and low-frequency AMSR2 channels, which provides a close representation of the SIE compared to the ice chart. By contrast, the Bremen SIC product relies solely on the high-frequency (89 GHz) channels, which has limited capability in capturing the areas of low SIC (see, e.g., Figure 2). This deficiency results in pronounced underestimation of the SIE in the Bremen product. Using the Sentinel-1 SAR improves the the Multisensor SIE. However, its SIE is still markedly underestimated compared to the ice chart, resulting in the second-largest SIE bias among the four products.
4.3. MIZ Extent (MIZE)
The seasonal evolutions of MIZE70 for all the products are shown in Figure 5, together with the biases against the Norwegian ice chart. Compared with the SIE (Figure 4), the MIZE70 demonstrates more pronounced high-frequency temporal variations and less distinct seasonal cycle. On the whole, Bremen, Multisensor, ASIP and the Norwegian ice chart exhibit consistently low MIZE70 values, ranging from 1.28 to 1.63 × 10⁵ km2, whereas the RE product shows comparatively higher values of 2.28 × 10⁵ km2. The minimum MIZE70 generally occurs between late September and mid-October, however, with a secondary minimum typically observed from late March to early April, although with some fluctuations (Figure 5a). These periods are often coincident with the transitions between refreezing and melting, suggesting a possible influence of thermodynamic processes on the MIZE.
Figure 5.
Seasonal evolution of the MIZE70s in the Barents-2.5km domain during 2024–2025: (a) MIZE70, and (b) Bias of MIZE70. The biases are calculated via the satellite observations (Bremen, RE, Multisensor and ASIP)—Ice chart.
As shown in Figure 5a, the RE product reports the largest MIZE70 among the four products during 2024–2025 and the largest positive bias relative to the Norwegian ice chart (0.75 × 10⁵ km2; Figure 5b), despite its SIE agrees best with the ice chart (Figure 4). ASIP agree best with the ice chart in the MIZ70 among the four satellite observations, with the bias of 0.11 × 10⁵ km2. The Bremen and Multisensor both underestimate the MIZ70, with similar biases of about −0.23 × 10⁵ km2.
Figure 6 illustrates the seasonal evolution of the MIZE90 and its associated bias. The MIZE90 values of the four satellite observations are nearly (Bremen) or more than double (RE, Multisensor, and ASIP) of their MIZE70 values, whereas the ice chart MIZE90 is approximately 60% higher than its MIZE70. Similar to MIZE70, the MIZE90 shows high-frequency temporal variations and a less distinct seasonal cycle. The MIZE90 minimums are observed between late September and early October as the MIZE70. However, the secondary minimum is generally imperceptible.
Figure 6.
Seasonal evolution of the MIZE90s in the Barents-2.5km domain during 2024–2025: (a) MIZE90, and (b) Bias of MIZE90. The biases are calculated via the satellite observations (Bremen, RE, Multisensor and ASIP)—Ice chart.
On the whole, the Bremen MIZE90 provides the closest agreement with ice chart (zero bias). The other three satellite observations all overestimate the MIZE90 when compared with the ice chart, in particular the RE product (Figure 6a). The Multisensor MIZE90 has the second lowest bias of 0.51 × 10⁵ km2. By contrast, the RE and ASIP products show considerably high overestimation, being 2.08 × 10⁵ km2 and 1.10 × 10⁵ km2 larger than the ice chart, respectively.
The absolute biases of MIZE90 are significantly larger than those of MIZE70 for the RE and ASIP products (Figure 5b vs. Figure 6b), suggesting that the overestimation of MIZE90 in these two products arises primarily from the overestimation of close drift ice. The Multisensor product shifts from underestimation in MIZE70 to overestimation in MIZE90, indicating a similar overestimation of the close drift ice. The relatively small bias in the MIZE70 and the much larger bias in the MIZE90 imply that very close drift ice is likely misclassified as close drift ice in these products. However, such misclassification could also result from overlooking of close drift ice during the ice charting. More studies are needed to clarify this uncertainty.
4.4. Length of Ice Edge (LIE)
Figure 7 illustrates the seasonal evolution of the LIEs during 2024–2025. The seasonal cycle of the ice chart LIE is pronounced (Figure 7a), with a clear minimum occurred repeatedly from late September to early October. From October onward, the LIE increases steadily and remains relatively stable from December to late June, with occasional short-lived spikes in LIE. From July, the LIE generally undergoes a systematic decline until it reaches the annual minimum. On the whole, the minimum and maximum LIEs of the ice chart reach 0.20 × 10⁴ km and 1.57 × 10⁴ km, respectively.
Figure 7.
Seasonal evolution of the LIE in the Barents-2.5km domain during 2024–2025: (a) LIE, and (b) Bias of LIE. The biases are calculated via the satellite observations (Bremen, RE, Multisensor and ASIP)—Ice chart.
The qualities of the LIEs can be seen more clearly in the bias (Figure 7b). On the whole, RE and ASIP demonstrate much better consistency with the ice chart. The RE LIE has a zero mean bias, and the ASIP LIE bias is generally small (0.09 × 10⁴ km). In addition, ASIP has a much better temporal consistency with the ice chart, as shown in Figure 7b by the much smaller uncertainty (0.13 × 10⁴ km). Bremen and Multisensor significantly overestimate the LIE, both over 60% larger than the ice chart LIE. This overestimation can primarily be attributed to the different sensors used. Due to the lower capability in capturing the lower SIC areas, the sea ice edges are much more complex in the Bremen and Multisensor products (see, e.g., Figure 2), resulting in much longer LIEs.
4.5. MIZ Width
Figure 8 shows the seasonal evolution of the MIZ70 width together with the bias. As shown in Figure 8a, the ice chart MIZ width exhibits clear seasonal cycles. The width remains relatively small during October to June, and increases rapidly from August to September, reaching a maximum of about 50 km. This gives a remarkable contrast to the SIE which reaches the minimum in September (Figure 4). This overall evolution pattern is well captured by the ASIP product, although ASIP provides a notably larger maximum width during August to September. The RE MIZ70 width remains relatively large throughout the years. The MIZ70 width of the Bremen and Multisensor products are considerably smaller, being less than half of the ice chart width on average (Figure 8a).
Figure 8.
Seasonal evolution of MIZ70 width in the Barents-2.5km domain during 2024–2025: (a) MIZE70 width, and (b) Bias of MIZE70 width. The biases are calculated via the satellite observations (Bremen, RE, Multisensor and ASIP)—Ice chart.
The overall performance can be much more easily seen in the bias (Figure 8b). On the whole, ASIP provides a closest agreement in the MIZ70 width with the ice chart, with a mean bias of 0.87 km (Figure 8b). Its MIZ70 width is slightly underestimated in most months, but appears markedly overestimated during August and September. By contrast, RE generally overestimates the MIZ70 width, but tends to underestimate the width during the summer months. The difference in the MIZ70 width is generally very small between Bremen and Multisensor, both underestimating the width throughout the years, in particular during the summer months (Figure 8b).
The MIZ90 width is generally double of the MIZ70 width (cf. Figure 8a and Figure 9a). It is seen that the RE MIZ90 width is significantly overestimated throughout the years. Its mean width reaches 64.84 km, nearly double of the ice chart MIZ90 width of 37.35 km. ASIP generally provides a good estimate of the MIZ90 width during the cold season from December to May. However, it significantly overestimates the width from July to October. By contrast, Bremen and Multisensor generally underestimate the MIZ90 width, both being about 2/3 of the ice chart MIZ90 width.
Figure 9.
Seasonal evolution of MIZ90 width in the Barents-2.5km domain during 2024–2025: (a) MIZE90 width, and (b) Bias of MIZE90 width. The biases are calculated via the satellite observations (Bremen, RE, Multisensor and ASIP)—Ice chart.
All the satellite products have large mean biases for the MIZ90 width, with the absolute values all over 10 km (Figure 9b). On the whole, Multisensor agrees best with the ice chart, with the mean bias of −12.11 km. Bremen, Multisensor and ASIP generally have small biases from January to May. However, during the summer months ASIP significantly overestimates the MIZ90 width, whereas Bremen and Multisensor notably underestimate the width. The RE MIZ90 width has the largest mean bias of 27.41 km.
4.6. MIZ Position
The seasonal evolution of the MIZ70 position, represented by the mean longitude and mean latitude , is illustrated in Figure 10 and Figure 11. As shown by the ice chart, is significantly larger (eastward) during the cold season from November to June than the melting season from August to October (Figure 10a). This is consistent with the larger SIE during the cold season, which has more eastward sea ice edges and MIZs in the Barents Sea and Greenland Sea (see Figure 1). Consistent with the ice chart, all the four satellite observations show significant short-term variations in (Figure 10a). The mean longitudes of these four satellite products range from 22.84–27.04°, showing eastward biases compared with the ice chart (20.62°).
Figure 10.
Seasonal evolution of the mean longitude of MIZ70 in the Barents-2.5km domain during 2024–2025: (a) mean longitude , and (b) Bias of the mean longitude. The biases are calculated via the satellite observations (Bremen, RE, Multisensor and ASIP)—Ice chart.
Figure 11.
Seasonal evolution of the mean latitude of MIZ70 in the Barents-2.5km domain during 2024–2025: (a) mean latitude , and (b) Bias of the mean latitude. The biases are calculated via the satellite observations (Bremen, RE, Multisensor and ASIP)—Ice chart.
The seasonal evolution of the longitudinal biases of the MIZ70 can be clearly seen in Figure 10b. The four products have a similar seasonal pattern, with the biases generally small from January to June, but notably larger from mid-July to late September. The large overestimation of during the summer time is mainly due to the following reasons. The Bremen and Multisensor products often overlook the MIZ in the Greenland Sea and Fram Strait (e.g., Figure 2), which are located in the west of the prime meridian. Overlooking the corresponding MIZ would increase the mean longitude . In addition, RE, Multisensor and ASIP often misclassify close and very close drift ices as open drift ice around the North pole, which lies in the east of the prime meridian commonly of large longitude (Figure 1). The extra misclassified MIZ70 would also increase the mean longitude . On the whole, ASIP has the lowest mean bias, being 2.11° (about 48 km at 78.24°). The other three products have notably larger biases, all more than double of the ASIP bias on average.
The seasonal evolution of the latitude of MIZ70 is generally more smooth (Figure 11a). Unlike the of MIZ70 (Figure 10a), has a clear seasonal cycle, with the minimum in April and maximum in September, inversely correlated with the SIE (Figure 4). In most cases, the four satellite observations produce a more northward (Figure 11b), which is consistent with the underestimate of the SIE (Figure 4b). On the whole, ASIP provides a closest estimate of for the MIZ70 (bias 0.48°, equivalently 52.8 km), whereas the biases of the other products are all over 0.60° (about 66 km). Similar to the longitude , the latitudes of RE, Multisensor and ASIP are also significantly overestimated in August and September, indicating large northward biases.
The seasonal evolution of the MIZ90 position is shown in Figure 12 and Figure 13. Similar to the MIZ70 longitude, the MIZ90 longitude exhibits strong short-term variations with eastward biases. During the winter period (November to June), the mean longitudes of the four satellite observations follow closely to the the ice chart, whereas during the summer period (July to September) is significantly overestimated. On the whole, ASIP reports the lowest mean bias of 2.90°. The other products have similar bias levels to the MIZ70.
Figure 12.
Seasonal evolution of the mean longitude of MIZ90 in the Barents-2.5km domain during 2024–2025: (a) mean longitude , and (b) Bias of the mean longitude. The biases are calculated via the satellite observations (Bremen, RE, Multisensor and ASIP)—Ice chart.
Figure 13.
Seasonal evolution of the mean latitude of MIZ90 in the Barents-2.5km domain during 2024–2025: (a) mean latitude , and (b) Bias of the mean latitude. The biases are calculated via the satellite observations (Bremen, RE, Multisensor and ASIP)—Ice chart.
The latitudes of the MIZ90 also have a clear seasonal cycle, with the minimum in April and maximum in September (Figure 13a). All the satellite observations show large northward biases in the latitude , except occasionally southward biases in the Bremen product (Figure 13b). The Bremen product has the smallest mean bias of the MIZ90 (1.06°, about 116.6 km). While ASIP provides a closest to the ice chart, it is the Bremen product that gives a closest to the ice chart.
4.7. Integrated Ice Edge Error (IIEE) and Ice Edge Distance Error (IEDE)
Figure 14 shows the seasonal evolution of the IIEE and IEDE for all the four satellite observations validated against the ice chart. The IIEE is an essential metric for the evaluation of MIZ focusing on the lower bound (here SIC = 0.1). Unlike the bias of LIE, IIEE provides an measure of ice edge error by accounting for spatial mismatches. Among the four products, the Bremen product has the largest mean IIEE (1.23 × 10⁵ km) throughout the period (Figure 14a), primarily due to its limitation in detecting regions of low SIC compared to the ice chart (Figure 3). By contrast, the ASIP product has the lowest mean IIEE (0.62 × 10⁵ km), about half of the Bremen IIEE. The Multisensor product has a mean IIEE of 0.79 × 10⁵ km, being the second lowest IIEE.
Figure 14.
Seasonal evolution of the ice edge errors in the Barents-2.5km domain during 2024–2025: (a) IIEE, and (b) , the IIEE normalized by the average LIE, and (c) , the IIEE normalized by the reference LIE.
Figure 14b,c illustrate the and , which represent the IIEE normalized by and , respectively. The magnitudes and variations of for all four products are less than those of as reflected in their respective means and standard deviations. Regardless of the normalization method, Bremen consistently exhibits the largest mean IEDE (13.73 km for ; 19.64 km for ), whereas ASIP demonstrates the smallest mean IEDE (8.39 km for ; 8.94 km for ). Notably, the differences in IEDE between the two normalization approaches are minimal for ASIP and RE, generally less than 1.5 km. This indicates a consistent representation of LIE in these two products relative to the ice chart. By contrast, Bremen and Multisensor products show larger differences in IEDE between the two normalizations methods (4.0 km for Multisensor, 5.9 km for Bremen), indicating less consistency in their alignment with the ice chart.
The ASIP IIEE is noticeably smaller than that of Multisensor (Figure 14a). Its is also notably lower, with a mean difference of 3.37 km (Figure 14c). However, its is slightly larger than that of the Multisensor product (Figure 14b). Conversely, while the Bremen IIEE is significantly larger than that of the RE product (Figure 14a), their values differ only slightly (mean difference of 1.57 km). Their values vary more widely, averaging around 5.9 km (Figure 14b). Overall, the evaluation of the ice edge using IIEE and is more consistent (cf. Figure 14a,c), as all the IIEEs are normalized against the same ice chart LIE.
4.8. Integrated MIZ Error (IME) and MIZ Width Error (MWE)
The IME is the central metric for evaluating the accuracy of an operational SIC product in describing the spatial distribution of MIZ. Its corresponding normalized metric, MWE, is designed to provide a more intuitive description. Figure 15 shows the seasonal evolution of IME70 and MWE70 for all the four satellite observations. Overall, the Multisensor and ASIP products demonstrate noticeably lower IME70 compared to the Bremen and RE products (Figure 15a), indicating the critical role of SAR observations in improving the accuracy of MIZ detection.
Figure 15.
Seasonal evolution of the MIZ70 errors in the Barents-2.5km domain during 2024–2025: (a) IME70, and (b) , the IME70 normalized by the average LIE, and (c) , the IME70 normalized by the reference ice chart LIE.
Similar to the IEDEs (Figure 14b,c), the variations of MWE70 in the two normalizations are most pronounced during the summer seasons (Figure 15b,c), which can be up to 60–110 km. Among the products, RE consistently has the highest MWE in both normalizations, followed by Bremen. By contrast, ASIP and Multisensor have lower MWEs, with ASIP recording the lowest , and Multisensor reporting the lowest .
Except for the Bremen product, the other three satellite observations nearly double the IME when the upper bound of MIZ is increased from 0.7 to 0.9 (Figure 15a vs. Figure 16a), indicating the overall significant overestimation of close drift ice. The mean Bremen IME90 is 2.52 × 10⁵ km2, slightly higher than its IME70 value of 1.88 × 10⁵ km2. This suggests the Bremen classification of close drift ice agrees reasonably well with the ice chart, particularly when compared to the other satellite products. When increasing the upper bound of MIZ, the Multisensor product has the lowest mean IME90 (2.28 × 10⁵ km2), followed by ASIP of 2.33 × 10⁵ km2, while the RE product has the highest mean (3.22× 10⁵ km2) among the four satellite observations.
Figure 16.
Seasonal evolution of the MIZ90 errors in the Barents-2.5km domain during 2024–2025: (a) IME, and (b) MWE normalized with the average LIE, and (c) MWE normalized with the ice chart LIE.
The seasonal patterns of MWE90 (Figure 16b,c) are similar to those of MWE70 (Figure 15b,c), except the amplitudes during the summer seasons are more pronounced. When comparing the MWEs under the two normalizations, the Multisensor product consistently has the lowest MWEs (25.23 km for ; 37.72 km for ), while the RE product has the highest MWEs (48.48 km for ; 54.66 km for ), highlighting the better performance of Multisensor in representing the MIZ90. The mean MWE90s for Bremen (27.46 km for ; 38.91 km for for ) are comparable to those of Multisensor, suggesting that the high-frequency AMSR2 channels are more valuable for the determination of close drift ice.
5. Discussion
5.1. Overall Assessment
MIZ is a critical region for the polar climate system and ecosystems. For different purposes, a number of metrics have been proposed in describing the MIZ properties [28,47,49,50]. These metrics have been extended in the present study to provide a more comprehensive evaluation. All the metrics have been analyzed in Section 4 with a primary focus on the seasonal evolution. Here, we summarize these findings and present a statistical overview of the products. Table 2 summarize the metrics, along with their biases and uncertainties, evaluated against the Norwegian ice charts. The best-performance products for each metric is highlighted in bold in Table 2. Within these metrics, IIEE and IME are the primary metrics, as our main concern is to assess the four satellite products in describing the MIZ spatial consistency with the ice chart. The other metrics provide complementary information to further characterize the MIZ.
Table 2.
Summary of the four satellite SIC observations in describing the MIZs around Svalbard during 2024–2025. The bold numbers show the highest scores for the corresponding metrics. The superscripts 70 and 90 represent the upper bound being 0.7 and 90 for the defined MIZ, respectively. The subscripts a and r represent the average LIE and ice chart LIE being used for normalization, respectively.
5.1.1. Primary Metrics
IIEE and IME are two key metrics for evaluating the quality of satellite products in describing the MIZ, expressed as the total misclassified areas. As can be clearly seen in Table 2, the ASIP product provides the lowest IIEE and IME70, indicating a closest agreement with the ice chart. This is reasonable given that ASIP incorporates the largest number of satellite observations, in particular its constituent SAR products serve as the main reference for ice charting [45]. The Multisensor product has the second lowest IIEE and IME70, due most probably to the use of SAR products. The RE product generally has a comparable quality of the sea ice edge with the Multisensor product (similar mean IIEE), but has a much larger bias in the IME70 due to the underestimate of SIC in the close and very close drift ice areas. The Bremen product generally has the largest IIEE, indicating the largest bias in the determination of sea ice edge. Multisensor and ASIP provide the two lowest mean IME90, being 2.28 × 10⁵ km2 and 2.33 × 10⁵ km2, respectively. RE has the highest mean IME90. On the whole, ASIP exhibits the closest agreement with the Norwegian ice chart.
ASIP is trained based on the Danish and Canadian ice charts, which only covers a small portion of the ice conditions around Svalbard. This study shows that ASIP also agrees better with the Norwegian ice chart around Svalbard than most other products. This can partly be explained by the fact that both ASIP and the Norwegian ice chart use similar observations. In particular, both of them use the weather-independent SAR data from Sentinel-1 and RADARSAT as the primary observations. This suggests that the ASIP product is likely to have a good description of the MIZ for the whole Arctic.
5.1.2. Secondary Metrics
The extent and position of MIZ, together with SIE are the main metrics commonly used in climate studies. These metrics provide useful information about the MIZ climate, but are generally of lower capability in determining the quality of datasets. As can be seen in Table 2, the RE product demonstrates a remarkably smaller SIE bias (−0.22 × 10⁵ km2) than the others, suggesting that the RE SIE is statistically more consistent with the ice chart SIE. ASIP has the second lowest SIE bias (−0.34 × 10⁵ km2), which is noticeably smaller than Multisensor (−0.55 × 10⁵ km2) and Bremen (−0.89 × 10⁵ km2). ASIP agrees best with ice chart in MIZE70, followed by Multisensor and Bremen, whereas the RE MIZE70 is significantly overestimated. By contrast, Bremen agrees best with the ice chart in MIZE90 (zero mean bias), followed by Multisensor. RE again exhibits the largest MIZE90, indicating an overall overestimate of the MIZE. ASIP gives a closest agreement on the MIZ position with the ice chart, with the lowest mean biases in the longitude and latitude of MIZ70, as well as the longitude of MIZ90 (Table 2). However, the Bremen is shown to have the lowest mean bias in the latitude of MIZ90. On the whole, RE has the best SIE, ASIP has the best sea ice edge, MIZ70 extent and position, and Bremen has the best MIZE90.
5.1.3. LIE
LIE is a secondary metric. It is presented here separately due to its critical role in the derivative metrics in Section 5.1.4. As can be seen in Table 2, the LIEs can be grouped into two types. RE and ASIP have similar lengths, whereas Bremen and Multisensor have similar lengths. The RE and ASIP products demonstrate much better consistency with the ice chart, with RE of near-zero mean bias and ASIP of very small bias. In addition, ASIP has a much better temporal consistency with the ice chart, as shown by the much smaller uncertainty in the bias (0.13 × 10⁴ km). By contrast, both Bremen and Multisensor significantly overestimate the LIE, being over 60% larger than the ice chart LIE.
5.1.4. Derivative Metrics
Derivative metrics are computed from the combination of other metrics. A common basis metric for generating the derivative metrics is the LIE. For example, MIZ width is calculated from the MIZE and LIE (Equation (10)). Similarly, IEDE is derived from the IIEE and LIE, and MWE is obtained from IME and LIE. These derivative metrics are introduced to facilitate intuitive understanding and comparisons. As can be seen in Table 2, ASIP has a very close mean MIZ70 width to the ice chart (mean bias 0.87 km), whereas all the other products exhibits much larger biases (all over 8 km). ASIP also has a low , and . All the products show large bias in the MWE90, with Multisensor having the lowest mean bias (−12.11 km). Multisensor also provides the lowest mean bias in the , , and . Bremen generally has relatively low mean bias for the MIZ90 (after Multisensor), and RE generally has the largest mean bias except for the MIZ70 width.
5.2. Caution to Use Derivative Metrics
Derivative metrics are often used in climate and operational studies, such as the MIZ width [28,29] and IEDE [50], to provide intuitive illustrations. However, caution must be exercised when employing these metrics. While derivative metrics generally provide consistent results for a single dataset when assessing the climate trend, their use in comparisons between different datasets, such as model forecasts and reference [50], can lead to different even conflict conclusion when using different LIEs. This can be evident in the present study. When calculating the IEDE and MWE, two types of LIE are used: the average LIE and the reference LIE, the latter being derived from the ice chart LIE. As shown in Table 2, these two LIEs differ substantially. Consequently, the choice of LIE can have a considerable impact on the calculated IEDEs and MWEs (Figure 14, Figure 15 and Figure 16 and Table 2), potentially altering the performance rankings of the evaluated datasets (Table 2).
The above mentioned problem naturally raises a question on which LIE is more appropriate for conducting comparisons across multiple datasets. From the results we can see that the IEDE and MWE calculated using the reference LIE are more consistent with the other metrics, such as IIEE or IME. For example, a smaller IIEE or IME indicates a smaller mismatch relative to the ice chart. When the reference LIE is used, the smaller IIEE or IME is directly translated into a smaller IEDE or MWE. However, this consistency is not guaranteed when the average LIE is used. Moreover, using the reference LIE provides a clear physical interpretation. The IEDE or MWE represents the exact distance or width by which the ice edge deviates from the ice chart. This direct correspondence makes the reference LIE a more intuitive and meaningful choice for interpreting results. By contrast, when the average LIE is used, it lacks such direct physical connection to the reference dataset, making it less suitable for comprehensive comparisons across datasets. Given these considerations, the reference LIE is preferable for calculating IEDE and MWE. It ensures consistency with other error metrics, provides a clear physical meaning, and facilitates more reliable and interpretable comparisons across multiple datasets.
The MIZ width is a widely used metric for describing the MIZ properties, in particular in climate studies [28,29]. It is often calculated according to the MIZE and LIE for climate trend analysis. Most of such datasets are based on the coarse-resolution PMW SIC products. It is anticipated that the LIEs in such studies would generally be similar, but a thorough examination of the evolution of both MIZE and LIE would be more convincing.
5.3. Summer Conditions
Accurate determination of the summer MIZs remains a significant challenge. This can also be seen from the much larger biases in Section 4. During the summer melt season, passive (AMSR2) and active (SAR) sensors struggle to distinguish between ice and water due to the rapidly varying surface wetness, melt ponds, and atmospheric factors. In addition, distinguishing between close drift ice and very close drift ice is particularly challenging. The reduction in SIC during summer further exacerbates the problem. The larger areas of low SIC are more likely to be missed due to the limited sensitivity of high-frequency PMWs, such as the Bremen and Multisensor products. The limitation of satellite instruments, the complex surface conditions, and seasonal reduction in SIC jointly pose a significant challenge in accurate measuring the summer sea ice conditions.
Figure 17 illustrates a representative example of summer sea ice conditions from the four satellite observations together with the Norwegian ice chart and the US National Ice Center (NIC) ice chart. Except for the US NIC ice chart, the upper bound of MIZ here is defined as SIC = 0.7, and the close (purple) and very close (red) drift ices are purposely separated. It can be seen there are notable differences between the satellite products and the manually analyzed ice charts. For instance, the Norwegian ice chart identifies an elongated patch of close drift ice embedded within the very close drift ice (Figure 17a). By contrast, the satellite products depict this patch interspersed with varying amounts of MIZ70 or even open water. To the west of this elongated patch, extensive areas of close ice and MIZ70 are observed in the RE, Multisensor and ASIP products, but these features are only sporadically presented in the Bremen product and are completely absent in the ice chart. Similarly, to the east of the elongated patch, large portions of close ice are observed in the RE, Multisensor and ASIP products but are rarely in the Bremen product and entirely absent in the Norwegian ice chart. For another example, in the Greenland Sea, the Norwegian ice chart classifies the region as a MIZ70 zone (Figure 17a), whereas it is recognized largely as open water in the Bremen product (Figure 17b). The RE and Multisensor products provide closer agreement, but still notably underestimated the MIZE there. ASIP gives the closest MIZ description for this area among the four satellite products.
Figure 17.
Daily sea ice conditions on 15 August 2023 from (a) Norwegian ice chart, (b) Bremen, (c) RE, (d) Multisensor, (e) ASIP, and (f) US NIC ice chart. The ice conditions are separated into open water (light blue), MIZ70 (yellow), close drift ice and very close drift ice in (a–e). The blue and green lines represent the SIC equal to 0.1 and 0.9 in the Norwegian ice chart, respectively. In (f) NIC ice chart, the ice conditions are separated into open water, MIZ80 (yellow) and dense pack ice (SIC > 80%).
To further validate the ice conditions described by the Norwegian ice chart, we present a US NIC ice chart on the same date with the MIZ defined as SIC (Figure 17f). It is seen that the MIZ80 area in the NIC ice chart is only slightly larger than the MIZ70 area in the Norwegian ice chart, suggesting there is only a very small area of SIC . In the central Arctic (upper left in the figures), the NIC ice chart shows nearly no MIZ80, compared with the close drift ice in the Norwegian ice chart, suggesting the SIC there is mostly in the range of 0.8 to 0.9. On the whole, both ice charts indicate very rare MIZ70 in the central Arctic. This adds more confidence in the quality of the analyzed ice charts. However, we still can not fully exclude the possibility that the lower SIC area near the central Arctic is overlooked by ice chart analysts. More work is needed to mitigate such discrepancies.
5.4. Limitations of Ice Chart for Evaluation
In this study, we have used the Norwegian ice chart as the ground truth for the evaluation. It is noted, however, that the ice chart is essentially an expert reference rather than an error-free truth. In practice, the analysts pay most attention to the ice areas close to the ice edge. Therefore, small patches of fine-scale features in the central Arctic can occasionally be overlooked in the ice charts [26].
Another uncertainty of the ice chart arises from the analyst’s subjective analysis. Studies show that this uncertainty can reach about 7–9% of the total SIC, with the maximum uncertainty occurring in the open and close drift ices [51]. If we regard 8% as a reasonable estimate of the uncertainty, and considering the fact that the ice chart only has seven categories in describing the ice conditions (Figure 2 and Table 1), then a high possibility of about 30% could occur due to manual misclassification. This would have a significant impact on the overall assessment when using the ice chart as the reference for evaluation. A more accurate reference dataset is, therefore, highly needed.
The ice charting relies heavily on the weather-independent SAR data from Sentinel-1 and RADARSAT, which are also the main source for the Multisensor and ASIP products. This indicates that the Norwegian ice chart used here is not fully independent. In general, products that share input data or training targets with the reference tend to show enhanced agreement for reasons unrelated to intrinsic accuracy, therefore, caution must be exercised when interpreting the ranking discussed here, in particular for the Multisensor and ASIP products. By contrast, the close agreement in the close and very close drift ice between the relatively independent Bremen SIC and the ice charts (e.g., Figure 17) tends to suggest that the Bremen SIC provides a more reliable estimate for these high SIC areas.
6. Conclusions
The Marginal Ice Zone (MIZ) is a dynamic transitional region between dense pack ice and open water, characterized by strong interactions among the atmosphere, ocean, sea ice and waves. This zone plays a critical role in the polar climate system and ecosystem, influencing energy exchanges, ocean circulation, and biological processes in polar regions. Due to the significant contrast between the ocean and sea ice surfaces, even minor deviation in identifying the sea surface can result in substantial errors in the air-sea interactions. Therefore, accurate determination of the MIZ is essential for advancing our understanding and improving the modeling and prediction of the polar climate system, as well as for supporting ecosystem management and climate adaptation strategies in these sensitive regions.
In this study, a comprehensive suit of MIZ-related metrics was introduced and applied to evaluate the effectiveness of four satellite-derived high-resolution operational SIC products—Bremen, RE, Multisensor and ASIP—in determining the MIZs around Svalbard, with the Norwegian ice chart as the reference dataset. The metrics employed for this evaluation include SIE, MIZE, MIZ position, MIZ width, LIE, IIEE, IME, IEDE and MWE. Of all the metrics, IIEE and IME are the two primary metrics for evaluating a SIC dataset in describing the MIZ against the Norwegian ice chart. Based on the analysis and evaluation of sea ice conditions around Svalbard from 2024–2025, we have the following conclusions.
- Among the four satellite products, ASIP excels in determining the sea ice edge and MIZ70, based on the primary metrics IIEE and IME70. It also exhibits the closest agreement with the Norwegian ice chart across a series of secondary metrics, such as LIE, IEDE, MIZE70, width and position of MIZ70, and MWE70. Although the ASIP product was originally trained using the Danish and Canadian ice charts, this study shows that it also has high skill in describing the ice edge and MIZ70 around the Svalbard compared with the Norwegian ice chart. It is anticipated that this product would also give skillful description of the MIZs in the pan-Arctic.
- All the satellite products have large bias in describing the MIZ90 when compared with the Norwegian ice chart. There is no product that is clearly superior to the others. However, the Multisensor product outperform the other three products in terms of IME90, MIZ90 width and MWE90, while the Bremen product is superior regarding MIZE90 and the mean latitude of MIZ90. It is also noteworthy that the ice chart could occasionally overlook small features in the central Arctic. Further studies are need to clarify the uncertainties and improve the MIZ90.
- The product performance is often affected by the sensors used. Among the four satellite observations here, low-frequency AMSR2 channels are effective for identifying low-SIC area, which helps accurate determination of sea ice edge and LIE, as shown by the RE and ASIP products. By contrast, high-frequency AMSR2 channels are effective for accurately determination of high-SIC areas, as shown by the Bremen and Multisensor products. By further incorporation of the SAR measurements, the ASIP and Multisensor products achieved even better description of the MIZs.
- Substantial errors emerged across the four satellite observations when characterizing summer MIZs, when the Arctic activities reach peak. To mitigate the limitations of individual satellite product, merging and fusing of existing SIC datasets offer a feasible solution (e.g., [26,52]), but further deployment of more advanced satellite sensors and further development of machine learning based methods with multiple satellite observations are highly anticipated.
Author Contributions
Conceptualization, K.W. and C.W.; methodology, K.W.; software, K.W.; validation, K.W. and C.W.; formal analysis, K.W. and C.W.; investigation, K.W. and C.W.; resources, K.W.; data curation, K.W.; writing—original draft preparation, K.W.; writing—review and editing, K.W. and C.W.; visualization, K.W.; project administration, K.W.; funding acquisition, K.W. All authors have read and agreed to the published version of the manuscript.
Funding
This research received funding from the Norwegian Research Council through project 4SICE (grant No. 328886), the Norwegian FRAM Flagship program through project SUDARCO (grant No. 551323), the Nordic Council of Ministers through project NOCOS DT (grant No. 102642), and the European Union’s Horizon Europe research and innovation programme through project EU-INTERCHANGE (grant No. 101181585).
Data Availability Statement
The AMSR2 data is available at https://data.seaice.uni-bremen.de/amsr2/ (accessed on 24 March 2026). The ASIP data is available at https://thredds.met.no/thredds/myocean/SIW-TAC/siw-dmi-arc-hires-sic.html (accessed on 11 April 2026). The Multisensor data is available at https://thredds.met.no/thredds/myocean/SIW-TAC/siw-metno-arc-hires-sict.html (accessed on 11 April 2026). The Norwegian sea ice chart data is available at https://thredds.met.no/thredds/myocean/SIW-TAC/siw-metno-svalbard.html (accessed on 11 April 2026). The US NIC ice chart is from https://usicecenter.gov/Catalog/ArcticMizChart (accessed on 6 April 2026).
Acknowledgments
The authors are grateful to Gunnar Spreen in the University of Bremen for the discussions on the AMSR2 data, and to Till Rasmussen in the Danish Meteorological Institute for the discussions on the ASIP data. We gratefully thank our colleagues Frode Dinessen for the explanations of the Multisensor data, and Arne Melsom and Nick Hughes for the discussions on the ice edge length and ice edge distance error.
Conflicts of Interest
The authors declare no conflicts of interest. The funders had no role in the design of the study; in the collection, analyses, or interpretation of data; in the writing of the manuscript; or in the decision to publish the results.
Abbreviations
The following abbreviations are used in this manuscript:
| AMSR2 | Advance Microwave Scanning Radiometer 2 |
| ARTIST | Arctic Radiation and Turbulence Interaction Study |
| ASI | ARTIST Sea Ice |
| ASIP | Automated Sea Ice Product |
| AVHRR | Advanced Very High Resolution Radiometer |
| CCI | Climate Change Initiative |
| CMEMS | Copernicus Marine Environment and Monitoring Service |
| CS2SMOS | CryoSate-2 and SMOS |
| IEDE | Ice Edge Distance Error |
| IIEE | Integrated Ice Edge Error |
| IME | Integrated Marginal Ice Zone Error |
| LIE | Length of Ice Edge |
| MIZ | Marginal Ice Zone |
| MIZE | Marginal Ice Zone Extent |
| MW | Marginal Ice Zone Width |
| MWE | Marginal Ice Zone Width Error |
| NIC | National Ice Center |
| OLCI | Ocean and Land Colour Instrument |
| RE | Resolution Enhanced |
| SAR | Synthetic Aperture Radar |
| SIC | Sea Ice Concentration |
| SIE | Sea Ice Extent |
| SLSTR | Sea and Land Surface Temperature Radiometer |
| SSMIS | Special Sensor Microwave Imager/Sounder |
| VIIRS | Visible Infrared Imaging Radiometer Suite |
References
- WMO. Sea Ice Nomenclature; Number No. 259; WMO: Geneva, Switzerland, 2014. [Google Scholar]
- Røed, L.P.; O’Brien. A coupled ice-ocean model of upwelling in the marginal ice zone. J. Geophys. Res. Oceans 1983, 88, 2863–2872. [Google Scholar] [CrossRef] [Scilit]
- Josberger, E.G. Sea ice melting in the marginal ice zone. J. Geophys. Res.-Oceans 1983, 88, 2841–2844. [Google Scholar] [CrossRef] [Scilit]
- Tucker, W.B.; Grenfell, T.C.; Onstott, R.G.; Perovich, D.K.; Gow, A.J.; Shuchman, R.A.; Sutherland, L.L. Microwave and physical properties of sea ice in the winter marginal ice zone. J. Geophys. Res. Oceans 1991, 96, 4573–4587. [Google Scholar] [CrossRef] [Scilit]
- Johannessen, J.A.; Johannessen, O.M.; Svendsen, E.; Shuchman, R.; Manley, T.; Campbell, W.J.; Josberger, E.G.; Sandven, S.; Gascard, J.C.; Olaussen, T.; et al. Mesoscale eddies in the Fram Strait marginal ice zone during the 1983 and 1984 Marginal Ice Zone Experiments. J. Geophys. Res.-Oceans 1987, 92, 6754–6772. [Google Scholar] [CrossRef] [Scilit]
- Inoue, J.; Hori, M.E. Arctic cyclogenesis at the marginal ice zone: A contributory mechanism for the temperature amplification? Geophys. Res. Lett. 2011, 38, L12502. [Google Scholar] [CrossRef] [Scilit]
- Padman, L.; Dillon, T.M. Turbulent mixing near the Yermak Plateau during the Coordinated Eastern Arctic Experiment. J. Geophys. Res. Oceans 1991, 96, 4769–4782. [Google Scholar] [CrossRef] [Scilit]
- Sunfjord, A.; Fer, I.; Kasajima, Y.; Svendsen, H. Observations of turbulent mixing and hydrography in the marginal ice zone of the Barents Sea. J. Geophys. Res.-Oceans 2007, 112, C05008. [Google Scholar] [CrossRef] [Scilit]
- Häkkinen, S. Coupled ice-ocean dynamics in the marginal ice zones: Upwelling/downwelling and eddy generation. J. Geophys. Res. Oceans 1986, 91, 819–832. [Google Scholar] [CrossRef] [Scilit]
- Stephenson, S.R.; Smith, L.C.; Agnew, J.A. Divergent long-term trajectories of human access to the Arctic. Nat. Clim. Change 2011, 1, 156–160. [Google Scholar] [CrossRef] [Scilit]
- Squire, V.A.; Dugan, J.P.; Wadhams, P.; Rottier, P.J.; Liu, A.K. Of ocean waves and sea-ice. Annu. Rev. Fluid Mech. 1995, 27, 115–168. [Google Scholar] [CrossRef]
- Squire, V.A. Of ocean waves and sea-ice revisited. Cold Reg. Sci. Tech. 2007, 49, 110–133. [Google Scholar] [CrossRef] [Scilit]
- Dumont, D.; Kohout, A.; Bertino, L. A wave-based model for the marginal ice zone including a floe breaking parameterization. J. Geophys. Res.-Oceans 2011, 116, C04001. [Google Scholar] [CrossRef] [Scilit]
- Shen, H.H.; Hiber, W.D.; Lepparanta, M. The role of floe collisions in sea ice rheology. J. Geophys. Res.-Oceans 1987, 92, 7085–7096. [Google Scholar] [CrossRef] [Scilit]
- Feltham, D.L. Granular flow in the marginal ice zone. Philos. Trans. R. Soc. A 2005, 363, 1677–1700. [Google Scholar] [CrossRef] [Scilit] [PubMed]
- Steele, M. Sea ice melting and floe geometry in a simple ice-ocean model. J. Geophys. Res.-Oceans 1992, 97, 17729–17738. [Google Scholar] [CrossRef] [Scilit]
- Falk-Petersen, S.; Haakon, H.; Budgell, W.P.; Hegseth, E.N.; Korsnes, R.; Løyning, T.B.; Ørbæk, J.B.; Kawamura, T.; Shirasawa, K. Physical and ecological processes in the marginal ice zone of the northern Barents Sea during the summer melt period. J. Mar. Syst. 2000, 27, 131–159. [Google Scholar] [CrossRef] [Scilit]
- Hamilton, C.D.; Kovacs, K.M.; Ims, R.A.; Aars, J.; Strøm, H.; Lydersen, C. Spatial overlap among an Arctic predator, prey and scavenger in the marginal ice zone. Mar. Ecol. Prog. Ser. 2017, 573, 45–59. [Google Scholar] [CrossRef] [Scilit]
- Derocher, A.E.; Lunn, N.J.; Stirling, I. Polar Bears in a Warming Climate. Integr. Comp. Biol. 2004, 44, 163–176. [Google Scholar] [CrossRef] [Scilit] [PubMed]
- Olsen, J.; Hovelsrud, G.; Kaltenborn. Increasing Shipping in the Arctic and Local Communities’ Engagement: A Case from Longyearbyen on Svalbard. In Arctic Marine Sustainability; Pongrácz, E., Pavlov, V., Hänninen, N., Eds.; Springer: Berlin/Heidelberg, Germany, 2020; pp. 305–331. [Google Scholar] [CrossRef] [Scilit]
- Stocker, A.; Renner, A.; Knol-Kauffman, M. Sea ice variability and maritime activity around Svalbard in the period 2012–2019. Sci. Rep. 2020, 10, 17043. [Google Scholar] [CrossRef] [Scilit] [PubMed]
- Vinje, T. Fram Strait ice flux and atmospheric circulation: 1950–2000. J. Clim. 2001, 14, 3508–3517. [Google Scholar] [CrossRef] [Scilit]
- Maslanik, J.; Drobot, S.; Fowler, C.; Emery, W.; Barry, R. On the Arctic climate paradox and the continuing role of atmospheric circulation in affecting sea ice conditions. Geophys. Res. Lett. 2012, 34, 1501–1515. [Google Scholar]
- Sandø, A.; Nilsen, J.; Gao, Y.; Lohmann, K. Importance of heat transport and local air-sea heat fluxes for Barents Sea climate variability. J. Geophys. Res.-Oceans 2010, 115, C07013. [Google Scholar] [CrossRef] [Scilit]
- Smedsrud, L.; Esau, I.; Ingvaldsen, R.; Eldevik, T.; Haugan, P.; Li, C.; V., L.; Olsen, A.; Omar, A.; Otterå, O.; et al. The role of the Barents Sea in the Arctic climate system. Rev. Geophys. 2013, 51, 415–449. [Google Scholar] [CrossRef] [Scilit]
- Wang, K.; Wang, C.; Dinessen, F.; Spreen, G.; Ricker, R.; Tian-Kunze, X. Multisensor data fusion of operational sea ice observations. Front. Mar. Sci. 2024, 11, 1366002. [Google Scholar] [CrossRef] [Scilit]
- Wang, K.; Wang, C.; Hughes, N.; Ali, A. Improving short-term forecasts of sea ice edge and marginal ice zone around Svalbard. Front. Mar. Sci. 2025, 12, 1588769. [Google Scholar] [CrossRef] [Scilit]
- Strong, C. Atmospheric influence on Arctic marginal ice zone position and width in the Atlantic sector, February–April 1979–2010. Clim. Dyn. 2012, 39, 3091–3102. [Google Scholar] [CrossRef] [Scilit]
- Rolph, R.J.; Feltham, D.L.; Schröder, D. Changes of the Arctic marginal ice zone during the satellite era. Cryosphere 2020, 14, 1971–1984. [Google Scholar] [CrossRef] [Scilit]
- Song, L.; Zhao, X.; Wu, Y.; Gong, J.; Li, B. Assessing Arctic marginal ice zone dynamics from 1979 to 2023: Insights into long-term variability and morphological changes. Environ. Res. Lett. 2025, 20, 034032. [Google Scholar] [CrossRef] [Scilit]
- Duarte, P.; Brændshøi, J.; Shcherbin, D.; Barras, P.; Albretsen, J.; Gusdal, Y.; Szapiro, N.; Martinsen, A.; Samuelsen, A.; Wang, K.; et al. Implementation and evaluation of open boundary conditions for sea ice in a regional coupled ocean (ROMS) and sea ice (CICE) modeling system. Geosci. Model Dev. 2022, 15, 4373–4392. [Google Scholar] [CrossRef] [Scilit]
- Müller, M.; Batrak, Y.; Dinessen, F.; Grote, R.; Wang, K. Challenges in the Description of Sea Ice for a Kilometer-Scale Weather Forecasting System. Weather Forecast. 2023, 38, 1157–1171. [Google Scholar] [CrossRef] [Scilit]
- Röhrs, J.; Gusdal, Y.; Rikardsen, E.; Duran Moro, M.; Brændshøi, J.; Kristensen, N.M.; Fritzner, S.; Wang, K.; Sperrevik, A.K.; Idžanović, M.; et al. Barents-2.5km v2.0: An operational data-assimilative coupled ocean and sea ice ensemble prediction model for the Barents Sea and Svalbard. Geosci. Model Dev. 2023, 16, 5401–5426. [Google Scholar] [CrossRef] [Scilit]
- Durán Moro, M.; Sperrevik, A.K.; Lavergne, T.; Bertino, L.; Gusdal, Y.; Iversen, S.C.; Rusin, J. Assimilation of satellite swaths versus daily means of sea ice concentration in a regional coupled ocean–sea ice model. Cryoshpere 2024, 18, 1597–1619. [Google Scholar] [CrossRef] [Scilit]
- Spreen, G.; Kaleschke, L.; Heygster, G. Sea ice remote sensing using AMSR-E 89-GHz channels. J. Geophys. Res. Oceans 2008, 113, C02S03. [Google Scholar] [CrossRef] [Scilit]
- Melsheimer, C. ASI Version 5 Sea Ice Concentration User Guide, Version V0.92; Unversity of Bremen: Bremen, Germany, 2019; pp. 1–10.
- Lavergne, T.; Sørensen, A.; Tonboe, R.; Pedersen, L. CCI+ Sea ice ECV Sea Ice Concentration Algorithm Theoretical Basis Document; Technical Report; European Space Agency: Paris, France, 2021; pp. 1–41. [Google Scholar]
- Rusin, J.; Lavergne, T.; Doulgeris, A.P.; Scott, K.A. Resolution enhanced sea ice concentration: A new algorithm applied to AMSR2 microwave radiometry data. Ann. Glaciol. 2025, 65, e15. [Google Scholar] [CrossRef] [Scilit]
- Dinessen, F.; Korosov, A.; Wettre, C.; Lavergne, T.; Kreiner, M. Arctic Sea Ice Concentration, Arctic Sea Ice Type, Greenland Sea Ice Concentration, SEAICE_ARC_PHY_AUTO_L4_NRT_011_015, Issue: 1.2; Technical Report; MERCATOR OCEAN: Toulouse, France, 2024. [Google Scholar]
- Wulf, T.; Buus-Hinkler, J.; Singha, S.; Shi, H.; Kreiner, M.B. Pan-Arctic sea ice concentration from SAR and passive microwave. Cryophere 2024, 18, 5277–5300. [Google Scholar] [CrossRef] [Scilit]
- Cavalieri, D.J. A microwave technique for mapping thin sea ice. J. Geophys. Res. Oceans 1994, 99, 12561–12572. [Google Scholar] [CrossRef] [Scilit]
- Kern, S.; Lavergne, T.; Notz, D.; Pedersen, L.T. Satellite passive microwave sea-ice concentration data set inter-comparison for Arctic summer conditions. Cryosphere 2020, 7, 2469–2493. [Google Scholar] [CrossRef] [Scilit]
- Radhakrishnan, K.; Scott, K.A.; Clausi, D.A. Sea Ice Concentration Estimation: Using Passive Microwave and SAR Data with a U-Net and Curriculum Learning. IEEE J. Sel. Top. Appl. Earth Obs. Remote Sens. 2021, 14, 5339–5351. [Google Scholar] [CrossRef] [Scilit]
- Meng, X.; Shen, H.; Li, H.; Zhang, L.; Fu, R. Review of the pan-sharpening methods for remote sensing images based on the idea of meta-analysis: Practical discussion and challenges. Inform. Fusion 2019, 46, 102–113. [Google Scholar] [CrossRef] [Scilit]
- Copeland, W.; Wagner, P.; Hughes, N.; Everett, A.; Robertsen, T. The MET Norway Ice Service: A comprehensive review of the historical and future evolution, ice chart creation, and end user interaction within METAREA XIX. Front. Mar. Sci. 2024, 11, 1400479. [Google Scholar] [CrossRef] [Scilit]
- Dinessen, F.; Hackett, B. Product User Manual for Regional High Resolution Sea Ice Charts Svalbard Region; Copernicus Marine Service: Toulouse, France, 2018; pp. 1–16. [Google Scholar]
- Wang, K.; Ali, A.; Wang, C. Local analytical optimal nudging for assimilating AMSR2 sea ice concentration in a high-resolution pan-Arctic coupled ocean (HYCOM 2.2.98) and sea ice (CICE 5.1.2) model. Cryosphere 2023, 17, 4487–4510. [Google Scholar] [CrossRef] [Scilit]
- Melsom1, A.; Palerme, C.; Müller, M. Validation metrics for ice edge position forecasts. Ocean Sci. 2019, 15, 615–630. [Google Scholar] [CrossRef] [Scilit]
- Goessling, H.F.; Tietsche, S.; Day, J.J.; Hawkins, E.; Jung, T. Predictability of the Arctic sea ice edge. Geophys. Res. Lett. 2016, 43, 1642–1650. [Google Scholar] [CrossRef] [Scilit]
- Palerme, C.; Lavergne, T.; Rusin, J.; Melsom, A.; Brajard, J.; Kvanum, A.F.; Sørensen, A.M.; Bertino, L.; Müller, M. Improving short-term sea ice concentration forecasts using deep learning. Cryosphere 2024, 18, 2161–2176. [Google Scholar] [CrossRef] [Scilit]
- Dinessen, F.; Korosov, A.; Wettre, C.; Lavergne, T.; Kreiner, M. CMEMS-SI-PUM-011-015; Copernicus Marine Service: Toulouse, France, 2024; pp. 1–24. [Google Scholar]
- Wang, K.; Lavergne, T.; Dinessen, F. Multisensor data merging of sea ice concentration and thickness. Adv. Polar Sci. 2020, 31, 1–13. [Google Scholar] [CrossRef]
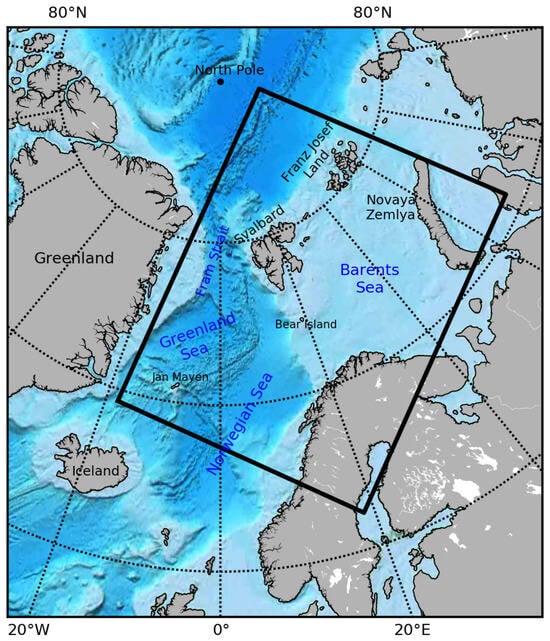
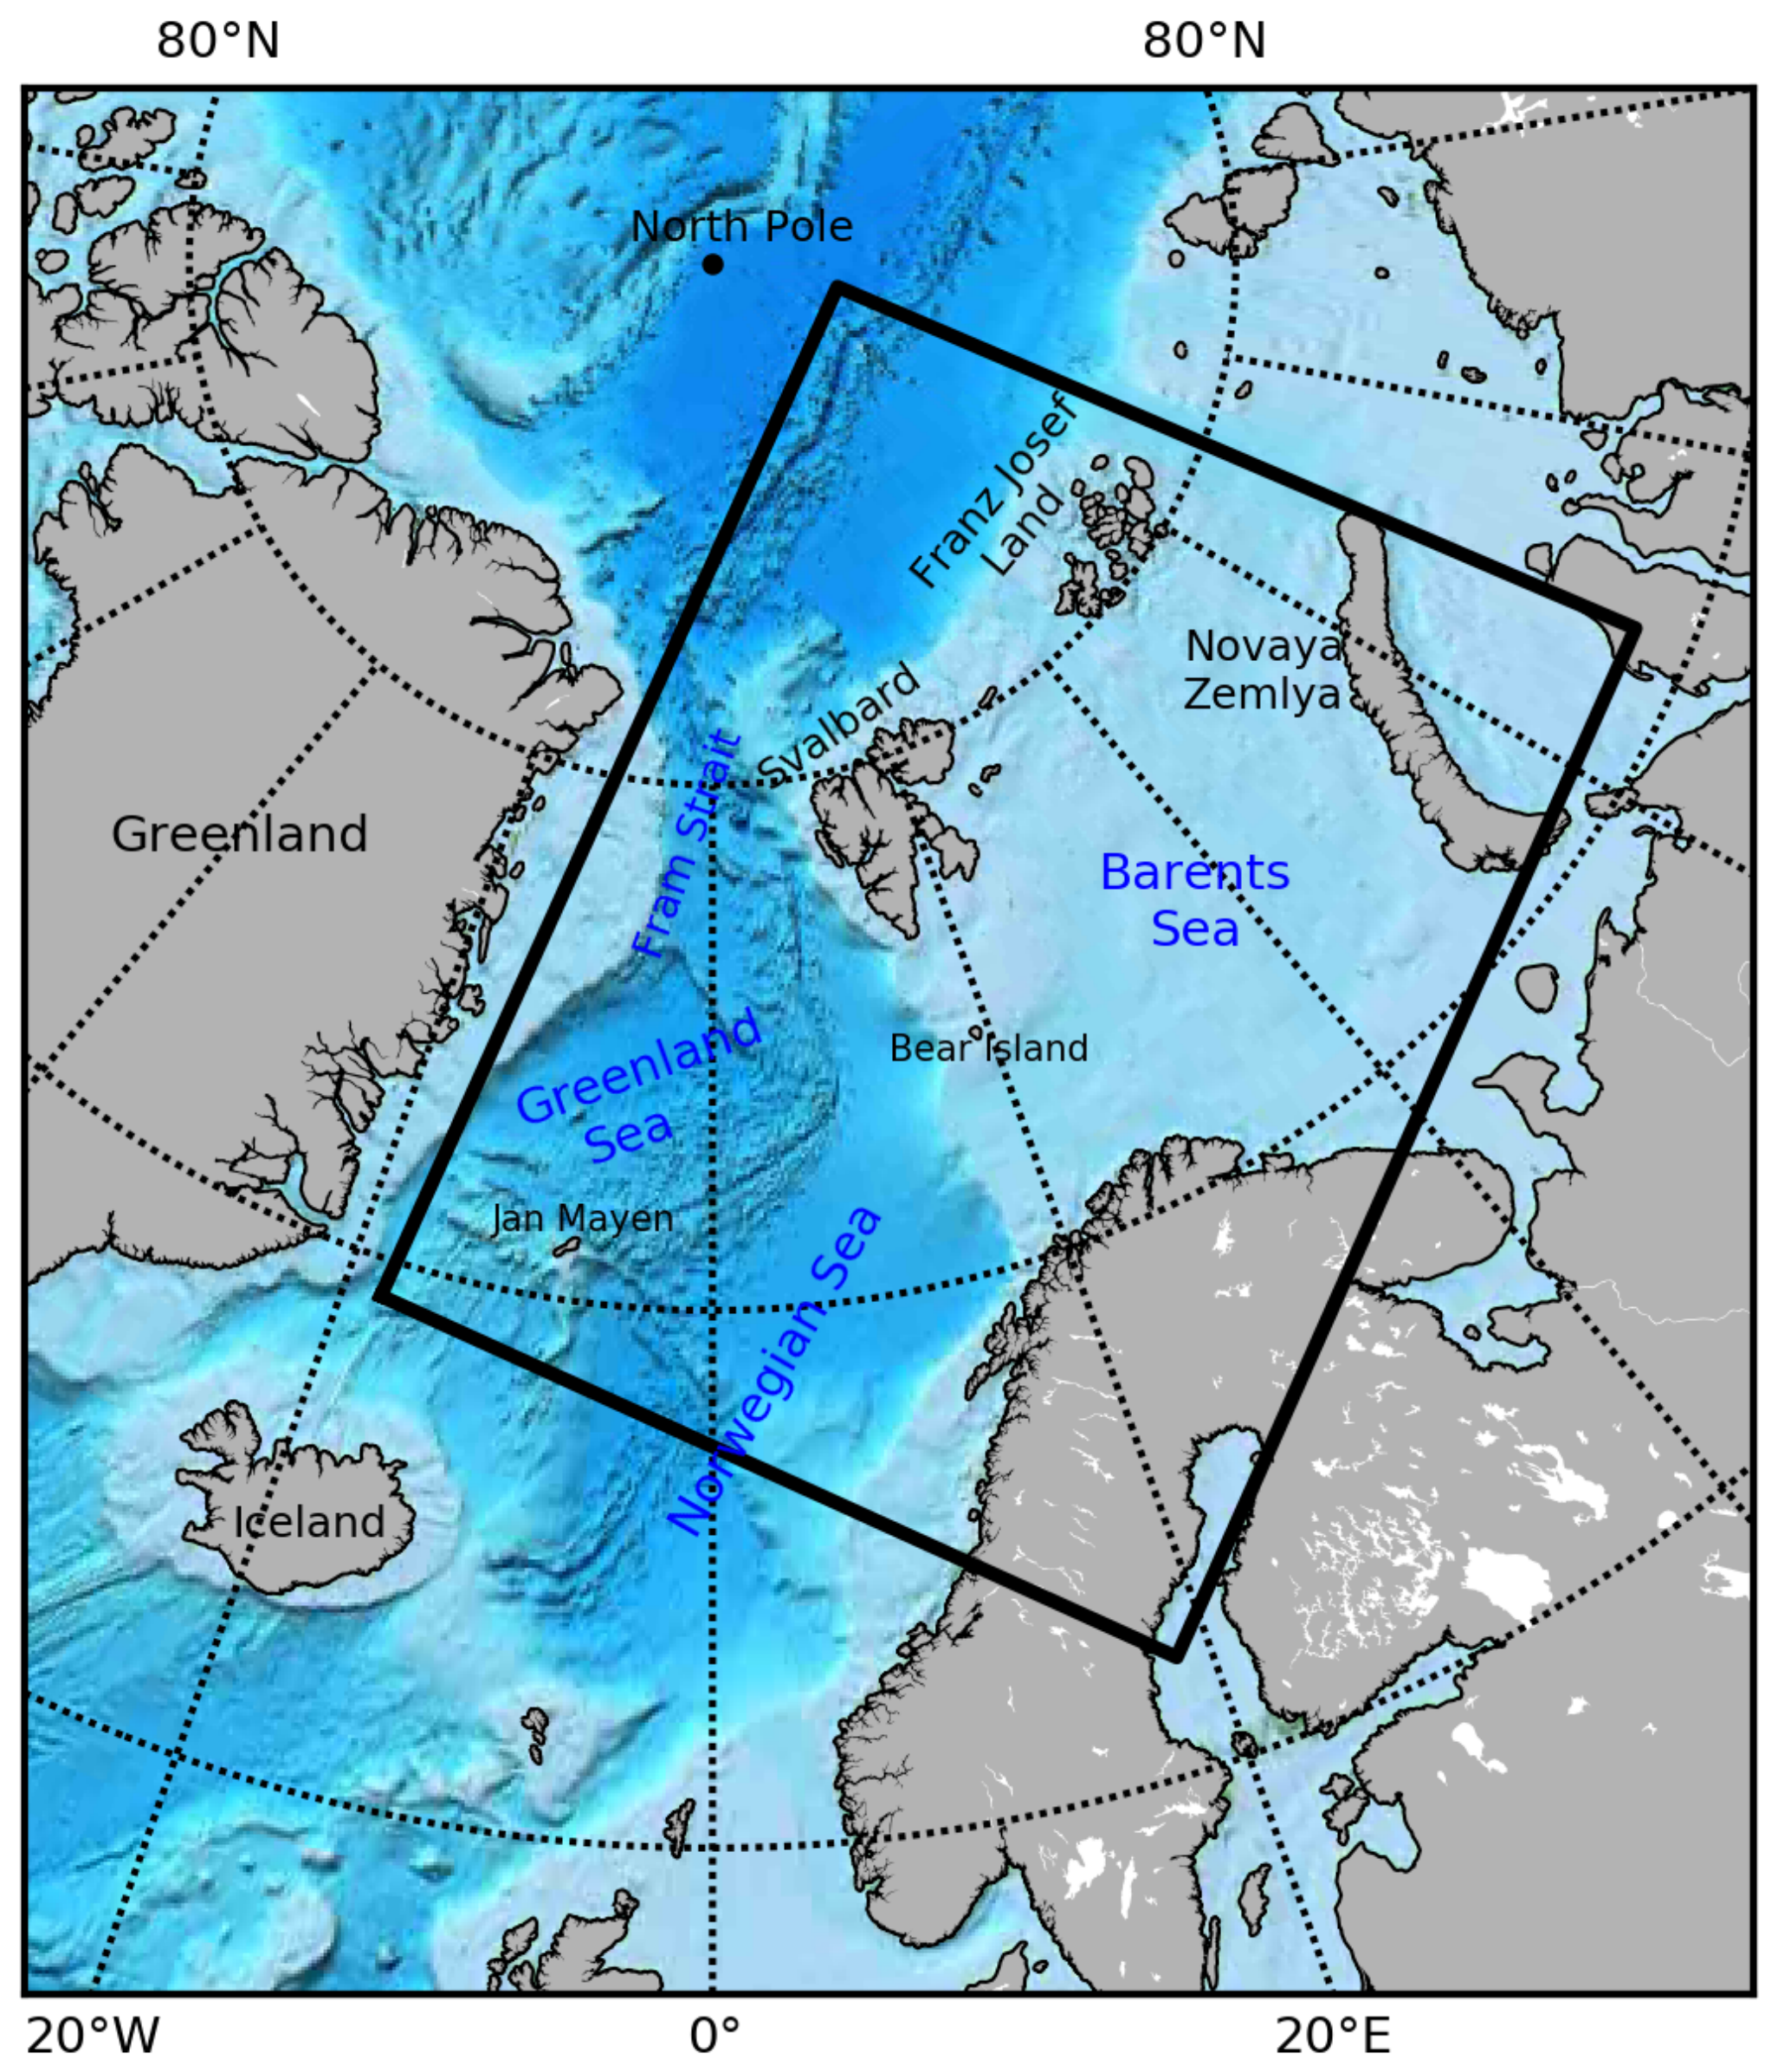
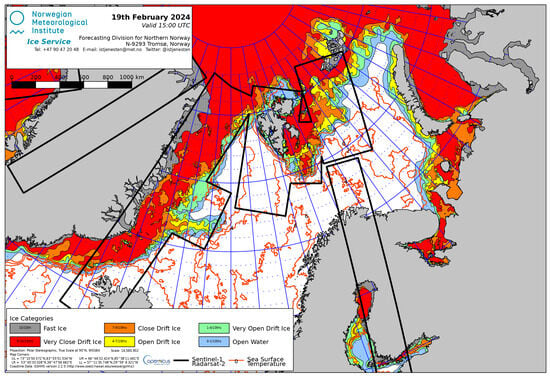
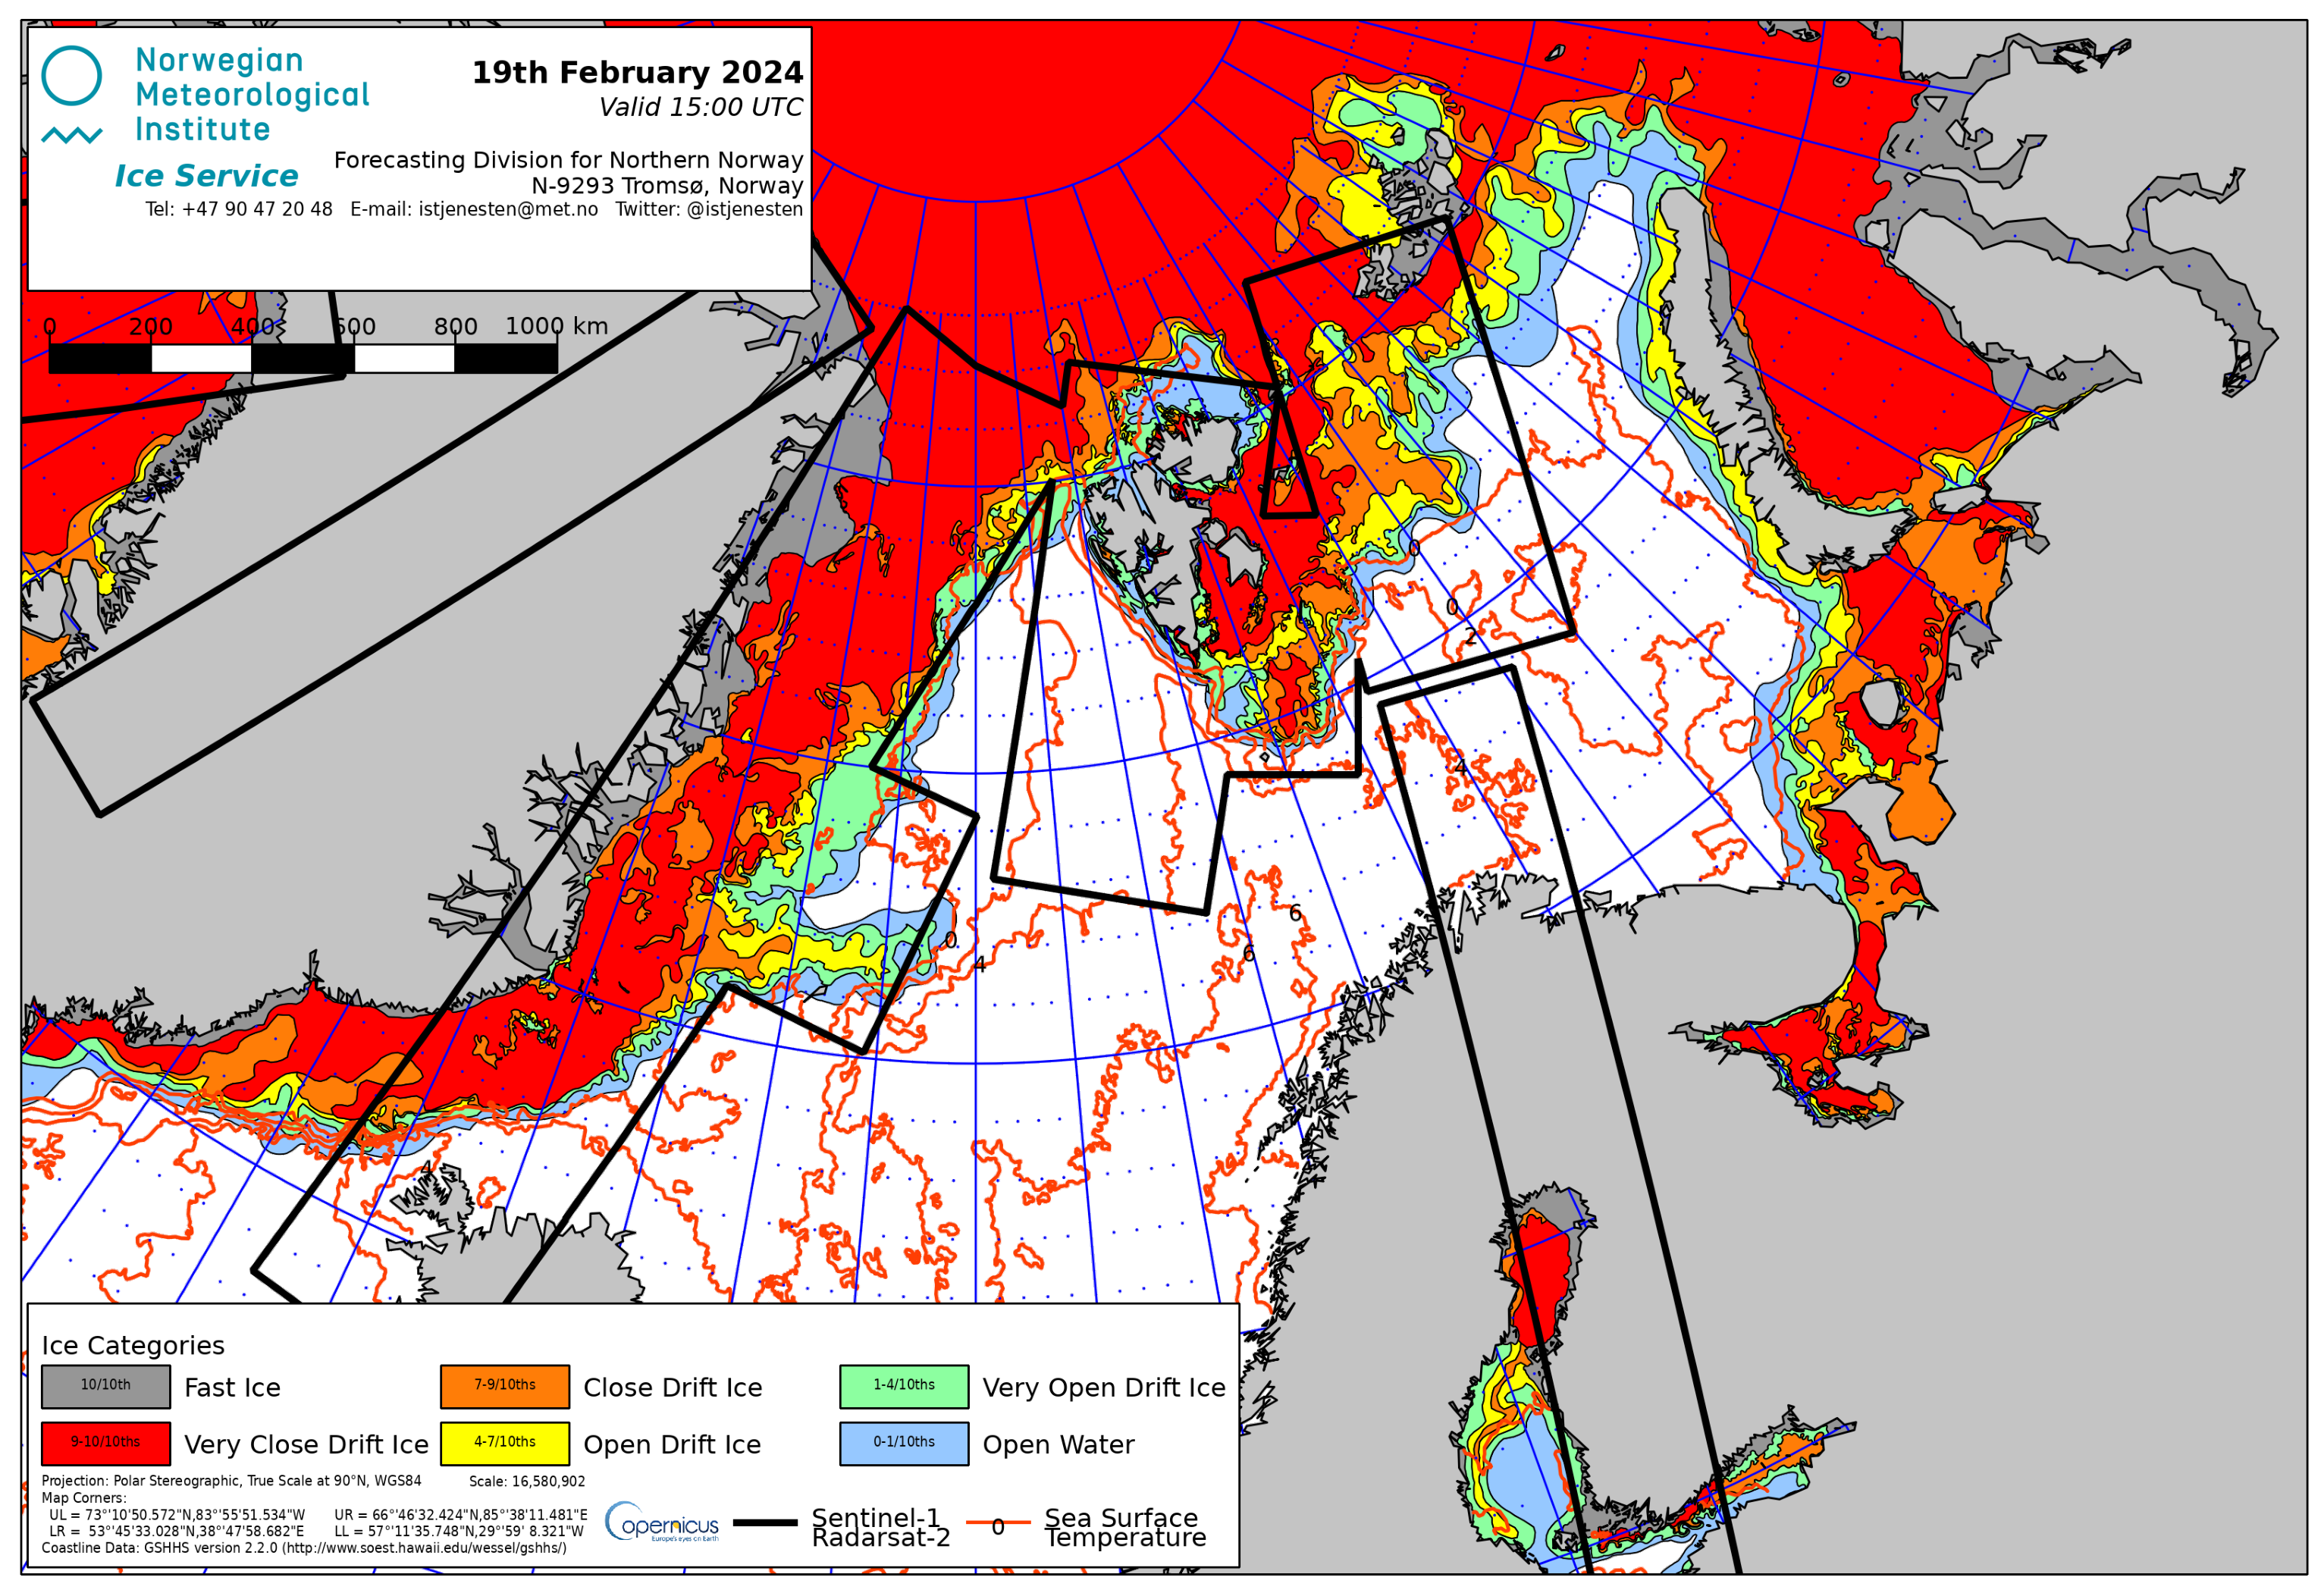
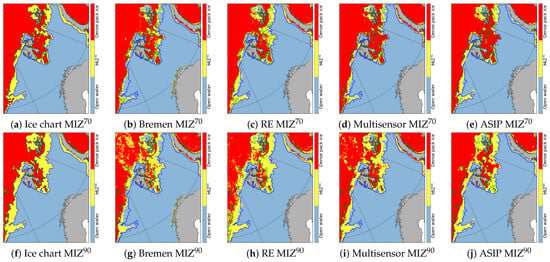
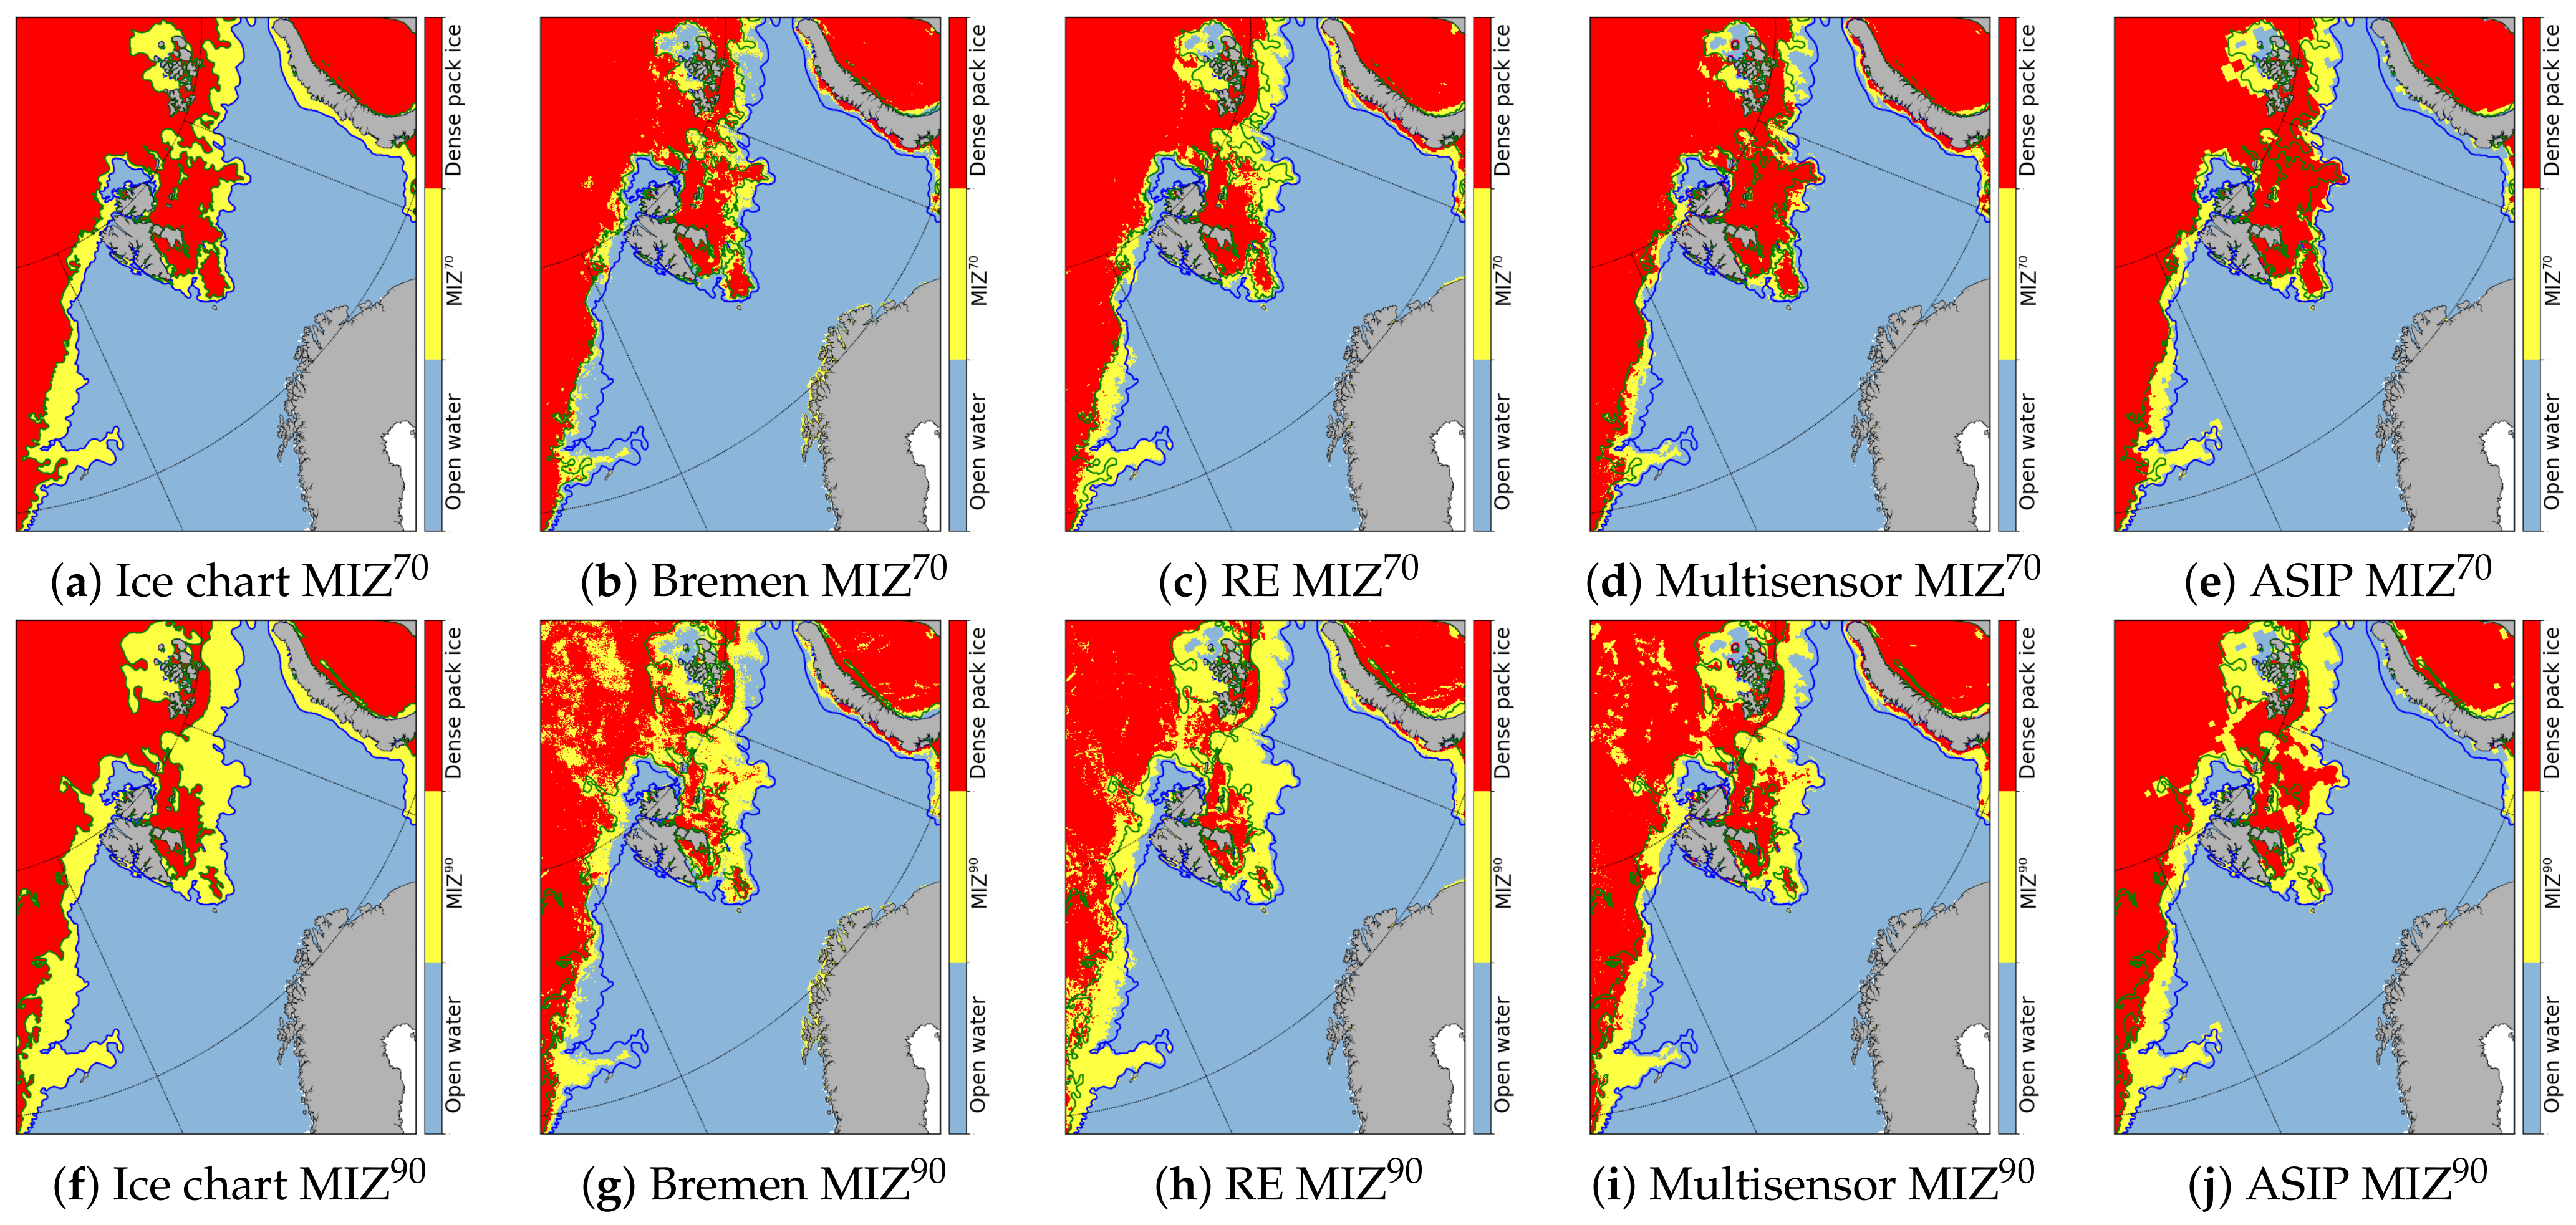
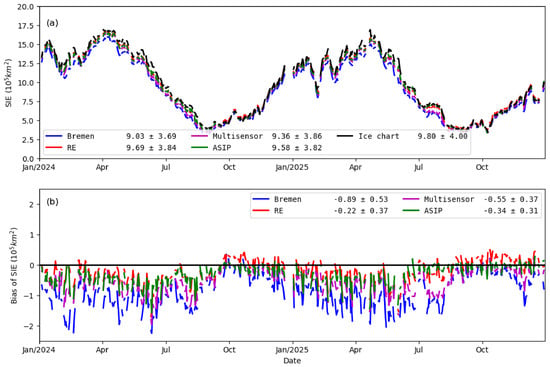
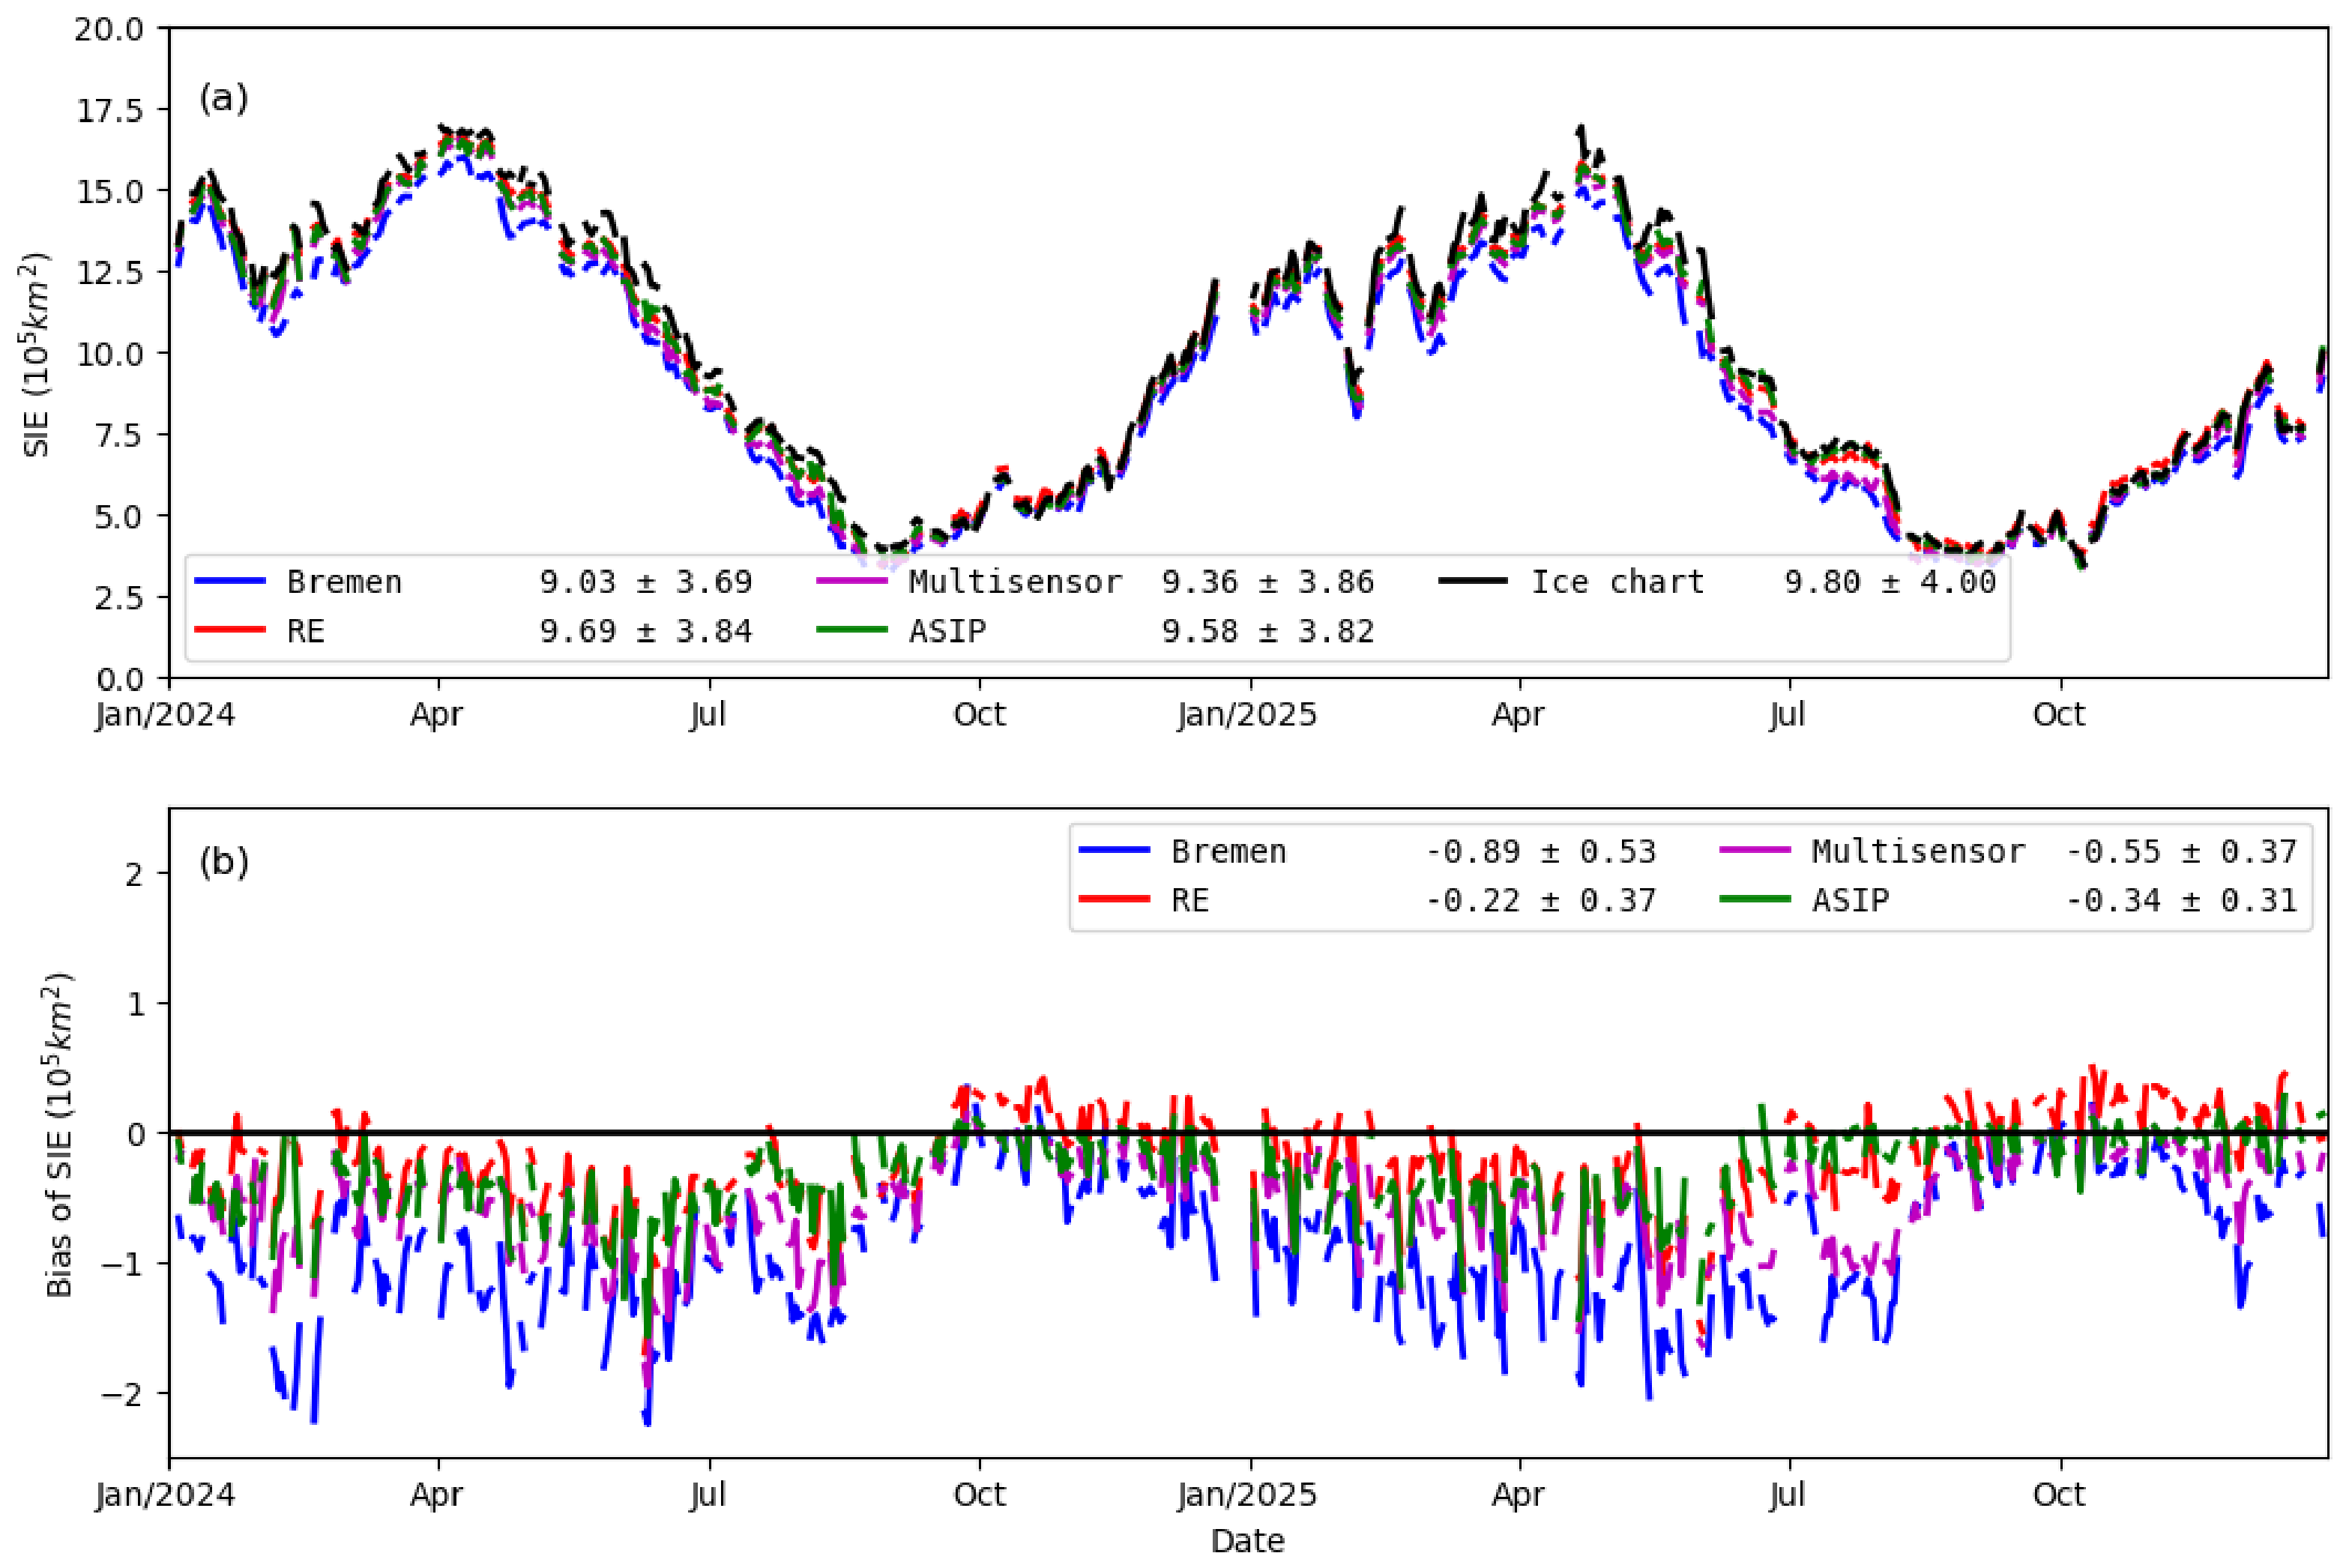
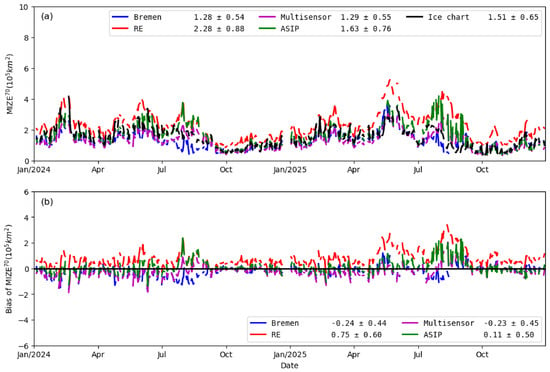
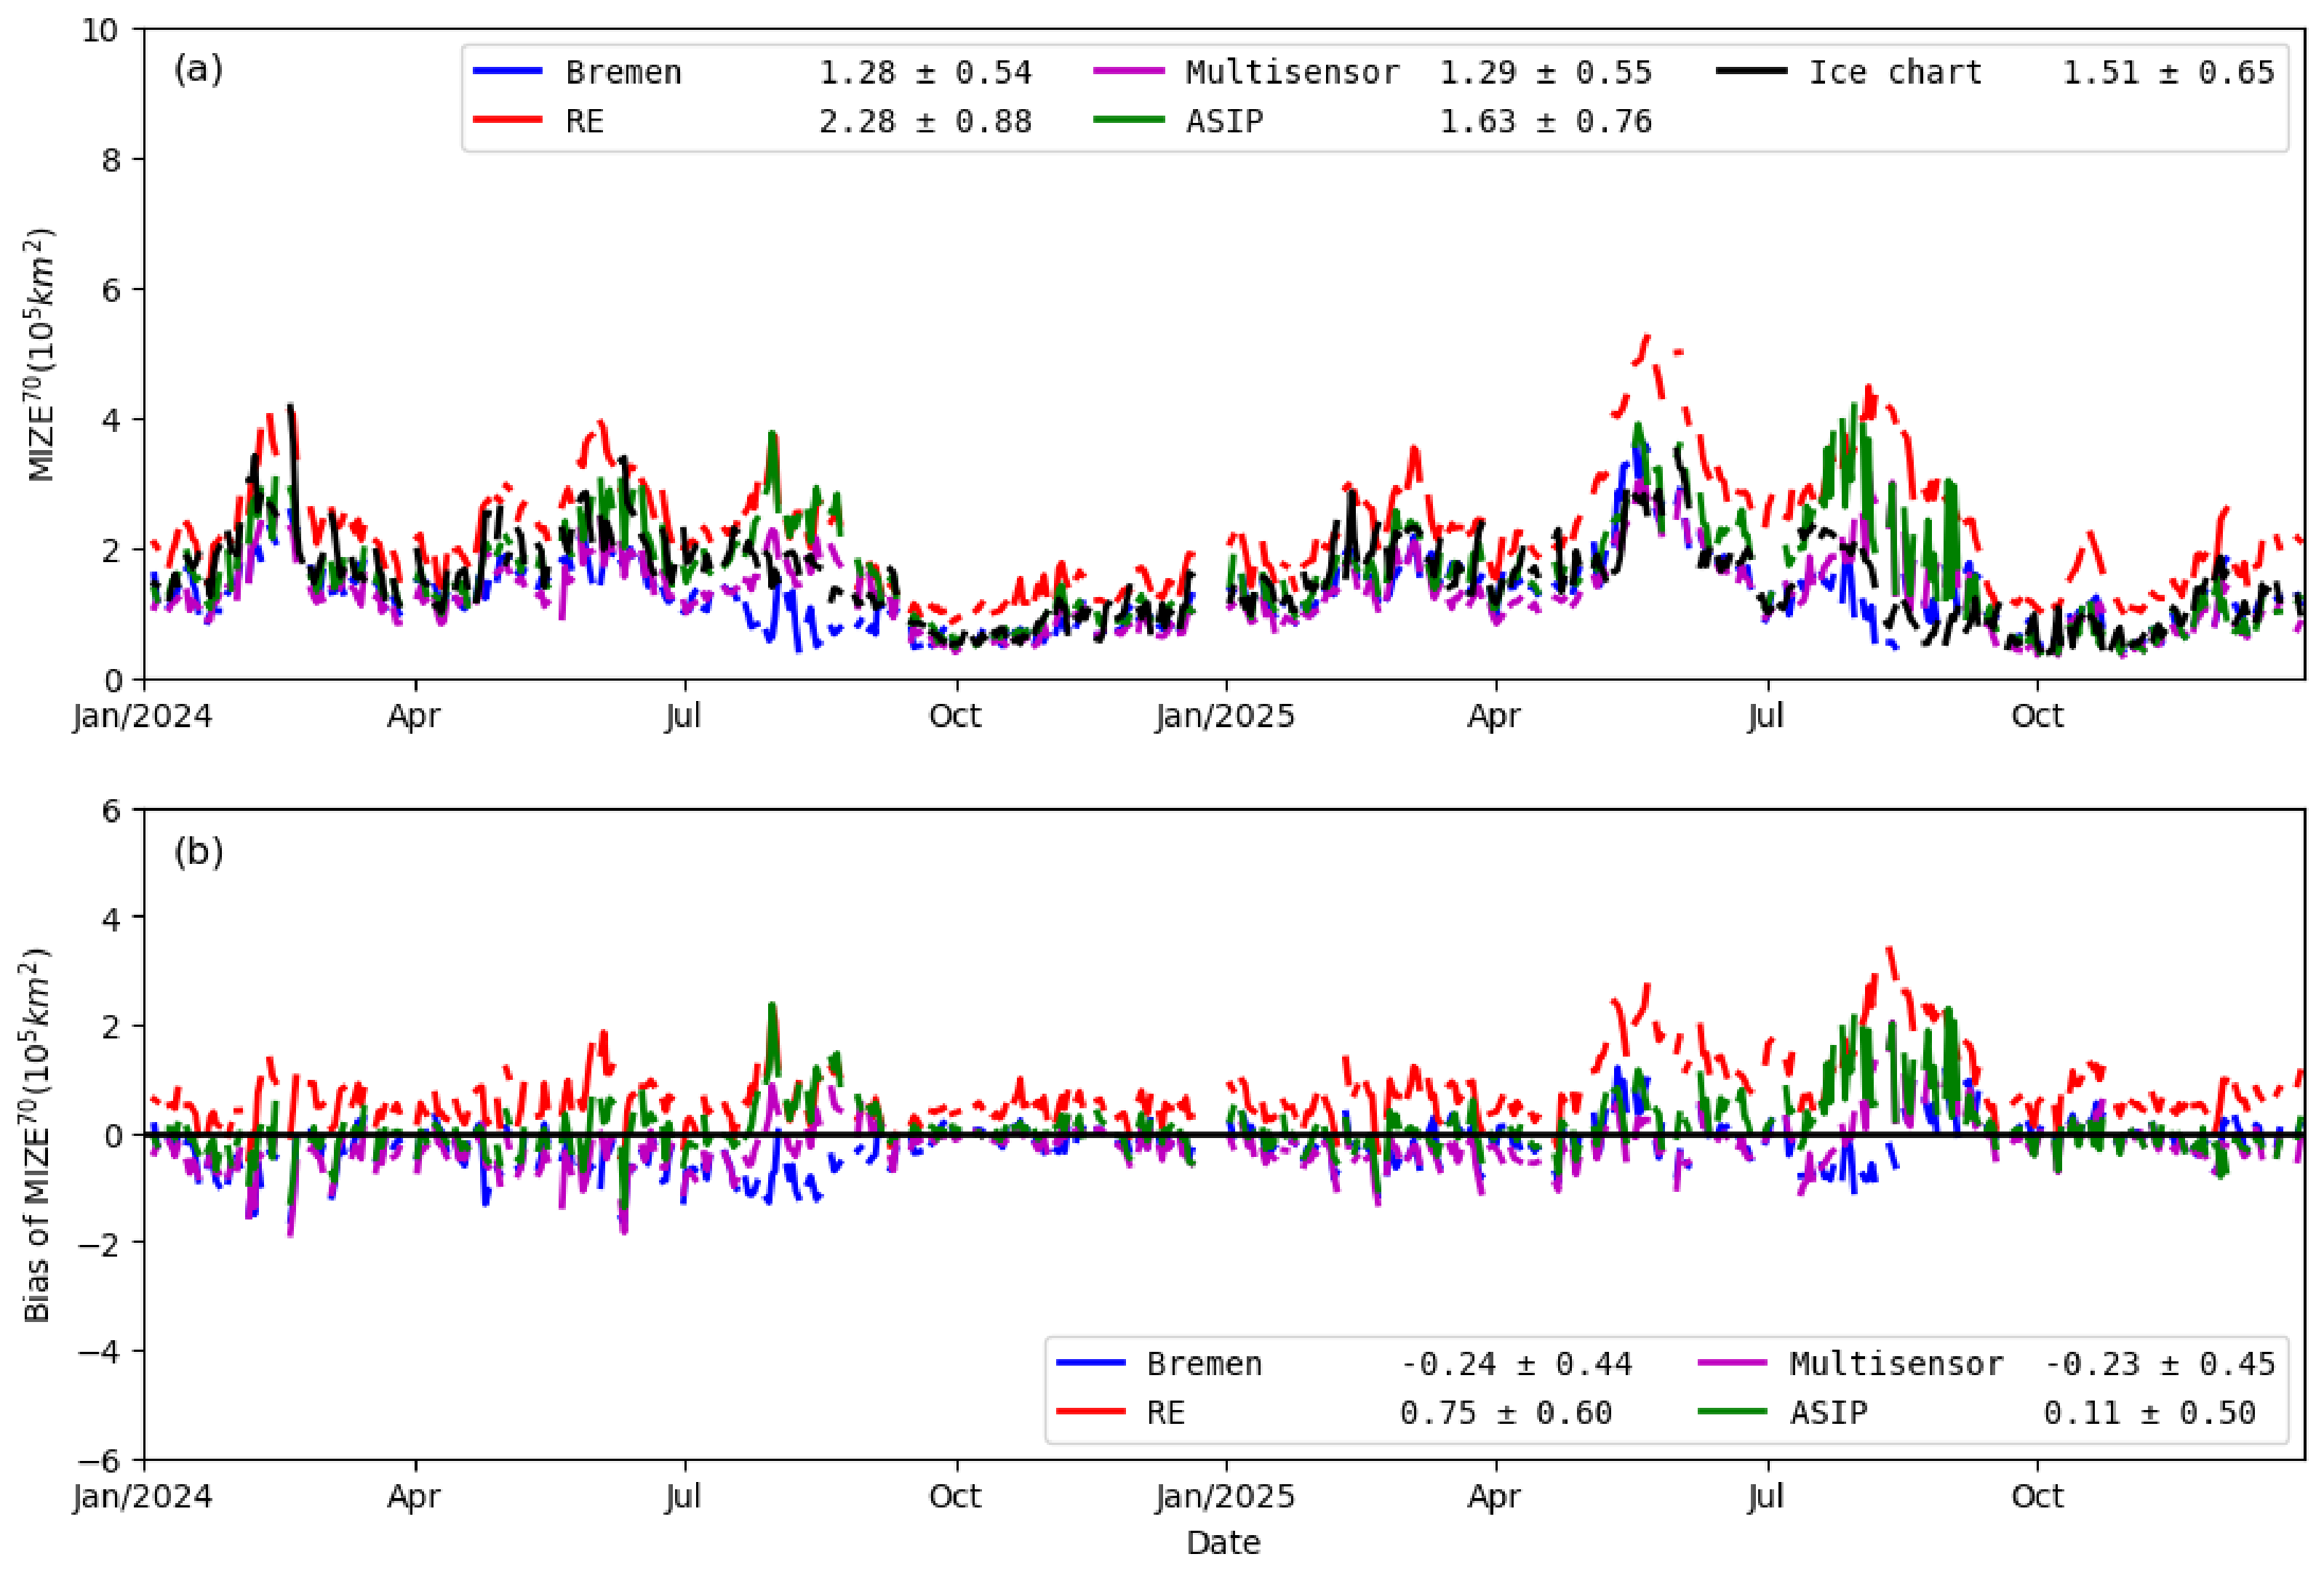
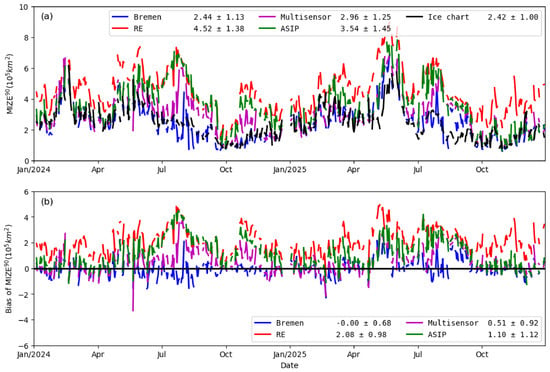
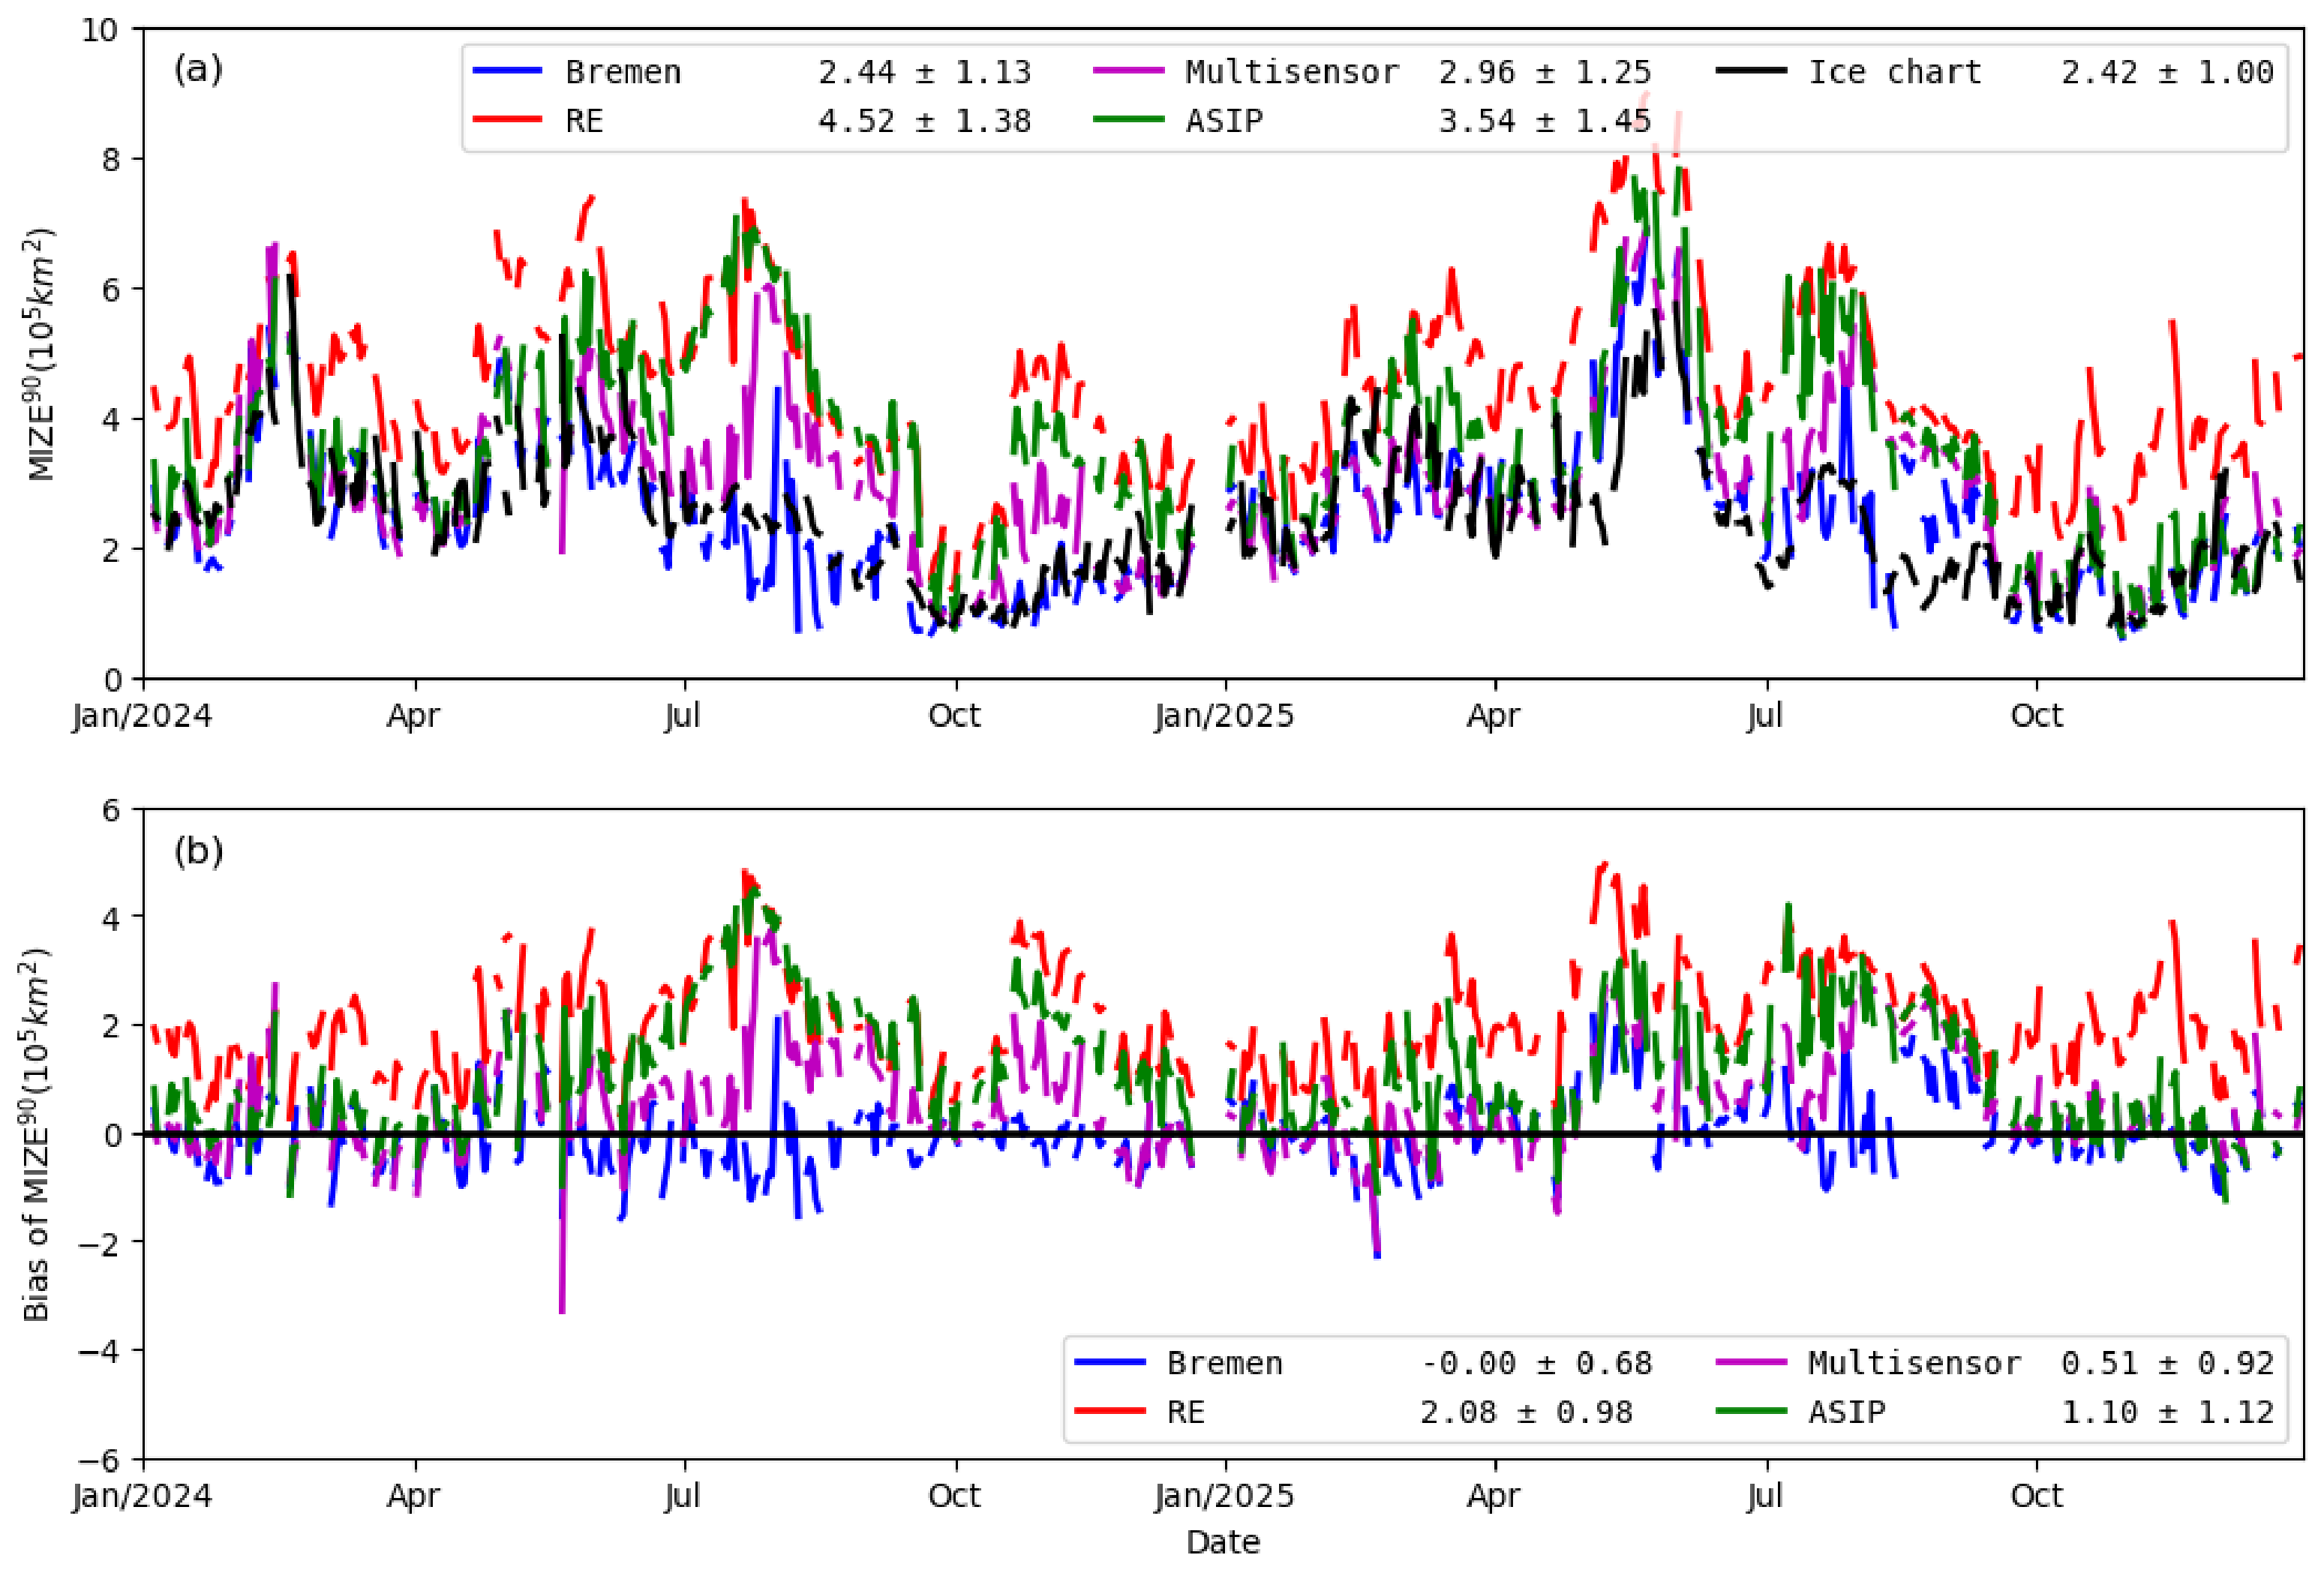
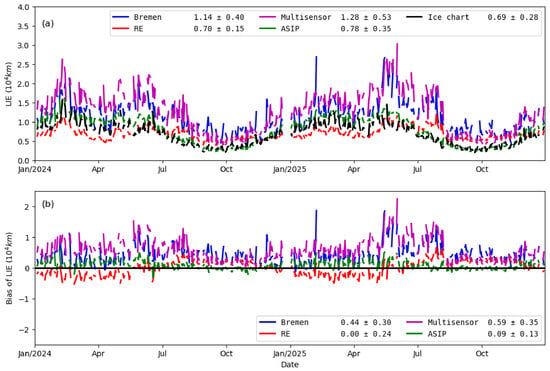
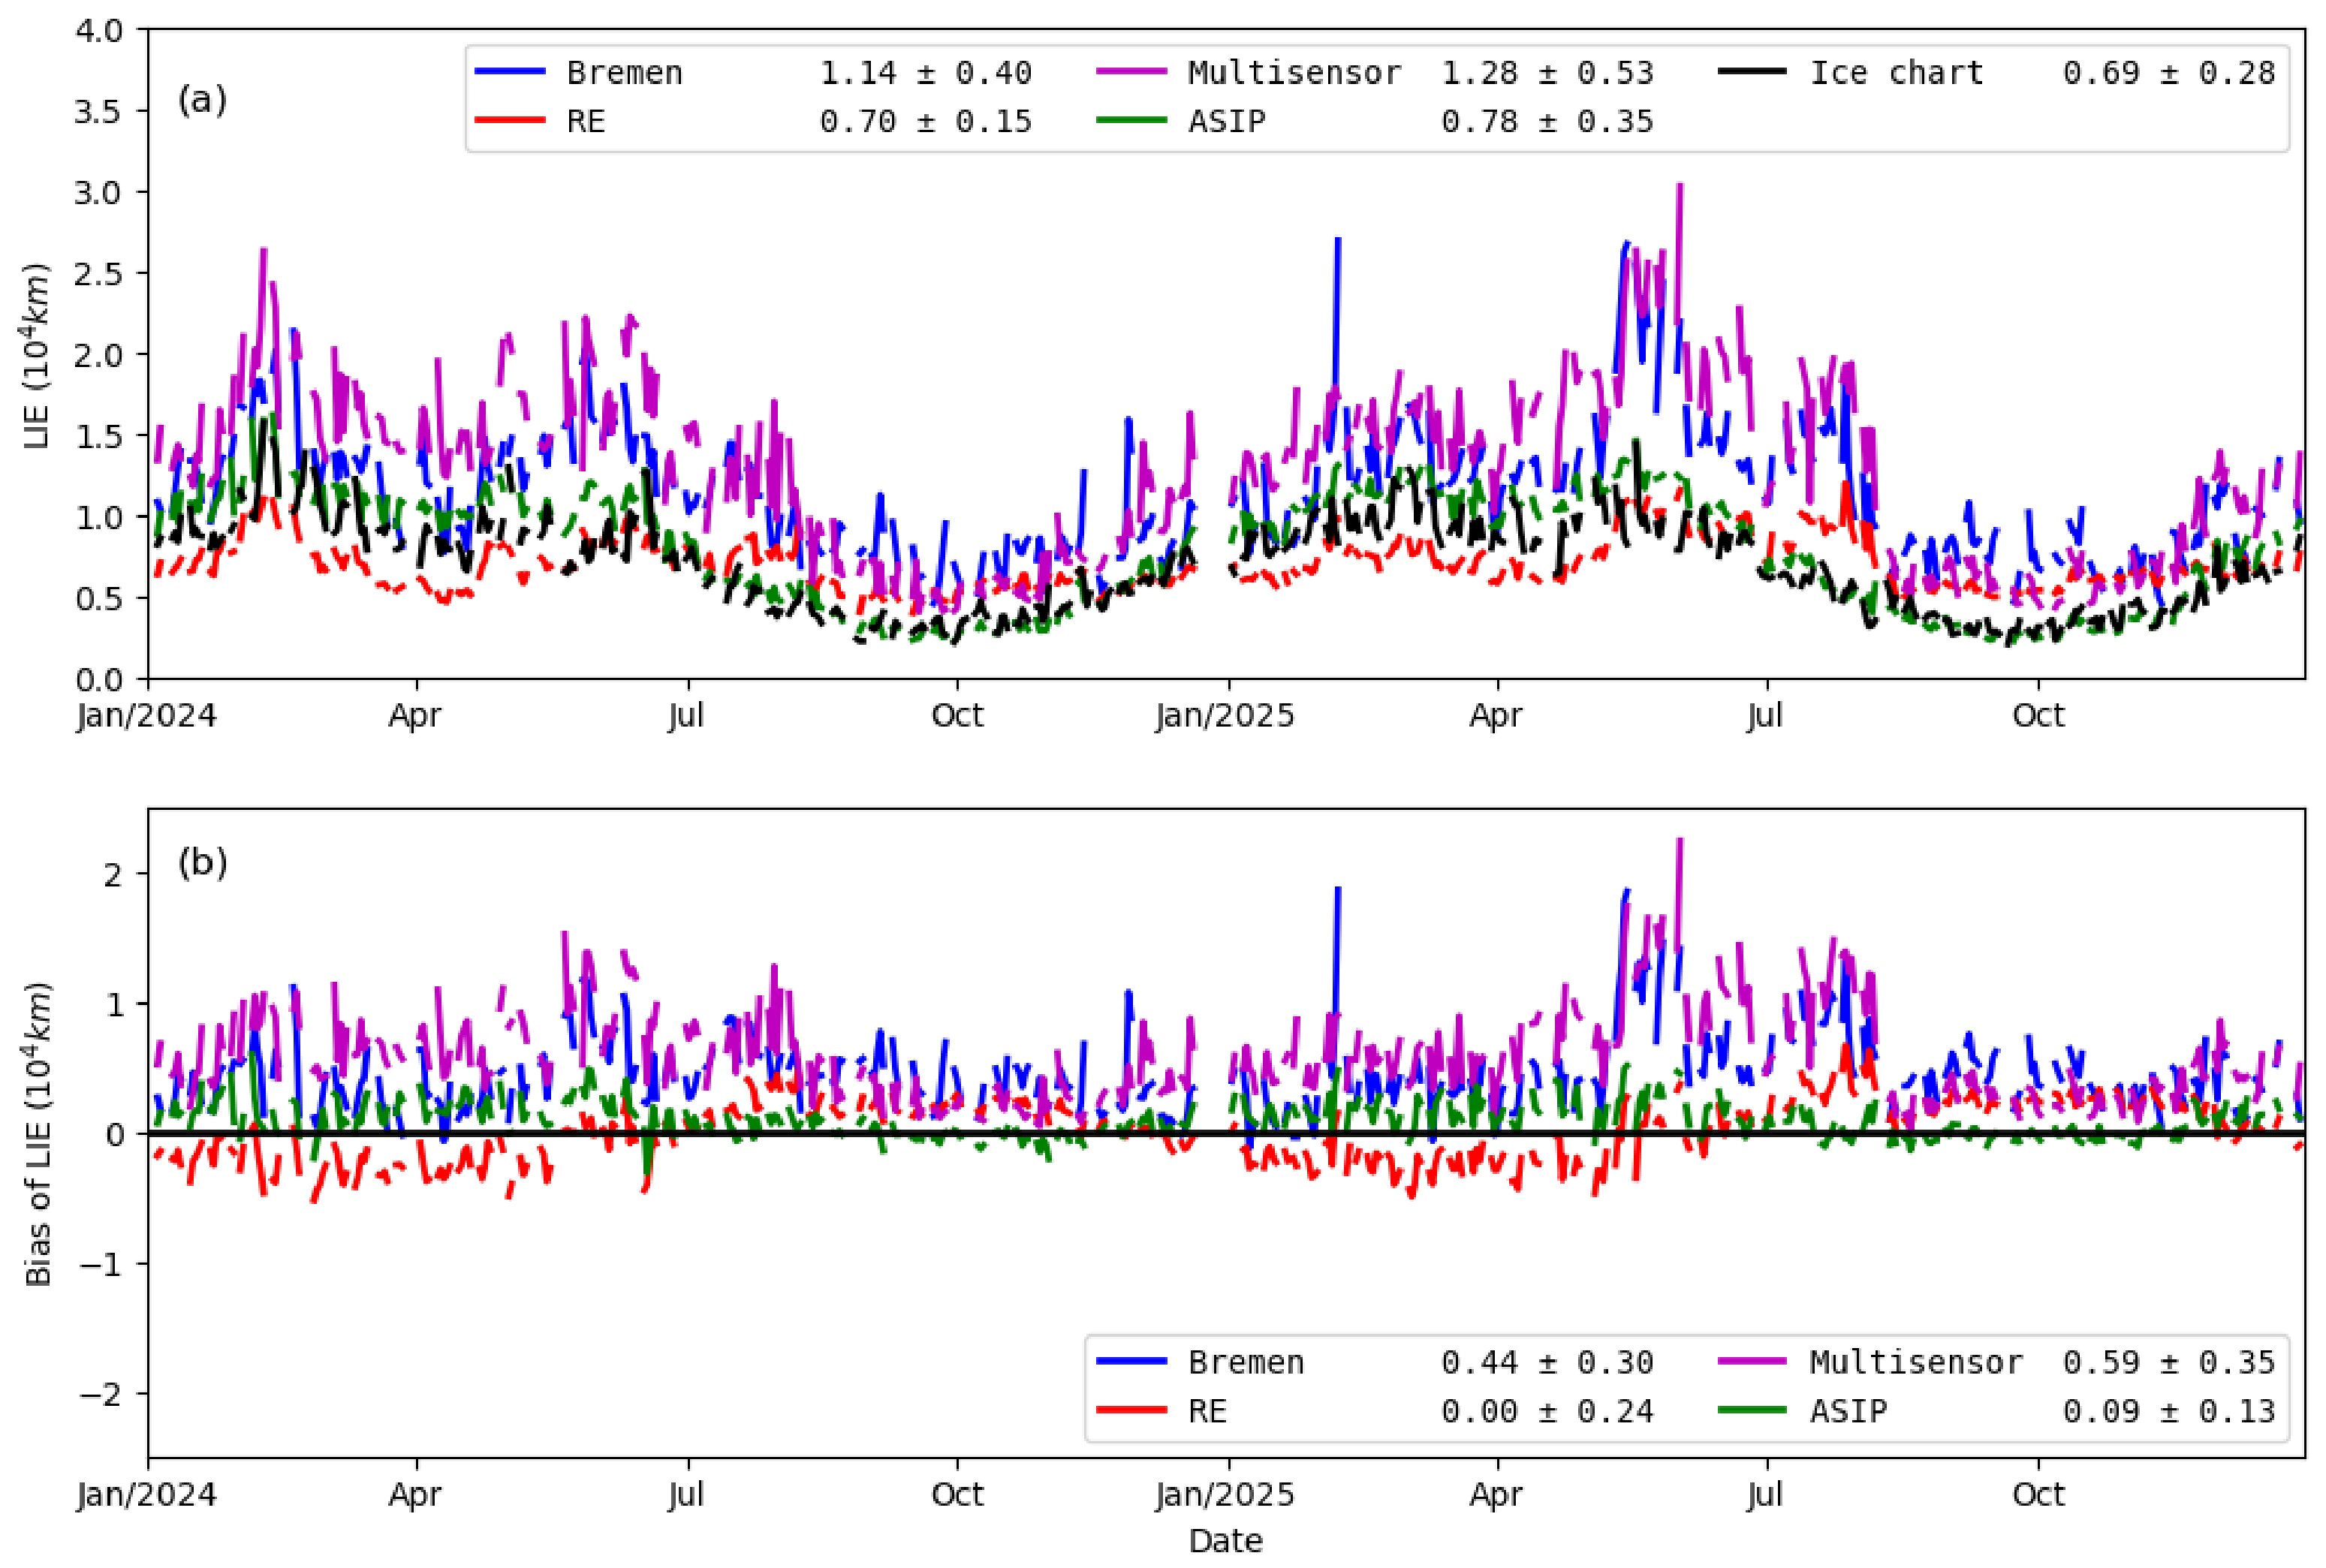
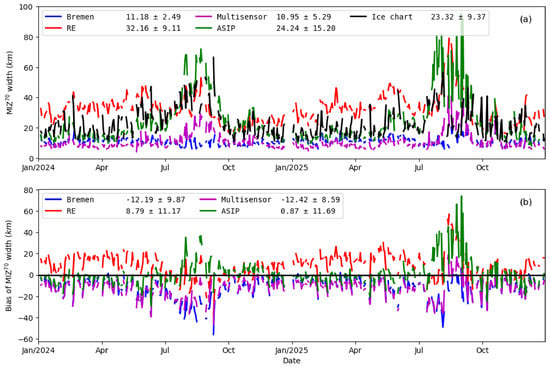
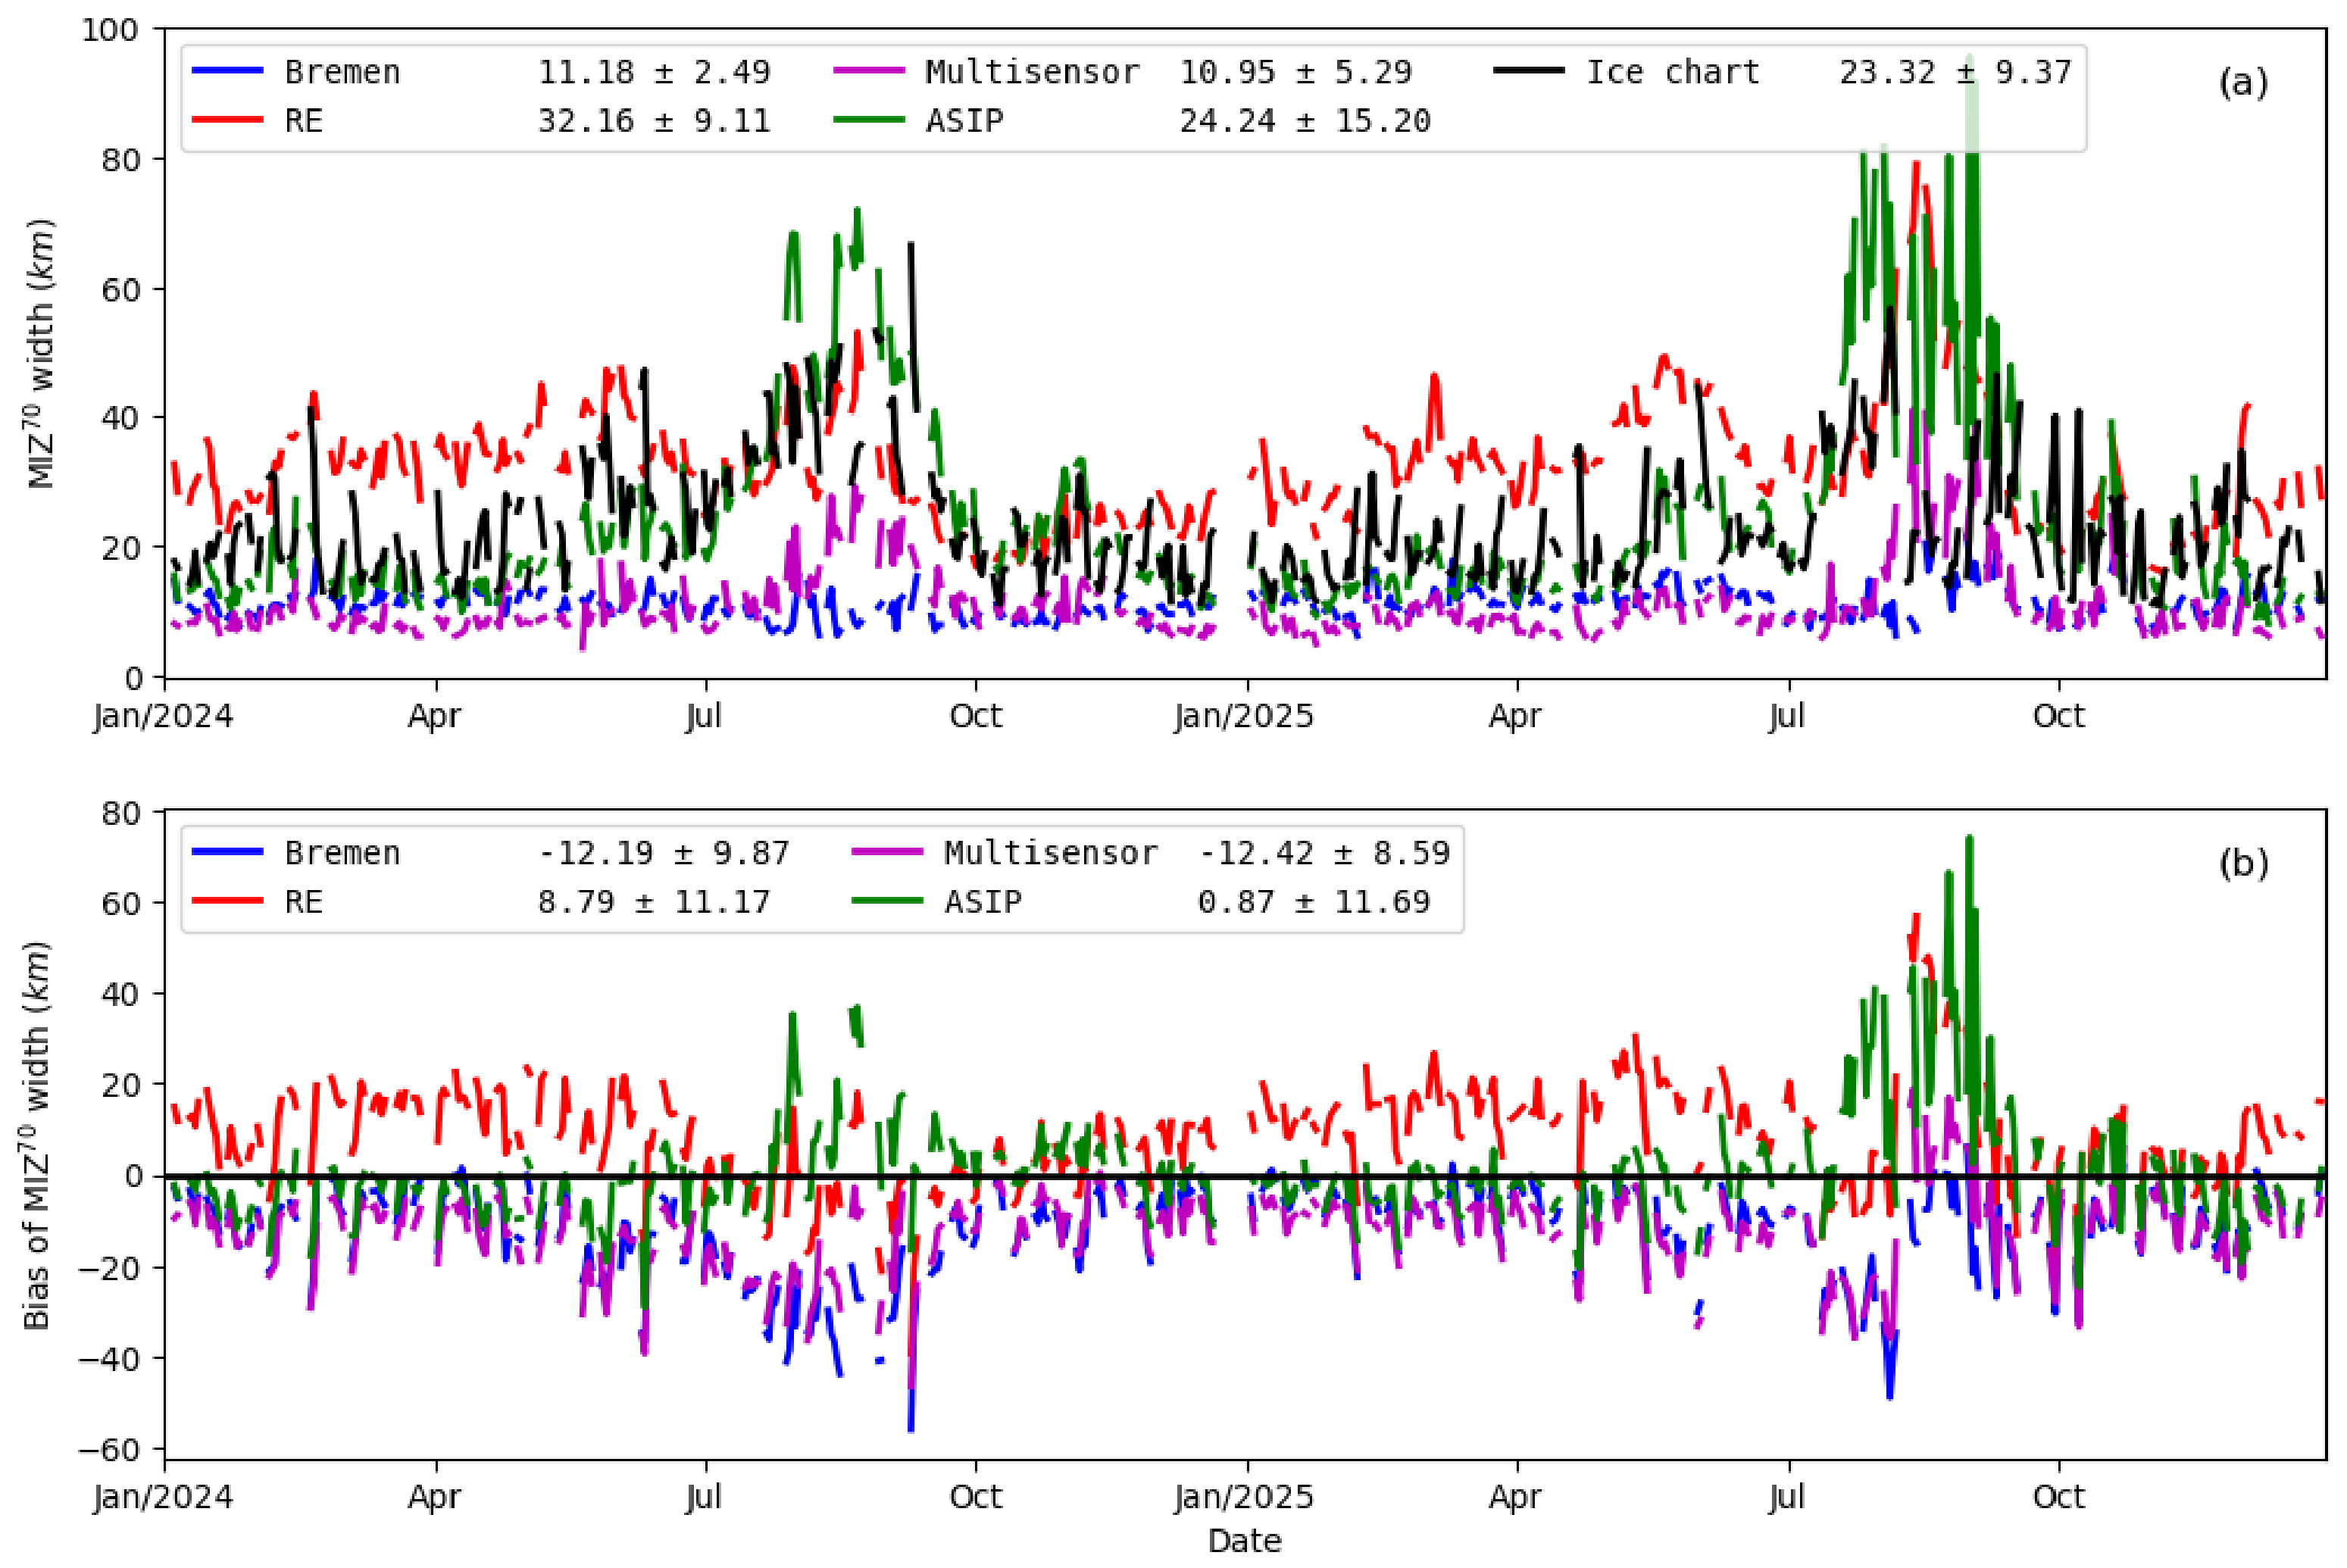
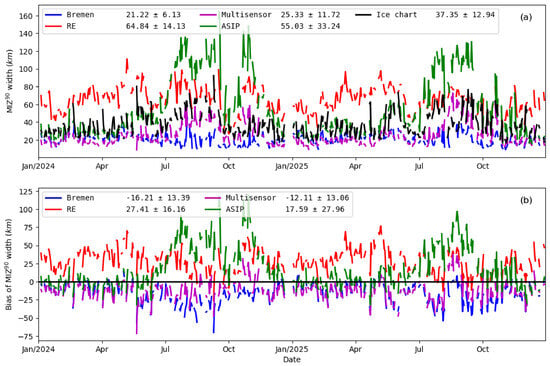
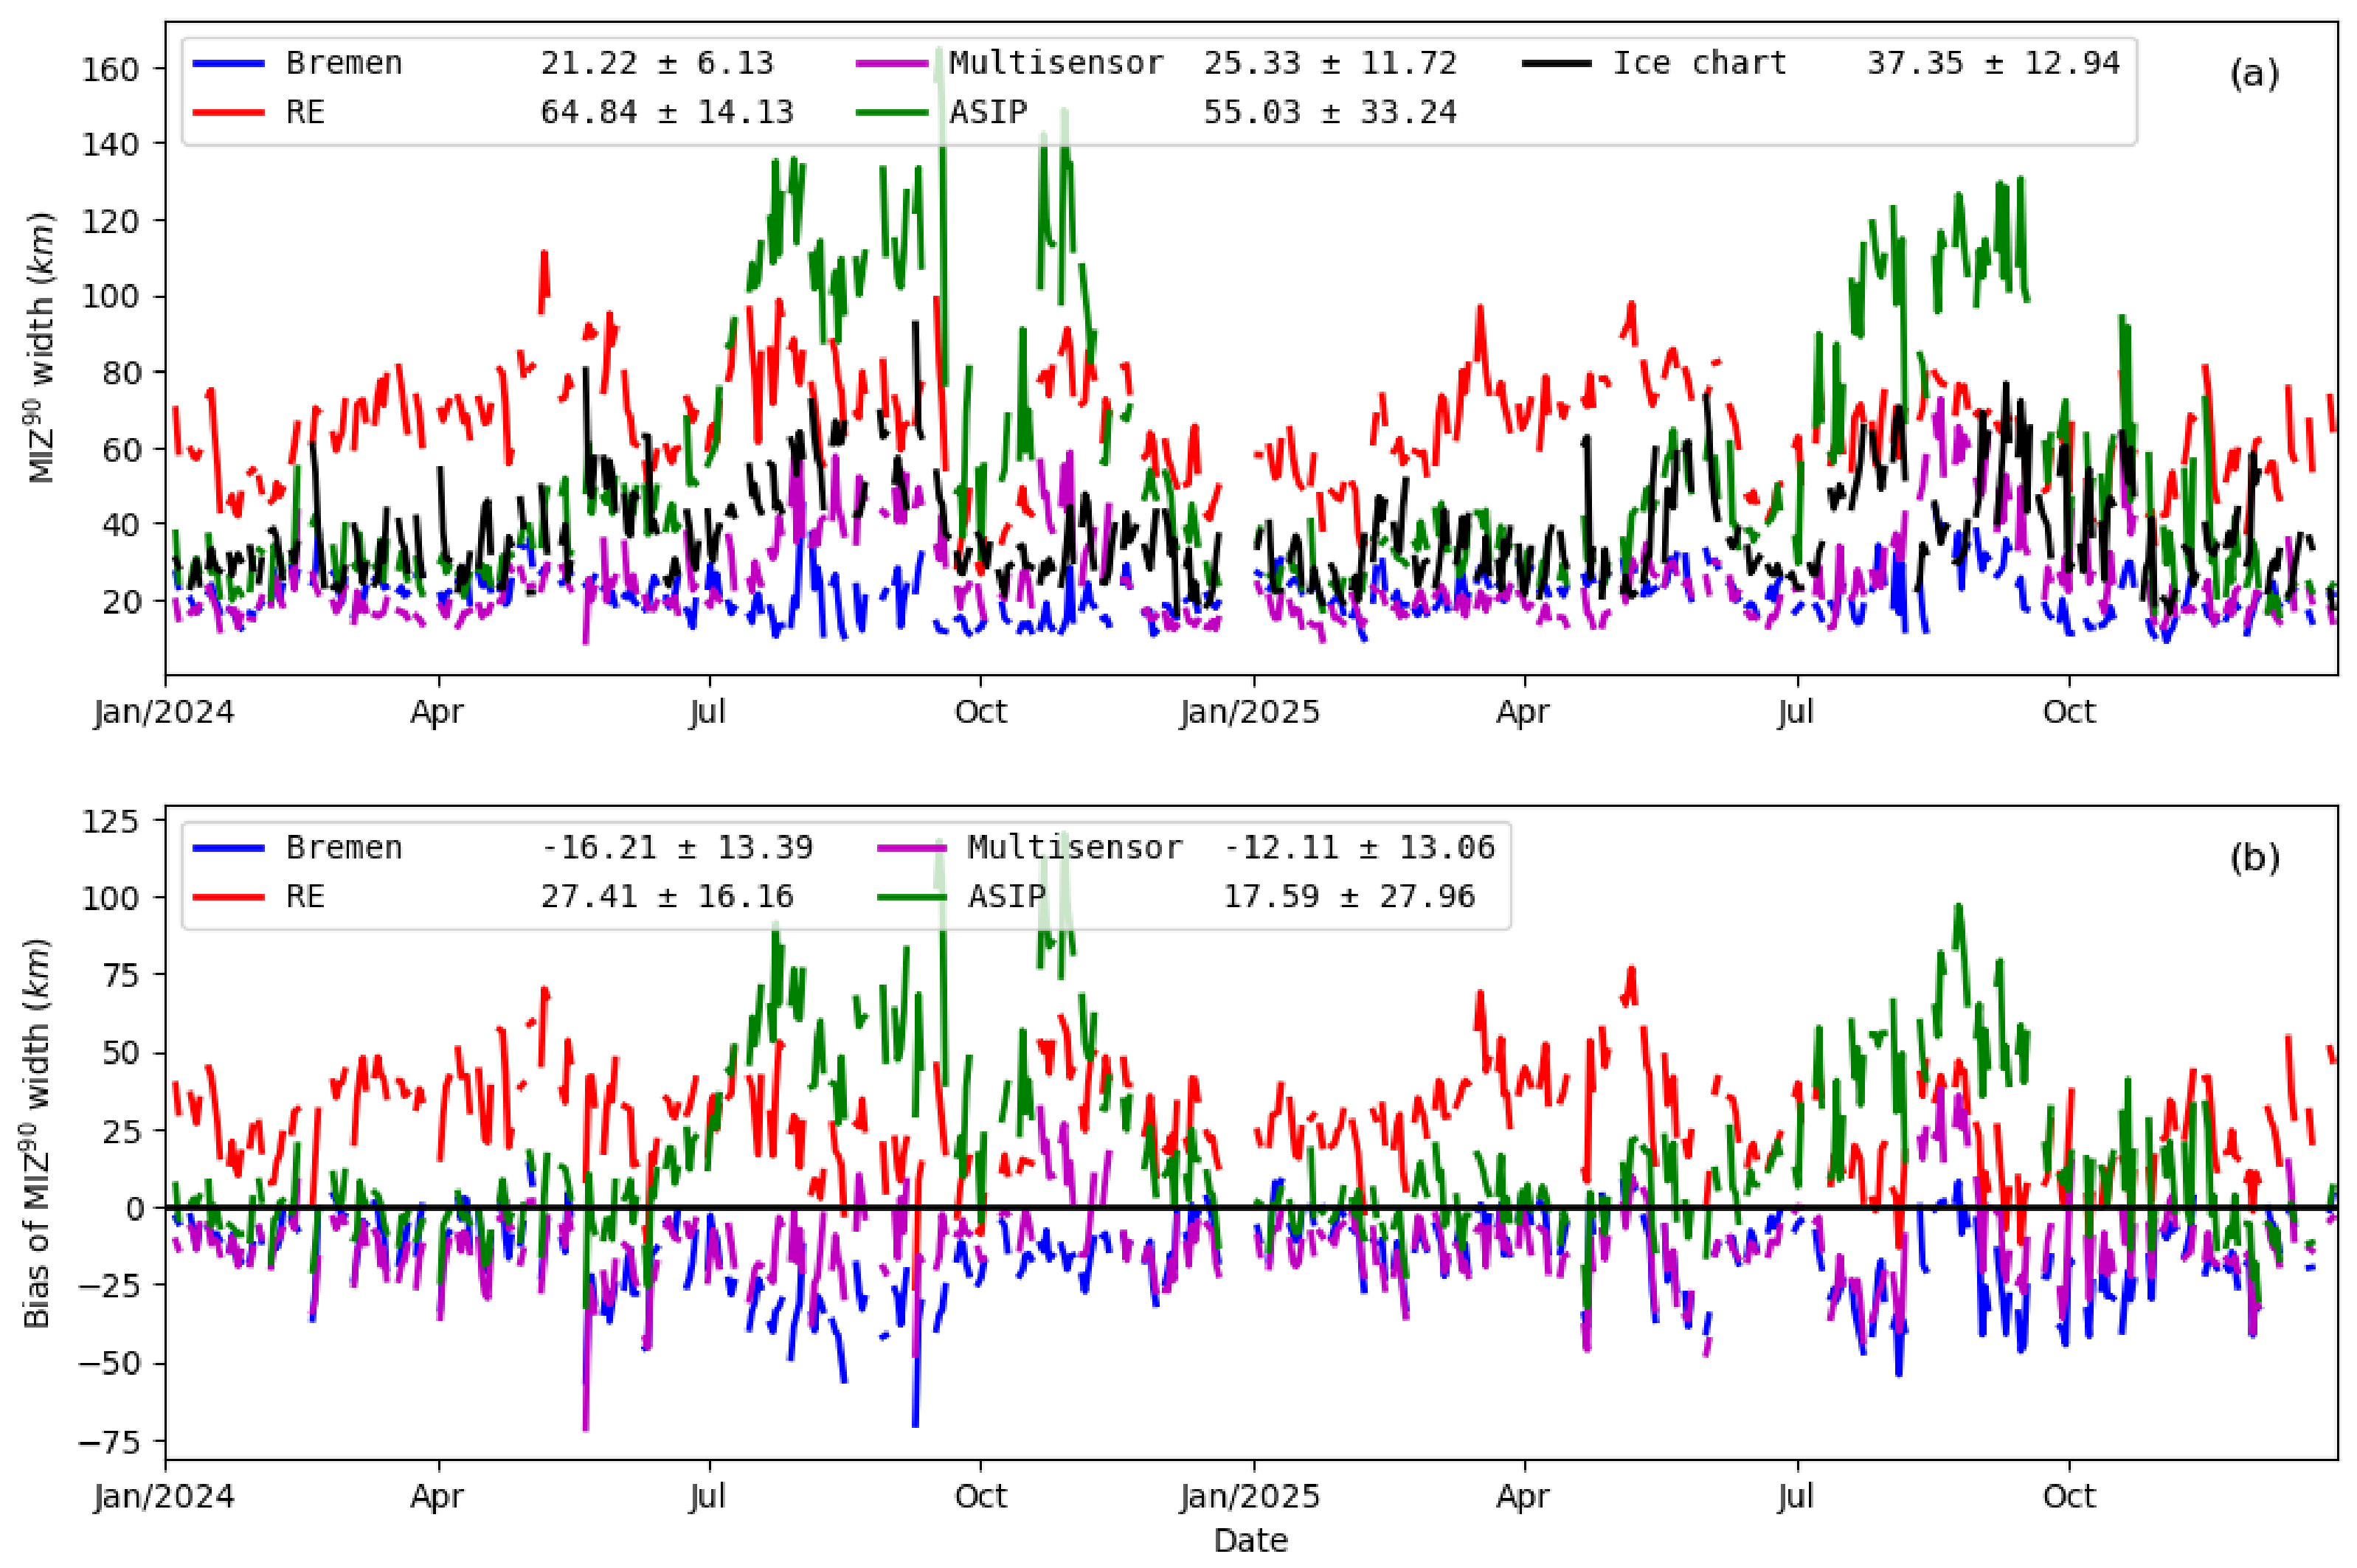
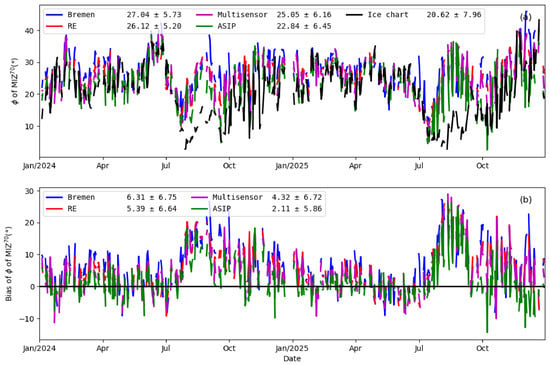
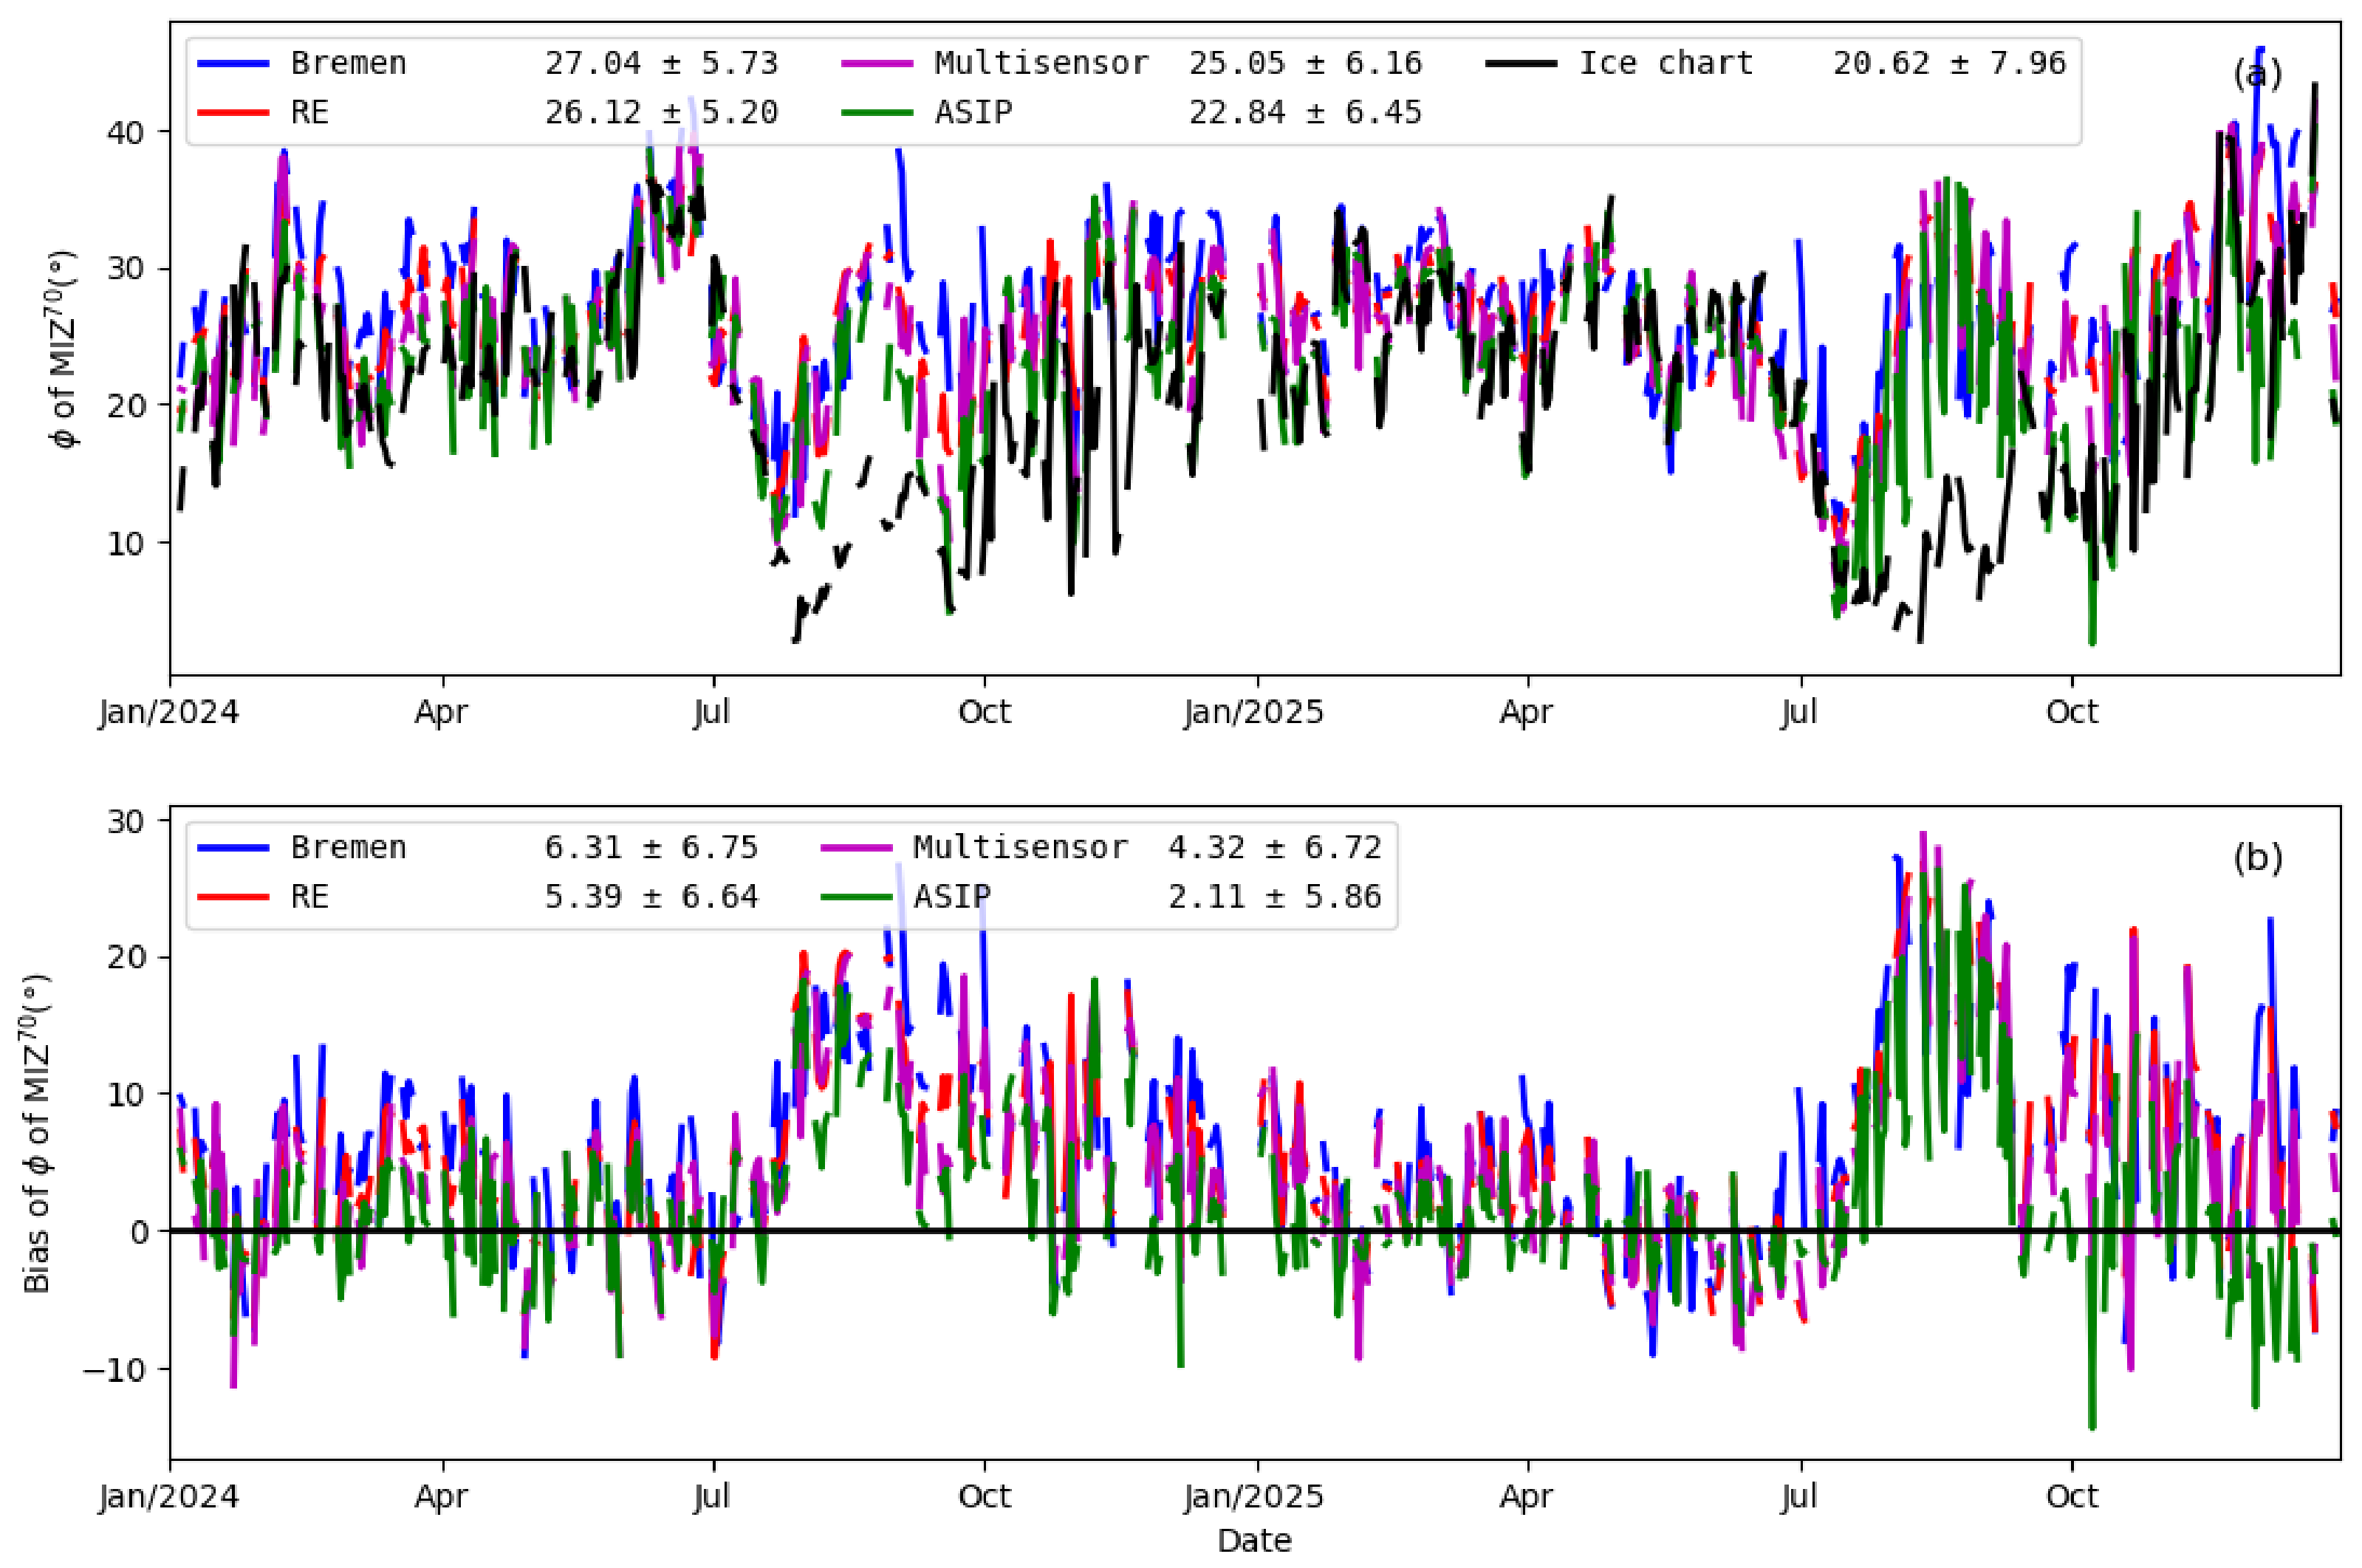
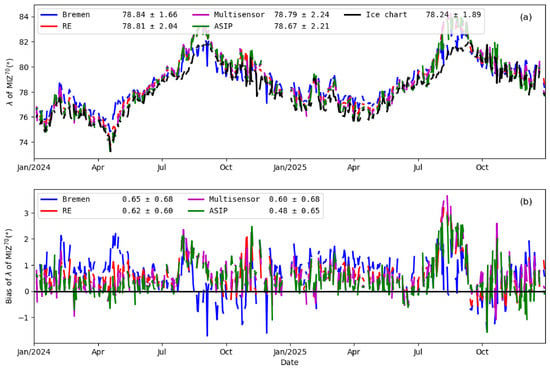
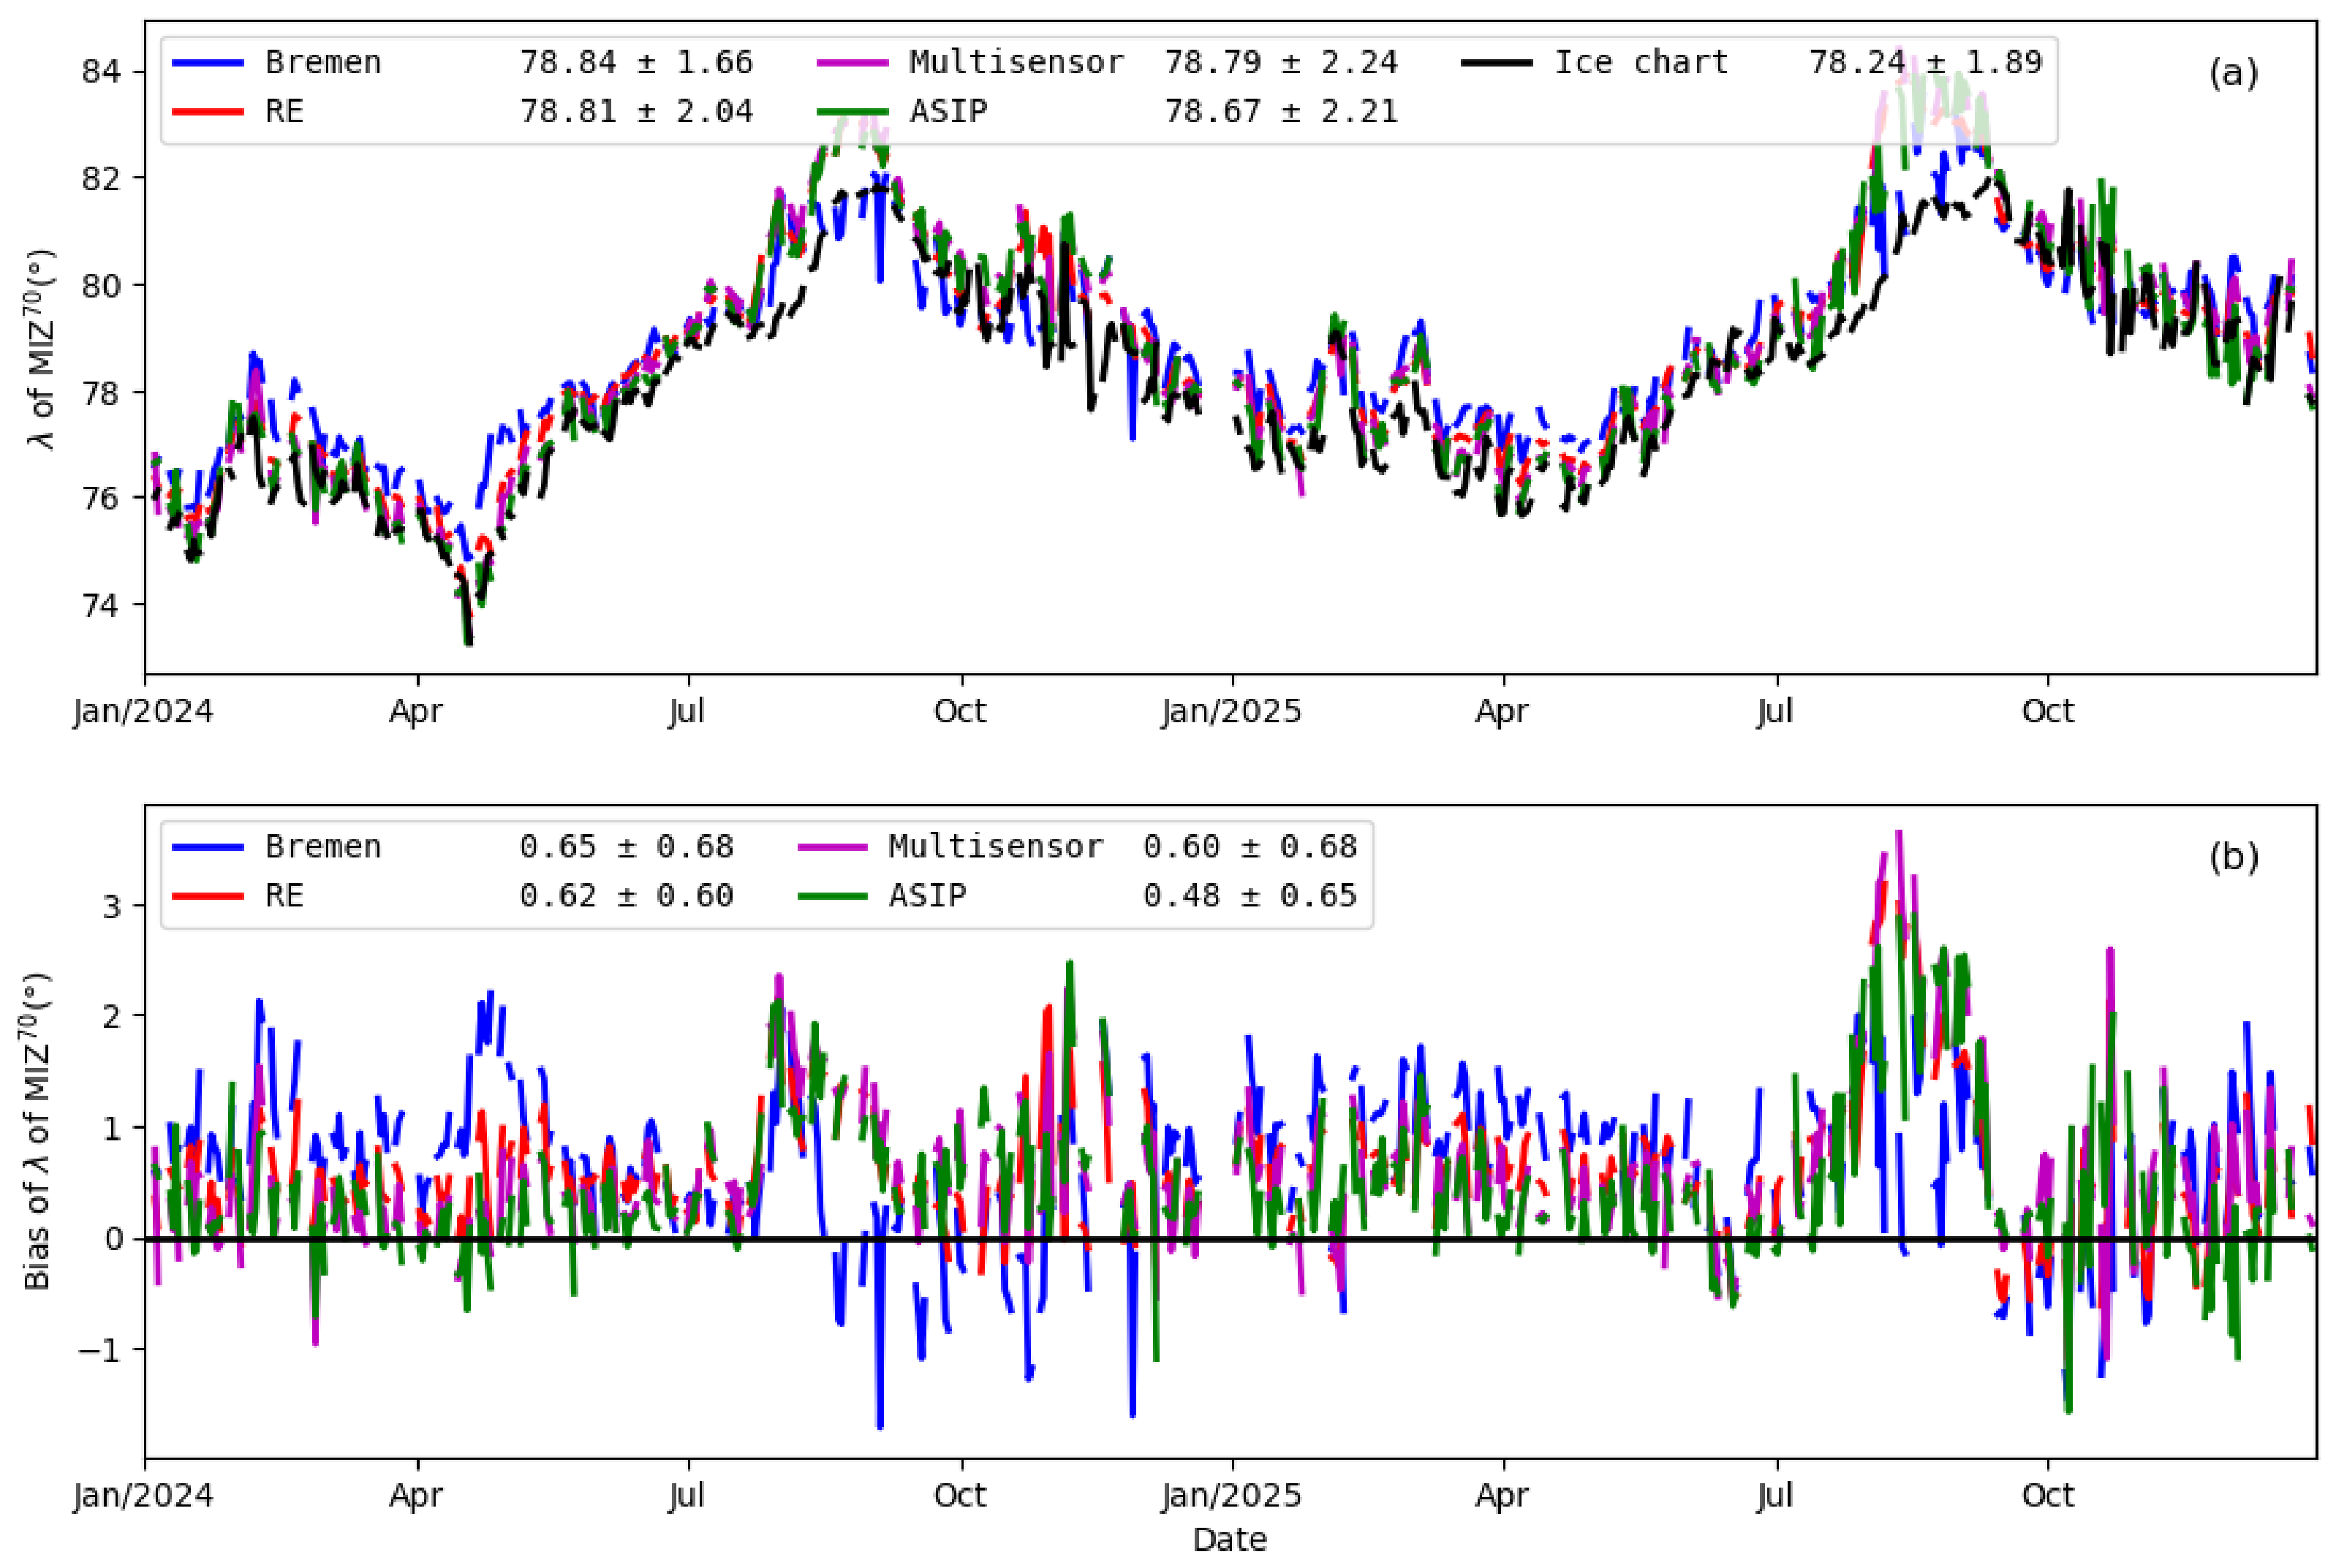
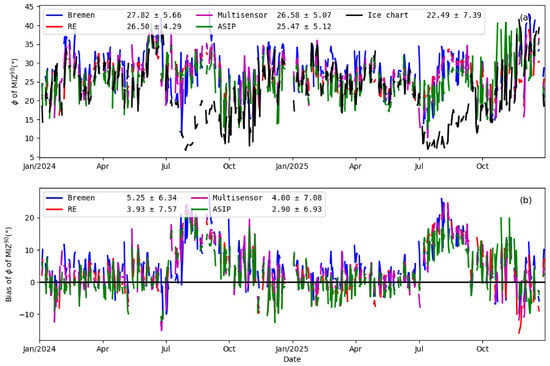
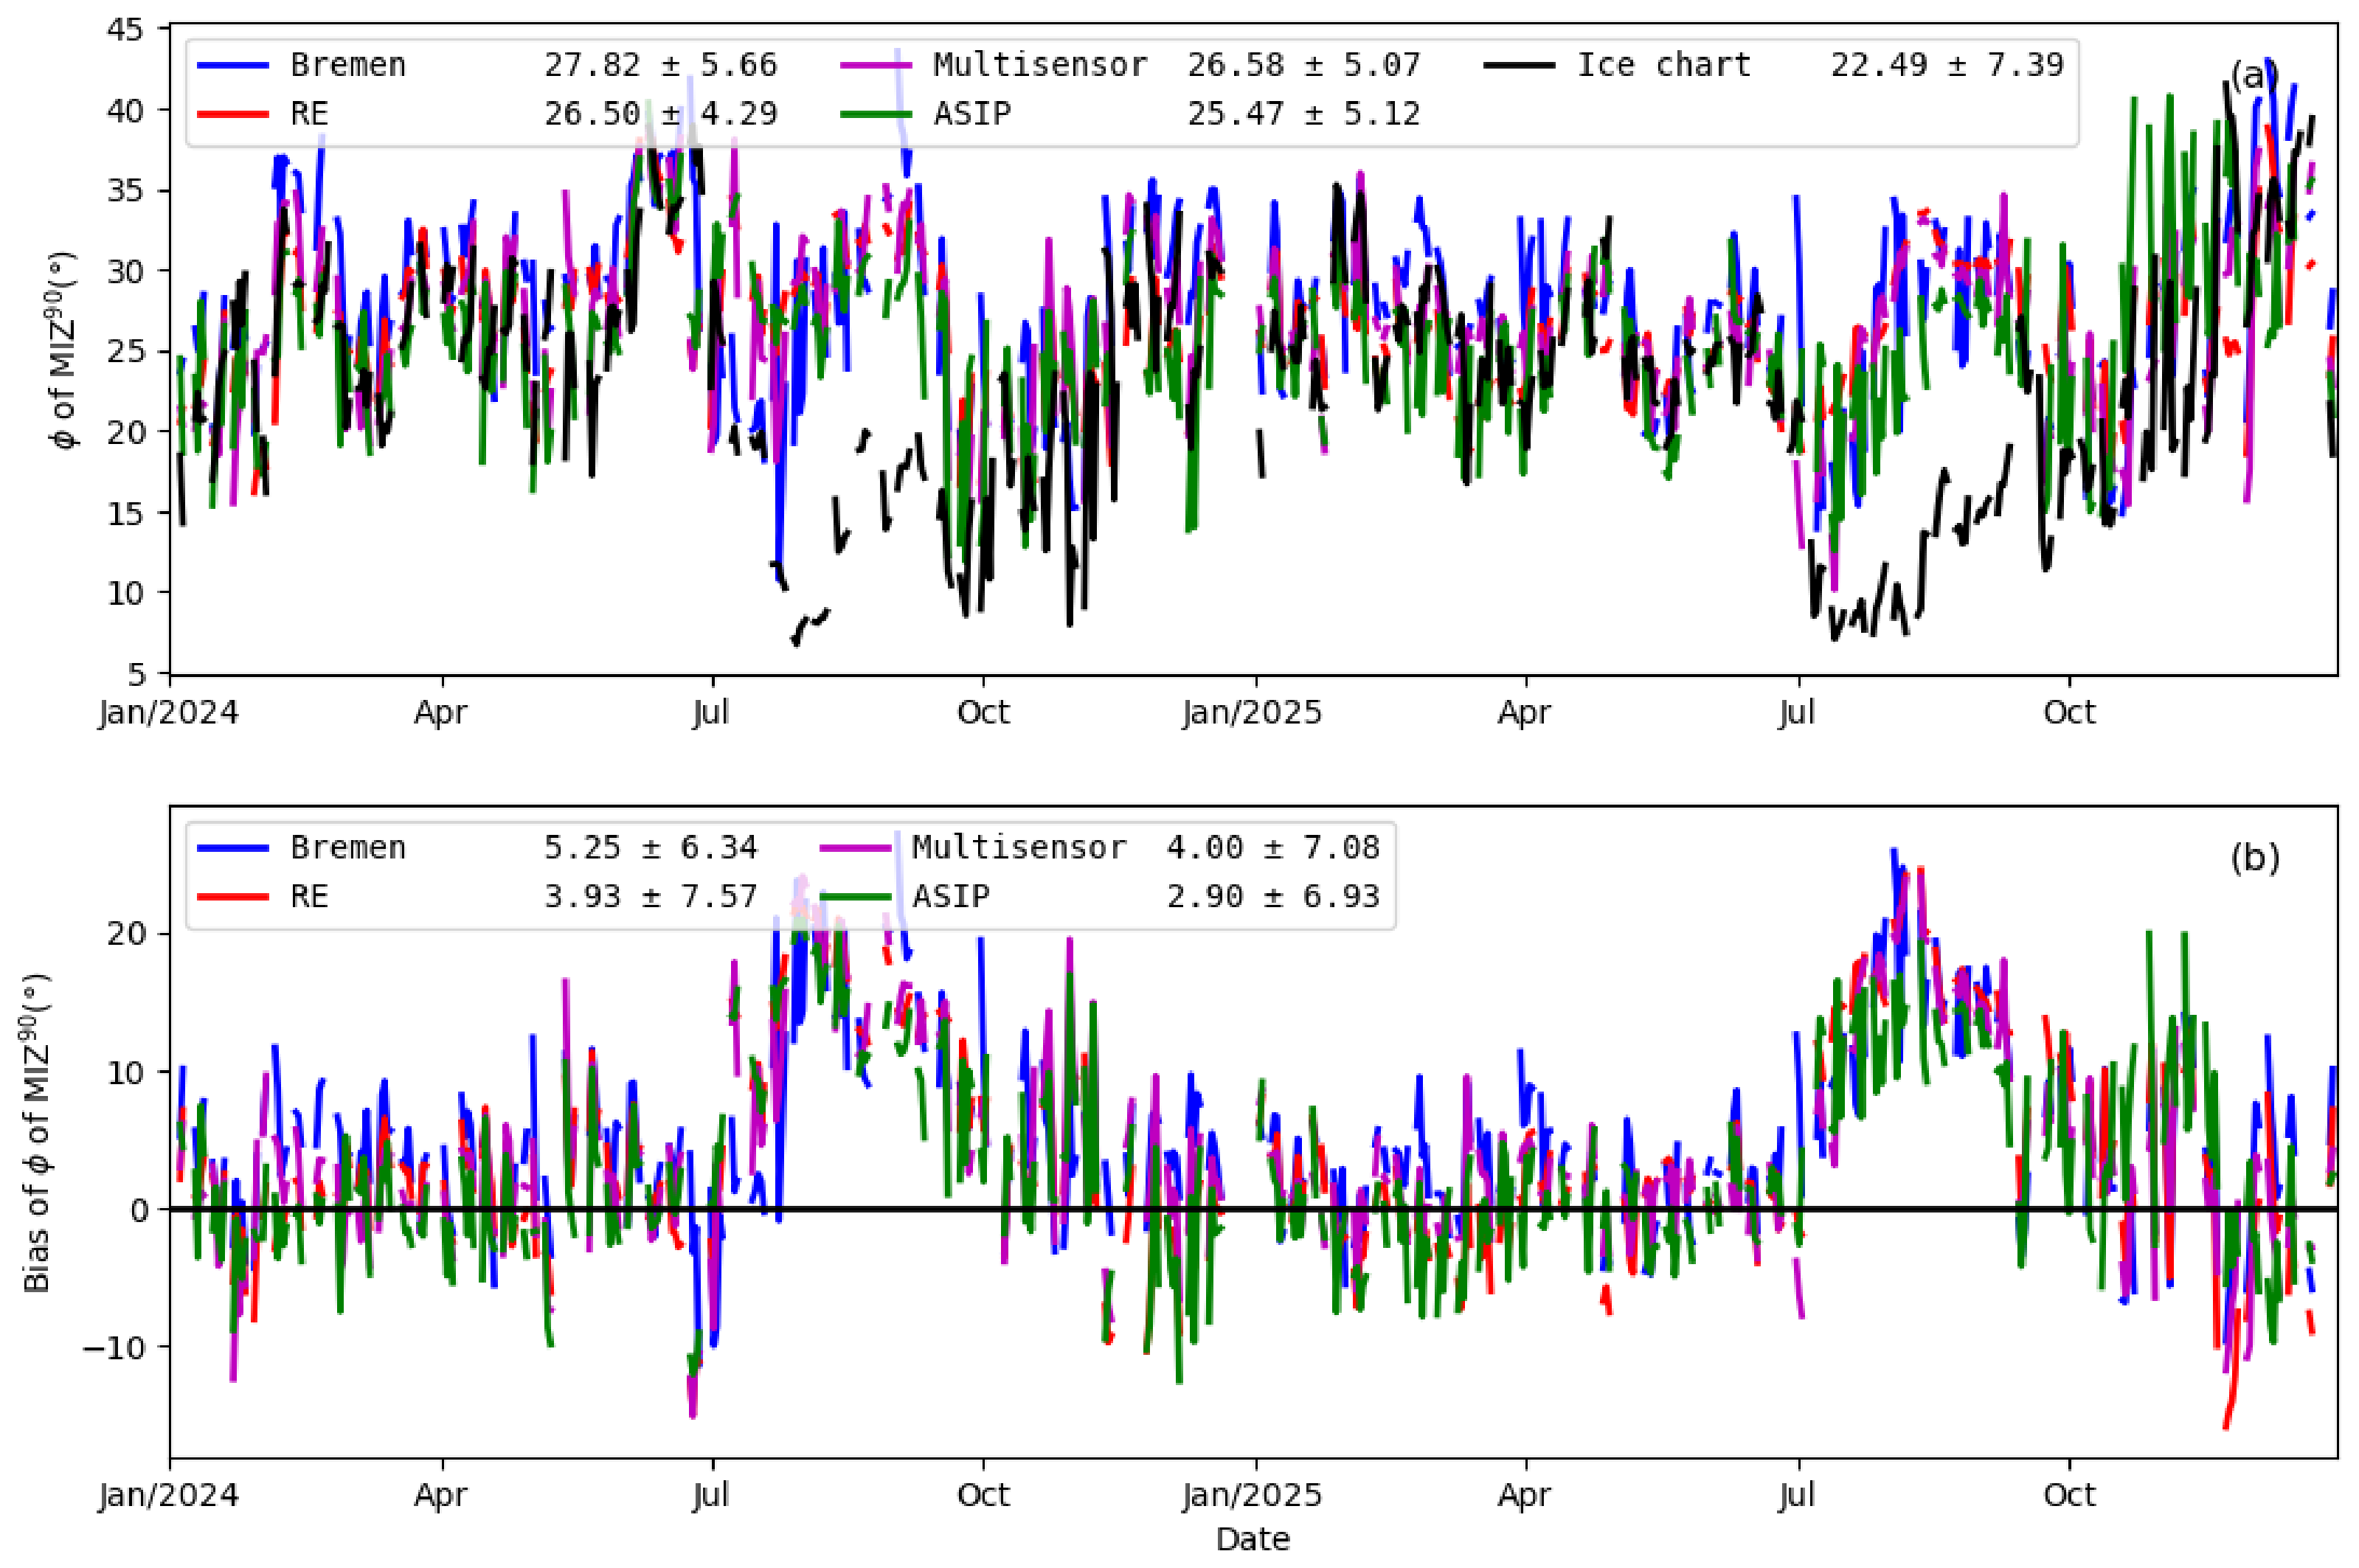
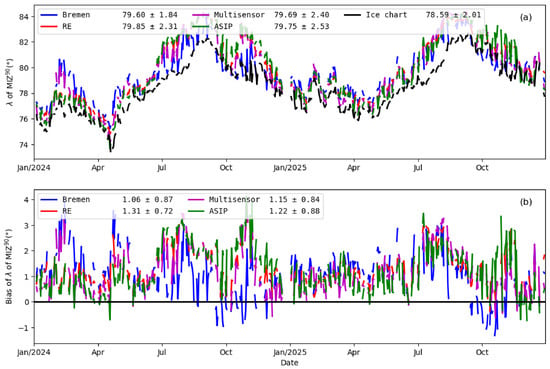
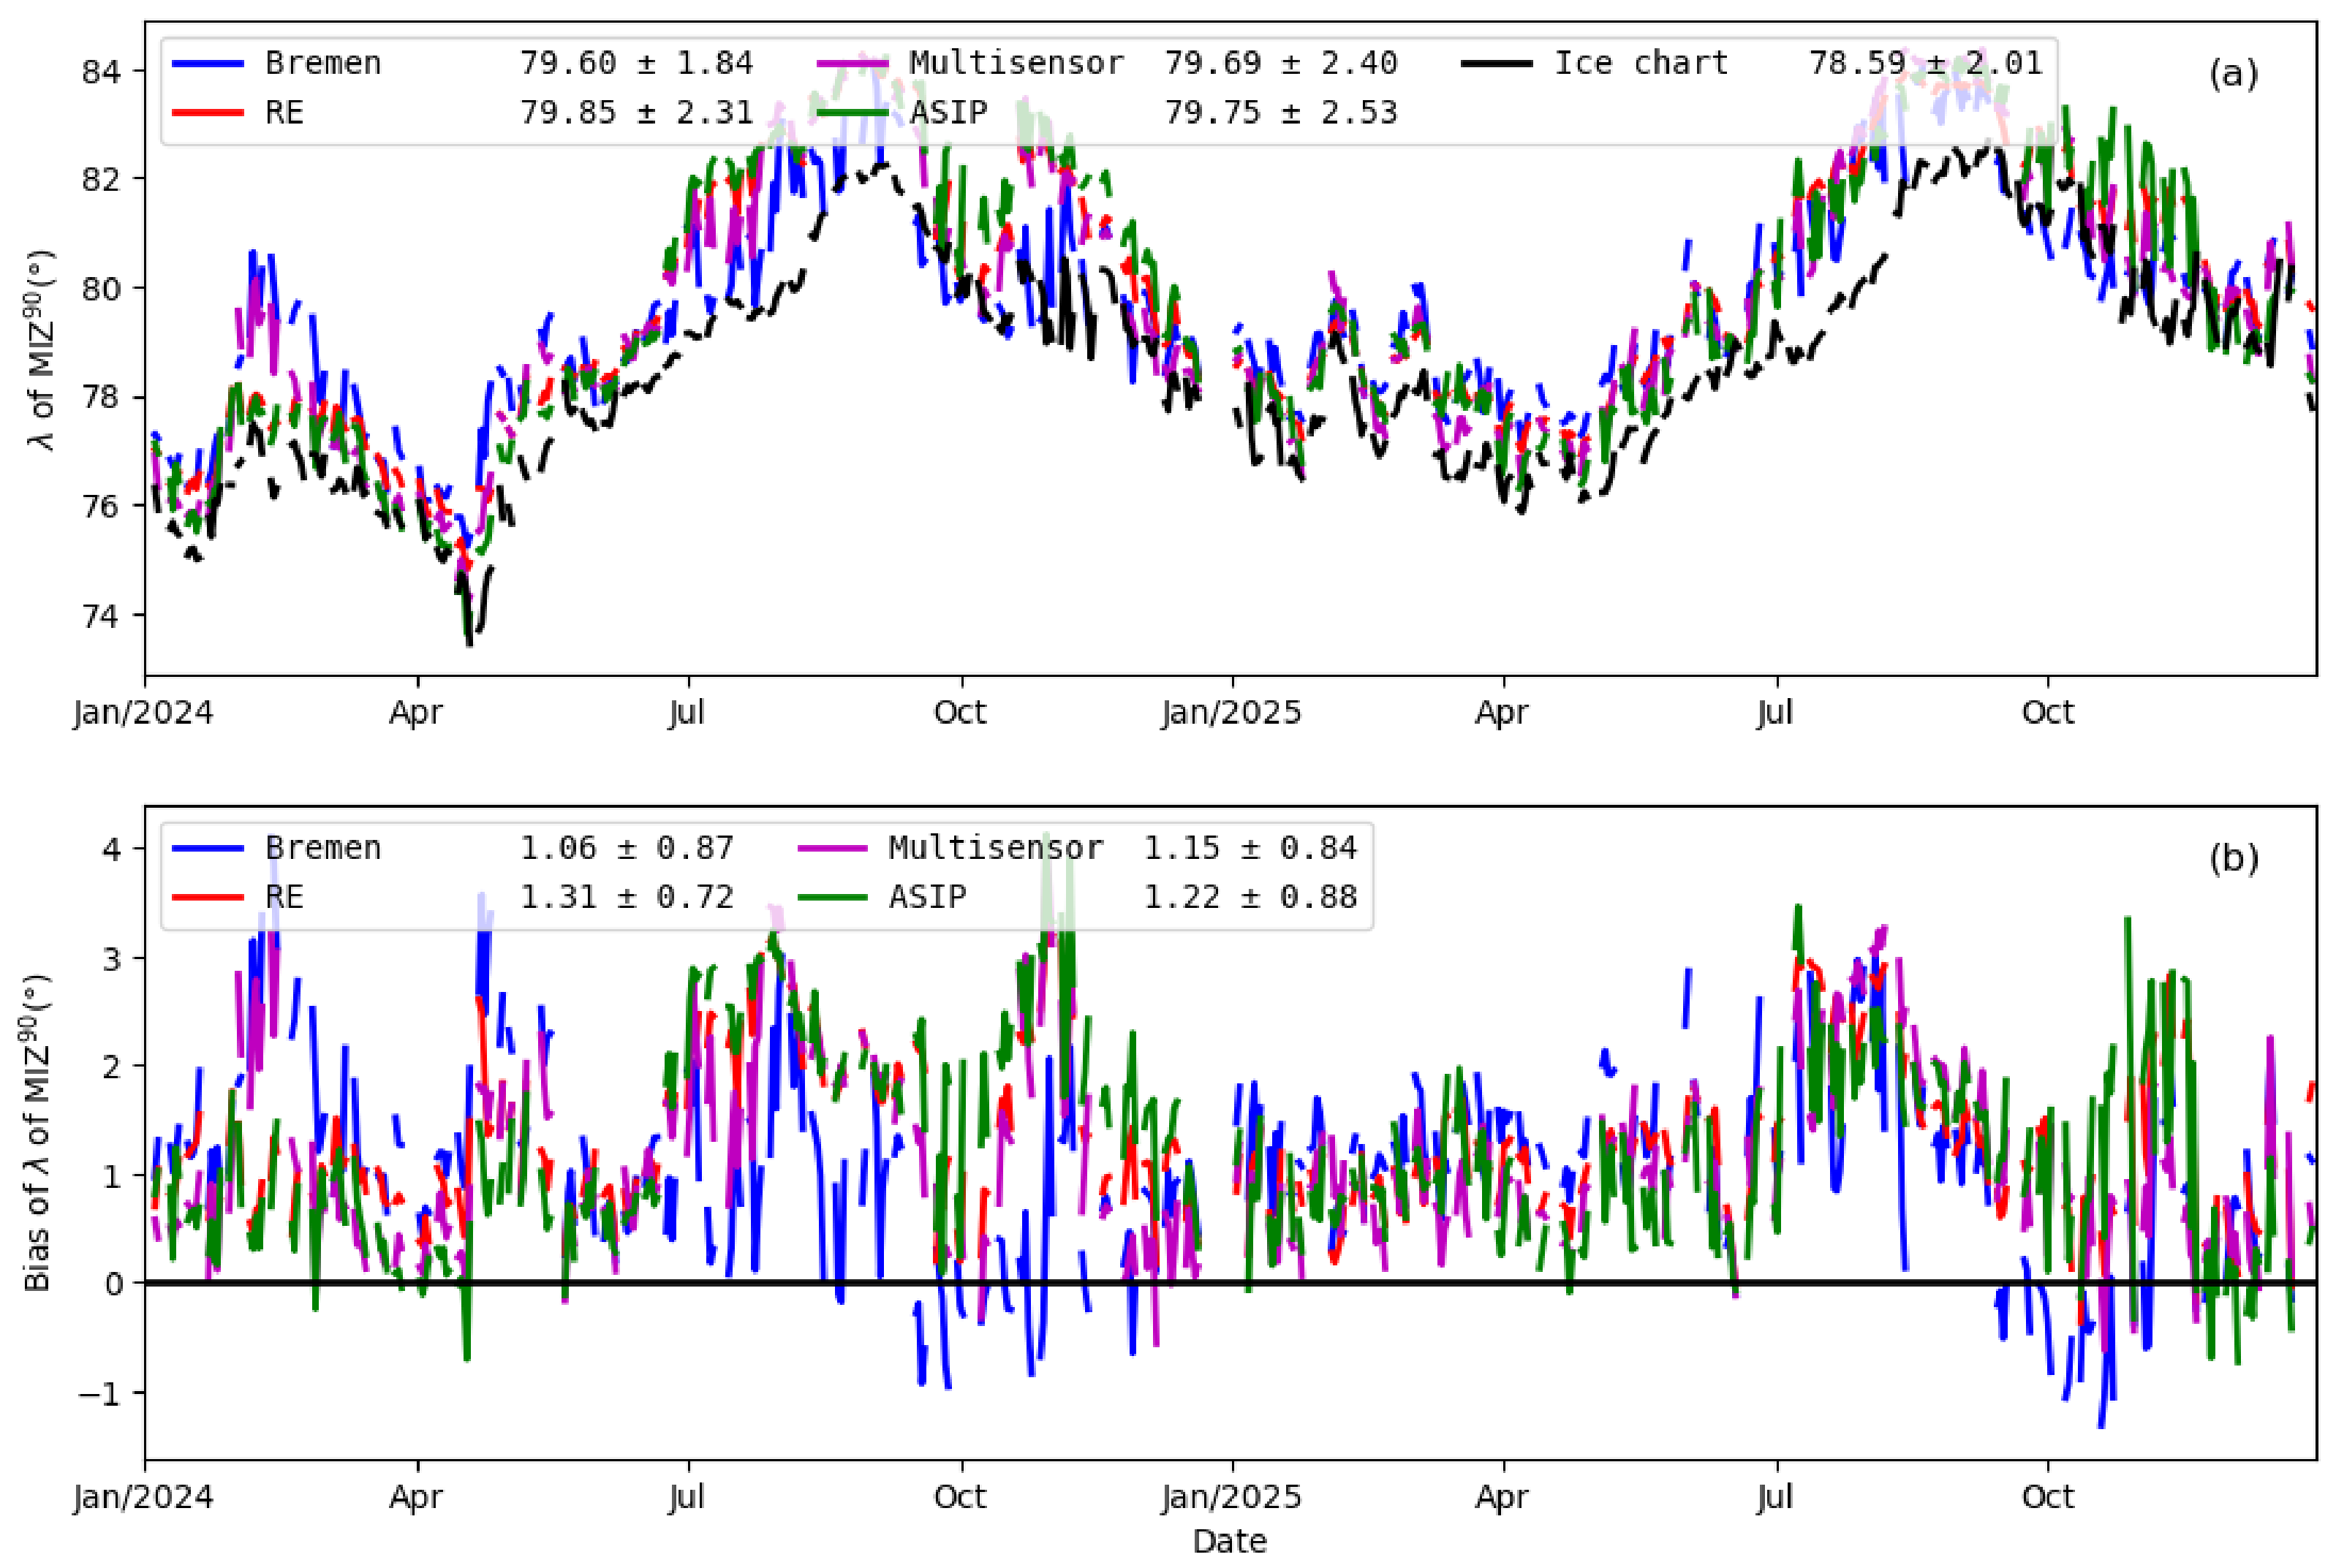
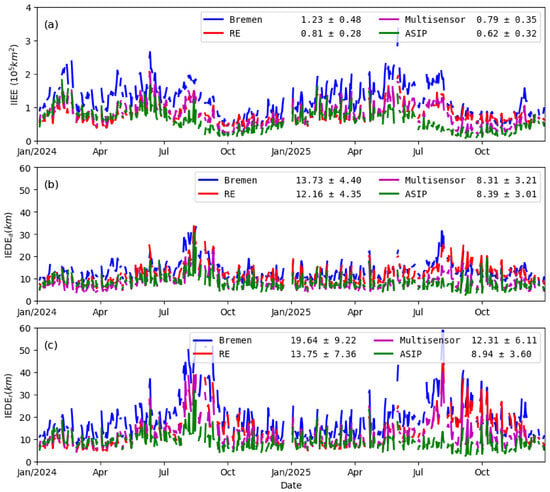
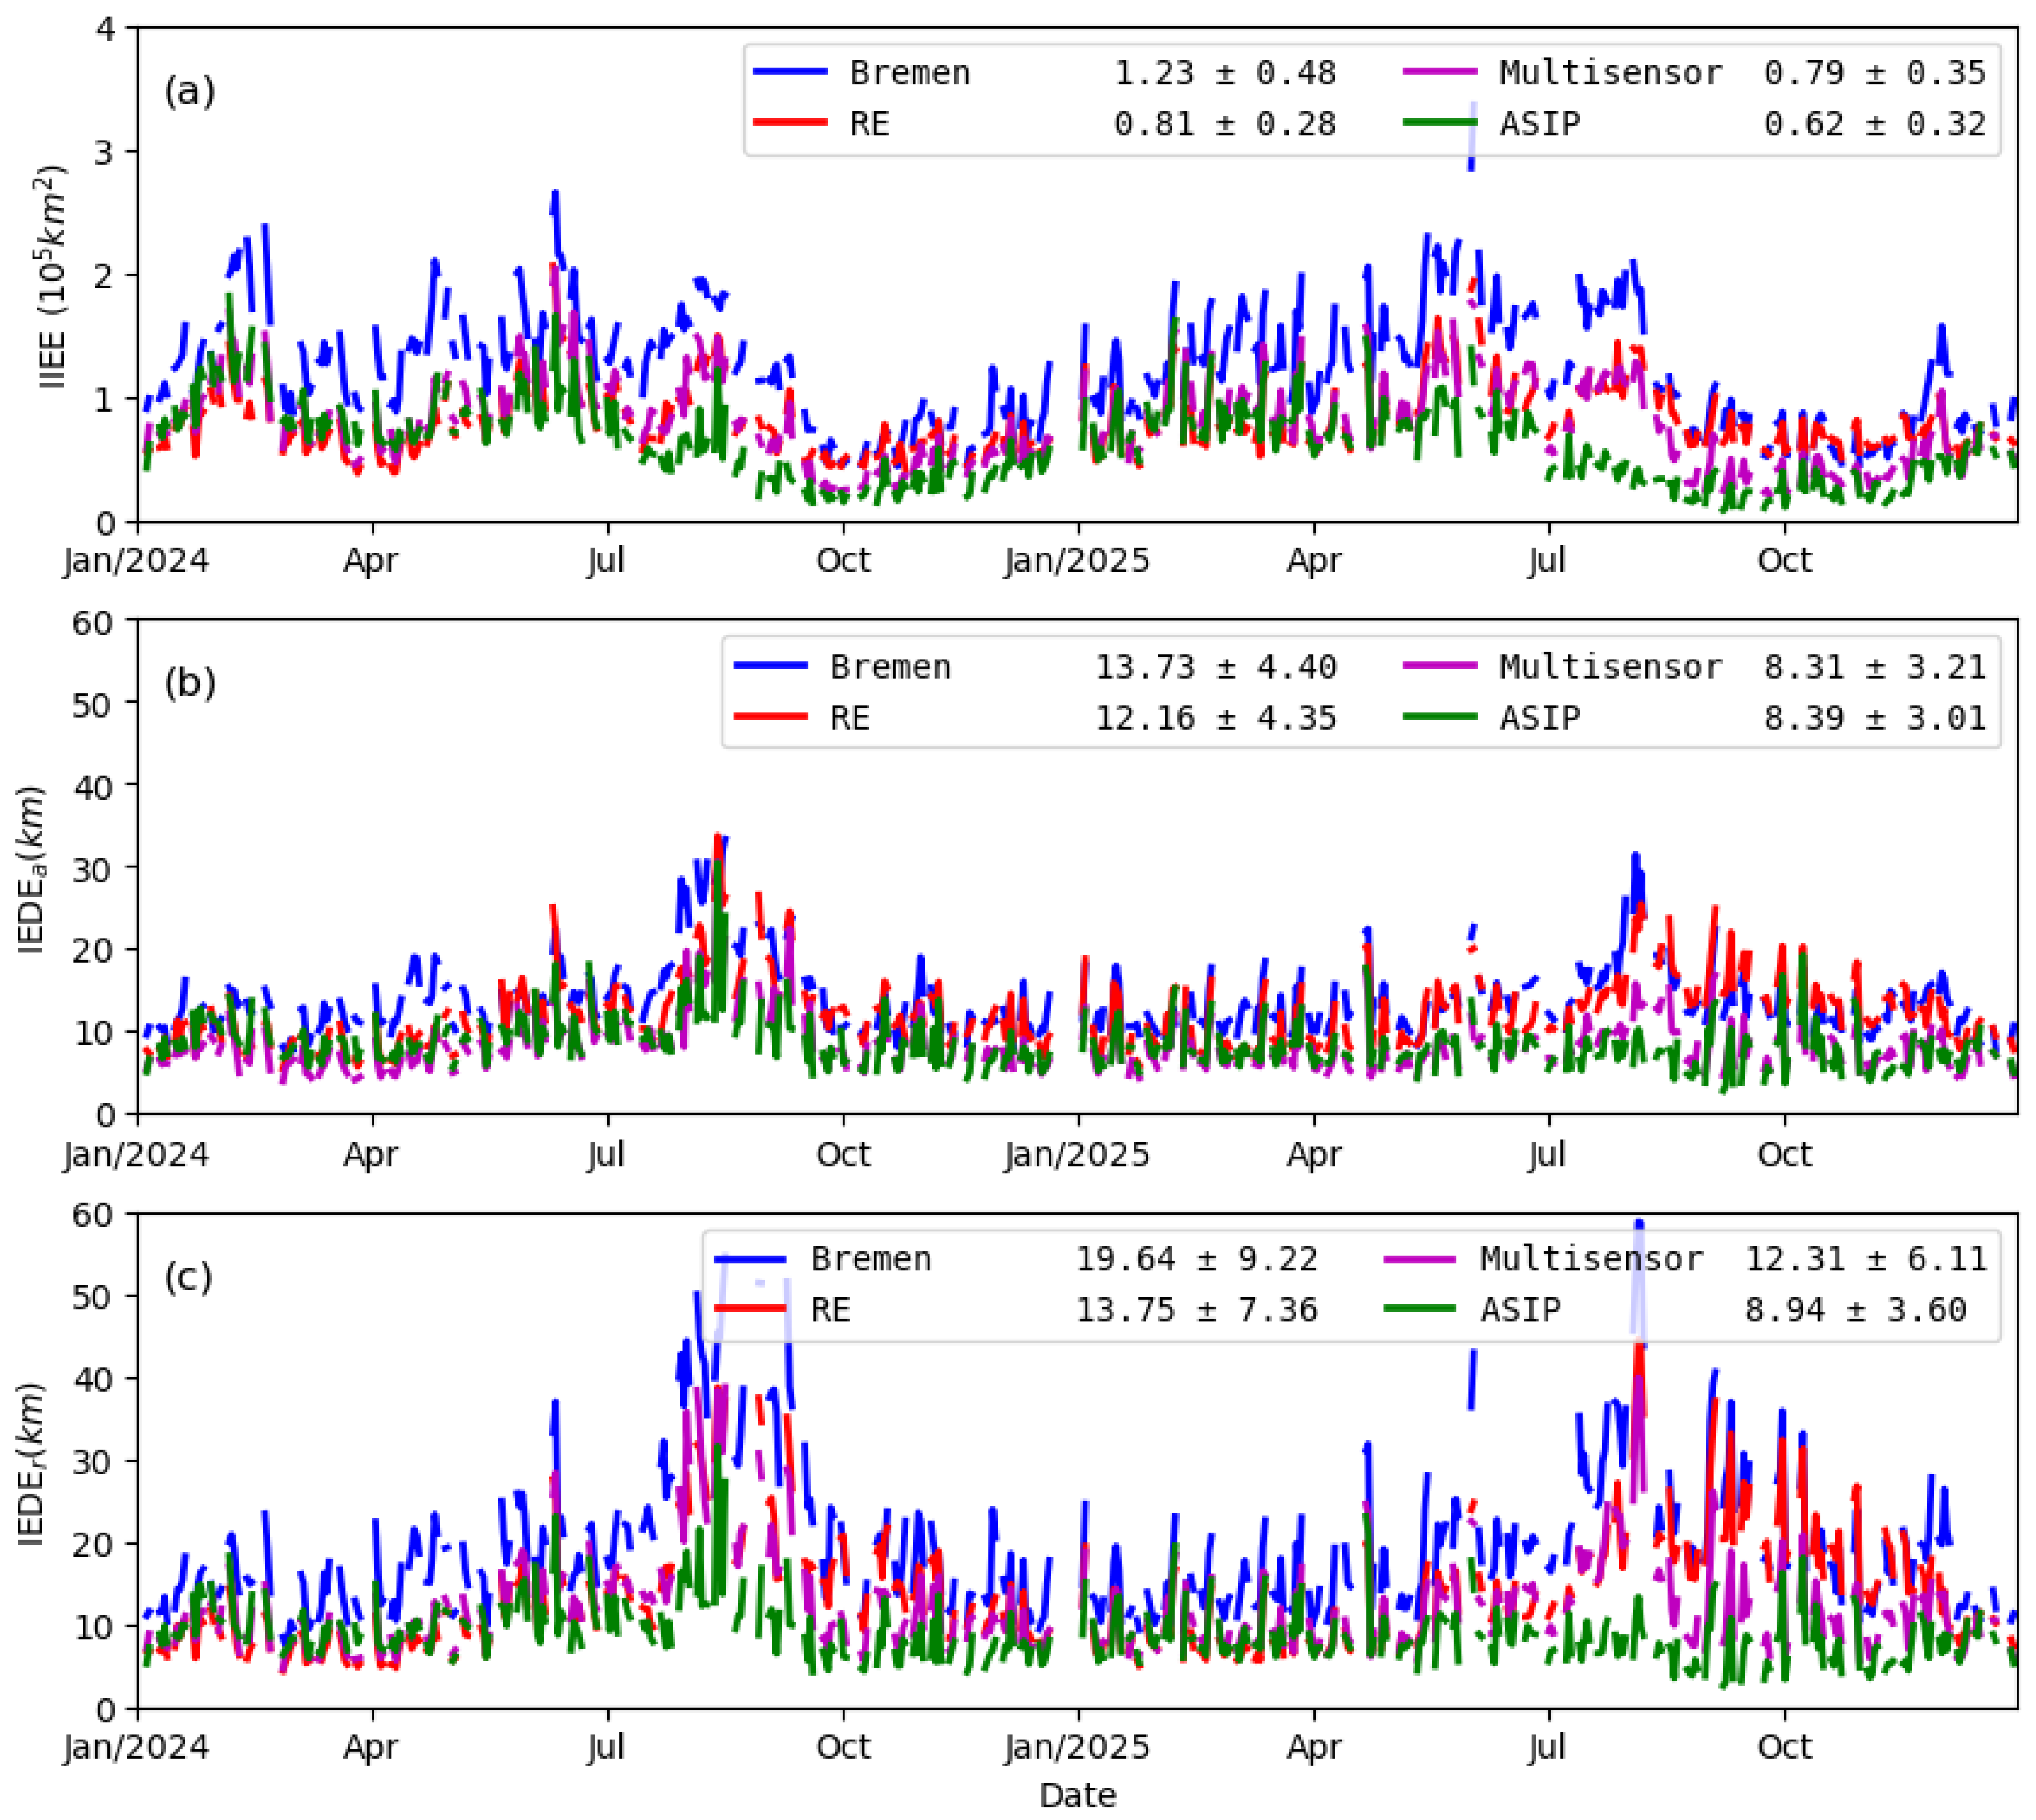
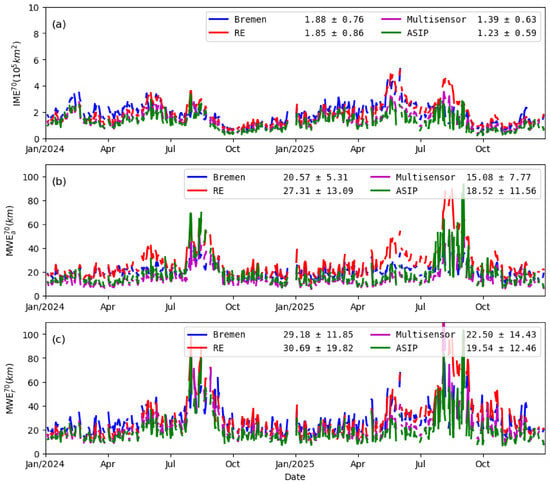
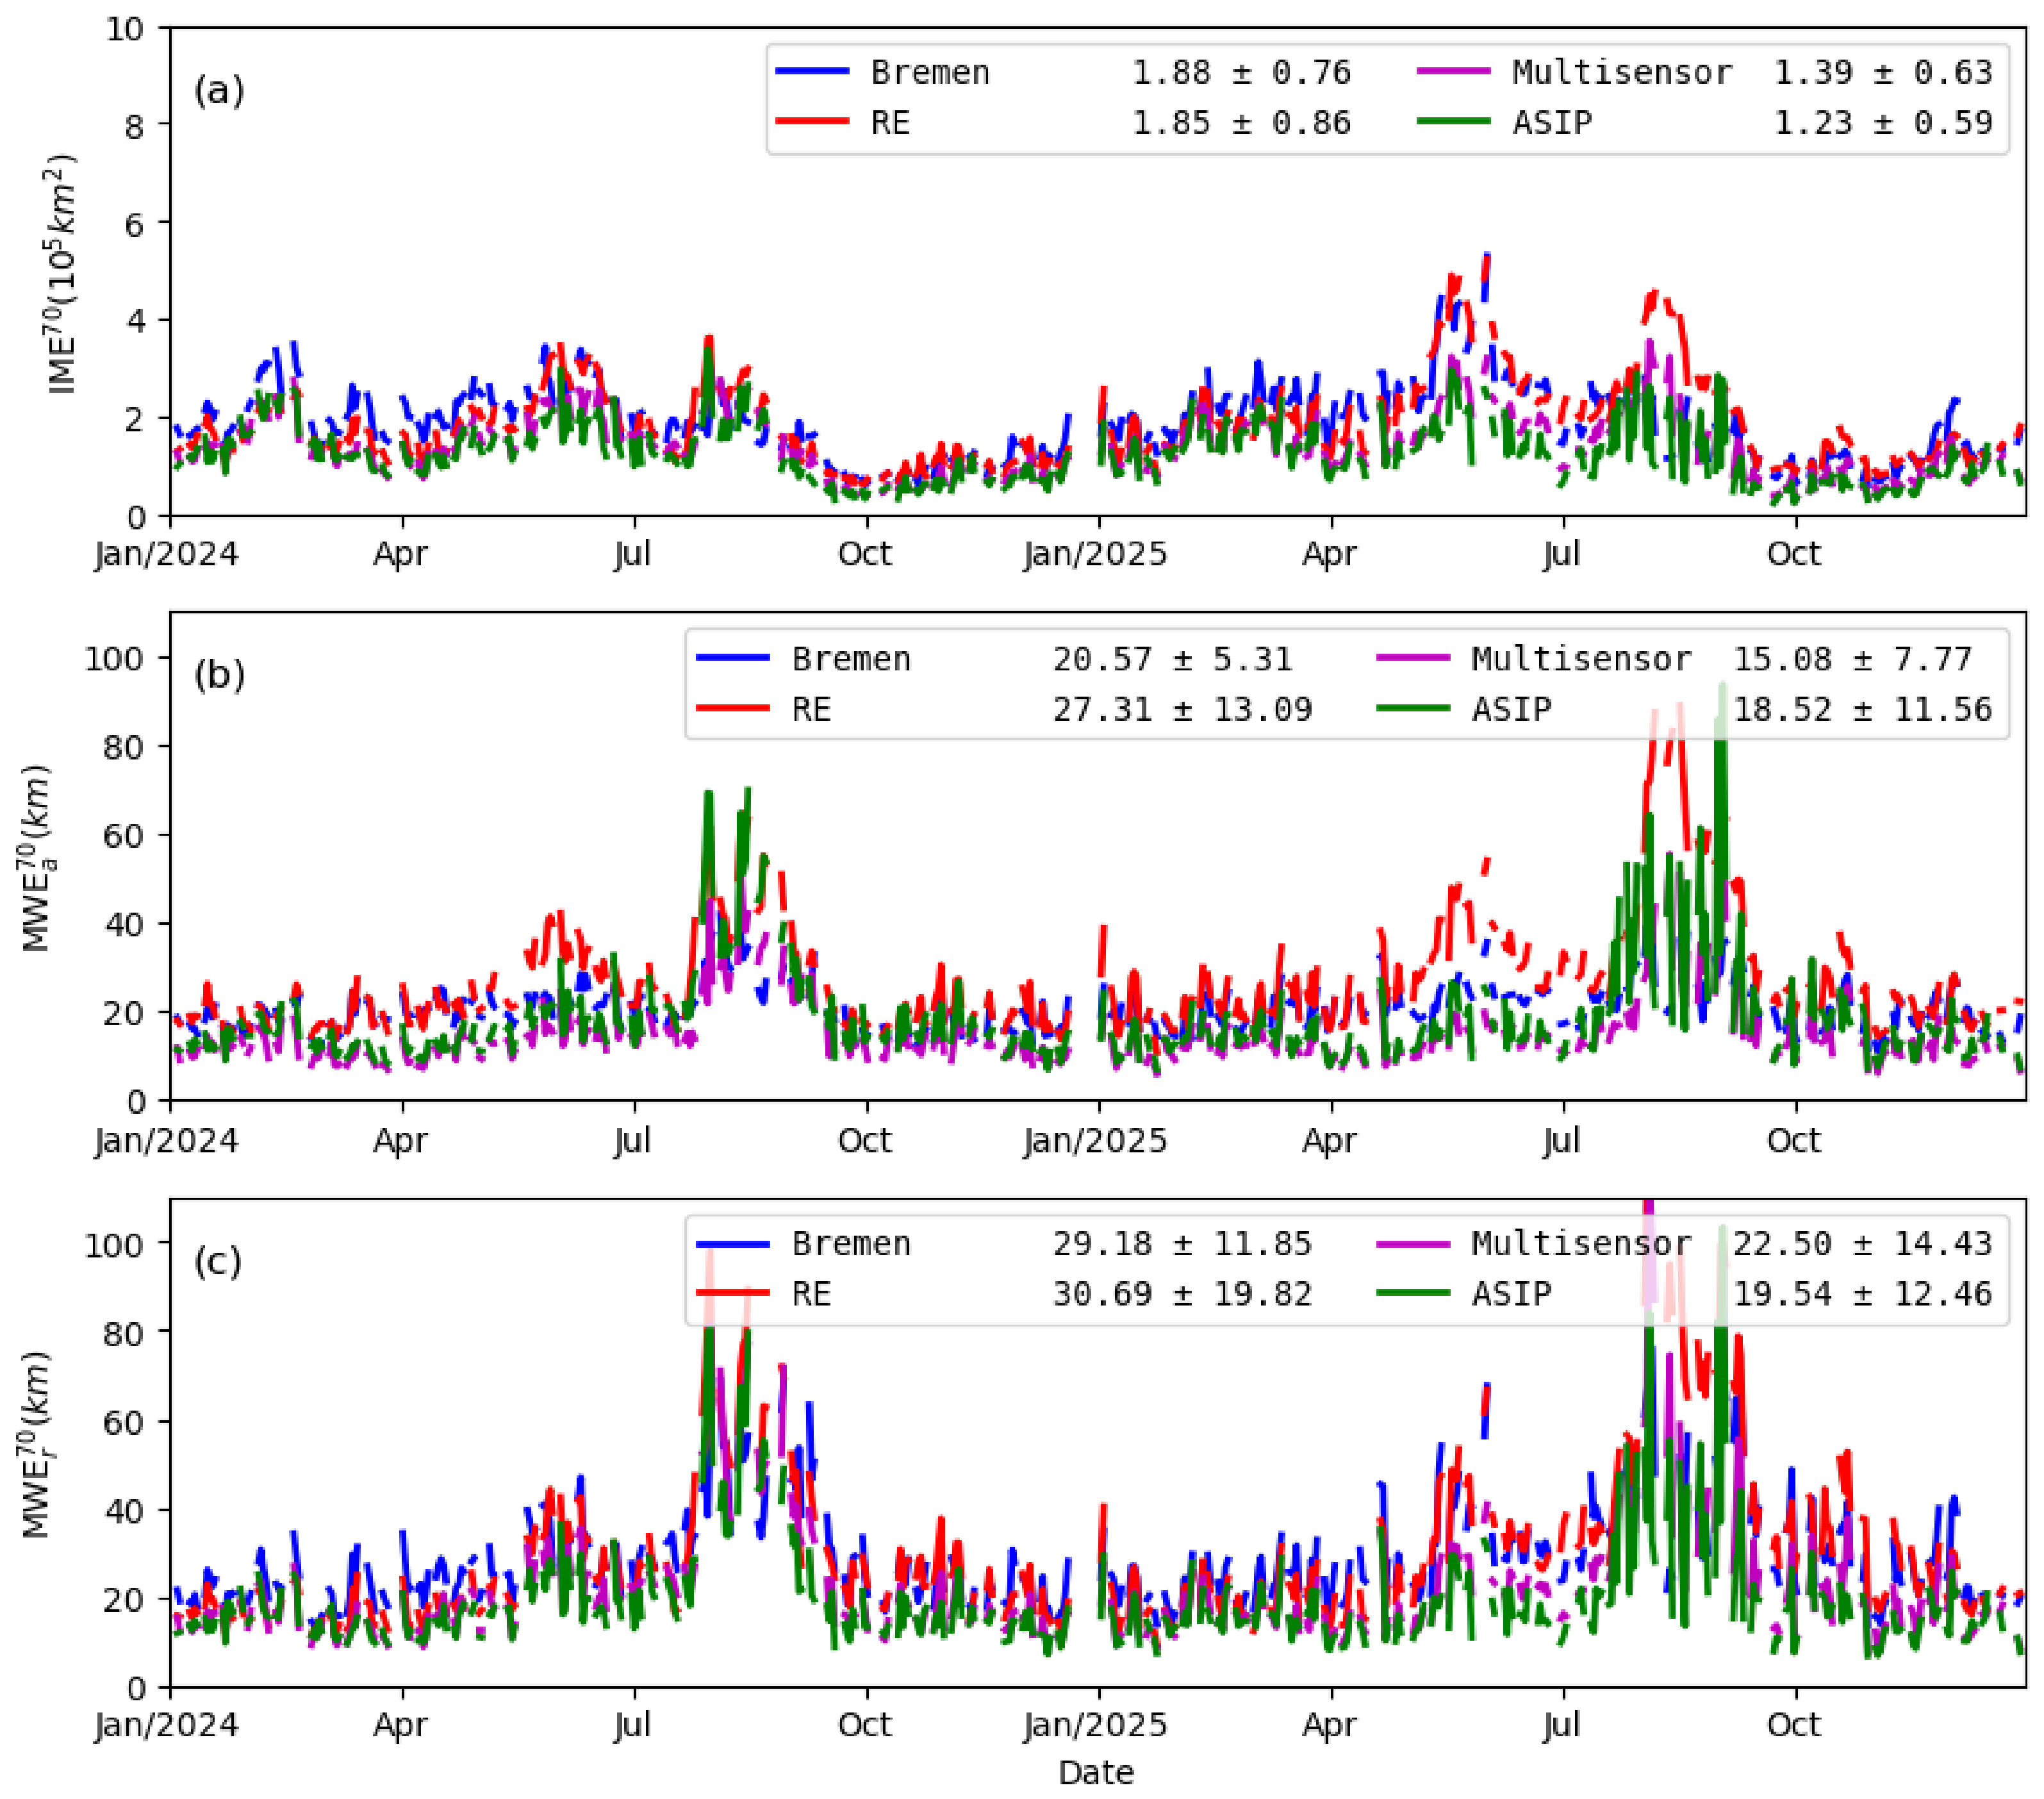
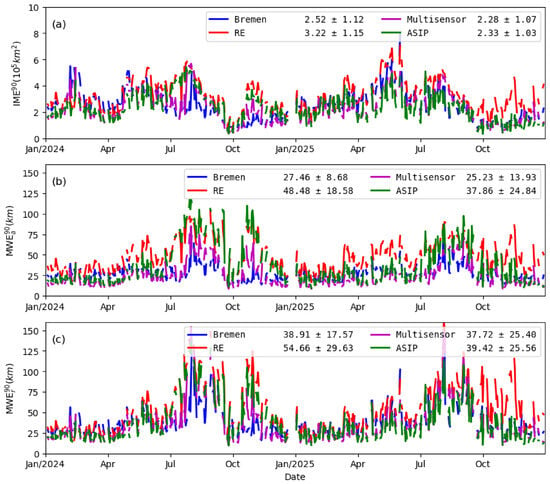
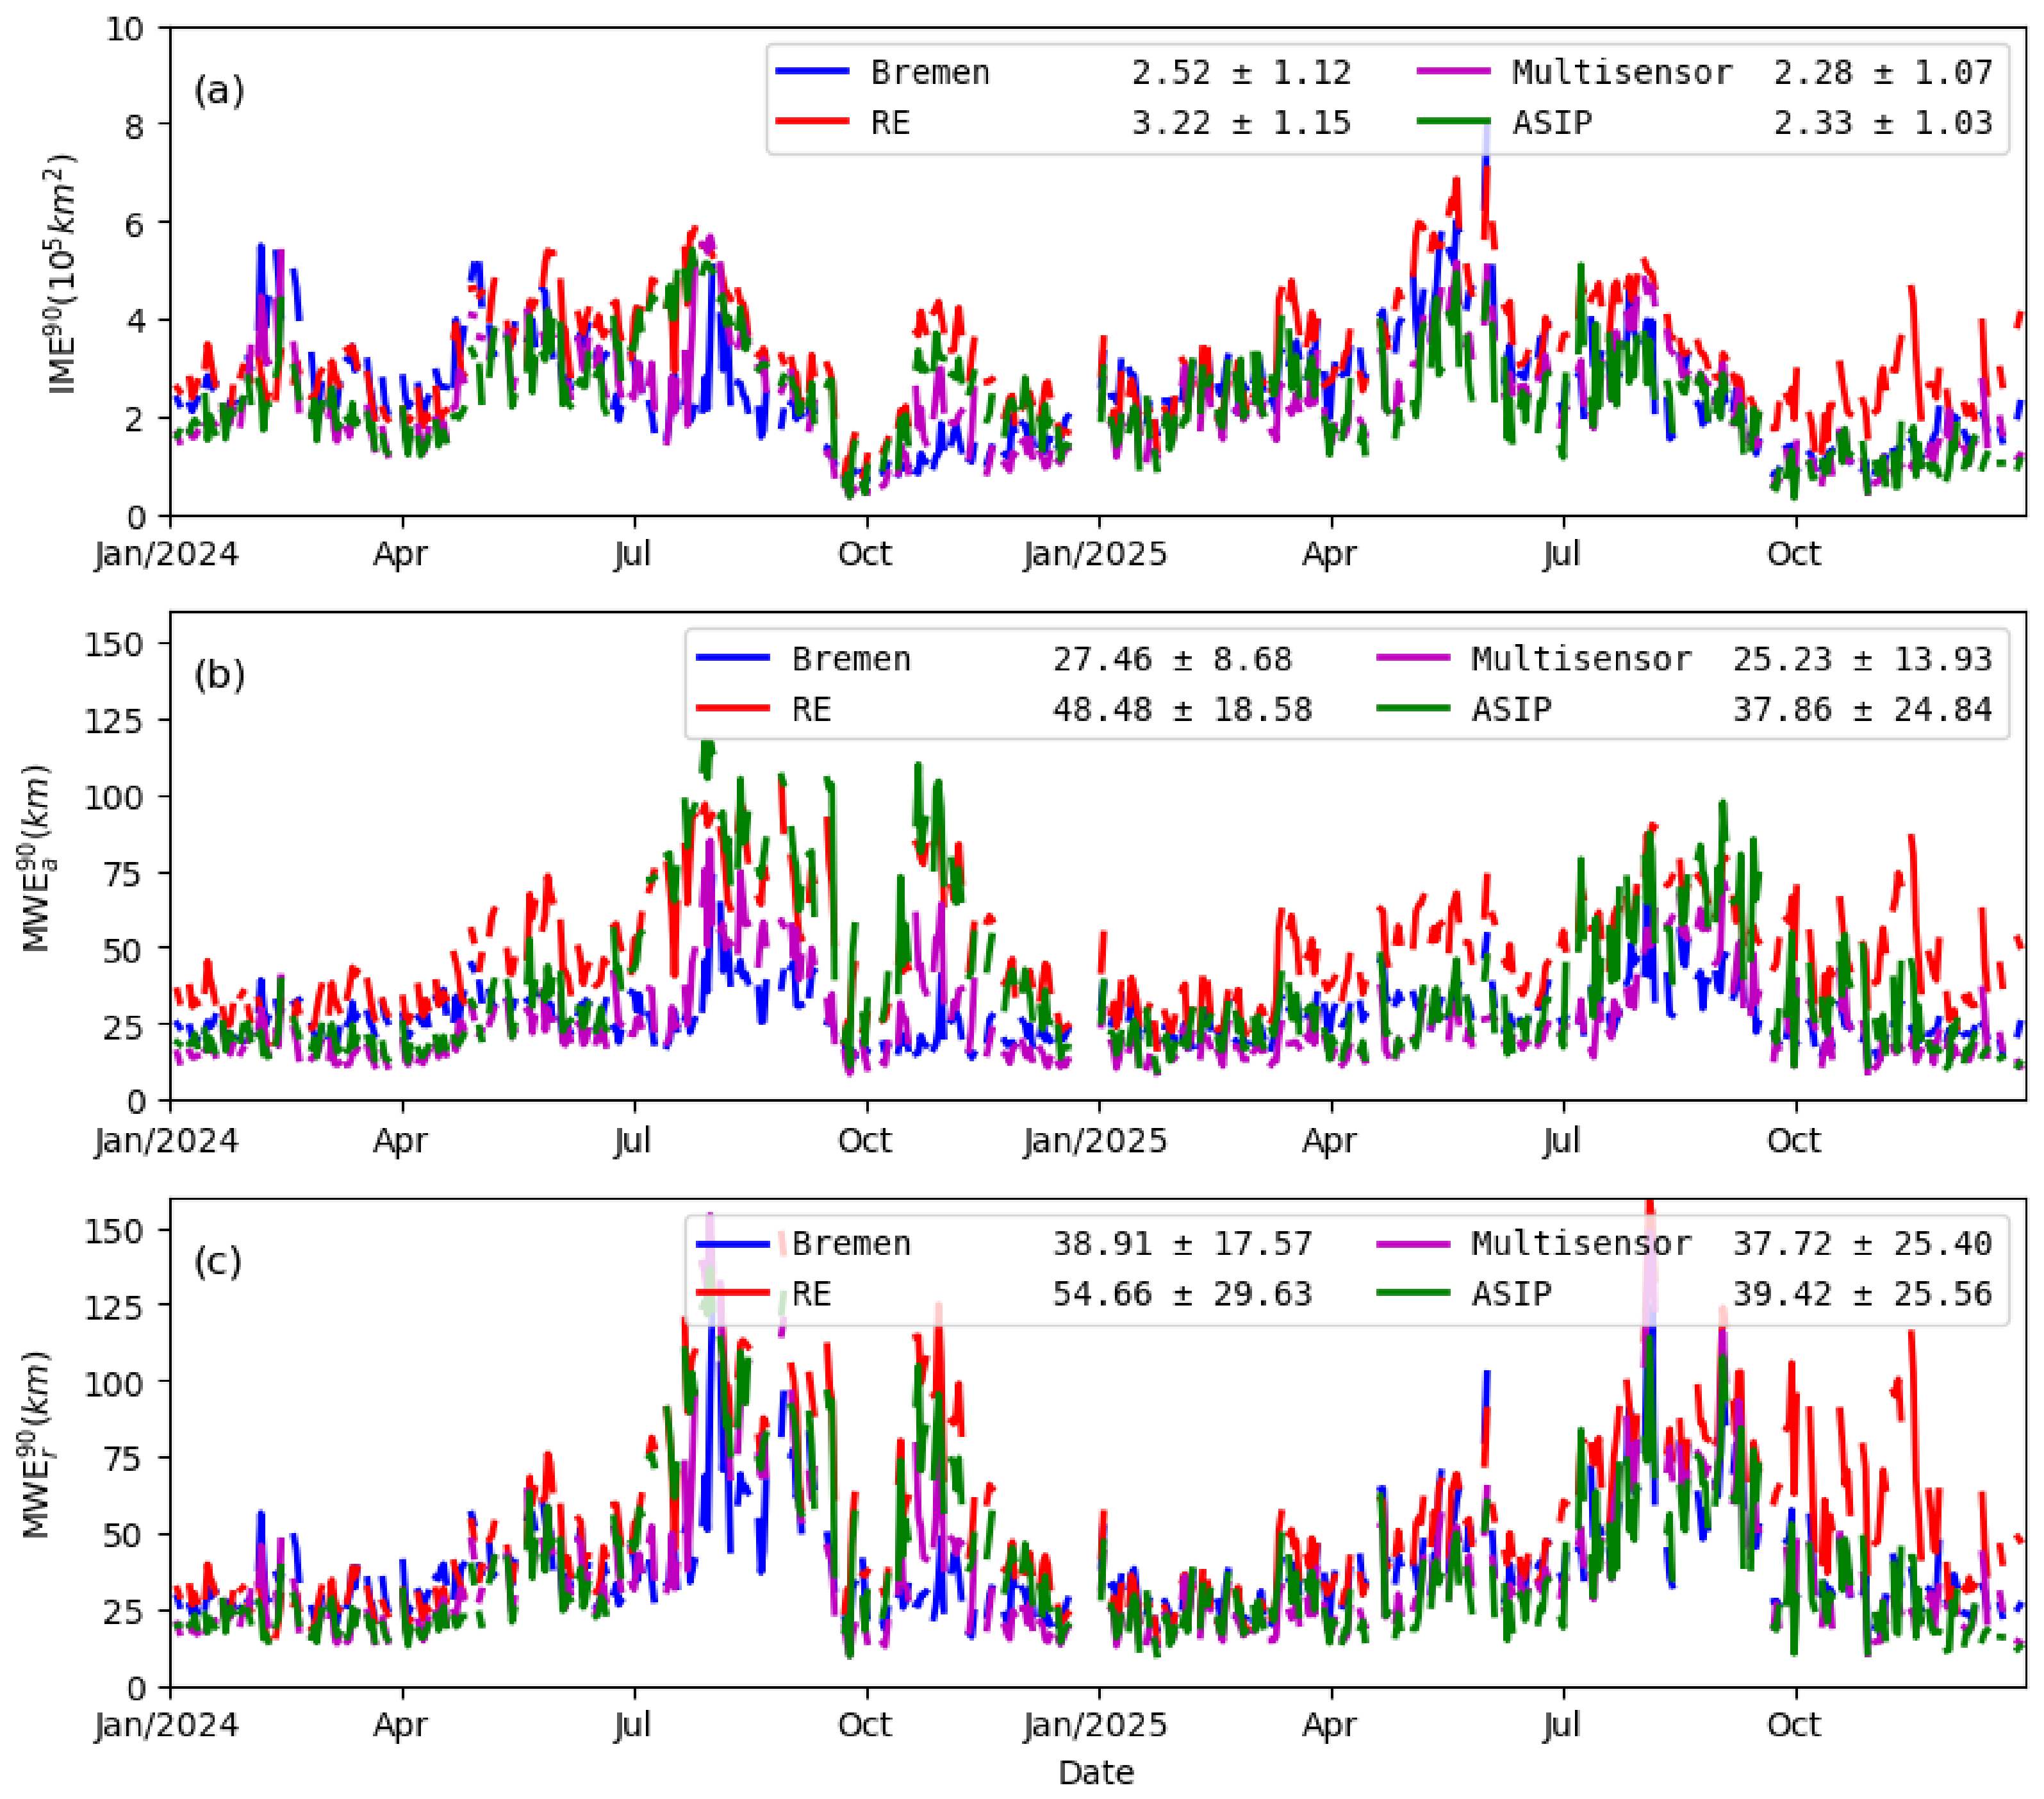
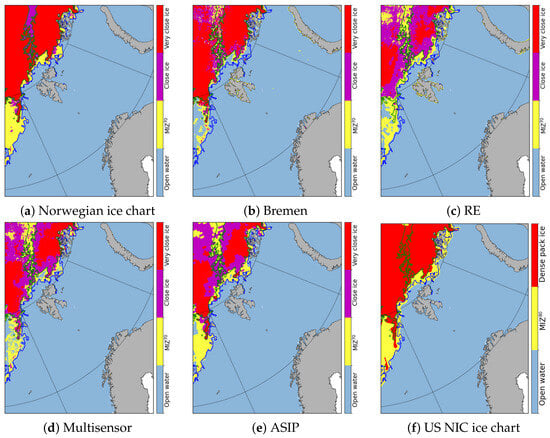
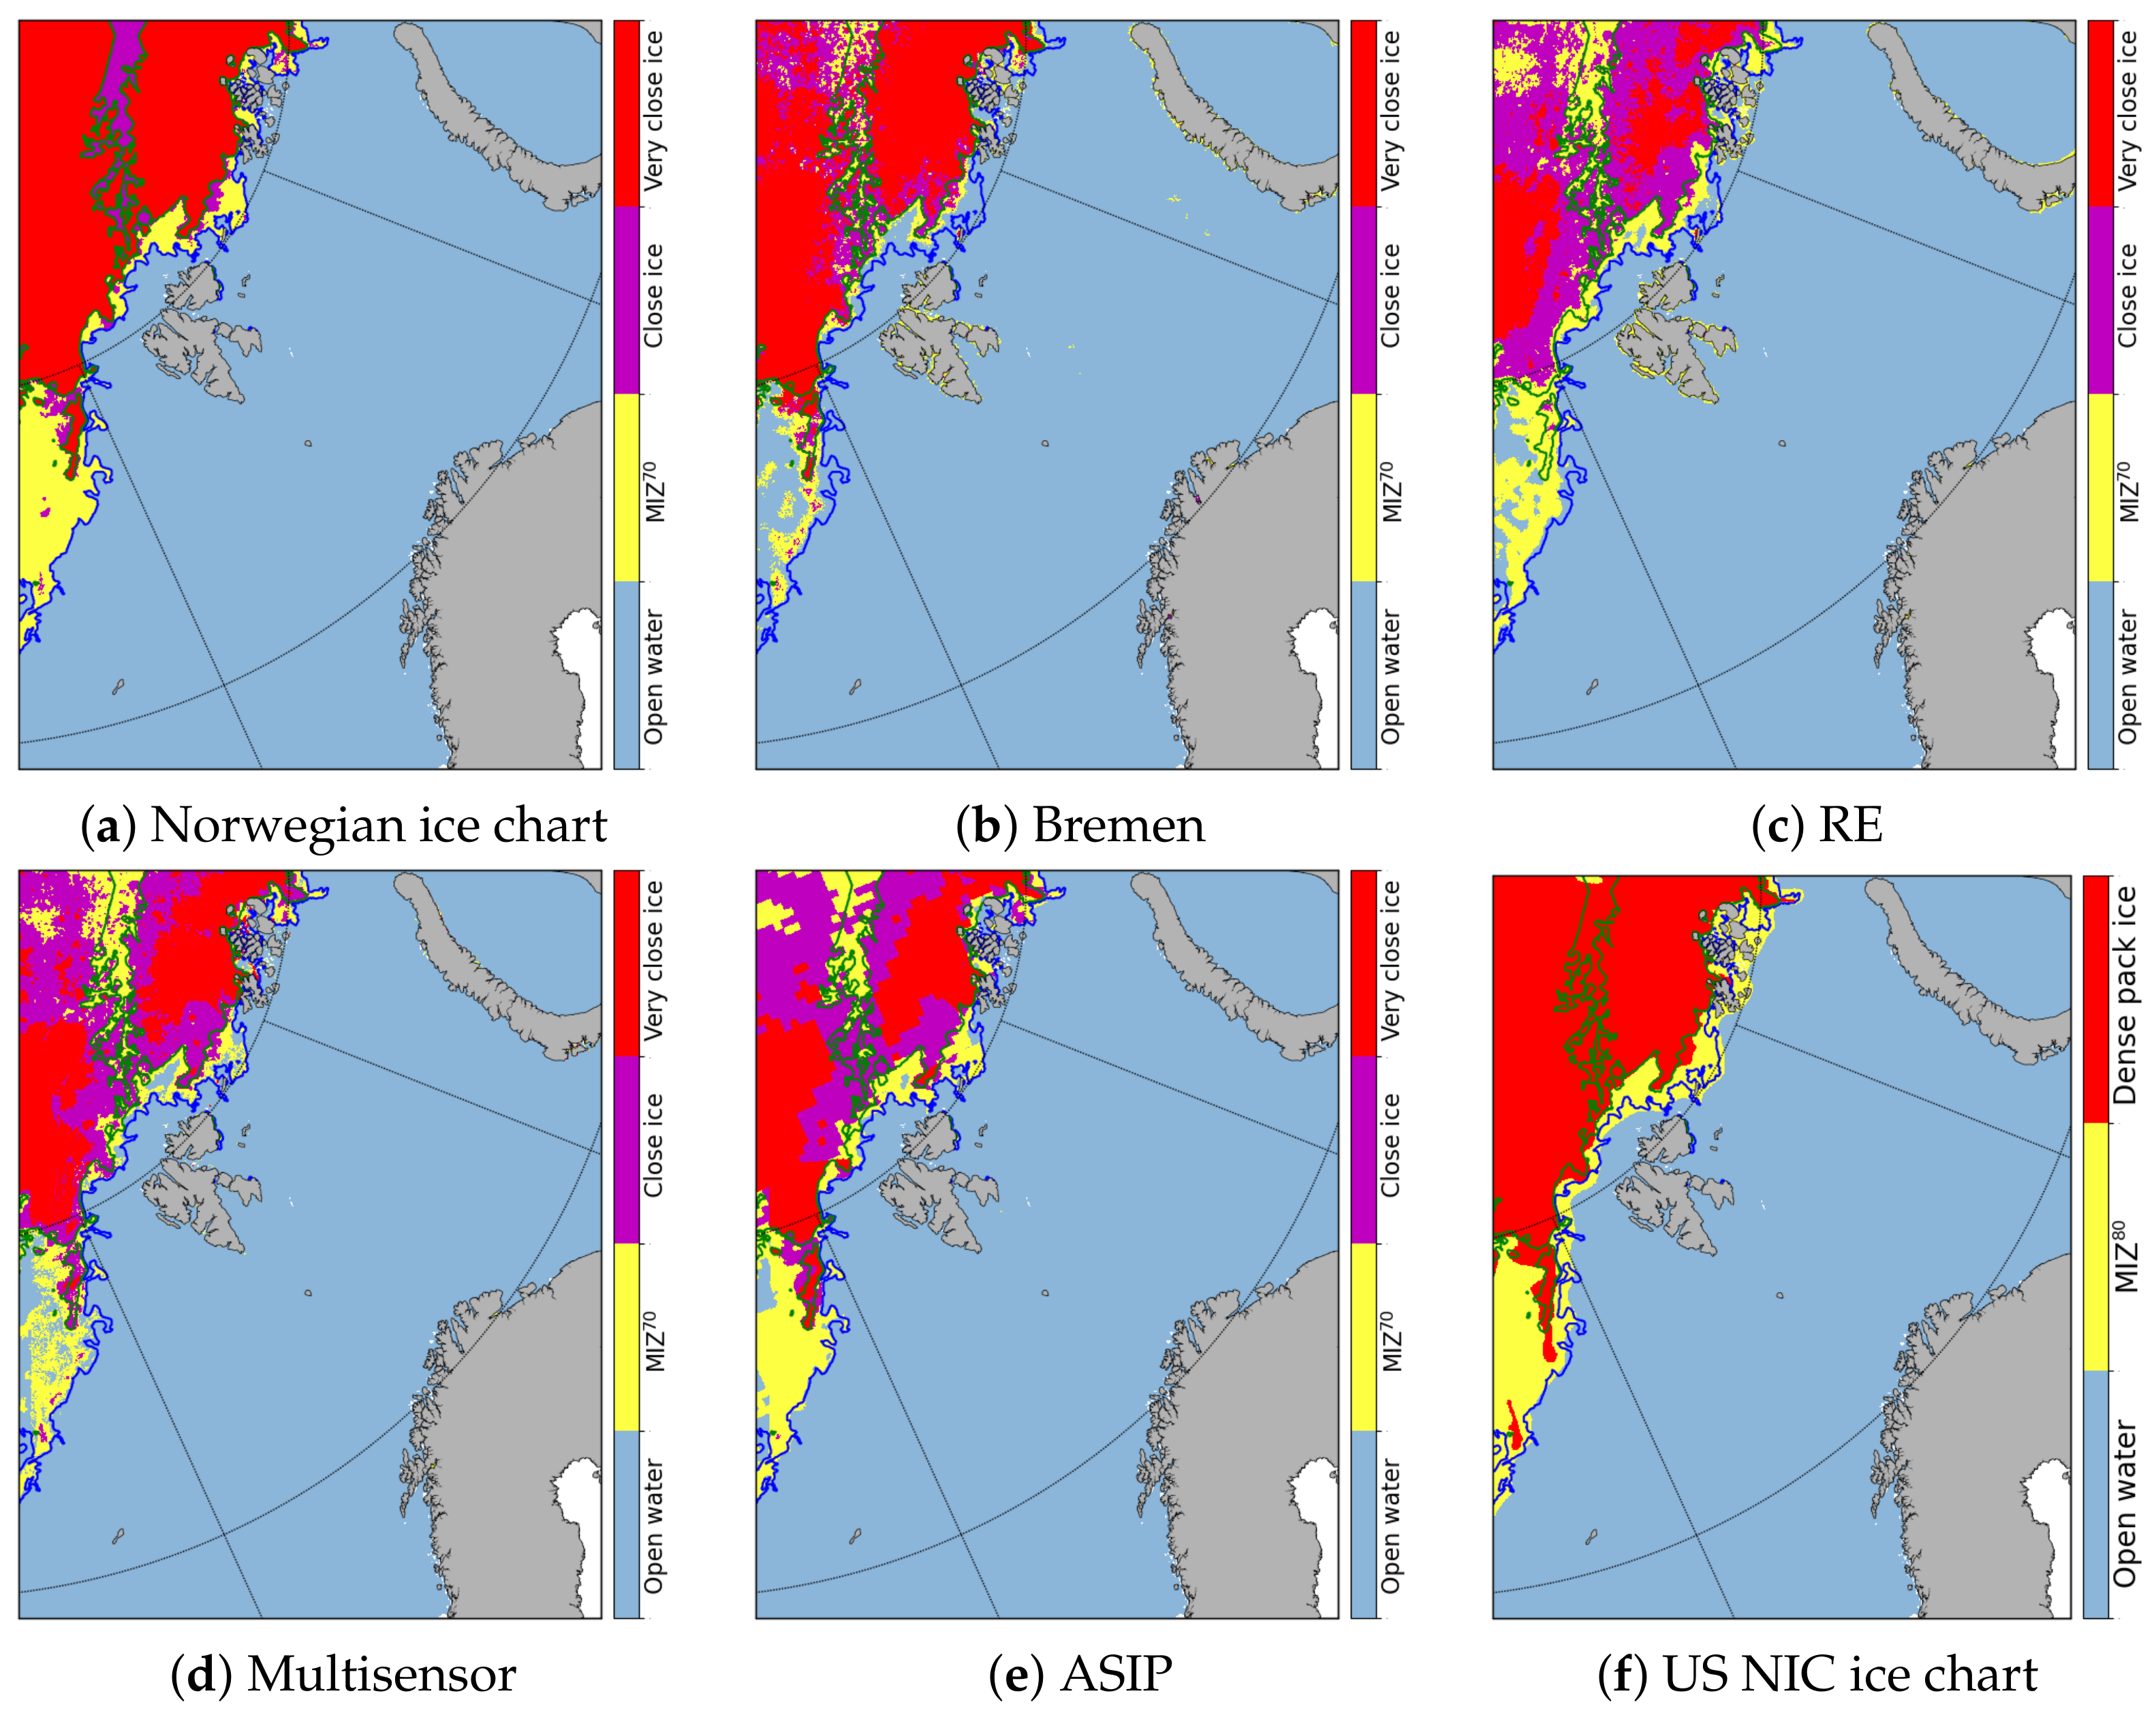

Disclaimer/Publisher’s Note: The statements, opinions and data contained in all publications are solely those of the individual author(s) and contributor(s) and not of MDPI and/or the editor(s). MDPI and/or the editor(s) disclaim responsibility for any injury to people or property resulting from any ideas, methods, instructions or products referred to in the content. |
© 2026 by the authors. Licensee MDPI, Basel, Switzerland. This article is an open access article distributed under the terms and conditions of the Creative Commons Attribution (CC BY) license.