


Highlights
What are the main findings?
- Annual 2 m and-cover maps showed extensive mangrove canopy loss after the 2017 hurricanes. Within the Mangrove Target Areas (MTAs), the mapped canopy cover declined to 47% in southeastern Rookery Bay MTA and 59% in Jobos Bay MTA, subsequently reaching 90% and 79% by 2023, respectively. Return to the mangrove class was lowest for pixels initially reclassified as coastal water in 2018 and in areas with pre-existing stressors.
- Monthly Sentinel-2 and Landsat Normalized Difference Vegetation Index (NDVI) time series showed an initial rapid rebound in canopy greenness followed by a slower return toward climatological values and seasonality by mid-2022 in areas that subsequently recovered. Neither the land-cover maps nor the NDVI detected a comparable widespread canopy response following the 2022 storms.
What are the implications of the main findings?
- Substantial return to the mangrove class indicates considerable capacity for canopy recovery, but it does not establish restoration of pre-storm forest structure or ecosystem function. Persistent non-recovery along coastal-fringes and in areas with pre-existing stressors identifies priorities for field assessment, restoration planning, and long-term monitoring.
- NDVI results indicate that mangrove canopy greenness is regained rapidly after hurricanes but takes several years to return to pre-storm levels and seasonal amplitude. Post-storm monitoring should extend beyond the first year to assess whether NDVI values and seasonal amplitudes return to climatological levels. The absence of a comparable NDVI response after the 2022 storms does not exclude ecological effects undetectable through canopy greenness.
Abstract
Two U.S. National Estuarine Research Reserves (NERRs), Rookery Bay (Florida) and Jobos Bay (Puerto Rico), experienced hurricanes in September 2017 (Irma and Maria) and 2022 (Ian and Fiona). We quantified mangrove canopy disturbance and recovery using pixel-wise annual land-cover trajectories from 2 m WorldView™ imagery (2017–2024) and monthly Sentinel-2 and Landsat Normalized Difference Vegetation Index (NDVI) time series (2016–2025). Mangrove target areas (MTAs) comprised pixels classified as mangrove in the pre-storm 2017 map and consistent coverage across the subsequent available maps. In 2018, mapped mangrove cover declined to 47% in the southeastern Rookery Bay MTA (sRB-MTA) and 59% in the Jobos Bay MTA (JB-MTA), with most disturbed pixels reclassified as soil. Intermediate mapped classes represented spectral and surface-condition changes rather than discrete ecological states. Despite greater initial loss, mapped mangrove cover reached 90% in the sRB-MTA by 2023, compared with 79% in the JB-MTA in 2023 and 83% in 2024. Recovery was spatially heterogeneous: pixels initially reclassified as mixed low-relief vegetation showed higher recovery percentages by 2023 (sRB-MTA: 92%; JB-MTA: 81%) than those reclassified as coastal water (48% and 23%, respectively). Persistent non-recovery of mangrove class coincided with pre-existing hydrologic stressors in both regions, and unauthorized coastal development in Jobos Bay NERR. Areas that subsequently returned to the mangrove class showed a sharp post-storm NDVI decline, followed by an initial rapid rebound and gradual recovery toward climatological greenness and seasonality by mid-2022. NDVI recovery began earlier in Jobos Bay (November 2017) than in southern Rookery Bay (June 2018). No widespread canopy response was detected following the 2022 storms, consistent with weaker local wind exposure but not excluding other ecological effects. Together, land-cover trajectories and the NDVI resolved complementary canopy recovery patterns without establishing restoration of pre-storm forest structure or ecosystem function.
1. Introduction
Mangroves provide critical ecosystem services by stabilizing shorelines, reducing storm-surge impacts, and mitigating coastal flooding for coastal communities. Loss or degradation of coastal mangroves can significantly increase the land area exposed to damaging surge inundation [1]. Tropical cyclones are major disturbances to mangrove forests: strong winds, storm surge, and coastal erosion can uproot trees, defoliate canopies, and alter species composition and stand structure [2,3]. Severe storms can also modify hydrology, salinity, sediment deposition, and soil redox conditions, including sulfide concentrations, with consequences ranging from seedling mortality to widespread death of mature stands [2,4]. The effects of tropical cyclones can be cumulative, with wind, surge, and rainfall jointly influencing post-disturbance recovery conditions [5]. Many mangrove forests show rapid functional recovery of canopy leaf area and carbon exchange after major disturbances, returning to pre-storm conditions within a few years [3,6], although structural recovery can be slower and some stands remain degraded.
Satellite remote sensing provides a powerful tool for monitoring the distribution and area extent of mangrove ecosystems across large spatial scales. Time series of annual and seasonal mangrove mosaics have been used to quantify hurricane-related canopy damage and track recovery following storms [3,7,8,9]. Monitoring mangrove forests is valuable to managers seeking to conserve habitat quality and sustain ecosystem services [10].
Hurricane impacts on mangroves and their subsequent recovery have been documented across a wide range of regions using satellite time series, and that literature frames the contribution of the present study. Asbridge et al. [11] used Landsat-derived canopy cover to separate short- and long-term cyclone effects on Australian mangroves. Lagomasino et al. 2021 [8] combined Landsat imagery with lidar-derived elevation to show that storm surge and ponding explained the extent of mangrove dieback in southwest Florida after Irma; and Radabaugh et al. [12] documented delayed mortality at two Irma landfall sites. Taillie et al. 2017 [13] mapped damage from the 2017 hurricane season across the Gulf of Mexico and the Caribbean and found maximum wind speed to be the strongest predictor of mangrove damage, and Imbert 2018 [14] related mangrove basal-area loss to wind speed in the East Caribbean. Velazquez-Salazar et al. [3] tracked early canopy recovery after Hurricane Roslyn in Mexico with satellite-derived indices. The NDVI and related indices from Landsat, Sentinel-2, and MODIS have been used to detect defoliation, to date the onset of regreening, and to separate recovering from persistently degraded stands after cyclones in Mexico [3,15], the British Virgin Islands [16], and Australia [11]. Most of these analyses rely on 10–30 m imagery, and annual or seasonal composites, which limit the detection of small, degraded patches and the resolution of recovery timing within a year. The present study differs in two respects: the structural component uses annual 2 m canopy-class maps, which resolve degraded patches of tens of meters, and the spectral component uses the NDVI from individual satellite overpasses rather than composites, which resolves the timing of decline and regreen to within weeks.
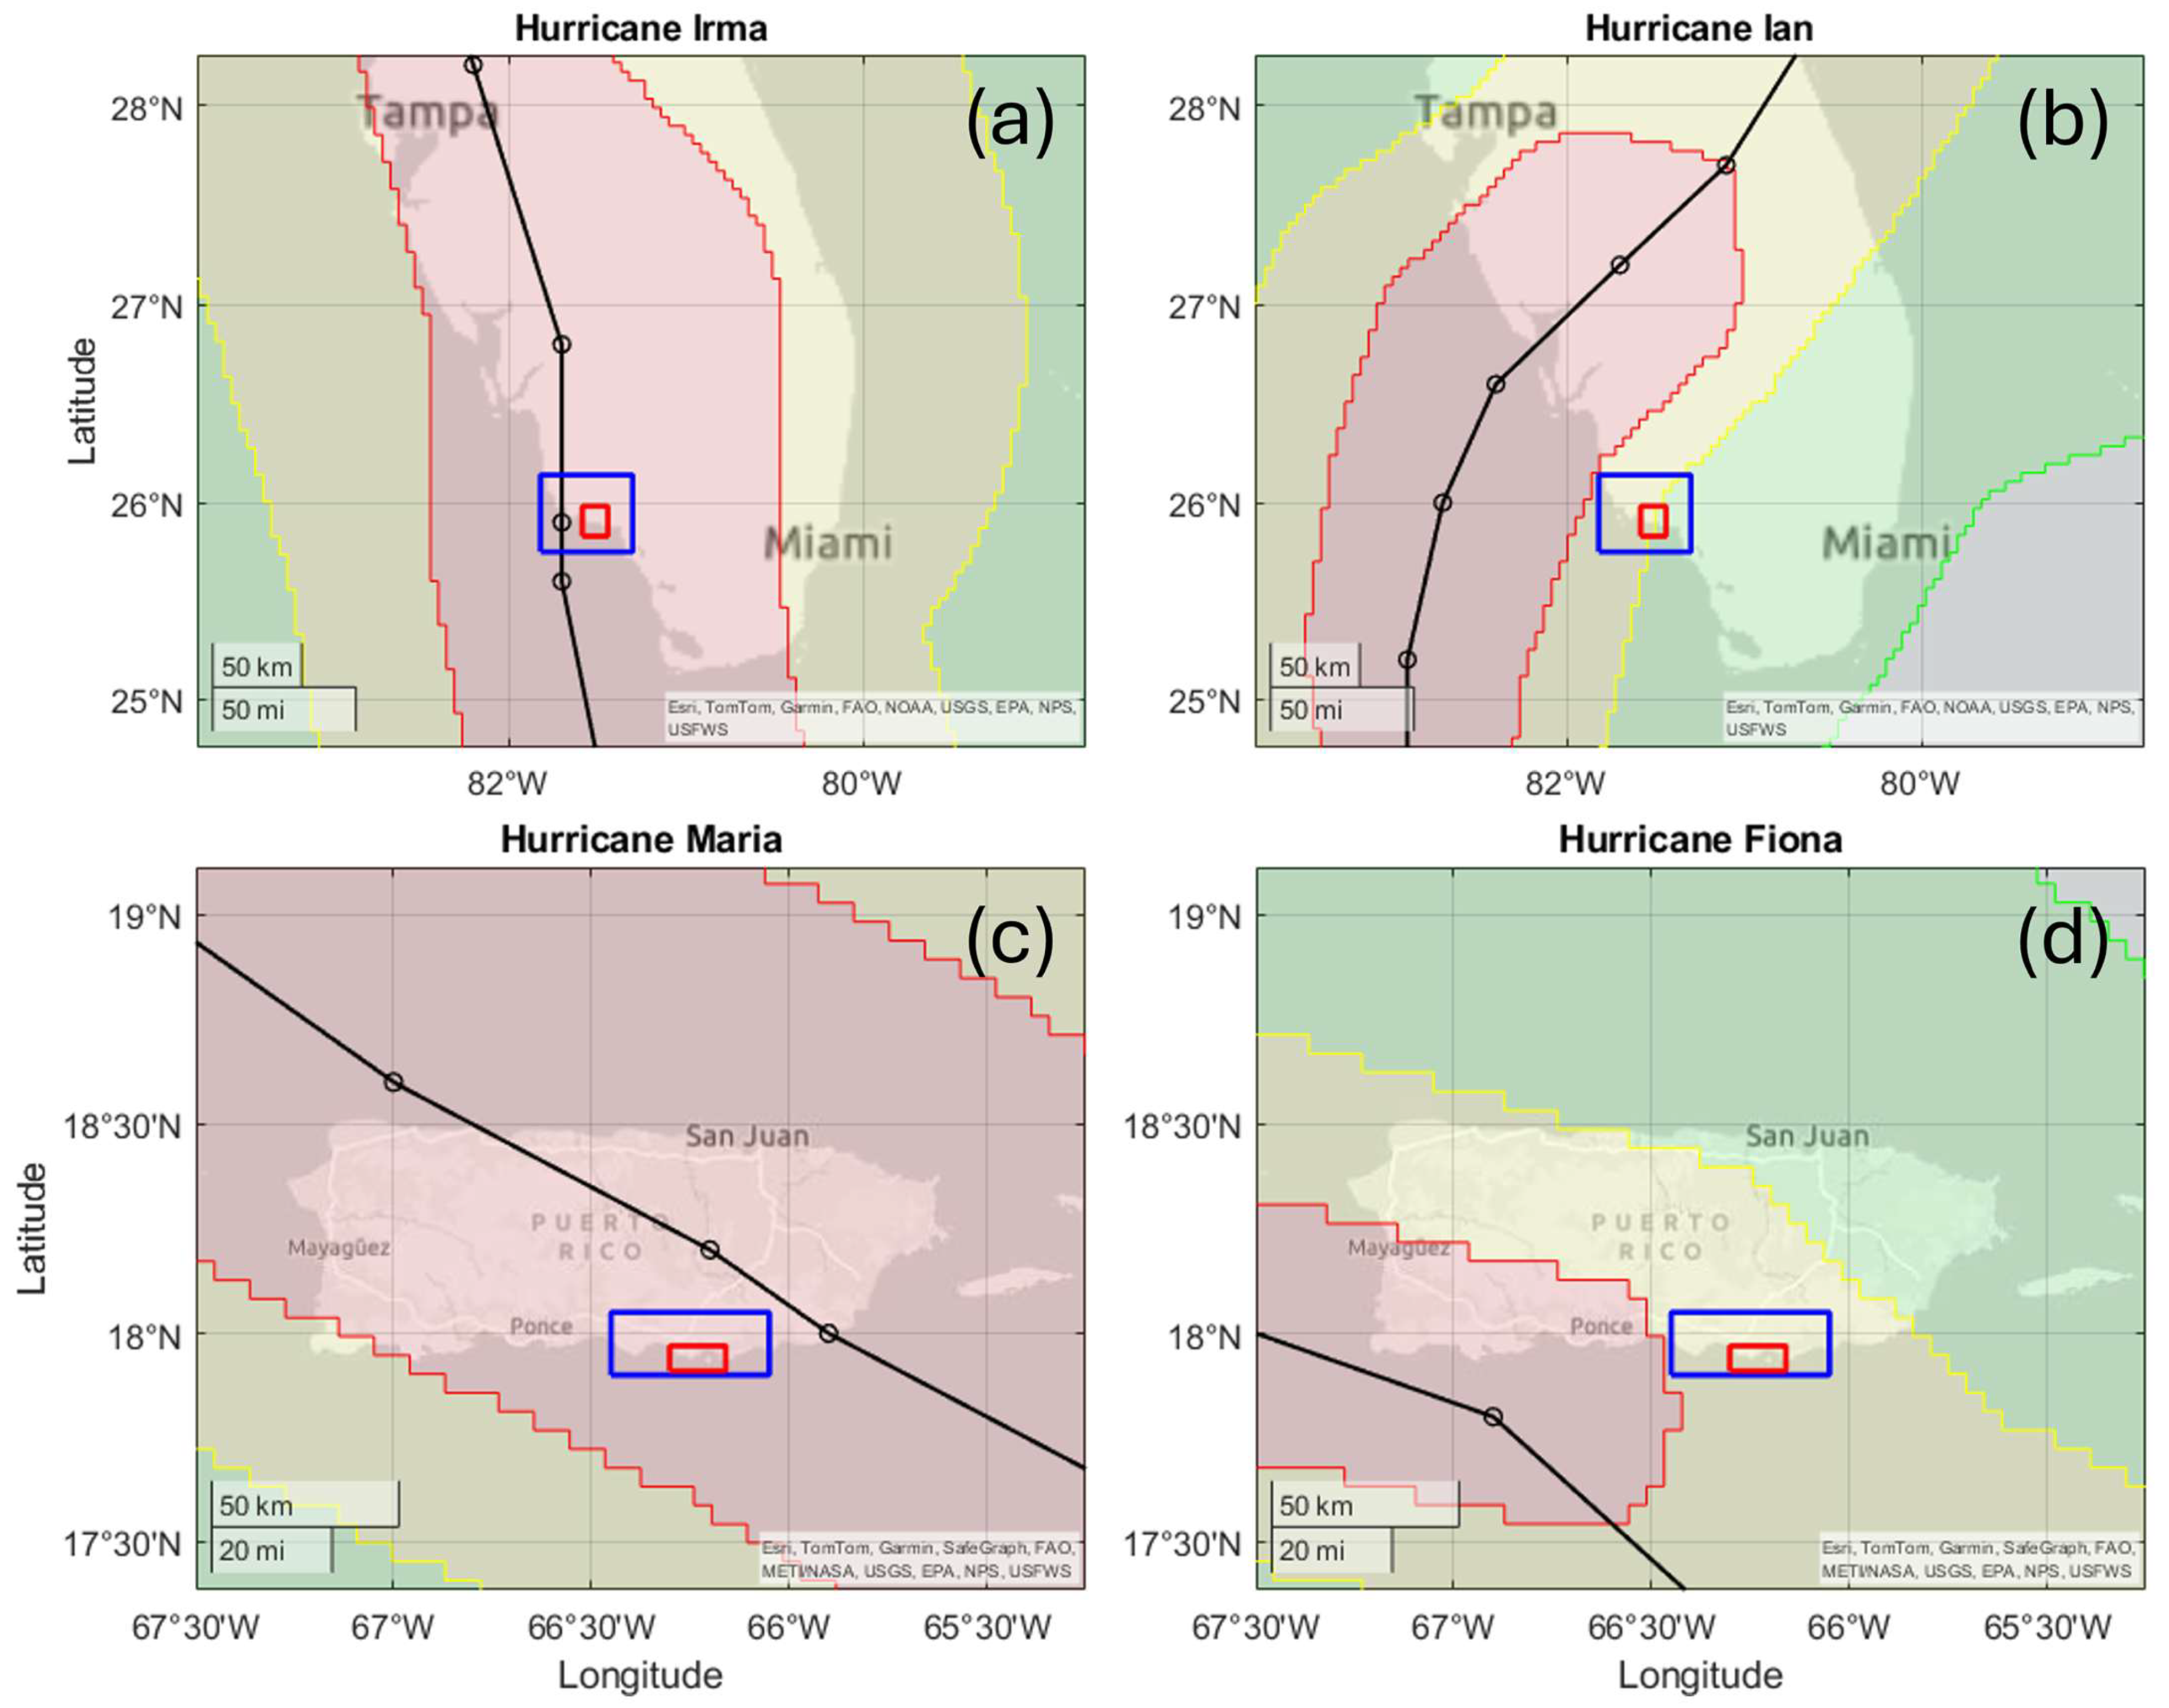
In the United States, two National Estuarine Research Reserves (NERRs), namely Rookery Bay in southwest Florida and Jobos Bay in south-central Puerto Rico (Figure 1), have coastlines dominated by mangrove habitats that are frequently exposed to tropical cyclones. In September 2017, Hurricane Irma passed over Rookery Bay and Hurricane Maria passed very close to Jobos Bay, affecting mangroves in both reserves. In September 2022, Hurricanes Ian and Fiona again passed near both reserves (Figure 1). Collaborative research projects were implemented to characterize storm impacts on mangroves: “Resilience of the Mangrove Coast” [17] and “Limits of Resilience” [18], hereafter referred to as the NERRS Mangrove Coast Collaborative (NERRS-MCC). These projects generated a diverse set of products to improve understanding of long-term mangrove disturbance and recovery under repeated tropical-cyclone exposure [19,20]. Among the primary outputs of the NERRS-MCC projects was an annual time series (2014–2024) of high-resolution (2 m) land-cover maps derived from WorldViewTM imagery using a decision-tree classification [21,22].
The aim of this study was to characterize and quantify post-storm changes in mangrove cover using two complementary approaches: satellite-derived land-cover maps and spectral time series. We focused on mangrove canopy resistance and recovery, and identifying areas that showed persistent degradation following the 2017 storms. Post-storm classification maps (2018) revealed widespread transitions from mangroves to other land-cover classes at both reserves, as canopy loss and downed trees exposed the underlying substrate [23]. We quantified pixel-wise land-cover change from 2017 to 2024 at Jobos Bay and from 2017 to 2023 in the southeastern portion of Rookery Bay. We also examined the time series (2016–2025) of the Normalized Difference Vegetation Index (NDVI) derived from Sentinel-2 and Landsat imagery at spatial resolutions of 10 and 30 m pixels to characterize storm disturbance and post-storm spectral greenness recovery timing at finer (monthly means and single-date observations) temporal resolution.
Figure 1.
Hurricane best-track paths (black lines with circles) and wind swath (colors) for hurricanes affecting the study areas in 2017 and 2022. The boundary of the NERRS-MCC annual land-cover maps around the Rookery Bay (top) and Jobos Bay (bottom) NERRs and surrounding ecosystems are shown in blue; the regions analyzed in this study (Figure 2) are shown in red. (a) Hurricane Irma (8 September 2017) and (b) Hurricane Ian (28 September 2022) affected southwest Florida, while (c) Hurricane Maria (20 September 2017) and (d) Hurricane Fiona (18 September 2022) affected Puerto Rico. Colors indicate the spatial extent of sustained winds, including hurricane-force (≥64 kt, red), strong tropical storm-force (≥50 kt, yellow), and tropical storm-force (≥34 kt, green) winds. Data from the Tropical Cyclone Best Track archive [24].
2. Materials and Methods
2.1. Study Areas and Hurricane Disturbance
This study was done within the Rookery Bay and Jobos Bay National Estuarine Research Reserves (NERRs) and adjacent coastal ecosystems. Rookery Bay is in southwest Florida and Jobos Bay is located south-central Puerto Rico. Mangrove ecosystems in south Florida and Puerto Rico are composed of three true mangrove tree species: Avicennia germinans (black mangrove), Laguncularia racemosa (white mangrove), and Rhizophora mangle (red mangrove) [25]. Within the boundaries of the Jobos Bay and Rookery Bay NERRs, mangrove ecosystems cover approximately 1000 and 31,000 acres (404.7 and 12,545.3 ha), respectively [26]. Mangrove structure in both reserves ranges from scrub forests composed of small individuals (<2 m) to taller, forested stands with trees typically 10–15 m in height. Mixed-species assemblages are common in both reserves, along with tidally-dominated fringing forests characterized primarily by red mangrove and lower-elevation basin forests dominated by black mangrove [27].
We focused our temporal sampling to capture mangrove cover and extent before and after four hurricanes that affected the study regions: Irma (2017) and Ian (2022), which affected southwest Florida, and Maria (2017) and Fiona (2022), which impacted Puerto Rico. Storm exposure was characterized using National Hurricane Center best track and wind swath data [24] to document trajectories and wind fields affecting each reserve (Figure 1).
During the September 2017 storms, both reserves experienced hurricane-force winds (≥64 kt; Figure 1a,b). Hurricane Irma made landfall near Marco Island, directly affecting the center of Rookery Bay NERR as a Category 3 storm with maximum sustained winds of about 100 kt, storm tides of 6–10 ft above ground level (AGL), and 10–15 in of rainfall across the southern portion of Rookery Bay [28]. Hurricane Maria made landfall about 40 km east of Jobos Bay NERR as a Category 4 storm with maximum sustained winds of 135 kt, generating storm tides of around 4 ft AGL along Jobos Bay and 7–10 in of rainfall in the area [29].
During the September 2022 storms, both reserves were exposed to strong tropical-storm-force winds (≥50 kt; Figure 1c,d) but remained outside the core band of hurricane-force wind fields. Hurricane Ian made landfall as a Category 4 storm approximately 100 km north of Rookery Bay, producing maximum inundation of about 7 ft AGL near Marco Island and 5–7 in of rainfall in the surrounding area [30]. Hurricane Fiona made landfall as a Category 1 storm approximately 100 km west of Jobos Bay, generating 1–3 ft of storm-surge inundation AGL along the southern coast of Puerto Rico and heavy rainfall of 20–25 in around Jobos Bay [31]. These contrasting exposure conditions allow comparison of mangrove responses to severe (2017) versus less intense (2022) tropical-cyclone impacts and assess the effects of repeated disturbances.
2.2. Annual Land-Cover Mapping and Recovery Analysis
Provenance of the products used: The annual land-cover maps analyzed here were not produced for this manuscript. They are existing products of the NERRS-MCC projects, distributed with their own documentation, metadata, and accuracy assessment [19,20,32]. The subsections below headed “Satellite imagery and preprocessing”, “Annual land-cover maps”, and “Map validation” summarize that earlier work so that the reader can judge the inputs; the imagery selection, the classifier, the mosaicking rules, the post-processing, and the validation design and accuracy metrics reported in Table A3 are fixed properties of those products and were not modified here. What was carried out for the present manuscript is the analysis built on top of them: definition of the mangrove target areas, the pixel-wise trajectory and pathway analysis, the separation of coastal from inland water, the delineation of the mangrove condition polygons, and the NDVI time-series analysis of Section 2.3.
The NERRS-MCC projects produced a time series of 2 m annual land-cover maps spanning 2014–2024 for the Rookery Bay and Jobos Bay NERRs and including the surrounding ecosystems extending beyond the reserve boundaries (Figure 1, blue polygons). Those maps used a decision-tree classifier developed by McCarthy et al. [21,22]. This hierarchical classifier assigns each pixel to a land-cover class through a sequence of binary decision rules and has been previously applied to mangrove mapping and hurricane-impact assessments [7,10]. This classifier identifies mangroves and exposed soil more accurately than support vector machines and neural network classifiers [10] and was successfully applied to detect mangrove damage following Hurricane Irma in Rookery Bay [7]. All technical and data reports, datasets, metadata, and data visualizations for both projects can be found in Office for Coastal Management reports [19,20,32]. The classification code, including the sequence of decision-tree tests and thresholds used to assign land-cover classes, is publicly available in the USF-IMARS repository [33].
The 2017 maps were derived from imagery acquired prior to hurricane landfall in September (Table A1) and represent pre-storm conditions. Subsequent annual maps were used to quantify hurricane-induced mangrove canopy disturbance and recovery.
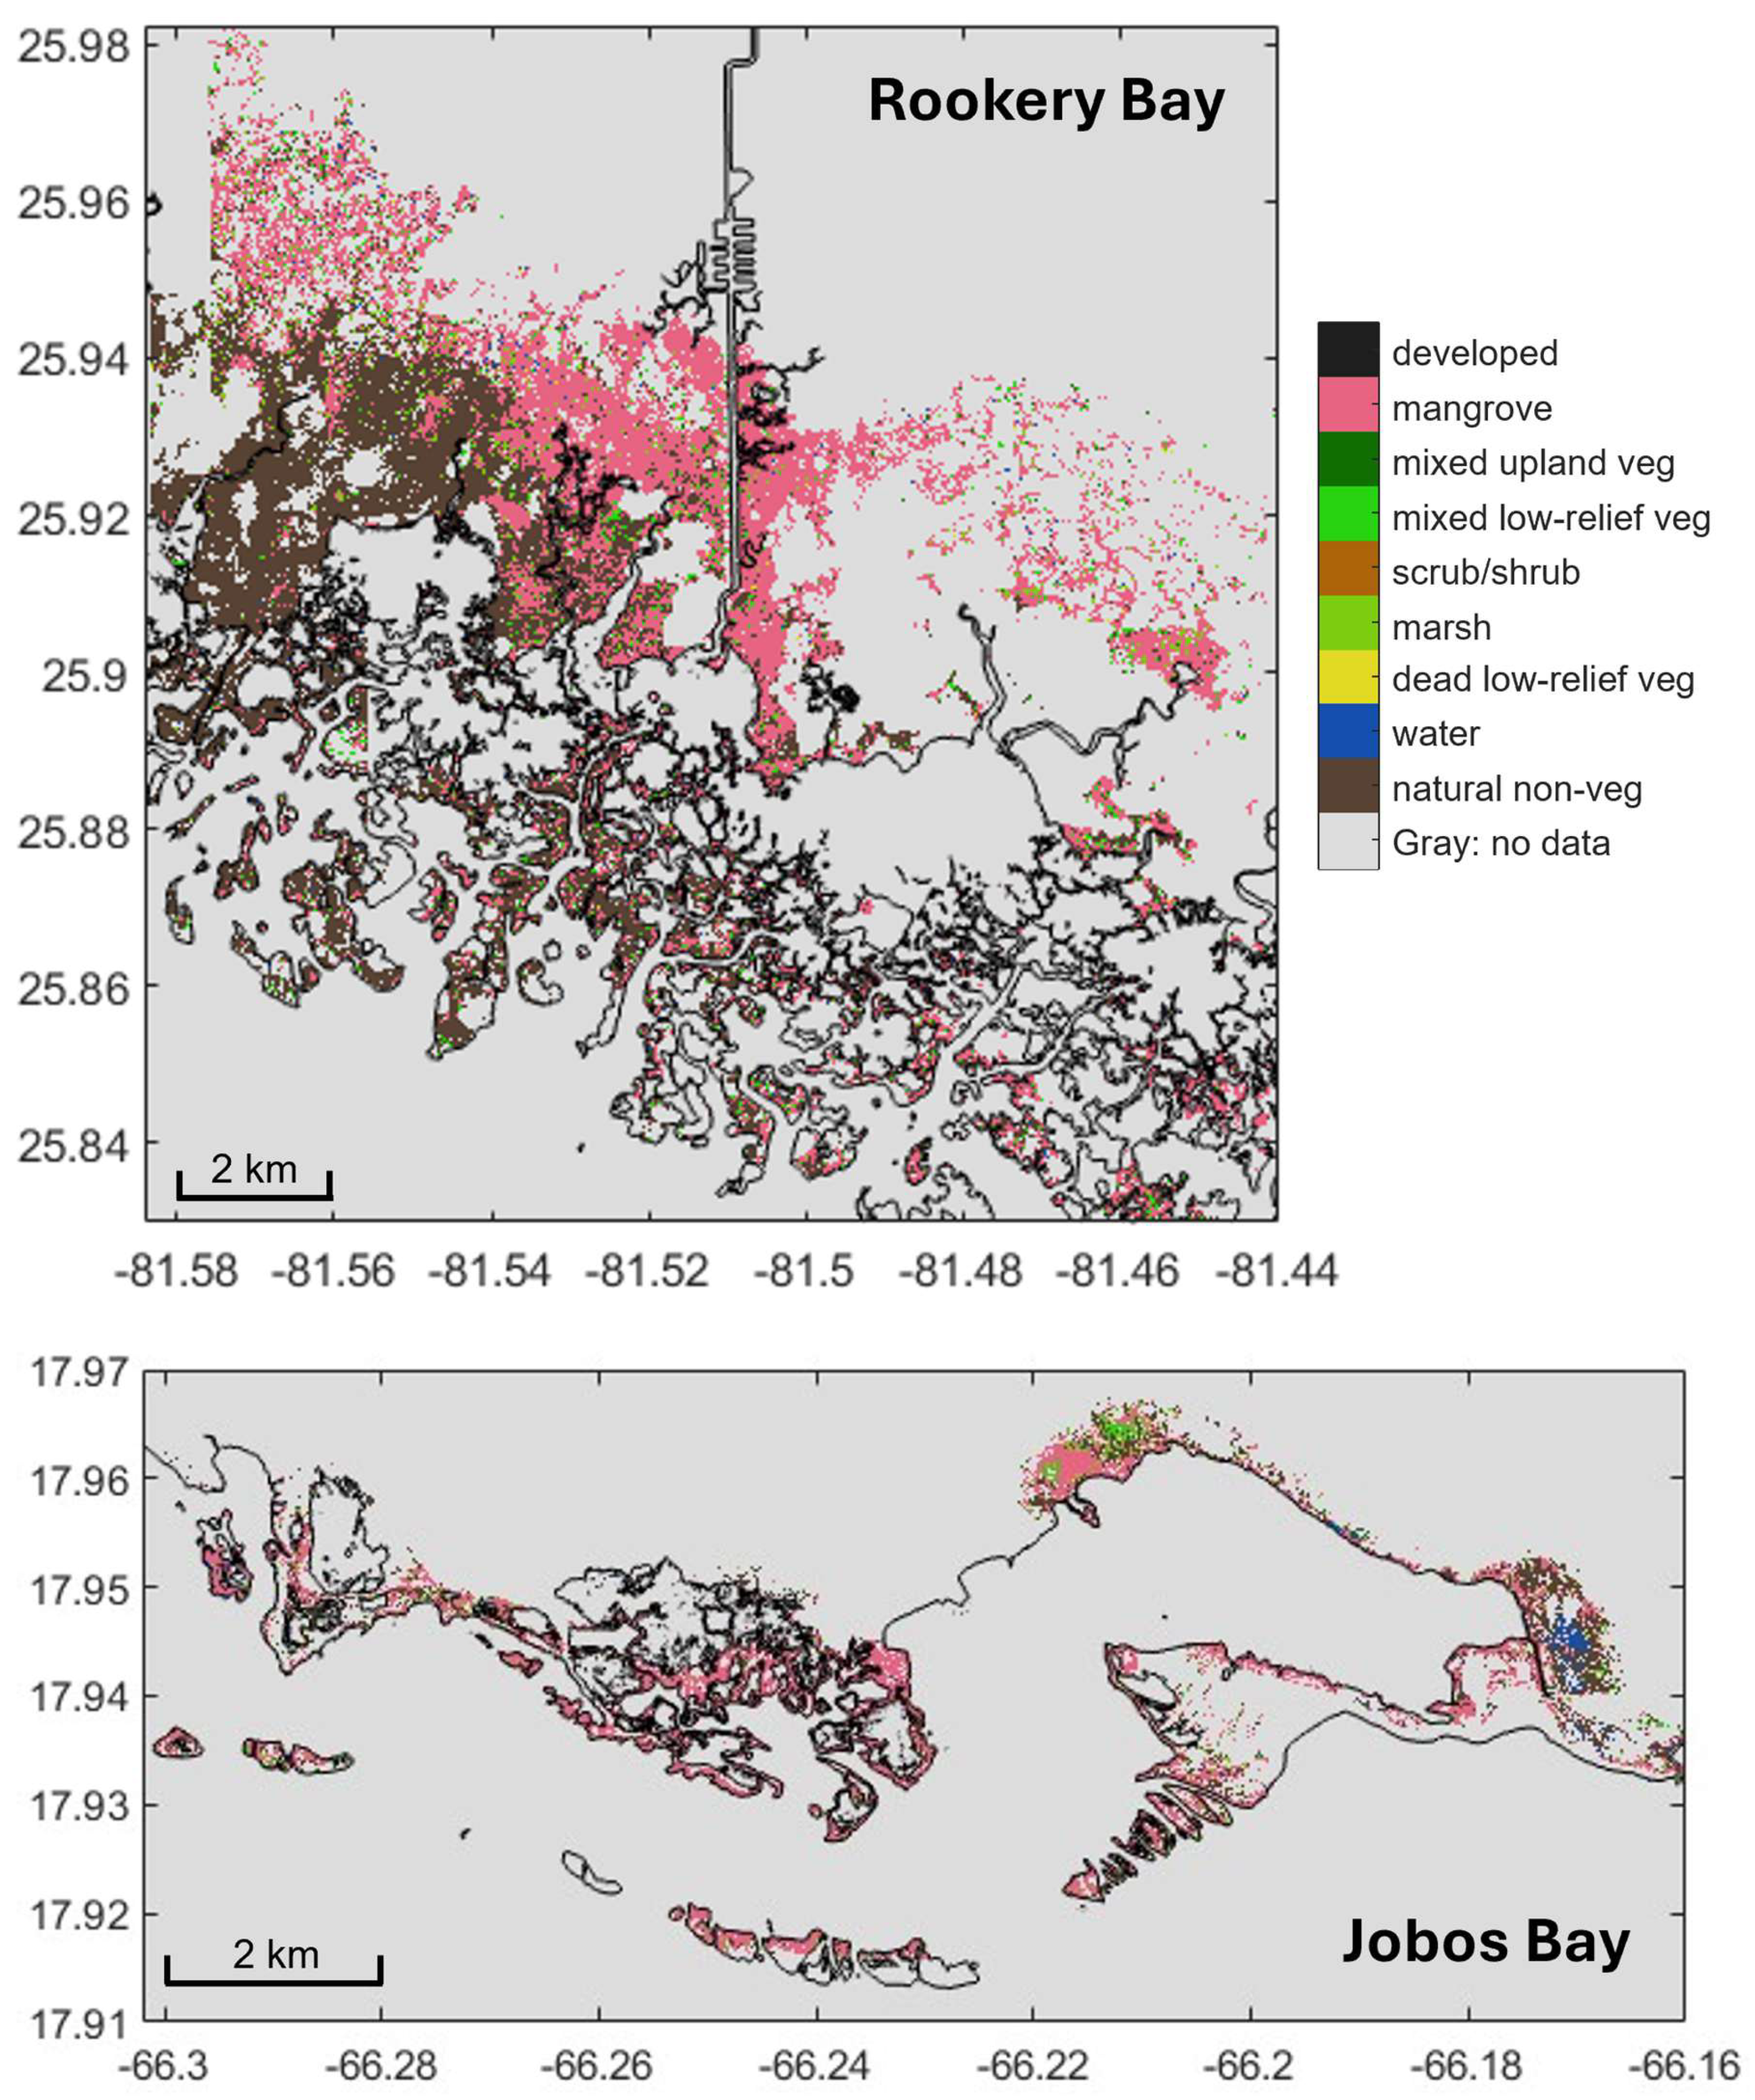
For this study, the analysis of post-storm mangrove change trajectories with the land-cover maps was restricted to areas with mangrove classification in the 2017 pre-storm map and consistent spatial coverage throughout the available time series (Figure 1, Figure 2, Figure A1 and Figure A2). The study areas for each region are called the mangrove target areas (MTAs, Figure 2), which include the southeastern region of Rookery Bay NERR (2017–2023) and the area surrounding Jobos Bay NERR (2017–2024). Due to reduced satellite image coverage for 2023, only the southernmost region of the reserve was used for this analysis (Figure 2 and Figure A1). Because the map study area is driven by image coverage availability and pixel continuity across years, the analyzed domain is not a random sample of either reserve. At Rookery Bay it is concentrated in the southeastern portion of the reserve, which sustained important damage related to hurricane Irma, so quantities derived from it are expected to differ systematically from reserve-wide values.
Figure 2.
Mangrove target areas (MTAs, colored pixels) in southern Rookery Bay (sRB-MTA, top) and Jobos Bay (JB-MTA, bottom) used for temporal land-cover pathway analysis. MTAs were defined by pixels classified as mangrove in the 2017 pre-storm maps and retaining valid classifications throughout all annual mosaics (2018–2023 for Rookery Bay; 2018–2024 for Jobos Bay); all other pixels are shown in gray. The sRB-MTA covers 4875.0 ha, and 653.1 ha for the JB-MTA. Both MTAs are shown in Figure 1 (red polygons) in the context of the hurricane tracks. Pixel colors within this figure indicate 2018 land-cover classes, highlighting immediate post-storm changes after Hurricanes Irma and Maria.
Satellite imagery and preprocessing: Habitat maps were generated from very-high-resolution (around 2 m), 8-band multispectral WorldView-2 and WorldView-3 imagery provided by the NASA Commercial Smallsat Data Acquisition Program [34]. Level-1B images were orthorectified, atmospherically corrected, and converted to remote-sensing reflectance following McCarthy et al. [22], using a Digital Elevation Model (Copernicus GLO-30; ref. [35]) and standard GDAL/MATLAB workflows [36,37] on a high-performance computing cluster. Residual georeferencing errors, particularly in Jobos Bay, were reduced by manually aligning reflectance images to high-resolution coastline vectors from NOAA’s Continually Updated Shoreline Product (CUSP, ref. [38]). This alignment was performed visually, and no residual positional error statistics were computed for the archived products. We did not find any apparent interannual misalignment of mapped features in the annual mosaics by visually inspecting them. However, at 2 m resolution, a residual offset of a single pixel is sufficient to move the boundary between mangrove, soil, and water, especially along a narrow fringe; therefore, apparent transitions confined to the outermost one or two pixels of a shoreline should be treated with caution.
Annual land-cover maps: Land-cover classification followed McCarthy et al. [21,22], using spectral indices and a decision-tree algorithm implemented in MATLAB without in situ training data. Classes were grouped into vegetated and non-vegetated types (Table A2), with mangroves distinguished from upland vegetation, low-relief vegetation, marsh, and unvegetated surfaces. Cloud and shadow pixels were explicitly classified, allowing partial use of cloud-contaminated scenes [21].
Annual mosaics were produced by combining classified scenes using the pixel-wise mode of class values. The mosaicking procedure generally prioritized imagery from the beginning of the calendar year due to clearer atmospheric conditions; when coverage was limited, the best available imagery from other periods was used. The number of contributing acquisitions for the annual mosaics ranged from several dozen images in the beginning of the map time series in 2014 and were reduced in recent years due to lower availability of WorldViewTM images over the reserves (Table A1). Cloud and shadow classes were merged into a no-data category in the annual composites (Table A2). Mosaicking was conducted in Google Earth Engine [39]. A complete list of image acquisitions and processing details is provided in the project dataset description [32].
Map development incorporated iterative input from stakeholders at both reserves, including managers, advisory committees, and technical collaborators, to improve ecological realism and management relevance. Stakeholders contributed local ecological knowledge and management priorities to define regions of interest, refine classification rules, and review intermediate and final products. This process revealed georeferencing inconsistencies addressed by manual alignment, artifacts from the original maximum-value mosaicking approach [22] addressed by adopting mode-based compositing, and confusion between mangroves and upland vegetation in Jobos Bay addressed by adjusting decision-tree thresholds.
Post-processing combined temporal prevalence and spatial filters to reduce misclassifications. For each pixel, the percentage of years assigned to each land-cover class was computed, and rare, context-inconsistent assignments (e.g., vegetation or mangrove classes occurring infrequently within pixels classified as water in most years) were reclassified as no-data. For vegetation classes, prevalence criteria were combined with spatial masks derived from expert-defined polygons and existing habitat maps to indicate where mangroves were expected or unlikely to occur. Suspected mangrove–upland confusion was removed by reclassifying unlikely mangrove pixels outside known mangrove areas or with low mangrove prevalence as no-data. In Rookery Bay, pixels outside existing habitat maps were revised using temporal prevalence alone. Stakeholder input, obtained through repeated project meetings at both reserves, improved spatial consistency, classification accuracy, and ecological realism in the final land-cover time series.
Due to limited imagery, maps were not produced for either reserve in 2019. Availability of WorldViewTM images for Rookery Bay decreased after 2020; the 2023 mosaic, made with a single pass (Table A1), only covered the southern portion of the reserve and there were no images available for 2024 (Figure A1). Coverage at Jobos Bay remained sufficient for annual maps throughout 2024 (Figure A2).
Map validation: Annual land-cover maps were validated by the NERRS-MCC projects using georeferenced field observations and expert visual interpretation of very-high-resolution historical imagery available in Google Earth Pro. Field data were obtained from multi-year surveys at both reserves, including pre- and post-hurricane campaigns in 2014, 2018, and assessments of mangrove forest structure in 133 circular 100 m2 plots at both reserves as part of the NERRS-MCC project in 2022–2023 (Ogurcak et al. in preparation). Where field coverage was incomplete, additional validation points were assigned via visual interpretation by analysts from each reserve familiar with local conditions to improve spatial representation. In ideal conditions, each annual map should be validated with observations taken during the same year. However, there was no available annual set of validation points. Thus, the same set of observations was used to validate all the maps produced from 2014 to 2024. Under that data constraint, validation points within hurricane-affected areas were excluded because land cover at those locations changed after storm impact.
For each annual map, the classified land-cover value at each validation point was extracted and compared with the corresponding reference class. Land-cover classes in both the maps and validation dataset were aggregated into mangrove and non-mangrove categories to focus accuracy assessment on mangrove detection. The Prevalence, Accuracy, Balanced Accuracy, Matthews Correlation Coefficient, Recall/Sensitivity, Precision, F1 score, Critical Success Index, and Specificity are shown in Table A3, which includes general definitions for those validation metrics (see [40] for standard performance metric formulations). Validation data were used solely for accuracy assessment and not in classifier training or map generation.
Mangrove change trajectory analysis: Mangrove change following Hurricanes Irma and Maria was examined using pixel-wise land-cover succession analysis for Rookery Bay (2018–2023) and Jobos Bay (2018–2024). To simplify interpretation, the original classes were consolidated into broader categories (e.g., grouping several low-vegetation classes into mixed low-relief vegetation and merging sand into soil), and developed surfaces were excluded (Table A2).
For each region, trajectories were analyzed for pixels classified as mangrove in the 2017 pre-storm maps and having a valid land-cover classification in every subsequent annual mosaic (2018–2023 for Rookery Bay and 2018–2024 for Jobos Bay). These pixels define the mangrove target area (MTA) for each region (Figure 2). Pixels not classified as mangrove in 2017 were excluded because they were outside the pre-storm mangrove domain of interest, while pixels with no-data or unclassified observations in any subsequent mosaic were excluded to maintain a consistent pixel-wise trajectory record across the full-time series. Because the trajectory analysis was restricted to pixels classified as mangrove in 2017, it characterizes recovery of pre-existing mangrove areas and does not quantify new mangrove establishment or expansion into areas classified as non-mangrove in 2017.
The Jobos Bay MTA (JB-MTA) encompassed the full JB NERR extent and adjacent areas, including the Aguirre Forest, Playa Punta Arenas, and other cays, and contained 653.1 ha of mangrove pixels. In Rookery Bay, limited satellite-image availability resulted in reduced spatial coverage in the 2023 annual map (Figure A1). The Rookery Bay MTA was therefore restricted to the southeastern region of Rookery Bay NERR and the Ten Thousand Islands, including adjacent mainland mangrove areas outside the reserve. This southeastern Rookery Bay MTA (sRB-MTA) contained 4875.0 ha of mangrove pixels and included areas with both severe and comparatively lower hurricane impacts (Figure 2 and Figure A1). The MTAs shown in Figure 2 represent the specific pixels retained for trajectory analysis; therefore, the trajectory results should not be generalized to the full 2017 mangrove extent of either reserve.
Pixel counts were converted to area using latitude-adjusted pixel-area estimates based on a representative latitude for each study site. The maps’ rasters were stored in WGS 84 geographic coordinates (EPSG:4326) at a spatial resolution of 1.79663 × 10⁻⁵° in both latitude and longitude, corresponding to 3.58 m2 pixel−1 at Rookery Bay (25.85°N) and 3.78 m2 pixel−1 at Jobos Bay (17.94°N).
Within the MTAs, annual class composition was quantified as the proportion of pixels assigned to each land-cover class, providing a time series of class abundance for mangrove, unvegetated, and other categories (Figure 3 and Figure 4; Table 1 and Table 2). Pixel-wise transition trajectories were derived by tracking each pixel’s annual class assignment through time, yielding multi-year class sequences such as mangrove class loss in 2018 followed by return to mangrove class or persistence in non-mangrove classes. Dominant temporal pathways of disturbance and recovery were aggregated and expressed as percentages of the MTA (Figure 5 and Figures S2–S5; Table 3), providing metrics of canopy resistance, recovery, and prolonged degradation.
Transition to water occurred in the 2018 maps in both coastal and inland settings within the MTAs (Figure 2). Coastal transitions to water may indicate shoreline erosion, persistent inundation, or collapse of fringe mangroves, whereas inland transitions may reflect localized flooding, groundwater changes, altered drainage, or impoundment. To distinguish between these settings, we generated a persistent-water mask for each reserve by combining the available annual maps. For Jobos Bay, the maps used were from 2014, 2015, 2016, 2017, 2018, 2020, 2021, 2022, 2023, and 2024. For Rookery Bay, the maps used were from 2014, 2015, 2017, 2018, 2020, 2021, 2022, and 2023. Pixels classified as water in at least six of the available annual maps were defined as persistent open water. This persistence threshold was used as a spatial classification criterion to identify stable open-water areas for defining the coastal reference boundary, rather than as a hydrological threshold for perennial water.
Small inland water bodies were manually removed to prevent isolated inland features from being used as reference points for the coastal boundary. Morphological erosion using a disk-shaped structuring element with a 5-pixel radius was then applied to reduce small-scale irregularities and narrow protrusions along the classified water boundary. Visual comparison of the resulting boundaries with high-resolution coastline vectors (CUSP, ref. [38]) showed generally good spatial agreement, with local differences of approximately one to two 2 m pixels. Distance to the resulting persistent open-water boundary was then calculated. Pixels within 20 m (10 pixels at 2 m resolution) of the water boundary were classified as “coastal water”, providing a buffer around the mapped open-water margin that accommodates small local differences between the classified boundary and the visible coastline. Pixels farther than 20 m from the water boundary were classified as “inland water”.
For interpretation of mangrove trajectories, resistance was defined as persistence of the mangrove classification from 2017 through all subsequent annual maps. Recovery was defined as a return to the mangrove classification after a transition to a non-mangrove class. This represents apparent mapped canopy recovery and does not necessarily indicate recovery of mangrove structure, composition, biomass, or function. First return to mangrove refers to the first subsequent annual observation in which a pixel was classified as mangrove, and final-year mangrove status indicates whether a pixel was classified as mangrove in the last available annual map. Recurrent transitions refer to repeated changes among mapped classes over the years, whereas persistent degradation refers to a transition from mangrove to a non-mangrove class without a subsequent return to mangrove during the observation period.
Because NERRS-MCC map validation was based on a binary mangrove versus non-mangrove assessment, the reported accuracy metrics do not quantify the ability of the mapping methodology to distinguish among individual non-mangrove classes used in the trajectory analysis, such as soil and low-relief vegetation. We therefore conducted an independent visual corroboration of representative post-storm changes using sub-meter-resolution historical imagery available through Google Earth Pro (GEP). Representative areas within the Rookery Bay and Jobos Bay trajectory-analysis domains were selected to examine the principal mapped transitions following the 2017 hurricanes (Figure A3). For each area, the 2017, 2018, and 2023 land-cover maps were compared with corresponding available historical GEP imagery. The 2017 map displayed all mapped classes, whereas the 2018 and 2023 maps displayed only pixels classified as mangrove in 2017, allowing the subsequent condition of the same pixels to be visually assessed. This comparison (Figure A3) provided qualitative independent corroboration of mapped disturbance and subsequent return to the mangrove class and was not intended as a formal accuracy assessment or probability-based validation of individual land-cover classes.
2.3. NDVI Satellite Time Series Analysis
To characterize disturbance, degradation, and recovery at finer temporal resolution, satellite surface-reflectance time series were constructed for polygons representing three mangrove response groups after the storm: less-impacted, recovered, and non-recovered stands (Figure 6, Figure 7, Figure 8 and Figure 9). These areas were identified by comparing NERRS-MCC land-cover maps from 2017, 2018, and subsequent years (Figure A1 and Figure A2), interpreted together with historical imagery in Google Earth Pro (GEP) and the Satellite basemap in Google Earth Engine (GEE), which provided high-resolution optical reference information.
Less-impacted polygons encompassed areas that showed minimal changes in mangrove classification across the annual land-cover maps and retained a visibly green canopy in the reference imagery. Recovered polygons were delineated in areas classified as mangrove in 2017, reclassified to a non-mangrove class in the 2018 map, and subsequently reclassified as mangrove in one or more later maps. Historical GEP imagery was used to confirm a visible canopy-color change in 2018, while GEP and GEE reference imagery were used to verify the subsequent reestablishment of green canopy cover. Non-recovered polygons were identified in areas classified as mangrove in 2017 but not classified as mangrove in the most recent land-cover map. Historical GEP imagery and the GEE Satellite basemap were used to verify the continued absence of a mangrove canopy in the available reference imagery.
All polygons were manually digitized within the GEE environment. Initially, due to the small area and spatial heterogeneity of the non-recovered areas, those polygons were delineated with relatively complex boundaries and numerous vertices to closely follow the mapped land-cover features and minimize the inclusion of adjacent mixed land-cover areas. However, despite their relatively small total area, these highly detailed polygons substantially increased the computational time required to extract the Sentinel-2 time series and frequently caused the GEE processing to fail. The polygon boundaries were therefore simplified to improve computational efficiency while maintaining the intended post-storm response category. This simplification occasionally increased the inclusion of mixed land-cover pixels, particularly within the non-recovered patches. Nevertheless, the simplified polygons maintained the dominant post-storm response represented by each group. Consequently, spectral averages for the non-recovered group may include contributions from residual vegetation and adjacent non-mangrove land-cover types.
For Rookery Bay, the polygons were located both inside and outside the analyzed 2017 southeastern Rookery Bay mangrove target area (compare Figure 6, Figure 7 and Figure 8 with Figure 2), providing complementary evidence of vegetation response beyond the land-cover trajectory domain of the sRB-MTA. For Jobos Bay, the polygons were located within the mapped domain and included pixels within the JB-MTA mask (compare Figure 9 with Figure 2). The analysis included 9 less-impacted, 7 recovered, and 24 non-recovered polygons in Rookery Bay, representing 1.79, 5.55, and 3.12 ha, respectively (Figure 6, Figure 7 and Figure 8). In Jobos Bay, one polygon was available for each response group, representing 0.25, 0.58, and 0.91 ha, respectively (Figure 9).
Many non-recovered mangrove patches were approximately 100 m across or smaller, which would produce mixed pixels in coarser sensors. We therefore used Sentinel-2 imagery, which provides 10–20 m spatial resolution, 13 spectral bands from visible to shortwave-infrared, and a short revisit time [41,42]. Sentinel-2 Level-2A surface-reflectance data (COPERNICUS/S2_SR_HARMONIZED, ref. [43]) were obtained from the data catalog of Google Earth Engine, and values were scaled (using a multiplicative factor 0.0001) to obtain surface reflectance.
To reduce pass-to-pass variability due to illumination and atmospheric differences while preserving relative spectral information (Figure S1), for each satellite pass, we normalized each reflectance band measurement at the pixel level by dividing reflectance in that band by the sum of reflectance across all bands. Because the Sentinel-2 bands have different native spatial resolutions, Google Earth Engine automatically handled the required reprojection/resolution during the pixel-wise band-sum calculation using GEE’s default nearest-neighbor resampling; no explicit prior resampling of the bands was performed. Cloud, cloud-shadow, thin-cloud, and cloud-edge contamination was removed using the Sentinel-2 Cloud Score± mask (GOOGLE/CLOUD_SCORE_PLUS/V1/S2_HARMONIZED) [44], retaining only pixels with “cs” and “cs_cdf” values > 0.60.
For each cloud-screened and normalized satellite pass, reflectance in each band was then averaged within the polygons of each mangrove response group, yielding a time series for each band at the temporal resolution of individual satellite passes. We visually inspected the time series of the individual bands, as well as of different indices derived from them. Several showed clear changes associated with the 2017 storms, for example, the post-storm shape of the SWIR2 (band 12) time series for recovered mangroves in Rookery Bay (Figure S1). However, we conducted the analysis of mangrove greenness disturbance and recovery using only the Normalized Difference Vegetation Index (NDVI), which showed clear storm-related changes and has been widely used to study storm effects on mangrove forests [3,11,15,16]. The NDVI was calculated using the polygon-averaged Sentinel-2 bands B8 (near-infrared) and B4 (red) as NDVI = (NIR − Red)/(NIR + Red) [45].
Sentinel-2 coverage at Jobos Bay began in December 2018, missing pre-storm conditions and the first year of the post-hurricane period. Therefore, Landsat 8 and 9 imagery (30 m resolution) was used to extend the time series. Landsat revisit time ranged from 16 days (Landsat 8 only) to 8 days after the Landsat 9 launch, and the Operational Land Imager acquires visible to shortwave-infrared bands [46]. Landsat Level-2 Collection 2 Tier 1 data (LANDSAT/LC08/C02/T1_L2 and LANDSAT/LC09/C02/T1_L2, refs. [47,48]) were converted to surface-reflectance data using scaling coefficients (multiplicative factor 0.0000275, additive offset −0.2). Landsat images were cleaned using the QA_PIXEL band by excluding pixels flagged as clouds and cloud shadows, processed using the same band-normalization procedure as for Sentinel-2, and each band was averaged over the polygons for each mangrove response group. The NDVI was calculated from the Landsat group-averaged bands B5 (NIR) and B4 (red). Inter-sensor consistency between Landsat and Sentinel-2 was assessed using polygon-averaged monthly NDVI pairs for each mangrove response group during the overlap period (2019–2025), calculating linear correlations, mean biases (BIAS, Sentinel-2 minus Landsat), mean absolute errors (MAE), and root-mean-square errors (RMSE).
To assess variability in the NDVI time series, we evaluated both between-polygon and within-area variability. For both Rookery Bay and Jobos Bay, within-area spatial variability was calculated from the standard deviation of pixel-level NDVI values within each polygon and date. These values were summarized across dates and expressed relative to the mean polygon-level NDVI as relative spatial variability (%) = mean within-area NDVI standard deviation/mean within-area NDVI × 100. For Rookery Bay, where multiple polygons were available within each response group, between-polygon variability was additionally assessed using the RMSE among polygon-level NDVI time series. RMSE was calculated for each polygon relative to the group-level mean time series and summarized for each response group using the mean and median RMSE. RMSE was also expressed as a percentage of the mean NDVI for each group.
3. Results
3.1. Classification Accuracy of Annual Land-Cover Maps
Annual habitat maps were independently validated as part of the NERRS-MCC mapping effort, showing consistently high and temporally stable classification performance for both reserves (Table A3). In Rookery Bay, mangrove prevalence in the validation data was relatively low (0.22–0.61; mean 0.27), yet overall and balanced accuracy both averaged 0.93, and the Matthews correlation coefficient (MCC) was 0.83, indicating strong classification skill. Mangrove detection was robust, with recall, precision, and F1 scores of 0.94, 0.82, and 0.87, respectively, and specificity of 0.93 for non-mangrove areas. In Jobos Bay, where mangrove prevalence was higher (0.60–0.70; mean 0.67), performance was similarly strong and stable. Overall and balanced accuracy both averaged 0.92, MCC averaged 0.83, and mangrove detection showed high recall (0.92), precision (0.96), and F1 score (0.94). Specificity remained high (0.93), indicating reliable discrimination of non-mangrove pixels despite mangrove dominance.
These accuracy levels are consistent with recent mangrove mapping studies reporting overall accuracies of 0.85–0.97 and F1 scores ≥ 0.8 [49,50,51]. Given the consistently high overall and balanced accuracies in both regions (0.92–0.93), together with stable MCC, precision, and recall values, classification uncertainty was low and temporally stable. These performance metrics support the use of the annual maps for analyzing interannual mangrove variability.
Within the 2017 mangrove study areas (Figure 2), the occurrence of class 9 (upland vegetation) occurred in subsequent annual maps but remained rare, and given the short time frame and site conditions, these occurrences are most consistent with classification error. In both study areas, class 9 represented less than 2% of the mapped area in every annual map, averaging 0.7 ± 0.6% in Rookery Bay (2018–2023) and 1.3 ± 0.4% in Jobos Bay (2018–2024). These consistently low percentages provide an additional indication that misclassification of mangrove as upland vegetation was minimal.
We used the annual land-cover maps from 2017–2023/2024 for a trajectory analysis of mapped mangrove canopy recovery pathways. For that period, Jobos Bay annual overall accuracy ranged from 0.87 to 0.94 and MCC from 0.75 to 0.87, whereas Rookery Bay had overall accuracy ranging from 0.92 to 0.98 and MCC from 0.79 to 0.95. These results indicate generally consistent classification performance among the annual maps but do not directly quantify uncertainty in multi-year trajectories. Accordingly, trajectory proportions were interpreted as observed proportions of mapped land-cover sequences rather than as error-free estimates of ecological transition probabilities.
3.2. Spatial Mangrove Disturbance and Recovery
3.2.1. Land-Cover Post-Storm Changes
Hurricanes Irma and Maria in September 2017 produced clear impacts in the 2018 habitat maps for both reserves (Figure A1 and Figure A2), with extensive areas of mangrove forest transitioning to non-mangrove classes. In contrast, the 2023 maps show little evidence of change following Hurricanes Ian and Fiona in September 2022. The NERRS-MCC map validation was based on a binary mangrove versus non-mangrove assessment, supporting the use of these products for distinguishing mangrove from non-mangrove conditions. Following mangrove canopy damage or removal, the pixel signal could reflect a spectral mixture of exposed woody material (e.g., branches and trunks) and the underlying surface, including soil, mixed low-relief vegetation, or water. However, the validation did not provide class-specific information on the ability of the mapping methodology to distinguish among the individual non-mangrove classes obtained in the trajectory analysis. We therefore conducted an independent visual comparison of the post-storm maps with sub-meter-resolution historical imagery available through Google Earth Pro (GEP; Figure A3). At Hog Key, Rookery Bay, most pixels classified as mangrove in 2017 were mapped as soil in 2018. The corresponding GEP imagery shows exposed soil with visible trunks and branches, while areas mapped as mixed low-relief vegetation appear as green-brown patches. By 2023, nearly all 2017 mangrove pixels had returned to the mangrove class at Hog Key, whereas the remaining soil and low-relief vegetation areas corresponded to visibly persistent non-mangrove conditions in the GEP imagery. A similar pattern was observed east of Central Aguirre in Jobos Bay. Broad areas were mapped as low-relief vegetation in 2018, corresponding to green vegetation patches in the GEP imagery, while areas mapped as soil showed exposed substrate with visible trunks and branches. By 2023, the mangrove class had returned across nearly the entire area, with only a small number of pixels remaining classified as soil or low-relief vegetation and showing corresponding conditions in the GEP imagery. The agreement between the mapped classes and independent very-high-resolution imagery supports the interpretation that the observed trajectories capture spatial patterns of post-storm canopy disturbance and subsequent return to the mangrove class, rather than being solely attributable to classification artifacts. However, this visual corroboration is qualitative and does not provide quantitative accuracy estimates for the individual non-mangrove classes. Therefore, these post-storm land-cover trajectories are interpreted as mapped indicators of changes in pixel composition associated with canopy loss and subsequent return to the mangrove class, rather than as definitive evidence of a single, homogeneous land-cover type at the pixel scale.
The 2017 habitat maps, based on pre-storm imagery, were used as baselines because mangrove extent matched that observed in 2014–2016. The 2018 maps, derived from imagery acquired in the first four months of the year, show widespread shifts from mangrove to the natural non-vegetated soil class, consistent with field observations of defoliation and structural damage (broken branches, snapped trunks, uprooted trees). Loss of green canopy exposed the ground layer in the satellite imagery, so affected mangrove stands were classified as the underlying substrate visible after the storm (Figure 2). Many pixels that were mangrove in 2017 were reclassified as soil in 2018; others changed to mixed low-relief vegetation, consistent with exposed understory; and fringe mangrove pixels converted to water, indicating canopy loss over water and/or shoreline retreat. In subsequent years, some affected areas gradually reverted to mangrove (Figure A1 and Figure A2), revealing spatially heterogeneous recovery of mangrove canopy, whereas other regions remained non-mangrove in 2023–2024. We quantified those changes using pixel-wise trajectories.
3.2.2. Mangrove Recovery Pathways
A pixel-wise land-cover succession analysis was used to characterize annual class transitions and mangrove canopy recovery trajectories. Transition pathways were derived by tracking each pixel’s class sequence through time within the mangrove target area (MTA) defined for each region (Figure 2). To simplify the analysis, trajectories were evaluated using a reduced set of classes (Table A2): mangrove, upland vegetation, mixed low-relief vegetation, natural non-vegetated soil, and water.
A key constraint on interpreting recovery timing is the absence of annual maps for 2019 in both reserves. The 2017 maps represent pre-storm conditions, and the 2018 maps capture immediate post-storm disturbance, but the next annual maps are from 2020. Thus, pixels classified as non-mangrove in 2018 and mangrove in 2020 are interpreted as having returned to the mangrove mapped class by 2020, rather than as having recovered within a specific year interval.
The time-series length also differed between reserves. In Rookery Bay, reduced spatial coverage in 2023 limited the target area to the southern portion of the reserve, and 2024 coverage was insufficient for annual mapping. Therefore, recovery pathways in the southeastern Rookery Bay MTA (sRB-MTA) were evaluated over five annual maps (2018-2020-2021-2022-2023). In the Jobos Bay MTA (JB-MTA), more complete coverage allowed inclusion of 2024, yielding six annual maps (2018-2020-2021-2022-2023-2024). Because the JB-MTA time series includes one additional year and thus a larger number of possible trajectories, pathway results are reported as percentages rather than counts of unique paths to allow direct comparison between the reserves.
Results are summarized in Figure 3, Figure 4 and Figure 5 and Table 1, Table 2 and Table 3. Figure 3 and Figure 4 show annual class composition integrated within each MTA. Figure 5 (with detailed views in Figures S2–S5) illustrates alluvial diagrams of class transitions for pixels classified as mangrove in 2017. Table 1 and Table 2 present percentages of pixels transitioning from their original 2017 or 2018 class to each mapped class in target years integrated by MTA; the first sections focus on 2017 mangroves, and subsequent rows describe dynamics of classes that appeared in 2018. Table 3 lists the most common annual class pathways for affected mangroves at the pixel level. Most trajectories involved transitions among mangrove, mixed low-relief vegetation, soil, and water classes; whereas only a small fraction resulted in persistent transitions away from mangrove.
Compared to 2017, the pixel fraction classified as mangrove declined sharply in 2018 to 47% in the sRB-MTA and 59% in the JB-MTA. By 2023, mangrove coverage had recovered to 90% in the sRB-MTA and 79% in the JB-MTA (Table 1 and Table 2, Figure 2, Figure 3, Figure 4, Figure A1 and Figure A2). In contrast, no substantial changes in mapped mangrove extent were observed after Hurricane Ian in Rookery Bay or Hurricane Fiona in Jobos Bay in 2022 (Figure A1 and Figure A2). Recovery pathways were interpreted using the operational definitions described in the methodology subsection “Mangrove change trajectory analysis”. Because trajectories were derived from discrete annual maps, return to the mangrove class indicates apparent mapped canopy recovery by the next available observation and does not establish the precise timing or ecological completeness of recovery.
In both MTA, pixels that transitioned to mixed low-relief vegetation in 2018 showed the highest subsequent mangrove canopy recovery, whereas areas that transitioned to water showed the lowest recovery. When mangrove recovery was expressed as the percentage of the area occupied by pixels that had changed class in the 2018 maps, the sRB-MTA showed the highest canopy recovery by 2023 (Table 1) for pixels that transitioned to mixed low-relief vegetation (92.19%), followed by those that transitioned to soil (84.3%), while pixels that transitioned to water showed the lowest recovery mapped canopy (52.3%). A similar pattern was observed in the JB-MTA by 2024, although recovery percentages were lower: 85.5% for mixed low-relief vegetation, 67.9% for soil, and 39.4% for water (Table 2).
Mangrove Recovery Pathways at Southeastern Rookery Bay MTA
sRB-MTA 2018 mangrove class: Nearly half of the 2017 mangrove pixels in the sRB-MTA remained classified as mangrove in 2018 (47%; Figure 3, Table 1). Most of these pixels (83.3%) persisted as mangrove through 2020–2023 (Table 3), representing 39.6% (1928.1 ha) of all the sRB-MTA area. A small subset of this group (<7%) showed brief (1 year) transitions to mixed low-relief vegetation in subsequent years before returning to mangrove, a pattern consistent with temporary visibility of understory vegetation.
Figure 3.
Integrated post-storm interannual class transitions for southeastern Rookery Bay MTA. The analysis was done for pixels within the sRB-MTA (Figure 2) classified as mangrove in 2017 and with classifications available for 2018–2023. Mixed low-relief vegetation (lowVeg) groups classes 5–8 (Table A2). The lower graph omits the mangrove class to emphasize less predominant class transitions among soil, water, mixed low-relief vegetation, and upland vegetation; the y-axis is truncated (dashed lines) to better display classes with lower percentages.
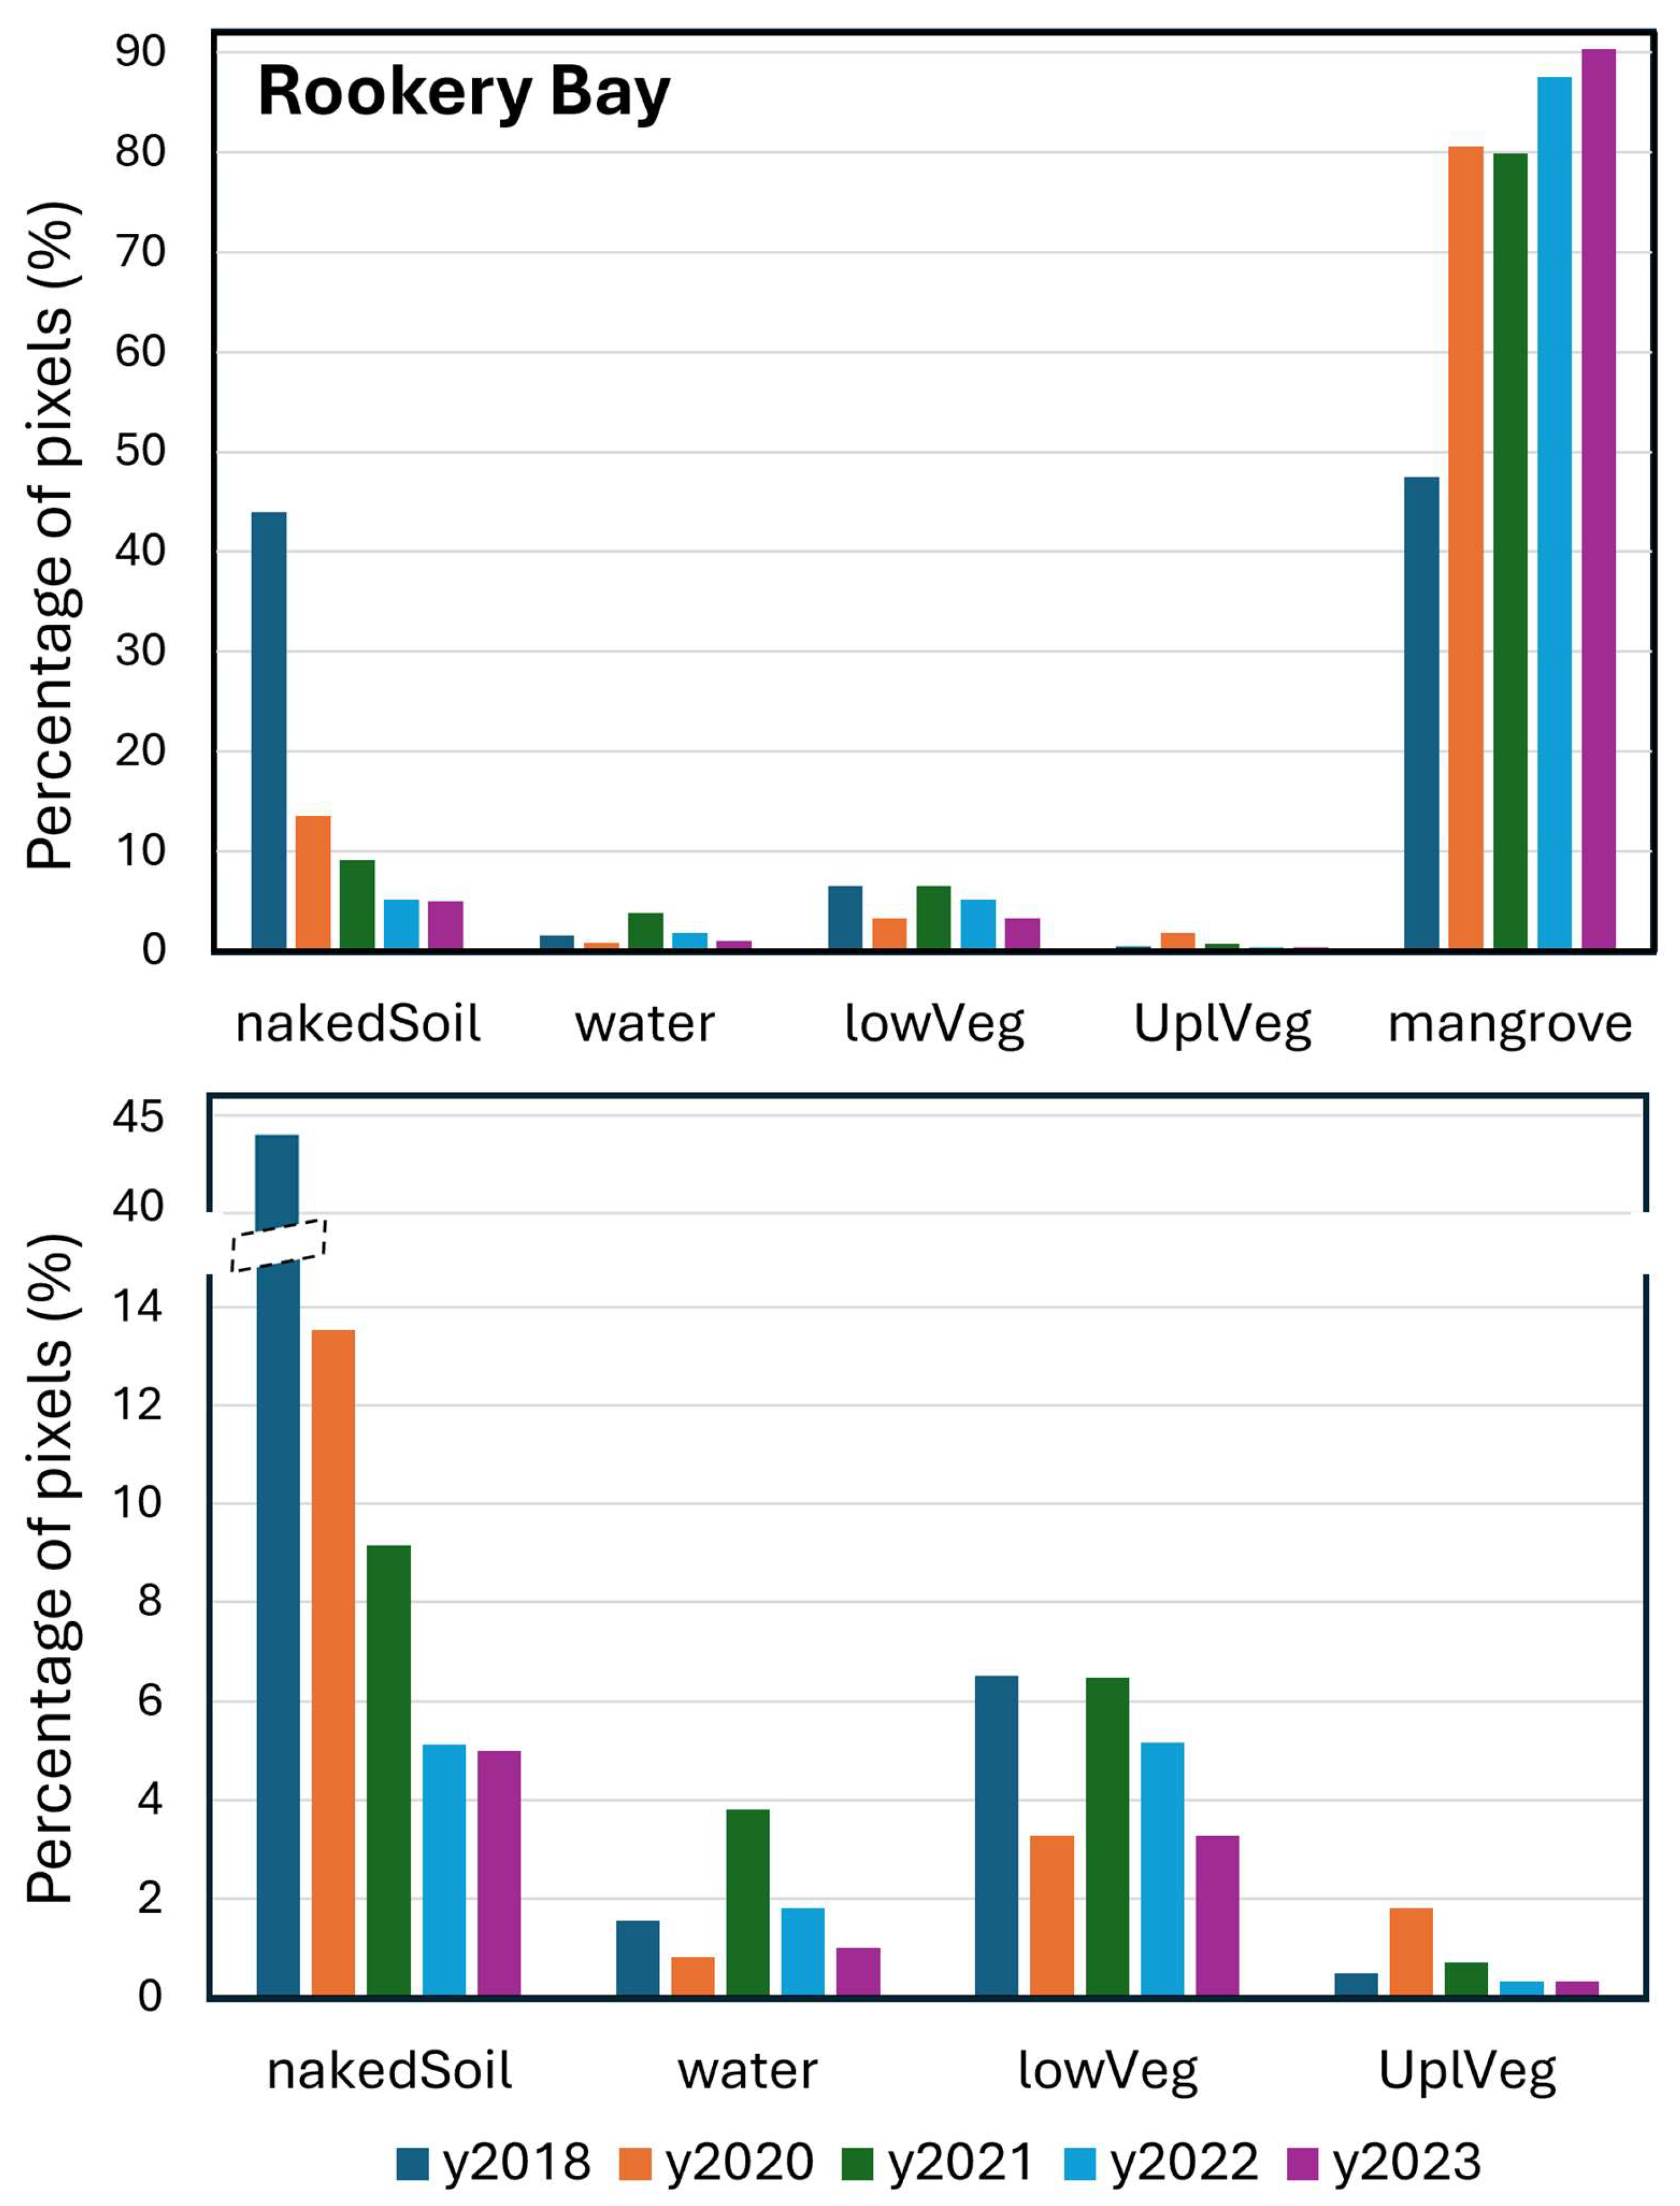
Table 1.
Integrated land-cover transitions for southeastern Rookery Bay MTA after Hurricane Irma (2018–2023). Each row group corresponds to a Base-Year/Base-Class pair; the base class includes its area (hectares) for its base year, followed by the distribution in each subsequent target year among five land-cover classes (mangrove, natural non-vegetated soil, mixed low-relief vegetation (lowVeg), water, and upland vegetation (uplVeg)). The water class was further subdivided into coastal and inland water (below the dashed line). The first group shows the trajectory of mangrove cover from 2017, while the remaining groups represent 2018 land-cover classes that emerged after the storm disturbance. The analysis was done for each pixel within the sRB-MTA (Figure 2), and some classes were grouped together (Table A2).
sRB-MTA 2018 soil class: Over 44% of the sRB-MTA 2017 mangrove pixels were reclassified as bare soil in 2018 (Table 1), especially along the eastern eyewall path of Hurricane Irma (Figure 1 and Figure A1). These areas exhibited a wide range of mapped canopy disturbance and recovery trajectories (Table 3, Figure 5 and Figure S2). Looking at all paths starting as soil in 2018, 84% of soil pixels were again classified as mangrove via two main recovery pathways. The first, and most common, recovery pathway was a direct transition from soil to mangrove (68.1% of pixels across eight paths), with most recovery occurring rapidly by 2020 (53.8%) and smaller fractions recovering in 2021 (5.6%) and 2022 (5.0%). The second involved a short transition through mixed low-relief vegetation before mangrove reclassification (13.8%), typically with a one-year intermediate state. Table 3 shows some of the more common paths.
A small fraction of soil pixels followed more complex trajectories involving mixed low-relief vegetation or mangrove but did not end as mangrove by 2023 (3.2%). Nearly 7% of soil pixels never transitioned to any vegetation class, remaining soil or oscillating between soil and water across the five post-storm annual maps.
sRB-MTA 2018 mixed low-relief vegetation class: A smaller portion of mangrove pixels (<7%) transitioned to mixed low-relief vegetation in 2018 in the sRB-MTA (Table 1), consistent with exposed understory or short vegetation visible after canopy loss. By 2023, over 92% of these pixels had returned to mangrove (Table 1, Figure S2), primarily via three recovery paths. The dominant pathway was a rapid return to mangrove by 2020 (sequence 13-10-10-10-10; 73.5%; Table 3), consistent with moderate canopy damage and fast regrowth. Other paths (12.9% of total) involved recurrent transitions to mixed low-relief vegetation before mangrove recovery in 2023 (see examples in Table 3). Only 1.7% of all the 2018 mixed low-relief vegetation were reclassified as soil or water in 2020 and failed to return to any vegetation class in 2023.
sRB-MTA 2018 water class: A small fraction of pre-hurricane mangrove pixels in the sRB-MTA transitioned to water in 2018 (1.5%; Table 1, Figure 3). Water pixels showed highly heterogeneous trajectories (Figure S3). The two more important paths (Table 3) were, first, a rapid transition back to mangrove (25%) consistent with a fast canopy recovery, and second, the persistence of water pixels through the time series (10%). From all the water pixels paths, 52.3% of water pixels recovered to mangrove by 2023, mostly in 2020 (33.7%) and 2021 (11.2%), often with alternating classifications between water and soil (Table 3 shows the most common paths).
Examination of all 2018 water paths showed that transitions from water through mixed low-relief vegetation before returning to the mangrove class were rare (5.7%; six paths). A substantial 26.5% of water pixels (16 paths) did not return to any vegetation in any annual map, remaining as water or soil, and 16.8% showed brief transitions to mixed low-relief vegetation or mangrove but did not end as mangrove by 2023.
For pixels classified as water in 2018, we further distinguished coastal water from inland water to evaluate whether recovery pathways differed between shoreline-adjacent and interior sites (Table 1). Mangrove pixels that transitioned to inland water tended to recover to mangrove more frequently than those transitioning to coastal water (57% vs. 48%; Table 1, Figure S3). Across the 2018 water class (75.5 ha), 52% of pixels recovered to mangrove by 2023, with 40% recovering early (2020) and 43% not returning to any vegetation. Coastal water pixels (40.2 ha) showed 48% mapped mangrove canopy recovery by 2023, 33% early recovery in 2020, and 47% with no vegetation reclassification, whereas inland water pixels (35.4 ha) had higher mapped canopy recovery (57% by 2023, 48% by 2020) and lower percentage of reclassification to non-vegetation classes (39%). These patterns show lower mangrove recovery and a higher proportion of persistent non-vegetated pixels in coastal areas (Figure S6).
Mangrove Recovery Pathways at Jobos Bay MTA
Jobos Bay MTA pathways results are presented in direct comparison with southeastern Rookery Bay MTA. We focused on percentages rather than counts of unique paths because the Jobos Bay time series includes one additional year, increasing the number of possible paths (Table 3).
JB-MTA 2018 mangrove class: In the JB-MTA, 58.6% of 2017 mangrove pixels remained classified as mangrove in 2018 (Figure 4, Table 2). Most of these pixels (75.4%, 288.6 ha) persisted as mangrove through 2024 (Table 3), which represents 44.2% of all the JB-MTA area, a value very close to the 39.6% observed for the sRB-MTA. Looking at all the paths, approximately 13.6% of pixels showed temporary intrusions from other classes, and only 1.15% followed trajectories that did not return to mangrove by 2024, typically transitioning to soil with no subsequent return to any vegetated classes.
Mangrove coverage decreased in 2022 (Figure 4), resulting in the second-lowest mangrove area in the record after 2017. The areas no longer classified as mangrove were primarily reclassified as soil and mixed low-relief vegetation (Figure 4 and Figure S4). Because the 2022 mosaic was generated using imagery acquired during the first four months of the year (Table A1), this decrease predates the September 2022 storm and therefore cannot be attributed to that event.
Figure 4.
Integrated post-storm interannual class transitions for Jobos Bay MTA. The analysis was done for pixels within the JB-MTA (Figure 2) classified as mangrove in 2017 and with classifications available for 2018–2024. Mixed low-relief vegetation (lowVeg) groups classes 5–8 (Table A2). The lower graph omits the mangrove class to emphasize less predominant class transitions among soil, water, mixed low-relief vegetation, and upland vegetation.
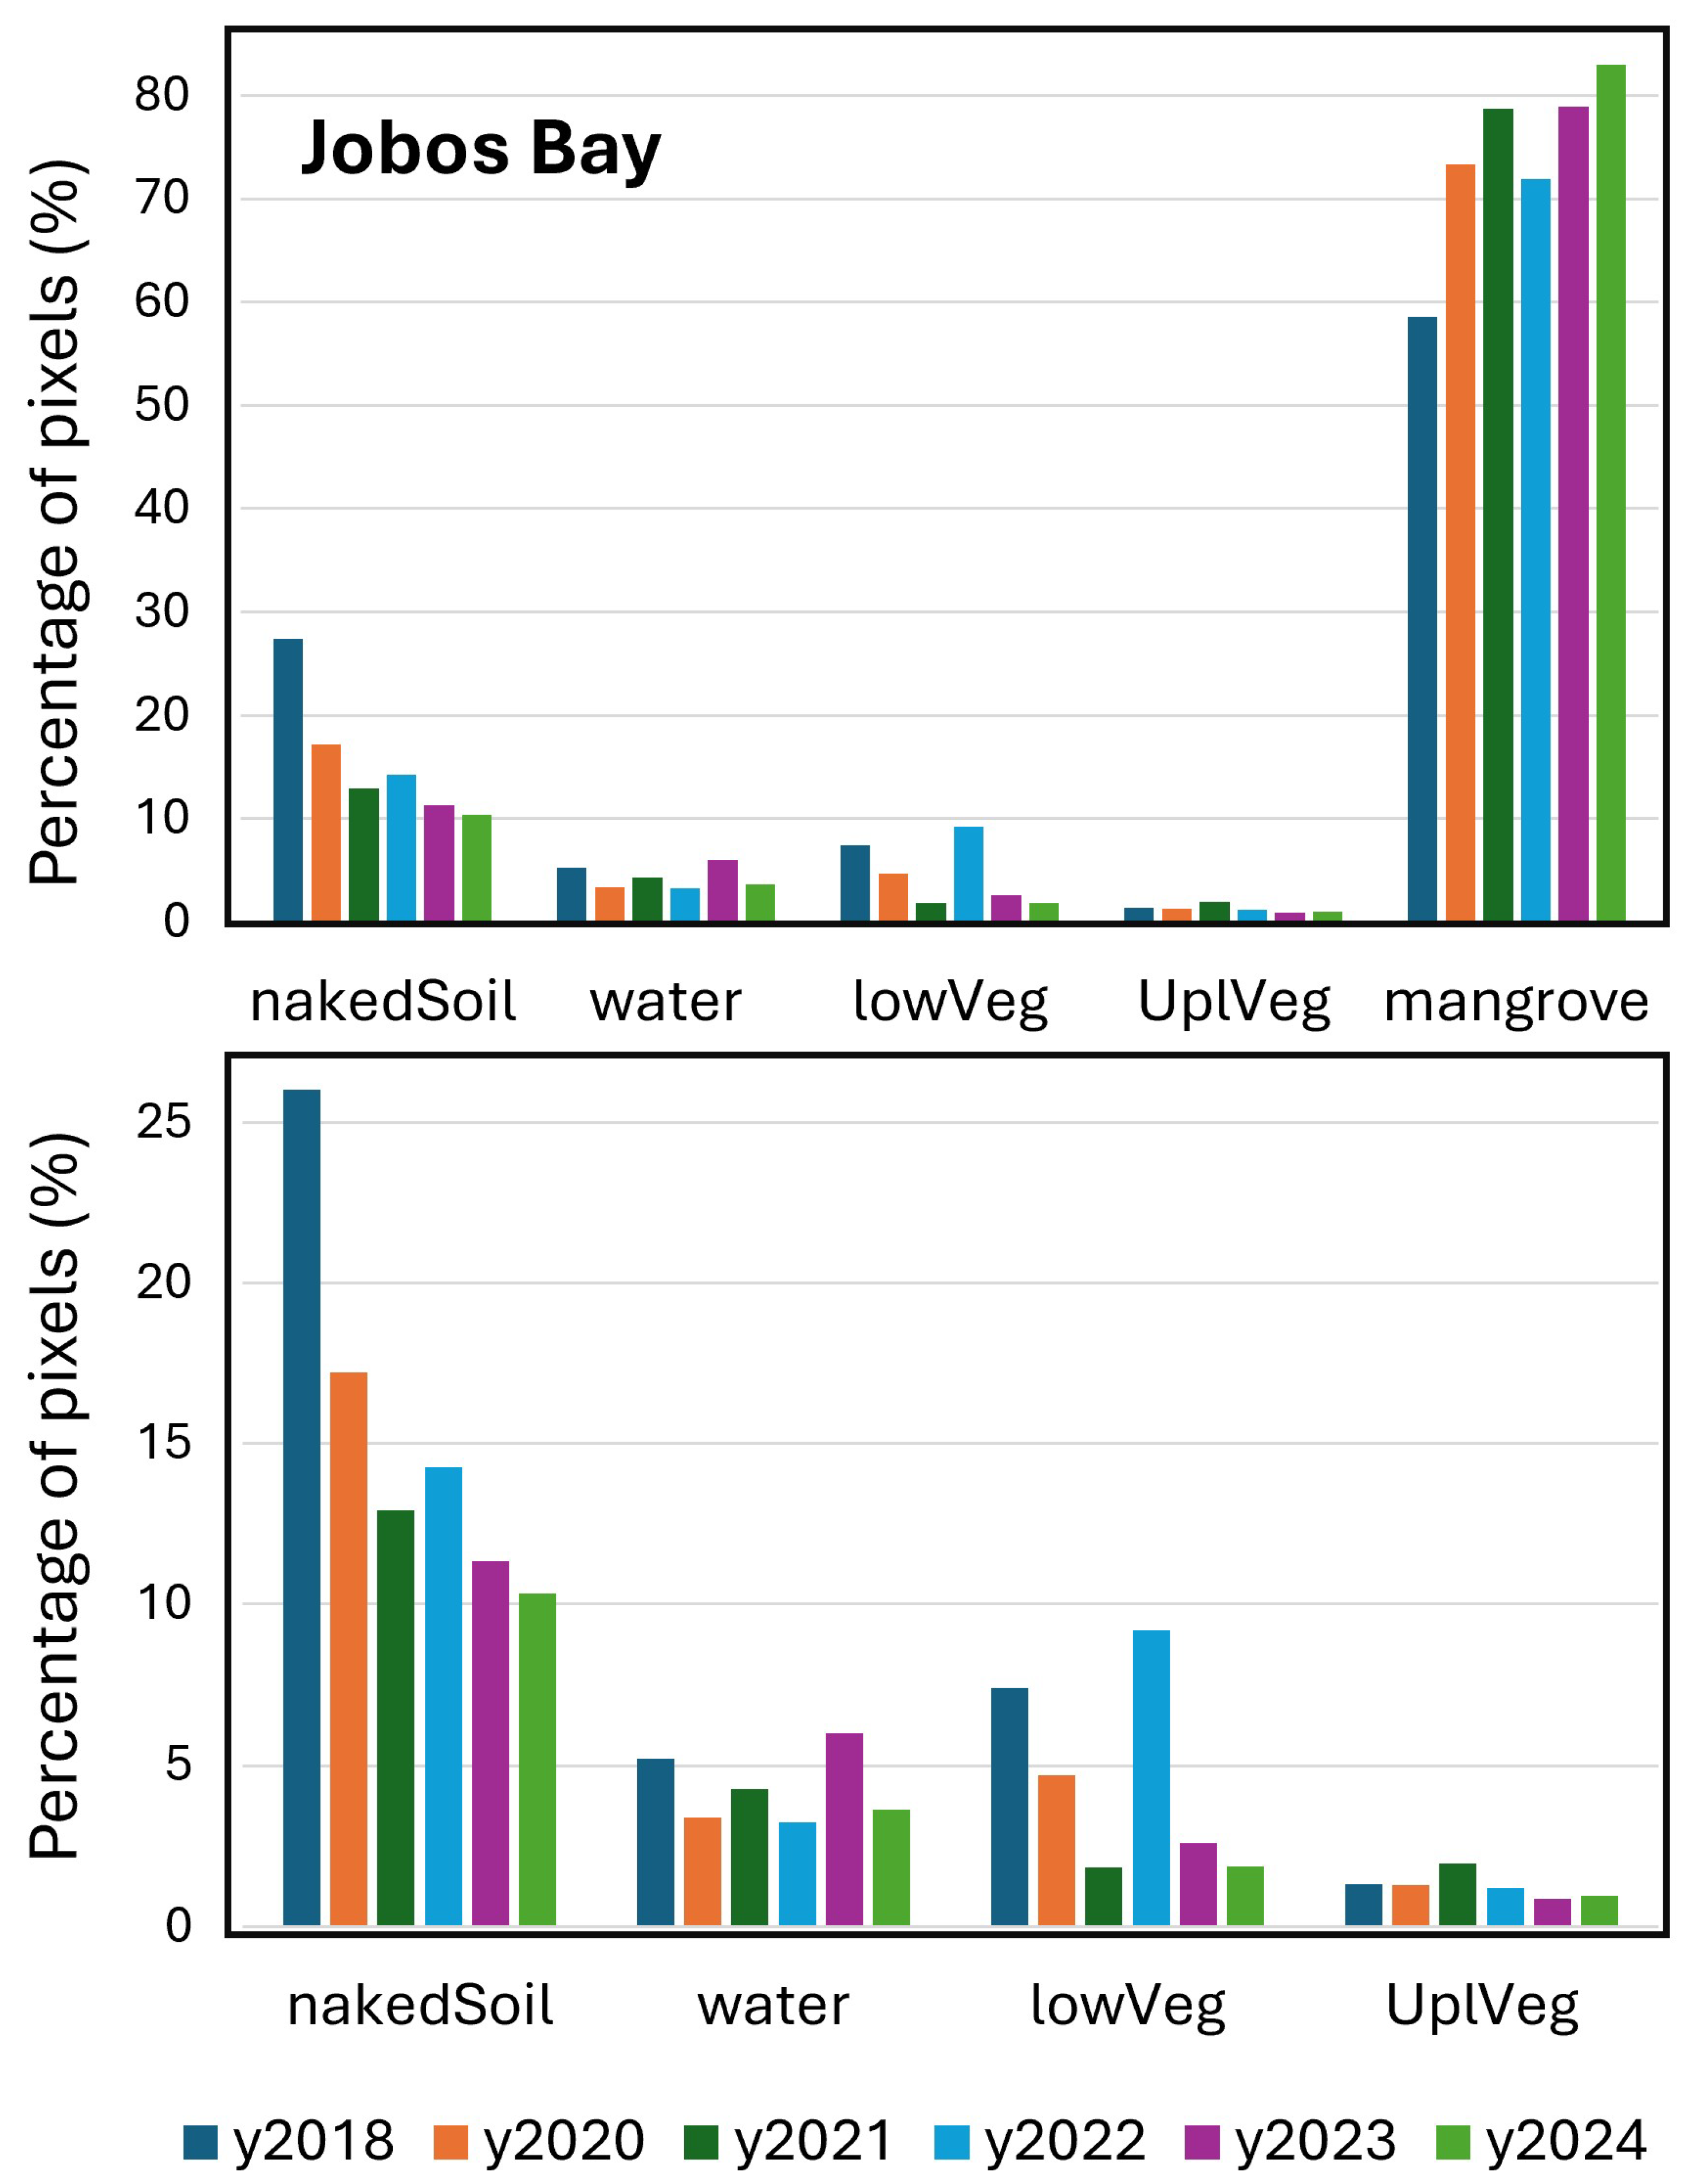
Table 2.
Integrated land-cover transitions for Jobos Bay MTA after Hurricane Maria (2018–2024). Each row group corresponds to a Base-Year/Base-Class pair; the base class includes its area (hectares) for its base year, followed by the distribution in each subsequent target year among five land-cover classes (mangrove, natural non-vegetated soil, mixed low-relief vegetation (lowVeg), water, and upland vegetation (uplVeg)). The water class was further subdivided into coastal and inland water (below the dashed line). The first group shows the trajectory of mangrove cover from 2017, while the remaining groups represent 2018 land-cover classes that emerged after the storm disturbance. The analysis was done for each pixel within the JB-MTA (Figure 2), and some classes were grouped together (Table A2).
Table 3.
Most frequently observed temporal land-cover paths at the pixel level showing mapped mangrove canopy persistence, degradation, and recovery after Hurricane Irma in Rookery Bay (2018–2023) and Hurricane Maria in Jobos Bay (2018–2024). Paths are based on annual class assignments for each pixel within the mangrove target areas (MTAs, Figure 2). The table includes the four 2018 base classes: pixels that remained as mangrove (class 10) in 2018 or were reclassified as soil (class 3), mixed low-relief vegetation (lowVeg, class 13), or water (class 4), together with the number of paths for each class in 2018. Each path shows the chronological sequence of class assignments: 2018-2020-2021-2022-2023 for the southeastern Rookery Bay MTA (sRB-MTA), and 2018-2020-2021-2022-2023-2024 for the Jobos Bay MTA (JB-MTA). Path percentages were calculated relative to the area of their corresponding 2018 base class (Table 1 and Table 2) and therefore represent the proportion of pixels within each base-class group following each path. Only paths representing more than 1% of the corresponding 2018 class area are shown.
JB-MTA 2018 soil class: Most mangrove pixels that became soil in 2018 in the JB-MTA returned to mangrove by 2024 (67.9%; Table 2, Figure 5), with nearly half recovering by 2020 (44.3%); however, a substantial fraction did not recover and remained as soil in 2024 (24.0%). As in the sRB-MTA, the principal mapped canopy recovery pathway in the JB-MTA was a direct transition from soil to mangrove (51.1%; Table 3, Figure S4), with most canopy recovery occurring by 2020 (33.3%, Table 3). Recovery of mapped mangrove canopy via mixed low-relief vegetation had a similar frequency in the JB-MTA (12.7%) as in the sRB-MTA (13.8%), with intermediate low-vegetation states typically lasting one year. Unlike the sRB-MTA, a notable proportion of 2018 soil pixels in the JB-MTA did not return to mangrove or other vegetation (29.2%; Table 2, Figure S4). Many of these pixels (8.6%) remained as soil throughout 2020–2024 (Table 3), while others oscillated between soil and water (4.4% from all paths) or had brief transitions to mangrove or mixed low-relief vegetation (3.9% from all paths).
Figure 5.
Pathways of disturbance and recovery of mangrove after Hurricane Irma in Rookery Bay (top, 2018–2023) and Hurricane Maria in Jobos Bay (bottom, 2018–2024). The diagrams show the most common temporal land-cover paths, accounting for 90% of total pixels (see examples in Table 3) within the mangrove target area (MTA) for each region (Figure 2), with some classes grouped together (Table A2). Stream thickness represents relative pixel proportions, and nodes are ordered by decreasing frequency. Alluvial diagrams were generated using RAWGraphs [52]. Detailed diagrams with close-up views of pixels initially reclassified in 2018 as mangrove, soil, mixed low-relief vegetation, and water are provided in the Supplementary Materials (Figures S2–S5).
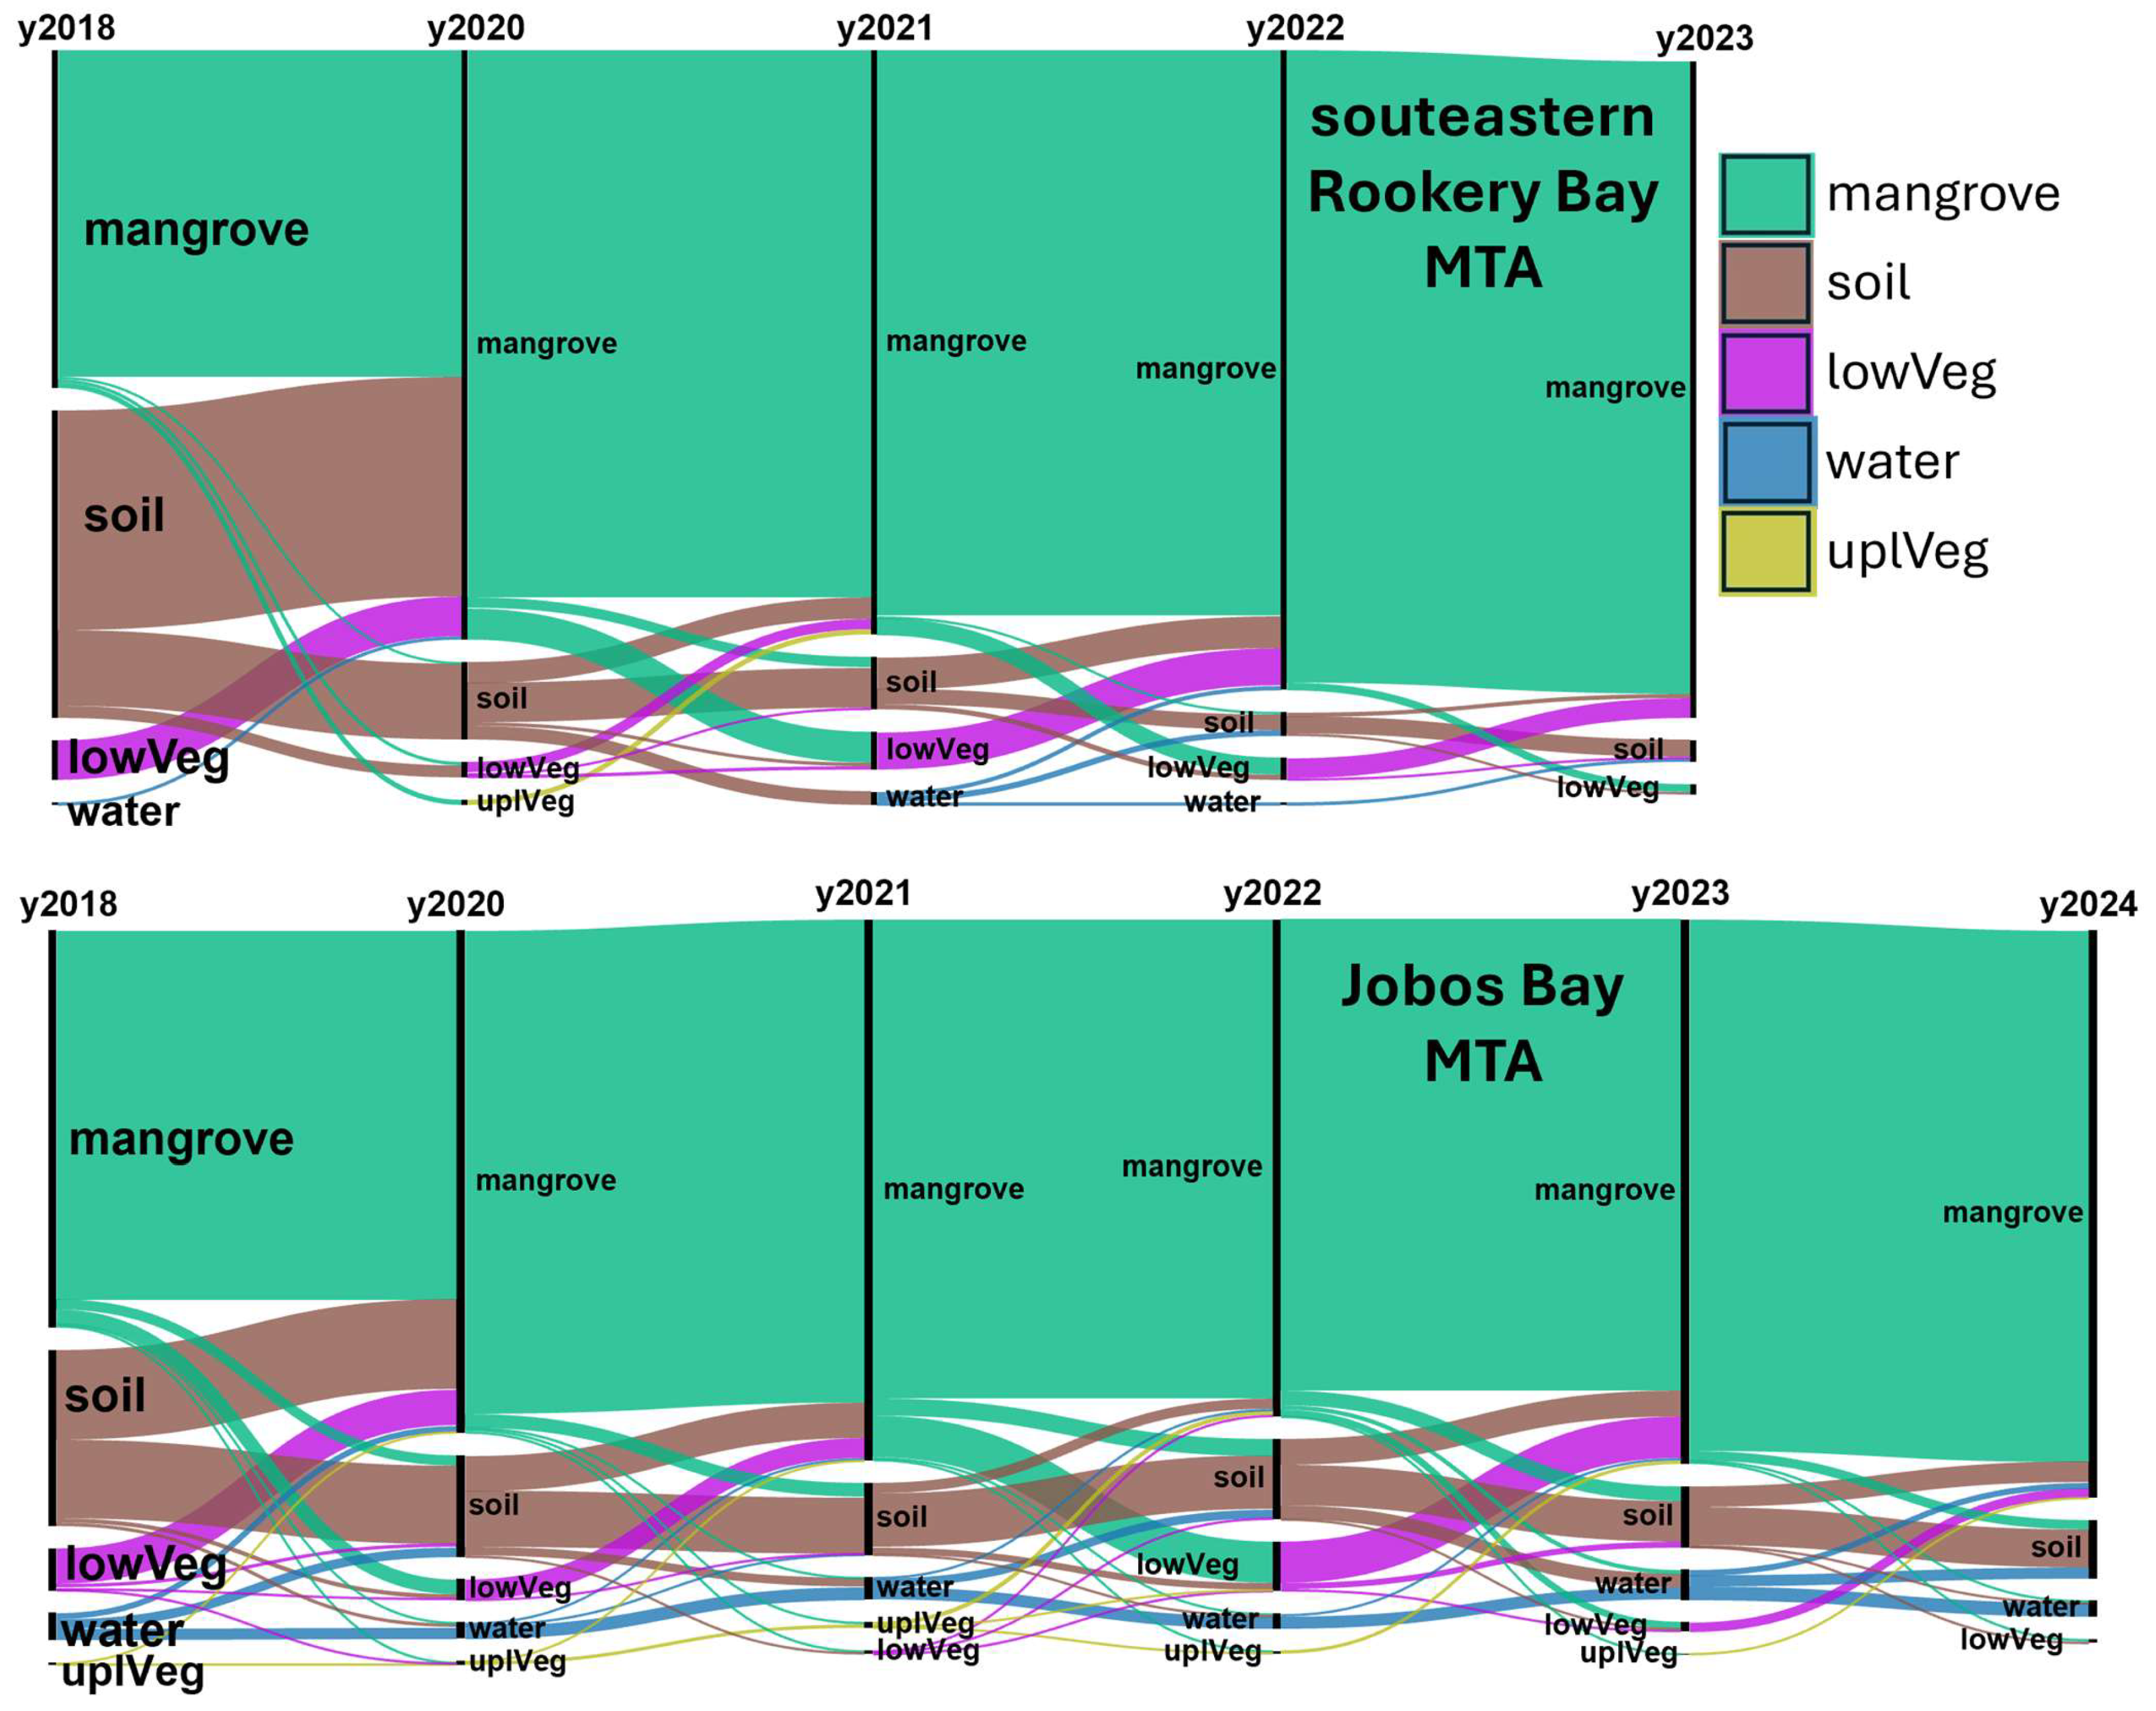
JB-MTA 2018 mixed low-relief vegetation class: Like the sRB-MTA, a small fraction of mangrove pixels in the JB-MTA (7.4%; Table 2, Figure 4) transitioned to mixed low-relief vegetation in 2018, consistent with exposed understory vegetation. Of these, 74.1% reverted to mangrove by 2020, increasing to 85.5% by 2024 (Table 2, Figure S4), which is lower than in the sRB-MTA (89% by 2020 and 92% by 2023; Table 1). An important fraction (Table 2) remained as mixed low-relief vegetation in 2020 (9.6%) or transitioned to soil (13.2% in 2020; 7.8% in 2024).
By 2024, 85.5% of 2018 low-vegetation pixels had returned to mangrove in the JB-MTA, mostly via 11 pathways. The most common trajectories involved fast recovery to mangrove class by 2020 (two paths, 62.0%; Table 3), with an additional 7% recovering by 2021. However, considering all the paths, 14.5% did not return to mangrove by 2024 (Figure S4), including a dominant path in which mixed low-relief vegetation converted to soil (2.2% of pixels, Table 3). A small proportion of these paths ended in other vegetation classes (5.8%), predominantly mixed low-relief vegetation.
JB-MTA 2018 water class: In the JB-MTA, 5.2% of 2017 mangrove pixels transitioned to water in the 2018 map (Table 2, Figure 4), a higher proportion than in the sRB-MTA (1.6%; Table 1). Recovery of mapped mangrove from 2018 water reclassification was slower and less complete (Table 2): by 2020, only 24% of water pixels had returned to mangrove (compared to 40% in the sRB-MTA), and by 2023, this reached 33% (compared to 52% in the sRB-MTA), increasing to nearly 40% by 2024. In 2020, 38.5% of water pixels remained water and 35.9% had transitioned to soil.
Recovery pathways to the mangrove class originating from 2018 water pixels were complex and heterogeneous in the JB-MTA, with 46 paths accounting for 75% of pixels (Figure S5, more common paths in Table 3). From all the paths, only 39.4% of pixels recovered to the mangrove class by 2024. The most important pathway of mapped canopy recovery was the direct transition from water in 2018 to mangrove in 2020 through to 2024 (10.9%, Table 3), with seven other important paths showing a few years of water or soil before returning to mangrove in 2024 (10.0%, Table 3). Among all the trajectories with no returning to the mangrove class in 2024, the dominant path involved continuous water presence throughout the time series (15.5%, Table 3, Figure S5). The second-most common path was a transition from water to soil persisting through 2024 (6.1%). Remaining non-recovery paths were characterized mainly by alternations between water and soil with only brief appearances of mangrove or mixed low-relief vegetation.
Separating water pixels into coastal and inland categories revealed contrasting recovery dynamics in mapped canopy in the JB-MTA (Table 2, Figure S5). The overall 2018 water class (34.2 ha) showed ~40% recovery to mangrove by 2024, with 24% recovering by 2020. Coastal water pixels (13.6 ha) had lower mangrove reclassification (35.5%) than inland water pixels (20.5 ha, 42.1%). A large fraction of water pixels did not transition to vegetation by 2024 (58.9% remained soil or water), with non-vegetated pixels more frequent in coastal areas (64.2%) than inland (55.3%). The strongest contrast between coastal and inland water was in final non-vegetated states: 2018 coastal water pixels predominantly stayed as water in 2024 (60.5%) and only a small proportion changed to soil (3.6%); whereas inland water pixels more often transitioned to soil (37.7%) than to water (17.7%).
Areas of persistent mangrove loss: The broader spatial coverage of the JB-MTA map time series allowed visualization of mangrove disturbance in 2018 and residual loss in 2024 by subtracting annual mangrove maps from a reference year (Figure A4). Mangrove canopy loss in 2018 was widespread, with extensive disturbance in the eastern and northwestern sectors of Aguirre State Forest, while impacts around Jobos Bay NERR were primarily in the coastal fringe (Figure A4, top). By 2024, most mangrove areas had recovered to conditions comparable to 2017 (gray, Figure A4, bottom), consistent with field results of forest structural assessments conducted in 2022 documenting canopy recovery and structural damage followed by resprouting and seedling recruitment (Ogurcak et al., in preparation). Persistent loss remained in localized areas (red), notably in eastern Aguirre State Forest and along Camino del Indio west of Jobos Bay NERR (Figure A4, bottom). Because the trajectory analysis followed pixels classified as mangrove in 2017, it quantified recovery of pre-existing mangrove areas rather than new mangrove establishment. Mapped mangrove gains visible in Figure A4 were outside the scope of the trajectory analysis and were not quantified separately.
Close-up views of eastern Aguirre State Forest (Figure S7) show loss of both coastal and inland mangroves. Former coastal mangrove zones are now classified as water or soil, with no vegetation recovery by 2024 along the coastal strip. Inland mangroves were also heavily affected in 2018, but many recovered by 2024; however, central forest areas transitioned to soil and remained non-vegetated.
A second area of concern is a small sector in the southwestern reserve where illegal expansion into protected lands has occurred. Along Camino del Indio, mangrove loss following Hurricane Maria has been compounded by residential encroachment into the reserve, leading to conversion of mangrove to developed surfaces and bare soil (Figure S8). A management brief from the Mangrove Coast Collaborative reports that mangrove loss in this area reached 37% immediately after the storm and increased to 45% by 2024 due to ongoing anthropogenic pressure [53]. Adjacent to the developed area, a rounded landform shows no inland mangrove canopy recovery, consistent with very high-resolution imagery from late 2023 showing standing dead trees and limited regeneration along the edges. This was a result of infilling of the tidal channel from Maria’s storm surge.
3.3. Higher-Temporal-Resolution Analysis of Disturbance and Recovery
Annual land-cover maps reveal storm-driven mangrove disturbance and recovery, but they cannot resolve shorter-term dynamics or seasonal variability. To capture these finer changes, high-temporal-resolution NDVI time series were analyzed for mangrove areas representing three post-storm response types: (a) less-impacted mangroves, (b) impacted but recovered mangroves, and (c) non-recovered mangroves. The NDVI was derived from single-date Sentinel-2 passes for both reserves and complemented with Landsat 8/9 imagery to extend the early record at Jobos Bay. NDVI climatologies were calculated from less-impacted regions, excluding data within one year after the storm, to avoid contamination by immediate disturbance. Similarly to the analysis of the land-cover maps, the NDVI analysis detected the effect of the 2017 storms but not of the 2022 storms.
3.3.1. Rookery Bay NDVI
Mangrove forests in Rookery Bay showed clear NDVI seasonality (Figure 6), with maxima of 0.88–0.89 between November and February and a minimum of 0.82 in June. The high NDVI values and small seasonal amplitude (~0.07) are typical of evergreen mangrove canopy conditions.
Less-impacted mangroves polygons still exhibited a post-storm NDVI decline, reaching 0.52 in October 2017 (about 0.16 below climatology), and recovered to climatological levels by September 2018 (Figure 6). These declines show that “less-impacted” areas still experienced measurable post-storm NDVI reductions and were not undisturbed.
In regions that were impacted but eventually recovered (Figure 7), the NDVI fell sharply after the storm and continued declining, reaching a minimum plateau between February and May of 2018 (0.49 ± 0.02; about 0.37 below climatology). The recovery of spectral greenness occurred in two phases: a rapid increase in the second half of 2018, followed by a slower rise until climatological values were reached by mid-2022, although the seasonal NDVI cycle re-emerged earlier in 2019 (Figure 7).
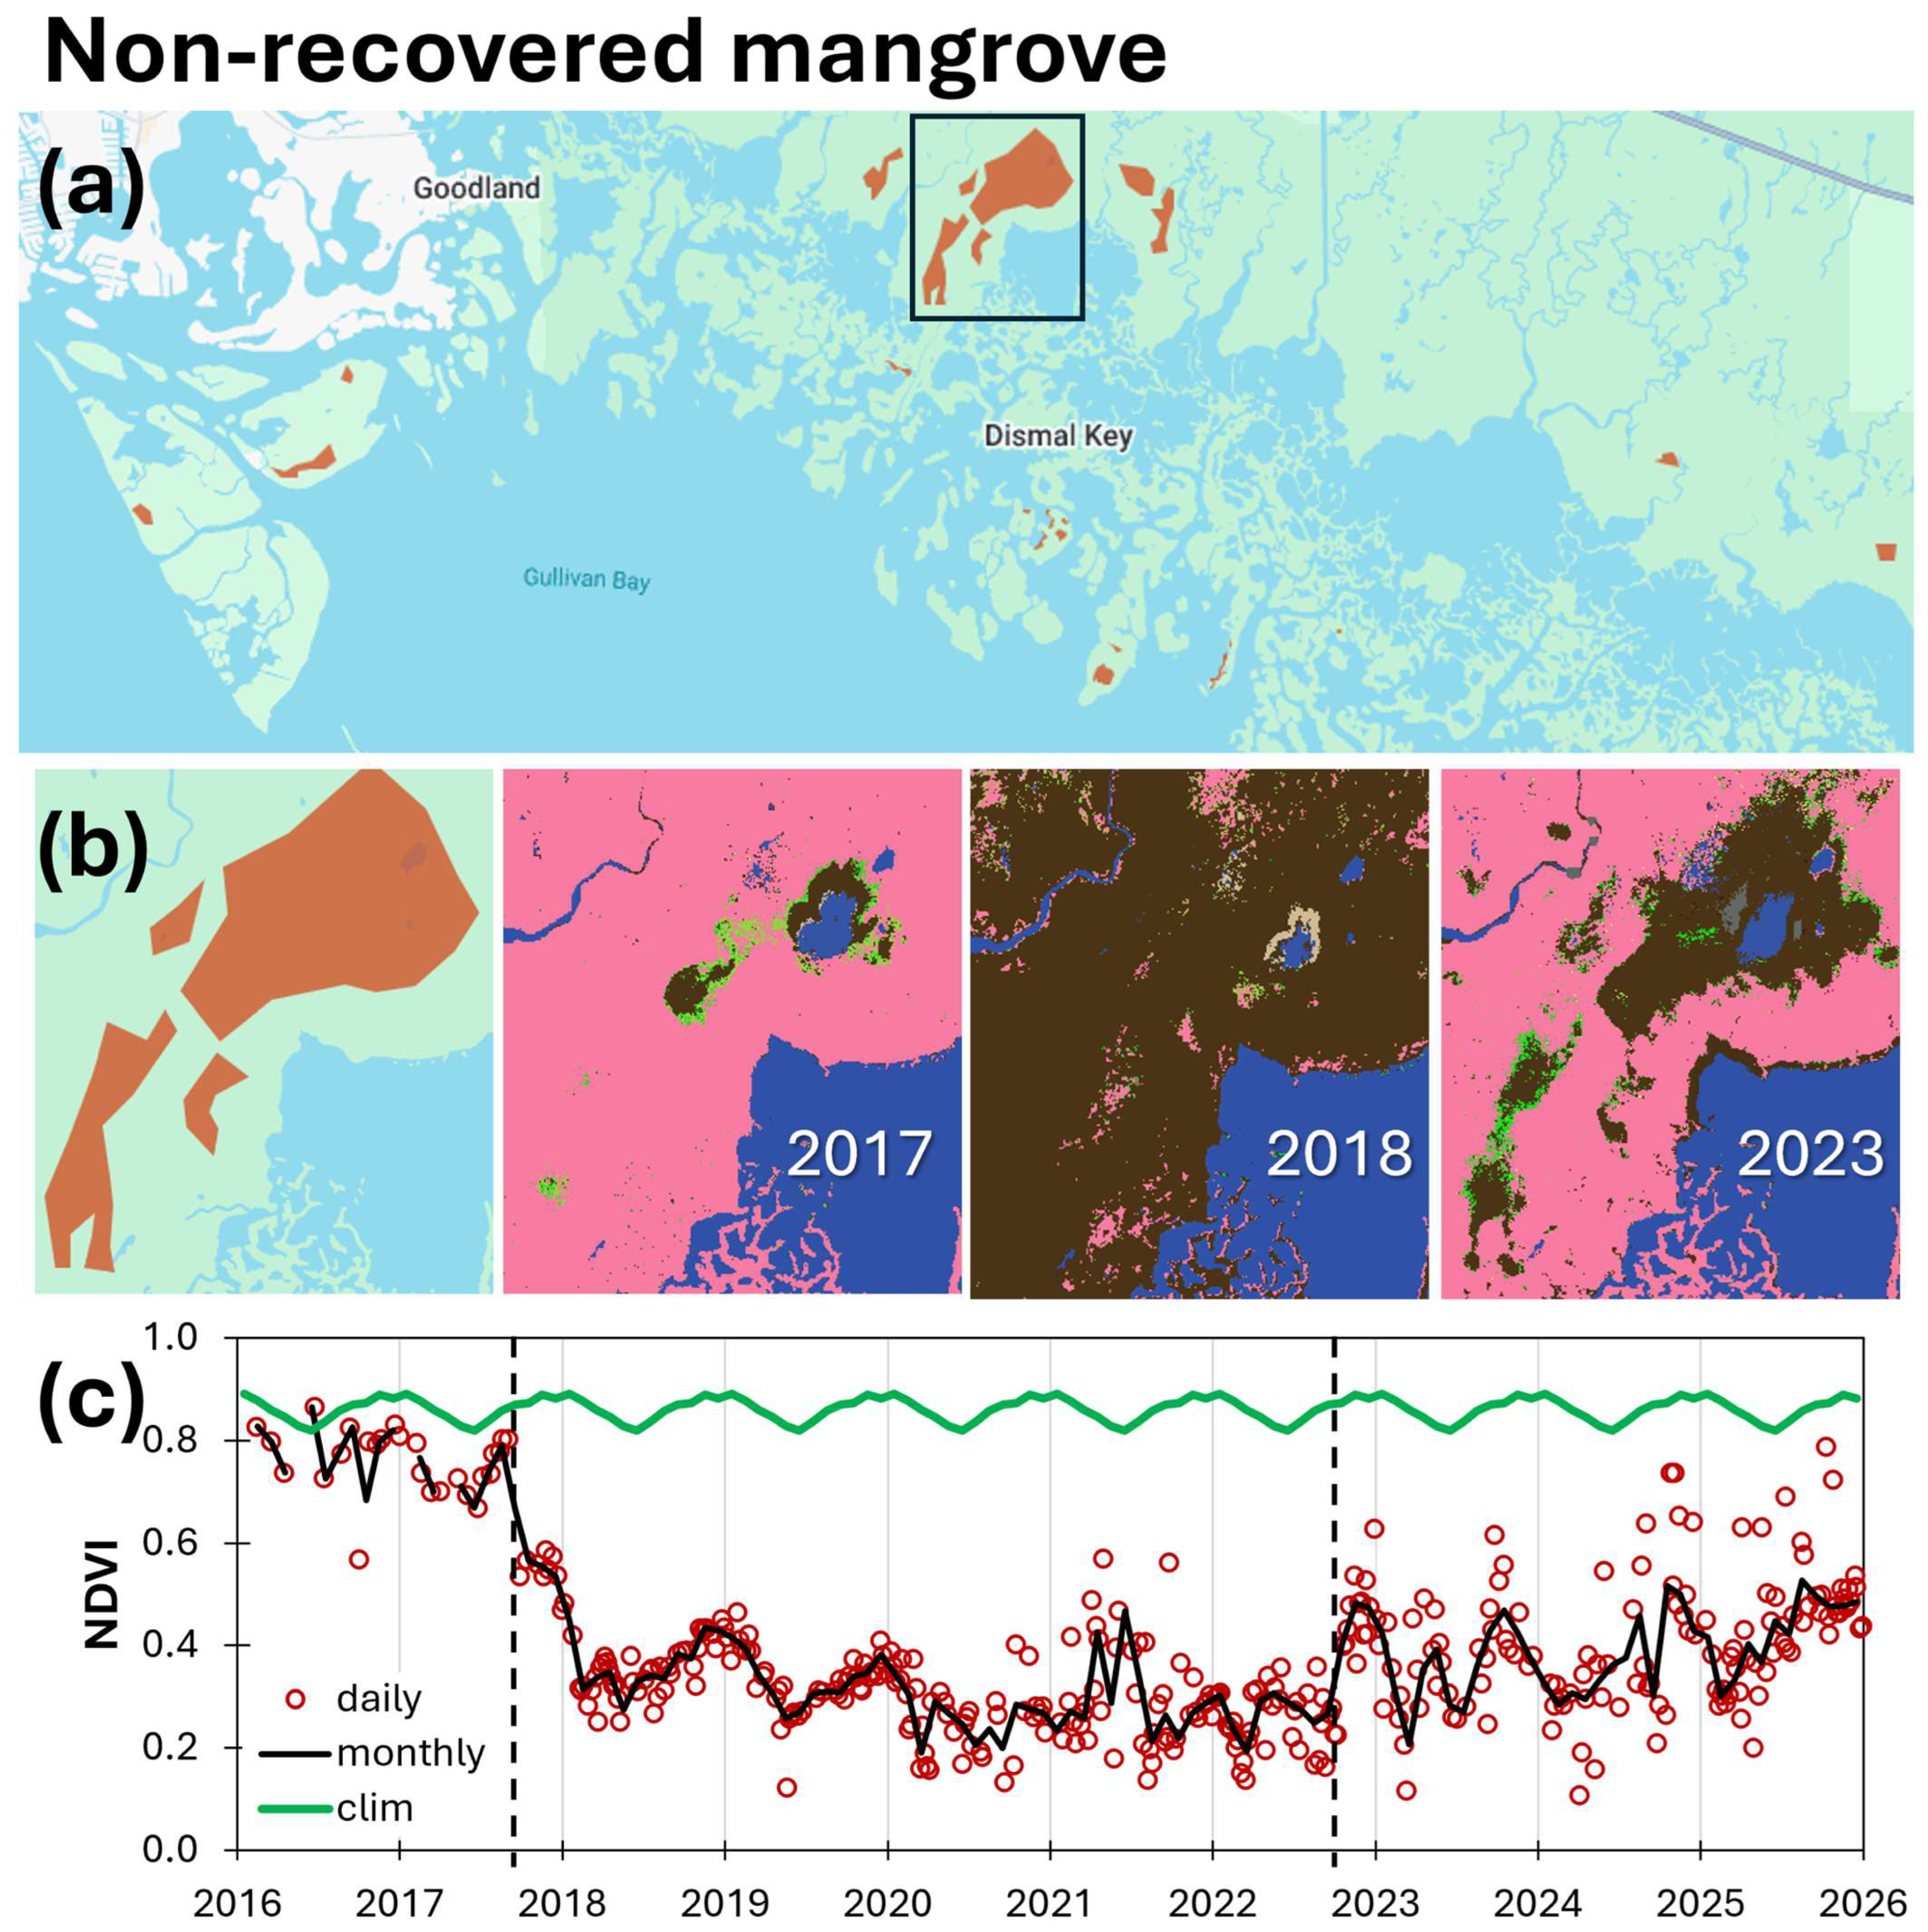
Non-recovered regions experienced a drastic NDVI decline immediately after the storm, reaching a minimum of 0.27 in May 2018 (Figure 8). The NDVI remained low through 2025 (average 0.34, SD 0.08), with a high temporal variability, suggesting heterogeneous and changing surface conditions that included some vegetation pixels. The pre-storm NDVI in these areas was already lower and more variable than the mangrove climatology (0.7–0.8). Pumpkin Bay (Figure 8b) illustrates a location where a lower pre-storm NDVI coincided with lack of post-storm recovery. A map of mangrove die-off in Rookery Bay NERR produced from 1999 digital orthophoto quadrangle imagery (Jill Schmid, personal communication) documented mangrove die-off in the southern part of the lagoon in 1999.
Figure 6.
Time series of the Normalized Difference Vegetation Index (NDVI) averaged over less-impacted mangrove areas in Rookery Bay. (a) Polygons delineating mangrove areas that were less-impacted by Hurricane Irma. (b) Example polygon highlighted in (a), with mangrove classification maps for 2017 and 2018, illustrating minimal change in mangrove cover. (c) NDVI time series (2016–2025), calculated from normalized and cloud-masked Sentinel-2 bands (see Figure S1) and averaged over the polygons shown in (a). This plot shows the monthly climatology calculated from the less-impacted NDVI time series, monthly averages, and individual observations from all available satellite passes. Vertical black dashed lines indicate the landfall dates of Hurricanes Irma (left) and Ian (right).
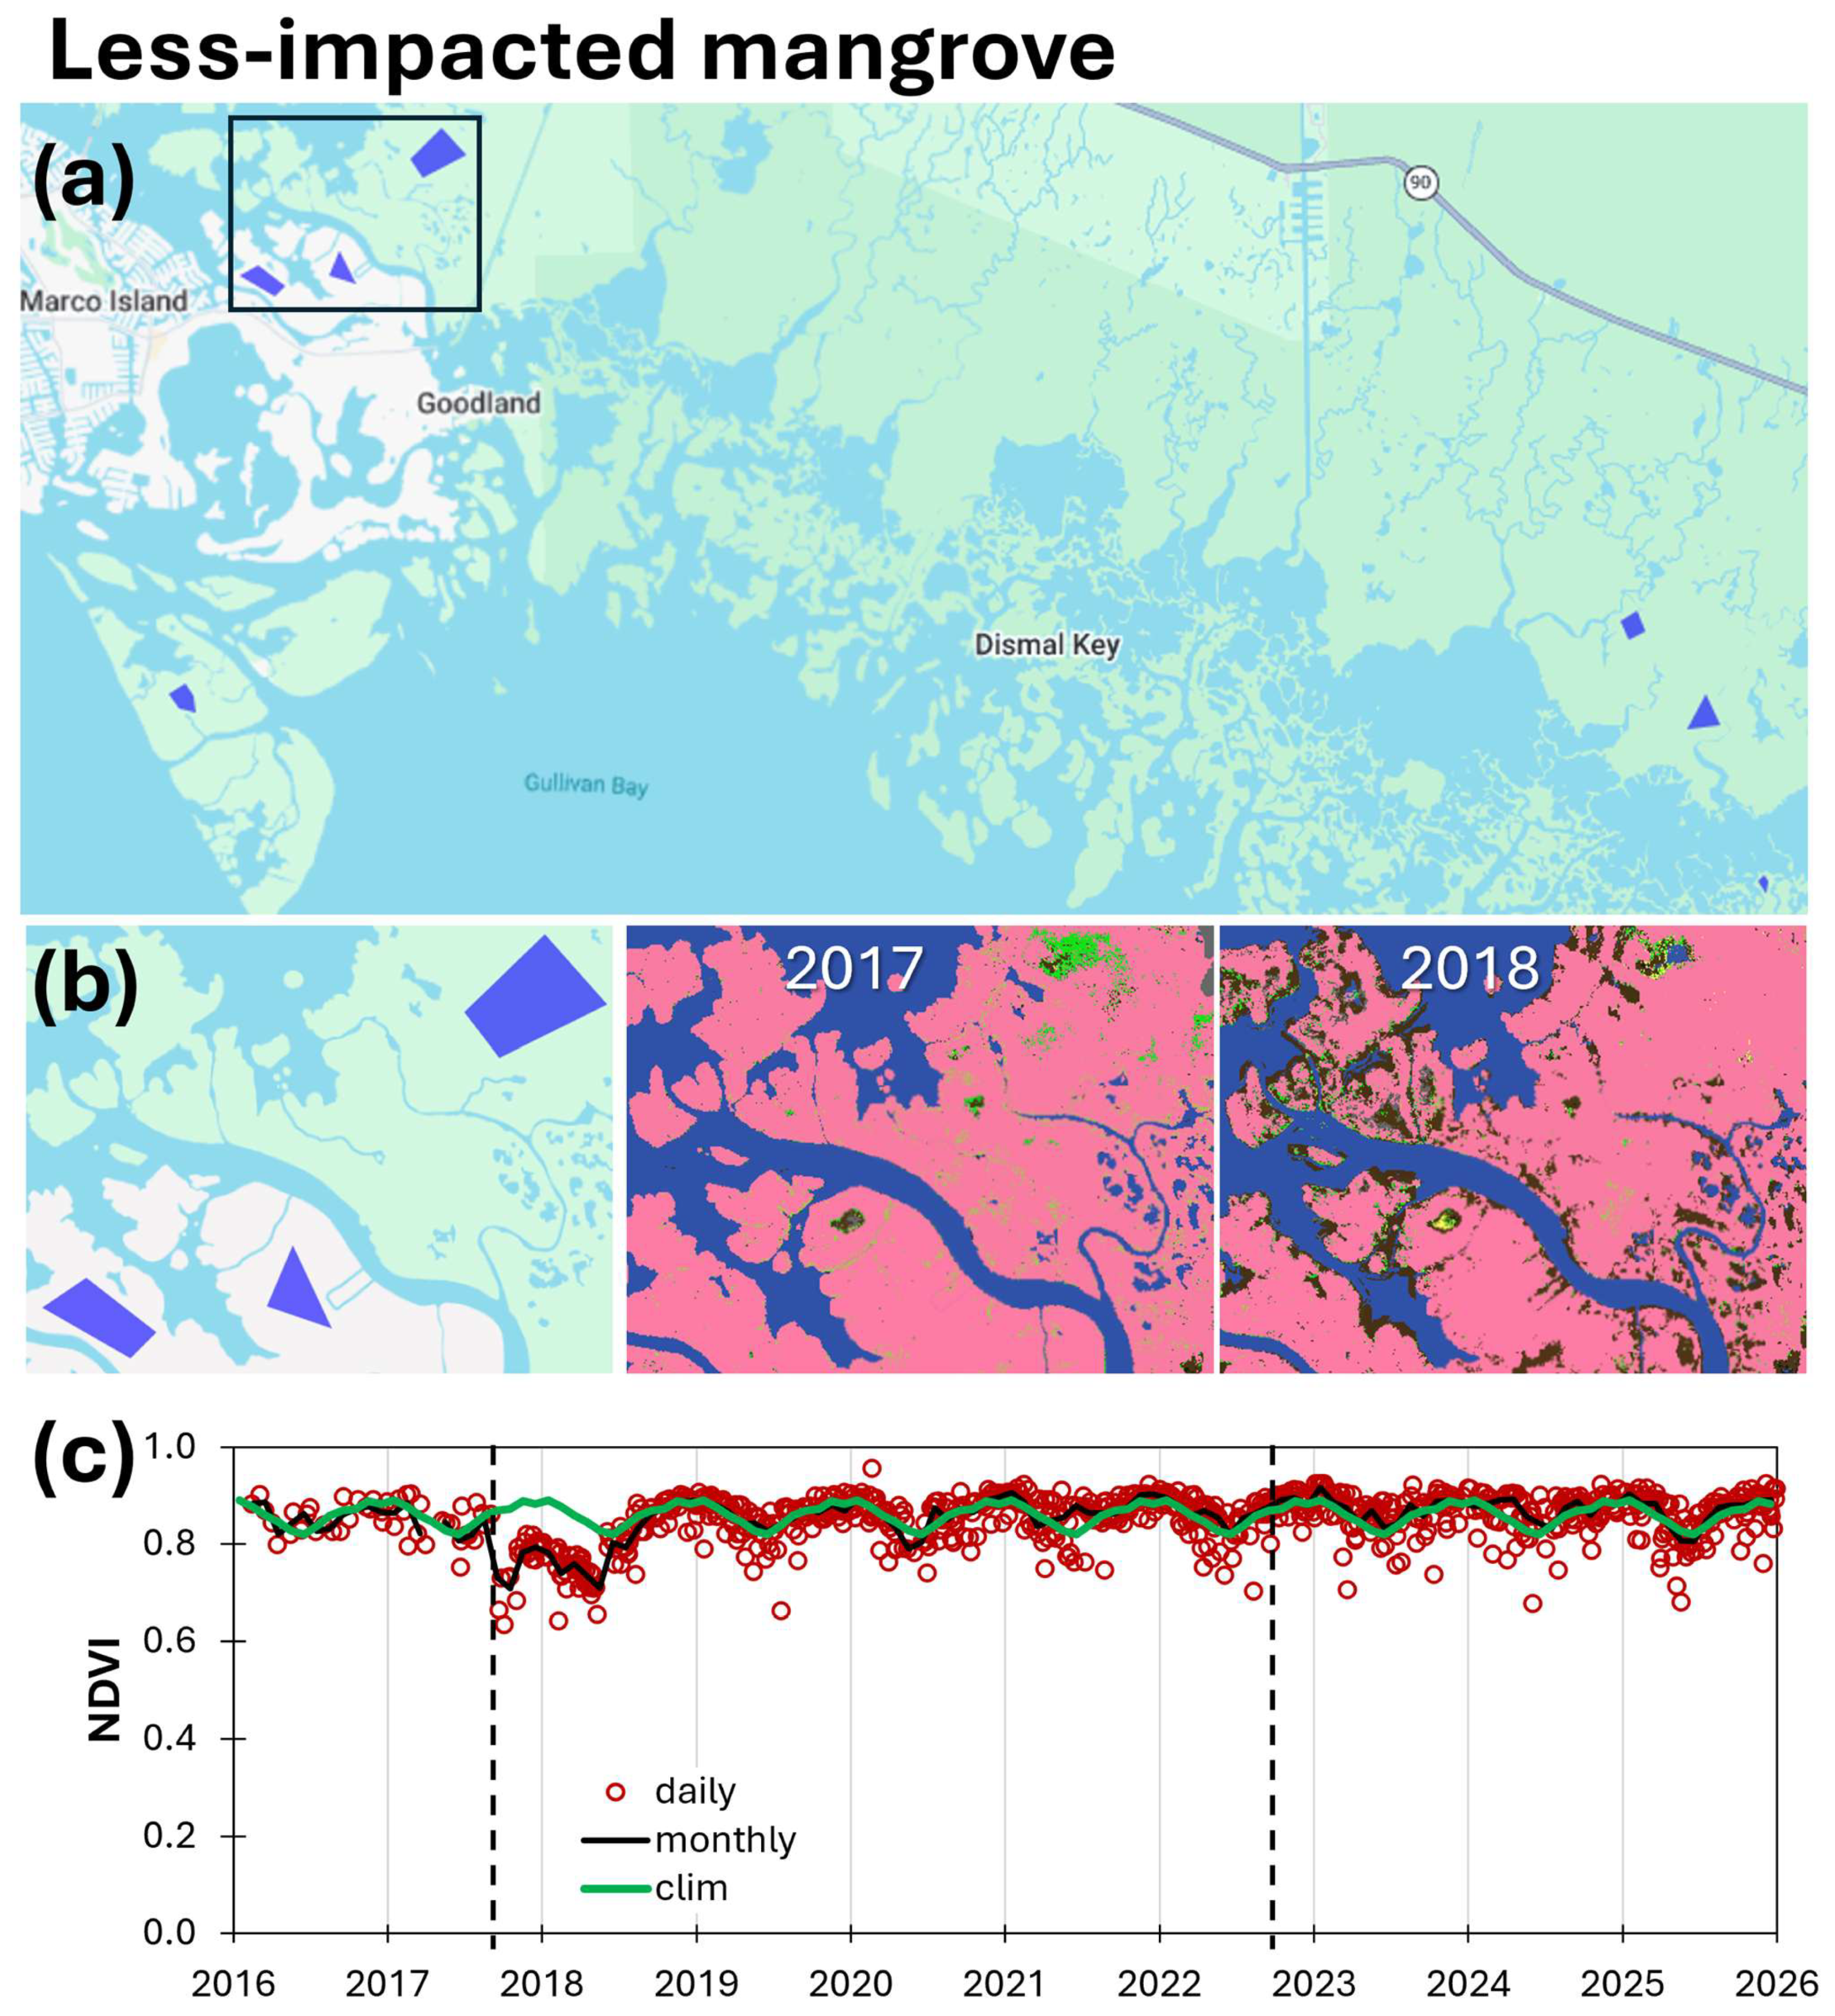
Figure 7.
Time series of NDVI averaged over recovered mangrove areas in Rookery Bay. (a) Polygons delineating mangrove areas that were degraded after the storms and subsequently showed mapped canopy recovery. (b) Example polygon highlighted in (a), with mangrove classification maps for 2017, 2018, 2020, and 2023, illustrating degradation in 2018 followed by a gradual, near-complete return of mapped mangrove canopy cover by 2023. (c) NDVI time series (2016–2025), calculated from normalized and cloud-masked Sentinel-2 bands (see Figure S1) and averaged over the polygons shown in (a). Monthly climatology calculated from the less-impacted NDVI time series, monthly averages, and individual observations from all available satellite passes. Vertical black dashed lines show the landfall dates of Hurricanes Irma (left) and Ian (right).
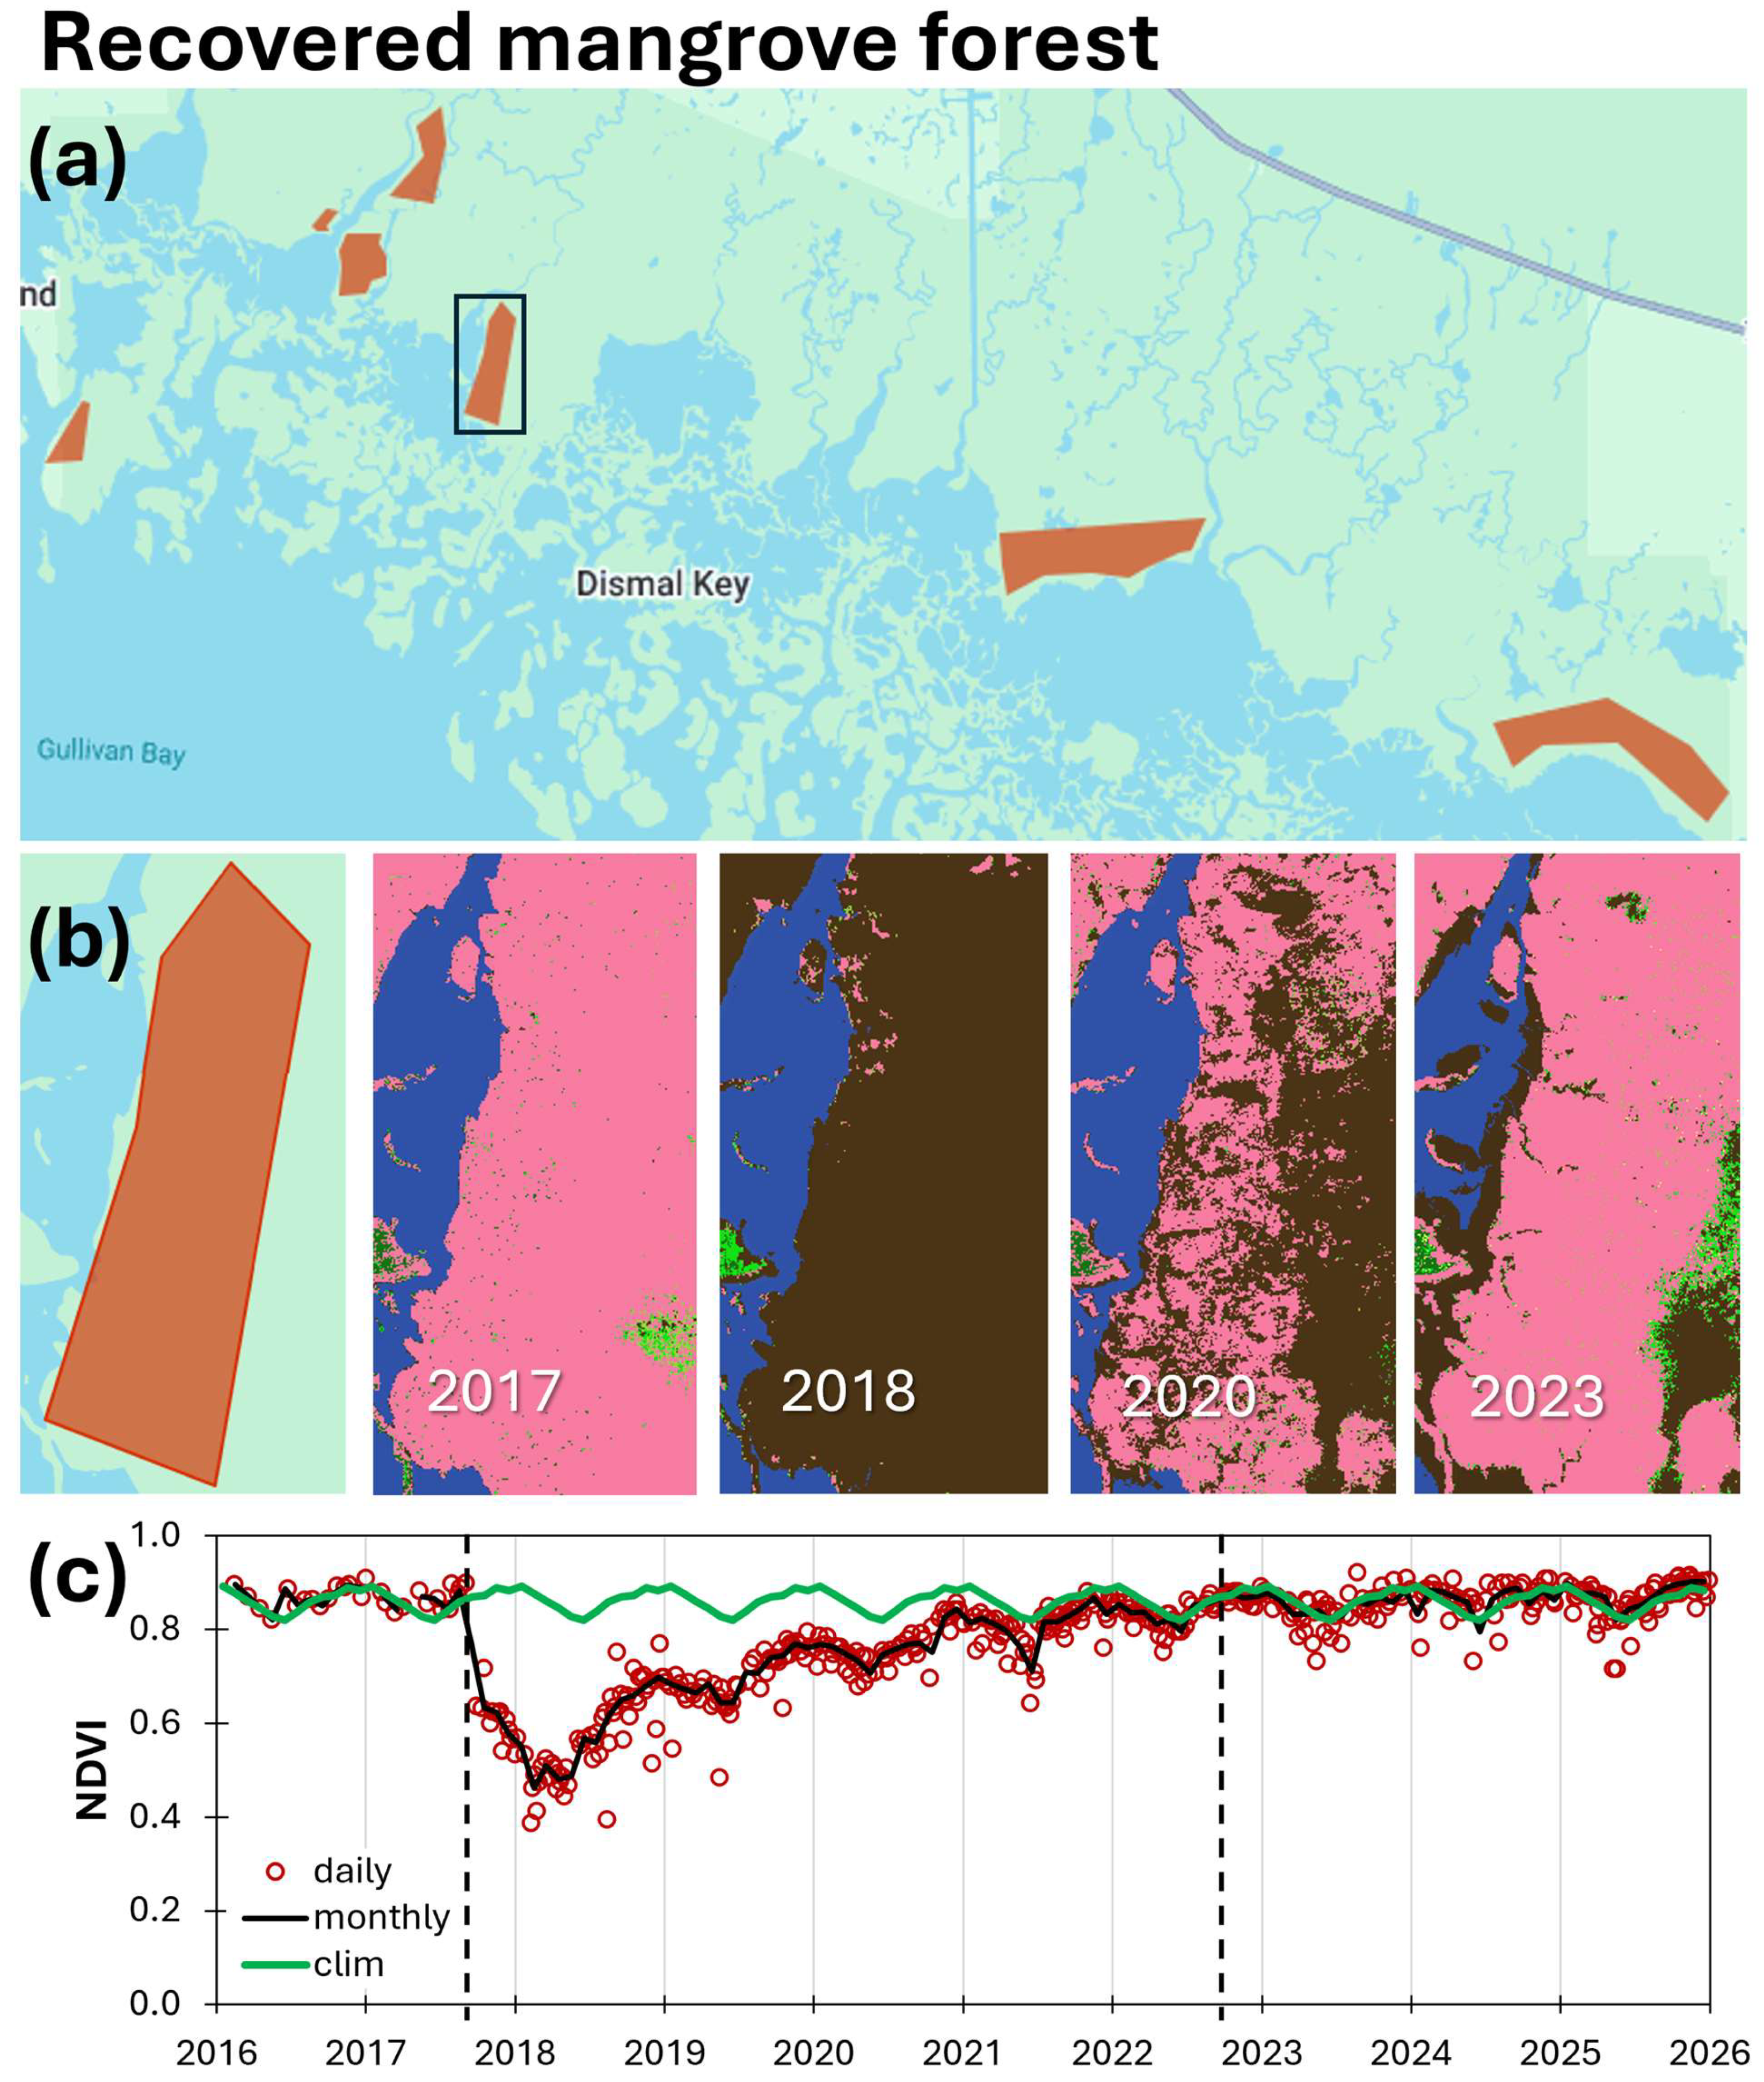
Figure 8.
Time series of NDVI averaged over non-recovered mangrove areas in Rookery Bay. (a) Polygons delineating former mangrove areas that showed little or no mapped canopy recovery by 2023. (b) Example polygon highlighted in (a), with mangrove classification maps for 2017, 2018, and 2023 illustrating the persistence of areas classified primarily as bare soil in the 2018 and 2023 maps. (c) NDVI time series (2016–2025), calculated from normalized and cloud-masked Sentinel-2 bands (see Figure S1) and averaged over the polygons shown in (a). The plot shows the monthly climatology calculated from the less-impacted NDVI time series, monthly averages, and individual observations from all available satellite passes. Vertical black dashed lines indicate the landfall dates of Hurricanes Irma (left) and Ian (right).
In Rookery Bay, the pre-storm mean monthly Sentinel-2 NDVI (January 2016–August 2017) was high in all three groups: less-affected, 0.85 ± 0.03 (n = 18); recovered, 0.87 ± 0.02 (n = 17); and non-recovered, 0.79 ± 0.04 (n = 17). During the late post-storm period (2022–2025; n = 48 per group), the mean NDVI in the non-recovered group (0.51 ± 0.08) was more than 40% lower than in the less-affected (0.87 ± 0.02) and recovered (0.86 ± 0.03) groups. Values are means ± standard deviations across available monthly observations.
The mean monthly NDVI was compared between groups using paired two one-sided equivalence tests (TOST; ref. [54]), with observations paired by calendar month. Comparisons were conducted separately for the pre-storm and late post-storm periods, using 17 and 48 matched months per comparison, respectively. Following the principle that equivalence bounds should reflect the study context [54,55], we defined practical equivalence as a mean NDVI difference within ±1 standard deviation of the less-affected reference series. This criterion assessed whether between-group differences were small relative to background temporal variability in the reference NDVI. The reference SD was calculated over 2016–2025, excluding the storm-disturbance interval of September 2017–May 2018 (Figure 6), yielding equivalence bounds of ±0.026945 NDVI (109 observations). The unrounded SD was used in all calculations. Holm correction [56] was applied to the three pairwise comparisons within each period, with equivalence assessed at an adjusted significance level of 0.05.
During 2022–2025, the less-affected and recovered groups exhibited an equivalent mean NDVI under the predefined reference-SD criterion (less-affected minus recovered = 0.012; Holm-adjusted p = 1.14 × 10⁻⁵). Pre-storm equivalence between these groups was not established after Holm adjustment, although the result was borderline (mean difference = −0.015; Holm-adjusted p = 0.0553). Equivalence was not established for comparisons involving the non-recovered group in either period. During the pre-storm period, the non-recovered group had a lower mean NDVI than the less-affected and recovered groups, with mean differences of 0.066 and 0.081, respectively. During 2022–2025, the corresponding differences were 0.363 and 0.351. Both late post-storm differences exceeded the predefined equivalence margin.
These results indicate that, during the late post-storm period, the non-recovered group had a substantially lower mean NDVI than the less-affected and recovered groups. The lower pre-storm NDVI of the non-recovered group also suggests that these areas may have experienced pre-existing stress or other conditions associated with lower vegetation greenness.
3.3.2. Jobos Bay NDVI
In Jobos Bay, three regions capturing different post-storm impact and recovery levels were identified: (1) a less-impacted region in northeast Mar Negro, (2) an impacted but recovered region in northwestern Aguirre State Forest, and (3) a non-recovered region showing low mangrove reclassification in the eastern Aguirre State Forest, spatially separated from the recovered area (Figure 9).
Because no Sentinel-2 observations were available for Jobos Bay before December 2018, Landsat 8 and 9 NDVIs were used to extend the record before Sentinel-2 observations. Landsat and Sentinel-2 NDVI time series were plotted separately but interpreted jointly to track vegetation dynamics following Hurricane Maria (Figure 10). Inter-sensor consistency was assessed during the overlap period (2019–2025) using group-averaged monthly NDVI pairs (n = 78). Linear regressions showed consistent relationships between Landsat and Sentinel-2 NDVIs, with the two sensors generally showing similar temporal patterns of variation for the less-impacted (slope = 0.55, intercept = 0.37, r = 0.62), recovered (slope = 0.72, intercept = 0.21, r = 0.70), and non-recovered groups (slope = 1.28, intercept = −0.21, r = 0.80). Across groups and months, mean biases were −0.010, −0.019, and −0.051 NDVI for the less-impacted, recovered, and non-recovered groups, respectively; mean absolute errors (MAE) were 0.034, 0.036, and 0.078, respectively; and root-mean-square errors (RMSEs) were 0.045, 0.047, and 0.087, respectively. These differences were small relative to the seasonal amplitude (~0.12 NDVI) and much smaller than hurricane-related disturbances, with month-to-month NDVI declines exceeding 0.30 following Maria in impacted regions (Figure 10). Thus, although some systematic differences occurred between sensors, particularly for the non-recovered group, inter-sensor discrepancies were generally smaller than seasonal variability and substantially smaller than the magnitude of disturbance, supporting the combined interpretation using both data sets. The post-storm NDVI reduction and rapid recovery occurred mostly from late 2017 through 2018; therefore, the timing of these changes during this period was assessed visually using only the Landsat time series (Figure 10).
Figure 9.
Polygons with different mapped mangrove canopy recovery stages following Hurricane Maria in Jobos Bay, Puerto Rico. (a) Polygons delineating less-impacted mangrove areas with minimal storm influence, degraded mangroves that recovered over time, and areas with low mangrove reclassification as of 2024. (b) These regions were delineated using annual habitat maps from before (2017), shortly after (2018), and six years after (2024) Hurricane Maria. These polygons were used to extract spatially averaged satellite-derived NDVI time series (Figure 10).
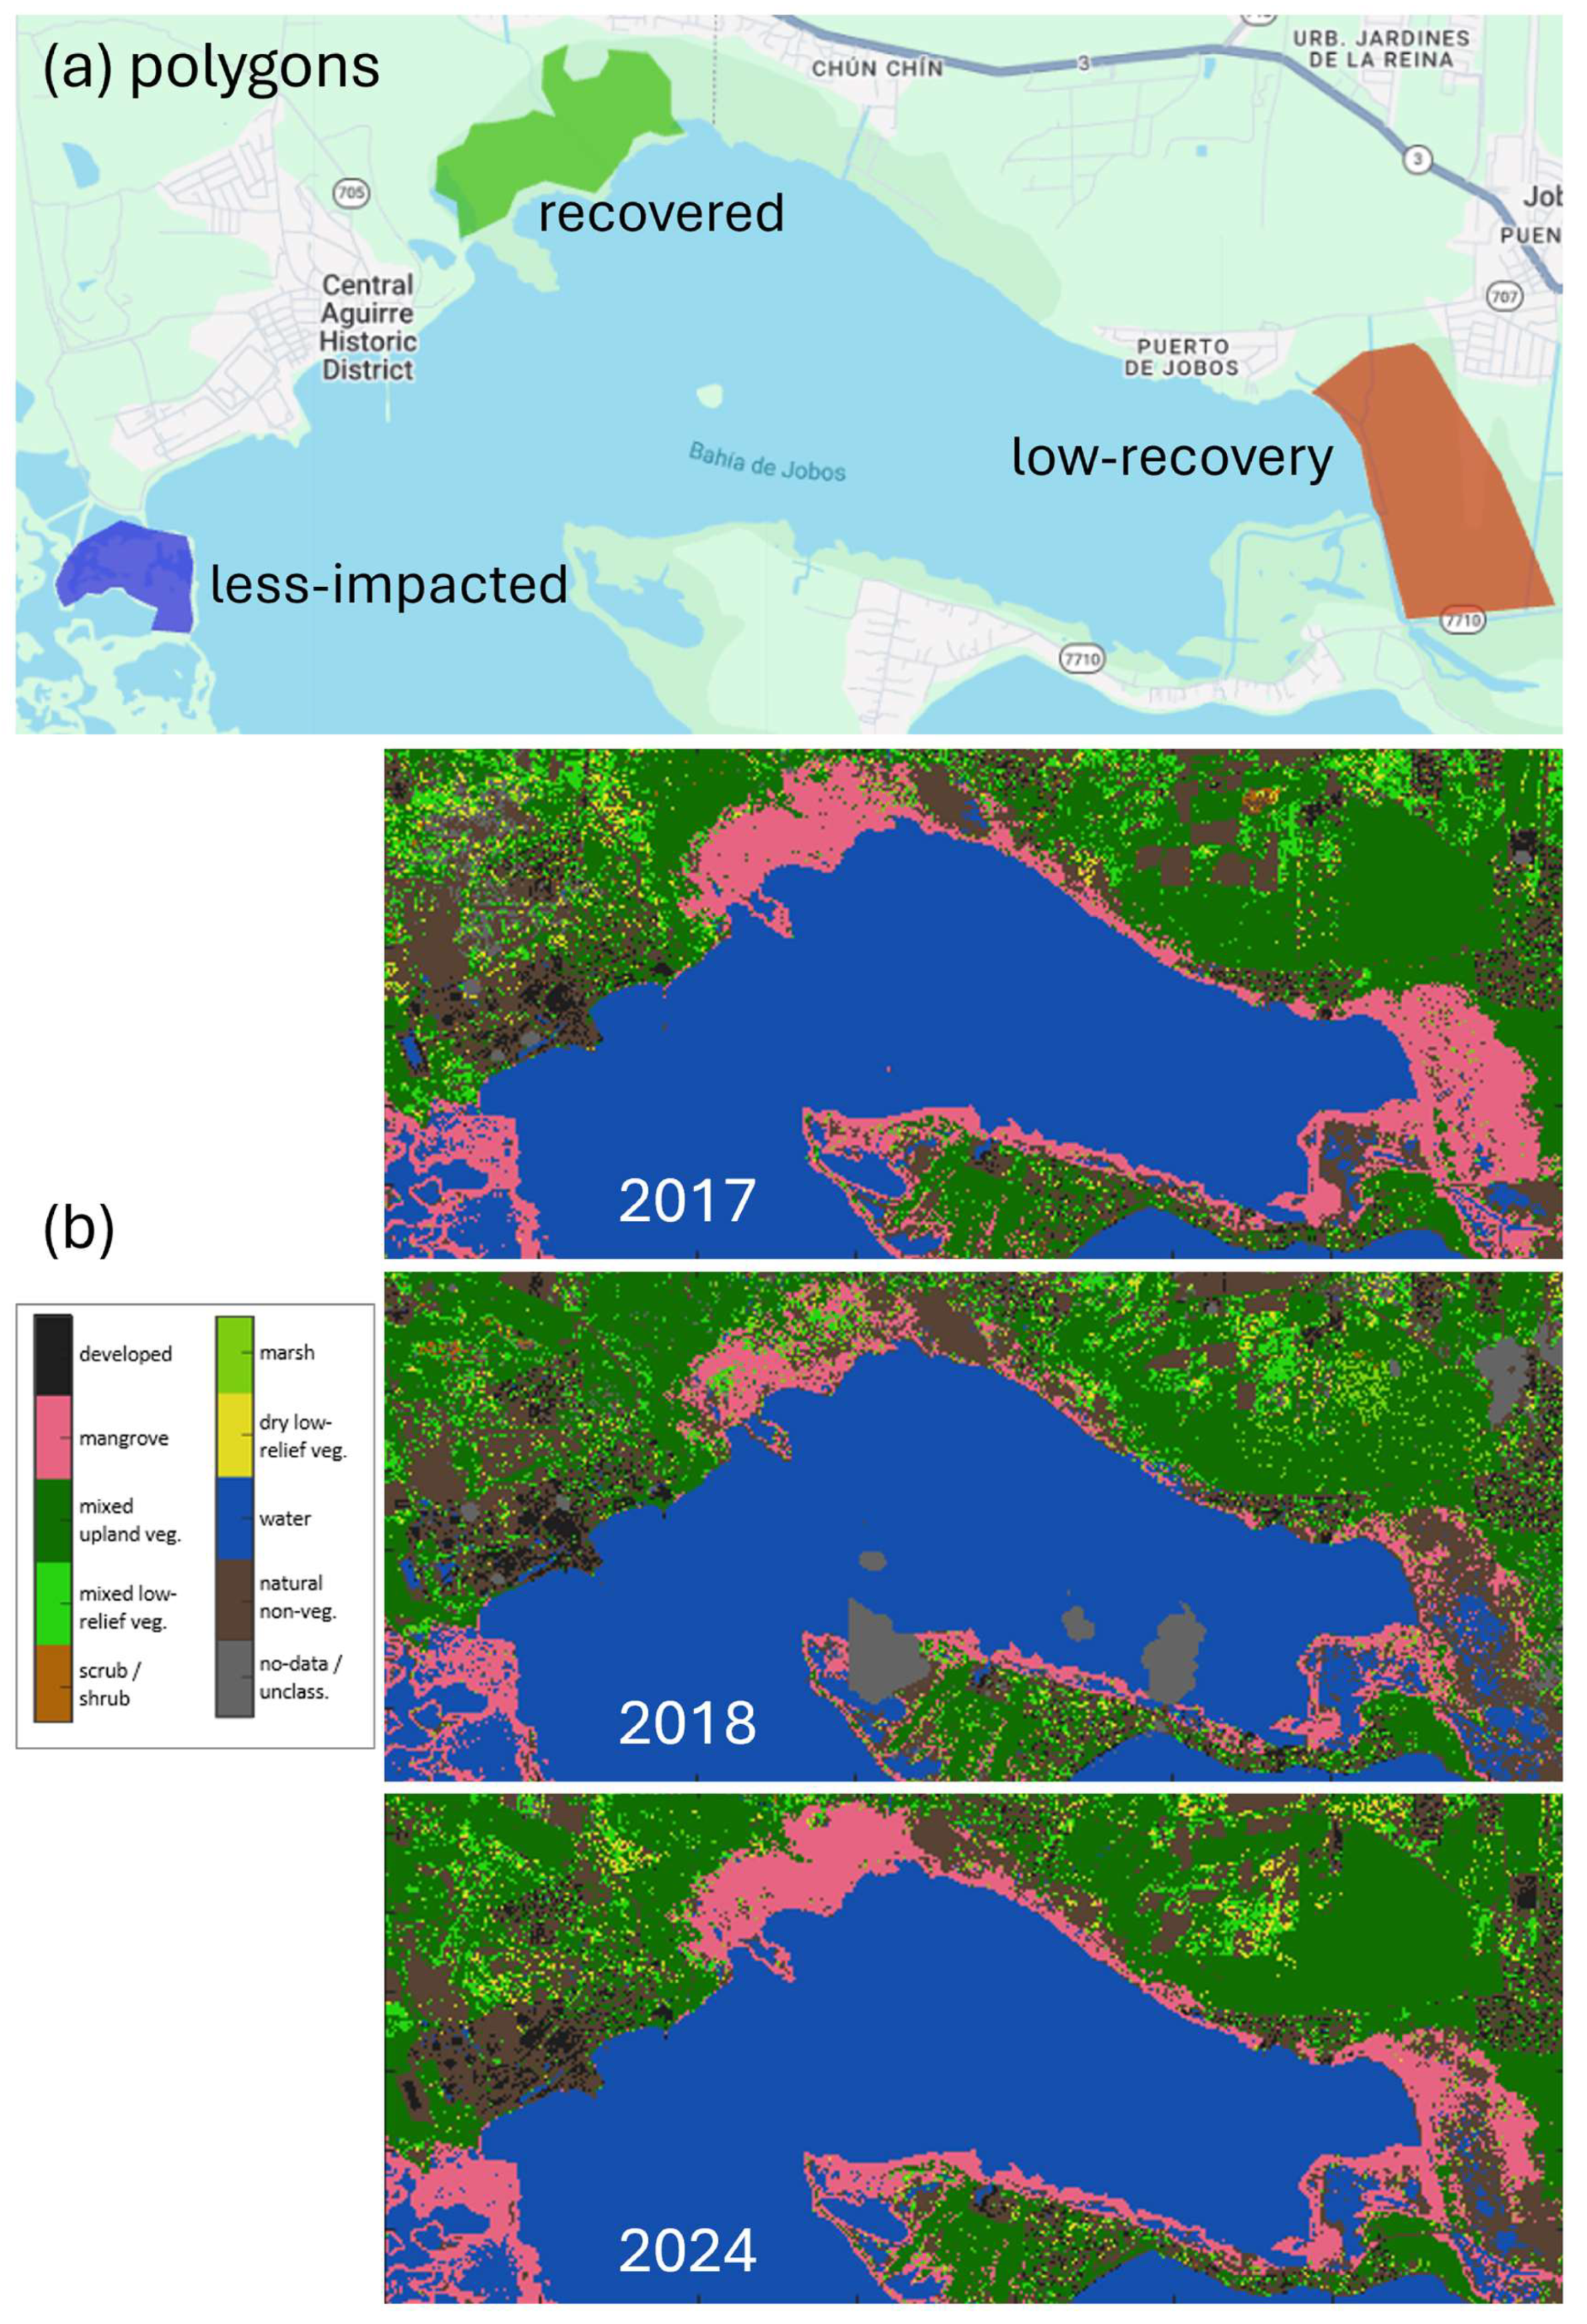
Figure 10.
Time series (2016–2025) of the Normalized Difference Vegetation Index (NDVI) for the three post-storm mangrove response types in Jobos Bay (less-impacted, recovered, and non-recovered; see polygons in Figure 9). Sentinel-2 data were not available for this region prior to 2019; therefore, Landsat 8 and 9 observations were used to ensure continuity of the time series. NDVI estimates from Sentinel (S) and Landsat (L) are comparable and exhibit consistent seasonal variability, however, they were kept separated. The NDVI monthly climatology was computed using the Sentinel-derived NDVI time series from the less-impacted polygon. Single-date observations from every available satellite pass and monthly means are shown. Vertical black dashed lines show the landfall times of Hurricanes Maria (left) and Fiona (right).
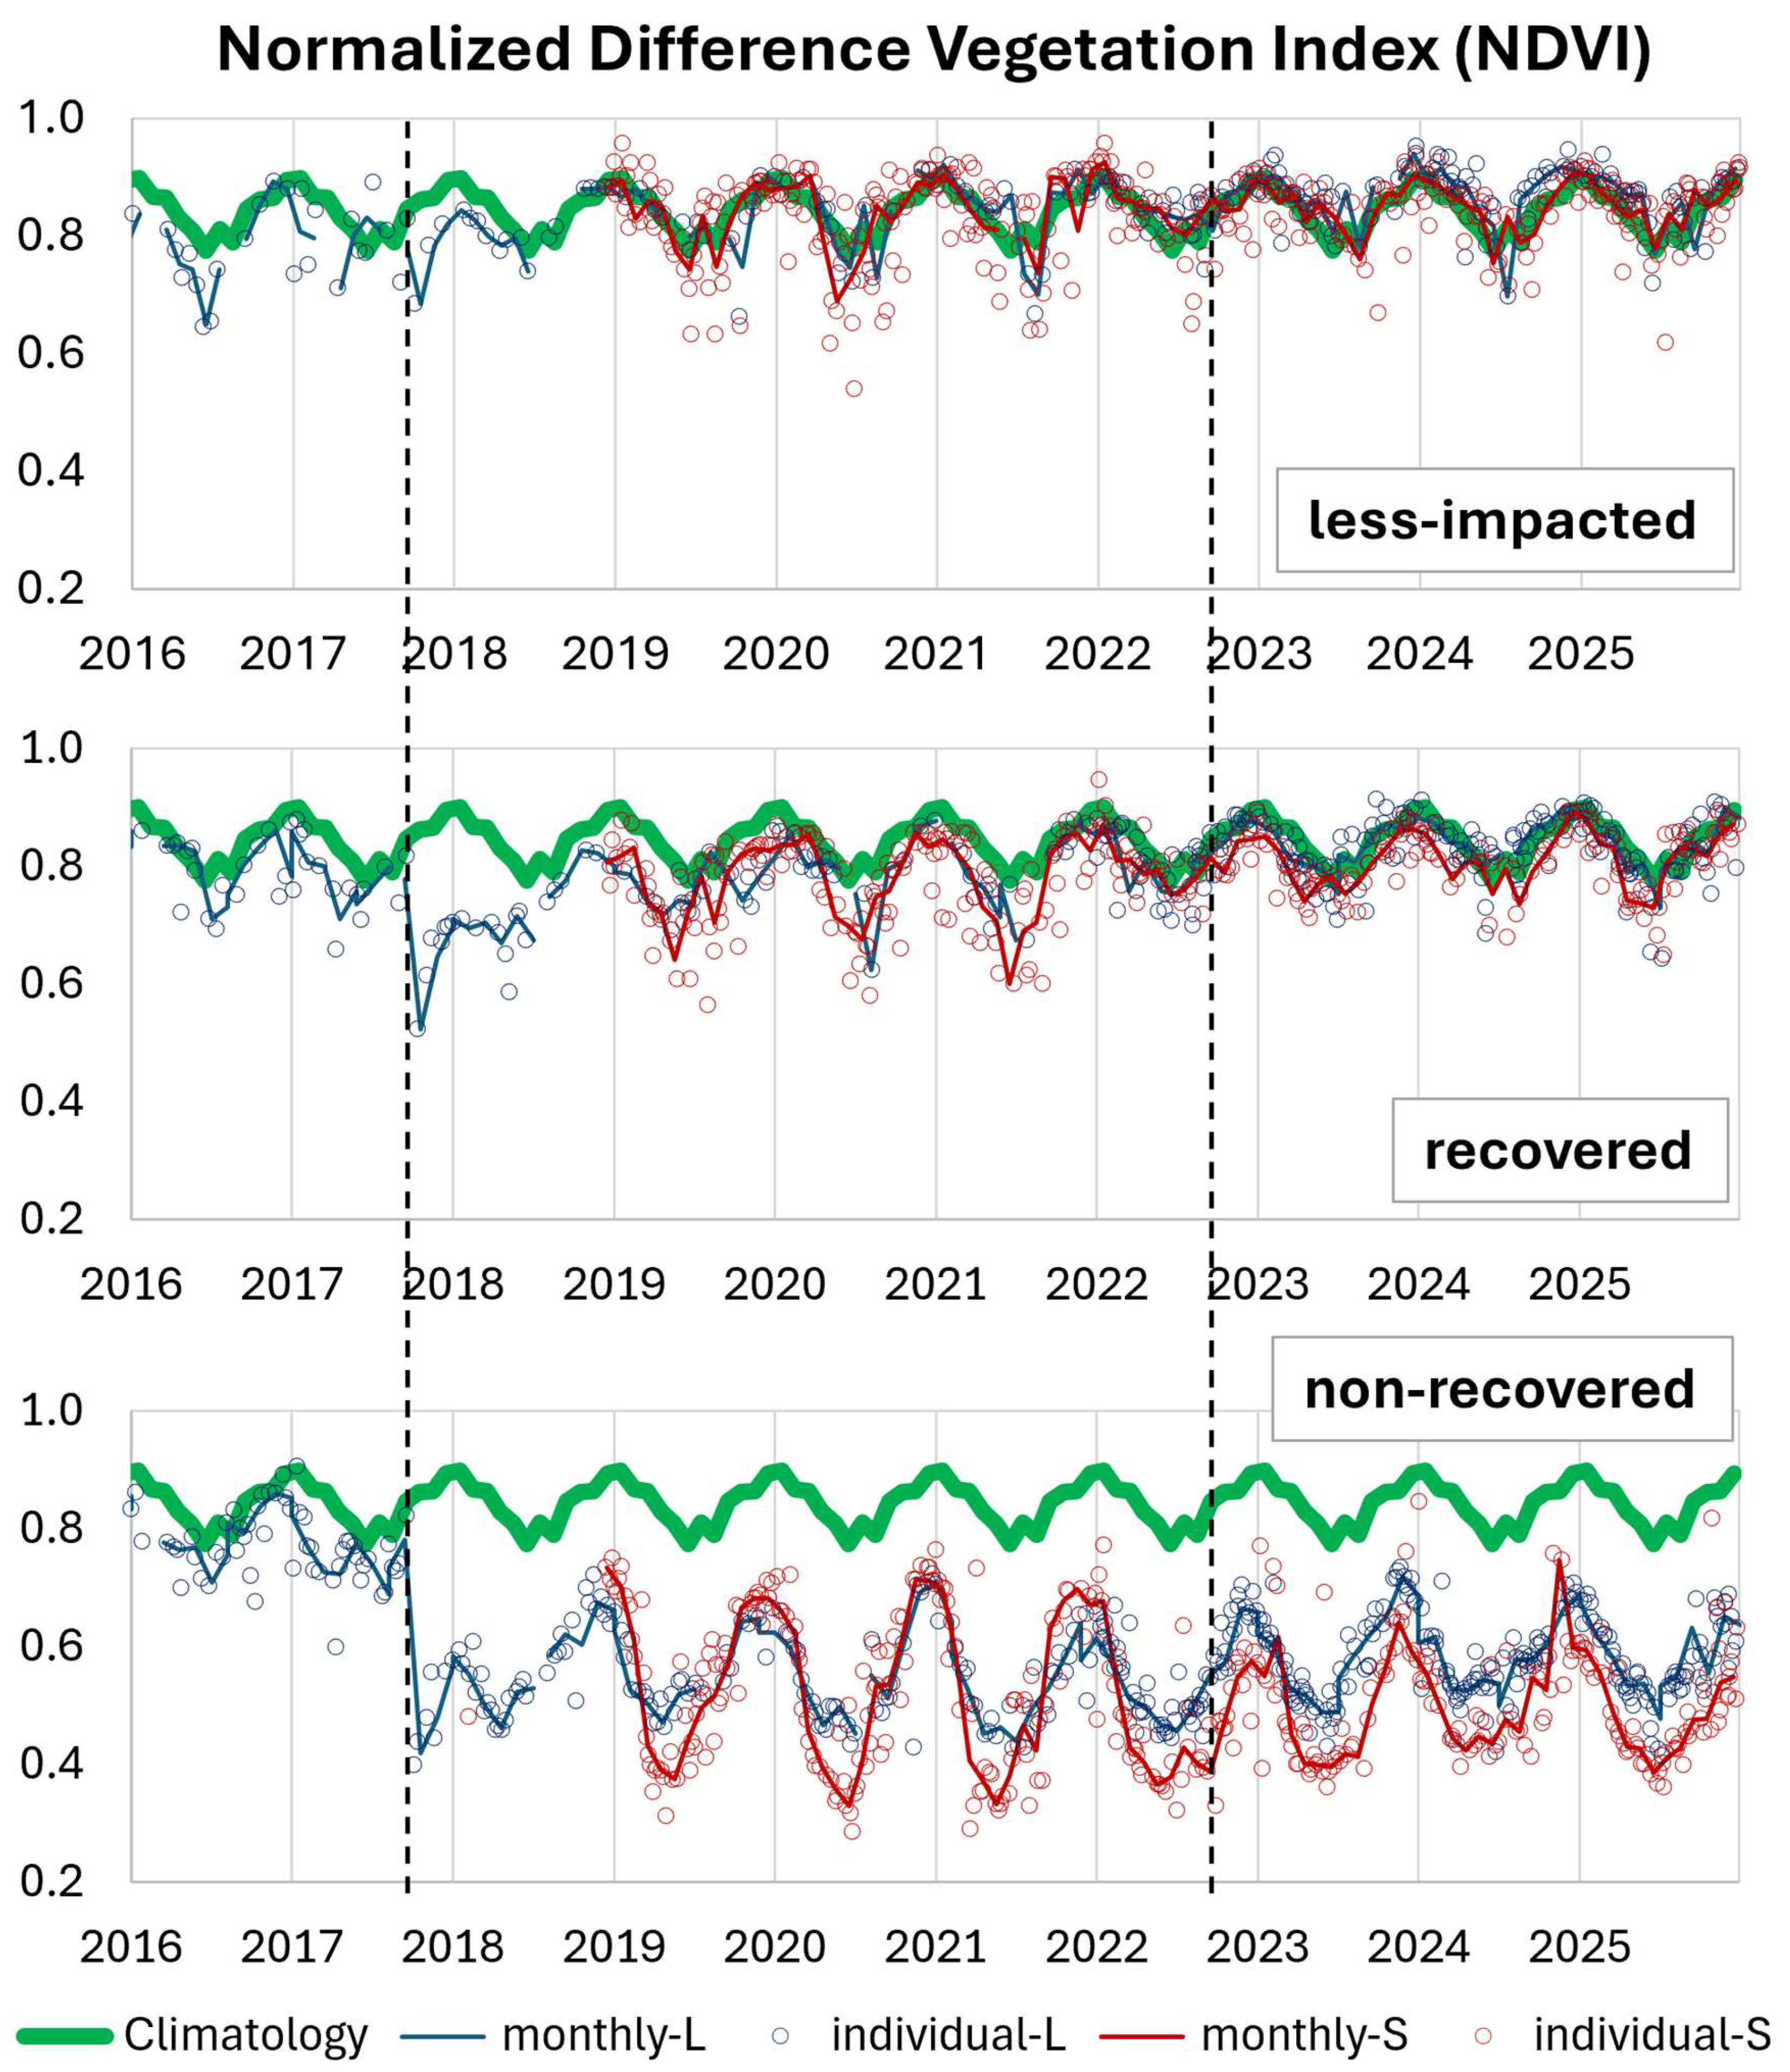
NDVI seasonality for Jobos Bay was defined from Sentinel-2 observations in the less-impacted polygon (2019–2025). The NDVI seasonal amplitude was 0.124 (Figure 10); the NDVI seasonal maximum and lowest variability occurred in December–January (mean 0.90 ± 0.01), whereas the NDVI seasonal minimum and highest variability occurred in June–August (0.79 ± 0.04).
Following Hurricane Maria (September 2017), the less-impacted region still showed a small NDVI decline of 0.68 in October (−0.18 relative to climatology), then a rapid rebound to 0.80 in November (+0.12 in one month). The NDVI returned to near-climatological values by May 2018 (Figure 10, top).
The recovered region experienced a larger post-storm NDVI reduction, reaching 0.52 in October 2017 (−0.34 from climatology). However, the NDVI rose quickly in November (0.65; +0.13) and started to show seasonality in 2019 although with lower seasonal minimums compared to the climatology. It took until 2022 for the seasonal low to also reach climatological conditions, with both the mean NDVI and the seasonal amplitude restored (Figure 10, middle). In Jobos Bay, the NDVI started to increase over a month after the storm (November 2017), while in Rookery Bay, the NDVI continued to decline several months after the storm, until June 2018, when it started to rise (Figure 7).
The low-recovery region in eastern Aguirre State Forest showed the strongest disturbance signal, with the NDVI dropping to 0.42 in October 2017 (−0.44 relative to climatology; Figure 10, bottom). The subsequent rebound was limited (0.48 in November; +0.06), and the NDVI never returned to pre-storm levels. Seasonality gradually re-emerged from late 2018 and became broadly synchronized with the regional climatological cycle by ~2023, but the absolute NDVI remained markedly lower. By 2024, about half of this polygon showed mangrove reclassification (Figure 9); therefore, the polygon-averaged NDVI reflects a mixture of mangrove vegetation, exposed soil, and open water, explaining the persistence of seasonal variability despite the reduced mean NDVI.
In Jobos Bay, the pre-storm mean monthly Landsat NDVI (January 2016–August 2017) was comparable across the three groups: less-affected, 0.79 ± 0.06 (n = 16); recovered, 0.79 ± 0.05 (n = 18); and non-recovered, 0.78 ± 0.05 (n = 19). During 2022–2025, both sensors recorded the lowest mean NDVI in the non-recovered group. Landsat means were 0.86 ± 0.05 for the less-affected group (n = 46), 0.83 ± 0.04 for the recovered group (n = 47), and 0.57 ± 0.07 for the non-recovered group (n = 48). Corresponding Sentinel-2 NDVI means were 0.85 ± 0.04, 0.81 ± 0.04, and 0.49 ± 0.09, respectively (n = 48 per group). Values are means ± standard deviations across available monthly observations.
Because the Landsat NDVI time series covered both periods, it was used for paired TOST comparisons following the approach described for Rookery Bay in the previous section. Each comparison included all available matched monthly observations: 16–18 pairs before the storm and 45–47 pairs during 2022–2025. Equivalence bounds were defined as ±1 standard deviation of the less-affected reference series over 2016–2025, excluding September–November 2017 (Figure 10). The resulting bounds were ±0.057755 NDVI (105 observations), with the unrounded SD used in all calculations.
Under the predefined reference-SD criterion, all three groups exhibited pairwise equivalent mean NDVI before the storm (Holm-adjusted p ≤ 0.00131). During the late post-storm period (2022–2025), equivalence was supported between the less-affected and recovered groups (Holm-adjusted p = 1.18 × 10⁻⁶), but not for comparisons involving the non-recovered group. Based on the paired comparisons, the mean NDVI in the non-recovered group was 0.290 lower than in the less-affected group and 0.257 lower than in the recovered group. Both differences exceeded the predefined equivalence margin.
These results indicate that, during the late post-storm period, the non-recovered group had a substantially lower mean NDVI than the less-affected and recovered groups, whereas all three groups exhibited equivalent mean NDVIs before the storm under the predefined criterion.
Together, the three mangrove response groups captured a gradient of greenness recovery in Bahía de Jobos (Figure 9 and Figure 10): (a) less-impacted, with increased greenness within months; (b) recovered with large initial decline followed by gradual increase of greenness over ~3–4 years; and (c) low-recovery, with the strongest decline and incomplete greenness recovery even eight years after the storm.
3.3.3. NDVI Variability Within Areas and Between Polygons
The NDVI time series differed within the three post-storm response areas. The mean within-area NDVI represents the level of vegetation greenness for the three mangrove response groups. In both regions, the mean NDVI was highest for less-impacted mangroves, followed by recovered mangroves, and lowest for non-recovered mangroves (Rookery Bay: 0.85, 0.72, and 0.48, respectively; Jobos Bay: 0.83, 0.78, and 0.52, respectively). Within-area spatial variability was assessed using the standard deviation of pixel-level NDVI values as a measure of spatial heterogeneity within each area. Spatial variability also showed gradation, with the lowest variability in less-impacted mangroves, followed by recovered mangroves, and the highest variability in non-recovered mangroves (Rookery Bay: 3.4%, 12.35%, and 43.79%, respectively; Jobos Bay: 8.6%, 9.5%, and 34.5%, respectively). The mapped patterns in the eastern Aguirre Forest provide an example of high spatial variability in an area with limited mangrove reclassification (Figure 9), where areas of mangrove and other vegetation occurred alongside areas with no vegetation as of 2024.
Between-polygon variability was not estimated for Jobos Bay because only one polygon was available for each response group. Rookery Bay had multiple polygons for each response group (Figure 6, Figure 7 and Figure 8), and therefore, between-polygon variability was assessed using the RMSE among polygon-level NDVI time series. Between-polygon variability increased from the less-impacted to the recovered and not-recovered groups. The mean between-polygon RMSE was 0.017 NDVI units (2.0% of the mean NDVI) for less-impacted polygons, 0.039 (5.0%) for recovered polygons, and 0.098 (20.6%) for not-recovered polygons. The corresponding median RMSE values were 0.013, 0.031, and 0.093, respectively, showing the same pattern. Thus, the greater between-polygon variability observed for non-recovered mangroves indicates that areas of persistent non-recovery were spatially heterogeneous, with greater differences among individual areas than observed for less-impacted and recovered mangroves. This result is consistent with the greater within-area spatial variability observed for non-recovered mangroves, indicating greater spatial heterogeneity at both spatial scales.
The consistency of the NDVI patterns was supported by the results of methodological sensitivity and inter-sensor assessments. The near-equivalence of NDVI time series obtained using the alternative band-normalization and averaging procedures indicates that the observed temporal patterns were not driven by the processing approach. Similarly, the agreement between Landsat and Sentinel-2 during their overlap supports interpreting the longer time series as a continuous record of vegetation condition, despite some sensor-specific differences. Together, these assessments increase confidence that the observed changes in the NDVI primarily reflect temporal variation in mangrove condition rather than methodological artifacts.
4. Discussion
4.1. Classification Accuracy and Confidence in Mangrove Recovery Pathways
The high and consistent classification performance of the annual land-cover maps (Table A3) provides a robust basis for examining broad patterns of mapped mangrove canopy disturbance and recovery. Because the binary validation focused on mangrove versus non-mangrove discrimination, it provides stronger support for identifying post-storm mangrove loss and subsequent return to the mangrove class than for distinguishing among non-mangrove classes, including soil, mixed low-relief vegetation, and water.
However, because validation distinguished only between mangrove and non-mangrove, it did not identify the specific land-cover classes present after disturbance. Therefore, post-storm transitions from mangrove to non-mangrove should not be interpreted as complete conversion to a homogeneous land-cover type. Instead, they indicate changes in pixel composition associated with canopy loss or severe degradation. Following canopy damage, a pixel may contain a mixture of exposed woody material, such as trunks and branches, underlying soil or sediment, water, and regenerating vegetation.
Independent visual corroboration using sub-meter-resolution historical imagery from Google Earth Pro (GEP; Figure A3) supports this interpretation. Areas mapped as mangrove in 2017 and soil in 2018 showed visible trunks and woody debris over exposed soil in the 2018 GEP imagery, whereas areas mapped as low-relief vegetation corresponded to light-green vegetation patches. By 2023, most degraded areas were classified as mangrove in both the maps and GEP imagery, although a small number of pixels mapped as soil or low-relief vegetation retained corresponding conditions in the high-resolution imagery. This agreement provides qualitative evidence that the mapped trajectories reflect spectral patterns of post-storm canopy disturbance and subsequent vegetation recovery rather than classification artifacts.
Therefore, the trajectory analysis extends beyond a mangrove/non-mangrove change assessment by identifying intermediate mapped conditions within areas classified as mangrove before the storm. The recurrence of classes such as soil and mixed low-relief vegetation within the 2017 mangrove target areas identifies intermediate mapped conditions through which severely disturbed mangrove areas passed before returning to the mangrove class. For example, the mangrove → soil → low-relief vegetation → mangrove pathway should be interpreted as a sequence of spectral and surface-condition changes during canopy disturbance and recovery, rather than as four discrete ecological states.
Return to the mangrove class indicates that a pixel again met the spectral criteria for mangrove classification; it does not necessarily indicate recovery of pre-storm canopy height, biomass, species composition, or ecosystem function. Previous studies in Australia, Florida, and Puerto Rico similarly show that vegetation indices, foliage cover, or mapped canopy cover can recover while structural recovery remains delayed, spatially heterogeneous, or incomplete [11,57,58]. The mapped mangrove canopy recovery pathways identified here should therefore be interpreted as complementary to, rather than substitutes for, direct measurements of mangrove structure and ecosystem function.
4.2. Wind Exposure and Disturbance
The contrasting responses observed after the 2017 and 2022 storms are consistent with stronger local wind exposure contributing importantly to the widespread mangrove disturbance detected in 2017. Both Rookery Bay and Jobos Bay experienced hurricane-force winds during Irma and Maria, respectively, whereas during Ian and Fiona in 2022, the reserves were exposed mainly to strong tropical-storm-force winds and remained outside the core hurricane-force wind fields [28,29,30,31]. Our analyses detected the 2017 storms through strong NDVI declines and loss of mapped mangrove canopy, with pixels subsequently reclassified as soil, mixed low-relief vegetation, or water. In contrast, after the 2022 storms there was no widespread canopy signal detected at the spatial, temporal, and spectral resolution of our analyses. This contrast occurred despite substantial hydrologic forcing in 2022, including approximately 7 ft of storm surge near Rookery Bay during Ian and 20–25 in of rainfall around Jobos Bay during Fiona [30,31].
Storm tracks and local exposure provide context for this difference. During the 2017 storms, Irma’s eyewall crossed central Rookery Bay NERR, while Maria passed approximately 40 km from Jobos Bay, exposing both reserves to hurricane-force winds [28,29]. For the 2022 storms, in contrast, Ian made landfall approximately 100 km north of Rookery Bay and Fiona approximately 100 km west of Jobos Bay [30,31]. Thus, the storm category at landfall did not necessarily correspond to the intensity of conditions experienced within the reserves. The observed spectral contrast is therefore more consistent with differences in local storm exposure, particularly wind intensity, than with storm category alone.
The stronger local wind exposure in 2017, including hurricane-force winds over the two NERRs, may have contributed to the extensive defoliation and structural damage observed in these systems. This interpretation is consistent with Imbert [14], who reported maximum mangrove basal area loss at wind speeds ≥ 130 km h−1 (70 kt); with Taillie et al. [13], who found maximum wind speed to be the strongest predictor of hurricane-related mangrove damage, with stronger effects than surge and rainfall; and with Peereman et al. [59], who found that distance from the cyclone path and local maximum wind speed were among the most important factors explaining cyclone damage.
However, our observations should not be interpreted as evidence for a universal wind-speed threshold or as demonstrating that wind was the sole cause of the 2017 disturbance. Wind damage can vary with storm duration and gust characteristics, forest structure, species composition, antecedent conditions, and local topography and hydrogeomorphology [4,14]. Other storm processes, including surge and rainfall, may also contribute to mangrove impacts and may produce effects that are delayed, spatially heterogeneous, or not detectable through canopy reflectance [12,60]. Our results instead indicate that, under the contrasting conditions examined here, widespread canopy disturbance detectable by the remote-sensing approaches used in this study was associated with the stronger local wind exposure experienced in 2017.
The absence of a comparable 2022 spectral response should likewise not be interpreted as evidence that Ian and Fiona had no ecological effects. The annual land-cover maps primarily captured persistent structural changes, whereas the NDVI time series captured changes in green canopy condition. Neither approach directly measures hydrologic stress, salinity changes, soil conditions, root damage, or other sublethal effects. Consequently, the results indicate that the 2022 storms did not produce widespread or persistent canopy changes detectable at the spatial and temporal resolution of this study, rather than demonstrating an absence of ecological effects.
4.3. Recovery Was High but Spatially Heterogeneous
Despite the severity of the 2017 storm disturbances, most of the affected mangrove area in both mangrove target areas (MTAs) subsequently returned to the mangrove class; however, this mapped canopy recovery was strongly heterogeneous in space and time. At both the southeastern Rookery Bay MTA (sRB-MTA) and the Jobos Bay MTA (JB-MTA), a substantial and similar fraction of the 2017 mangrove area remained classified as mangrove throughout the study period, consistent with canopy resistance or recovery occurring before the subsequent annual land-cover map (39.6% of the sRB-MTA extent and 44.2% of the JB-MTA extent). Immediately post-storm, mapped mangrove canopy in 2018 declined more strongly in the sRB-MTA than in the JB-MTA, falling to 47% and 59% of their respective 2017 MTA coverages. Among pixels that transitioned to non-mangrove classes in 2018, the majority returned to mangrove within 2–3 years, especially where the initial post-storm classes were mixed low-relief vegetation or bare soil. Despite a greater initial loss, the sRB-MTA exhibited a larger subsequent increase in mapped canopy than the JB-MTA. In the sRB-MTA, mapped mangrove cover increased to 81% in 2020 and reached 90% in 2023. In the JB-MTA, mapped mangrove cover increased to 73% in 2020, reaching 79% in 2023 and 83% in 2024.
Recovery over several years has also been documented for other mangrove attributes. In Florida Everglades mangroves, aboveground carbon stocks lost during hurricanes were largely recovered within approximately four years [6]. However, recovery of carbon stocks and return to a mapped mangrove class represent different outcomes and should not be treated as equivalent. A smaller but non-trivial proportion of spatially clustered pixels exhibited persistent degradation and limited mapped canopy recovery, particularly along coastal fringes and in both hydrologically altered inland locations or within lower elevation basin forests. These patterns indicate substantial canopy recovery across the analyzed areas but also show that recovery was neither spatially uniform nor assured. Mangrove responses to hurricanes were consistent with a continuum from canopy resistance or rapid recovery to delayed recovery and persistent non-mangrove conditions.
The spatial heterogeneity observed here likely reflects the interaction of disturbance severity with local geomorphic and hydrological conditions and pre-existing environmental stress. Areas with greater tidal connectivity and effective drainage may have been more capable of recovering after canopy damage, whereas low-elevation basins, poorly drained areas, and exposed coastal fringes may have experienced prolonged inundation, erosion, or substrate changes that delayed or prevented canopy re-establishment. Pre-storm forest conditions and species compositions may also influence recovery, as damaged stands with surviving trees can recover through resprouting or advance regeneration, whereas areas experiencing greater structural mortality may require longer periods for recruitment. In addition, persistent anthropogenic or hydrologic disturbances may reduce resilience independently of hurricane damage. These factors provide plausible explanations for the spatial patterns observed in the trajectory analysis, but their relative contributions were not quantified in this study.
Our trajectory analysis revealed two dominant mapped pathways following canopy loss: transitions from the soil class directly to the mangrove class, and transition from mixed low-relief vegetation to the mangrove class. The first pathway, which accounted for most of the recovering area in both reserves, consisted of pixels remaining classified as bare soil for one or more years before transitioning directly to mangrove. As discussed in Section 4.1, the soil class represents an intermediate mapped surface condition that may include exposed sediment, woody debris, and residual or regenerating vegetation, rather than a uniformly unvegetated surface. The predominance of short transitions from the 2018 to the 2020 annual maps suggests relatively rapid canopy reestablishment, potentially following defoliation or limited branch damage, but does not establish the severity of structural damage or the mechanism of recovery. Longer transitions from bare soil to mangrove may reflect more severe canopy or structural damage, with recovery occurring through resprouting from surviving trees, including basal or epicormic shoots in the species Laguncularia racemosa and Avicennia germinans. Resprouting individuals of both species were commonly observed in the mangrove structural assessment conducted in both reserves during 2022–2023. These observations establish that resprouting occurred but do not identify its contribution to individual mapped trajectories. The transition of 2018 soil pixels through mixed low-relief vegetation before mangrove reclassification (13.8% in the sRB-MTA, and 12.7% in JB-MTA) may also reflect recruitment and establishment of mangrove propagules, although the trajectory data alone cannot distinguish recruitment from recovery of surviving vegetation.
The second pathway involved one or two consecutive annual maps of mixed low-relief vegetation before transitioning to mangrove. Following canopy loss, the exposed surface likely included a mixture of understory vegetation including mangrove saplings and herbaceous succulents such as Batis maritima and Sesuvium portulacastrum, which were observed at the mangrove plots sampled post-hurricane. The relatively short duration of this intermediate stage in the mapped trajectories (typically one to two years) is consistent with a relatively rapid return to the mangrove class. However, the annual maps do not establish whether this transition resulted from canopy recovery of surviving trees, resprouting, growth of advance regeneration, new seedling establishment, or a combination of these processes. Advance regeneration, including seedlings and saplings already present before disturbance, may benefit from increased light following storm-induced canopy thinning [5]. Overall, the predominance of short recovery pathways indicates that post-hurricane mangrove reclassification was primarily associated with relatively rapid return to mangrove-like spectral conditions, rather than prolonged multi-stage mapped transitions. However, it does not demonstrate equivalent recovery of canopy height, biomass, species composition, or ecosystem function.
Areas that transitioned from mangrove in 2017 to water in 2018 exhibited substantially lower proportions returning to the mangrove class (52.3% for the sRB-MTA in 2023, and 39.4% for JB-MTA in 2024) than those transitioning to soil or mixed low-relief vegetation. Lower mangrove reclassification was particularly evident along exposed coastal fringes, where persistent water or soil classes were more prevalent, consistent with possible geomorphic and hydrologic changes such as shoreline erosion, prolonged inundation, storm-surge ponding, or loss of substrate elevation that can inhibit recolonization over ecologically relevant time scales. However, the mapped trajectories alone cannot distinguish among these processes. In Rookery Bay, red mangroves (Rhizophora mangle) dominate the shoreline and fringe zones and may be especially vulnerable to severe structural damage because recovery is limited to advance regeneration and propagule recruitment, as this species does not exhibit epicormic growth. Similar patterns in recovery failure were documented across southwest Florida (including the current study area) following Hurricane Irma using a combination of Landsat imagery and lidar-derived DEM, highlighting the vulnerability of low-elevation mangrove areas to ponding and prolonged inundation [8]. Similarly, lower mangrove recovery has been found in fringe mangrove, especially for Rhizophora mangle in northeast Caribbean [14]. In contrast, inland water pixels more frequently transitioned to soil or back to mangrove, a pattern potentially consistent with changes in inundation, sediment conditions, or vegetation cover that permitted subsequent mangrove reclassification. Smith et al. [4] reported that some Everglades mangrove forests recovered after catastrophic hurricane disturbance, whereas others were permanently converted to mudflats, with damage severity varying among geomorphic settings. Coastal fringe zones in our study areas therefore appeared particularly susceptible to persistent non-mangrove conditions. Together, these patterns suggest that persistent hydrologic and geomorphic constraints, rather than the initial magnitude of canopy loss alone, may have limited recovery in some locations. This interpretation is consistent with previous work in southwest Florida showing that low elevation, poor drainage, and storm-surge ponding can produce prolonged mangrove stress and delayed or failed recovery following Hurricane Irma [8].
These contrasting trajectories also have potential implications for blue-carbon storage and coastal protection. Where canopy recovery is accompanied by structural and functional recovery, mangrove forests may regain carbon sequestration and shoreline stabilization functions over decadal time scales [1,6]. In contrast, areas that transitioned to persistent water or non-vegetated soil may represent long-term reductions in carbon storage, diminished resistance to future storm surges, and possible shifts toward alternative ecosystem states such as mudflats or open water. These consequences cannot be established from mapped cover and the NDVI alone and require measurements of forest structure, carbon stocks, and relevant ecosystem processes. Identifying these persistent degradation hotspots is therefore important for prioritizing field assessment, hydrologic restoration, erosion mitigation, and long-term ecological monitoring within mangrove reserves.
Both regions showed examples of limited mapped canopy recovery coinciding with pre-existing stressors. In eastern Aguirre State Forest and along Camino del Indio, persistent canopy loss occurred in areas affected by impounded hydrology and development encroachment, respectively, suggesting that pre-existing environmental degradation reduced post-storm resilience. In Rookery Bay, an inland lagoon around Pumpkin Bay had documented mangrove die-offs in 1999 (Jill Schmid, personal communication). Although mangrove cover was present in 2017, this area showed little to no return to the mangrove class following Hurricane Irma. Previous studies have likewise shown that mangrove forests affected by hydrologic alteration or other forms of degradation are less likely to recover naturally following major storm impacts [2,61]. Lewis et al. [62] describe the chronic stressors and mechanisms that can lead to mass mortality following acute disturbances such as hurricanes as mangrove “heart-attacks”. These examples support the interpretation that mapped recovery trajectories reflected both hurricane disturbance and antecedent environmental conditions, although the influence of individual stressors was not quantified.
4.4. Differences in Recovery Between the Two Sites
Although both reserves exhibited substantial return to the mangrove class following the 2017 hurricanes, it was less complete in the JB-MTA than in the sRB-MTA over the same period. Mangrove cover had recovered to 83% of its 2017 extent in Jobos Bay by 2024, compared with 90% in the sRB-MTA by 2023. The JB-MTA also showed lower mangrove reclassification for pixels that transitioned to soil or mixed low-relief vegetation in 2018, as well as a higher proportion of persistent non-vegetated trajectories. These differences may partly reflect the greater extent of pre-existing natural and anthropogenic stressors in Jobos Bay, in addition to differences in hydrology, geomorphic setting, local disturbance exposure, and climatic conditions.
Pre-storm NDVI provides additional context for interpreting these differences. In Rookery Bay, areas that subsequently remained non-recovered already had lower mean NDVI than the other groups, whereas all three groups in Jobos Bay exhibited equivalent pre-storm mean NDVI under the reference-SD criterion. Thus, lower baseline greenness distinguished subsequent non-recovery in Rookery Bay but not in Jobos Bay. This contrast does not exclude pre-existing stress in Jobos Bay but indicates that such stress was not expressed as a detectable baseline difference in mean NDVI among response groups.
Persistent degradation in Jobos Bay was particularly evident in eastern Aguirre State Forest and along Camino del Indio. Eastern Aguirre State Forest contained a large area with only partial mangrove recovery, consistent with the combined influence of pre-existing environmental stressors and post-hurricane disturbance (Figure S7). Along Camino del Indio, illegal expansion into protected lands appears to have compounded storm-related canopy loss, with storm-damaged mangrove areas subsequently cleared or altered (Figure S8; Angel Dieppa, personal communication). These examples indicate that hurricane disturbance can interact with both chronic stress and coastal governance issues, reducing the likelihood of natural recovery and increasing the persistence of non-mangrove states.
The JB-MTA showed an anomalous reduction in mangrove coverage in the 2022 map (Figure 4). Because the 2022 mosaic was generated from imagery acquired during the first four months of the year (Table A1), this reduction cannot be attributed to Hurricane Fiona (September 2022). During plot sampling in 2022, numerous recently dead or stressed small stems (both small trees and sprouts associated with epicormic growth) were recorded in areas of mangroves that had evidence of post-hurricane recovery; mortality appeared to be associated with very dry field conditions observed at the affected sites (Ogurcak et al., in preparation). These observations are consistent with the exceptionally low precipitation recorded in 2021 (441 mm) at Jobos Bay NERR, which was the lowest annual precipitation in the 2001–2024 record (long-term annual mean of 955 ± 319 mm; station JOBJBMET; ref. [63]).
The overall patterns observed here are consistent with studies showing that post-cyclone mangrove recovery depends not only on storm intensity but also on antecedent ecosystem condition, local hydrology, and geomorphic exposure. Asbridge et al. [11] reported broad post-cyclone recovery in Australian mangroves but identified localized areas of persistent damage, while Velázquez-Salazar et al. [3] found highly variable recovery after Hurricane Roslyn in Mexico, with limited recovery in previously degraded forests. These findings support the interpretation that lower recovery in Jobos Bay was likely influenced by the interaction between hurricane damage and pre-existing stressors rather than by storm exposure alone. Recovery may have been further constrained by weather extremes, including the exceptionally dry conditions recorded in 2021.
Another important difference was that the 2017 post-storm NDVI in Rookery Bay exhibited a deeper and more prolonged functional decrease than in Jobos Bay. In polygons that were damaged in 2018 but subsequently recovered, the NDVI began increasing in Jobos Bay shortly after Hurricane Maria, by November 2017. In Rookery Bay, the NDVI continued to decline after Hurricane Irma and did not begin to recover until June 2018. A similar NDVI decline after the storm is shown in Lagomasino et al. [8] for southern Florida after hurricane Irma. By mid-2022, however, areas that subsequently recovered at both reserves had approached their climatological mean NDVI values and seasonal amplitudes. The NDVI time series showed that differences between the sites involved not only the extent of mapped canopy loss, but also the duration and intensity of functional vegetation stress following the storms.
The delayed NDVI recovery of greenness in southern Rookery Bay is consistent with the greater initial disturbance associated with its position immediately to the right of Hurricane Irma’s track. The large extent of Rookery Bay NERR provides a clear example of how hurricane impacts can vary according to position relative to the storm track. Hurricane Irma’s eye crossed approximately the central portion of the reserve (Figure 1), placing the section analyzed in this study (southern Rookery Bay) on the right side of the storm track, where the strongest winds and storm surge occurred. This area experienced extensive canopy loss and a prolonged decline in NDVI following the storm. In contrast, areas left of the storm track (north section of Rookery Bay, not analyzed in this study) were less affected and retained a greater proportion of mangrove cover in the 2018 map [23]. This spatial asymmetry is consistent with previous observations that mangrove damage in Florida is typically greater on the right side of landfalling hurricanes than on the left side at comparable distances from the storm center [64]. By contrast, Jobos Bay was located 40 km from the left side of Hurricane Maria track, where wind and surge exposure were lower than near the storm’s right-front quadrant. Greater wind-driven canopy and structural damage in southern Rookery Bay could have prolonged the decline in the NDVI by delaying leaf replacement and canopy rebuilding. However, higher surge and rainfall exposure at Rookery Bay in 2017 may also have contributed to the prolonged post-storm NDVI decline. For Hurricane Irma, Castañeda-Moya et al. [65] found that storm deposits extended up to 10 km inland, with vertical accretion several times higher than the long-term values, and Radabaugh et al. [12] found delayed mortality after the storm due to storm-surge mud deposit. Storm surge and rainfall may prolong stress through salinity changes, sustained inundation, low soil oxygen availability, or altered sediment and nutrient conditions. Such effects could suppress leaf production or increase delayed mortality after the storm, even where the initial loss of canopy was predominantly wind-driven.
4.5. Structural and Functional Recovery
The annual land-cover trajectories and NDVI time series captured complementary canopy-level indicators relevant to structural and functional recovery. Land-cover transitions represented changes in mapped canopy cover, including canopy loss sufficient to expose underlying surface components and subsequent return to the mangrove class. In contrast, the NDVI captured canopy greenness conditions, including changes consistent with defoliation or reduced vegetation vigor that did not necessarily result in a mapped land-cover transition. Neither indicator directly measured forest structural attributes or ecosystem functioning. The differences among the three response groups further indicate that canopy greenness varied along a gradient associated with storm response, with less-impacted areas maintaining higher and more spatially homogeneous vegetation condition, whereas persistent mapped non-recovery was associated with greater spatial heterogeneity. This suggests that areas classified as non-recovered were not necessarily uniformly degraded but instead contained a mixture of vegetation conditions at relatively fine spatial scales.
Following the sharp NDVI decline immediately after the 2017 storms, the NDVI time series in areas that subsequently recovered showed a rapid initial rebound in greenness during the first post-storm year, followed by a more gradual increase through mid-2022, when both NDVI values and seasonal amplitudes approached climatological levels. The early rebound phase likely reflected leaf replacement, resprouting, and partial canopy closure, whereas the later phase may have coincided with continued canopy development and biomass accumulation [3,6]. However, the NDVI alone cannot distinguish these processes or establish the extent of structural recovery. The equivalence tests further support recovery of mean canopy greenness: during 2022–2025, recovered and less-affected areas exhibited equivalent mean NDVI at both sites under their respective reference-SD criteria. In contrast, mean NDVI in non-recovered areas remained approximately 0.35–0.36 lower than in the other groups in Rookery Bay and 0.26–0.29 lower in Jobos Bay. These results reinforce the distinction between greenness recovery and persistent mapped non-recovery, without establishing recovery of forest structure or ecosystem function. The presence of an NDVI decline in less severely affected areas where pixels remained classified as mangrove in 2018 shows that greenness disturbance extended beyond the area of mapped mangrove canopy reclassification. This distinction is important because the land-cover maps alone could classify these areas as persistent mangrove cover even though their vegetation condition had been temporarily altered. Conversely, persistent mapped non-recovery was characterized by greater spatial heterogeneity both within individual areas and among sampled areas, suggesting that canopy greenness remained uneven within the same mapped mangrove class. This variability cautions against interpreting mapped mangrove areas as having a uniform ecosystem function.
The lack of a comparable NDVI decline in 2022 indicates that hurricanes Ian and Fiona did not produce widespread canopy greenness detectable at the spatial and temporal resolution of the NDVI time series, but it does not exclude other ecological effects. Annual averages of vegetation indices have been used to monitor post-storm mangrove recovery [3,9,13,16]. However, the study of the NDVI from single-date satellite overpasses, rather than from annual composites, allowed a detailed assessment of greenness recovery timing in our study areas.
Combining very-high-resolution land-cover maps with dense NDVI time series allowed us to evaluate mangrove canopy disturbance and recovery across complementary spatial and temporal scales. Land-cover trajectories of the annual maps identified sequences of mapped canopy loss, intermediate surface conditions, and return to the mangrove class, whereas NDVI time series characterized greenness changes and recovery dynamics that could precede, or occur without, mapped canopy reclassification. The spatial heterogeneity evident in the NDVI record also highlights the value of combining these approaches: annual maps identify where persistent, mapped canopy changes occurred, while dense NDVI time series can reveal differences in vegetation greenness within and among those mapped areas. Agreement between these indicators strengthens interpretation of canopy-level recovery but does not establish restoration of pre-storm biomass, species composition, or ecosystem function. By integrating these approaches, this framework provides managers with spatially explicit and temporally resolved information to support targeted field assessment, hydrologic restoration, shoreline stabilization, monitoring of persistent dieback, and prioritization of vulnerable sectors within protected estuaries. Because the workflow relies primarily on transferable remote-sensing datasets and reproducible classification approaches, it offers a scalable approach that can be adapted to other NERRs and mangrove regions exposed to repeated tropical cyclone disturbance, providing a template for integrated assessment of mapped canopy cover and greenness as complementary indicators of resilience.
4.6. Methodological Considerations and Limitations
The combination of high-resolution land-cover maps, pixel-level trajectory analysis, stakeholder-informed corrections, and dense NDVI time series enabled a detailed assessment of post-storm mangrove canopy recovery. Nevertheless, several limitations should be considered. First, differences in image availability introduced temporal and spatial asymmetries between reserves. When possible, annual mosaics were generated using imagery from the first part of the year; however, this was not always feasible. As a result, some annual maps were derived from imagery acquired in different seasons, potentially introducing phenological and spectral inconsistencies between years. In addition, no land-cover maps were available for 2019, a key period for early canopy recovery, and WorldViewTM coverage declined after 2020, particularly in Rookery Bay, where no imagery was available for 2024, and 2023 coverage was limited to the southeastern portion of the reserve. Second, despite high classification accuracies, residual errors and mixed pixels are unavoidable in heterogeneous coastal environments, especially near ecotones and heavily disturbed areas. Due to those two limitations, the interannual trajectories should be interpreted as mapped patterns of post-hurricane mangrove canopy disturbance and subsequent recovery, rather than as temporally uniform, independently validated pixel-level observations. Third, because the trajectory analysis used a complete-case subset of 2017 mangrove pixels, the results characterize land-cover changes within the analyzed 2017 mangrove target areas (MTAs) rather than the entire pre-storm mangrove extent of each reserve. Fourth, the NDVI reflects vegetation greenness rather than species composition, forest structure, or belowground processes. Consequently, areas that appear spectrally recovered may still differ from pre-storm conditions in biomass or structural complexity, while persistently low NDVIs may reflect mixtures of sparse vegetation, exposed sediment, and shallow water rather than complete ecosystem collapse. These limitations may influence interpretation at local scales but do not alter the broader pattern of widespread canopy recovery alongside localized persistent degradation observed across both reserves.
5. Conclusions
- Annual 2 m resolution land-cover maps achieved consistently high mangrove/non-mangrove classification accuracy across both reserves (overall and balanced accuracies of 0.92–0.93; MCC = 0.83), providing a robust basis for assessing hurricane-related mangrove canopy loss and subsequent return to the mangrove class. Intermediate mapped classes, qualitatively corroborated by high-resolution imagery, represent changes in pixel composition and surface conditions rather than discrete ecological states. Accordingly, mapped canopy recovery indicates renewed spectral correspondence with mangrove cover, not necessarily restoration of pre-storm forest structure or ecosystem function.
- The 2017 hurricanes caused extensive but spatially variable mangrove canopy disturbance, whereas the 2022 storms produced no widespread or persistent canopy changes detectable by the land-cover maps and NDVI time series. In 2018, 47% of the 2017 mangrove extent in southeastern Rookery Bay MTA and 59% in Jobos Bay MTA remained classified as mangrove, indicating substantial resistance in addition to subsequent recovery. In contrast, neither the annual land-cover maps nor the NDVI time series showed important disturbance following the 2022 storms. These contrasting responses were consistent with stronger local wind exposure in 2017, rather than storm category alone. However, these observations neither establish a universal wind-speed threshold nor isolate wind effects from surge, rainfall, and other contributing processes. The absence of a comparable canopy response in 2022 does not exclude ecological effects beyond those detectable by the approaches used.
- Mapped mangrove canopy recovery was substantial but spatially and temporally heterogeneous, reaching 90% of the MTA extent by 2023 in southeastern Rookery Bay MTA and to 83% by 2024 in Jobos Bay MTA. Most disturbed pixels initially mapped as soil or mixed low-relief vegetation classes returned to the mangrove class within 2–3 years. These short trajectories indicate relatively rapid canopy re-establishment but do not distinguish recovery of surviving trees from recruitment. Pixels initially reclassified as water showed lower mangrove reclassification rates, particularly along exposed coastal fringes, consistent with persistent hydrologic or geomorphic constraints. Localized persistent degradation also coincided with pre-existing hydrologic alterations and anthropogenic stressors, suggesting that antecedent conditions influenced recovery, although their relative contributions were not quantified.
- Recovery was less complete in Jobos Bay MTA than in southeastern Rookery Bay MTA, potentially reflecting interacting differences in antecedent condition, hydrology, geomorphic setting, storm exposure, and climatic stress. Persistent degradation in Jobos Bay coincided with areas affected by hydrologic alteration and development encroachment. Its anomalous reduction in mapped mangrove cover in early 2022 preceded Hurricane Fiona and therefore cannot be attributed to that storm. Exceptionally low rainfall in 2021 and field observations of stressed or recently dead stems suggest that dry conditions may have further constrained post-hurricane recovery.
- The NDVI complemented the land-cover trajectories by resolving canopy greenness changes within and beyond areas of mapped mangrove loss. Areas that subsequently recovered showed an initial rapid rebound in greenness followed by more gradual increases, with NDVI values and seasonal amplitudes approaching climatological levels by mid-2022. NDVI recovery began earlier in Jobos Bay, by November 2017, than in Rookery Bay, where the NDVI continued declining until June 2018. This prolonged response was consistent with greater local storm disturbance exposure in southern Rookery Bay, although wind, surge and rainfall effects could not be separated. Greater NDVI heterogeneity in persistently non-recovered areas further indicated that these areas contained mixed vegetation conditions rather than uniformly degraded cover.
- Integrating very-high-resolution land-cover trajectories with temporal dense NDVI time series provides a transferable framework for assessing complementary dimensions of mangrove canopy disturbance and recovery. Annual maps identify changes in mapped canopy cover, whereas the NDVI resolves greenness dynamics that may occur without land-cover reclassification. Interpretation must account for uneven image timing and coverage, residual classification uncertainty, and the restriction of trajectory estimates to the analyzed 2017 mangrove target areas rather than entire reserves. Neither mapped canopy return nor NDVI recovery establishes restoration of pre-storm forest structure or ecosystem function. Within these limits, the approach identifies persistent degradation hotspots and supports targeted field assessment, long-term monitoring, hydrologic restoration, and shoreline management.
Supplementary Materials
The following supporting information can be downloaded at: https://www.mdpi.com/article/10.3390/rs18213855/s1, Supplementary Materials are provided as a PDF file containing Supplementary Figures S1–S8 (Supplementary_all-Figures-wCaptions.pdf) and as a folder (SuppMat) containing the datasets generated and analyzed in this study: JB_MTA_mask.tif and sRB_MTA_mask.tif, which are the masks for the Jobos Bay and southeastern Rookery Bay mangrove target areas (MTAs); post-stormPaths_JB-MTA_2018-2024.csv and post-stormPaths_sRB-MTA_2018-2023.csv, which contain the mangrove degradation and recovery pathways extracted from the land-cover map time series for each MTA; Mangrove_NDVI_2016-2025_3responseGroups_JobosBay.csv and Mangrove_NDVI_2016-2025_3responseGroups_RookeryBay.csv, which contain the NDVI time series for the mangrove response polygons at Jobos Bay and Rookery Bay, respectively; and NDVI_polygons_forGEE.txt, which contains the polygons used to extract NDVI time series for the three mangrove response groups at both sites. The pathway and NDVI data files include metadata describing their contents, data sources, temporal coverage, variables, and other relevant information.
Author Contributions
Conceptualization: D.R.-R., T.M., D.E.O. and F.E.M.-K. Methodology: D.R.-R., T.M. and M.J.M. Software: D.R.-R., T.M. and M.J.M. Field data collection: D.E.O., M.M.-H., J.L.S., J.A.C., J.S.F., A.D.A., M.B. and M.J.M. Map validation: D.R.-R., T.M., D.E.O., M.M.-H., J.L.S., J.A.C., J.S.F., A.D.A. and M.B. Formal analysis: D.R.-R., T.M. and F.E.M.-K. Investigation: D.R.-R., T.M., D.E.O. and F.E.M.-K. Data Curation: D.R.-R. and T.M. Writing—original draft: D.R.-R., T.M. and D.E.O. Writing—review and editing: D.R.-R., T.M., D.E.O., F.E.M.-K., J.L.S., M.J.M. and A.D.A. Visualization: D.R.-R. Project supervision: D.E.O., F.E.M.-K. and D.R.-R. Project administration: D.E.O., D.R.-R. and F.E.M.-K. Funding acquisition: D.E.O., F.E.M.-K., M.J.M. and D.R.-R. All authors have read and agreed to the published version of the manuscript.
Funding
This work was sponsored by the National Estuarine Research Reserve System Science Collaborative (University of Michigan Water Center/NOAA grants no. NA19NOS4190058 to Florida International University). This work was also funded by NSF grant number 1728913 to the University of South Florida. Geospatial support for this work was provided by the Polar Geospatial Center under NSF PLR awards 1043681 and 1559691. Partial support was provided also by NASA grants NNX14AP62A and 80NSSC22K1779, and NOAA/ONR grant NA19NOS0120199 of the US Integrated Ocean Observing System (IOOS) Program Office to the University of South Florida.
Data Availability Statement
Technical reports, data reports, data descriptors, datasets, data visualization, and metadata are available through NOAA Fisheries InPort: https://www.fisheries.noaa.gov/inport/item/77779, accessed on 1 June 2026 (for the Mangrove Coast Collaborative project) and https://www.fisheries.noaa.gov/inport/item/77784, accessed on 1 June 2026 (for the Limits of Resilience project). The file SuppMat provided in the Supplementary Materials include the data products needed to reproduce the trajectory summaries in Table 1, Table 2 and Table 3 and the NDVI time series presented in the manuscript. This work utilized WorldViewTM commercial satellite imagery from Vantor, made available through the NASA Commercial Satellite Data Acquisition (CSDA) Program. Sentinel-2, Landsat-8, and Landsat-9 data are available through the Google Earth Engine data catalog (COPERNI-CUS/S2_SR_HARMONIZED, LANDSAT/LC08/C02/T1_L2, and LANDSAT/LC09/C02/T1_L2).
Acknowledgments
The authors are grateful to the NASA Commercial Satellite Data Acquisition (CSDA) Program for providing access to and technical support for the WorldViewTM imagery. The authors acknowledge the use of the University of South Florida Research Computing facilities, specifically the CIRCE high-performance computing cluster, for providing computational resources to process the satellite imagery used in this study. Computational processing and geospatial analyses were also conducted using the Google Earth Engine platform. We acknowledge technical advice through the life of the NERRS-MCC projects from the following colleagues of the Rookery Bay and Jobos Bay NERR Advisory Committees, and from the NERRS-MCC Technical Committee (alphabetic order): Ariel Lugo, Arturo Leon, Brian Bovard, Concepcion Rodriguez-Fourquet, Daniel Davila, Elsie Rivera, Felix Lopez, Jessica Tipton, Julio Morell, Kara Radabaugh, Ken Krauss, Manuel Matos, Michael Ross, Rene Esteves, Rolando Santos, Ryan Moyer, Sean Charles, and Yogani Govender. Our gratitude extends equally to other colleagues from these committees whom we are unable to name here, but whose advice and contributions were greatly valued throughout the NERRS-MCC projects. This publication is a contribution from the Marine Biodiversity Observation Network (MBON). This publication is contribution #2209 from the Institute of Environment at Florida International University. Four reviewers of an initial draft of this paper provided helpful comments and suggestions for its improvement. During the preparation of this work, the authors utilized several generative artificial intelligence (AI) and large language model (LLM) tools. Specifically, ChatGPT (GPT-5.6 Luna, OpenAI), Claude (Sonnet 5, Anthropic), Perplexity AI, and Google Gemini were used to assist with language editing, improving clarity, readability, and conciseness of selected text passages. They were also used to identify relevant peer-reviewed literature on different sections of the manuscript. Additionally, Google Gemini was utilized to generate graphical elements incorporated into the article’s Graphical Abstract. All AI-assisted outputs were reviewed, validated, and revised by the authors, who take full responsibility for the scientific content, analysis, and conclusions presented in this work.
Conflicts of Interest
Author Michael Barry was employed by Tatenda, Inc., a company contracted by Florida International University to develop an updated habitat map for Jobos Bay National Estuarine Research Reserve (JBNERR) based on in situ observations. Tatenda, Inc. was not involved in the study design, data analysis, interpretation of results, writing of this article, or the decision to submit it for publication. No commercial funding was received for this study. The remaining authors declare that the research was conducted in the absence of any commercial or financial relationships that could be construed as a potential conflict of interest.
Abbreviations
The following abbreviations are used in this manuscript:
| NERR(s) | National Estuarine Research Reserve(s) |
| NERRS-MCC | Two collaborative research projects: “Resilience of the Mangrove Coast” and “Limits of Resilience” (the NERRS Mangrove Coast Collaborative) |
| NDVI | Normalized Difference Vegetation Index |
| AGL | Above ground level |
| MTA | Mangrove Target Areas |
| sRB-MTA | southeastern Rookery Bay MTA |
| JB-MTA | Jobos Bay MTA |
| GEP | Google Earth Pro |
| GEE | Google Earth Engine |
Appendix A
Table A1.
WorldView-derived annual habitat mosaics used in this study for Rookery Bay and Jobos Bay National Estuarine Research Reserves (NERRs). Each annual mosaic was assembled from individual habitat maps derived from WorldViewTM image acquisitions, preferentially using imagery collected during the first part of the year. The table lists the number of image acquisitions included in each mosaic and the start and end months of the imagery used.
Table A2.
Correspondence between land-cover classes in the original individual habitat maps, the annual mosaics, and the merged classification used for temporal land-cover pathway analysis in this study. The table identifies classes retained unchanged, classes merged into broader categories, and classes excluded from the analysis.
Table A3.
Accuracy metrics for the annual habitat maps generated by the NERRS-MCC projects for the Jobos Bay and Rookery Bay NERRS (2014 to 2024). Metrics corresponding to the maps used in this study are highlighted in gray. Within each region, the same set of in situ validation points was used; however, interannual differences in map coverage resulted in varying sample sizes. The following accuracy metrics are reported: Prevalence, proportion of mangrove samples in the validation dataset; Accuracy (ACC), overall classification performance; Balanced Accuracy (BA), accuracy accounting for class imbalance; Matthews Correlation Coefficient (MCC), overall classification quality considering all error types; Recall/Sensitivity (TPR), ability to correctly detect mangrove pixels; Precision (PPV), reliability of mapped mangrove pixels; F1 score, harmonic balance between precision and recall; Critical Success Index (CSI), detection success excluding true negatives; Specificity (TNR), ability to correctly identify non-mangrove pixels; and n, total number of validation samples. Overall accuracy metrics were calculated from the confusion matrices across all validated years (see [40] for standard performance metric formulations).
Figure A1.
Annual habitat maps for the southern region of Rookery Bay, Florida (2017–2023). The 2017 map shows the pre-storm state of the mangrove habitat. After Hurricane Irma, degraded mangrove areas were primarily classified as natural non-vegetated soil in 2018. Subsequent annual maps show different stages of mangrove recovery. Habitat mosaics were generated from high-resolution (~2 m) multispectral WorldViewTM imagery; periods and numbers of individual images used for each annual mosaic are listed in Table A1.
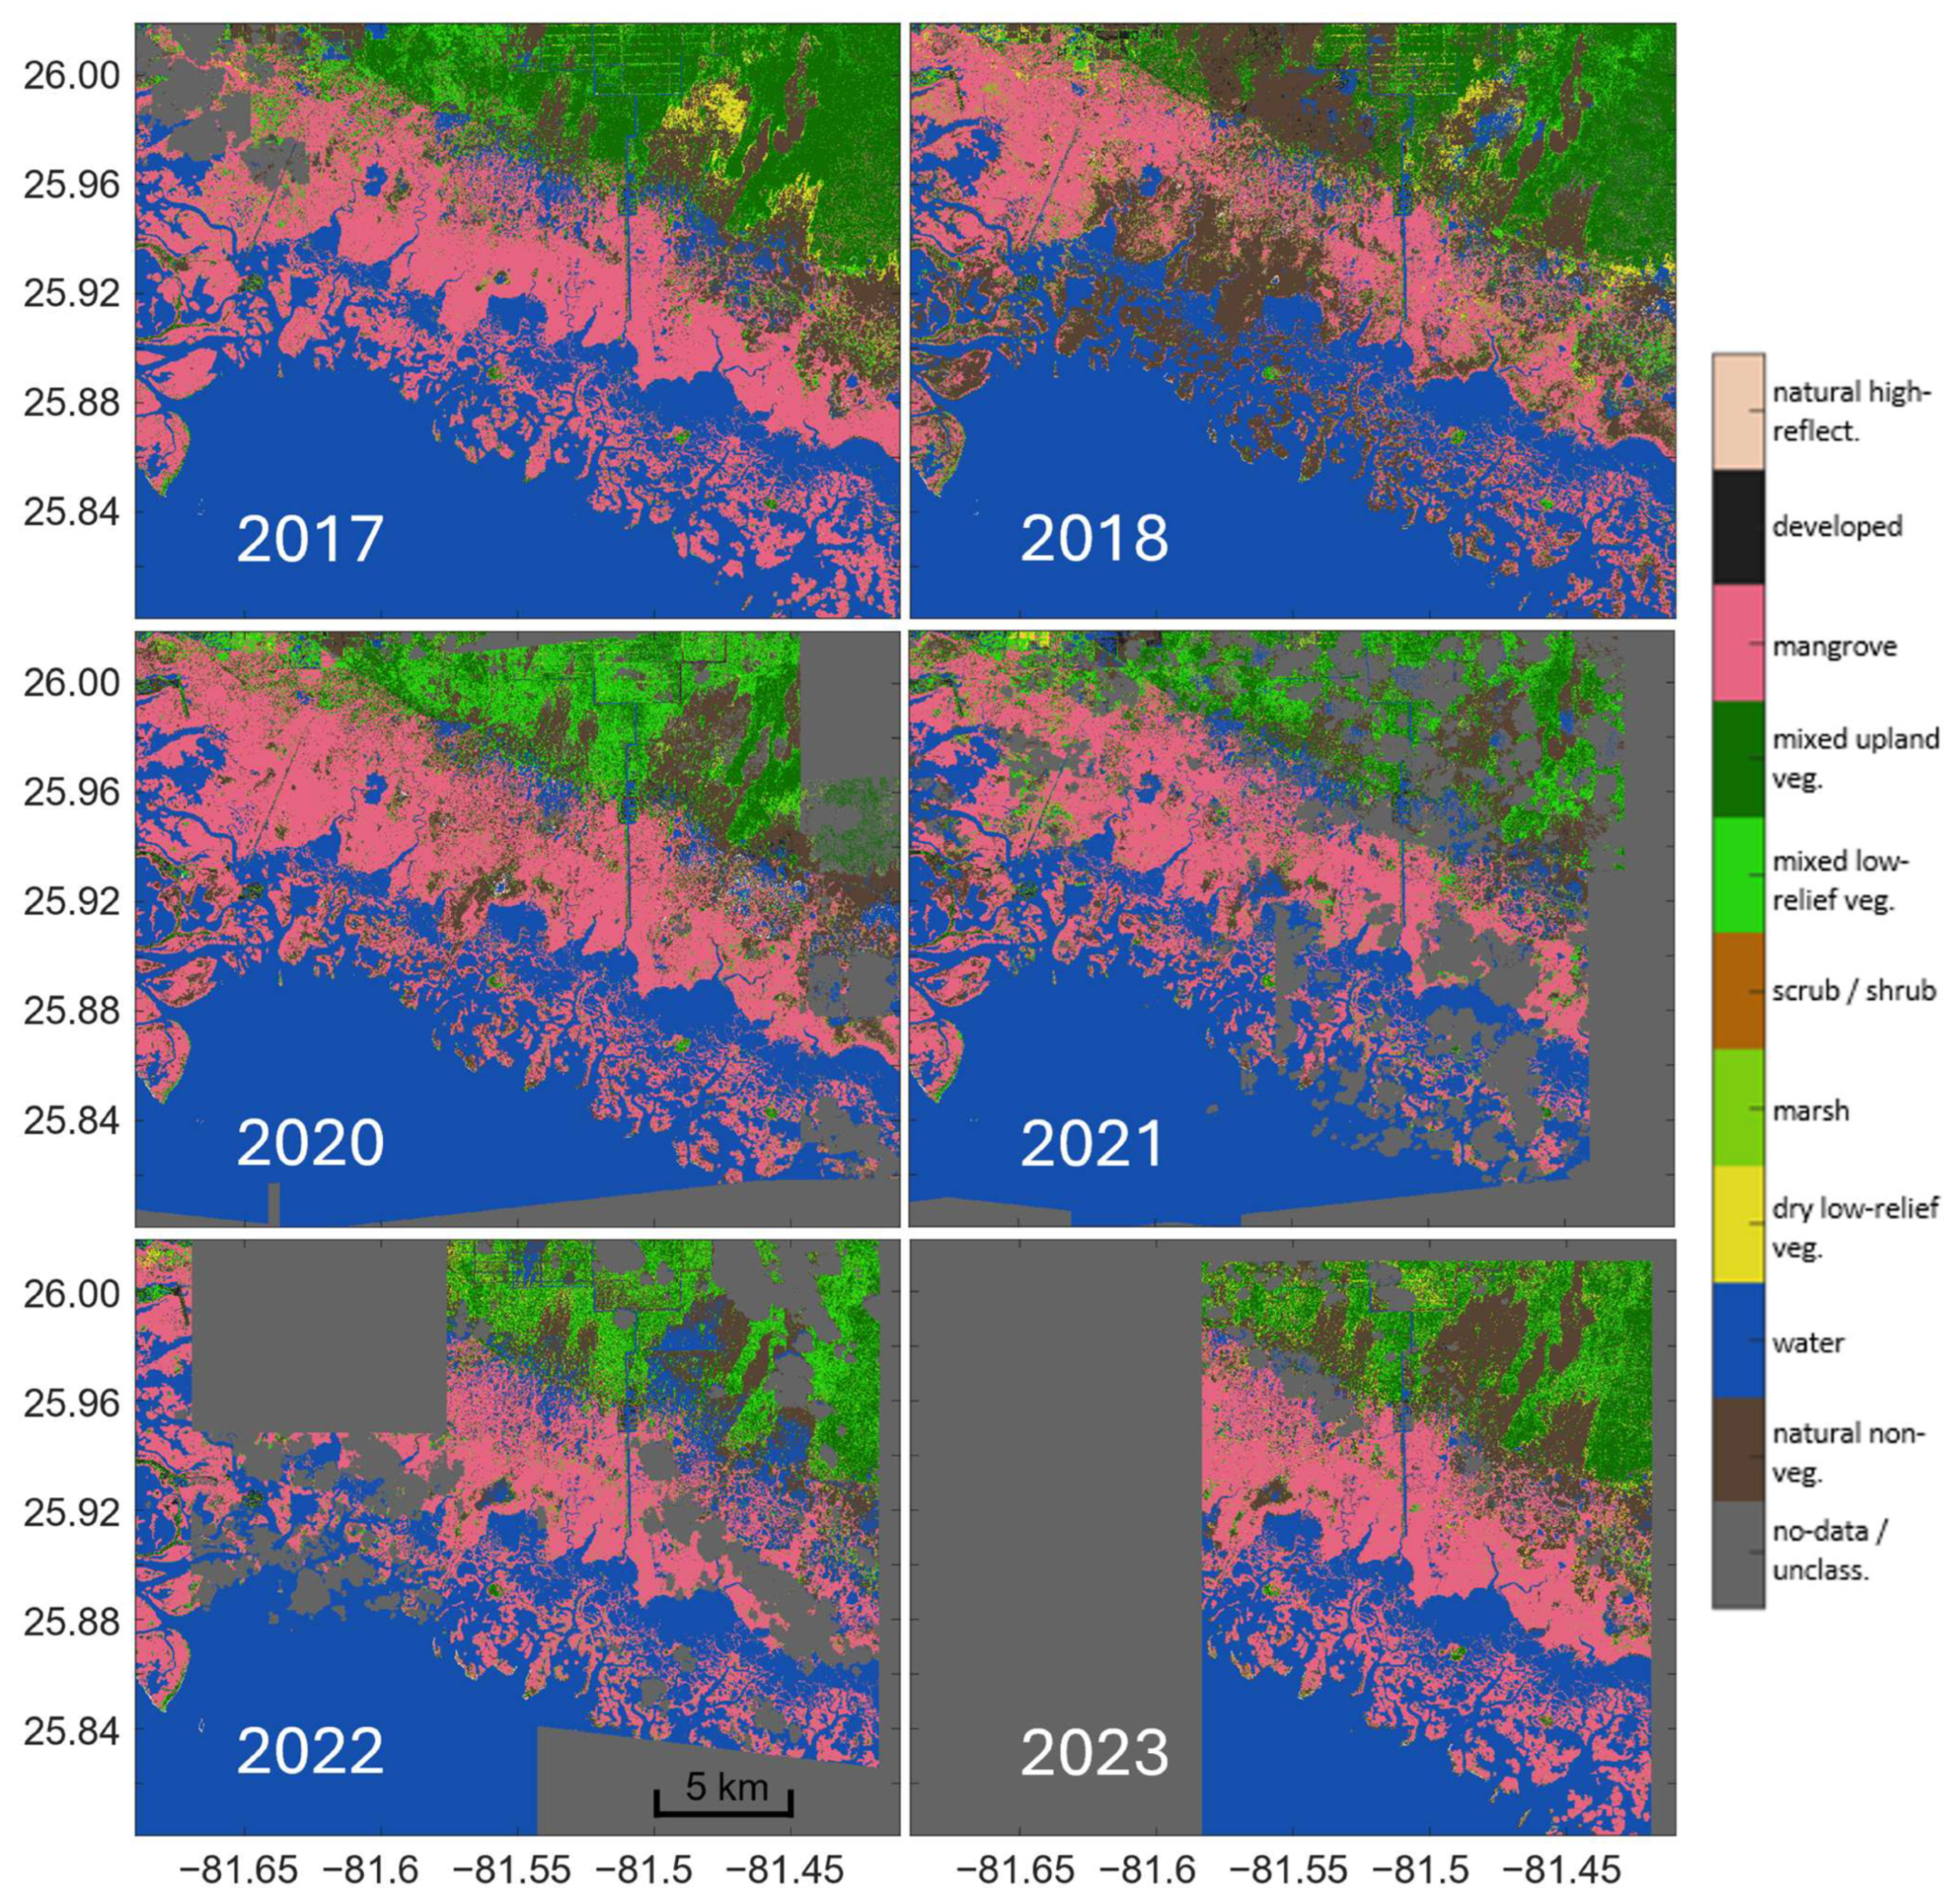
Figure A2.
Annual habitat maps focusing on Jobos Bay, Puerto Rico (2017–2024). The 2017 map shows the pre-storm state of the mangrove habitat. After Hurricane Maria, degraded mangrove areas were primarily classified as natural non-vegetated soil in 2018. Subsequent annual maps show different stages of mangrove recovery. Habitat mosaics were generated from high-resolution (~2 m) multispectral WorldViewTM imagery; periods and numbers of individual images used for each annual mosaic are listed in Table A1.
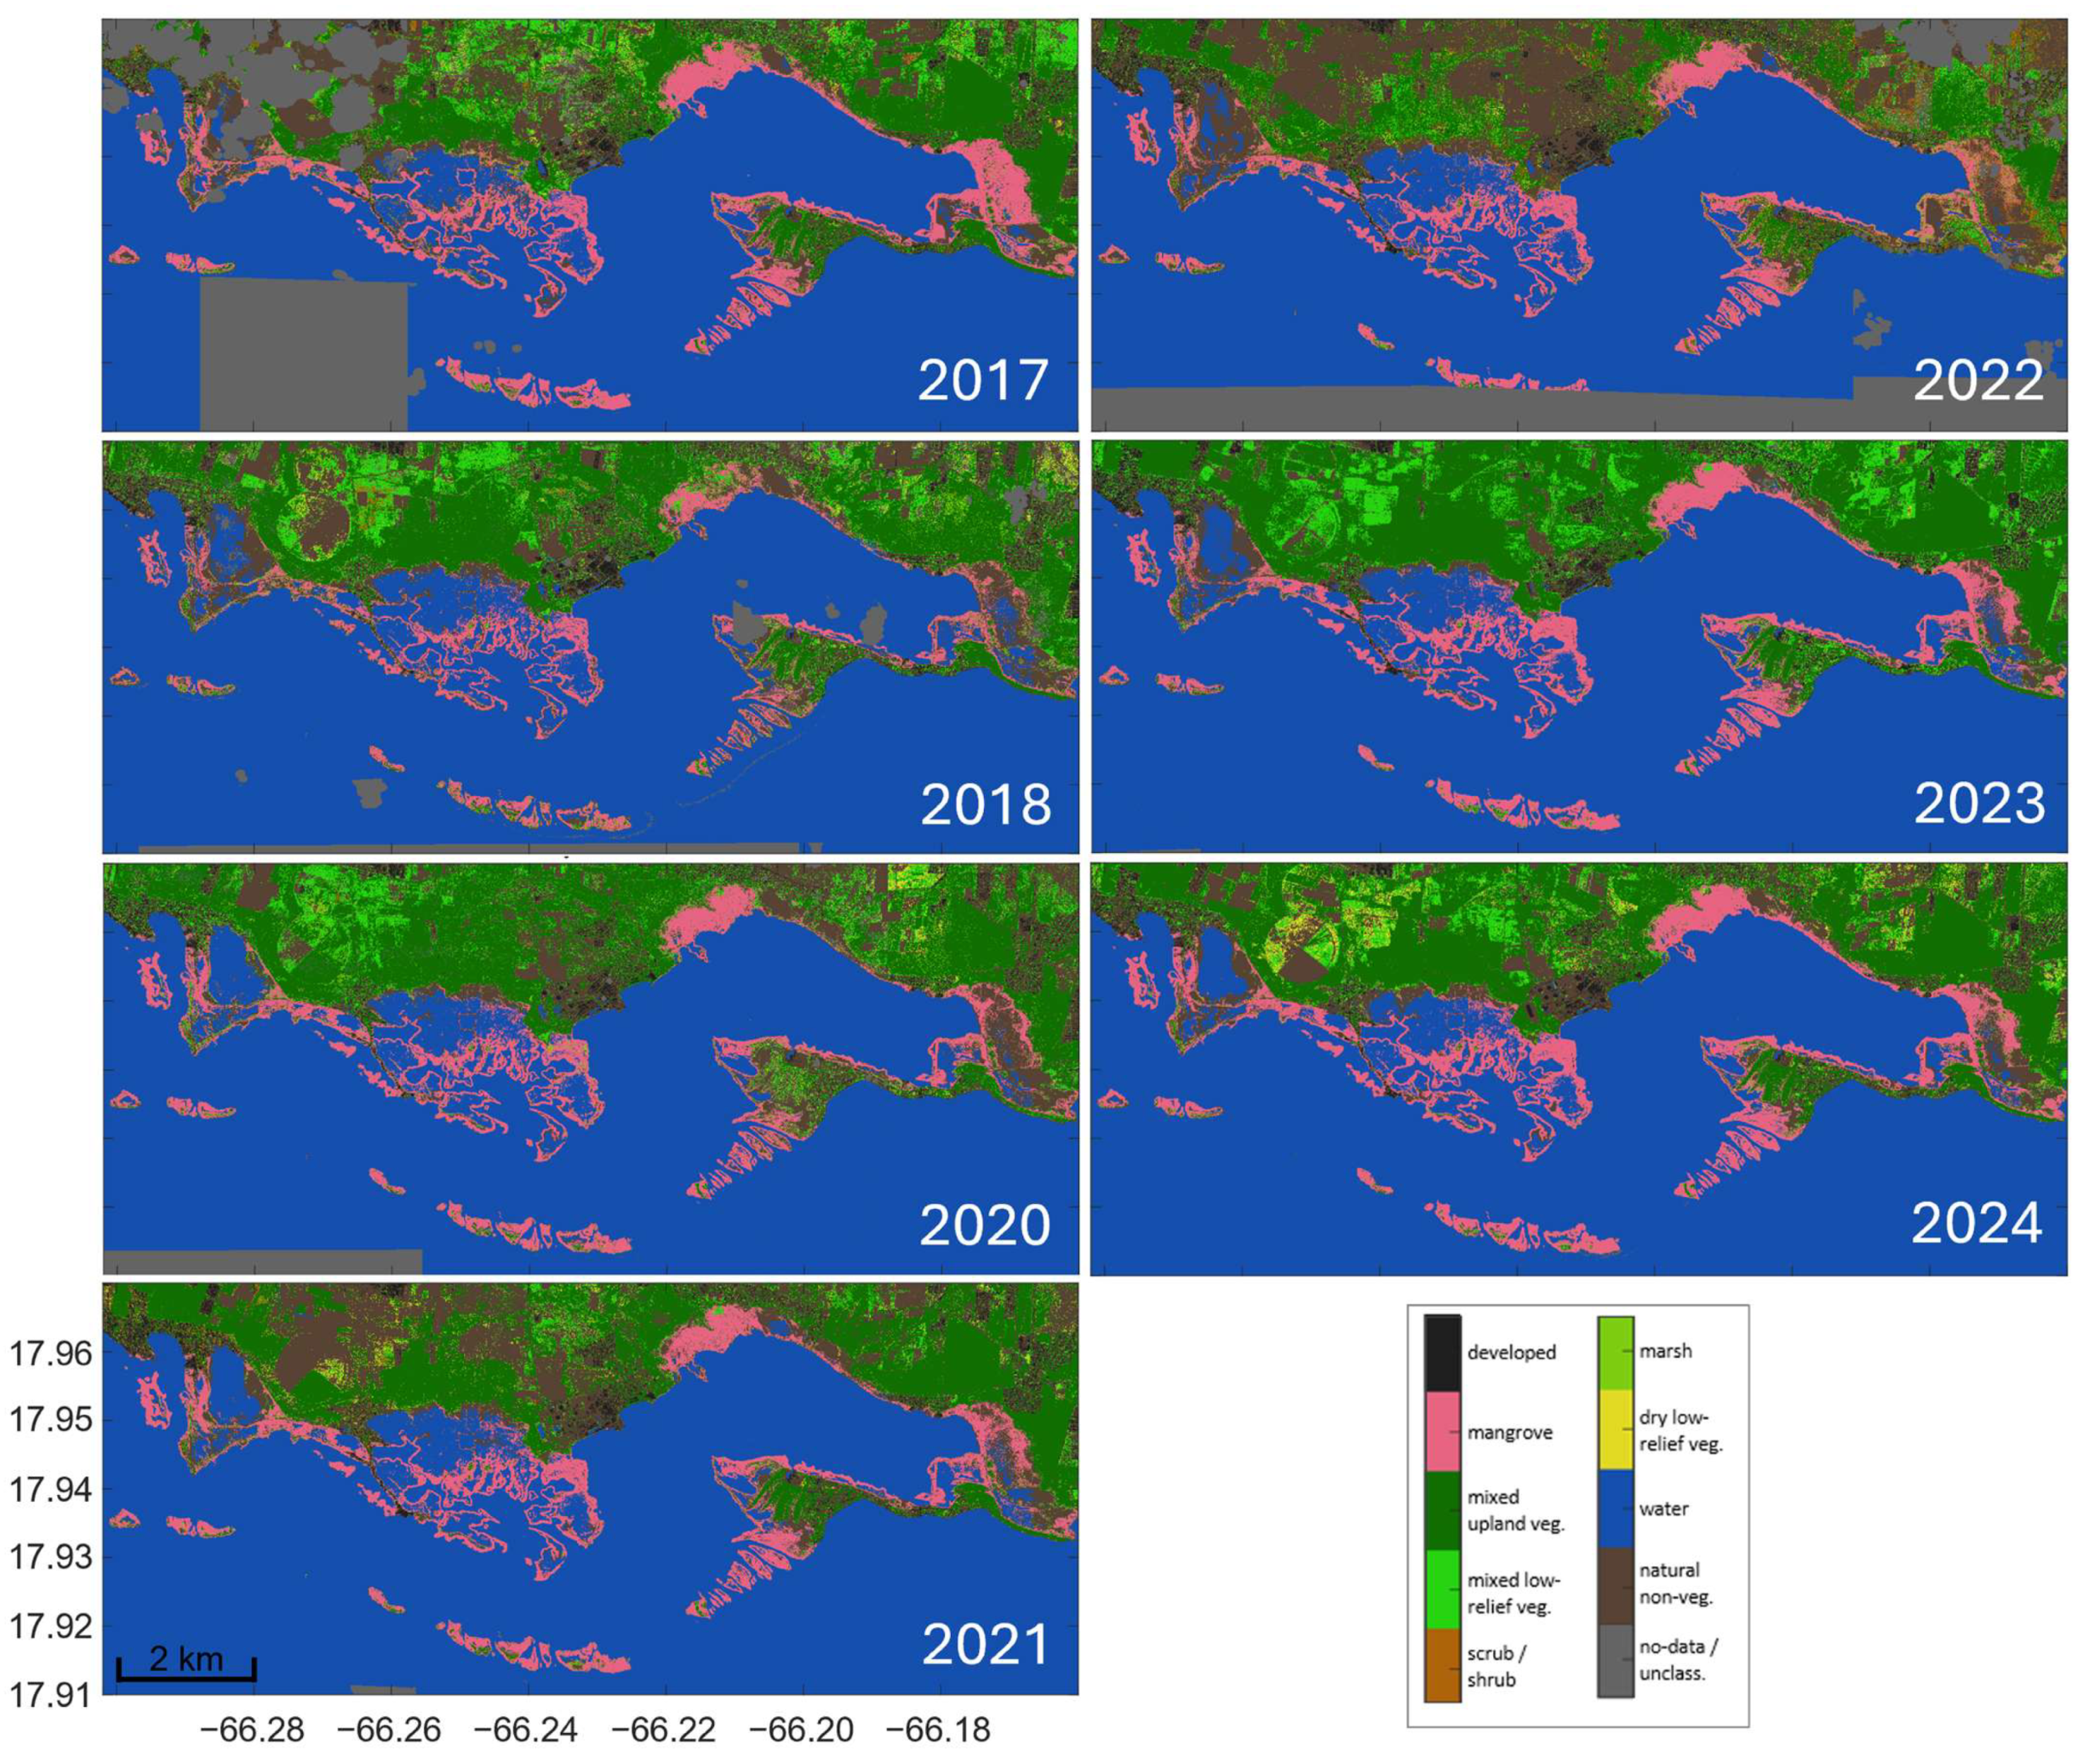
Figure A3.
Independent visual corroboration of representative trajectories of mangrove change following Hurricanes Irma and Maria. (Panel A) An area east of Central Aguirre, Jobos Bay, Puerto Rico; and (Panel B) Hog Key, Rookery Bay, Florida. Each panel pairs NERRS-MCC annual land-cover maps with corresponding sub-meter-resolution historical imagery from Google Earth Pro (GEP) for 2017, 2018, and 2023. Maps for 2017 show all land-cover classes, whereas the 2018 and 2023 maps show only pixels classified as mangrove in 2017 to track subsequent post-storm changes. At both sites, areas mapped as mangrove in 2017 were largely classified as soil or mixed low-relief vegetation in 2018. Corresponding post-storm GEP imagery shows exposed substrate, bare trunks and branches, and patchy green-brown vegetation. By 2023, most areas had returned to the mangrove class, whereas remaining soil and mixed low-relief vegetation corresponded to visibly persistent non-mangrove conditions. GEP imagery was used for independent visual corroboration of mapped disturbance and canopy-class recovery patterns, not for quantitative accuracy assessment.
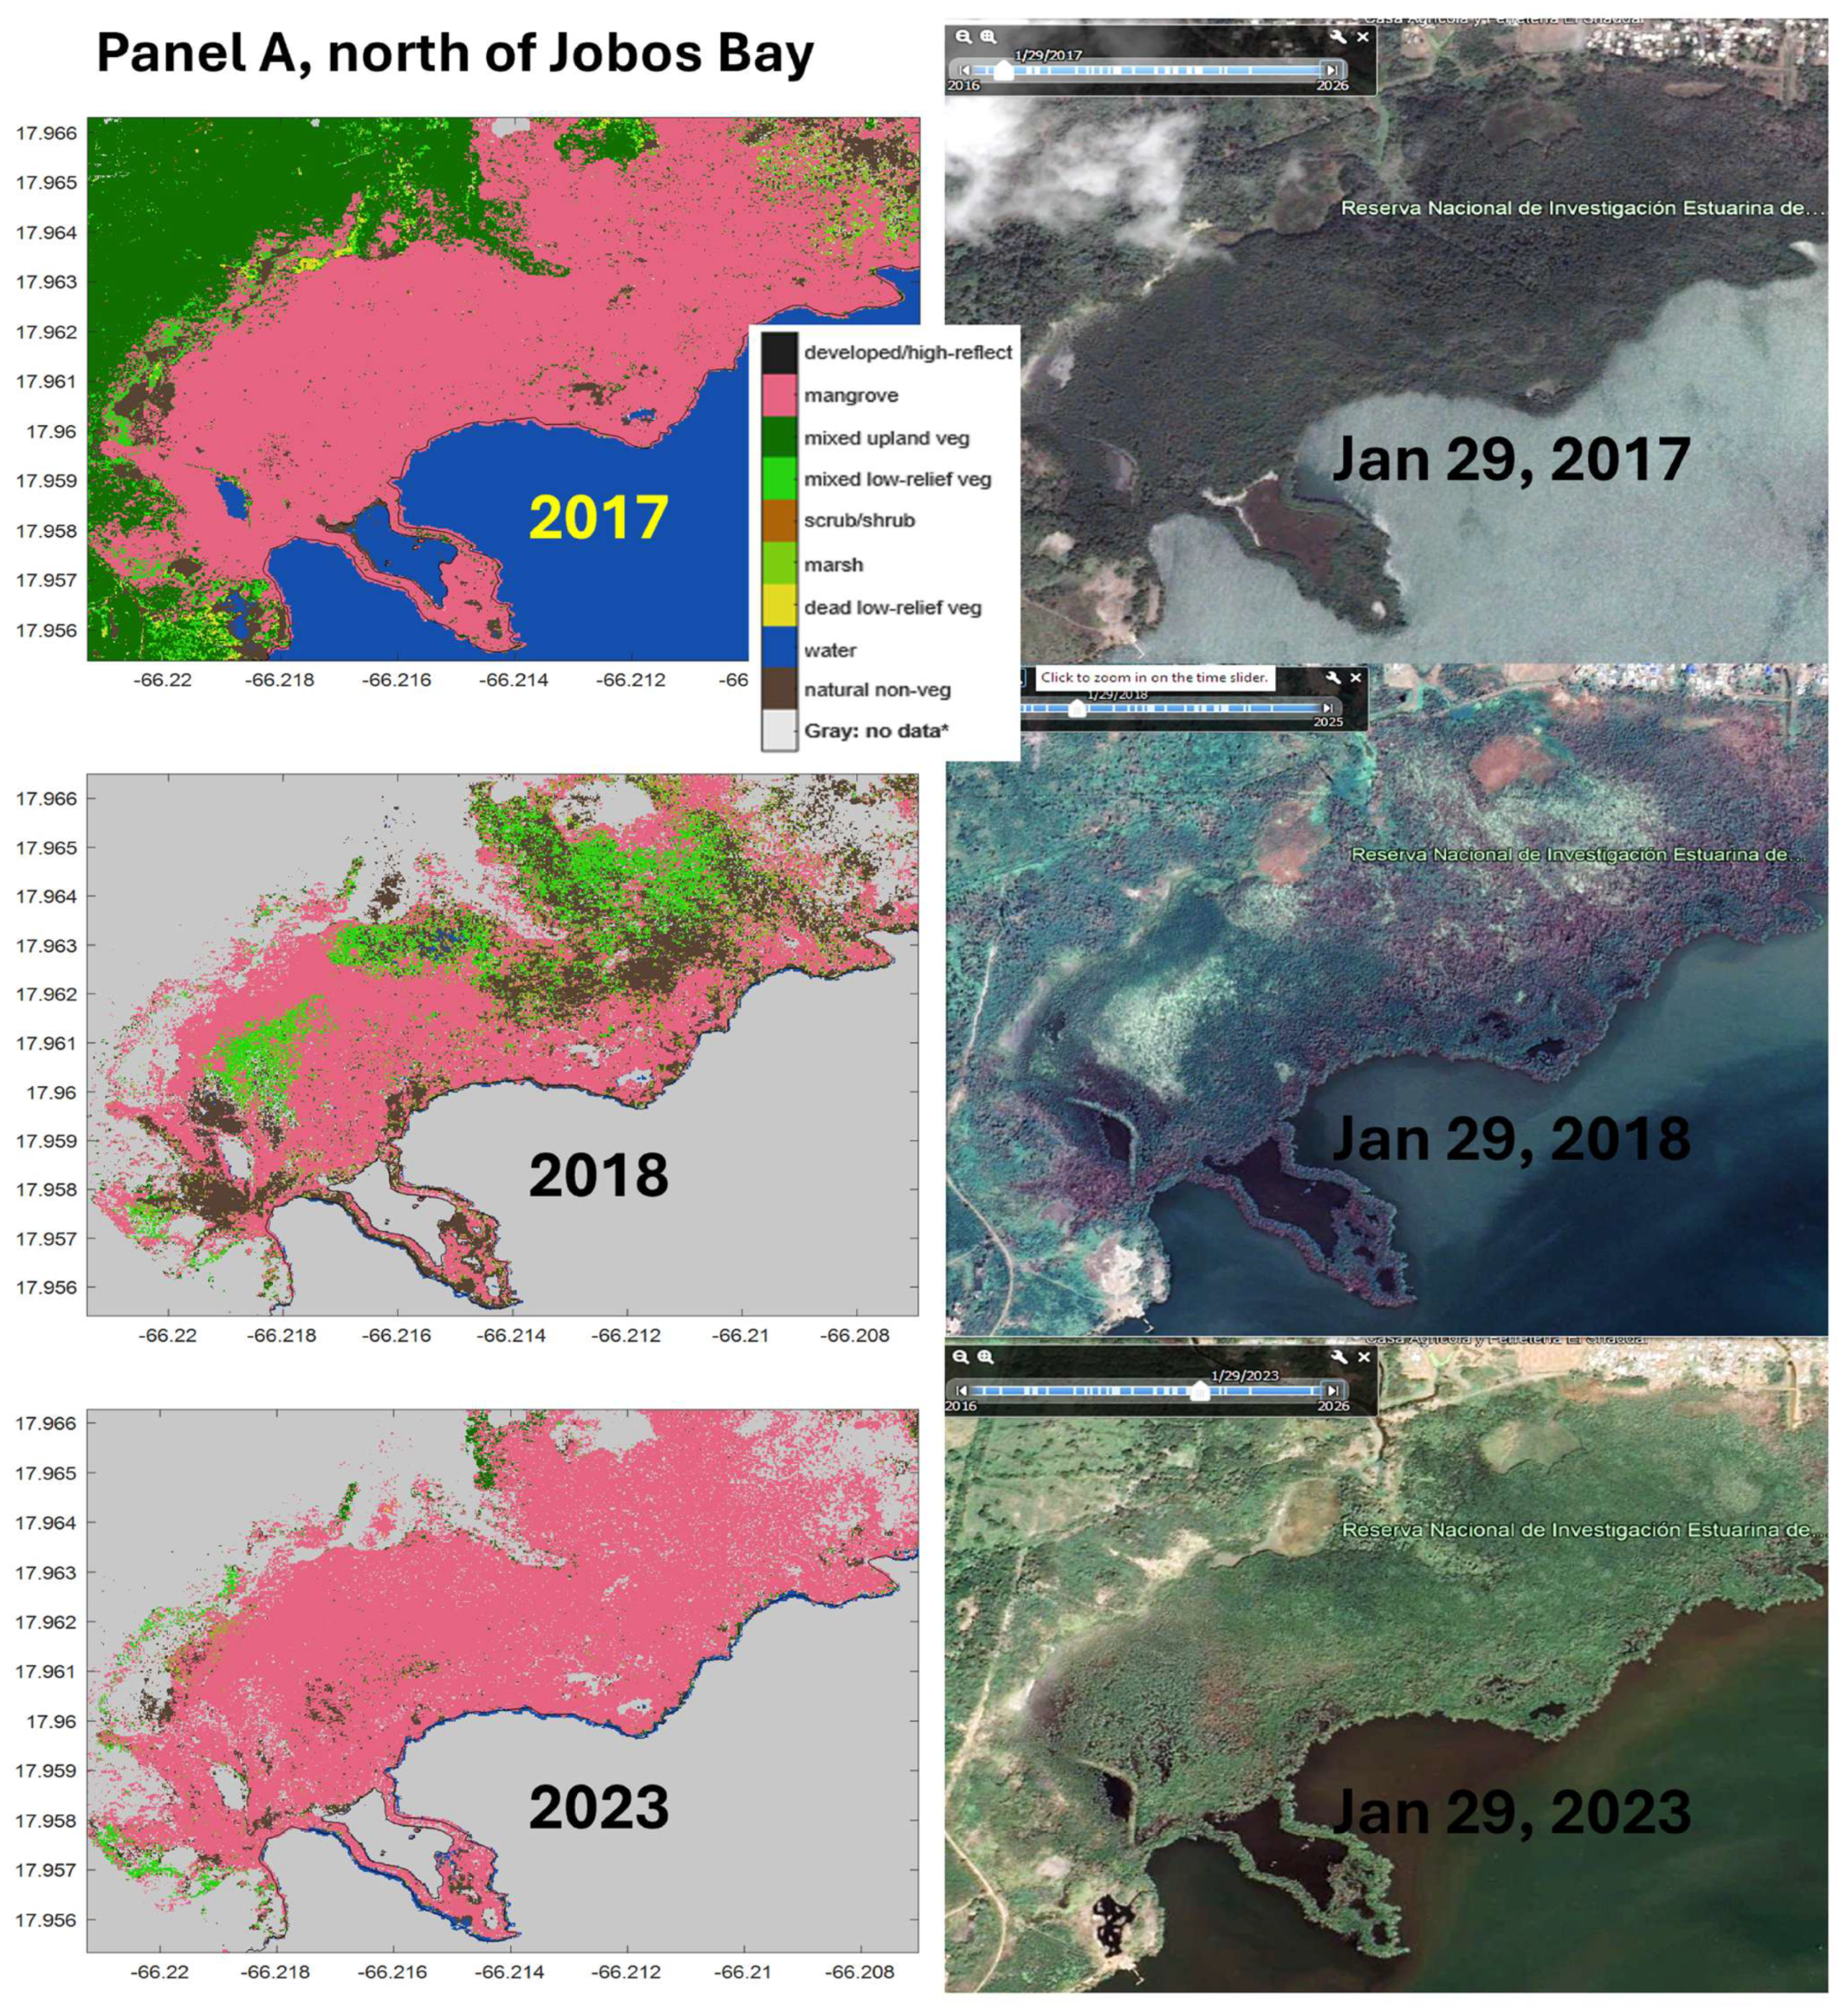
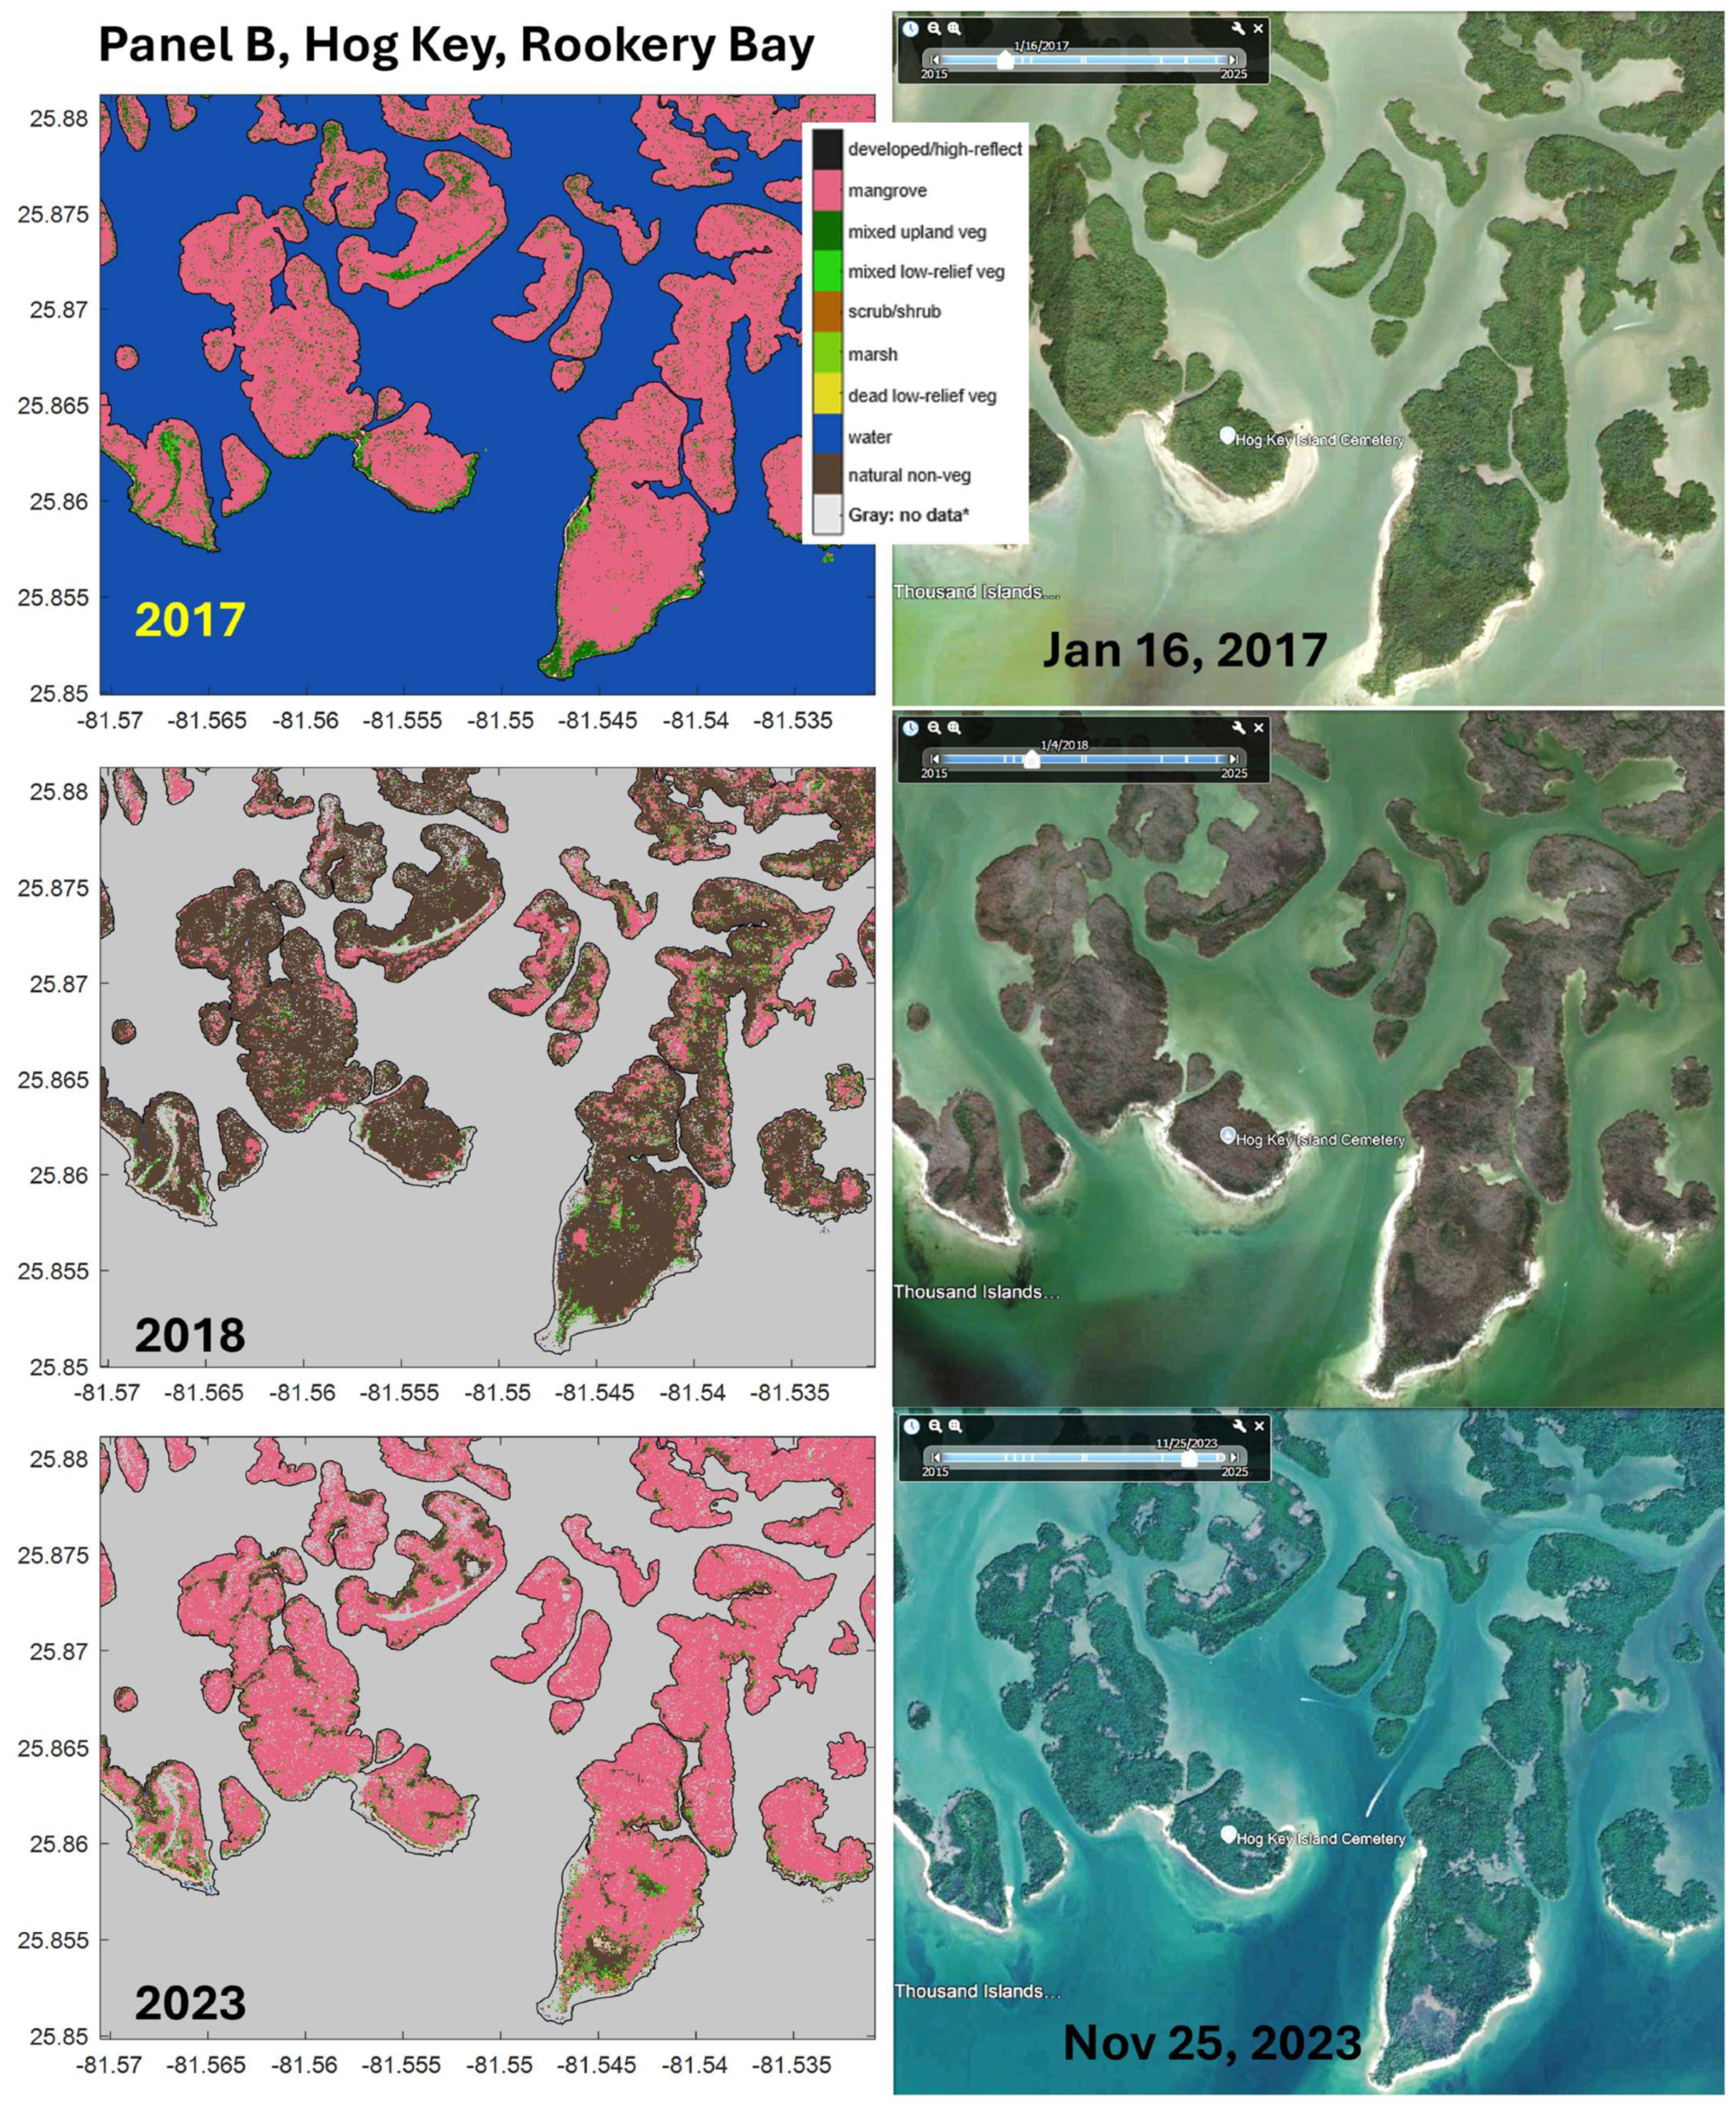
Figure A4.
Interannual spatial extent of mangrove canopy loss (red) and gain (blue) in Jobos Bay. Maps were derived from pixel-wise differences between annual mosaics (current year minus a previous year), using only pixels classified as mangrove in 2017. Top: 2018–2017, highlighting widespread canopy loss following Hurricane Maria, with extensive areas of mangrove disturbance (red). Bottom: 2024–2017, showing partial recovery seven years post-storm, including areas that returned to 2017 mangrove extent (gray), limited expansion beyond 2017 levels (blue), and persistent deficits where mangroves did not recover (red). Notable non-recovery areas include the eastern portion of the Aguirre State Forest (blue square), and parts of Mar Negro (green square; Camino del Indio), detailed further in Figures S7 and S8.
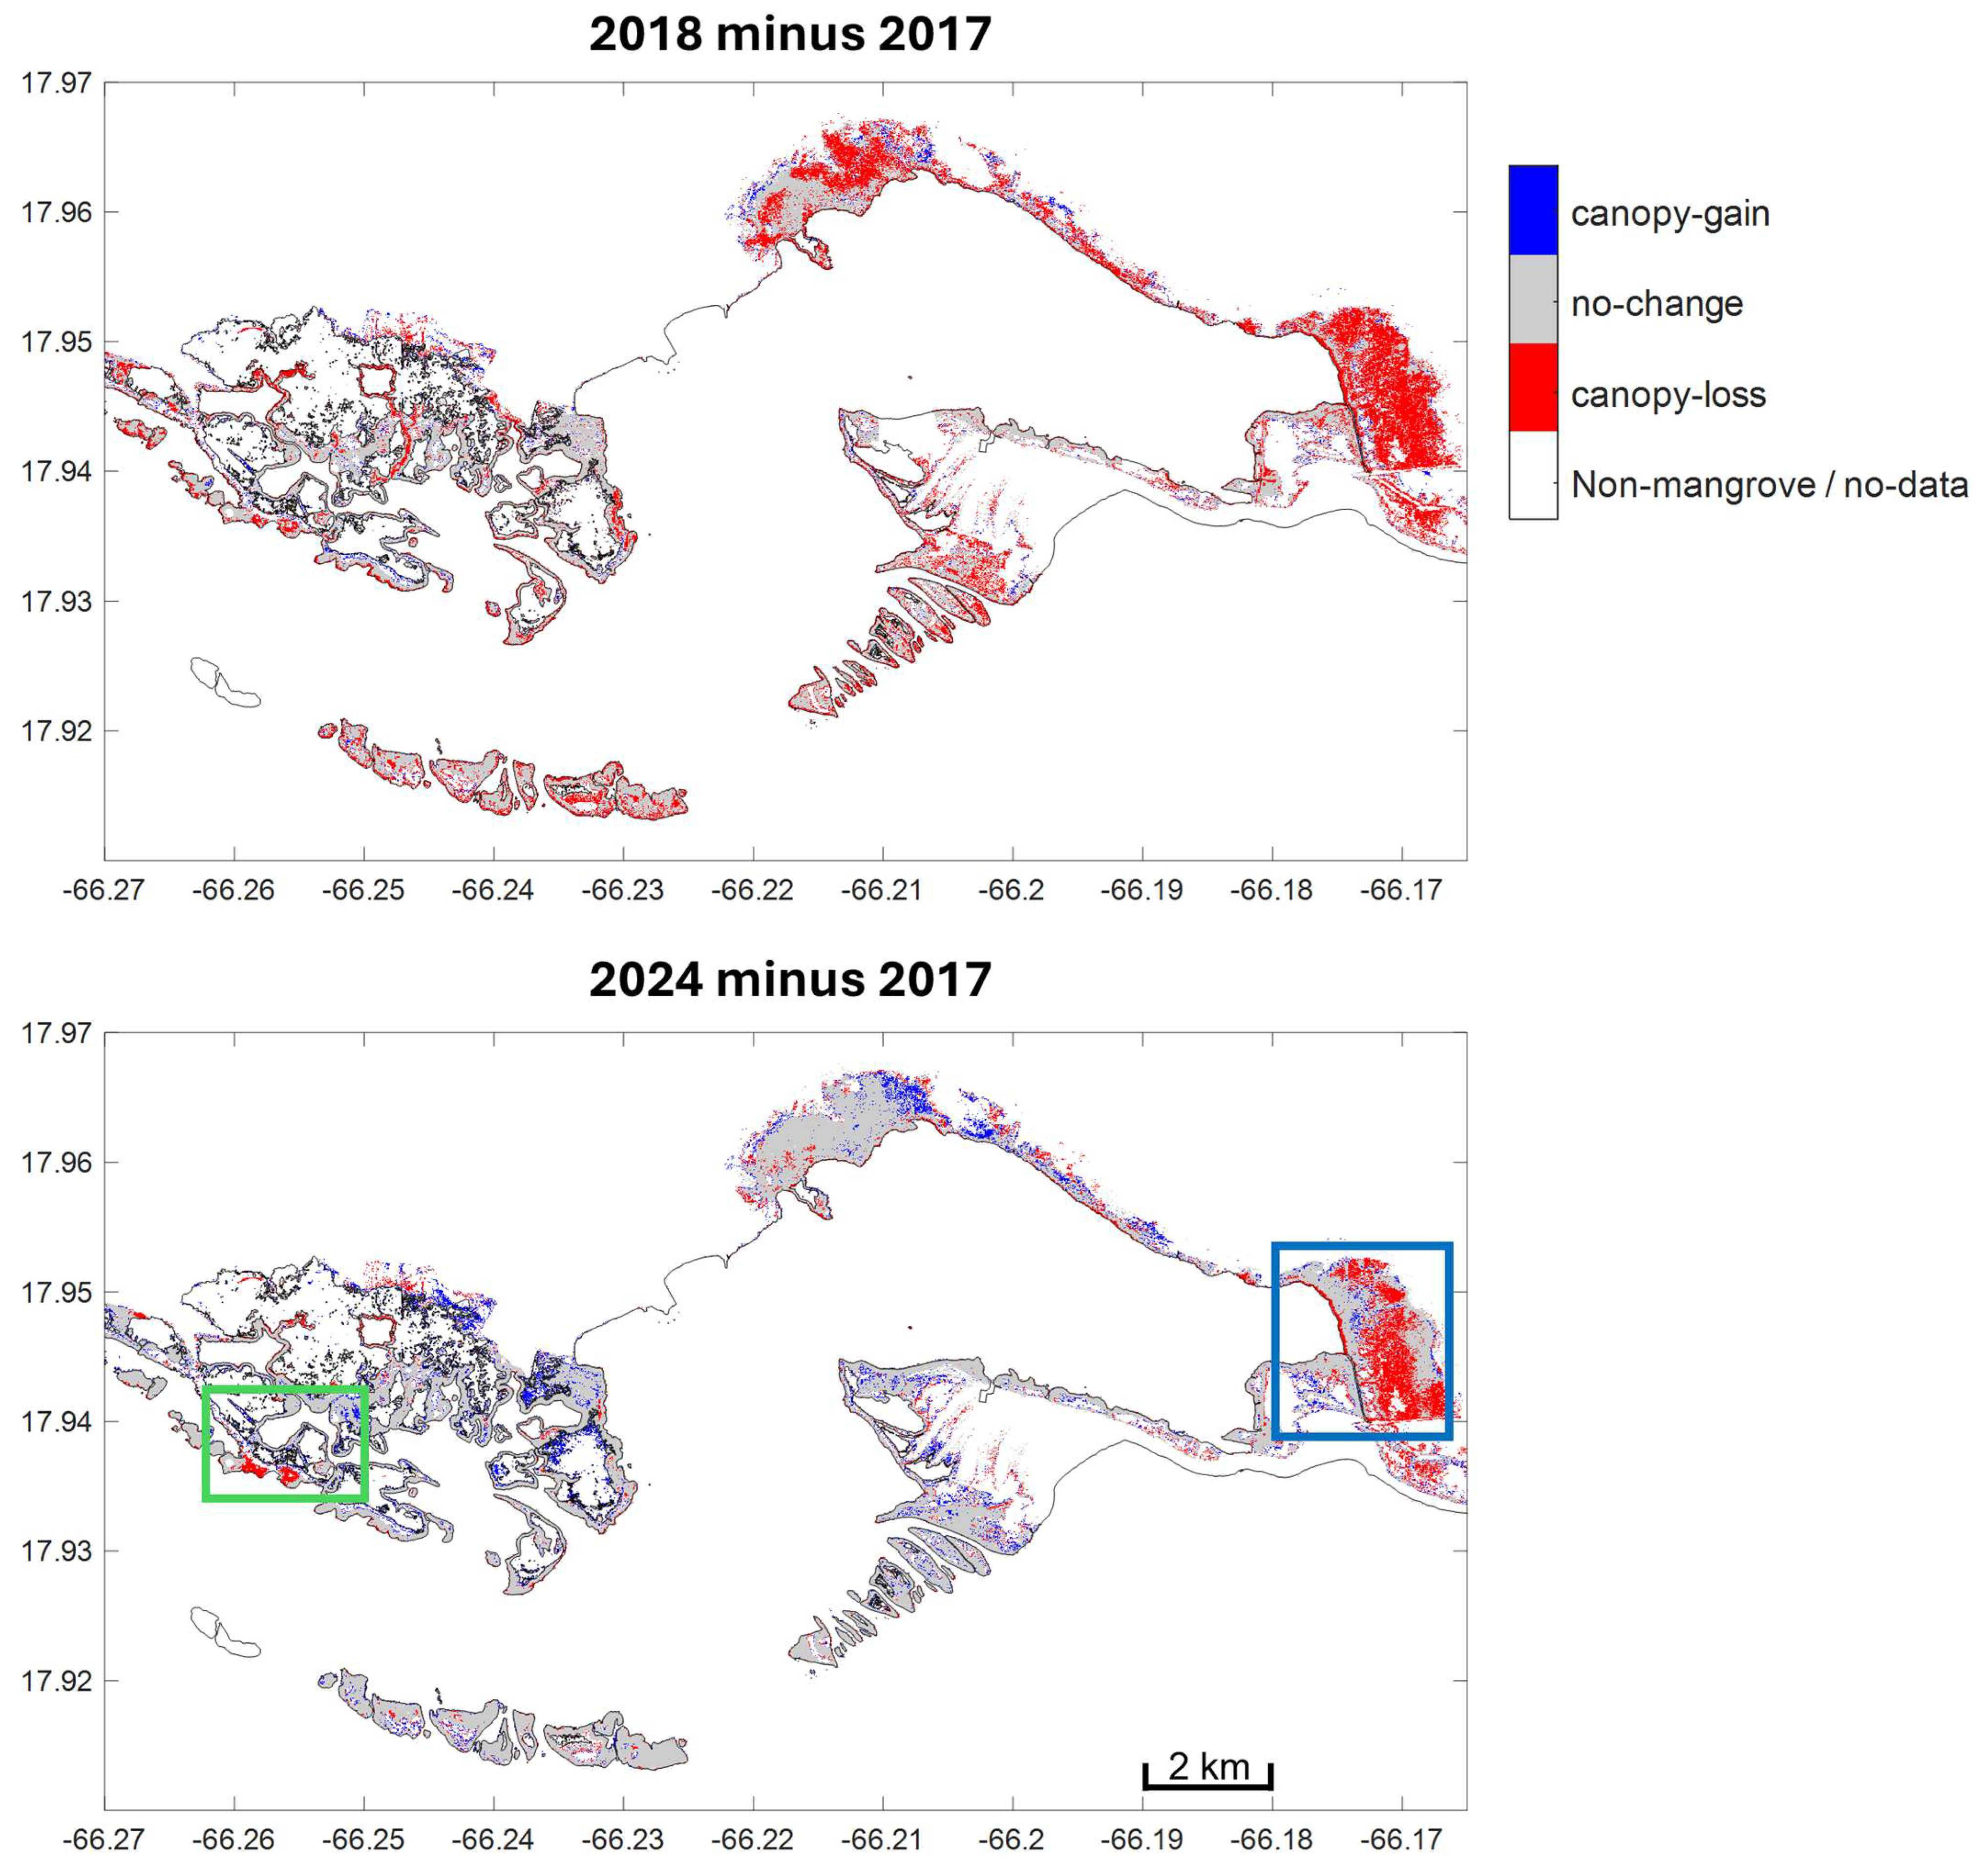
References
- Blankespoor, B.; Dasgupta, S.; Lange, G.-M. Mangroves as a protection from storm surges in a changing climate. Ambio 2017, 46, 478–491. [Google Scholar] [CrossRef] [Scilit]
- Herrera Silveira, J.A.; Teutli Hernandez, C.; Secaira Fajardo, F.; Braun, R.; Bowman, J.; Geselbracht, L.; Musgrove, M.; Rogers, M.; Schmidt, J.; Robles Toral, P.J.; et al. Hurricane Damages to Mangrove Forests and Post-Storm Restoration Techniques and Costs; The Nature Conservancy: Arlington, VA, USA, 2022; Available online: https://www.nature.org/content/dam/tnc/nature/en/documents/TNC_MangroveHurricaneDamages_Report.pdf (accessed on 1 June 2026).
- Velázquez-Salazar, S.; Valderrama-Landeros, L.; Villeda-Chávez, E.; Cervantes-Rodríguez, C.G.; Troche-Souza, C.; Alcántara-Maya, J.A.; Vázquez-Balderas, B.; Rodríguez-Zúñiga, M.T.; Cruz-López, M.I.; Flores-de-Santiago, F. Mangrove Damage and Early-Stage Canopy Recovery Following Hurricane Roslyn in Marismas Nacionales, Mexico. Forests 2025, 16, 1207. [Google Scholar] [CrossRef] [Scilit]
- Smith, T.J.; Anderson, G.H.; Balentine, K.; Tiling, G.; Ward, G.A.; Whelan, K.R.T. Cumulative impacts of hurricanes on Florida mangrove ecosystems: Sediment deposition, storm surges and vegetation. Wetlands 2009, 29, 24–34. [Google Scholar] [CrossRef] [Scilit]
- Krauss, K.W.; Osland, M.J. Tropical cyclones and the organization of mangrove forests: A review. Ann. Bot. 2020, 125, 213–234. [Google Scholar] [CrossRef] [Scilit]
- Reed, D.; Chavez, S.; Castañeda-Moya, E.; Oberbauer, S.F.; Troxler, T.; Malone, S. Resilience to Hurricanes Is High in Mangrove Blue Carbon Forests. Glob. Change Biol. 2025, 31, e70124. [Google Scholar] [CrossRef] [Scilit]
- McCarthy, M.J.; Jessen, B.; Barry, M.J.; Figueroa, M.; McIntosh, J.; Murray, T.; Schmid, J.; Muller-Karger, F.E. Automated High-Resolution Time Series Mapping of Mangrove Forests Damaged by Hurricane Irma in Southwest Florida. Remote Sens. 2020, 12, 1740. [Google Scholar] [CrossRef] [Scilit]
- Lagomasino, D.; Fatoyinbo, T.; Castañeda-Moya, E.; Cook, B.D.; Montesano, P.M.; Neigh, C.S.R.; Corp, L.A.; Ott, L.E.; Chavez, S.; Morton, D.C. Storm surge and ponding explain mangrove dieback in southwest Florida following Hurricane Irma. Nat. Commun. 2021, 12, 4003. [Google Scholar] [CrossRef] [Scilit]
- Sunkur, R.; Kantamaneni, K.; Bokhoree, C.; Rathnayake, U.; Fernando, M. Mangrove mapping and monitoring using remote sensing techniques towards climate change resilience. Sci. Rep. 2024, 14, 6949. [Google Scholar] [CrossRef] [Scilit]
- McCarthy, M.J.; Jessen, B.; Barry, M.J.; Figueroa, M.; McIntosh, J.; Murray, T.; Schmid, J.; Muller-Karger, F.E. Mapping hurricane damage: A comparative analysis of satellite monitoring methods. Int. J. Appl. Earth Obs. Geoinf. 2020, 91, 102134. [Google Scholar] [CrossRef] [Scilit]
- Asbridge, E.; Krause, C.; Lucas, R.; Owers, C.J.; Rogers, K.; Lymburner, L.; Mueller, N.; Ai, E.; Wong, S. Characterising the short- and long-term impacts of tropical cyclones on mangroves using the Landsat archive. Camb. Prism. Coast. Future 2025, 3, e4. [Google Scholar] [CrossRef] [Scilit]
- Radabaugh, K.R.; Moyer, R.P.; Chappel, A.R.; Dontis, E.E.; Russo, C.E.; Joyse, K.M.; Bownik, M.W.; Goeckner, A.H.; Khan, N.S. Mangrove Damage, Delayed Mortality, and Early Recovery Following Hurricane Irma at Two Landfall Sites in Southwest Florida, USA. Estuaries Coasts 2020, 43, 1104–1118. [Google Scholar] [CrossRef] [Scilit]
- Taillie, P.J.; Roman-Cuesta, R.; Lagomasino, D.; Cifuentes-Jara, M.; Fatoyinbo, T.; Ott, L.E.; Poulter, B. Widespread mangrove damage resulting from the 2017 Atlantic mega hurricane season. Environ. Res. Lett. 2020, 15, 064010. [Google Scholar] [CrossRef] [Scilit]
- Imbert, D. Hurricane disturbance and forest dynamics in east Caribbean mangroves. Ecosphere 2018, 9, e02231. [Google Scholar] [CrossRef] [Scilit]
- Vizcaya-Martínez, D.A.; Flores-de-Santiago, F.; Valderrama-Landeros, L.; Serrano, D.; Rodríguez-Sobreyra, R.; Álvarez-Sánchez, L.F.; Flores-Verdugo, F. Monitoring detailed mangrove hurricane damage and early recovery using multisource remote sensing data. J. Environ. Manag. 2022, 320, 115830. [Google Scholar] [CrossRef] [Scilit]
- Routhier, M.R.; Moore, G.E.; Rock, B.N.; Glidden, S.; Duckett, M.; Zaluski, S. Assessing Mangrove Forest Recovery in the British Virgin Islands After Hurricanes Irma and Maria with Sentinel-2 Imagery and Google Earth Engine. Remote Sens. 2025, 17, 2485. [Google Scholar] [CrossRef] [Scilit]
- NERRS Science Collaborative. Mangrove Coast Collaborative/Colaboración en Mangles Costeros: Understanding Links Between Degradation, Recovery, and Community Benefits. Project Summary. National Estuarine Research Reserve System (NERRS) Science Collaborative. 2020. Available online: https://nerrssciencecollaborative.org/project/Ogurcak20 (accessed on 1 June 2026).
- NERRS Science Collaborative. Limits of Resilience: Uncertain Recovery in Mangrove Ecosystems Following Repeated Hurricane Disturbance. Project Summary. National Estuarine Research Reserve System (NERRS) Science Collaborative. 2023. Available online: https://nerrssciencecollaborative.org/project/Ogurcak23 (accessed on 1 June 2026).
- Office for Coastal Management. Limits of Resilience: Uncertain Recovery in Mangrove Ecosystems Following Repeated Hurricane Disturbance—NERRS/NSC (NERRS Science Collaborative). NOAA InPort. 2026. Available online: https://www.fisheries.noaa.gov/inport/item/77784 (accessed on 1 June 2026).
- Office for Coastal Management. Mangrove Coast Collaborative/Colaboración en Mangles Costeros: Understanding Links Between Degradation, Recovery, and Community Benefits—NERRS/NSC (NERRS Science Collaborative). NOAA InPort. 2026. Available online: https://www.fisheries.noaa.gov/inport/item/77779 (accessed on 1 June 2026).
- McCarthy, M.J.; Merton, E.J.; Muller-Karger, F.E. Improved coastal wetland mapping using very-high 2-meter spatial resolution imagery. Int. J. Appl. Earth Obs. Geoinf. 2015, 40, 11–18. [Google Scholar] [CrossRef] [Scilit]
- McCarthy, M.J.; Radabaugh, K.R.; Moyer, R.P.; Muller-Karger, F.E. Enabling efficient, large-scale high-spatial resolution wetland mapping using satellites. Remote Sens. Environ. 2018, 208, 189–201. [Google Scholar] [CrossRef] [Scilit]
- Hedgpeth, J.; Ogurcak, D.; Jessen, B.; Rueda-Roa, D.; Murray, T.; Muller-Karger, F.; Sara Mason, S.; Figueroa, M.; McIntosh, J.; Jobos Bay NERR staff; et al. Collaboration on the Coast, Mangrove Coast Collaborative. ArcGIS StoryMaps. 2026. Available online: https://storymaps.arcgis.com/stories/fa2c111c0a624553907e8a68e82ec39e (accessed on 1 June 2026).
- National Hurricane Center. NHC GIS Archive: Tropical Cyclone Best Track Data. NOAA National Hurricane Center. Available online: https://www.nhc.noaa.gov/gis/archive_besttrack.php (accessed on 1 June 2026).
- Tomlinson, P.B. The Botany of Mangroves, 2nd ed.; Cambridge University Press: Cambridge, UK, 2016. [Google Scholar] [CrossRef] [Scilit]
- Martínez, R.; Cintron, G.; Encarnacion, L.A. Mangroves in Puerto Rico: A Structural Inventory; Final Report to the Office of Coastal Zone Management; NOAA: Silver Spring, MD, USA, 1979. Available online: https://repository.library.noaa.gov/view/noaa/2142 (accessed on 1 June 2026).
- Odum, W.E.; McIvor, C.C. Chapter 15: Mangroves. In Ecosystems of Florida; University of Central Florida Press: Orlando, FL, USA, 1990; pp. 517–548. [Google Scholar]
- Cangialosi, J.P.; Latto, A.S.; Berg, R. National Hurricane Center Tropical Cyclone Report Hurricane Irma (AL112017), 30 August–12 September 2017; National Hurricane Center: Miami, FL, USA, 2026. Available online: https://www.nhc.noaa.gov/data/tcr/AL112017_Irma.pdf (accessed on 1 June 2026).
- Pasch, R.J.; Penny, A.B.; Berg, R. National Hurricane Center Tropical Cyclone Report Hurricane Maria (AL152017), 6–30 September 2017; National Hurricane Center: Miami, FL, USA, 2023. Available online: https://www.nhc.noaa.gov/data/tcr/AL152017_Maria.pdf (accessed on 1 June 2026).
- Bucci, L.; Alaka, L.; Hagen, A.; Delgado, S.; Beven, J. National Hurricane Center Tropical Cyclone Report. Hurricane Ian (AL092022), 23–30 September 2022; National Hurricane Center: Miami, FL, USA, 2026. Available online: https://www.nhc.noaa.gov/data/tcr/AL092022_Ian.pdf (accessed on 1 June 2026).
- Pasch, R.J.; Reinhart, B.J.; Alaka, L. National Hurricane Center Tropical Cyclone Report: Hurricane Fiona (AL072022), 14–23 September 2022; National Hurricane Center: Miami, FL, USA, 2022. Available online: https://www.nhc.noaa.gov/data/tcr/AL072022_Fiona.pdf (accessed on 1 June 2026).
- NERRS Science Collaborative. Datasets: Field Assessment Data, Hydrologic Monitoring Data, Habitat Maps, and Mangrove Interannual Change Maps for Jobos Bay and Rookery Bay NERRs Associated with the Mangrove Coast Collaborative Project; NERRS Science Collaborative: Ann Arbor, MI, USA; Available online: https://nerrssciencecollaborative.org/sites/default/files/data%20descriptions/Dataset%20Description_Ogurcak20%20and%20Ogurcak23.pdf (accessed on 1 June 2026).
- USF-IMaRS. Processing Scripts for Decision-Tree Land Use Classification on WorldView Images. University of South Florida/Institute of Marine Remote Sensing (USF/IMaRS). Available online: https://github.com/USF-IMARS/wv-land-cover/tree/master (accessed on 1 June 2026).
- NASA. CSDA Vendor—Vantor, WorldView-[2/3]. 2026. Available online: https://www.earthdata.nasa.gov/about/csda/vendor-maxar (accessed on 1 June 2026).
- European Union/ESA/Copernicus. Copernicus DEM—Global and European Digital Elevation Model. Located at: Copernicus GLO-30. 2019. Available online: https://dataspace.copernicus.eu/explore-data/data-collections/copernicus-contributing-missions/collections-description/COP-DEM (accessed on 1 June 2026).
- Polar Geospatial Center Contributors. PGC Imagery Utils. GitHub. 2017. Available online: https://github.com/PolarGeospatialCenter/imagery_utils (accessed on 1 June 2026).
- GDAL/OGR Contributors. GDAL/OGR Geospatial Data Abstraction Software Library. Open Source Geospatial Foundation. 2022. Available online: https://zenodo.org/records/21992619 (accessed on 1 June 2022). [CrossRef]
- National Geodetic Survey. NOAA NGS Continually Updated Shoreline Product (CUSP). 2024. Available online: https://shoreline.noaa.gov/cusp.html (accessed on 1 June 2026).
- Gorelick, N.; Hancher, M.; Dixon, M.; Ilyushchenko, S.; Thau, D.; Moore, R. Google Earth Engine: Planetary-scale geospatial analysis for everyone. Remote Sens. Environ. 2017, 202, 18–27. [Google Scholar] [CrossRef] [Scilit]
- Sammut, C.; Webb, G.I. (Eds.) Encyclopedia of Machine Learning and Data Mining; Springer: Boston, MA, USA, 2017. [Google Scholar] [CrossRef] [Scilit]
- European Space Agency (ESA). SentiWiki—Copernicus Sentinel-2. S2 Mission: Overview of Sentinel-2 Mission. 2025. Available online: https://sentiwiki.copernicus.eu/web/s2-mission (accessed on 1 June 2026).
- NASA Goddard Earth Sciences DISC. Sentinel 2 Multispectral Imager (MSI). 2024. Available online: https://www.earthdata.nasa.gov/data/instruments/sentinel-2-msi (accessed on 1 June 2026).
- European Union/ESA/Copernicus. Harmonized Sentinel-2 MSI: MultiSpectral Instrument, Level-2A (SR). The Harmonized Sentinel-2 MSI Level-2A (SR) Dataset Provides Wide-Swath, High-Resolution, Multi-Spectral Imaging for Land Monitoring. Earth Engine Data Catalog. Available online: https://developers.google.com/earth-engine/datasets/catalog/COPERNICUS_S2_SR_HARMONIZED (accessed on 1 June 2026).
- Sentinel Hub. Sentinel-2 Cloud Probability (S2_HARMONIZED V1). Google Earth Engine. 2026. Available online: https://developers.google.com/earth-engine/datasets/catalog/COPERNICUS_S2_CLOUD_PROBABILITY (accessed on 1 June 2026).
- Rouse, J.W.; Haas, R.H.; Schell, J.A.; Deering, D.W. Monitoring Vegetation Systems in the Great Plains with ERTS. 1974. Available online: https://ntrs.nasa.gov/api/citations/19740022614/downloads/19740022614.pdf (accessed on 1 June 2026).
- USGS. Sentinel 2 Multispectral Imager (MSI). Landsat Missions. 2025. Available online: https://www.usgs.gov/landsat-missions (accessed on 1 June 2026).
- USGS. USGS Landsat 8 Level 2, Collection 2, Tier 1. Google Earth Engine. 2026. Available online: https://developers.google.com/earth-engine/datasets/catalog/LANDSAT_LC08_C02_T1_L2 (accessed on 1 June 2026).
- USGS. USGS Landsat 9 Level 2, Collection 2, Tier 1. Google Earth Engine. 2026. Available online: https://developers.google.com/earth-engine/datasets/catalog/LANDSAT_LC09_C02_T1_L2 (accessed on 1 June 2026).
- Thomas, N.; Bunting, P.; Lucas, R.; Hardy, A.; Rosenqvist, A.; Fatoyinbo, T. Mapping Mangrove Extent and Change: A Globally Applicable Approach. Remote Sens. 2018, 10, 1466. [Google Scholar] [CrossRef] [Scilit]
- Bunting, P.; Rosenqvist, A.; Hilarides, L.; Lucas, R.M.; Thomas, N.; Tadono, T.; Worthington, T.A.; Spalding, M.; Murray, N.J.; Rebelo, L.-M. Global Mangrove Extent Change 1996–2020: Global Mangrove Watch Version 3.0. Remote Sens. 2022, 14, 3657. [Google Scholar] [CrossRef] [Scilit]
- Kathiroli, R.; Madhumitha, P.S.; Achyut Prasad, D.C.; Sandhiya, S. Spatiotemporal analysis of mangroves using median composites and convolutional neural network. Sci. Rep. 2025, 15, 26999. [Google Scholar] [CrossRef] [Scilit]
- Mauri, M.; Elli, T.; Caviglia, G.; Uboldi, G.; Azzi, M. RAWGraphs: A Visualisation Platform to Create Open Outputs. In Proceedings of the 12th Biannual Conference on Italian SIGCHI Chapter; ACM: Cagliari, Italy, 2017; pp. 1–5. [Google Scholar] [CrossRef] [Scilit]
- NERRS Science Collaborative. Management Brief for the Mangrove Coast Collaborative. National Estuarine Research Reserve System (NERRS) Science Collaborative. 2025. Available online: https://nerrssciencecollaborative.org/sites/default/files/resources/Online%20Copy%20of%20Management%20Brief%20for%20the%20MCC.pdf (accessed on 1 June 2026).
- Lakens, D. Equivalence Tests: A Practical Primer for t Tests, Correlations, and Meta-Analyses. Soc. Psychol. Personal. Sci. 2017, 8, 355–362. [Google Scholar] [CrossRef] [Scilit]
- Lakens, D.; Scheel, A.M.; Isager, P.M. Equivalence Testing for Psychological Research: A Tutorial. Adv. Methods Pract. Psychol. Sci. 2018, 1, 259–269. [Google Scholar] [CrossRef] [Scilit]
- Holm, S. A Simple Sequentially Rejective Multiple Test Procedure. Scand. J. Stat. 1979, 6, 65–70. [Google Scholar]
- Howe, J.; Merchant, S.; Hernández, W.J.; Pessutti, J.; Groffman, P. Assessing mangrove canopy height and health changes in Puerto Rico post-Hurricane Maria using remote-sensing techniques. Ecosphere 2025, 16, e70226. [Google Scholar] [CrossRef] [Scilit]
- Xiong, L.; Lagomasino, D.; Charles, S.P.; Castañeda-Moya, E.; Cook, B.D.; Redwine, J.; Fatoyinbo, L. Quantifying mangrove canopy regrowth and recovery after Hurricane Irma with large-scale repeat airborne lidar in the Florida Everglades. Int. J. Appl. Earth Obs. Geoinf. 2022, 114, 103031. [Google Scholar] [CrossRef] [Scilit]
- Peereman, J.; Hogan, J.A.; Lin, T. Disturbance frequency, intensity and forest structure modulate cyclone-induced changes in mangrove forest canopy cover. Glob. Ecol. Biogeogr. 2022, 31, 37–50. [Google Scholar] [CrossRef] [Scilit]
- Medina-Calderón, J.H.; Mancera-Pineda, J.E.; Castañeda-Moya, E.; Rivera-Monroy, V.H. Hydroperiod and Salinity Interactions Control Mangrove Root Dynamics in a Karstic Oceanic Island in the Caribbean Sea (San Andres, Colombia). Front. Mar. Sci. 2021, 7, 598132. [Google Scholar] [CrossRef] [Scilit]
- Trench, C.A. Hydrological Restoration Approaches for Degraded Mangrove Forests in Jamaica. Doctoral Dissertation, University of West Indies, Mona, Jamaica, 2021. [Google Scholar]
- Lewis, R.R.; Milbrandt, E.C.; Brown, B.; Krauss, K.W.; Rovai, A.S.; Beever, J.W.; Flynn, L.L. Stress in Mangrove forests: Early detection and preemptive rehabilitation are essential for future successful worldwide mangrove forest management. Mar. Pollut. Bull. 2016, 109, 764–771. [Google Scholar] [CrossRef] [Scilit]
- NOAA National Estuarine Research Reserve System. NOAA National Estuarine Research Reserve (NERR) System-Wide Monitoring Program Meteorological, Water Quality and Nutrient/Pigment Data from 1994 to 2024. (NCEI Accession 0200366). NOAA National Centers for Environmental Information. 2019. Available online: https://www.ncei.noaa.gov/archive/accession/0200366 (accessed on 19 August 2026).
- Doyle, T.W.; Smith, T.J.; Robblee, M.B. Wind damage effects of Hurricane Andrew on mangrove communities along the southwest coast of Florida, USA. J. Coast. Res. 1995, 21, 159–168. [Google Scholar]
- Castañeda-Moya, E.; Rivera-Monroy, V.H.; Chambers, R.M.; Zhao, X.; Lamb-Wotton, L.; Gorsky, A.; Gaiser, E.E.; Troxler, T.G.; Kominoski, J.S.; Hiatt, M. Hurricanes fertilize mangrove forests in the Gulf of Mexico (Florida Everglades, USA). Proc. Natl. Acad. Sci. USA 2020, 117, 4831–4841. [Google Scholar] [CrossRef] [Scilit]
Disclaimer/Publisher’s Note: The statements, opinions and data contained in all publications are solely those of the individual author(s) and contributor(s) and not of MDPI and/or the editor(s). MDPI and/or the editor(s) disclaim responsibility for any injury to people or property resulting from any ideas, methods, instructions or products referred to in the content. |
© 2026 by the authors. Licensee MDPI, Basel, Switzerland. This article is an open access article distributed under the terms and conditions of the Creative Commons Attribution (CC BY) license.