


Highlights
What are the main findings?
- Python-based automated InSAR workflow to generate PS and SBAS interferograms for time-series analysis using LiCSBAS and StaMPS;
- Demonstration of the proposed workflow in three different study areas based on study area position in Sentinel frame footprints.
What are the implications of the main findings?
- PS and SBAS interferometric stacks can be generated using a single workflow in major operating systems, widening accessibility and reducing the learning curve;
- This workflow supports reproducible MT-InSAR preprocessing for surface deformation studies and geohazard monitoring.
Abstract
Interferometric Synthetic Aperture Radar (InSAR) is a satellite–based remote sensing technique capable of measuring surface displacement. However, InSAR measurements can be affected by temporal decorrelation, baseline geometry, and surface characteristics. Persistent scatterer (PS) and small baseline subset (SBAS) are two widely used multi-temporal InSAR techniques for addressing these limitations. Processing SAR acquisitions to derive deformation maps and displacement time series requires a series of complex steps. Many existing open-source and commercial software packages support PS or SBAS, while some support both methods, each with its own challenges and limitations. In this study, we presnet SNAPxtra, a Python-based InSAR automatic workflow to generate PS and SBAS interferometric stacks. These can be exported in the format required for time-series analysis in LiCSBAS and StaMPS. SNAPxtra has automated master selection, multi-swath and multi-frame processing, polygon-based masking, trial processing, and network generation features within an integrated workflow. The reproducibility and adaptability of SNAPxtra are demonstrated through case studies in Quetta (Pakistan), Surat (India), and Fort Worth (USA) as case studies using both PS and SBAS methods.
1. Introduction
Interferometric Synthetic Aperture Radar (InSAR) has proven to be an effective space-geodetic technique for monitoring and quantifying surface deformation due to natural and anthropogenic causes. This technique has been widely used to study various geohazards, such as subsidence [1,2,3,4], landslides [5], and volcanic deformation [6], as well as to monitor the stability of human-built infrastructures [7,8,9]. These applications improve our understanding of geophysical processes, help to mitigate future risks, prevent economic losses, and enhance the resilience and lifespan of critical infrastructure. Sentinel-1 SAR mission launched in 2014 and 2016 as part of the European Space Agency’s (ESA) Copernicus Program provides free public access to large archives of SAR images worldwide. Sentinel radar sensors use C-band frequency and have a revist time of 6-12 days, providing improved temporal resolution compared to previous SAR missions [10]. Its systematic global coverage, interferometric wide (IW) swath acquisition mode for extensive area coverage, and dual-polarization capability have significantly advanced the monitoring of surface deformation. The availability of freely accessible SAR datasets has facilitated the development of numerous open-source and commercial InSAR software packages, enabling more accurate and continuous monitoring of surface deformation using Sentinel acquisitions.
The early adopted InSAR method was the differential synthetic aperture radar (DInSAR) technique, which subtracts the phase of two SAR data acquisitions at different times over the same study area [11,12]. DInSAR is highly effective for detecting rapid deformation associated with geohazards such as earthquakes and fault movements. Despite its advantages, DInSAR measurements can be affected by temporal and spatial decorrelation, orbital inaccuracies, and atmospheric noise [13]. Multi-temporal InSAR (MT-InSAR) extends conventional DInSAR by analyzing multiple SAR acquisitions to reduce noise, improve deformation estimates, and investigate long-term ground deformation. The two widely used MT-InSAR approaches are persistent scatterer interferometry (PSI) [14] and small baseline subset (SBAS) [15] for monitoring various geohazards.
PS is a single-master interferometric approach in which all SAR acquisitions are co-registered to common reference images to mitigate noise and enhance target coherence. SBAS utilizes a master–slave pairs network prepared with small perpendicular and temporal baselines to reduce decorrelation and increase signals by averaging distributed scatterers. Multilook reduces inherent speckle and improves phase estimates in low-coherence areas in pixels, which are preferred by the SBAS method, which measures average values over a pre-defined resampled grid of each pixel [16]. PS-InSAR is particularly suitable for urban built-up areas where artificial structures act as distinctive stable scatterers [17]. SBAS is broadly applied for large-scale deformation monitoring in areas characterized by rough terrain, dense vegetation, and a limited number of persistent radar targets. It utilizes a network of interferometric pairs with relatively short temporal and perpendicular baselines to minimize temporal and geometric decorrelation. SBAS interferograms are generally multilooked to reduce random phase noise and improve the signal-to-noise ratio (SNR) through spatial averaging of neighboring pixels, making the technique suitable for areas with limited persistent scatterers and slow linear and nonlinear deformation over time in low-coherence areas [18].
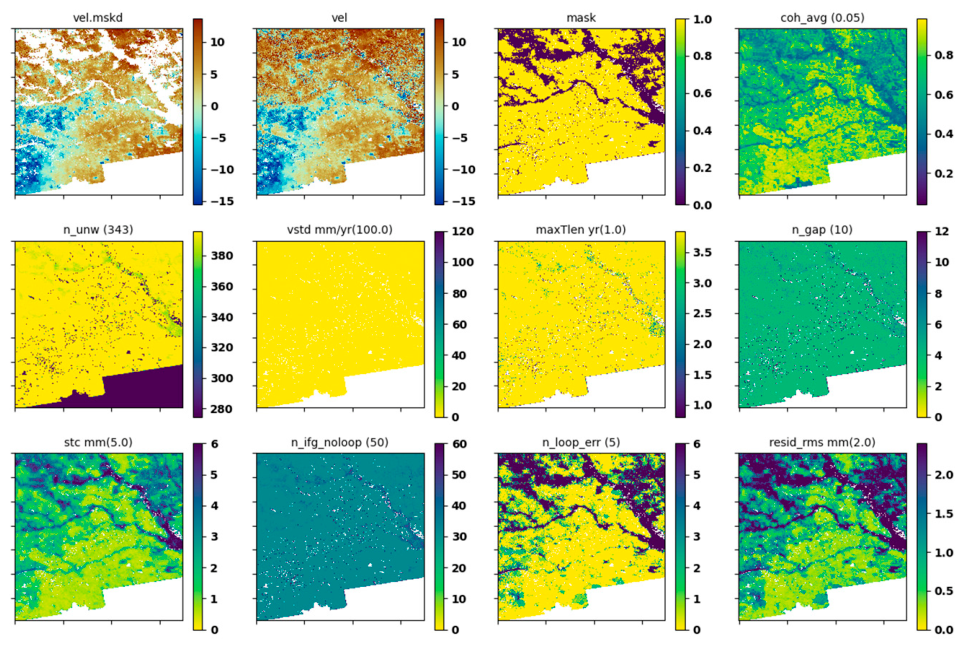
Several open-source and commercial InSAR software packages, such as GMTSAR [19], GAMMA [20], ENVI SARscape [21], SARPROZ [22] and ISCE, are available for interferometric processing and multi-temporal InSAR (MT-InSAR) analysis. Many of these packages provide comprehensive workflows covering interferogram generation and time-series analysis as an end-to-end processing solution. However, some InSAR software packages, such as StaMPS [23], MintPy [24], and PyRate [25], require externally prepared interferograms for deformation velocity estimation and time-series analysis. These software packages offer various processing algorithms, noise mitigation techniques, and computational capabilities, depending on their design and intended applications. Although many open-source packages have well-established documentation and active user communities, their installation, configuration, and operation can still be challenging without sufficient familiarity with various programming languages and software dependencies. The installation and configuration may vary among packages and operating systems. LiCSBAS [26] is a freely available, Python-based time-series analysis package that is relatively easy to install and operate. LiCSBAS is designed to process LiCSAR products, which consist of preprocessed unwrapped interferograms generated using GAMMA, and is made freely available through the COMET–LiCS web portal [27]. The LiCSBAS masking procedure evaluates nine noise indices, enabling users to inspect their effects on the results, as shown in Figure 1. Users can adjust the corresponding masking thresholds to retain or exclude noisy pixels, potentially improving the reliability of deformation measurements. However, the availability of LiCSAR products is geographically limited to the Himalayan belt and major volcanic areas, and they lack complete global coverage [28]. LiCSAR products are also already multilooked to a geographic pixel spacing of approximately 0.001°, whereas native or alternative spatial resolutions may be required for certain applications.
Figure 1.
Effects of noise-based pixel masking on the estimated velocity. Values in parentheses in the panel titles indicate the masking thresholds. The panels help users to assess how individual noise indices affect pixel retention and select appropriate thresholds. Detailed descriptions of the indices are provided in [29].
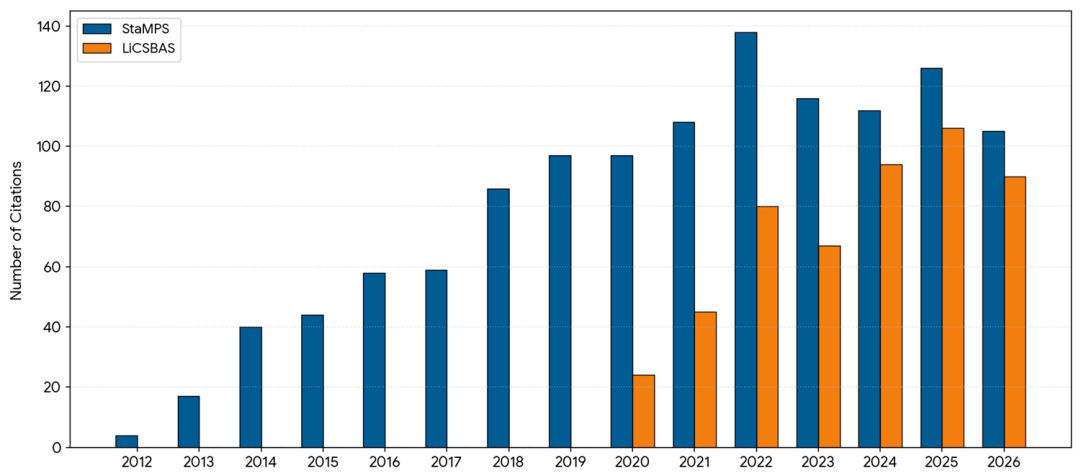
The Sentinel Application Platform (SNAP) [30], developed by the European Space Agency (ESA), is a freely available remote sensing software package with a graphical user interface (GUI) compatible with Windows, macOS, and Linux. Earlier versions of SNAP supported interferogram export for PS analysis using StaMPS, while SBAS interferogram generation through the MultiReference InSAR operator was introduced in SNAP version 9.0. Currently, SNAP supports the preparation of SBAS interferograms for analysis using PyRate (https://step.esa.int/docs/tutorials/Pyrate_Tutorial_GPF.pdf, accessed on 28 October 2026) but documentation and online resources remain relatively limited. Processing large SAR datasets through repetitive GUI operations can be time-consuming, particularly for long-term deformation monitoring involving numerous acquisitions. SNAP simplifies complex processes InSAR, by using its Graph Processing Tool (GPT) to automate repetitive tasks through predefined, linear workflow pipelines. Several workflows have been developed to facilitate automated interferogram generation using SNAP GPT. SNAP2StaMPS is a Python-based workflow that automates the preparation of interferometric stacks for subsequent PS time-series analysis using StaMPS https://github.com/mdelgadoblasco/snap2stamps (accessed on 15 October 2026). Similarly, SNAPWF provides an automated workflow for generating interferometric stacks for both PS and SBAS applications using SNAP operators within a preconfigured geospatial computing environment (GCP) [31]. SNAPWF is also distributed as a publicly accessible Jupyter notebook (.ipynb) that can be opened in compatible notebook environments. SNAPWF processes full swaths separately, performing co-registration and enhanced spectral diversity (ESD) correction before merging them. This approach is suitable for large-scale deformation monitoring; however, spatial subsetting before co-registration and subsequent processing steps can reduce computational time and storage requirements, thereby optimizing resource utilization. Many study areas may overlap multiple SAR frames or extend across different swaths, requiring appropriate data preparation before InSAR processing. Existing InSAR workflows often require prior knowledge of SAR acquisition geometry and coverage, which may involve the manual inspection and preparation of raw data before initiating processing. StaMPS is a widely used time-series analysis package supported by several freely available interferogram generation tools. However, it requires MATLAB, proprietary software that requires a license, potentially limiting its accessibility. LiCSBAS is a freely available time-series analysis package gaining popularity within the InSAR community since 2020 (Figure 2). However, LiCSBAS is not listed as the export option in many TS-InSAR softwares, while MintPy and StaMPS are preferred by existing softwares. Many commonly used InSAR software packages process entire datasets and may require restarting the processing workflow from the initial steps if any error is encountered or the results are unsatisfactory. For computationally intensive workflows, conducting a trial run using a small subset of the dataset before processing the entire dataset is a practical approach to evaluating the results and identifying potential issues. However, many common and popular InSAR software packages lack dedicated trial-run features, which could help to reduce computational time and resources.
Figure 2.
Annual citations to the selected StaMPS and LiCSBAS publications, retrieved from Google Scholar [accessed on 20 October 2026]. The 2026 values cover only the period up to that date.
We present SNAPxtra, a Python-based workflow to automate Sentinel-1 InSAR Processing. SNAP is freely available on Windows, macOS, and Linux. Python’s cross-platform compatibility enables SNAPxtra to generate interferometric stacks across these operating systems. SNAPxtra has an option to export interferometric stacks to be analyzed in StaMPS and LiCSBAS for time-series analysis and velocity estimation. StaMPS and LiCSBAS TS-InSAR softwares can operate on systems that also support SNAP. Hence, the complete InSAR workflow, from raw Sentinel-1 acquisitions to final deformation maps, can, therefore, be performed within a single operating system with the required dependencies installed. The MultiReference InSAR operator in SNAP may encounter memory-related issues during SBAS processing when a single co-registered stack is installed. Single-look complex (SLC) acquisitions are used without applying the split stack into the multiple references step. In contrast, PS processing requires interferometric pairs sharing a common master image, making this splitting approach less suitable. An alternative is to co-register each slave SLC image separately with the master before applying the interferogram operator, increasing computational time and reducing processing efficiency. SNAPxtra reduces the risk of out-of-memory (OOM) errors associated with generating numerous interferometric pairs by processing smaller batches sequentially. This approach optimizes computational resource utilization and improves accessibility for users with moderate computing resources while supporting both PS and SBAS processing from the same co-registered stack. MultiReference InSAR operator uses the PAIRS parameter to specify arbitrary interferometric combinations from the coregistered SAR acquisitions. This flexibility enables the construction of single-master interferometric pairs for the PS technique and interferometric pairs between secondary images that are co-registered to a common reference image, facilitating the generation of SBAS interferometric networks. SNAPxtra includes a trial-run option that processes a small subset of the dataset before a full run, enabling users to inspect outputs and adjust parameters. The proposed workflow also includes several features such as automatic swath detection, master image selection, trial-run validation, log generation, and shapefile-based masking before phase unwrapping. The novelty of this work lies in the development of a reproducible workflow that streamlines the complex processing chain for generating interferometric stacks for both PS-InSAR and SBAS analyses.
The applicability of the proposed package is evaluated using three representative case studies in which the study area position is: (1) within a single swath; (2) extends between multiple swaths; and (3) overlaps between two acquisition frames along the same track. These examples demonstrate the versatility of the workflow and the quality of the generated interferometric products across different acquisition scenarios. The proposed framework provides a reproducible solution that can be readily applied to any region with Sentinel-1 SLC data for surface deformation studies and the monitoring of diverse surface geohazards.
2. Materials and Methods
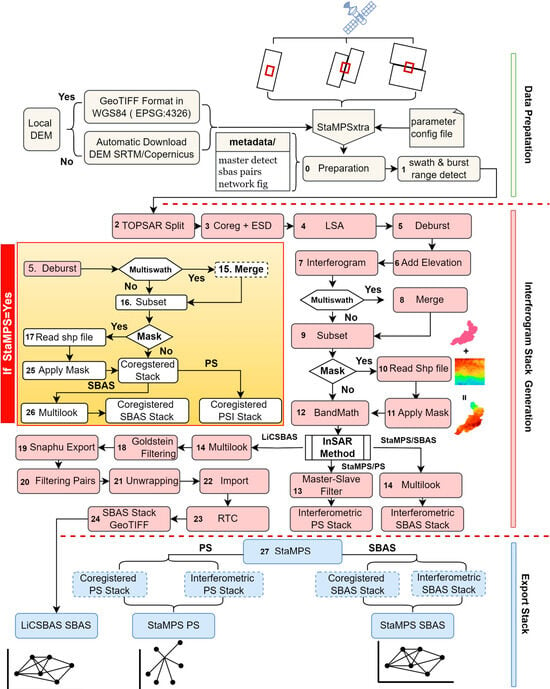
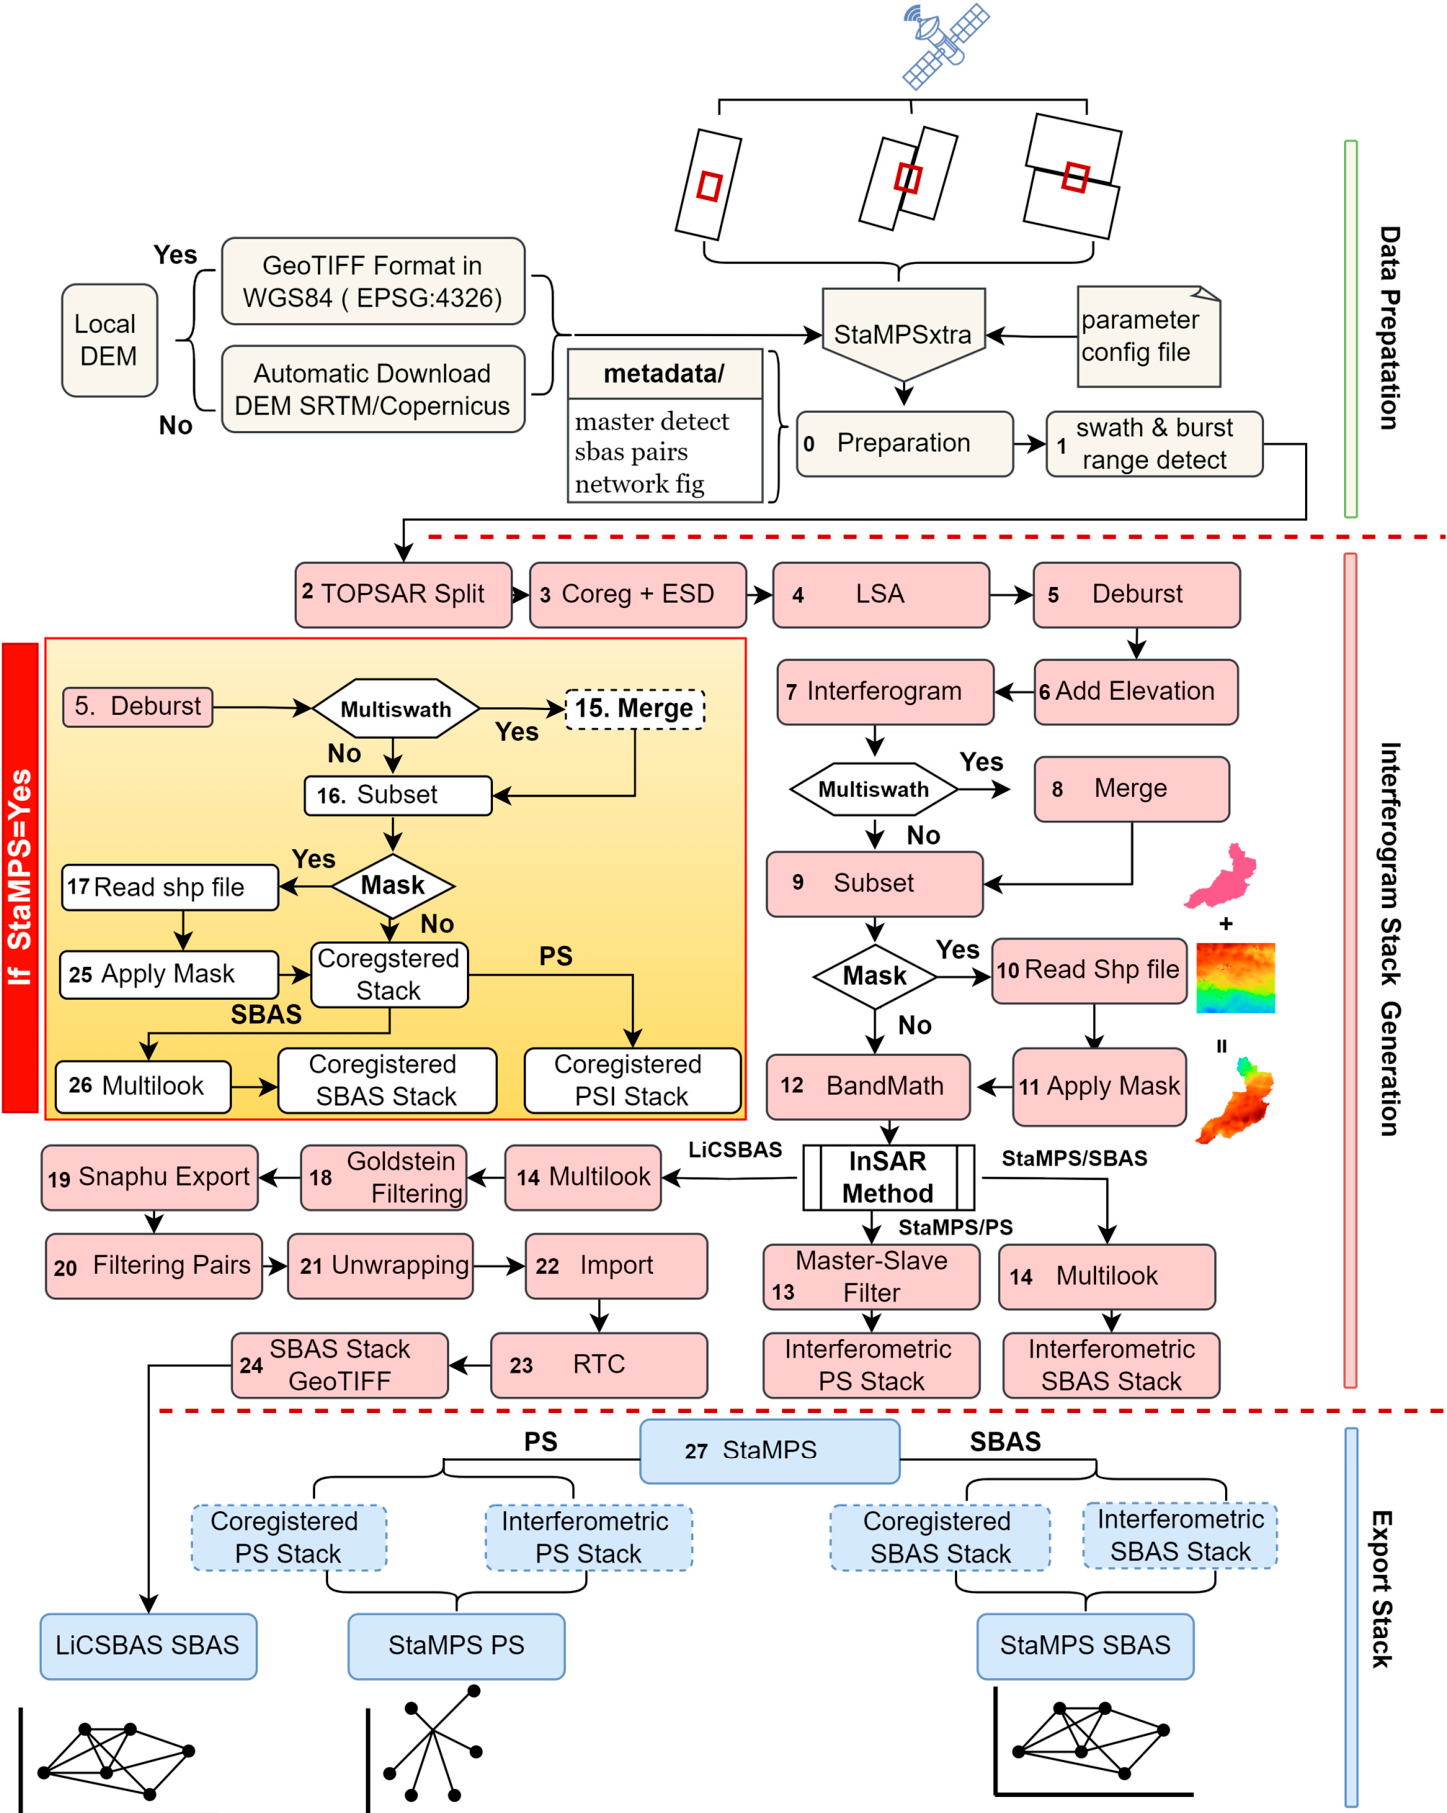
SNAPxtra is built using Python 3.11.0 and utilizes the SNAP 11.0.1 (European Space Agency, Paris, France) Graph Processing Tool (GPT) to execute end–end processing of SLC data to generate interferometric stacks. Python was selected because of its widespread adoption in scientific computing, automation, software development, data analysis, and machine learning. Its cross-platform compatibility, extensive scientific libraries, and active open-source community make it well suited for developing reproducible geospatial processing tools. Several widely used open-source InSAR tools, including PyGMTSAR https://github.com/AlexeyPechnikov/pygmtsar (accessed on 15 October 2026), SNAP2StaMPS, LiCSBAS, SNAPWF, and MintPy are also developed using Python. The SNAPxtra execution requires a configuration file path specified using the p argument. Optional arguments include s and e for defining the start and end processing steps and t for selecting the InSAR method (PS/SBAS) for generating interferometric stacks. The SNAPxtra reads the default values from the configuration file if optional parameters are not provided with the command. The SNAPxtra workflow can be executed step by step or in batch mode. Processing steps are numbered 0–27, with the final step depending on the export target. These processing steps are organized into three main stages: (1) data preparation; (2) interferogram generation; and (3) InSAR stack export. The detailed workflow of SNAPxtra is illustrated in Figure 3.
Figure 3.
SNAPxtra workflow. Horizontal dashed lines separate the three processing stages, with individual steps displayed in colored background boxes: data preparation (yellow), interferogram generation (pink), and stack export (blue). The steps in the box highlighted in yellow background are only for PS Processing.
2.1. Data Preparation
The data preparation stage validates the parameters defined in the configuration file and prepares Sentinel-1 SLC data for subsequent interferometric analysis. This stage applies SNAP TOPSAR–Split and Slice Assembly operators to select bursts overlapping the predefined region of interest (ROI). The Slice Assembly operator is applied when the study area overlaps two adjacent frames along the same track, merging them into a single continuous dataset. Sentinel-1 Level-1 SLC slices acquired along the same track under compatible acquisition conditions can be assembled while preserving phase and backscatter information, ensuring consistency across the overlapping region [32]. If the study area extends across multiple subswaths, each subswath is processed independently and merged after interferogram generation. For SBAS processing, interferometric pairs are selected based on the perpendicular and temporal baseline thresholds defined in the configuration file and saved in a text file. For PS processing, the selected master image is paired with the remaining (N − 1) slave images. If the master parameter is not specified, the workflow automatically selects a suitable reference image using Equation (1), considering the perpendicular baseline and Doppler centroid differences relative to the other acquisitions [33]. All remaining SLC images are co-registered to the master:
where represents the perpendicular baseline between images m and k at the center of image, T is the temporal baseline and fDC is the Doppler baseline, and c is the critical baseline for which total decorrelation is expected for the targets with the distributed scattering mechanism.
Users can also enable an optional burst verification step in SNAPxtra by setting ‘burst_check=true’ in the configuration file. This step compares the ROI footprint with Sentinel-1 swath coverage to identify the appropriate subswath and burst range based on a user-defined overlap threshold before applying any operations to the raw data. The identified parameters are automatically updated in the configuration file and subsequently used by the TOPSAR–Split and Slice Assembly operators to extract the selected subswath and bursts from the original SLC data. This produces a single, spatially reduced dataset at the end of step 2 for use in subsequent processing stages.
2.2. Interferometric Stack Formation
This stage comprises processing steps 3 to 26 and represents the most computationally intensive part of the workflow. This stage produces interferometric stacks for subsequent export to StaMPS or LiCSBAS. The process begins with the co-registration of SAR image pairs to the selected master image. Enhanced spectral diversity (ESD) is then applied to refine the co-registration accuracy by minimizing residual azimuth misregistration between SAR acquisitions. The Land–Sea Mask (LSM) operator excludes large water bodies that typically have low coherence. The TOPSAR Deburst operator then combines adjacent bursts along their boundaries to generate continuous SLC products. A digital elevation model (DEM) is used to remove the topographic phase component associated with terrain elevation from interferogram. By default, SNAPxtra automatically downloads the Copernicus 90 m DEM. Other supported DEM products (Copernicus 90 m Global DEM, SRTM 1Sec HGT) can be selected in the configuration file. A custom DEM can be supplied as a GeoTIFF in WGS84 geographic coordinates (EPSG:4326) by specifying its path in the configuration file.
Interferograms are generated using SNAP MultiReference InSAR Operator by reading the pair information from the text file created in the first step. The resulting interferometric stack is then processed using smart filtering to keep single master–slave pairs for PS or pairs with multiple master-slave pairs for SBAS in separate folders. The masking procedure is optional but highly recommended to exclude low-coherence areas. SNAPxtra supports polygon-based masking using shapefiles generated from common GIS platforms such as QGIS and ArcGIS. This enables SNAPxtra to exclude areas, such as water bodies, vegetative areas, and erosional surfaces, before unwrapping to remove noisy pixels. Excluding these decorrelated regions reduces potential phase-unwrapping errors and improves the quality of the deformation maps. Each batch contains three images: a common master (m) and two secondary images (d1 and d2) co-registered to the master. The PAIRS parameter of MultiReference InSAR Operator uses the combinations m–d1, m–d2, and d1–d2, producing three interferograms handled internally by SNAPxtra. The m–d1 and m–d2 pairs represent single-master interferograms referenced to the master image and are retained for PS. The d1–d2 pair, which is already co-registered to the master geometry, is used for SBAS. The pairs with the single master–slave format are moved to a separate folder for PS analysis and the remaining pairs are kept for SBAS analysis. Some single master–slave pairs are also retained in the SBAS output when they satisfy the temporal and perpendicular baseline thresholds. For N SAR acquisitions, SBAS can generate up to N (N − 1)/2 interferometric pairs, whereas conventional single-master PS processing requires N − 1 pairs. SNAPxtra generates co-registered stacks and interferograms based on the selected InSAR method, avoiding unnecessary SBAS interferogram generation when PS processing is selected. This reduces computational time and improves processing efficiency.
2.3. Exporting to StaMPS and LiCSBAS
Export to StaMPS requires both co-registered SLC stacks and wrapped interferograms. The operations (masking, multilooking, Subset) applied to generate interferograms are also applied to co-registered stacks matching dimensions and spatial properties. The size of the full SAR image is initially reduced by selecting only the relevant bursts during the first stage of data preparation. However, each burst covers approximately 20 km in the azimuth direction and ~83 km in the range direction, potentially extending beyond the study area. Therefore, the generated interferograms are further cropped using SNAP Subset operator in Step 9, with the extent specified by clip_roi in the configuration file before phase unwrapping. Processing smaller spatial subsets improves phase unwrapping efficiency, reduces computational time, and optimizes storage requirements for subsequent processing steps. The phase-unwrapping step is skipped when StaMPS is selected as the export target, as StaMPS performs phase unwrapping internally using a 3D phase-unwrapping algorithm. The processing steps and parameters used in the subsequent MT–InSAR analysis are described in the StaMPS Manual https://github.com/dbekaert/StaMPS (accessed on 15 October 2026). Multi-looking is excluded for PS interferometric stacks because spatial averaging and resampling can change the properties of dominant scatterers. If LiCSBAS is selected as the target to export an interferometric stack, SNAPHU is used to unwrap the interferograms with default statistical algorithms that can be changed from the configuration file. The parameter used by SNAPHU can also be changed from the configuration file. Finally, the unwrapped interferograms and coherence files are exported in GeoTIFF format. LiCSBAS also requires a DEM, east–north–up (ENU) look-vector components, and metadata in the project root directory. The incidence angle band is used to create ENU files using Equation (2):
where θ is the incidence angle, and α is the heading angle. The heading angle (α) for ascending orbit is −12° and the descending orbit is 192°. The DEM band is converted to an .hgt file. The metadata prepared during the initial SNAPxtra step are also copiedto output path. The Multilook and Goldstein Phase Filtering operator is applied before unwrapping to reduce the speckle noise and improve the quality of the pixel to mitigate the phase-unwrapping error. This helps to prevent unwrap failure and retain the maximum number of interferograms to maintain a dense network, increasing temporal resolution. The interferometric products are exported in the required formats and directory structures for PS and SBAS analysis by StaMPS and LiCSBAS, respectively. The exported datasets are then ready for deformation velocity estimation and time-series analysis using the corresponding software. SNAPxtra can deploy multithreading using GPT to reduce processing time. This is achieved by by setting parallel = true and specifying the number of threads in the configuration file, subject to the available CPU and memory resources.
E = sinθsin(α + 90), N = −sinθcos(α + 90), U = cosθ
3. Results
Interferometric stacks generated by SNAPxtra were processed in StaMPS and LiCSBAS to demonstrate their compatibility with downstream analysis. Three study areas with different urban settings and locations within the satellite footprints were selected to demonstrate the functionality of SNAPxtra.These studies were processed on an Ubuntu 20.04 system equipped with 64 GB of RAM and 2 TB of storage. SNAP 11.0.1 was used to generate interferometric stacks, which were subsequently processed using StaMPS 4.1-beta and LiCSBAS2 2.1.0 (Yu Morishita) for time-series analysis and deformation velocity estimation. StaMPS processing was performed using MATLAB R2024b (MathWorks, Natick, MA, USA). Sentinel-1 SLC datasets from March 2024 to December 2026 were downloaded from the ASF Vertex archive and a configuration file was prepared. The workflow was executed in batch mode independently for each case study. The resulting interferometric stacks were exported in formats compatible with StaMPS and LiCSBAS for subsequent PS and SBAS analysis. Prior to processing the complete dataset, the trial-run feature implemented in SNAPxtra was used to process the first few pairs before processing the full datasets. This feature was used to validate configuration values and input files, identify potential errors, and adjust parameters before processing the full datasets. Although noise-mitigation procedures were applied, comprehensive site-specific optimization and independent geodetic validation were not performed. The results primarily demonstrate workflow functionality, while detailed geophysical interpretation and investigation of deformation mechanisms remain beyond the scope of this study.
The first step of StaMPS is to retain the initial persistent scatterer (PS) and slowly decoherent filtering phase (SDFP) using amplitude dispersion and amplitude difference dispersion value. The amplitude dispersion of the pixel is defined as the ratio of its standard deviation to its mean [14], as shown in Equation (3):
DA represents the amplitude dispersion value, σA and μA indicate the standard deviation and mean amplitude. According to the StaMPS manual, the recommended threshold values of 0.4 and 0.6 were used in the mt_prep_snap command for PS and SBAS, respectively, to prepare the data [34,35]. These data are used by StaMPS to select initial PS candidates, estimate phase noises, remove the contribution from neighboring pixels, phase correction due to DEM error and merge individual patches from step 1 to step 5 separately for PS and SBAS interferometric stack data. The final filtered PS and SDFP candidates were merged using the ps_sb_merge function to combine pixels identified from the PS and SBAS analyses to cover more ground points [36,37]. In step 6, three-dimensional phase unwrapping resolves the 2π ambiguities in the wrapped phase before conversion to LOS displacement. The Toolbox for Reducing Atmospheric InSAR Noise (TRAIN) [38] toolbox is used to estimate and remove atmospheric noise by linear phase-based correction. The atmospheric noise, DEM error, spatially correlated look angle (SCLA), and spatially uncorrelated look angle (SULA) error are estimated and removed to isolate surface motion in step 7 to step 8 before generating the final deformation estimate in LOS direction using the ps_plot command.
LiCSBAS was used to perform SBAS time-series analysis using the interferometric stacks generated by SNAPxtra. The LiCSBAS workflow comprises nine processing stages that produce the final deformation velocity map and displacement time series. A detailed description of each processing step is available in the LiCSBAS user documentation [29]. The workflow begins with quality assessment of the generated interferograms, where interferograms with average coherence or spatial coverage below specified thresholds are excluded from further analysis. Loop-closure analysis identifies the remaining unreliable interferograms for exclusion. The remaining interferograms are then used to estimate pixel-wise deformation using the small baseline subset (SBAS) inversion approach. The standard deviation is computed and nine noise indices for masking noisy pixels are evaluated to identify and remove them in order to obtain the final surface deformation estimation from remaining pixels. These masking thresholds can be adjusted according to the characteristics of the study area, enabling users to optimize the quality and reliability of the resulting velocity maps and time series. The details of Sentinel data used for all three cases are presented in Table 1.
Table 1.
Sentinel-1 acquisition geometry for the three study areas.
3.1. Quetta Valley
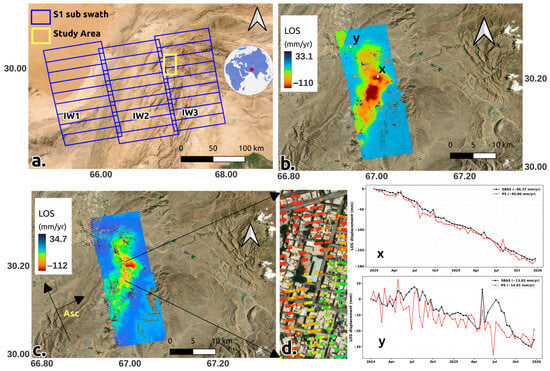
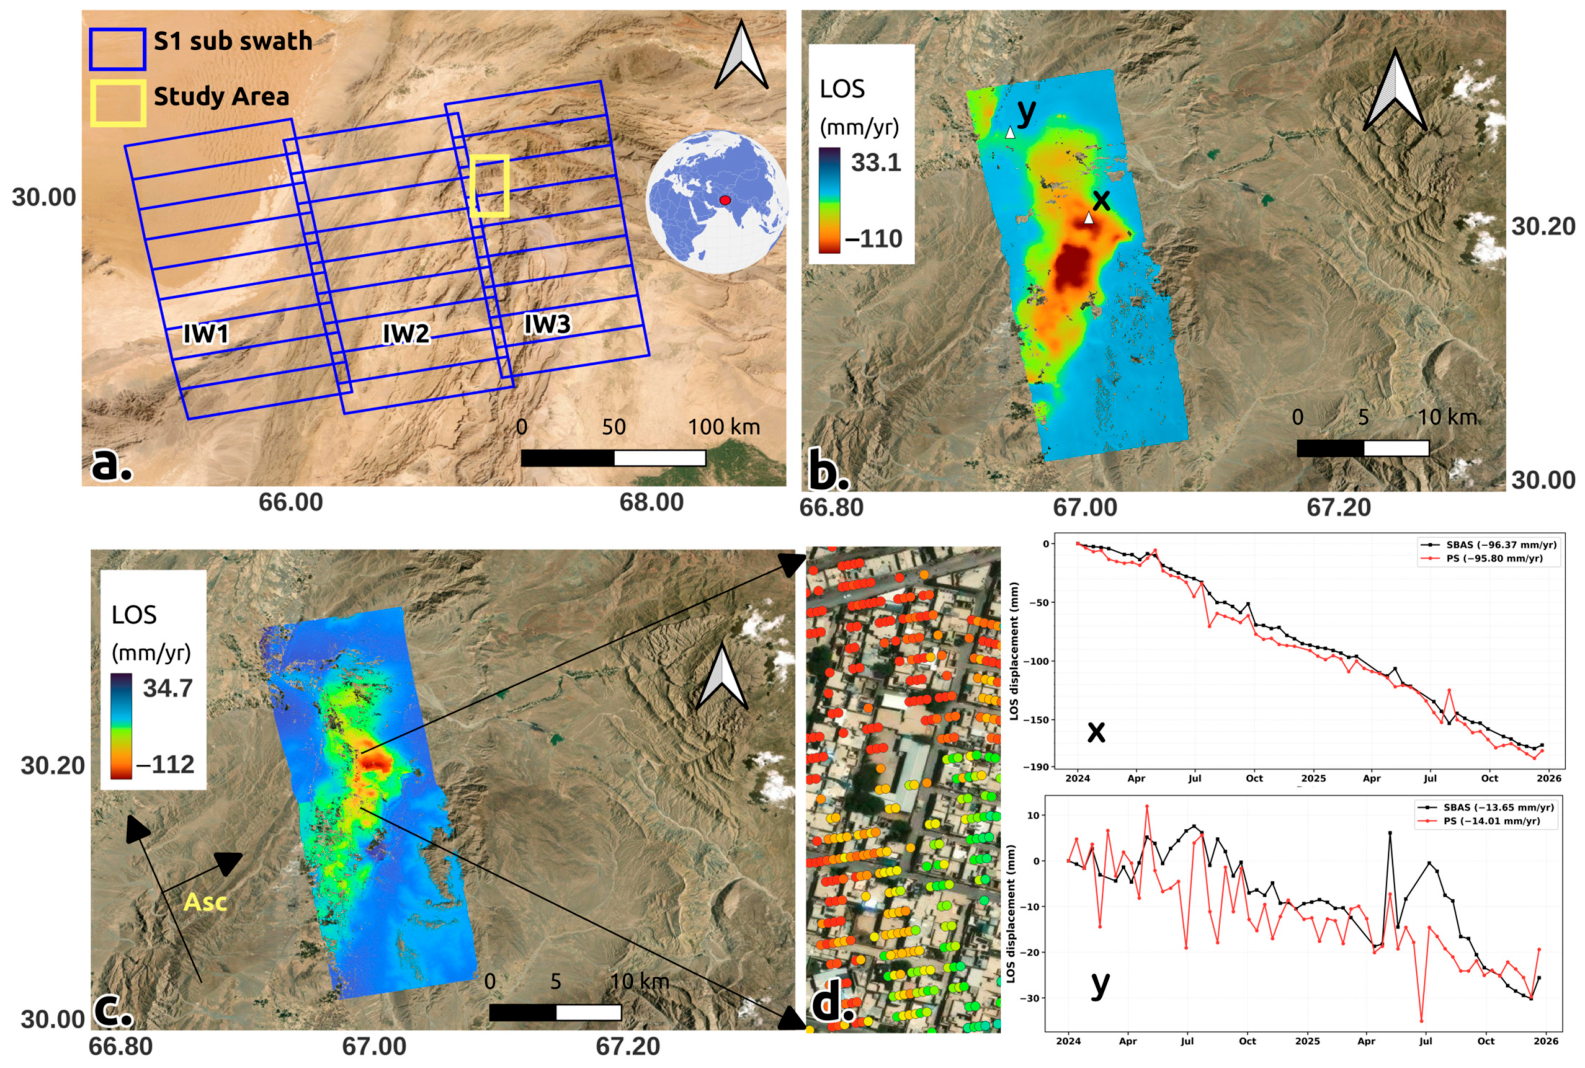
Quetta, the capital of Balochistan, is situated near the border between Pakistan and Afghanistan. Quetta serves as a major trade corridor between these two countries, attracting significant migration from remote areas in search of economic opportunities. The region experiences an arid climate, with average annual rainfall ranging from 150 to 200 mm. Quetta lacks substantial natural vegetation and has inadequate surface water resources. Water demand has increased due to population growth in recent years, while water supply remains limited. Groundwater levels have declined to unprecedented depths because of over-extraction, leading to rapid land subsidence. Previous studies reported GNSS subsidence magnitudes at Quetta of approximately 12 cm/yr during 2008–2016 and 16.6 cm/yr during 2016–2022. Their InSAR analysis for December 2015–December 2022 indicated vertical subsidence of approximately 16 cm/yr [39]. To evaluate the proposed workflow, no prior information regarding the Sentinel-1 swath or burst range was supplied; the burst_check parameter was enabled to facilitate automatic detection. SNAPxtra automatically identified the subswath overlapping the study area and processed only that subswath. The image acquired on 12 August 2024 was automatically selected as the master date; the entire processing was completed in batch mode using SNAPxtra. The generated interferometric stacks were exported to be analyzed in LiCSBAS and StaMPS for the SBAS and PS analysis. A total of 2,807,440 scatterers was retained with an average density of 6732/km2. The LOS velocity maps obtained from LiCSBAS and StaMPS are presented in Figure 4. The time-series evolution of two selected sites is also shown in Figure 4. Some interferometric pairs are excluded from subsequent processing steps due to phase-unwrapping failures during SBAS export selection. This is evident from the missing observations at the corresponding dates in the time series shown in Figure 4d. SBAS applies spatial averaging of neighboring pixels to reduce phase noise, producing smoother and more continuous displacement time series. In contrast, PS relies on individual dominant scatterers without spatial averaging, making the measurements more sensitive to localized noise and potentially resulting in higher-frequency fluctuations, as shown in Figure 4b.
Figure 4.
(a) Sentinel frame footprint in TOPS Mode in blue border. Yellow box delineates the study area located in swath IW1; Location of study area indicated by red circle on the 3D globe; (b) SBAS results using LiCSBAS; (c) PS results using StaMPS; (d) magnified view of PS scatterers of (c); (x) and (y) shows time-series displacement with same label of the locations in map (b).
The SBAS result processed using LiCSBAS shows line of sight (LOS) deformation ranging from −110 to 33.1 mm/yr. The existing interferometric stacks were also exported for PS and SBAS StaMPS format and processed in MATLAB. The StaMPS result shows the LOS deformation range of −112 to 34.7 mm/yr. The small disparity between the two results can be due to radar target selection, multilooking, spatial sampling, unwrapping techniques, and atmospheric decorrelation [17,40]. The result s a central bullseye subsidence pattern that may be associated with groundwater extraction. Areas exhibiting significant deformation rates overlap with densely built-up regions characterized by high population density.. Limited surface-water availability may contribute to groundwater dependence and associated subsidence.
3.2. Fort Worth, TX
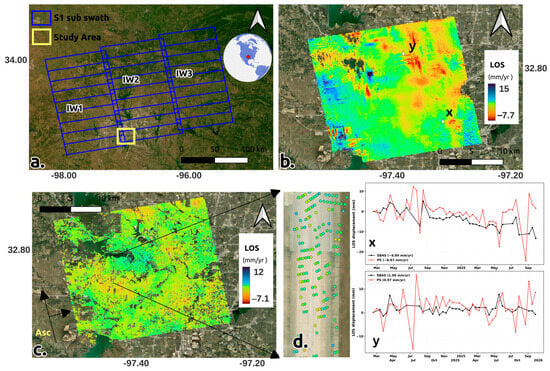
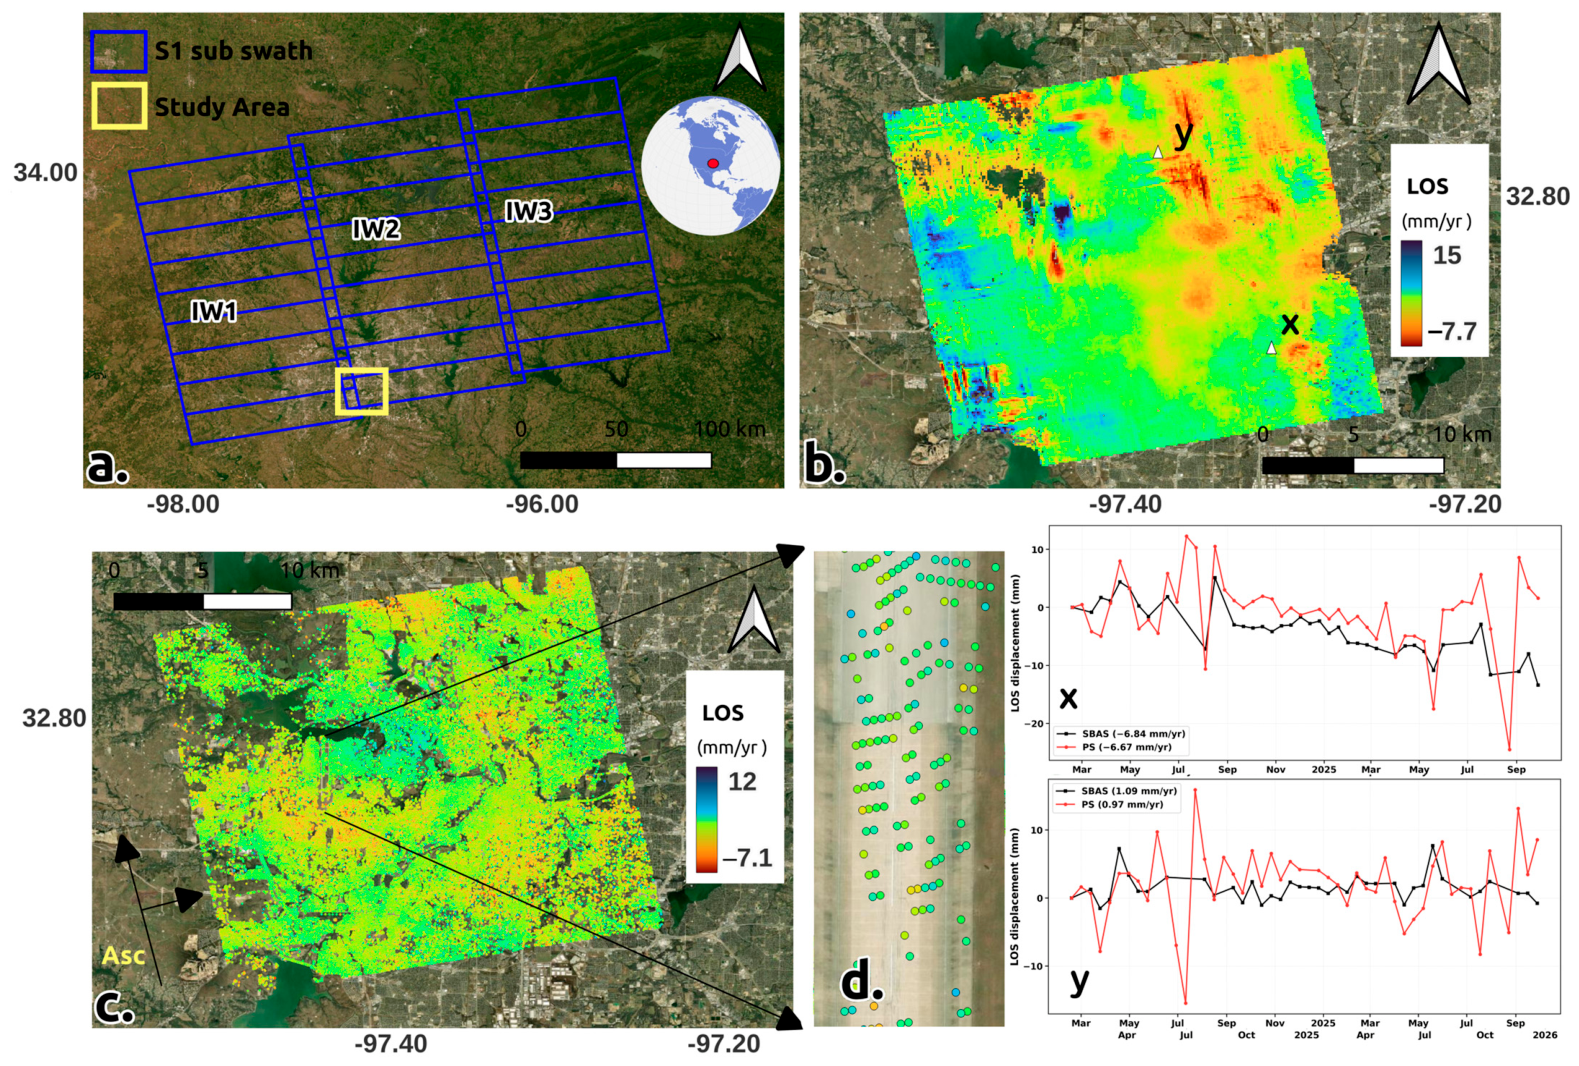
Fort Worth is the tenth largest city in the United States, with a rapidly increasing infrastructure and population. Groundwater extraction can reduce pore pressure, resulting in compaction due to overburden stress from surface loads, ultimately causing land subsidence in urban areas. This differential elevation change can lead to uneven highway surfaces, pipe bursts, tilting of large buildings, and the formation of cracks and fractures, which result in significant economic losses and increased maintenance costs. A study of 28 major U.S. cities reported an average subsidence rate of 4 mm per year in Dallas, TX during 2015 to 2021 period [41]. In this study, SNAPxtra correctly identified the subswaths (IW1 and IW2) and burst ranges based on the provided area of interest (AOI) before splitting the SAR data. The results were independently verified using Google Earth for one Sentinel-1 acquisition, demonstrating SNAPxtra's capability to accurately select the required subswaths and bursts.. The prepared interferometric stack after final step by SNAPxtra in batch mode were exported to LiCSBAS and StaMPS for time series analysis. StaMPS retained 1,158,115 final scatterer candidates for velocity estimation with an average density of 1765/km2. The LOS velocity results obtained from StaMPS and LiCSBAS are shown in Figure 5.
Figure 5.
(a) Sentinel frame footprint in TOPS mode (blue border). Yellow box delineates the study area spanning across swath IW1 and IW2; Location of study area indicated by red circle on the 3D globe; (b) SBAS results using LiCSBAS; (c) PS results using StaMPS; (d) PS scatterers in magnified view of (c); (x) and (y) shows time-series displacement with same label of the locations in map (b).
The results show broadly distributed subsidence in the Fort Worth area. PS results reveal significant deformation south of the runway near Naval Air Station Joint Reserve Base, which is less evident in the SBAS results. This highlights the advantage of PS-InSAR in urban areas, where stable artificial structures provide a higher density of reliable scatterers for deformation mapping. The final los deformation range is betweenshows −7.1 to 12 mm/yr in the StaMPS and from −7.7 to 15 mm/yr in the LiCSBAS result.
3.3. Surat, India
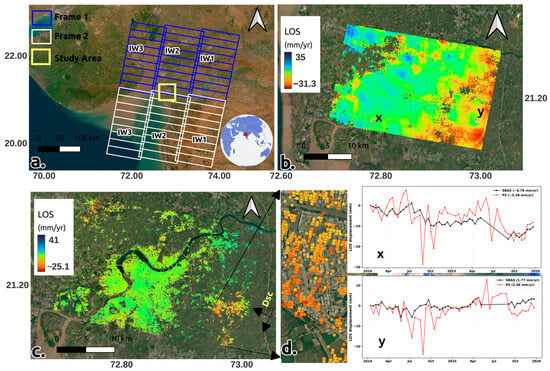
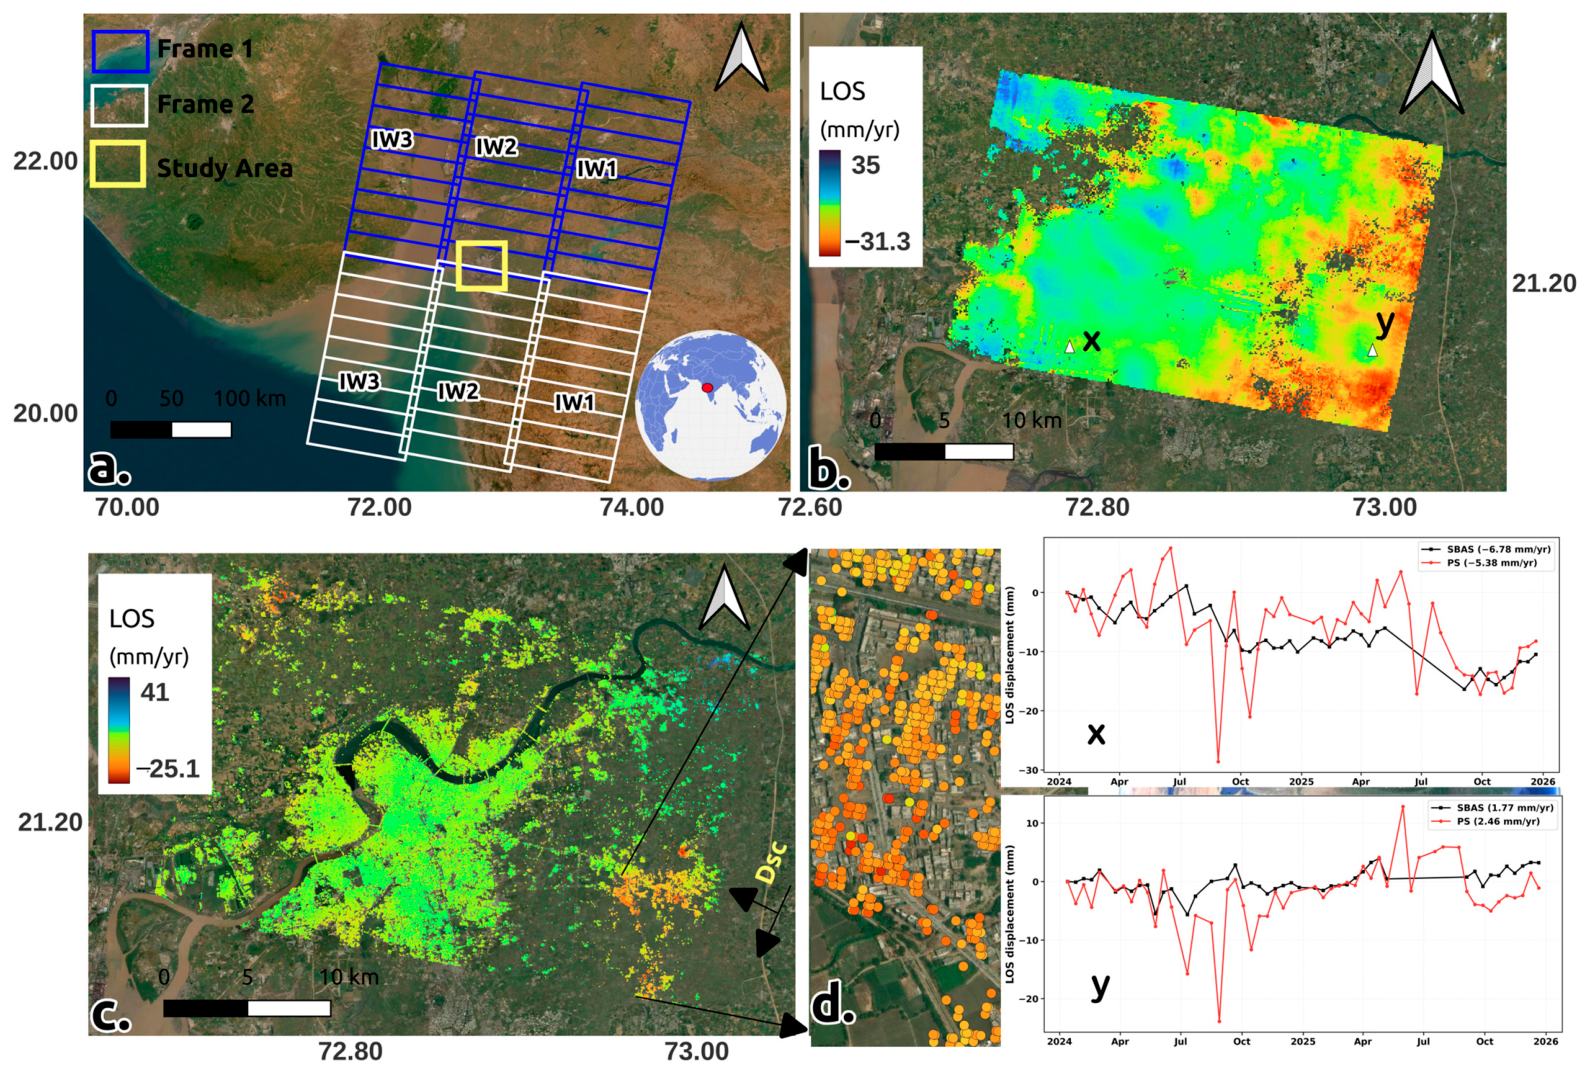
Surat is a coastal city situated on the western side of Gujarat, India, at the bank of a river that meets the Arabian Sea. The city hosts numerous ports, a significant textile industry, and thriving industrial zones. Many coastal regions are at risk of subsidence due to urban expansion and rising sea levels. Encroachment in open areas reduces rainwater infiltration, limiting groundwater replenishment, and further increasing the risk of subsidence. A study by Nanyang Technological University (NTU) using Multi-Temporal Interferometric Synthetic Aperture Radar (MT InSAR) from 2014 to 2020 reported subsidence rates of up to 6.7 cm per year using the Small Baseline Subset (SBAS) MT InSAR technique [42]. According to the ASF website, the Surat area is covered by frames 519 and 524 within track 34. Therefore, data from both frames for the period 2023 to 2025 were downloaded and saved in the same directory; the path was updated in the configuration file. SNAPxtra running in batch mode, was able to detect the frame and subswaths overlapping the study area and processed only the relevant data from each frame. After weeding, 492,475 scatterer candidates were retained, with an average density of 638/km2. The densely populated and highly developed areas along the river had a scatterer density of 2253/km2. The LOS velocity estimates obtained fromStaMPS and LiCSBAS are presented in Figure 5.
Significant subsidence is observed in the southwestern region, where large areas are covered by agricultural fields.. Because this area has few engineered structures, persistent scatterers are sparse in Figure 6c. The LiCSBAS result retains a larger spatial coverage of valid pixels. The PS result shows LOS displacement range of 41 to −25.1 mm/yr and SBAS shows range of −31.3 to 35 mm/yr. Differences between the LOS estimates may reflect atmospheric effects, temporal decorrelation, differences in spatial sampling, and the masking applied in each analysis. Both PS and SBAS show similar spatial distribution of subsidence in study area. Subsidence is greater in open areas toward the mainland than in urban areas along the riverbanks. Groundwater extraction for irrigation may contribute to the subsidence observed in agricultural fields [43].
Figure 6.
(a) Sentinel frame 1 footprint (blue border) and frame 2 footprint (white border). Yellow box delineates the study area that overlaps area of both frame 1 and frame 2; Location of study area indicated by red circle on the 3D globe; (b) SBAS results using LiCSBAS; (c) PS Results using StaMPS; (d) magnified view of PS scatterers of (c); (x) and (y) shows time-series displacement with the same label of the locations in map (b).
4. Discussion
SNAPxtra is a lightweight, cross-platform Python workflow designed to automate the generation of interferometric stacks for two widely used InSAR time-series analysis methods: PS and SBAS. SNAPxtra integrates ESA SNAP processing tools, predefined XML graphs, and Python scripts to automate Sentinel-1 SLC processing and interferometric stack generation. SNAP’s graph processing tool (GPT) executes the predefined processing graphs using configurable Java virtual machine memory, cache, and thread settings [44]. SNAPxtra processes selected bursts and spatial subsets and generates interferometric pairs in small batches to manage computational workload and memory usage. Further benchmarking is required to quantify its computational performance relative to equivalent SNAP workflows and other InSAR processing software. The workflow can export the generated interferometric stack in formats compatible with LiCSBAS and StaMPS, enabling further time-series analysis after interferogram generation. The proposed workflow relies on SNAP resources and, therefore, requires SNAP to be installed in the processing system. Both Python and SNAP are available in major operating systems, including Windows, macOS, and Linux, enabling SNAPxtra to operate across these platforms. LiCSBAS and StaMPS were selected as supported time-series analysis packages for exporting final data in SNAPxtra because of their cross-compatibility. Hence, the complete InSAR processing workflow from raw Sentinel-1 SLC data through interferogram generation, time-series analysis, and velocity estimation can be performed within the same computing environment without requiring users to switch between different operating systems. In the absence of a MATLAB license required to run StaMPS, users can still complete SBAS-based InSAR analysis using LiCSBAS, a free and open-source time-series analysis package. SNAPxtra enables users to execute individual processing steps or run the entire workflow in a single execution. The command-line interface for SNAPxtra only requires specifying the main execution Python file and configuration file. The step number is optional; if omitted, the entire processing workflow is executed. The InSAR method and export target can be controlled using the optional -m and -t parameters, respectively. Deploying SNAPxtra for InSAR processing in cluster computing environments is relatively straightforward due to its simplified installation and consistent command-line interface. Users do not need to remember multiple commands for different processing operations, as individual steps can be executed by specifying the corresponding step number only.These features also simplify InSAR processing on personal computers, with SNAPxtra supporting major operating systems, including Windows, macOS, and Linux. Detailed step-by-step tutorials and brief explanations of the configuration parameters are provided in the user manual available in the GitHub repository, helping new users quickly learn and adopt SNAPxtra for InSAR processing. Video tutorials are also available on YouTube https://www.youtube.com/watch?v=o_g6JAF6VlM (accessed on 20 October 2026). These tutorials demonstrate how to install and use SNAPxtra, helping users become familiar with the software and its complete processing workflow. SNAPxtra integrates several useful functionalities, including including polygon-based masking of low-coherence regions, trial runs before full-dataset processing, support for both PS and SBAS methods within a common pipeline, spatial subsetting to the study area, automatic swath and burst detection, and handling of study areas extending across adjacent SAR frames in same track and automatic log-saving and display total execution of each time. These integrated features simplify InSAR preprocessing, improve workflow flexibility, and provide researchers with an additional accessible option among existing InSAR software packages.
The three separate cases based on the location of the study area over the SAR frame were processed using SNAPxtra and results were presented showing the capability of SNAPxtra to detect swath and ranges from original SAR during end–end processing for estimation of displacement. A vector shapefile was used in each case to mask low-coherence regions before further processing. LiCSBAS identifies the stable group of pixels with high coherence as the reference with which to measure displacement with respect to the identified reference point. The latitude and longitude of the identified reference by LiCSBAS was used in StaMPS to maintain consistency in output result. Quetta, which has suffered over the long term from the over-extraction of groundwater, has shown LOS deformation rate ranging from 33.1 to −110 mm/yr using SBAS and 34.7 to −112 mm/yr from PS results. The steps and methods used in LiCSBAS and StaMPS to process the network of interferograms for deriving ground displacement are different. LiCSBAS supports tropospheric correction using external GACOS data only; however, StaMPS supports external weather models and linear tropospheric correction as well, using TRAIN toolbox before unwrapping. LiCSBAS only performs SBAS analysis; bad pixels are masked using nine major noise indicators after checking the quality of the interferogram in step 11 and step 12. StaMPS supports both PS and SBAS techniques that start with the identification of dominant scatterers. In PS Processing in StaMPS, we merged the identified scatterers and linear tropospheric correction was applied which only uses phase and topography information to remove the atmospheric noise using TRAIN to obtain deformaton map.
The SBAS analysis of Surat region using LiCSBAS shows the deformation rate of 35 to −31.3 mm/yr, and the StaMPS measured LOS displacement of the range 41 to −25.1 mm/yr using merged data of PS and SBAS scatterers. Our results show a greater improvement in the subsidence rate than the previous study conducted by NTA using the GNSS and InSAR data. The mapped subsidence is more pronounced in agricultural areas than in urban areas in this region. The results indicating that subsidence is predominantly associated with agricultural areas may explain the greater temporal variability observed in subsidence rates. Abundant precipitation during the wet season may reduce groundwater extraction. In addition, the water used for irrigation does not require expensive water treatment centers to reduce costs and the time to build infrastructure, making the rapid transition from groundwater to surface water improve subsidence in a short period of time. The subsidence observed in the Quetta area is predominantly concentrated in the central part of the city, reaching approximately −112 mm/yr based on the PS–InSAR results. The pronounced bullseye pattern indicates a localized concentration of ground deformation, potentially associated with excessive groundwater extraction, which reduces pore-water pressure and increases aquifer compaction. A similar elliptical subsidence pattern has been reported in Kathmandu, Nepal, where intensive groundwater pumping from clay-rich aquifers over the past two decades has been associated with subsidence rates of up to 21 cm/yr [4]. In contrast, the Fort Worth area exhibits a relatively homogeneous spatial distribution of subsidence. Both PS and SBAS results indicate that deformation is more widely distributed across downtown Fort Worth and the White Settlement area to the southwest, near Naval Air Station Joint-Reserve Base. In the downtown area, the presence of large-scale infrastructure and buildings increases surface loading, leading to greater soil compaction and contributing to the observed subsidence [9]. A large suburban region south of downtown also exhibits significant subsidence, which may be associated with continued groundwater withdrawal. Overall, the InSAR results for Fort Worth indicate deformation rates ranging from approximately 15 to −7.7 mm/yr using the SBAS method and from 12 to −7.1 mm/yr in the StaMPS result. The two outputs show similar deformation patterns.
The discrepancies in the obtained results from LiCSBAS and StaMPS are expected, as both use different techniques to estimate displacement from phases [17,40]. LiCSBAS performs SBAS analysis on multilooked interferometric stacks, whereas the StaMPS result was obtained by merging PS and SDFP candidates derived from single-look interferograms. The phase was unwrapped in two dimensions using a statistical cost approach for LiCSBAS products; however, 3D unwrapping was used in StaMPS. LiCSBAS requires external GACOS data to remove atmospheric correction; however, TRAIN supports linear correction to estimate and remove atmospheric noise based on topography and phase information. TRAIN also supports external weather models for complex and accurate atmospheric noise estimates. LiCSBAS adapts loop closure, average coherence, and noise parameters using the average value of all scatterers within a resampled grid; this is used for filtering bad interferograms before ground deformation is estimated. StaMPS uses weeding parameters to remove contributions from neighboring pixels to select phase estimates from a single dominant scatterer that contribute to the final velcoity map. Differences in the processing methods used by LiCSBAS and StaMPS may contribute to variations in their deformation estimates. Residual atmospheric noise, decorrelation, and phase-unwrapping errors may also affect the results, particularly near processing boundaries. Further site-specific quality assessment and validation against independent observations are needed to establish their quantitative accuracy. Processing parameters can be adjusted according to the study objectives and expected deformation characteristics. Where available, leveling or GNSS observations can be used to validate and calibrate InSAR measurements. Such datasets also provide valuable reference information for calibrating parameters, reducing systematic errors, and increasing the accuracy of results.
The restriction due to limited coverage of LiCSAR Products for InSAR analysis using LiCSAR has now been addressed by SNAPxtra. SNAPxtra uses raw Sentinel-1 data, which has wide global coverage, to generate the SBAS interferometric stack ready for use in LiCSBAS. SNAPxtra also provides the freedom to apply multilook using any range or azimuth values, based on the aim of the study and characteristics of the study area. SNAPxtra extends the applicability of LiCSBAS to regions beyond the current LiCSAR coverage and generates interferometric stacks at user-selected multilooking and output-grid settings, subject to the native data resolution.
The software is maintained and distributed freely online from the GitHub repository with detailed documentation. We intend this package to serve as a practical research tool for MT-InSAR preprocessing using Sentinel-1 SLC data. Future development of SNAPxtra will focus on expanding its functionality and improving its interoperability with additional InSAR time-series analysis software. Planned enhancements include support for exporting interferometric stacks compatible with widely used packages such as MintPy, PyRate, and GIAnT. Extending compatibility with multiple analysis frameworks will provide users with greater flexibility in selecting the processing methodologies that best suit their research objectives. The current implementation of SNAPxtra is designed for Sentinel-1 Terrain Observation with Progressive Scans (TOPS) acquisitions. Future releases will expand support to additional SAR missions, including ALOS, TerraSAR-X, NISAR [45], and COSMO–SkyMed missions. Long-term development will also focus on improving usability through the introduction of a graphical user interface (GUI) for workflow configuration, processing management, and the visualization of both raw and processed SAR products. Future releases will incorporate GNSS observations to validate InSAR-derived deformation time series and support integrated geodetic analysis. Interferogram export capabilities will also be expanded to include MintPy and other widely used time-series analysis software, further improving the accuracy and reliability of deformation monitoring.
The successful generation of PS and SBAS results using interferometric stacks produced by SNAPxtra demonstrates the reliability of its preprocessing workflow, from raw Sentinel-1 SLC data to interferogram generation. Its compatibility with Windows, macOS, and Linux enables researchers to integrate SNAPxtra into their existing computational environments. The easy installation of SNAP and the required Python packages also makes SNAPxtra a useful educational tool for introducing practical InSAR processing in university laboratory courses to gain hands on experience. Export to LiCSBAS provides an open-source route to SBAS time-series analysis for users without a MATLAB license. The manual guide of a step-by-step tutorial and regularly updated YouTube tutorials provide additional guidance for installation, configuration, and processing to new users, enabling them to quickly learn to use SNApxtra. These features establish SNAPxtra as a reliable and accessible preprocessing platform for Sentinel-1 MT-InSAR analysis, supporting researchers with varying levels of experience in investigating geophysical processes and geohazards.
5. Conclusions
This study presented SNAPxtra, a Python-based workflow that automates the generation of interferometric stacks from raw Sentinel-1 SLC data for both PS–InSAR and SBAS analyses. The generated products were successfully processed using StaMPS and LiCSBAS, demonstrating the compatibility, reproducibility, and reliability of the proposed workflow. By integrating Python with SNAP GPT, SNAPxtra streamlines the complex multi-stage InSAR processing chain, reducing repetitive manual operations in interferometric preprocessing.
The integration of automated log generation, masking, automatic swath and burst detection, flexible interferometric network generation, and direct export to LiCSBAS and StaMPS addresses several limitations commonly encountered in existing InSAR processing workflows. SNAPxtra enables deformation monitoring across diverse environments by supporting both PS and SBAS methods within a single processing framework. PS is suitable for urban environments, where stable man-made structures generate strong, temporally coherent radar backscatter that can be identified as persistent scatterers. SBAS uses short baseline interferograms and can retain measurements from distributed scatterers where sufficient coherence remains. Its suitability depends on acquisition geometry, temporal sampling, land cover, and processing choices.
The selection of PS–InSAR or SBAS should ultimately depend on the characteristics of the study area, available coherent targets, and the objectives of the investigation. SNAPxtra lowers the technical threshold for InSAR adoption by enabling researchers and students to perform both processing strategies within a unified framework without requiring extensive knowledge of multiple specialized software packages. Taking advantage of the global coverage and continuous acquisition capability of the Sentinel-1 mission, SNAPxtra can support deformation monitoring associated with a wide range of geohazards and Earth surface processes across diverse geographic regions.
By providing flexible parameterization and automated generation of analysis-ready interferometric stacks, SNAPxtra offers a cost-effective, scalable, computationally efficient, and transparent solution for surface deformation monitoring. The end-to-end workflow simplifies the transition from raw Sentinel-1 SLC data to time series analysis-ready products while reducing technical barriers and improving reproducibility for both PS and SBAS applications. The free access of SNAPxtra promotes transparency, accessibility, and reproducibility of the proposed InSAR processing workflow. The continued development of SNAPxtra will further expand its capabilities and support broader applications of satellite-based deformation monitoring.
Author Contributions
Conceptualization: S.R. and G.W.; Methodology, S.R.; Software and Validation, S.R., R.S., J.T. and M.A.; Visualization: S.R.; Writing—original draft; S.R.; Writing—review and editing; S.R. All authors have read and agreed to the published version of the manuscript.
Funding
This research received no external funding.
Data Availability Statement
SNAPxtra is an open automated python workflow maintained at free https://github.com/faraksoch1881/SNAPxtra (accessed on 22 October 2026). Sentinel-1 data were obtained from ASF vertex (accessed on 5 February 2026).
Acknowledgments
The authors thank the STEP Forum community https://forum.step.esa.int/ (accessed on 11 September 2026 for their valuable comments made during development of the package to solve several issues. We would also like to extend sincere thanks to LiCSBAS developer Yu Morishita. We thank Associate Prof Jiajia Sun for feedbacks that helped improve our results. The authors acknowledge the use of Cursor AI tools (version 3.24.18; Anysphere, Inc., San Francisco, CA, USA) to organize the scripts and improve their readability.
Conflicts of Interest
The authors declare no conflicts of interest.
Abbreviations
The following abbreviations are used in this manuscript:
| DEM | Digital Elevation Model |
| PS | Persistent Scatterers |
| SBAS | Small Baseline Subset |
| MT-InSAR | Multi-Temporal Insar |
| TOPS | Terrain Observation by Progressive Scans |
| LOS | Line of Sight |
| RMS | Root Mean Square |
| SDFP | Slowly Decorrelating Filtered Phase |
References
- Welch, J.; Wang, G.; Bao, Y.; Zhang, S.; Huang, G.; Hu, X. Unveiling the Hidden Threat: Drought-Induced Inelastic Subsidence in Expansive Soils. Geophys. Res. Lett. 2024, 51, e2023GL107549. [Google Scholar] [CrossRef] [Scilit]
- Wang, K.; Wang, G.; Bao, Y.; Su, G.; Wang, Y.; Shen, Q.; Zhang, Y.; Wang, H. Preventing Subsidence Reoccurrence in Tianjin: New Preconsolidation Head and Safe Pumping Buffer. Groundwater 2024, 62, 778–794. [Google Scholar] [CrossRef] [Scilit] [PubMed]
- Yu, X.; Wang, G.; Hu, X.; Liu, Y.; Bao, Y. Land Subsidence in Tianjin, China: Before and after the South-to-North Water Diversion. Remote Sens. 2023, 15, 1647. [Google Scholar] [CrossRef] [Scilit]
- Rawal, S.; Wang, G. Long-Term Subsidence Assessment by LiCSBAS and Emerging Hot Spot Analysis in Kathmandu Valley. Land 2025, 14, 700. [Google Scholar] [CrossRef] [Scilit]
- Silwal, R.; Wang, G.; KC, S.; Rimal, R.; Rawal, S. Integrating InSAR and Channel Steepness for AI-Based Coseismic Landslide Modeling in the Nepal Himalaya. Remote Sens. 2026, 18, 1151. [Google Scholar] [CrossRef] [Scilit]
- Zorn, E.U.; Vassileva, M.; Walter, T.R.; Darmawan, H.; Röhler, L.; Amelung, F. Interactions of Magmatic Intrusions with the Multiyear Flank Instability at Anak Krakatau Volcano, Indonesia: Insights from InSAR and Analogue Modeling. Geology 2023, 51, 340–344. [Google Scholar] [CrossRef] [Scilit]
- Aziz Zanjani, F.; Amelung, F.; Piter, A.; Sobhan, K.; Tavakkoliestahbanati, A.; Eberli, G.P.; Haghighi, M.H.; Motagh, M.; Milillo, P.; Mirzaee, S.; et al. InSAR Observations of Construction-Induced Coastal Subsidence on Miami’s Barrier Islands, Florida. Earth Space Sci. 2024, 11, e2024EA003852. [Google Scholar] [CrossRef] [Scilit]
- Calò, M.; Ruggieri, S.; Nettis, A.; Uva, G. A MTInSAR-Based Early Warning System to Appraise Deformations in Simply Supported Concrete Girder Bridges. Struct. Control Health Monit. 2024, 2024, 8978782. [Google Scholar] [CrossRef] [Scilit]
- Ao, Z.; Hu, X.; Tao, S.; Hu, X.; Wang, G.; Li, M.; Wang, F.; Hu, L.; Liang, X.; Xiao, J.; et al. A National-Scale Assessment of Land Subsidence in China’s Major Cities. Science 2024, 384, 301–306. [Google Scholar] [CrossRef] [Scilit] [PubMed]
- Torres, R.; Snoeij, P.; Geudtner, D.; Bibby, D.; Davidson, M.; Attema, E.; Potin, P.; Rommen, B.; Floury, N.; Brown, M.; et al. GMES Sentinel-1 Mission. Remote Sens. Environ. 2012, 120, 9–24. [Google Scholar] [CrossRef] [Scilit]
- Massonnet, D.; Feigl, K.L. Radar Interferometry and Its Application to Changes in the Earth’s Surface. Rev. Geophys. 1998, 36, 441–500. [Google Scholar] [CrossRef] [Scilit]
- Bürgmann, R.; Rosen, P.A.; Fielding, E.J. Synthetic Aperture Radar Interferometry to Measure Earth’s Surface Topography and Its Deformation. Annu. Rev. Earth Planet. Sci. 2000, 28, 169–209. [Google Scholar] [CrossRef] [Scilit]
- Zebker, H.A.; Rosen, P.A.; Hensley, S. Atmospheric Effects in Interferometric Synthetic Aperture Radar Surface Deformation and Topographic Maps. J. Geophys. Res. Solid Earth 1997, 102, 7547–7563. [Google Scholar] [CrossRef] [Scilit]
- Ferretti, A.; Prati, C.; Rocca, F. Permanent Scatterers in SAR Interferometry. IEEE Trans. Geosci. Remote Sens. 2001, 39, 8–20. [Google Scholar] [CrossRef] [Scilit]
- Berardino, P.; Fornaro, G.; Lanari, R.; Sansosti, E. A New Algorithm for Surface Deformation Monitoring Based on Small Baseline Differential SAR Interferograms. IEEE Trans. Geosci. Remote Sens. 2002, 40, 2375–2383. [Google Scholar] [CrossRef] [Scilit]
- Huang, Y.; Van Genderen, J.L. Comparison of Several Multi-Look Processing Procedures in INSAR Processing for ERS-1&2 Tandem Mode. In Proceedings of the Fringe 96 Workshop on ERS SAR Interferometry, Zurich, Switzerland, 30 September–2 October 1996; ESA SP-406. pp. 215–221. [Google Scholar]
- Gheorghe, M.; Armaş, I. Comparison of Multi-Temporal Differential Interferometry Techniques Applied to the Measurement of Bucharest City Subsidence. Procedia Environ. Sci. 2016, 32, 221–229. [Google Scholar] [CrossRef] [Scilit]
- Zhao, F.; Meng, X.; Zhang, Y.; Chen, G.; Su, X.; Yue, D. Landslide Susceptibility Mapping of Karakorum Highway Combined with the Application of SBAS-InSAR Technology. Sensors 2019, 19, 2685. [Google Scholar] [CrossRef] [Scilit] [PubMed]
- Sandwell, D.; Mellors, R.; Tong, X.; Wei, M.; Wessel, P. Open Radar Interferometry Software for Mapping Surface Deformation. Eos Trans. Am. Geophys. Union 2011, 92, 234. [Google Scholar] [CrossRef] [Scilit]
- Werner, C.; Wegmüller, U.; Strozzi, T.; Wiesmann, A. Gamma SAR and Interferometric Processing Software. In Proceedings of the Ers-Envisat Symposium, Gothenburg, Sweden, 16–20 October 2000; Volume 1620, p. 1620. [Google Scholar]
- Sahraoui, O.H.; Hassaine, B.; Serief, C.; Hasni, K. Radar Interferometry with Sarscape Software. In Proceedings of the XXIII FIG Congress (Shaping the Change), Munich, Germany, 8–13 October 2006; pp. 1–10. [Google Scholar]
- Perissin, D.; Wang, Z.; Wang, T. The SARPROZ InSAR Tool for Urban Subsidence/Manmade Structure Stability Monitoring in China. In Proceedings of the ISRSE, Sidney, Australia, 10–15 April 2011; Volume 1015. [Google Scholar]
- Hooper, A.; Bekaert, D.; Spaans, K.; Arıkan, M. Recent Advances in SAR Interferometry Time Series Analysis for Measuring Crustal Deformation. Tectonophysics 2012, 514–517, 1–13. [Google Scholar] [CrossRef] [Scilit]
- Zhang, Y.; Fattahi, H.; Amelung, F. Small Baseline InSAR Time Series Analysis: Unwrapping Error Correction and Noise Reduction. Comput. Geosci. 2019, 133, 104331. [Google Scholar] [CrossRef] [Scilit]
- Wang, H.; Wright, T.J.; Yu, Y.; Lin, H.; Jiang, L.; Li, C.; Qiu, G. InSAR Reveals Coastal Subsidence in the Pearl River Delta, China. Geophys. J. Int. 2012, 191, 1119–1128. [Google Scholar] [CrossRef] [Scilit]
- Morishita, Y.; Lazecky, M.; Wright, T.; Weiss, J.; Elliott, J.; Hooper, A. LiCSBAS: An Open-Source InSAR Time Series Analysis Package Integrated with the LiCSAR Automated Sentinel-1 InSAR Processor. Remote Sens. 2020, 12, 424. [Google Scholar] [CrossRef] [Scilit]
- COMET-LiCS: Sentinel-1 InSAR Portal. Available online: https://comet.nerc.ac.uk/COMET-LiCS-portal/ (accessed on 23 July 2026).
- Lazecký, M.; Spaans, K.; González, P.J.; Maghsoudi, Y.; Morishita, Y.; Albino, F.; Elliott, J.; Greenall, N.; Hatton, E.; Hooper, A.; et al. LiCSAR: An Automatic InSAR Tool for Measuring and Monitoring Tectonic and Volcanic Activity. Remote Sens. 2020, 12, 2430. [Google Scholar] [CrossRef] [Scilit]
- Morishita, Y. LiCSBAS2: InSAR Time Series Analysis Software · GitHub. Available online: https://github.com/yumorishita/LiCSBAS2 (accessed on 24 July 2026).
- Veci, L.; Prats-Iraola, P.; Scheiber, R.; Collard, F.; Fomferra, N.; Engdahl, M. The Sentinel-1 Toolbox. In Proceedings of the IEEE International Geoscience and Remote Sensing Symposium (IGARSS); IEEE: New York, NY, USA, 2014; pp. 1–3. [Google Scholar]
- Zaki, A.; Chang, L.; Manzella, I.; van der Meijde, M.; Girgin, S.; Tanyas, H.; Fadel, I. Automated Python Workflow for Generating Sentinel-1 PSI and SBAS Interferometric Stacks Using SNAP on Geospatial Computing Platform. Environ. Model. Softw. 2024, 178, 106075. [Google Scholar] [CrossRef] [Scilit]
- ESA Sentinel-1 Slice Assembly. Available online: https://step.esa.int/main/wp-content/help/versions/12.0.0/snap-toolboxes/eu.esa.microwavetbx.sar.op.sentinel1.ui/operators/SliceAssemblyOp.html (accessed on 19 October 2026).
- STEP—Scientific Toolbox Exploitation Platform. Available online: https://step.esa.int/main/wp-content/help/versions/12.0.0/snap-toolboxes/eu.esa.microwavetbx.sar.op.insar.ui/operators/InSARStackOverview.html (accessed on 23 July 2026).
- Hooper, A.; Zebker, H.; Segall, P.; Kampes, B. A New Method for Measuring Deformation on Volcanoes and Other Natural Terrains Using InSAR Persistent Scatterers. Geophys. Res. Lett. 2004, 31, L23611. [Google Scholar] [CrossRef] [Scilit]
- Sharma, G.; Nayak, K.; Biswakarma, P.; Gogoi, R.B.; Singh, M.S.; Sarma, K.K.; Aggarwal, S.P. Multi-temporal InSAR analysis for assessment of earthquake precursory deformation. Geod. Geodyn. 2026, 17, 314–325. [Google Scholar] [CrossRef] [Scilit]
- Hooper, A. A Multi-temporal InSAR Method Incorporating Both Persistent Scatterer and Small Baseline Approaches. Geophys. Res. Lett. 2008, 35, L16302. [Google Scholar] [CrossRef] [Scilit]
- Wang, Z.; Li, W.; Zhao, Y.; Jiang, A.; Zhao, T.; Guo, Q.; Li, W.; Chen, Y.; Ren, X. Monitoring Ground Displacement in Mining Areas with Time-Series Interferometric Synthetic Aperture Radar by Integrating Persistent Scatterer/Slowly Decoherent Filtering Phase/Distributed Scatterer Approaches Based on Signal-to-Noise Ratio. Appl. Sci. 2023, 13, 8695. [Google Scholar] [CrossRef] [Scilit]
- Bekaert, D.P.S.; Hooper, A.; Wright, T.J. A Spatially Variable Power Law Tropospheric Correction Technique for InSAR Data. J. Geophys. Res. Solid Earth 2015, 120, 1345–1356. [Google Scholar] [CrossRef] [Scilit]
- Kakar, N.; Zhao, C.; Li, G.; Zhao, H. GNSS and Sentinel-1 InSAR Integrated Long-Term Subsidence Monitoring in Quetta and Mastung Districts, Balochistan, Pakistan. Remote Sens. 2024, 16, 1521. [Google Scholar] [CrossRef] [Scilit]
- He, Y.; Chen, Y.; Wang, W.; Yan, H.; Zhang, L.; Liu, T. TS-InSAR Analysis for Monitoring Ground Deformation in Lanzhou New District, the Loess Plateau of China, from 2017 to 2019. Adv. Space Res. 2021, 67, 1267–1283. [Google Scholar] [CrossRef] [Scilit]
- Ohenhen, L.O.; Zhai, G.; Lucy, J.; Werth, S.; Carlson, G.; Khorrami, M.; Onyike, F.; Sadhasivam, N.; Tiwari, A.; Ghobadi-Far, K.; et al. Land Subsidence Risk to Infrastructure in US Metropolises. Nat. Cities 2025, 2, 543–554. [Google Scholar] [CrossRef] [Scilit]
- Tay, C.; Lindsey, E.O.; Chin, S.T.; McCaughey, J.W.; Bekaert, D.; Nguyen, M.; Hua, H.; Manipon, G.; Karim, M.; Horton, B.P.; et al. Sea-Level Rise from Land Subsidence in Major Coastal Cities. Nat. Sustain. 2022, 5, 1049–1057. [Google Scholar] [CrossRef] [Scilit]
- Jeanne, P.; Farr, T.G.; Rutqvist, J.; Vasco, D.W. Role of Agricultural Activity on Land Subsidence in the San Joaquin Valley, California. J. Hydrol. 2019, 569, 462–469. [Google Scholar] [CrossRef] [Scilit]
- ESA The SNAP Graph Processing Tool (Gpt). Available online: https://step.esa.int/main/wp-content/help/versions/9.0.0/snap/org.esa.snap.snap.gpf.ui/gpf/GraphProcessingTool.html (accessed on 21 October 2026).
- Rosen, P.A.; Kim, Y.; Kumar, R.; Misra, T.; Bhan, R.; Sagi, V.R. Global Persistent SAR Sampling with the NASA-ISRO SAR (NISAR) Mission. In Proceedings of the 2017 IEEE Radar Conference (RadarConf), Seattle, WA, USA, 8–12 May 2017; IEEE: New York, NY, USA, 2017; pp. 0410–0414. [Google Scholar]

Disclaimer/Publisher’s Note: The statements, opinions and data contained in all publications are solely those of the individual author(s) and contributor(s) and not of MDPI and/or the editor(s). MDPI and/or the editor(s) disclaim responsibility for any injury to people or property resulting from any ideas, methods, instructions or products referred to in the content. |
© 2026 by the authors. Licensee MDPI, Basel, Switzerland. This article is an open access article distributed under the terms and conditions of the Creative Commons Attribution (CC BY) license.