


Highlights
What are the main findings?
- Under comparable meteorological conditions, contrasting catchment landscapes differed in streamflow drought occurrence probability by 8.1–20.9 percentage points and by 13.8–22.3 points for moderate-or-stronger drought.
- Landscape differences clearly distinguished streamflow drought occurrence, while their associations with total drought duration and intensity were less conclusive.
What are the implications of the main findings?
- AlphaEarth provides a common landscape description for relating heterogeneous catchment backgrounds to distinct drought responses.
- Catchment drought susceptibility requires separate assessment of occurrence, intensity and duration, rather than a single ranking of vulnerability.
Abstract
The consequences of drought for rivers depend not only on the atmospheric water deficit but also on how catchments store and release water. It remains unclear how well catchment characteristics distinguish streamflow drought occurrence under similar meteorological conditions. We combined AlphaEarth satellite descriptors with principal component analysis to examine this question in 361 relatively undisturbed catchments across the conterminous United States. Using the three-month Standardized Precipitation Evapotranspiration Index (SPEI) and Standardized Streamflow Index (SSI), we linked meteorological droughts to subsequent streamflow droughts and assessed whether catchment landscapes helped explain differences in their occurrence, intensity and duration under comparable meteorological and initial streamflow conditions. Occurrence was most clearly associated with PC1, the dominant component of the AlphaEarth descriptors, whose landscape differences were partly reflected in drainage density and forest cover. At comparable meteorological drought durations and the same meteorological intensity and initial streamflow conditions, catchments in the upper PC1 quartile had estimated occurrence probabilities 8.1–20.9 percentage points below those in the lower quartile. The separation was greater for moderate-or-stronger drought, at 13.8–22.3 points. Higher PC1 also tended to accompany lower drought intensity, but the evidence for intensity and duration differences was less conclusive than for occurrence. These findings support the use of a common satellite-derived landscape description to identify catchments more susceptible to streamflow drought under comparable meteorological conditions, while showing that occurrence probability alone cannot indicate how severe or persistent the resulting drought will be.
1. Introduction
Communities and freshwater ecosystems rely on river discharge during dry periods. A prolonged lack of rain, however, does not by itself determine when discharge becomes unusually low or how long the shortage lasts. Water stored in soils and groundwater can sustain rivers as rainfall declines, delaying or moderating the shortage. Depletion of these stores can also prolong low discharge after rainfall returns [1]. Meteorological drought describes the atmospheric water deficit, while streamflow drought describes a period of unusually low river discharge. By storing and releasing water, catchments mediate this connection. Understanding their role helps explain why dry periods develop into river water shortages in some places but not others.
Research on drought propagation has established that climate and catchment storage influence how meteorological deficits develop into streamflow drought [1,2]. These responses involve interactions among atmospheric anomalies, land-surface processes and subsurface storage over different durations [3]. Regional studies further show that propagation and recovery vary with catchment characteristics, index scale and event definition [4,5]. These findings establish the importance of catchment differences but leave a more specific comparison to be made: under similar meteorological conditions, are the landscape characteristics associated with drought occurrence also associated with the intensity and duration of the droughts that develop?
Propagation probability and the characteristics of established droughts provide complementary information. In 50 Swedish catchments, conditional probabilities quantified how often meteorological drought, characterized using precipitation, was followed by streamflow and other hydrological deficits [6]. Across 1089 catchments, a different analysis linked existing streamflow droughts to preceding meteorological events and compared their severity and intensity [7]. The first perspective shows how often streamflow drought occurs, but not how severe or persistent it becomes; the second describes those characteristics but cannot by itself establish the probability of occurrence because meteorological droughts without a streamflow response are not included. Bringing both perspectives into the same catchment comparison can distinguish landscapes associated with frequent mild responses from those associated with less frequent but deeper or longer responses. Duration, mean intensity and peak intensity must be considered separately because an accumulated deficit cannot distinguish a long, shallow event from a short, deep one.
A common description of catchment background is needed to compare these responses across heterogeneous landscapes. Conventional attributes quantify useful individual properties, but their selection, aggregation and evaluation differ among studies. A systematic review of 742 studies identified no agreed approach to these choices and found that spatial and subsurface variability were often poorly represented [8]. Comparing catchments therefore requires a consistent representation of multiple landscape properties. AlphaEarth provides a common set of descriptors derived from Earth observations [9], offering a basis for representing composite landscape differences. Recent hydrological applications demonstrate the relevance of these representations to similarity and rainfall–runoff modeling [10,11]. Whether this shared description also distinguishes drought occurrence, intensity and duration remains an important question for comparing catchment susceptibility to a specified meteorological drought.
This study examines two linked questions. First, which meteorological conditions and catchment backgrounds are associated with new streamflow drought, and do these associations vary with drought severity? Second, how are the duration, mean intensity and peak intensity of the droughts that develop related to those conditions and backgrounds? AlphaEarth provides a consistent satellite-derived description of heterogeneous catchment landscapes, allowing their drought responses to be compared within a common framework. This study extends its application from catchment similarity and rainfall–runoff modeling [10,11] to differences in streamflow drought occurrence, intensity and duration. This helps clarify how catchment landscapes relate to the consequences of meteorological drought and supports drought assessment that considers both the likelihood of occurrence and the severity and persistence of the resulting shortages.
2. Materials and Methods
2.1. Catchment Data and Landscape Characteristics
We selected GAGES-II reference catchments to examine climate and landscape associations under relatively low human disturbance. This classification identifies comparatively least-disturbed catchments within broad ecological regions [12]. This study comprised 361 catchments in the conterminous United States with landscape data and CAMELSH NLDAS-2 meteorological and discharge source records for 1980–2024 [13]. All 361 contributed to the landscape description; 355 contained usable daily discharge observations. Occurrence and event-characteristic analyses used subsets of those 355 catchments with the observations required for each response. Discharge records were obtained from existing USGS gauge observations assembled by CAMELSH and provide the observed discharge response. NLDAS-2 supplies the gridded meteorological forcing, used to calculate meteorological drought conditions [13].
Daily mean discharge required at least 18 valid non-negative hourly observations, including observed zeros. Internal gaps of up to seven days were linearly interpolated between observed endpoints; longer gaps and gaps at record boundaries remained missing. Interpolated values accounted for 1.98% of all available daily values after filling and 1.63% of the daily values contributing to usable monthly means. These percentages use catchment-day records as their denominators.
After gap filling, monthly discharge was the arithmetic mean of daily mean discharge within each calendar month, in m3 s−1. A month was retained only when every day was available, yielding 114,038 catchment-months. Hourly precipitation and non-negative potential evapotranspiration were accumulated to monthly depths in millimeters. Precipitation and potential-evapotranspiration records were complete for every hour in all 194,940 catchment-months (361 catchments, 1980–2024). Monthly totals therefore required no adjustment for missing observations.
AlphaEarth supplied eight annual, 64-dimensional descriptors for each catchment during 2017–2024. We obtained catchment spatial means from the Google Earth Engine annual satellite-embedding collection, averaged the annual vectors and normalized each catchment vector to unit length. Principal component analysis (PCA) reduced these 64 dimensions to a smaller set of landscape coordinates. To account for upstream–downstream connections when constructing the coordinates, we fitted PCA to river-network-group mean vectors, each normalized to unit length.
PCA identifies weighted combinations of the descriptors that capture the main differences among landscapes. We centered each descriptor by subtracting its mean across river-network groups. PCA was then applied without rescaling individual descriptors, preserving their relative variation in the original embedding space. Component weights (loadings) were obtained by singular-value decomposition. We retained the smallest number of components explaining at least 80% of the variation, up to ten components. Each component was oriented so that its largest absolute loading was positive.
We then applied these same weights to every catchment. For catchment i, its normalized descriptor vector was centered using the mean vector μ across river-network groups and multiplied by the loading vector for component k. The resulting score was standardized across catchments to give the coordinate used in the regressions:
Here, and are the mean and standard deviation of the raw scores across all 361 catchments. A one-unit change in therefore represents one standard deviation of between-catchment variation.
To understand what landscape differences the PCs represent, we compared their scores with eight conventional attributes: aridity, precipitation seasonality, slope, drainage density, permeability, available water capacity, depth to bedrock and forest cover. Spearman correlations described how each attribute varied with each PC across the 361 catchments. We also used boxplots to show the attribute distributions in the lower quartile, middle half and upper quartile of PC1 and, separately, PC2. Each attribute was converted to percentile ranks across all 361 catchments so that quantities with different units could be displayed on the same scale; each catchment received equal weight.
The conventional attributes describe catchment-scale climate, terrain, drainage, soils and land cover. Channel-bed grain size and lithology were not measured. Permeability and depth to bedrock provide subsurface context but are not direct measurements of channel sediment or groundwater exchange.
2.2. Drought Index Calculation
Meteorological drought was described by the Standardized Precipitation Evapotranspiration Index (SPEI), based on accumulated precipitation minus potential evapotranspiration [14]. Streamflow drought was described by the Standardized Streamflow Index (SSI), which standardizes discharge relative to its seasonal distribution [15]. SSI expresses the relative magnitude of a streamflow anomaly within a catchment.
We used three-month SPEI and SSI to examine event-scale drought responses in comparatively little-disturbed catchments. One-month indices retain short fluctuations that can split a dry period into several brief events, whereas six- or twelve-month inputs smooth changes over longer periods and can obscure the timing of shorter meteorological–streamflow responses [16,17]. Three months provided a common intermediate scale intended to reduce fragmentation while retaining changes over a season.
Both indices were standardized separately for each calendar month, and every month in a three-month input window had to be available. SPEI used the log-logistic distribution proposed in its original formulation [14]. The reference period was 1981–2016, with at least 30 non-constant values. Shape and scale were fitted by maximum likelihood, with location fixed just below the reference minimum.
SSI used a rank-based, nonparametric approach to describe anomalies within the observed streamflow record [18]. Available three-month discharge means from 1980 to 2024 formed the reference sample, requiring at least 20 years and two distinct values. Each three-month mean was assigned a probability of , where is its rank and the sample size; tied values received their average rank. The probability was then transformed to a standard-normal score.
2.3. Drought Event Definitions and Characteristics
A meteorological drought event comprised consecutive months with a SPEI below −0.5, lasted at least three months, and reached a SPEI of −1 or lower. A streamflow drought comprised consecutive months with SSI below −0.5, lasting at least one month and without an additional −1 condition. For both indices, the onset was the first below-threshold month, and the final drought month preceded the return to −0.5 or above. Non-drought months were not merged into events.
We evaluated whether each meteorological drought was followed by a new streamflow drought and whether that response reached moderate severity or stronger. A new streamflow drought had to begin within the correspondence window defined below but could end outside it. All streamflow droughts linked to the same meteorological drought were combined into one response. A combined response with minimum SSI ≤ −1 was classified as moderate-or-stronger; otherwise, it was mild. Mild-inclusive occurrence includes both types.
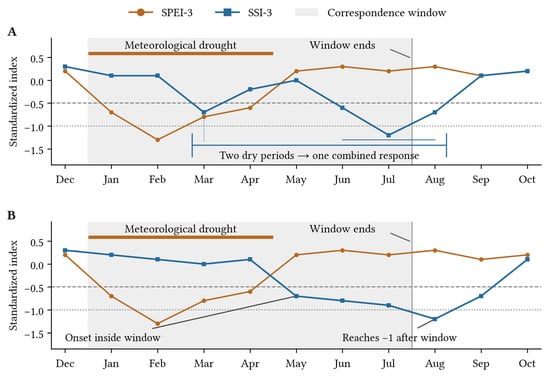
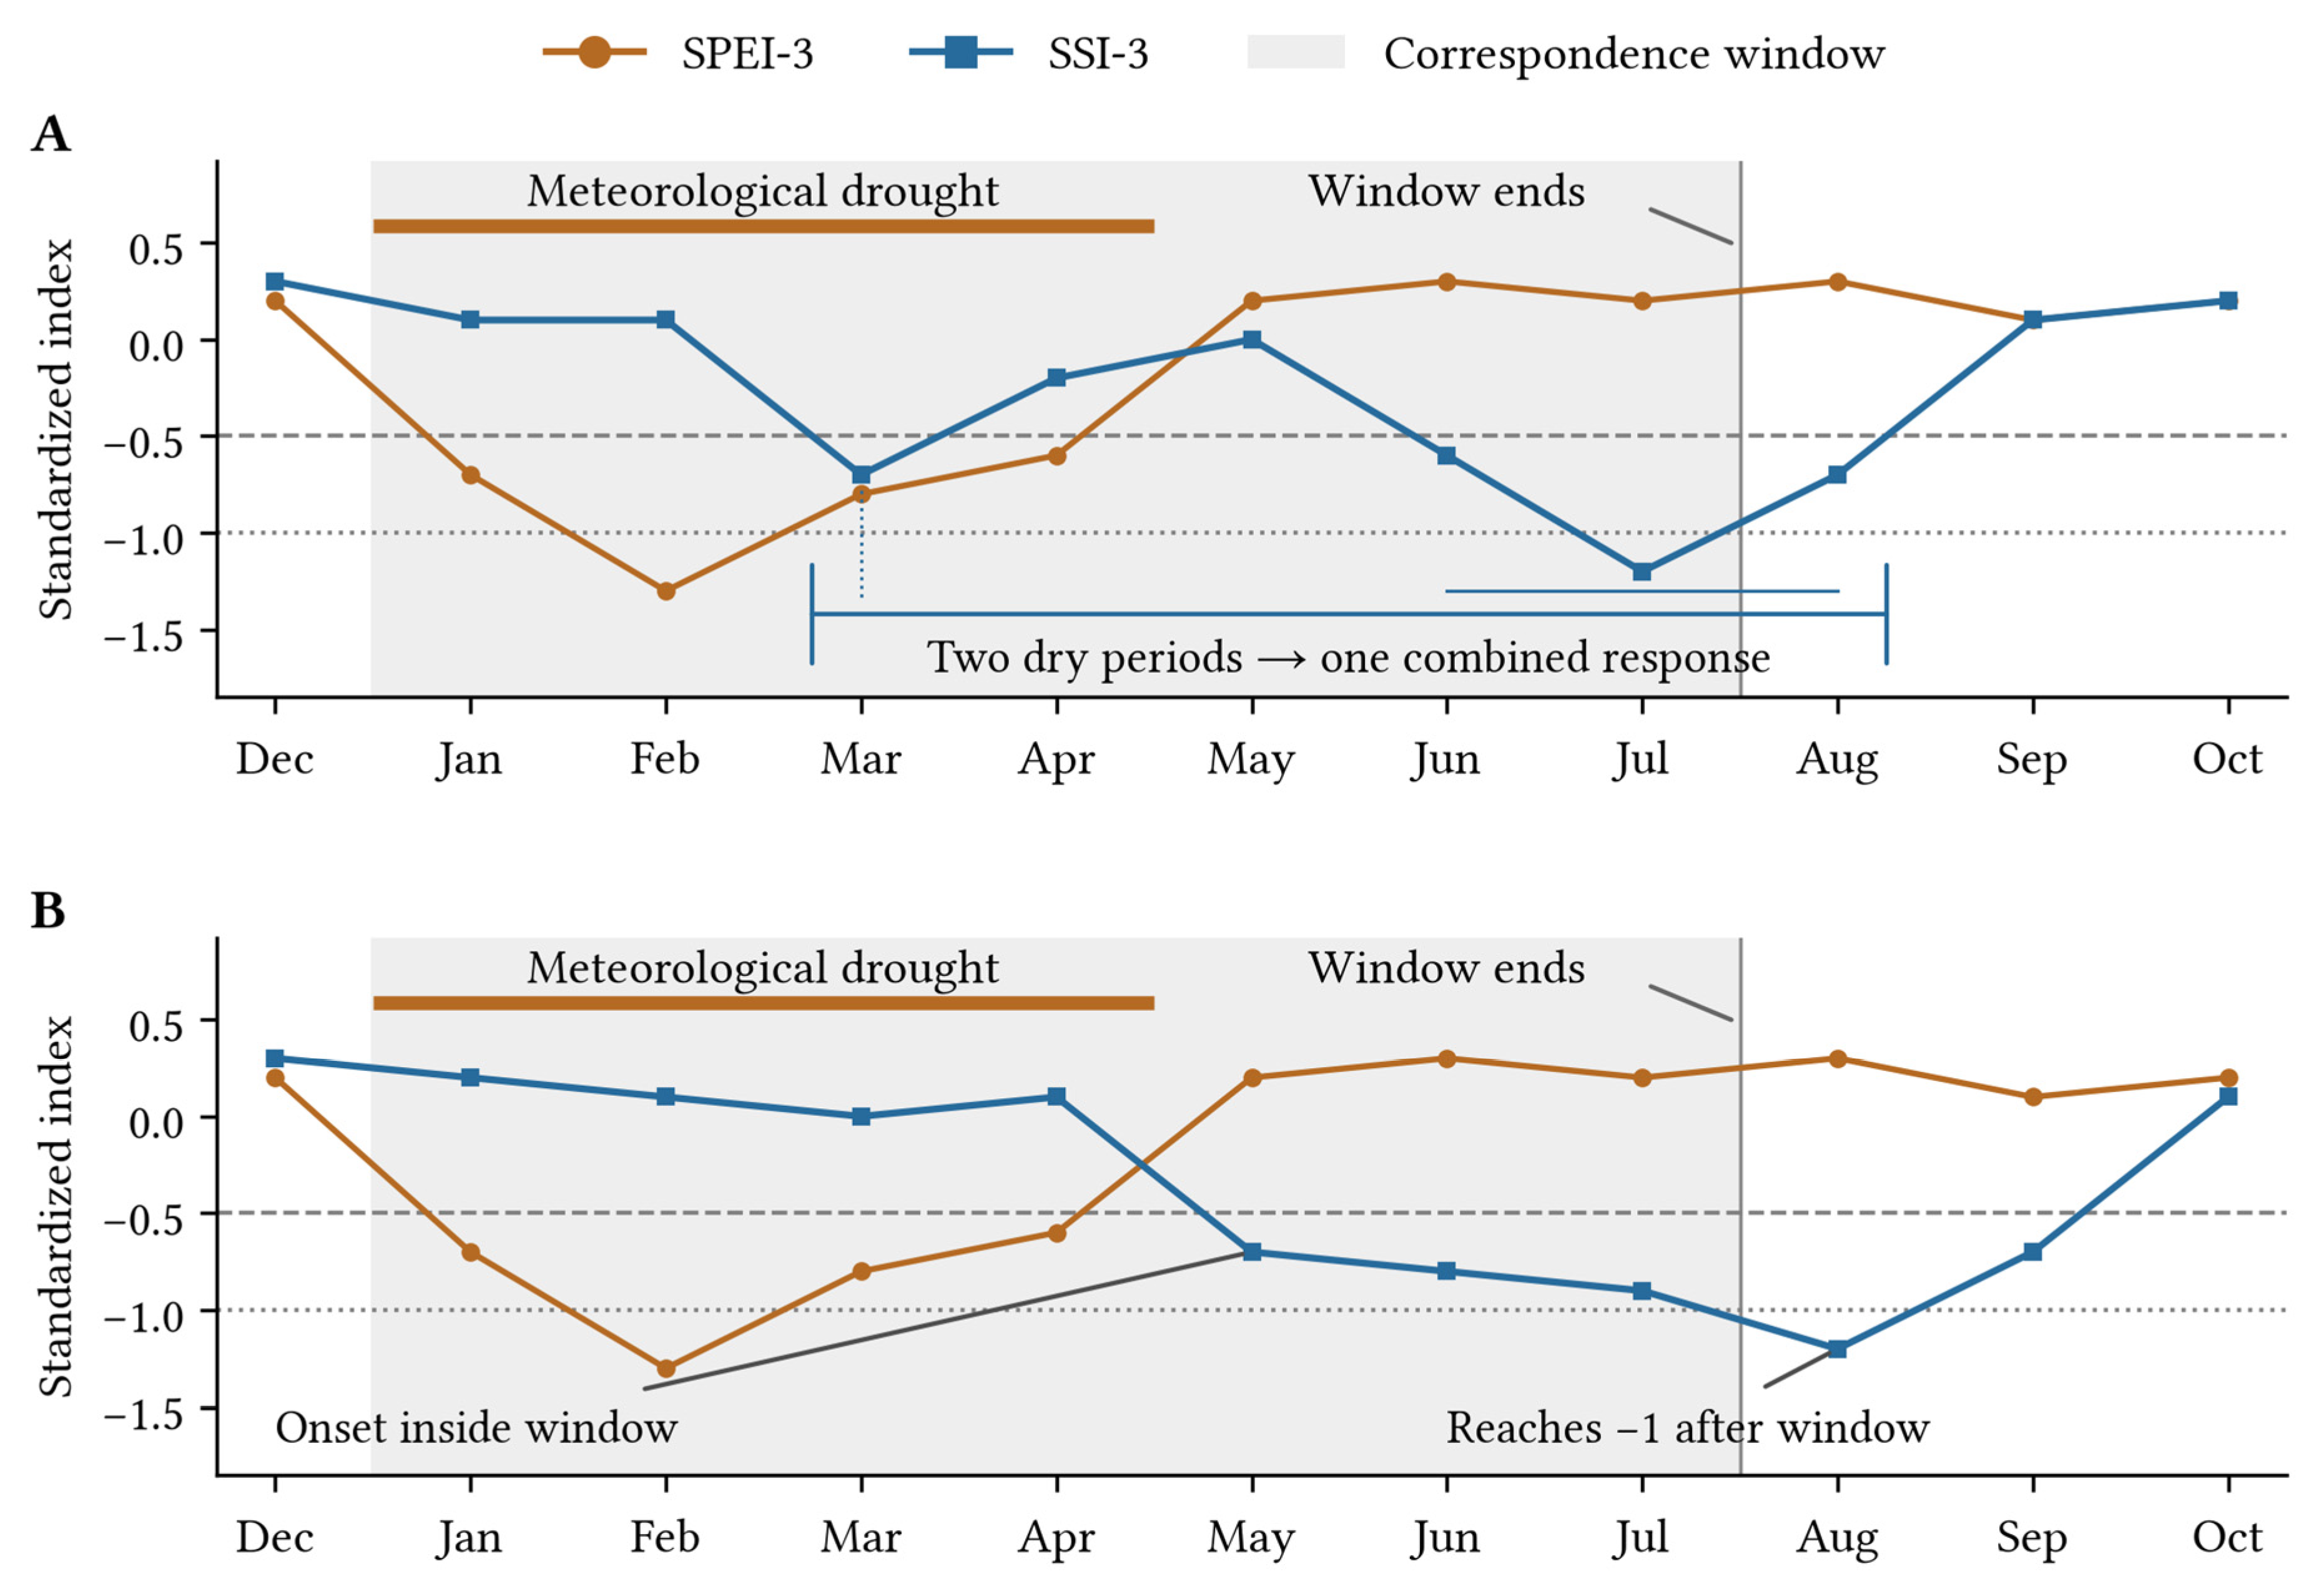
We linked streamflow drought to a meteorological event when the streamflow dry period began between the meteorological onset and three months after its final drought month. This correspondence window closed earlier if another eligible meteorological drought began. For illustration, Figure 1 uses a hypothetical meteorological drought lasting from January to April, with a correspondence window ending in July. In panel A of Figure 1, the March and June–August streamflow drought form one combined response. Their drought months are pooled when calculating duration and intensity; the intervening non-drought months are excluded. The minimum SSI across both periods determines the response type. In panel B of Figure 1, the May–September dry period begins within the window but first reaches −1 in August. It is still a moderate-or-stronger response, and its full duration and intensity include August and September. Thus, the window limits the start of a linked dry period, not its end or the timing of its lowest SSI.
Figure 1.
Correspondence and combined streamflow drought responses, illustrated with synthetic monthly indices. Grey shading marks the January–July correspondence window; the horizontal dashed line at −0.5 marks the drought threshold and the dotted line at −1 marks the threshold for moderate-or-stronger drought. (A) Two dry periods form one response, excluding intervening non-drought months from its duration and intensity. (B) A period beginning inside the window is followed through September and is classified as moderate despite first reaching −1 in August.
A clearly observed new streamflow drought confirmed a mild-inclusive occurrence, even if a separate earlier gap left other parts of the window unobserved. Moderate-or-stronger occurrence was confirmed once any linked SSI reached −1. Missing observations after confirmation did not reverse that positive outcome. To establish mild-inclusive non-occurrence, the entire window had to be observed, without a new dry period. To establish moderate-or-stronger non-occurrence, the window had to be fully observed, and every linked SSI had to end without reaching −1. Otherwise the outcome remained undetermined. An unfinished dry period that had already reached −1 could confirm moderate-or-stronger occurrence but could not contribute complete duration or intensity.
Direct comparisons between severity levels used the same meteorological events, restricted to those for which both occurrence outcomes could be determined. We refer to these events as the common two-threshold sample. Events with confirmed mild-inclusive occurrence but undetermined moderate-or-stronger status contributed only to the mild-inclusive occurrence analysis. Because the correspondence window includes the meteorological event itself, longer meteorological droughts provide both longer forcing and more time for streamflow drought to develop.
For a combined response, total drought duration was the number of months with SSI below −0.5 across all linked dry periods. Mean intensity was the sum of (−0.5 − SSI) over those drought months divided by their total number. Peak intensity was described by the minimum SSI across the entire combined response. We therefore added the dry-period durations and weighted their mean intensities by their drought-month counts; we did not select only the longest or strongest period. Non-drought months between periods were excluded from both total duration and mean intensity. The same calculation included all linked dry periods in a moderate-or-stronger response, not only those individually reaching −1.
Complete duration and intensity required an observed correspondence window and the observed end of every linked dry period. Otherwise an additional period or part of a continuing drought could be missing, leaving the combined totals unknown. Such a response could still confirm occurrence if a new dry period had been observed. A dry period extending beyond the window was retained, not truncated or excluded. If another meteorological drought began before streamflow recovered, that subsequent forcing remained part of the observed response; the models adjusted for the initially linked event rather than isolating its causal effect.
2.4. Conditional Models of Drought Occurrence and Characteristics
We used regression to compare catchment backgrounds under similar meteorological drought and initial streamflow conditions. We asked separately whether a new streamflow drought occurred and, for complete combined responses, their total drought duration and intensity. The models accounted for meteorological drought duration, mean intensity and SSI in the month before meteorological drought onset. Meteorological drought mean intensity was the event mean of (−0.5 − SPEI). For the descriptive plots, duration was grouped into 3, 4–5 and at least 6 months, and intensity into lower, middle and upper occurrence-sample tertiles. Duration and intensity remained continuous variables in the regressions.
Each meteorological drought event contributed at most one observation to each model. Separate logistic regressions estimated the probability that a meteorological drought was followed by a streamflow drought, either including mild droughts or restricted to moderate-or-stronger droughts. Logistic regression provides an explicit relationship between the predictors and occurrence probability, with coefficients that can be interpreted as conditional odds ratios. This makes it suitable for comparing landscape associations under the same event conditions. For complete combined responses, separate linear regressions modeled log drought duration, log mean intensity and log peak magnitude, first for the mild-inclusive sample and then for its moderate-or-stronger subset. Peak magnitude was defined as the absolute value of minimum SSI. Here, log transformation reduced the influence of long upper tails and expressed associations on a conditional geometric-mean scale.
Each model included meteorological drought duration, mean intensity and initial streamflow conditions, together with the seven landscape coordinates. The landscape coefficients thus describe associations conditional on these event characteristics and the other coordinates. A duration–intensity interaction allowed the association with meteorological intensity to vary with event length. All responses used the same predictor structure, with coefficients estimated separately:
Here, indexes meteorological drought events, is standardized log meteorological drought duration, is standardized meteorological drought mean intensity, is standardized SSI in the month before meteorological drought onset, and is the score on PC . All seven PCs entered jointly. For each meteorological or initial-streamflow predictor, standardization subtracts the occurrence-sample mean and divides by its standard deviation; duration is log-transformed first. The same means and standard deviations were reused in the corresponding characteristic models and in paired comparisons between severity levels.
In the occurrence models, denotes the probability that meteorological event is followed by streamflow drought at the specified threshold. The linear predictor can take any real value; the logistic function maps it to a probability between zero and one. In the event-characteristic models, duration and intensity are log-transformed and regressed on the same predictors. Thus, occurrence uses a binomial response with a logit link, whereas each positive event characteristic uses a separate linear model on the logarithmic scale. The latter includes an event-level residual around the fitted linear predictor in Equation (2).
The coefficient for each PC describes its association with a response while holding event conditions and the other six PCs constant. Exponentiating a coefficient gives an odds ratio for occurrence or a conditional geometric-mean ratio for a drought characteristic. To compare actual catchment backgrounds in probability, month and intensity units, we selected the lower and upper PC1 quartiles of all 361 catchments: 91 per group (PC1 ≤ −0.838 and PC1 ≥ 0.643). Group membership depended only on background scores, not on drought responses or event availability. For each catchment, we retained all seven observed PC scores and calculated fitted responses at the same reference conditions: a four-month meteorological drought, a mean meteorological intensity of 1.085, and an initial SSI of 0.385. We then averaged probabilities equally across catchments within each group and summarized duration and intensity predictions geometrically. High-minus-low differences therefore compare complete landscape profiles, not changes in PC1 alone.
To show whether the landscape contrast differed between shorter and longer meteorological droughts, we summarized fitted occurrence probabilities for the same duration groups used in the descriptive plots: 3, 4–5 and at least 6 months. Each comparison gave both background groups the same mix of meteorological durations so that a probability difference would not simply reflect one group having longer droughts. To make the catchment groups comparable, we also used the same meteorological drought intensity and pre-drought streamflow conditions for both groups. We calculated each catchment’s probability at every duration represented in a category, then averaged over durations using their frequencies for both mild-inclusive and moderate-or-stronger occurrence. Each catchment received equal weight within its background group. For example, the four- and five-month predictions received the same weights in both groups. These are summaries of the continuous-duration models, not separate models fitted to each category. Duration weights and background membership remained fixed during resampling.
Model fitting used all eligible events for each response, not only events from the two background groups. Predictions were then calculated for all 182 group members, including catchments without eligible events for that response. Predictions for those catchments relied on associations estimated from the available events in other catchments.
To assess whether a single descriptor captured the same background contrast, we compared the seven-PC model with models using PC1 alone, forest cover alone or drainage density alone. These models used identical events and meteorological controls, and predictions used the same catchments and reference conditions. Paired bootstrap differences compared the resulting high-minus-low contrasts.
Uncertainty was estimated by resampling river-network groups 1000 times, keeping repeated meteorological drought events and connected catchments together. The same resamples were used to compare severity levels and landscape descriptors. Pointwise 95% intervals describe one estimate at a time. Simultaneous 95% intervals account for examining several coordinates and responses together, using the largest standardized deviation in each bootstrap resample. This reduces the chance of highlighting an association simply because many were examined. In the results, intervals for PC associations use this simultaneous adjustment unless labeled pointwise. The landscape coordinates and predictor units were fixed across resamples.
To assess whether occurrence probabilities remained useful for events not used to fit the model, we used a five-fold river-network-group validation: events from each group were predicted by a model fitted to the other four folds. Keeping connected catchments together avoided splitting their events between training and evaluation. The landscape coordinates remained fixed. Area under the receiver operating characteristic curve (AUC) measured how well predictions distinguished occurrence from non-occurrence. The Brier score measured probability error. Calibration compared predicted probabilities with observed occurrence frequencies; a calibration slope of one is the target; lower values suggest that predicted differences in occurrence probability are larger than supported by the held-out observations. This evaluates new event responses within the fixed landscape representation, rather than independently validating the construction of the representation itself. We repeated the five-fold validation with five fixed random seeds; predictor scaling used only the training folds.
3. Results
3.1. Landscape Representation and Event Coverage
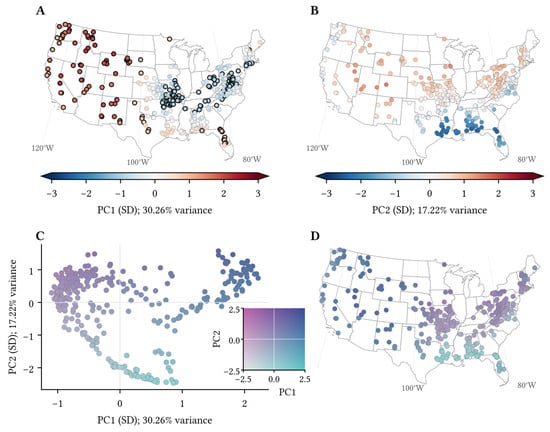
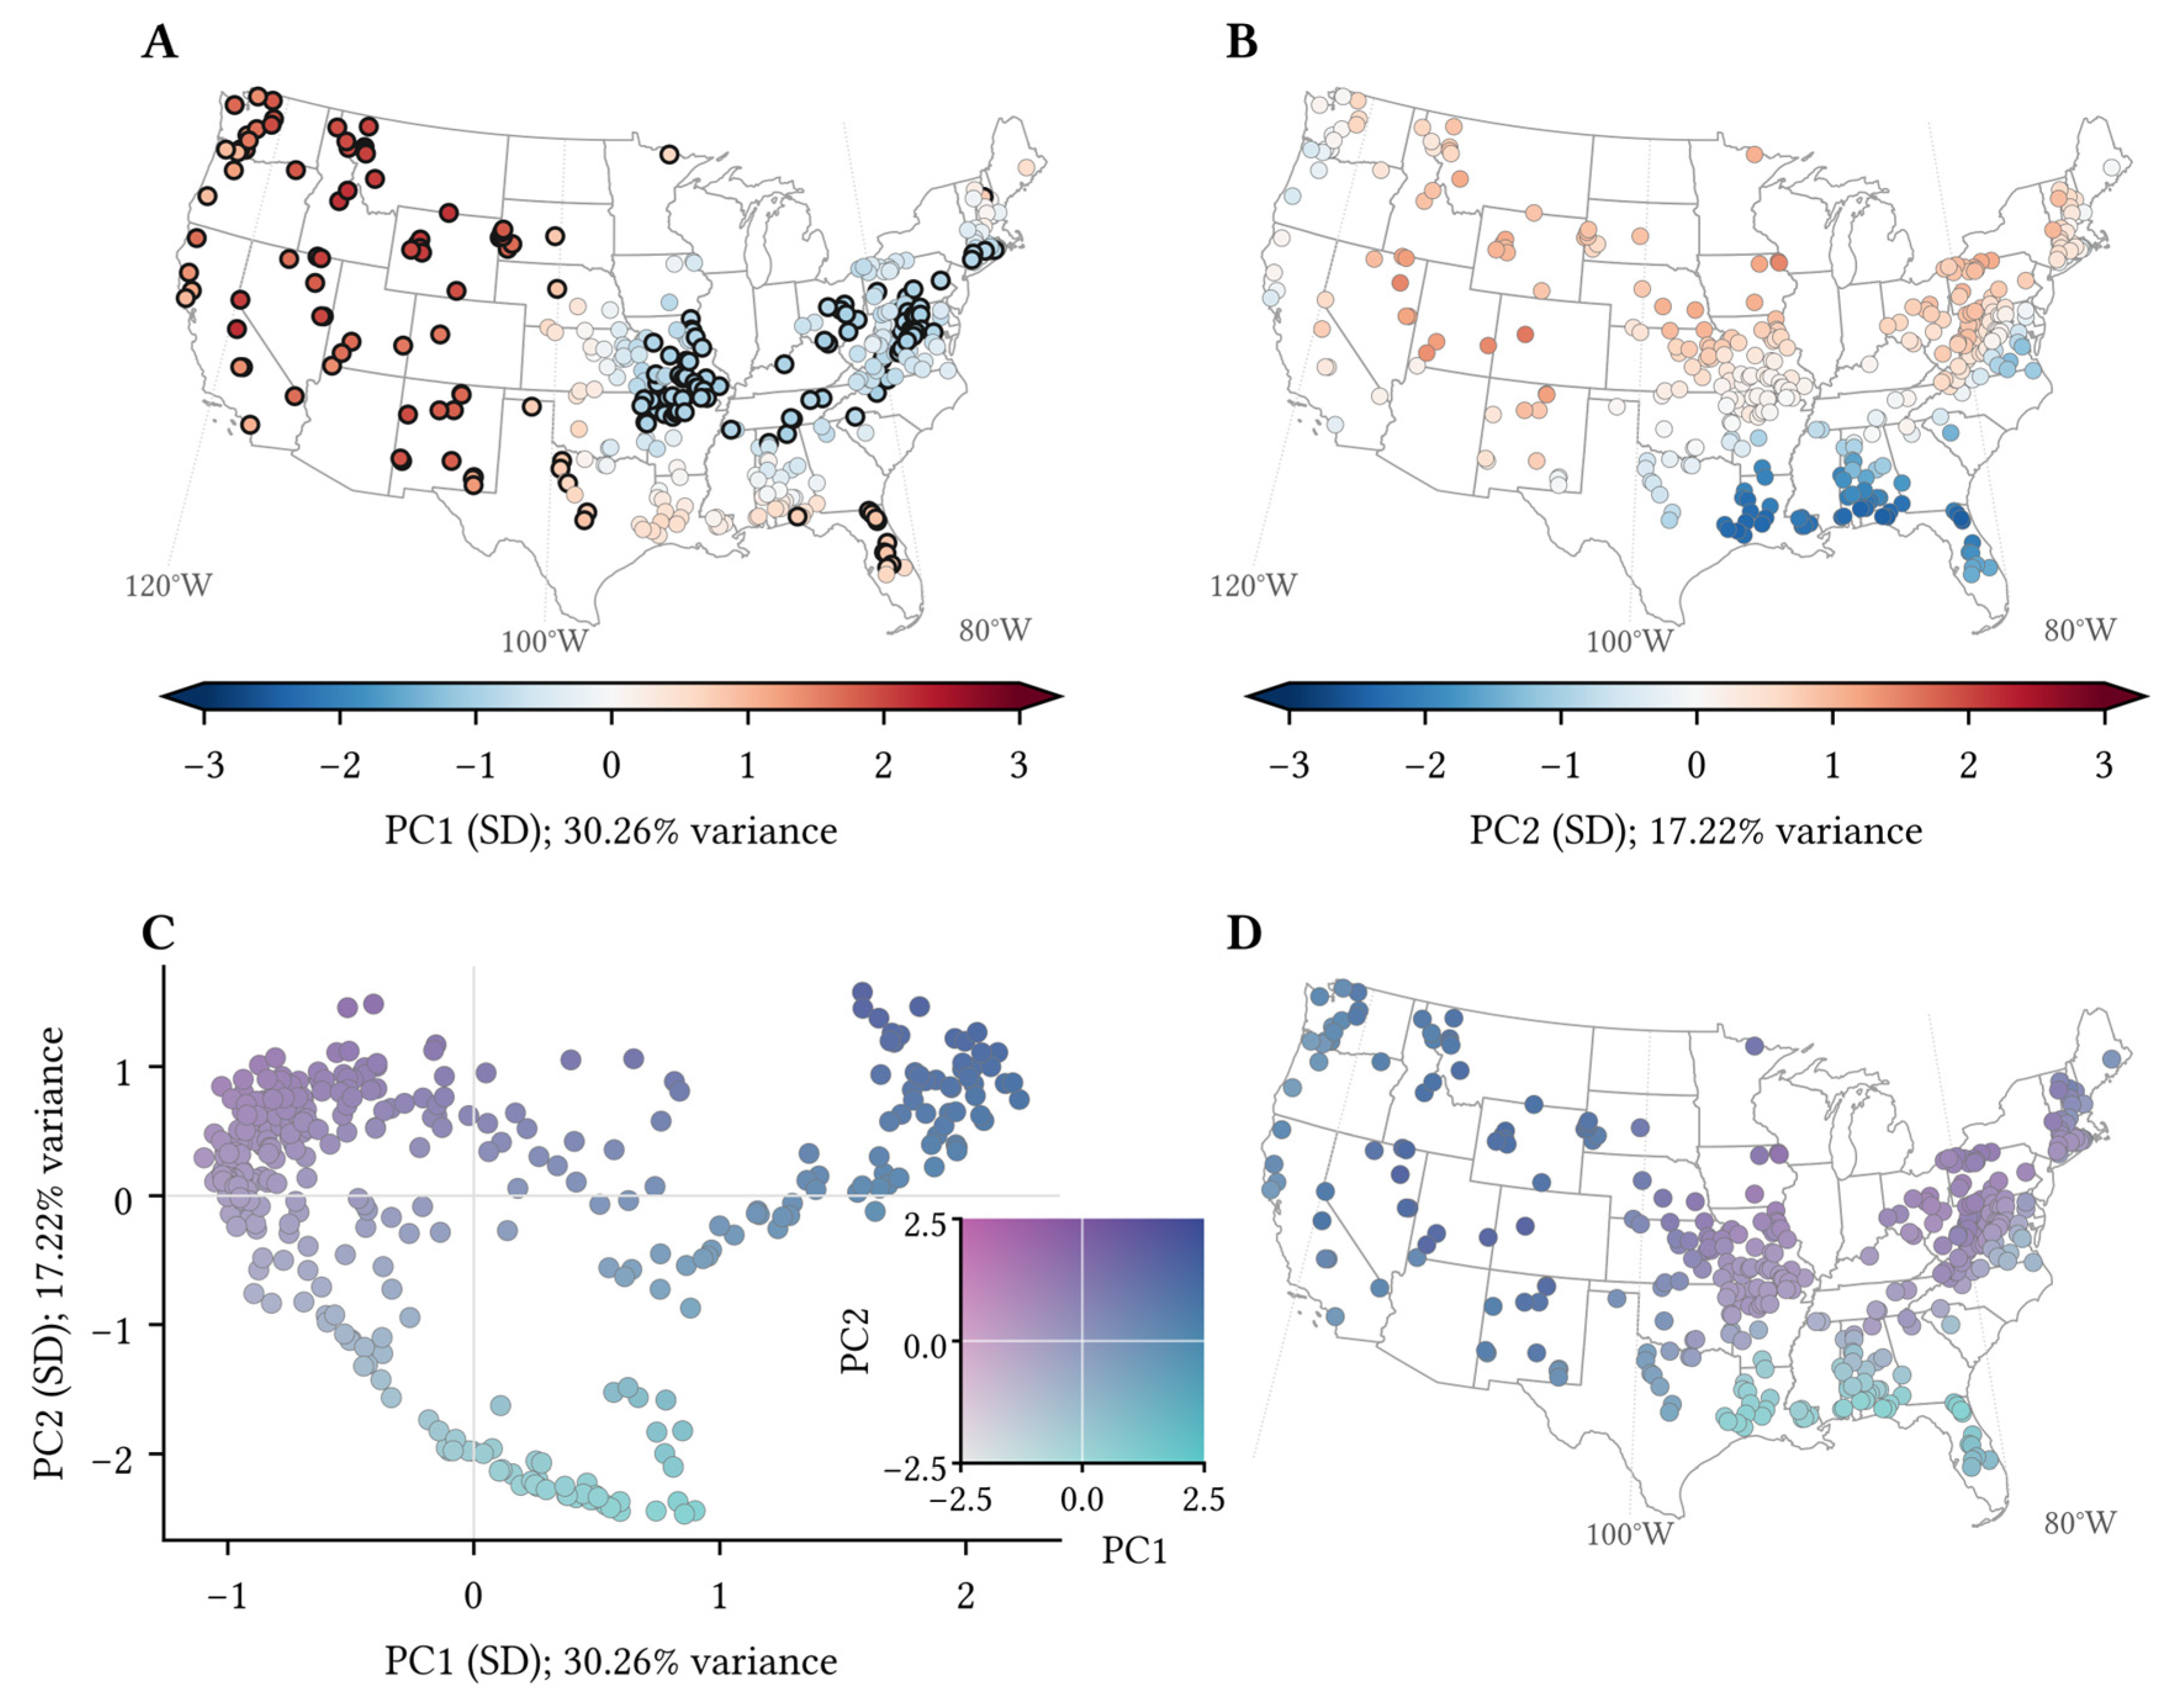
The 361 catchments formed 323 river-network groups. PCA retained seven components explaining 81.92% of embedding variance; PC1 and PC2 explained 30.26% and 17.22%, respectively (47.48% together). Figure 2 shows the geographical distribution of PC1 and PC2 scores. It also marks the catchments in the lower and upper PC1 quartiles used in the subsequent comparisons. These percentages describe descriptor variation, not explained variation in drought responses.
Figure 2.
Landscape coordinates and geographic distributions of 361 catchments. (A,B) Standardized PC1 and PC2 scores, with percentages of embedding variance explained. (C) Catchments in PC1–PC2 space, and (D), their geographic locations using the same bivariate colors. The color key combines PC1 horizontally and PC2 vertically; zero denotes the mean score. Black outlines in A mark the lower and upper PC1 quartiles (91 catchments each) used in the response comparisons.
Streamflow drought was common in the shared sample, but reaching moderate severity was less frequent. Of the 7646 eligible SPEI-3 events, 2667 in 326 catchments had a determinable mild-inclusive occurrence outcome: 2398 occurrences and 269 non-occurrences. Moderate-or-stronger occurrence remained undetermined for 266 confirmed mild-inclusive occurrences, leaving 2401 meteorological drought events in 314 catchments with known outcomes at both thresholds.
Within this shared sample of 2401 meteorological events, 2132 (88.8%) were followed by streamflow drought, including mild droughts, and 1681 (70.0%) were followed by moderate-or-stronger drought. Each meteorological drought event was counted once in each occurrence analysis. Complete combined characteristics were available for 1655 meteorological events in 233 catchments. These responses contained 1980 streamflow dry periods; 301 combined more than one period, and 1204 reached moderate severity or stronger. The medians (interquartile ranges) were 4 months (3–7) for drought duration, 0.511 (0.307–0.752) for mean intensity, and −1.364 (−1.960 to −0.987) for minimum SSI. Of the 2398 confirmed drought responses, 686 lacked a fully observed correspondence window, and a further 57 had an unfinished or interrupted dry period. These responses confirmed occurrence but could not provide complete drought duration and intensity. Thus, meteorological-event counts include both occurrence and non-occurrence, whereas characteristic counts include only complete combined drought responses.
It should be noted that data availability favored recent decades and differed among catchment backgrounds. Of the 7646 meteorological events, 857 began when streamflow was already in drought and were outside the new-onset analysis. Another 4122 could not be classified: 3594 lacked an initial SSI value, and 528 had incomplete SSI coverage within the correspondence window without a confirmed new drought. Unavailable SSI did not always mean missing discharge measurements. Among the 3594 initial cases, 2030 required three-month inputs extending beyond the usable monthly record, 876 encountered gaps within that record, and 140 had no usable monthly discharge. The remaining 548 had complete three-month inputs but fewer than 20 same-calendar-month reference values for SSI standardization. Additionally, occurrence could be determined for only five of the 1452 meteorological droughts beginning in the 1980s, compared with 1182 of 2238 in the 2010s. The occurrence analysis therefore represents recent decades much more strongly than the early record.
Across regions, 19.3–51.5% of meteorological events had determinable occurrence outcomes. The lowest proportions entering occurrence analysis were in the Upper Missouri (19.3%), Pacific Northwest (21.2%), Great Basin (22.0%) and Ohio (23.3%) regions. Retained events and events with unavailable occurrence outcomes shared a median meteorological drought duration of four months but differed in median meteorological drought intensity (0.999 versus 0.885). These differences limit the representativeness of the observable sample. Furthermore, restricting the complete-response sample to moderate-or-stronger droughts reduced its size from 1655 to 1204 events but changed its regional composition little: the share of events from any hydrological region changed by no more than 1.24 percentage points, and 221 of the original 233 catchments remained represented. This suggests that differences between the two characteristic analyses are unlikely to be explained primarily by a large shift in geographical composition.
3.2. Streamflow Responses Across Meteorological Drought Conditions
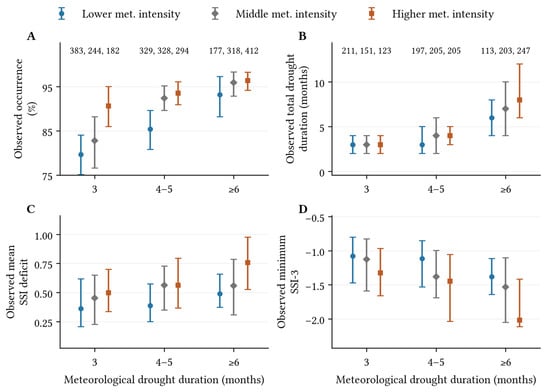
Observed drought event summaries showed that, in the full mild-inclusive occurrence sample of 2667 meteorological events, longer and more intense droughts were more often accompanied by streamflow drought (Figure 3). The duration groups of 3, 4–5 and at least 6 months contained 809, 951 and 907 events, respectively. Within the three-month group, occurrence increased from 79.6% to 82.8% and 90.7% across the lower-, middle- and higher-intensity groups. The corresponding proportions for events lasting at least six months were 93.2%, 95.9% and 96.4%. The complete combined responses also differed in drought duration and intensity across these groups, although their distributions overlapped substantially.
Figure 3.
Observed streamflow drought occurrence, duration and intensity across meteorological droughts of different durations and intensities. (A) mild-inclusive occurrence proportions for 2667 events, with pointwise 95% river-network bootstrap intervals. (B–D) Drought duration, mean intensity and minimum SSI for 1655 complete combined responses, shown as medians and interquartile ranges. Intensity groups use occurrence-sample tertiles. Sample counts in panel (A,B) are ordered from lower to higher intensity; counts in (B) also apply to (C,D).
The conditional regression estimates were consistent with these descriptive patterns. Mild-inclusive occurrence odds increased with meteorological log duration (standardized coefficient 0.620; pointwise 95% interval 0.427–0.903) and intensity (0.437; 0.243–0.675). Because the model includes their interaction, each coefficient describes the association when the other predictor is at its mean. Wetter initial conditions were associated with lower occurrence odds. Longer meteorological droughts were also associated with more streamflow drought months (coefficient 0.376; 0.345–0.411), and greater meteorological intensity with greater mean streamflow drought intensity (0.166; 0.125–0.207).
3.3. Landscape Heterogeneity in Drought Occurrence
The background map showed lower PC1 values concentrated in parts of the central and eastern United States, while higher values were common across the West, including the Northwest (Figure 2A). These geographic patterns locate the backgrounds being compared; the response estimates below account for event conditions and retain all seven coordinates.
Higher PC1 was associated with lower occurrence odds after accounting for meteorological conditions and the other six coordinates. In the paired sample of 2401 meteorological events, the log-odds coefficient was −0.617 (95% interval −1.014 to −0.221) for mild-inclusive occurrence and −0.420 (−0.735 to −0.106) for moderate-or-stronger occurrence. PC2 occurrence associations were not clearly resolved at either threshold.
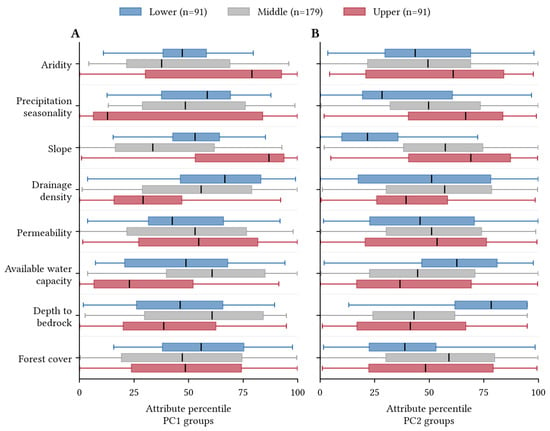
The PC1 groups differed in several observable catchment properties, with drainage density showing a more consistent ordering than forest cover (Figure 4A). Median drainage density declined from 0.906 through 0.856 to 0.670 km per square kilometer from the low to the high group. Forest cover instead had medians of 67.7%, 60.7% and 61.4%, so its group differences were not monotonic. The high group also had a higher aridity median than the low group (1.78 versus 1.45). The boxplots show substantial within-group variation and overlap: these properties help describe the backgrounds without defining sharply separated catchment types.
Figure 4.
Attribute distributions for PC1 (A) and PC2 (B) groups. Lower, Middle and Upper denote each coordinate’s lower quartile, central half and upper quartile (91, 179 and 91 catchments); membership differs between panels. Attributes are percentiles across all 361 catchments. Boxes show interquartile ranges and medians; whiskers extend to the most extreme values within 1.5 interquartile ranges of the box. Outlier markers are omitted.
The PC2 boxplots show a clearer contrast in terrain and subsurface properties (Figure 4B). Median slope increased from 2.52% in the low group to 10.43% in the middle group and 14.50% in the high group. The low group also had generally deeper bedrock, whereas the middle and high groups had shallower, substantially overlapping distributions. The upper half of the high-group slope distribution extended beyond that of the middle group, while the low group was concentrated toward gentler slopes. These distributional differences make PC2 interpretable as a partly characterized terrain and subsurface background, rather than a single measured property.
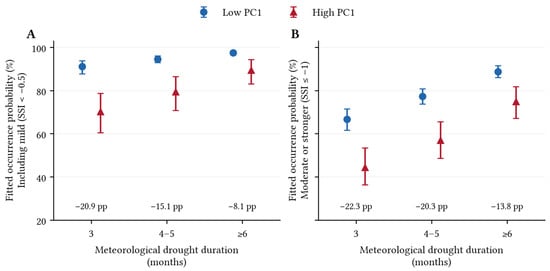
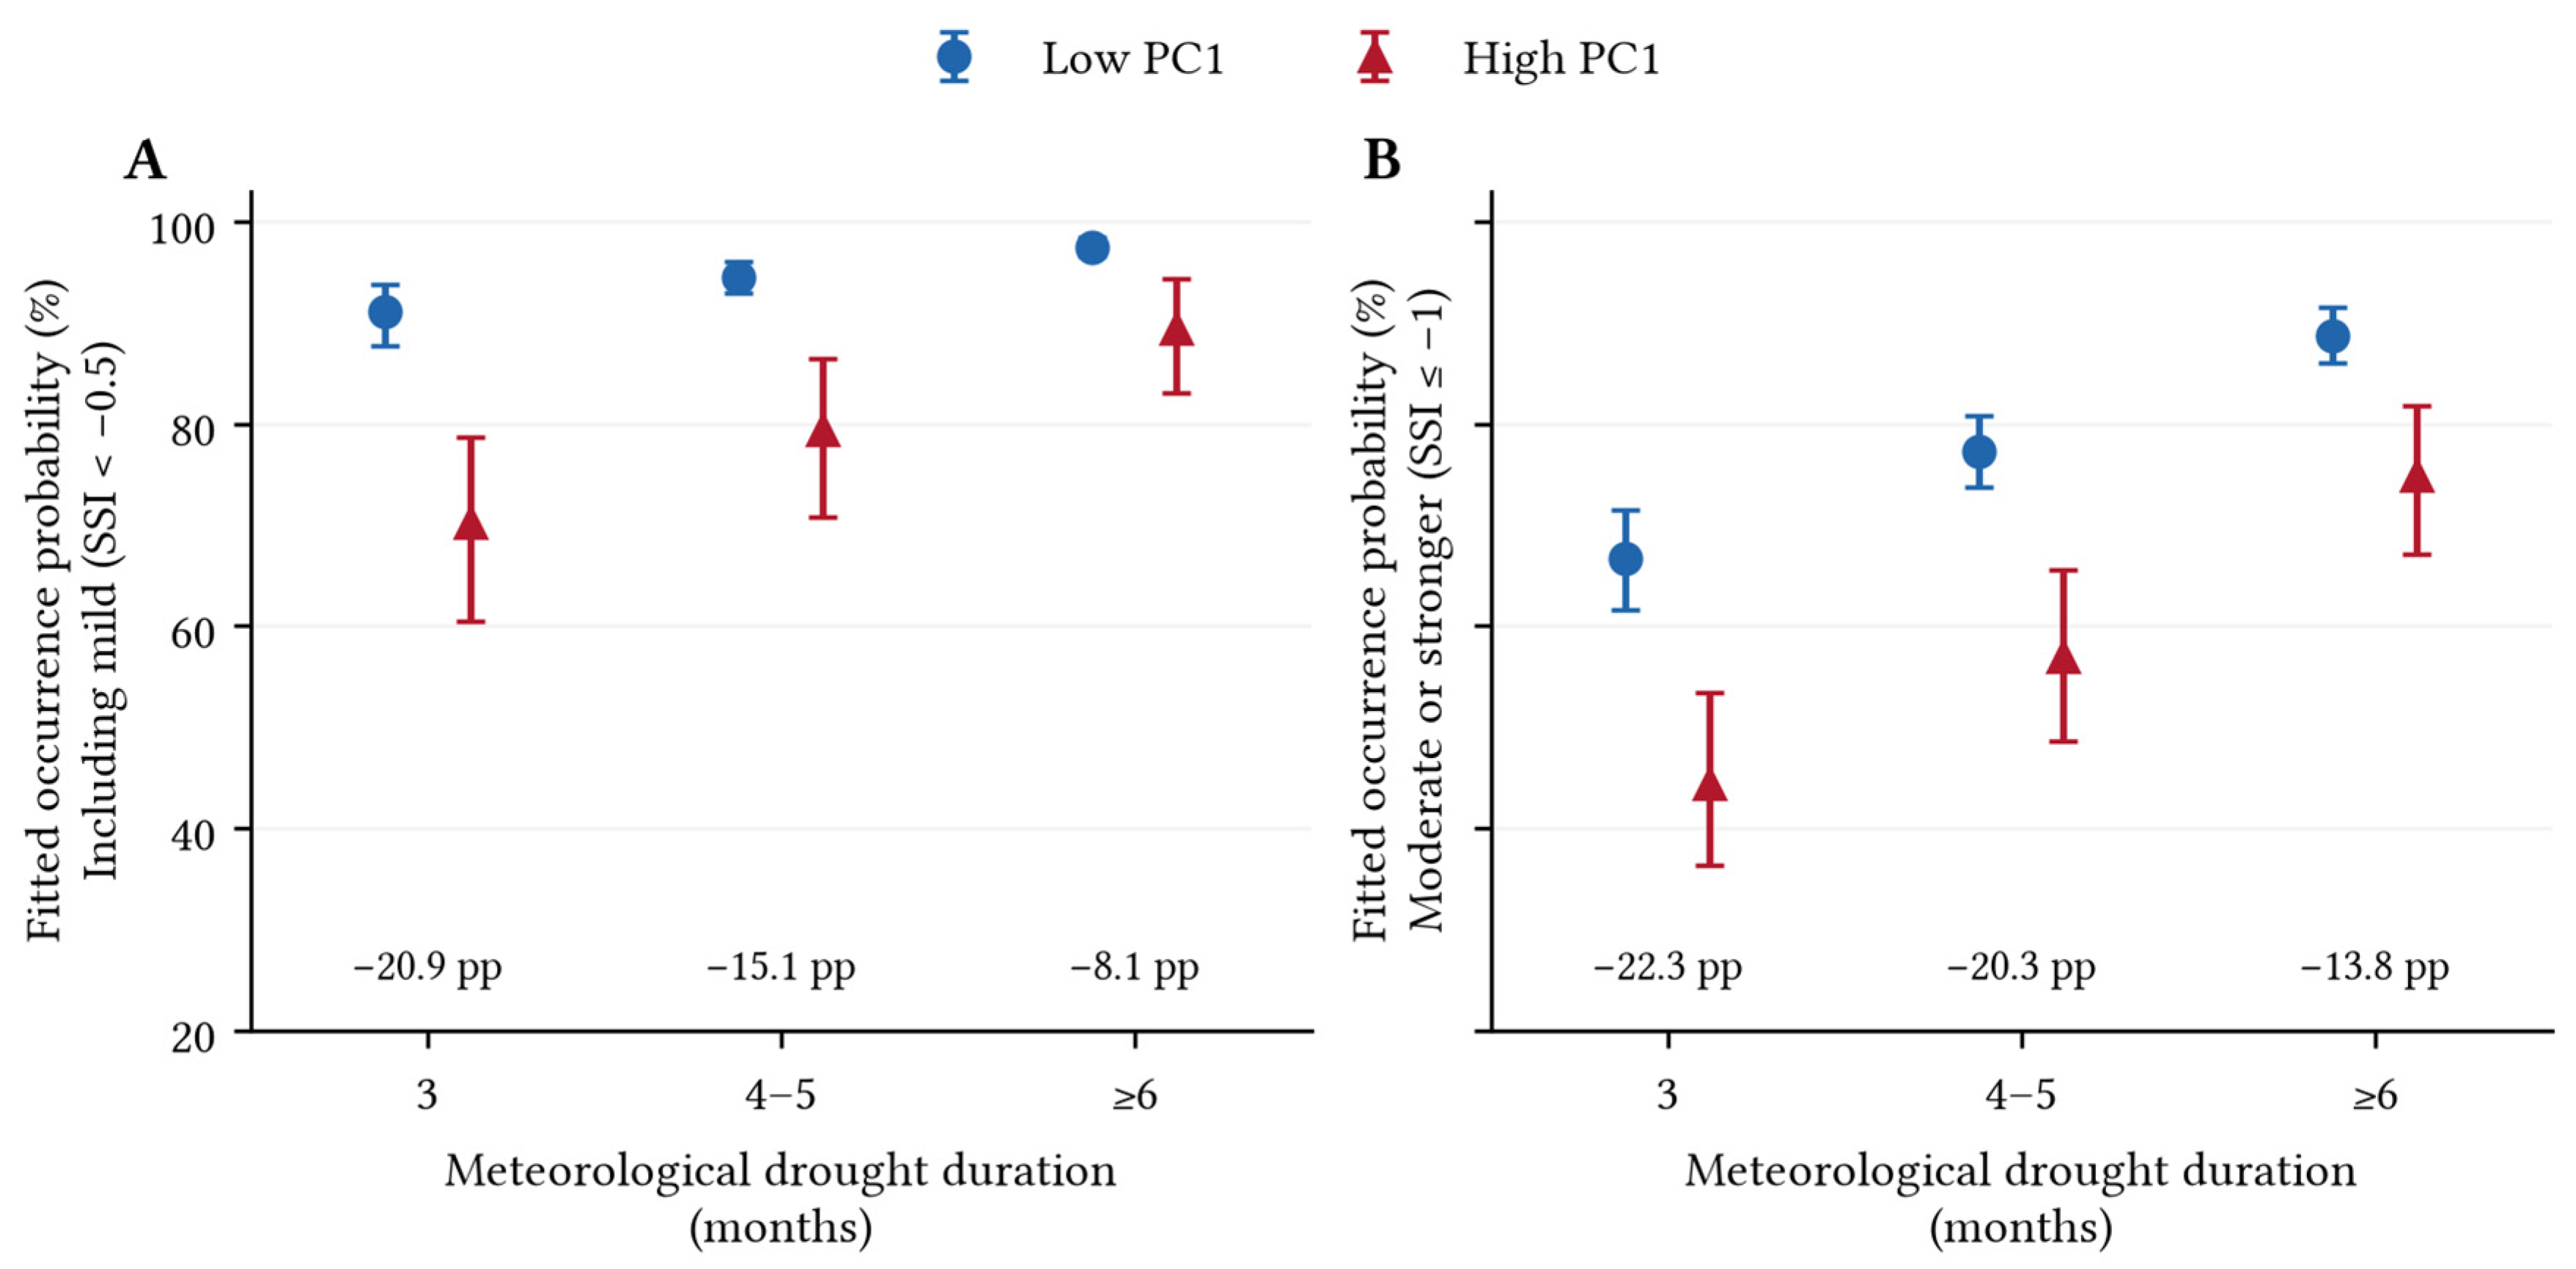
At matched meteorological drought durations, the higher-PC1 group remained less likely to develop streamflow drought (Figure 5). In the three-month category, mild-inclusive occurrence probabilities were 91.2% in the lower-PC1 group and 70.3% in the higher-PC1 group, a 20.9 percentage-point difference. Moderate-or-stronger probabilities were 66.7% and 44.4%, a 22.3-point difference. For meteorological droughts lasting at least six months, mild-inclusive probabilities reached 97.5% and 89.4%, narrowing the gap to 8.1 points; moderate-or-stronger probabilities were 88.7% and 74.9%, a 13.8-point gap. The estimated moderate-or-stronger gap was larger in all three categories.
Figure 5.
Fitted occurrence probabilities by meteorological duration for mild-inclusive (A) and moderate-or-stronger (B) drought, using 2401 events. Points average over 91 low- or 91 high-PC1 profiles with all seven coordinates retained, using shared within-category duration weights. Mean meteorological intensity is fixed at 1.085, and initial SSI is at 0.385. Bars show pointwise 95% paired-bootstrap intervals. Annotations give high-minus-low differences in percentage points (pp).
Across five river-network-group validation partitions, the seven-PC occurrence model had AUC values of 0.768–0.782 for mild-inclusive drought and 0.753–0.760 for moderate-or-stronger drought. These ranges describe sensitivity to the partition within this dataset, not performance in an independent region. Across these partitions, held-out Brier scores ranged from 0.0862 to 0.0885 and calibration slopes from 0.847 to 0.935 for mild-inclusive occurrence; the corresponding ranges were 0.1723–0.1741 and 0.908–0.955 for moderate-or-stronger occurrence. Calibration was estimated from predictions for held-out groups, not fitted-sample probabilities. The limited variation in AUC and Brier score suggests that discrimination and probability error were not strongly dependent on a particular partition. Calibration slopes were below the target value of one, suggesting that predicted differences in occurrence probability were larger than supported by the held-out observations.
Of the 91 profiles per background group, 87 lower-PC1 and 64 higher-PC1 catchments contributed to the paired occurrence fits; the corresponding counts were 62 and 48 for mild-inclusive characteristics and 60 and 46 for moderate-or-stronger characteristics. All profiles were retained in the reference comparison. To assess whether the group contrasts depended on predictions for catchments without eligible observations, we recalculated the four-month comparison using only the 87 lower-PC1 and 64 higher-PC1 catchments that contributed to the paired occurrence models. The fitted models and reference conditions were unchanged. The high-minus-low contrasts were −15.68 percentage points (pointwise 95% interval −24.07 to −8.51) for mild-inclusive occurrence and −21.90 (−31.17 to −12.55) for moderate-or-stronger occurrence, compared with −16.48 and −21.09 points for all 182 catchments. Restricting the comparison changed each contrast by less than one percentage point and did not alter the conclusion that the higher-PC1 group had lower occurrence probabilities under these reference conditions.
3.4. Landscape Associations with Streamflow Drought Duration and Intensity
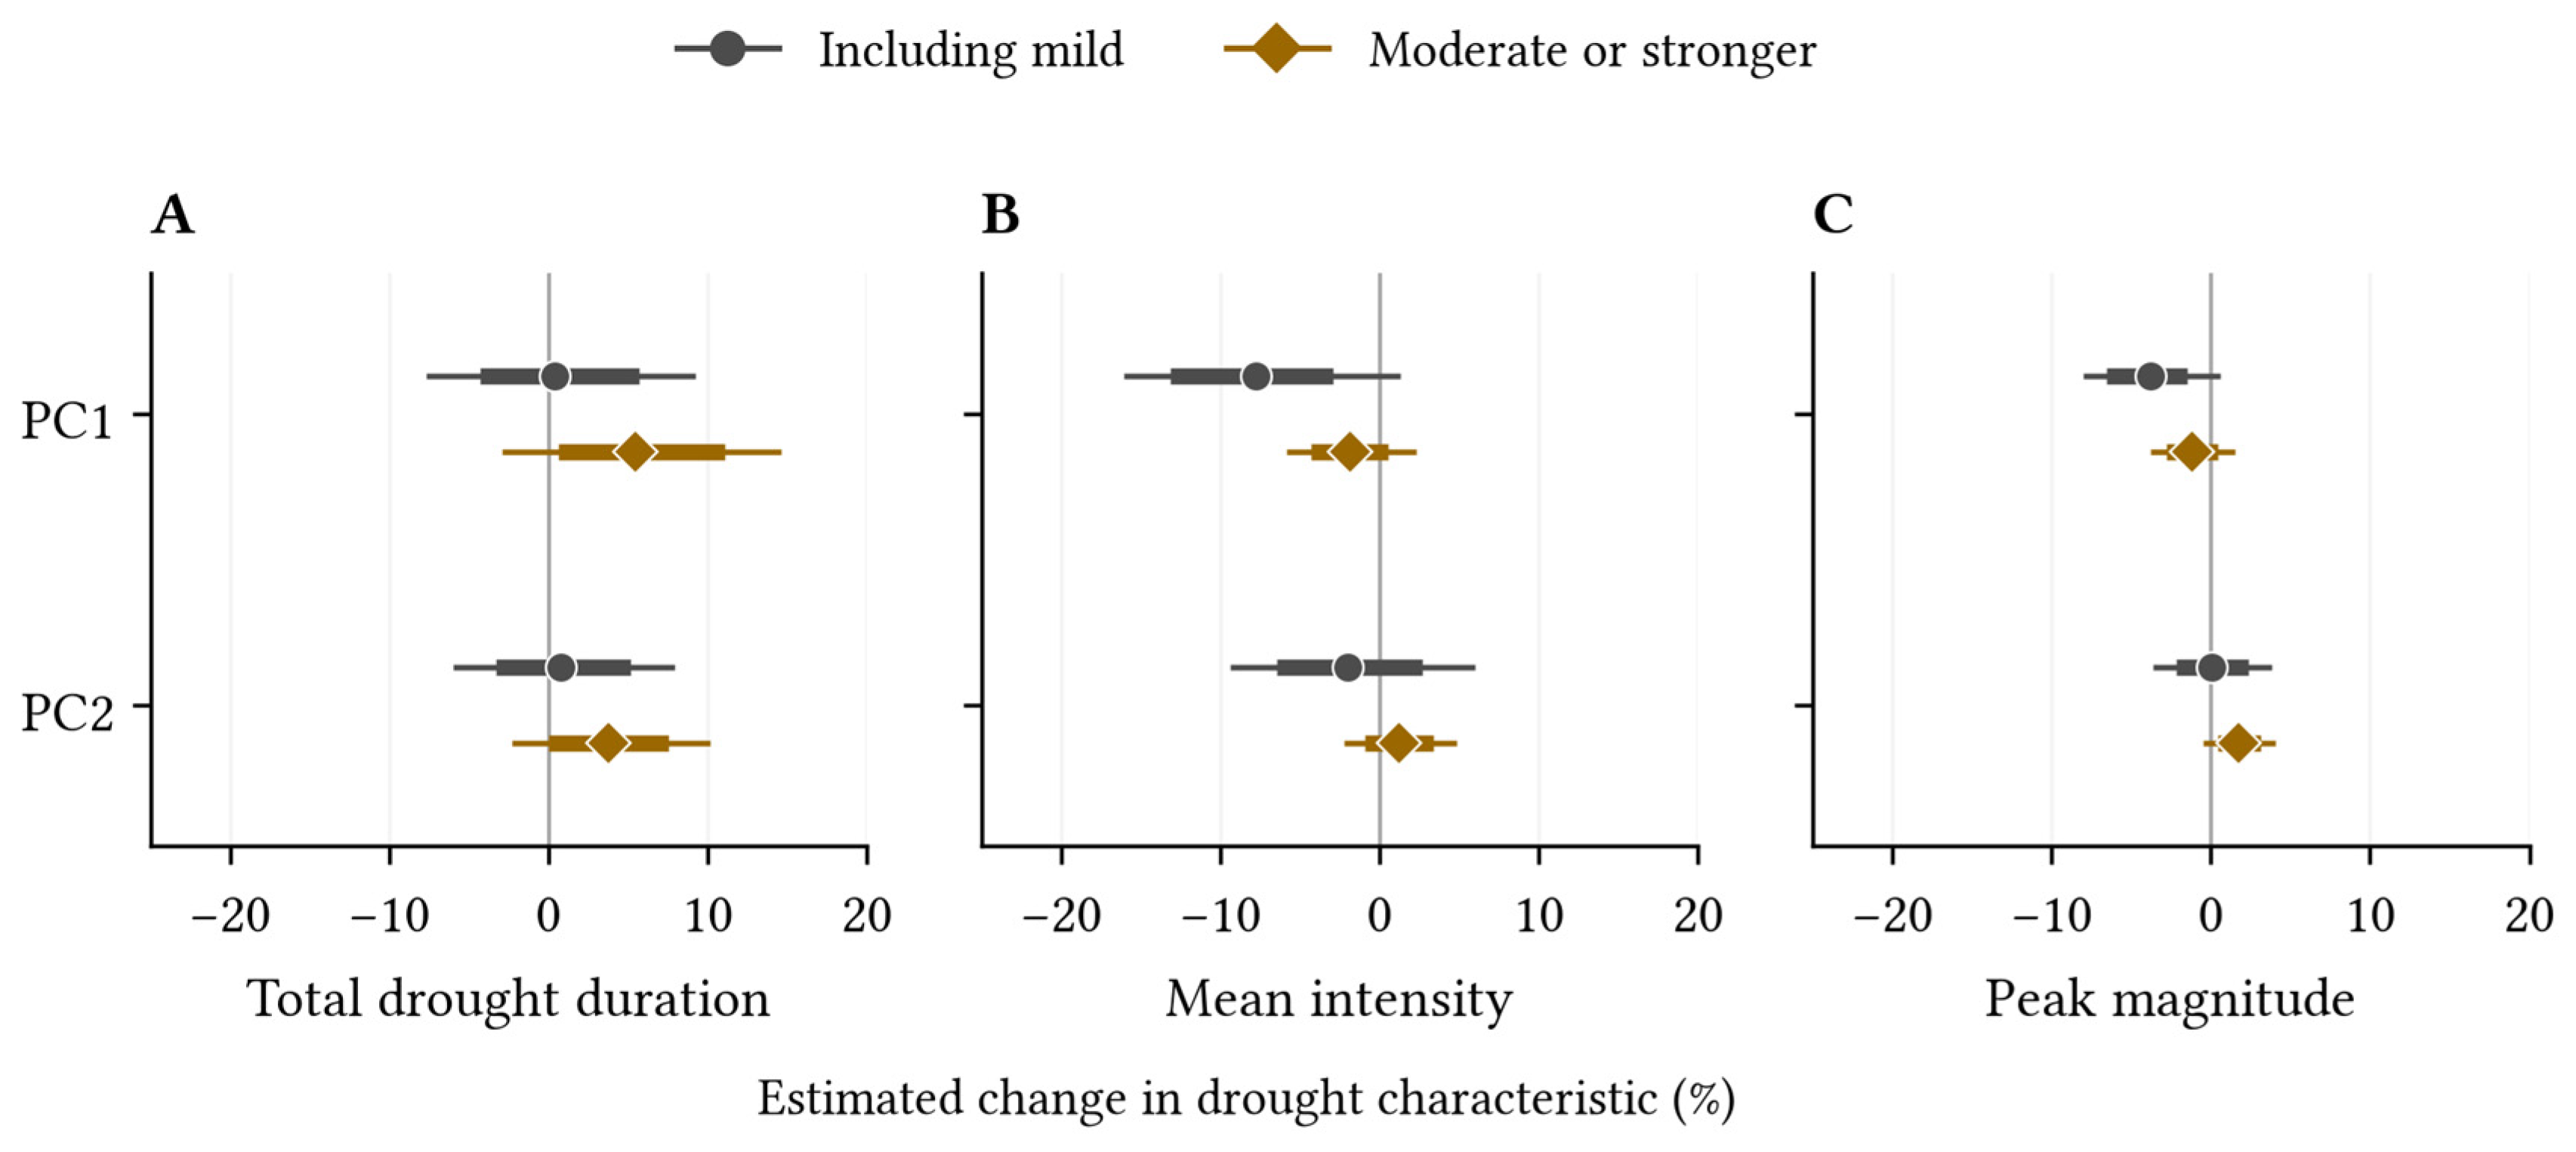
The landscape comparisons above describe streamflow drought occurrence differences between catchment groups. Figure 6 instead separates the associations of two continuous landscape coordinates, PC1 and PC2, with the characteristics of droughts that developed. Each row shows the estimated response to a one-standard-deviation increase in that coordinate, with meteorological conditions, initial streamflow and the other six coordinates held constant. PC1 and PC2 thus identify landscape directions rather than two groups of catchments.
Figure 6.
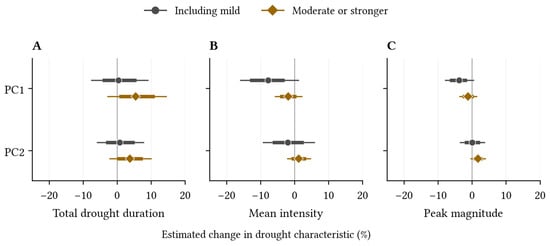
Conditional PC1 and PC2 associations with drought duration (A), mean intensity (B) and peak magnitude (C). Points show the estimated percentage change per one-standard-deviation increase in PC1 or PC2; negative values indicate fewer drought months or weaker intensity. Circles denote mild-inclusive responses, and diamonds moderate-or-stronger responses. Thick bars show pointwise 95% intervals; thin bars show 95% intervals adjusted for jointly examining all 42 PC coefficients in the six characteristic models.
Among the 1655 complete mild-inclusive responses, higher PC1 corresponded to lower estimated mean and peak intensity (Figure 6B,C). A one-standard-deviation increase corresponded to a 7.8% lower conditional geometric mean of mean intensity (simultaneous 95% interval −16.1% to 1.3% change) and a 3.8% lower peak magnitude (−8.0% to 0.6%). Although their pointwise intervals excluded zero, the simultaneous intervals did not. These estimates suggest weaker intensity toward higher PC1 but do not provide the same adjusted statistical support as the occurrence associations.
Neither PC1 nor PC2 clearly distinguished drought duration (Figure 6A). The estimated change per standard deviation was 0.4% for PC1 (simultaneous 95% interval −7.7% to 9.2%) and 0.7% for PC2 (−6.0% to 8.0%). PC2 also had uncertain mean- and peak-intensity associations. Its interpretable terrain and subsurface background therefore did not establish a corresponding ordering of combined drought duration in this sample. A later meteorological drought began during a linked dry period in 154 of the 1655 complete responses. Excluding these responses left 1501 mild-inclusive and 1055 moderate-or-stronger responses. In the mild-inclusive sample, the log-duration coefficients changed from 0.004 to −0.023 for PC1 and from 0.007 to 0.002 for PC2. In the moderate-or-stronger sample, they changed from 0.053 to 0.022 and from 0.037 to 0.033, respectively. Thus, PC1 estimates shifted downward, whereas PC2 estimates changed little. All four estimates after exclusion had pointwise 95% intervals including zero. These changes did not alter the main conclusion that neither coordinate showed a clear association with total drought duration.
Among the 1204 complete moderate-or-stronger responses, simultaneous intervals for PC1 and PC2 included zero for all three characteristics. Paired comparisons likewise did not clearly distinguish their coefficients from those in the mild-inclusive sample after simultaneous adjustment. Comparing the complete landscape profiles rather than individual coordinates gave a different view. The high-PC1 group had lower fitted mean and peak intensity among mild-inclusive responses, but no clear drought duration difference. Among moderate-or-stronger responses, the fitted high-minus-low total-duration contrast was 0.61 months (pointwise 95% interval 0.11–1.20); the mean-intensity contrast was uncertain. This group contrast retains all seven coordinates and cannot be attributed to PC1 alone. It also concerns the selected responses that reached moderate severity, not all meteorological droughts.
3.5. Composite and Single-Attribute Associations with Drought Occurrence
Forest cover and drainage density helped characterize the landscape groups but alone captured little of their occurrence-probability separation. In the analysis of all 2667 meteorological drought events with a known mild-inclusive streamflow drought outcome, the seven-PC model gave a high-minus-low contrast of −12.62 percentage points across the same 182 catchment profiles at the four-month reference. PC1 alone retained a similar contrast (−12.89 points), whereas forest cover alone gave −0.34 points and drainage density alone −1.47 points.
Paired comparisons confirmed that these two single-attribute descriptions yielded smaller contrasts than the seven-PC description. The seven-PC minus forest-only contrast difference was −12.28 points (pointwise 95% interval −19.90 to −5.26), and the corresponding drainage-density difference was −11.14 (−18.69 to −4.55). By contrast, PC1 alone and the seven-PC representation were not clearly different. The landscape attributes therefore helped identify what the groups looked like without reproducing the response contrast captured by the satellite coordinate.
The single-attribute comparisons ask whether the occurrence-probability difference between the lower- and upper-PC1 groups can also be represented by forest cover or drainage density alone. Neither single-attribute model reproduced the contrast estimated with the satellite descriptors. Several conventional attributes used together might also reproduce this probability difference, but that possibility was not tested here. Because the two catchment groups were defined by PC1, the comparison describes how their estimated drought probabilities differ; it does not show that AlphaEarth predicts drought more accurately than conventional attributes.
4. Discussion
4.1. Multiple Dimensions of Catchment Drought Susceptibility
The landscape association was clearest for streamflow drought occurrence, rather than for the drought duration and intensity of the combined response. PC1 distinguished occurrence under both severity definitions, whereas its intensity associations remained less conclusive after simultaneous adjustment; neither PC1 nor PC2 clearly ordered drought duration. Recent studies provide further context for these landscape associations. Teutschbein et al. [6] found that drought propagation across Swedish catchments reflected a combination of catchment characteristics, hydroclimatic conditions and soil properties. Xiong et al. [7] reported less attenuation of event severity and intensity in catchments with greater precipitation seasonality, higher snowfall fractions, steeper slopes or greater soil water-holding capacity. These findings suggest that several aspects of catchment background need to be considered together. Our analysis complements these studies by relating a common satellite-derived landscape description to both drought occurrence and the characteristics of the responses that develop. The clearer association with occurrence shows why a lower probability of drought cannot, by itself, be taken to mean that droughts will also be weaker or shorter. This complements evidence that climate and storage relate differently to drought characteristics [2,4,5,19]. Our combined response includes all dry periods linked to one meteorological event, unlike analyses of single continuous droughts. Differences in indices, climate and event definitions preclude direct comparison of effect magnitudes across these studies.
Differences in occurrence did not establish equally clear landscape associations with drought duration or intensity. The estimated occurrence-probability gap was larger for moderate-or-stronger drought. Among complete combined responses, some intensity estimates and full-profile contrasts were supported by pointwise intervals, while the PC1 and PC2 characteristic associations remained uncertain under simultaneous adjustment. These results support the occurrence finding without establishing a general ranking of catchments by all drought characteristics.
Additionally, reference-period choice can also affect drought identification. SPEI uses 1981–2016 as a common meteorological baseline, whereas SSI uses the longer available discharge record to retain sufficient seasonal reference observations in catchments with shorter or interrupted records. This improves coverage but means that the two indices describe anomalies relative to different periods. Recalculating SSI against 1981–2016 yielded 1037 events with known occurrence outcomes at both severity thresholds. Using all these events, the PC1 coefficients were −0.417 for mild-inclusive occurrence and −0.356 for moderate-or-stronger occurrence, compared with −0.617 and −0.420 in the primary analysis. Both retained the negative direction, supporting directional consistency under a common reference period.
4.2. Hydrological Relevance of Satellite-Derived Landscape Representation
The shared landscape description distinguished streamflow drought occurrence across catchments under comparable event conditions. Conventional attributes made the coordinate space partly interpretable: PC1 quartiles differed in forest cover and drainage density, while PC2 was associated with slope and depth to bedrock. These landscape meanings and their hydrological associations are separate findings. In particular, a clear terrain interpretation of PC2 did not imply a clear relation to drought duration. The contribution lies in testing specific drought responses within a common, response-independent description rather than assuming that landscape similarity implies similarity in every response.
Inconsistent choices and aggregation of conventional descriptors can hinder comparisons of hydrologically meaningful similarity [8]. Satellite representations offer a common basis for catchment description and rainfall–runoff modeling [10,11]. Here, the same satellite variables, spatial aggregation and coordinate construction described every catchment without using its drought responses. Conventional attributes helped relate these coordinates to observable landscape properties. Neither forest cover nor drainage density alone reproduced the occurrence contrast between the PC1-defined groups, showing that this contrast cannot be reduced to either of these individual descriptors. This comparison does not establish superiority over conventional attributes used jointly. The main contribution is a consistent composite description that connects catchment differences to drought occurrence under comparable event conditions.
The satellite averages describe landscape conditions during 2017–2024, whereas the event inventory spans 1980–2024. Changes in vegetation and land use can therefore weaken the correspondence between the descriptors and earlier events. We also analyzed drought events during 2017–2024. The PC1 occurrence coefficients remained negative under both severity definitions, consistent with the full-record results, but their magnitudes were smaller and their confidence intervals wider. This consistency supports the robustness of the association’s direction across the two study periods, although the recent-period estimates are less precise.
4.3. Geographic Interpretation and Scope of Drought Susceptibility
Figure 2D locates the landscape backgrounds underlying the conditional occurrence comparisons. Higher-PC1 locations lie toward the direction associated with lower occurrence probability. Figure 4 supplies observable landscape context through differences in forest cover, drainage density, slope and depth to bedrock. These maps describe background variation, not calibrated geographical risk classes. The same map does not establish which catchments will experience more drought months once a response develops. Drought duration associations for both displayed coordinates were uncertain, and the larger moderate-response duration in one complete-profile comparison cannot be reduced to a PC1 or PC2 direction. Geographic interpretation should therefore distinguish the supported occurrence association from the less resolved characteristic associations.
The findings apply to comparatively least-disturbed catchments in the conterminous United States. The estimated drought-response relationships may not hold in regions with different climates, landscapes or human influences. Nevertheless, the approach offers a common basis for describing catchments elsewhere: AlphaEarth descriptors can be aggregated and used to construct landscape coordinates without drought-response information. Regional studies can then examine how these coordinates relate to local landscape properties and drought responses, rather than assume that the present coefficients or coordinate interpretations transfer unchanged. Reservoir operations, irrigation withdrawals, groundwater abstraction and urbanization can alter drought propagation in ways not represented by this reference-catchment sample.
Landscape associations do not identify the physical processes responsible for them. Slope, permeability and bedrock depth help describe terrain and subsurface conditions but do not directly measure water storage, infiltration or groundwater exchange. Distinguishing these mechanisms requires observations of soil moisture, groundwater levels, evapotranspiration and storage changes, which are not available consistently across the study catchments. Future work could combine such observations with process-based hydrological models to examine how landscape properties modify responses to different meteorological droughts. Additionally, logistic regression provides a transparent model for interpreting occurrence associations, but its specified log-odds relationship may miss more complex landscape responses. Future work could consider flexible nonlinear models, such as generalized additive models, or machine-learning approaches such as random forests and gradient boosting, to examine nonlinearities and interactions not represented here.
5. Conclusions
Satellite-derived catchment backgrounds distinguished whether meteorological drought was followed by streamflow drought. Under comparable meteorological and initial streamflow conditions, higher-PC1 backgrounds had lower occurrence probabilities for both mild-inclusive and moderate-or-stronger responses. However, catchments with lower occurrence probabilities did not consistently experience shorter or less intense droughts once a response developed. Higher PC1 tended to be associated with lower intensity, but the evidence for intensity and duration relationships was less conclusive than for occurrence.
Together, these results provide a basis for assessing how the consequences of similar meteorological droughts differ across catchments. Rather than reducing susceptibility to a single ordering from resistant to vulnerable, the common description supports separate comparisons of drought occurrence, intensity and duration. This distinction can help orient monitoring toward both the likelihood of drought onset and the severity and duration of droughts once established. In particular, a lower likelihood of onset should not be taken as assurance of a shorter or less intense drought if one develops. Within the conditions represented by this study, satellite-derived landscape information therefore connects geographic heterogeneity to specific dimensions of streamflow drought, providing an empirical basis for more differentiated catchment assessment.
Author Contributions
Conceptualization, M.X. and D.K.; Methodology, M.X.; Writing—Original Draft Preparation, M.X.; Writing—Review and Editing, M.X. and D.K. All authors have read and agreed to the published version of the manuscript.
Funding
This work was supported by the National Natural Science Foundation of China (42477067, 42571041) and Guangdong Basic and Applied Basic Research Foundation (2023B1515040028).
Data Availability Statement
The CAMELSH and AlphaEarth datasets used in this manuscript are publicly available. The CAMELSH data are available as Zenodo repositories (https://doi.org/10.5281/zenodo.15066778) and AlphaEarth annual satellite embeddings are available through the Google Earth Engine Data Catalog. The analytical code is available from the corresponding author upon request.
Acknowledgments
The authors acknowledge financial support from the National Natural Science Foundation of China.
Conflicts of Interest
The authors declare no conflicts of interest.
References
- Van Loon, A.F. Hydrological Drought Explained. WIREs Water 2015, 2, 359–392. [Google Scholar] [CrossRef] [Scilit]
- Van Loon, A.F.; Laaha, G. Hydrological Drought Severity Explained by Climate and Catchment Characteristics. J. Hydrol. 2015, 526, 3–14. [Google Scholar] [CrossRef] [Scilit]
- Bruno, G.; Avanzi, F.; Gabellani, S.; Ferraris, L.; Brunner, M.I. Short to Long Streamflow Droughts: A Process-Oriented Review. WIREs Water 2026, 13, e70060. [Google Scholar] [CrossRef] [Scilit]
- Aryal, S.K.; Zheng, H.; Zhang, Y.; Faiz, M.A. Drought Propagation and Recovery Behaviors Across 407 Australian Catchments. Earth’s Future 2024, 12, e2023EF004190. [Google Scholar] [CrossRef] [Scilit]
- Apurv, T.; Cai, X. Drought Propagation in Contiguous U.S. Watersheds: A Process-Based Understanding of the Role of Climate and Watershed Properties. Water Resour. Res. 2020, 56, e2020WR027755. [Google Scholar] [CrossRef] [Scilit]
- Teutschbein, C.; Grabs, T.; Giese, M.; Todorović, A.; Barthel, R. Drought Propagation in High-Latitude Catchments: Insights from a 60-Year Analysis Using Standardized Indices. Nat. Hazards Earth Syst. Sci. 2025, 25, 2541–2564. [Google Scholar] [CrossRef] [Scilit]
- Xiong, H.; Han, J.; Yang, Y. Propagation from Meteorological to Hydrological Drought: Characteristics and Influencing Factors. Water Resour. Res. 2025, 61, e2024WR037765. [Google Scholar] [CrossRef] [Scilit]
- Tarasova, L.; Gnann, S.J.; Yang, S.; Hartmann, A.; Wagener, T. Catchment Characterization: Current Descriptors, Knowledge Gaps and Future Opportunities. Earth-Sci. Rev. 2024, 252, 104739. [Google Scholar] [CrossRef] [Scilit]
- Brown, C.F.; Kazmierski, M.R.; Pasquarella, V.J.; Rucklidge, W.J.; Samsikova, M.; Zhang, C.; Shelhamer, E.; Lahera, E.; Wiles, O.; Ilyushchenko, S.; et al. AlphaEarth Foundations: An Embedding Field Model for Accurate and Efficient Global Mapping from Sparse Label Data. arXiv 2025. [Google Scholar] [CrossRef] [Scilit]
- Ou, Z.; Zheng, Y. Foundation-Scale Satellite Embeddings Reframe Hydrological Generalization as a Representation Problem. Geophys. Res. Lett. 2026, 53, e2025GL121604. [Google Scholar] [CrossRef] [Scilit]
- Liu, J.; Shen, C.; Yang, Y.; Ji, H.; Lawson, K.; Kraabel, N. Geospatial Foundation Embeddings as Transferable Catchment Descriptors. Geophys. Res. Lett. 2026, 53, e2026GL122814. [Google Scholar] [CrossRef] [Scilit]
- Falcone, J.A. GAGES-II: Geospatial Attributes of Gages for Evaluating Streamflow; U.S. Geological Survey: Reston, VA, USA, 2011. [Google Scholar] [CrossRef] [Scilit]
- Tran, V.N.; Xu, D.; Nguyen, V.T.; Kim, T.H.; Ivanov, V.Y. CAMELSH: A Large-Sample Hourly Hydrometeorological Dataset and Attributes at Watershed-Scale for CONUS. Sci. Data 2025, 12, 1307. [Google Scholar] [CrossRef] [Scilit] [PubMed]
- Vicente-Serrano, S.M.; Beguería, S.; López-Moreno, J.I. A Multiscalar Drought Index Sensitive to Global Warming: The Standardized Precipitation Evapotranspiration Index. J. Clim. 2010, 23, 1696–1718. [Google Scholar] [CrossRef] [Scilit]
- Vicente-Serrano, S.M.; López-Moreno, J.I.; Beguería, S.; Lorenzo-Lacruz, J.; Azorin-Molina, C.; Morán-Tejeda, E. Accurate Computation of a Streamflow Drought Index. J. Hydrol. Eng. 2012, 17, 318–332. [Google Scholar] [CrossRef] [Scilit]
- Baez-Villanueva, O.M.; Zambrano-Bigiarini, M.; Miralles, D.G.; Beck, H.E.; Siegmund, J.F.; Alvarez-Garreton, C.; Verbist, K.; Garreaud, R.; Boisier, J.P.; Galleguillos, M. On the Timescale of Drought Indices for Monitoring Streamflow Drought Considering Catchment Hydrological Regimes. Hydrol. Earth Syst. Sci. 2024, 28, 1415–1439. [Google Scholar] [CrossRef] [Scilit]
- Lema, F.; Mendoza, P.A.; Vásquez, N.A.; Mizukami, N.; Zambrano-Bigiarini, M.; Vargas, X. Technical Note: What Does the Standardized Streamflow Index Actually Reflect? Insights and Implications for Hydrological Drought Analysis. Hydrol. Earth Syst. Sci. 2025, 29, 1981–2002. [Google Scholar] [CrossRef] [Scilit]
- Tijdeman, E.; Stahl, K.; Tallaksen, L.M. Drought Characteristics Derived Based on the Standardized Streamflow Index: A Large Sample Comparison for Parametric and Nonparametric Methods. Water Resour. Res. 2020, 56, e2019WR026315. [Google Scholar] [CrossRef] [Scilit]
- Tijdeman, E.; Bachmair, S.; Stahl, K. Controls on Hydrologic Drought Duration in Near-Natural Streamflow in Europe and the USA. Hydrol. Earth Syst. Sci. 2016, 20, 4043–4059. [Google Scholar] [CrossRef] [Scilit]
Disclaimer/Publisher’s Note: The statements, opinions and data contained in all publications are solely those of the individual author(s) and contributor(s) and not of MDPI and/or the editor(s). MDPI and/or the editor(s) disclaim responsibility for any injury to people or property resulting from any ideas, methods, instructions or products referred to in the content. |
© 2026 by the authors. Licensee MDPI, Basel, Switzerland. This article is an open access article distributed under the terms and conditions of the Creative Commons Attribution (CC BY) license.