


Highlights
What are the main findings?
- When the instrument’s intrinsic angular resolution cannot be changed, scanning observations combined with Lucy–Richardson deconvolution yield a more finely sampled reconstruction of the solar wind H-ENA angular distribution.
- Solar wind H-ENAs have an overall angular distribution comparable to that of upstream solar wind protons, while their broader angular width is consistent with charge exchange induced scattering.
What are the implications of the main findings?
- The results provide the first direct measurement of the angular distribution of solar wind H-ENAs at Mars.
- The proposed method exploits the brief observation intervals available during spacecraft attitude adjustments to obtain finely sampled ENA remote-sensing measurements and provides a new strategy for future planetary ENA observations.
Abstract
Energetic neutral atoms (ENAs) are generated by charge exchange process during collisions between energetic ions and neutral particles. Due to their electrical neutrality, ENAs are unaffected by electromagnetic fields and can travel along ballistic trajectories. Compared with in situ ion measurements, ENA observations enable large-scale remote imaging and provide an important means of understanding the interactions between solar wind plasma and planets. However, their angular resolution and field of view are generally very limited, which severely restricts research based on ENA observations. In this study, we propose a scanning observation and data-processing method that provides finer angular sampling of ENA measurements during spacecraft maneuvering and use it to investigate the angular distribution of H-ENAs. Using hydrogen ENA (H-ENA) data from the Mars Ion and Neutral Particle Analyzer (MINPA) aboard China’s Tianwen-1 spacecraft, we obtained an angular sampling interval of approximately during scanning, compared with the instrument’s intrinsic polar angular response width of . The results show that the H-ENA population exhibits a velocity of km/s and a temperature of eV, whereas the upstream solar wind have a velocity of km/s and a temperature of eV. The angular distribution of H-ENAs is highly consistent with that of the upstream solar wind . These observations are consistent with solar wind as an important source of H-ENAs at Mars and with charge exchange as the production process. This study obtained a finely sampled angular distribution of solar wind H-ENAs and provides a method for future planetary ENA observations.
1. Introduction
Interactions between the solar wind and planets are central to understanding how planetary space environments evolve. Mars, a typical atmospheric planet lacking a global intrinsic magnetic field, has therefore become a major focus of planetary space physics. Observations of hydrogen energetic neutral atoms (H-ENAs) in the near-Mars environment provide a unique window into these interactions. These neutral atoms are primarily produced through charge exchange between energetic solar wind protons and neutral particles in the Martian atmosphere. As they are unaffected by electromagnetic fields, ENAs propagate ballistically with the speeds of their parent particles. Consequently, ENA imaging serves as a powerful remote sensing tool for diagnosing global plasma properties and energy transfer processes in environments.
The significance of ENA measurements has been established through several key missions. Early studies of Earth’s aurora [1] and subsequent missions such as IMAGE [2,3] and IBEX [4,5,6] have demonstrated the effectiveness of ENA imaging for global diagnostics of magnetospheric and heliospheric plasmas. Notably, IBEX mapped the global ENA distribution in the inner heliosheath [7,8] and detected interstellar hydrogen, helium, and oxygen [9]. Fuselier et al. [10] and Petrinec et al. [11] further provided ENA images of the Earth’s magnetosheath and subsolar magnetosphere. Remote sensing observations of these neutral atoms provide information on the composition, energy, spatial distribution, and flux of the source plasma in the region of interest. Compared with in situ plasma measurements, ENA observations substantially improve observational efficiency and enable simultaneous measurements over large spatial scales.
Unlike Earth, unmagnetized planets lack a global intrinsic magnetic field, which causes its exosphere to extend higher than the bow shock and makes its atmosphere more vulnerable to erosion by the solar wind. As a result, its interactions with solar wind plasma become more direct [12,13]. The Neutral Particle Imager (NPI) and Neutral Particle Detector (NPD) on Mars Express (MEX) provided the first direct observations of ENAs at Mars [14], including nightside ENAs, scattered ENAs, ENA jets, and magnetosheath ENAs [15,16,17]. However, sunward ENA observations are strongly contaminated by solar UV radiation, which remains a major obstacle to the direct detection of solar wind H-ENAs. MAVEN measurements revealed that some solar wind H-ENAs undergo re-ionization in the Martian atmosphere and become penetrating protons, which retain the same energy as their parent solar wind ions [18]. In addition, observations of proton aurora at Mars provide further indirect evidence for the existence of solar wind H-ENAs [19].
Tianwen-1, China’s first independent Mars exploration mission [20], carries the Mars Ion and Neutral Particle Analyzer (MINPA), which alternately measures ions and ENAs to investigate the spatial distribution and transport mechanisms of particles in the Martian environment. The first MINPA ion observations were reported by Zhang et al. [21], with solar wind data compared to OMNI observations. Ma [22] presented the first ENA measurements from MINPA, and Zhang [23] used ENA data to reconstruct upstream solar wind parameters and to develop a solar wind H-ENA simulation model. These studies provided direct observational confirmation of the existence of solar wind H-ENAs. They are produced primarily through charge exchange collisions between energetic in the upstream solar wind and neutral H atoms in the Martian hydrogen corona. Consequently, their energy, propagation direction and temperature resemble those of the parent population. To mitigate UV interference, the MINPA sensor uses coated entry paths for both ions and ENAs, achieving a UV suppression efficiency above 98% [24]. However, during spacecraft attitude changes, UV light can still enter the electrostatic analyzer (ESA) through the ENA detection window at certain angles, resulting in elevated count rates. This UV interference has been evaluated in ion data [25].
Recent findings by Deighan et al. [19] indicate that precipitating solar wind H-ENAs can trigger proton auroras in the Martian atmosphere, representing a novel pathway for the direct transfer of solar wind energy and mass into the atmosphere. Characterizing the distribution and transport of ENAs is therefore essential for understanding the coupling between the solar wind and Mars, as well as the planet’s atmospheric evolution. However, fine-scale measurements of solar wind H-ENAs have not yet been achieved, and no direct measurements of their angular distribution have been reported. Swaczyna et al. [26] studied H+-H charge exchange scattering and found that for relative energies above 100 eV, the resulting scattering angle is typically less than , suggesting that solar wind H-ENAs should closely match the directional characteristics of their parent solar wind ions, with only slight angular broadening.
Despite this potential and beyond the numerous observational achievements made, current ENA observations remain constrained by significant technical limitations. Compared with ion measurements, they generally have poorer angular resolution and a narrower field of view (FOV). The NPD of ASPERA-3 onboard Mars Express provides an angular resolution of , while MINPA on Tianwen-1 offers [14,24]. Compared with the angular resolution of ion measurements by SWIA onboard MAVEN ( in the sunward direction), ENA instruments generally provide only comparatively coarse angular resolution, which hinders the detailed characterization of ENA angular distributions. Advancing research on high-angular-resolution instruments or high-angular-resolution reconstruction algorithms is therefore important. To address these limitations, this study proposes a scanning observation strategy that uses spacecraft attitude adjustments to obtain finer angular sampling and expand the FOV. Rather than changing the fixed intrinsic angular response of individual detector units, this method combines measurements acquired at successive spacecraft attitudes to reconstruct the ENA angular distribution with a finer sampling interval.
In this study, we analyse solar wind H-ENA observations from MINPA aboard Tianwen-1 using a scanning strategy during spacecraft attitude adjustments. The analysis accounts for UV induced counts and the magnetosheath H-ENA contribution. We reconstruct the angular distribution of solar wind H-ENAs and estimate the angular broadening associated with charge exchange. The reconstructed distribution is compared with simultaneous upstream solar wind observations. The agreement between the H-ENA and upstream solar wind angular distributions indicates that solar wind protons are one of the major sources of H-ENAs at Mars. The scanning strategy improves the ability to resolve the H-ENA angular distribution and may support future planetary ENA studies.
2. Principle and Methodology
When observing solar wind ions during a spacecraft attitude maneuver, sufficiently stable plasma conditions allow temporal resolution to be traded for finer angular sampling. Measurements acquired throughout the maneuver can then be combined to provide continuous angular coverage and reconstruct the ion angular distribution with a finer sampling interval. The following section describes the principle by which this scanning approach provides finer angular sampling and reconstructs a more detailed angular distribution without altering the intrinsic angular response of the instrument.
Many charged particle instruments directly measure count rates, which can be expressed as a convolution of the response function of the instrument and the differential fluxes of charged particles, as follows [27]:
where is the count rate (/s) in the measured time interval, energy range, and solid angle; is the integral instrument response function, representing the probability that a particle deposits energy within the energy interval to , polar angle interval to and azimuthal angle interval to . is the differential flux of particles. The deposited energy at the detector is generally smaller than the incident energy. represents the full instrumental response function, describing the combined sensitivity of the detector to particles of a given energy arriving from different directions of incidence. We assume a uniform energy response of the instrument, with defined as an energy-dependent geometric factor that corrects for this response. is the direction-dependent response function, representing only the detector’s sensitivity to particles arriving from different directions. represents the convolution of the particle differential flux F with the detector response function .
The measurement data from a specific angle is essentially a weighted average over the response function’s field of view, which is a convolution process:
In the scanning procedure, there is partial overlap among the fields of view of the detector. This overlap leads to multiple angular bins making redundant contributions to the same region of the observation, causing an effective blurring or smoothing of the original signal. Given the known response function, the Lucy–Richardson deconvolution algorithm can be used to reconstruct the true angular distribution. This method is an iterative algorithm based on maximum likelihood estimation, and its iterative formulation is as follows:
denotes the point spread function (PSF), C is the observed count rate matrix, and represents the estimated true distribution at the nth iteration. This method is a nonlinear deconvolution technique based on Bayes theorem. The detector response function determines the intrinsic point-spread characteristics of the system, whereas the scanning step size determines the angular sampling density. Deconvolution uses the known response function and the overlapping measurements to reconstruct the angular distribution. Thus, reducing the scanning step size provides finer angular sampling without changing the intrinsic detector response. The effective resolving capability of the reconstruction must be evaluated independently from the sampling interval. It’s important to note that too many iterations can amplify noise, so typically 5–10 iterations are used. Therefore, rotational scanning observation can be regarded as a convolutional sampling process.
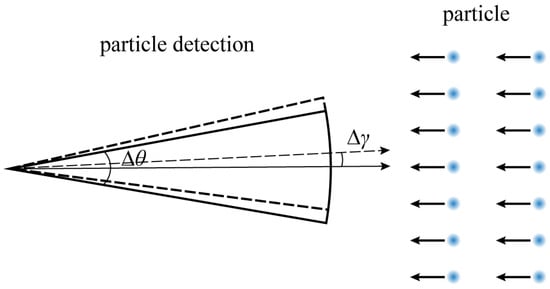
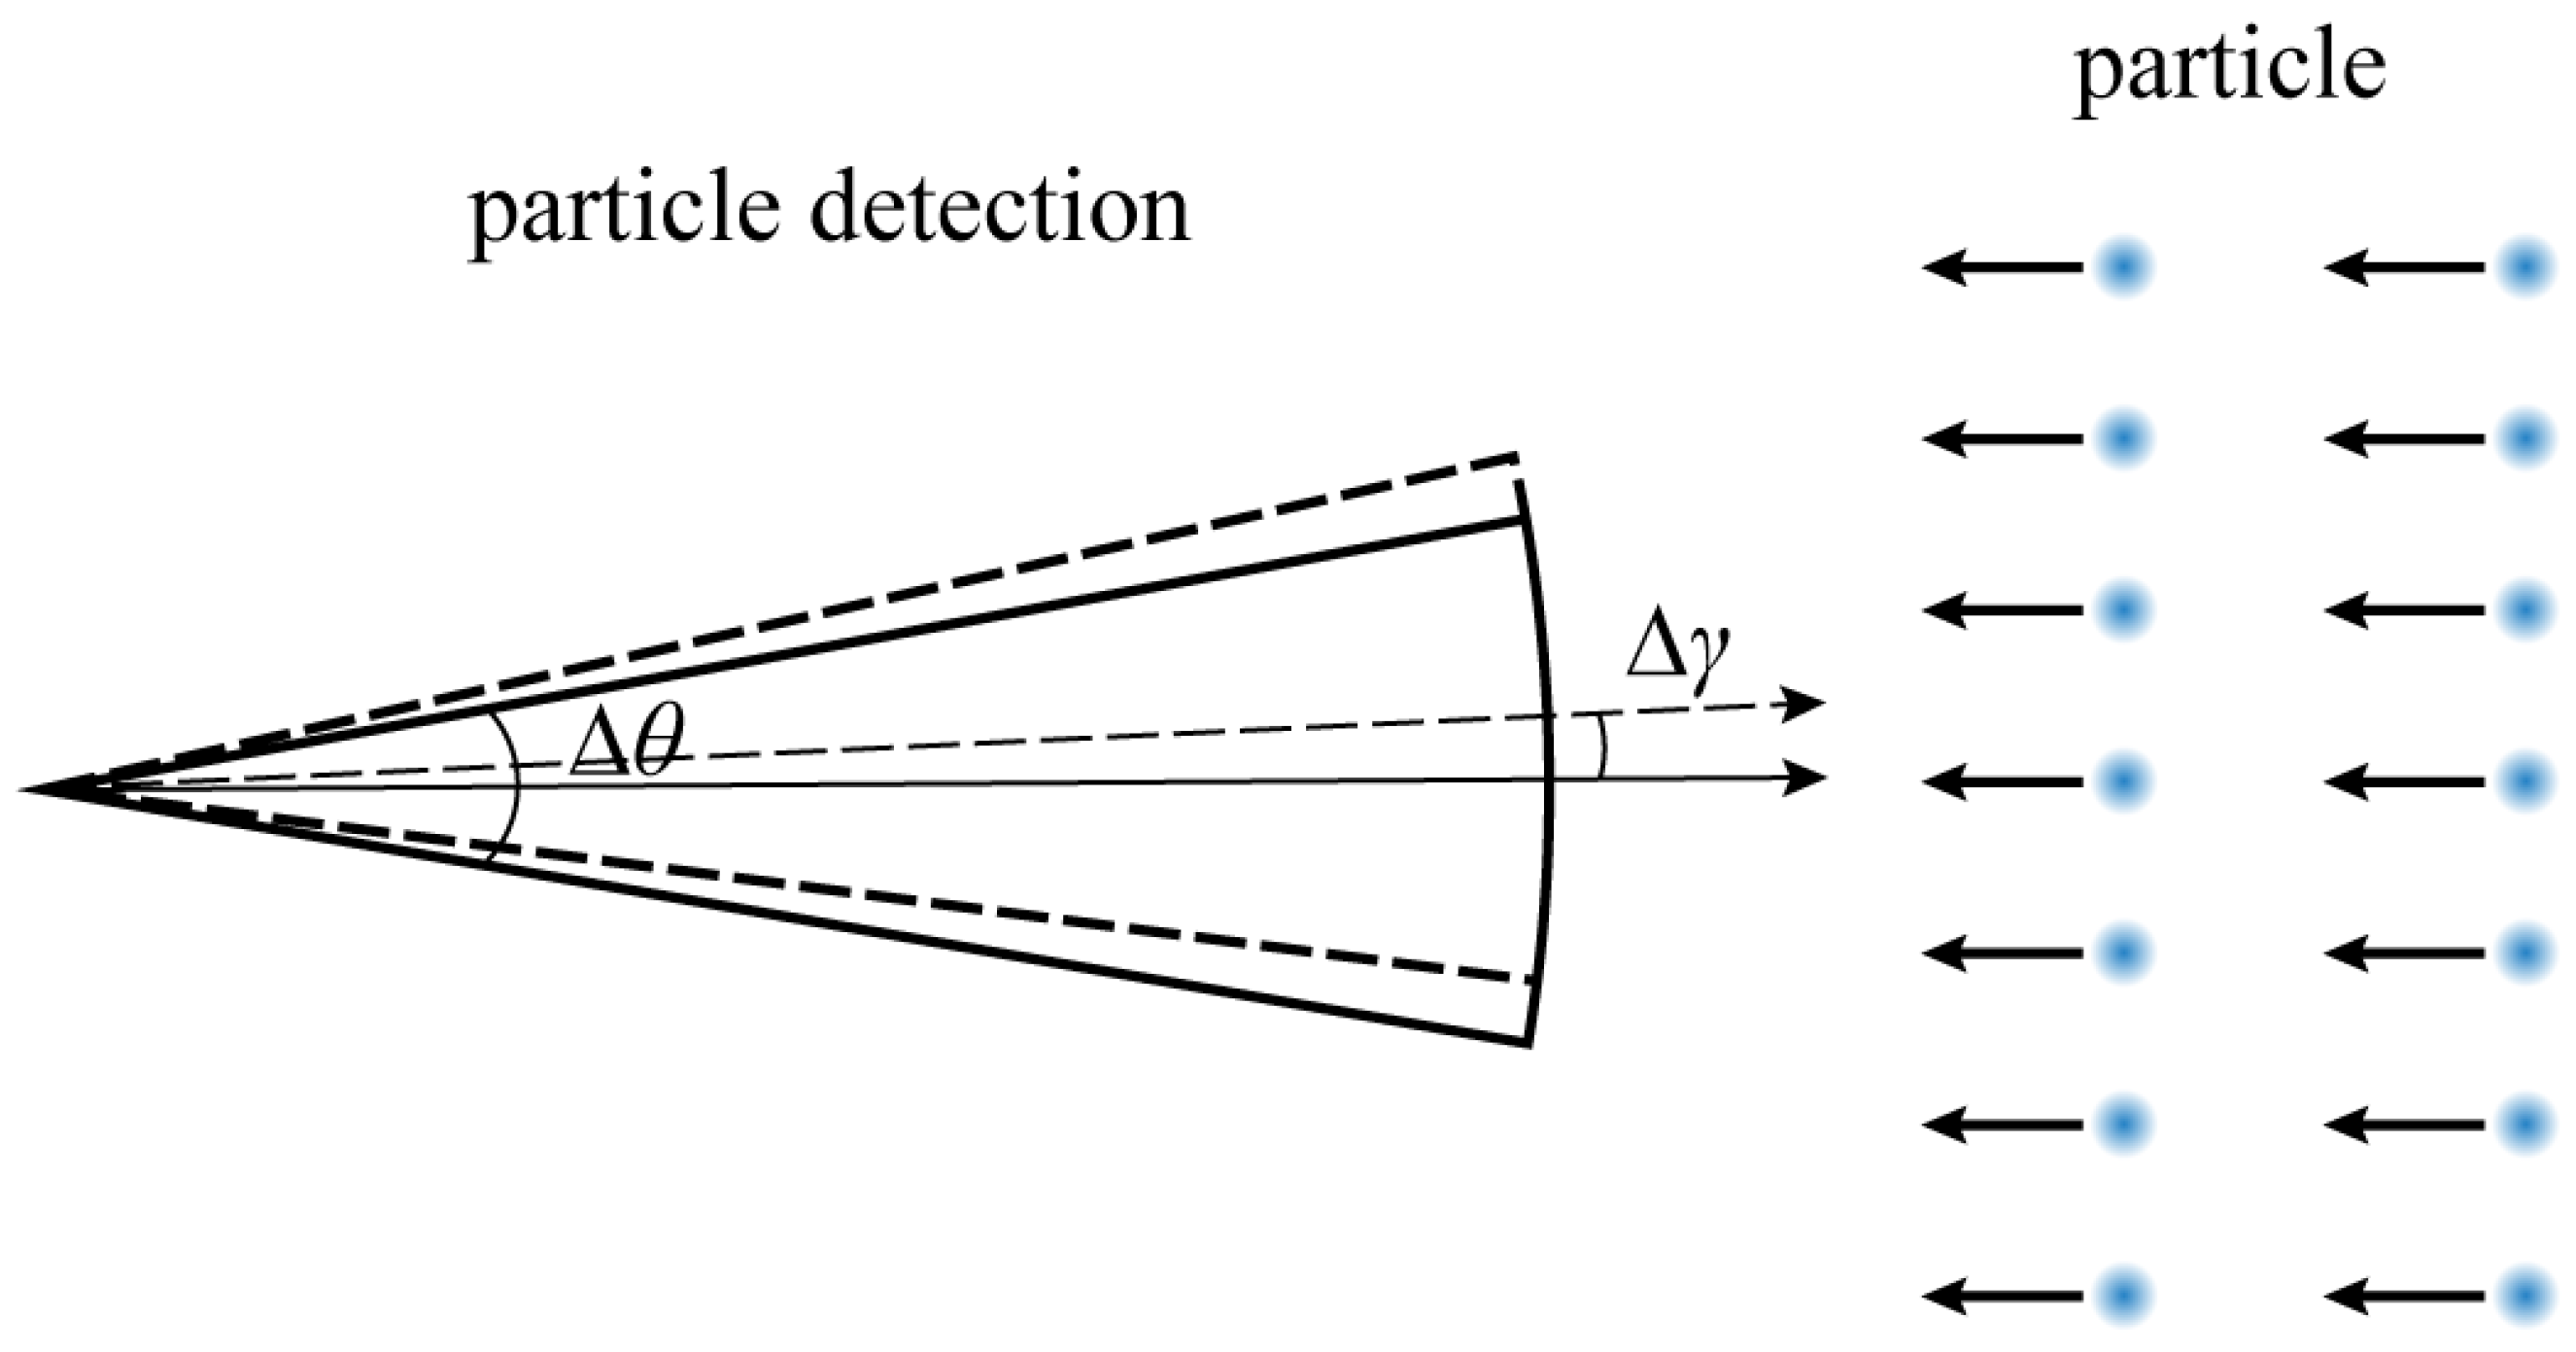
As shown in Figure 1, the detector performs angular scanning in the polar direction, with each sector having an intrinsic angular width of . The scanning step is related to the rotational speed and the integration time per individual sample:
Figure 1.
Principle of the scanning method. is the intrinsic angular response width of the detector, and is the angular sampling interval between two consecutive measurements during the continuous scan. The black solid and dashed arrows within the detector field of view indicate the central viewing directions, the blue dots represent particles, and the short black solid arrows indicate the directions of particle motion.
The is the angular velocity of the rotational scan, the is the integration time for a single observation, and the scanning step determines the sampling interval of the observed data. When the scanning step becomes sufficiently small so that the sampling bandwidth covers or exceeds the instrument’s intrinsic bandwidth, no effective information is lost during sampling. This means that deconvolution can remove part of the blurring effect, thereby yielding a more detailed angular distribution.
3. Instrumentation and Observational Dataset
The MINPA represents a highly integrated payload design that combines ion and neutral particle detection capabilities within a single instrument package. For Energetic Neutral Atom (ENA) measurements, the sensor provides a field of view (FOV) with an intrinsic angular resolution of . The ENA measurement configuration consists of 8 energy sweeping steps and 16 azimuthal sectors, operating in three primary modes: default mode (Mod1), magnetotail mode (Mod4), and ionosphere mode (Mod12), with the latter not conducting ENA observations.
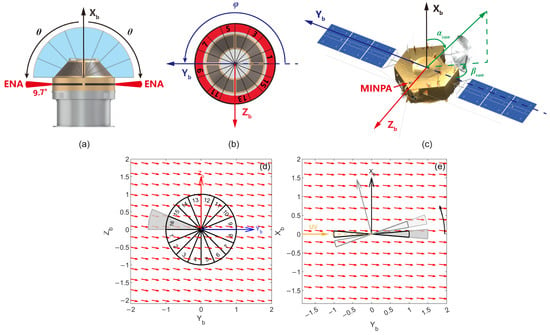
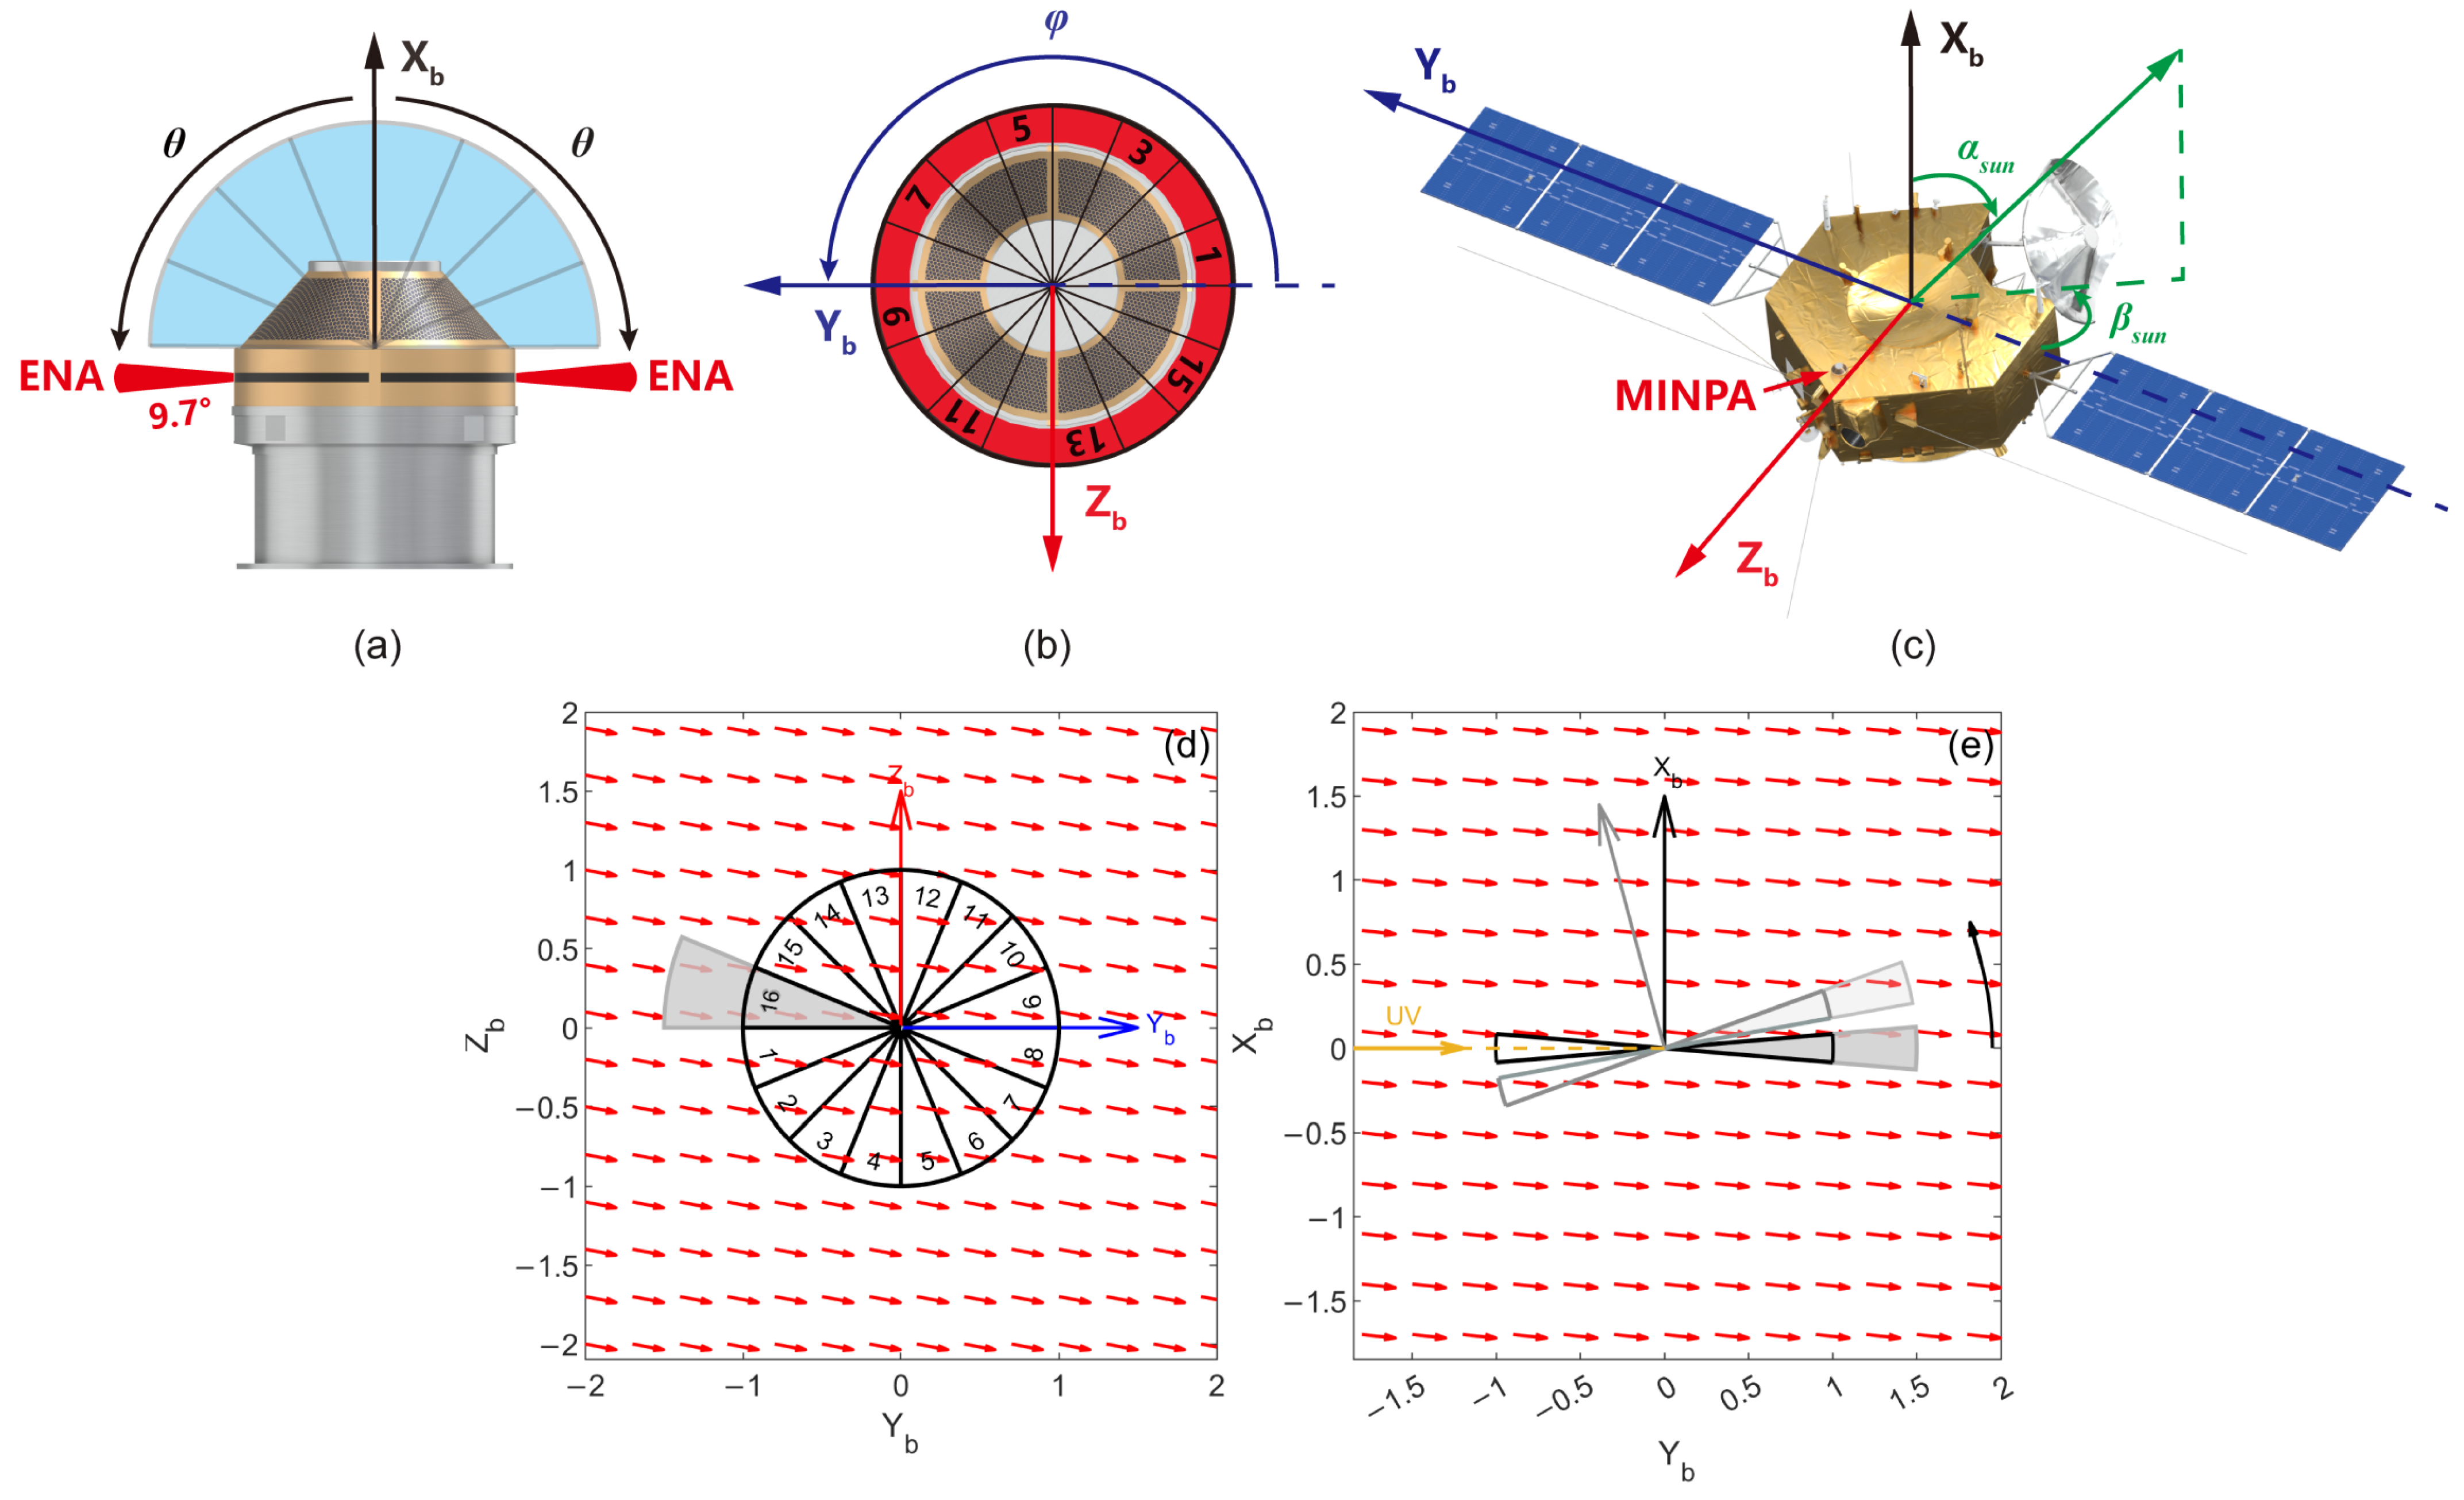
Figure 2 shows that MINPA is mounted on the spacecraft main deck in the +Xb plane. Its polar axis is aligned with +Xb, providing an unobstructed view of the +Xb hemisphere. The solar incidence angle, , is the angle between the Sun direction and the sensor +X axis and ranges from to . The solar azimuthal angle, , is measured in the instrument Y–Z plane from -Yb, with counter-clockwise rotation defined as positive. During the observation interval analyzed in this study, MINPA operated in its default ENA observation mode while the Tianwen-1 spacecraft underwent a controlled attitude adjustment maneuver. This maneuver enabled the instrument FOV to scan slowly and continuously across a range of solar incidence angles, yielding finely sampled observations of solar wind H-ENAs.
Figure 2.
(a) Front view of the instrument. It includes the detection windows for both ions and ENAs, and the pitch angle () definitions used for ion detection. (b) Vertical view of the instrument. It includes the instrument azimuthal angle () definitions and azimuthal bins. The axes used in the figure are all the axes of the satellite body coordinate system. (c) MINPA location and the definition of instrument solar incident angle () and instrument solar azimuthal angle (). (d,e) The MINPA ENA observation field of view and the solar wind direction in the satellite body coordinate system. The Xb, Yb, and Zb denote the coordinate axes of the satellite body frame, as shown in panel (c). The numbers 1–16 indicate the sixteen azimuthal sectors. The red arrow marks the upstream velocity direction of the solar wind ions. The black curved arrow indicates the direction of rotation.
The magnetic field data were provided by the Mars Orbiter Magnetometer (MOMAG), which is also onboard Tianwen-1. The magnetometer measures the ambient vector magnetic field across a broad dynamic range (up to 10,000 nT per axis) with a resolution of 1.19 pT [28]. Upstream solar wind conditions were independently characterized using simultaneous observations from the Solar Wind Ion Analyzer (SWIA) and Magnetometer (MAG) onboard MAVEN. These observations provided reliable information on the upstream solar wind plasma and magnetic field for interpreting the ENA measurements. The SWIA instrument is an electrostatic analyzer that measures the 3-D distributions of ions ranging from 25 eV to 25 keV. When MAVEN is within the solar wind, SWIA can offer an accurate angular distribution of solar wind protons [29,30]. MAG measures the magnitude and direction of the ambient magnetic field across a dynamic range from 3 nT to 3000 nT [31].
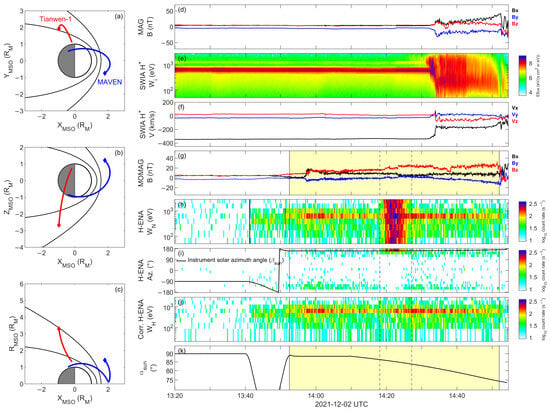
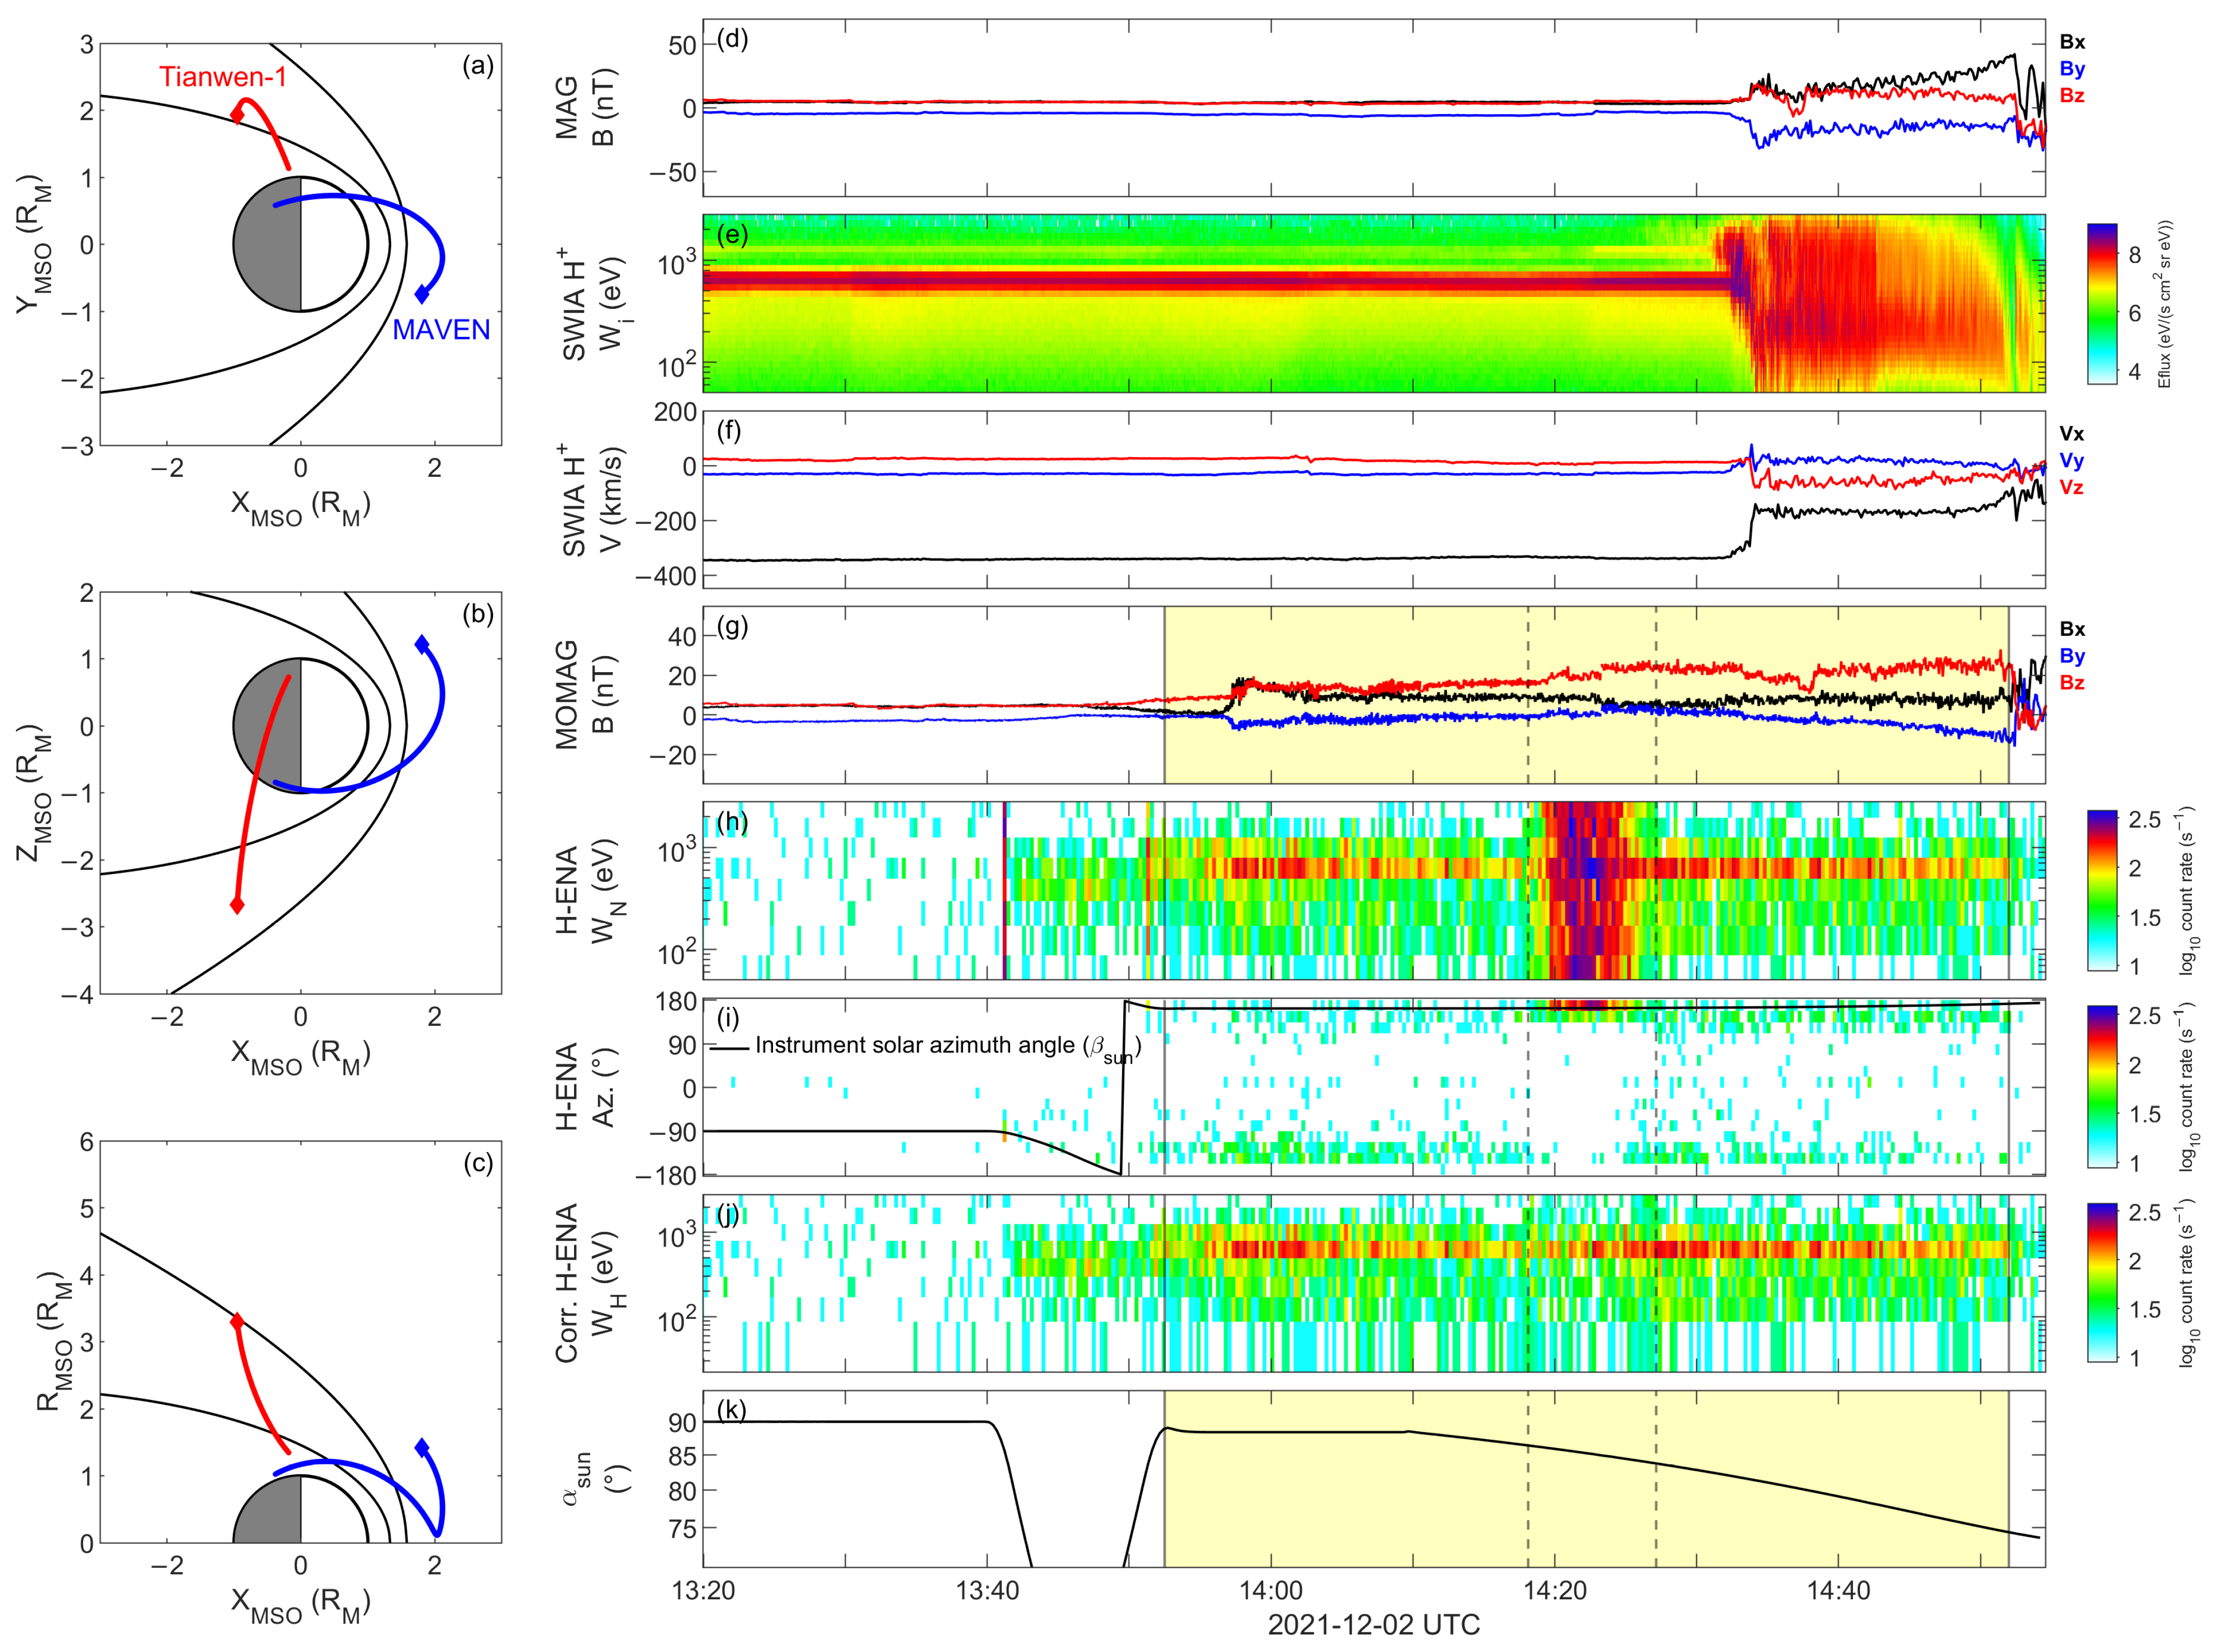
Figure 3 summarises the orbital configuration and particle measurements on 2 December 2021. During the selected interval, the upstream proton energy and bulk velocity remained nearly constant. The interval therefore provides an ideal opportunity to investigate the angular characteristics of SW H-ENAs under quasi-steady upstream conditions. It is noted that the H-ENA observations obtained during this attitude adjustment include contributions from multiple sources, including solar wind H-ENAs, MS H-ENAs, and occasional ultraviolet contamination. The separation and quantitative analysis of these components are addressed in the following section.
Figure 3.
Orbital information and observational data from MAVEN and Tianwen-1. (a–c) Projections of the spacecraft orbits onto different planes, with red indicating TIANWEN-1 and blue indicating MAVEN. (d) Magnetic field data from MAVEN/MAG. (e) Spectrogram from MAVEN/SWIA. (f) SWIA velocity provided by the MAVEN KP dataset. (g) Magnetic field data from Tianwen-1/MOMAG. The yellow box indicates the time period used for subsequent scanning observations, and the black dashed lines represent the time intervals affected by UV interference. (h) H-ENA spectrogram from Tianwen-1/MINPA. (i) MINPA H-ENA count-rate azimuthal spectrogram, overlaid with the instrument solar azimuthal angle. (j) H-ENA energy spectrogram from MINPA after UV interference correction. (k) Instrument solar incidence angle () from MINPA. The angular range between the two black dashed lines corresponds to the angular range impacted by UV interference.
4. Angular Distribution of Solar Wind H-ENAs and Inversion of Solar Wind Parameters
During the selected interval, simultaneous MAVEN/SWIA measurements showed that the upstream solar wind was in a slow wind state, with the central energy remaining stable at approximately 647.6 eV, corresponding to 352.2 km/s. At 13:41, the spacecraft attitude commenced a transition from sun-pointing to Mars-pointing, offering an opportunity to carry out scanning observations of ENAs in space. This attitude adjustment was carried out in two phases. In the first phase, the spacecraft rapidly adjusted the , accompanied by a rapid alteration in the . In the second phase, the remained constant while the was gradually adjusted to guarantee precise Mars-pointing for observation. We used H-ENA observations from the slow rotation period corresponding to the second phase of the attitude adjustment (the period marked by the yellow box in Figure 3). The observed H-ENA count rates obtained during the spacecraft attitude adjustment represent a superposition of multiple contributions, including solar wind H-ENAs, MS H-ENAs, and background signals associated with UV radiation. Separating these components is necessary to accurately retrieve the angular properties of solar wind H-ENAs.
4.1. Decomposition of Observed H-ENA Signals
Although the MINPA uses UV absorbing material to cover the detection entrance path for ions and ENAs, during the attitude adjustment phase, UV radiation incident at specific angles can still penetrate the instrument. UV radiation can directly interact with the microchannel plate (MCP) or generate photoelectrons, leading to interference with a high count rate. As the changes, the H-ENA spectrum in Figure 3h shows an abnormal increase in count rates across all energy channels within a specific angular range, which is caused by UV interference. A quantitative statistical analysis was carried out during the interference events in November and December 2021. In this study, the 3 criterion was used to identify high count rate interference events influenced by UV radiation. The time range in which the count rate exceeded the mean value plus three times the standard deviation was screened out. Any time period within this range with a peak count rate greater than s−1 was identified as UV interference events to prevent misjudgment. The UV interference reached its peak at , with a 3 width of , which was similar to the UV interference observed in the MINPA ions data [25]. We applied a similar method to eliminate the UV interference.
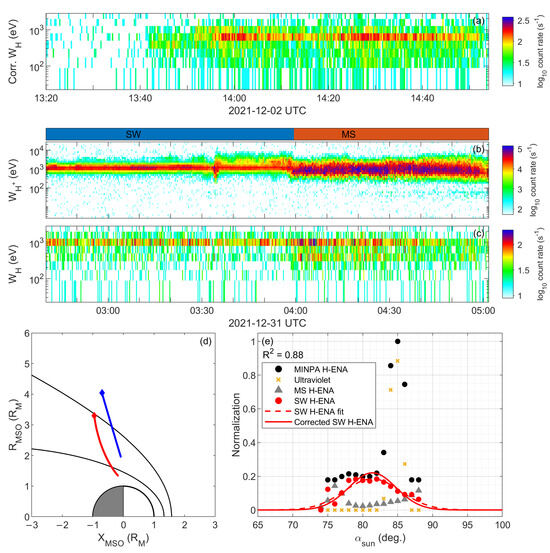
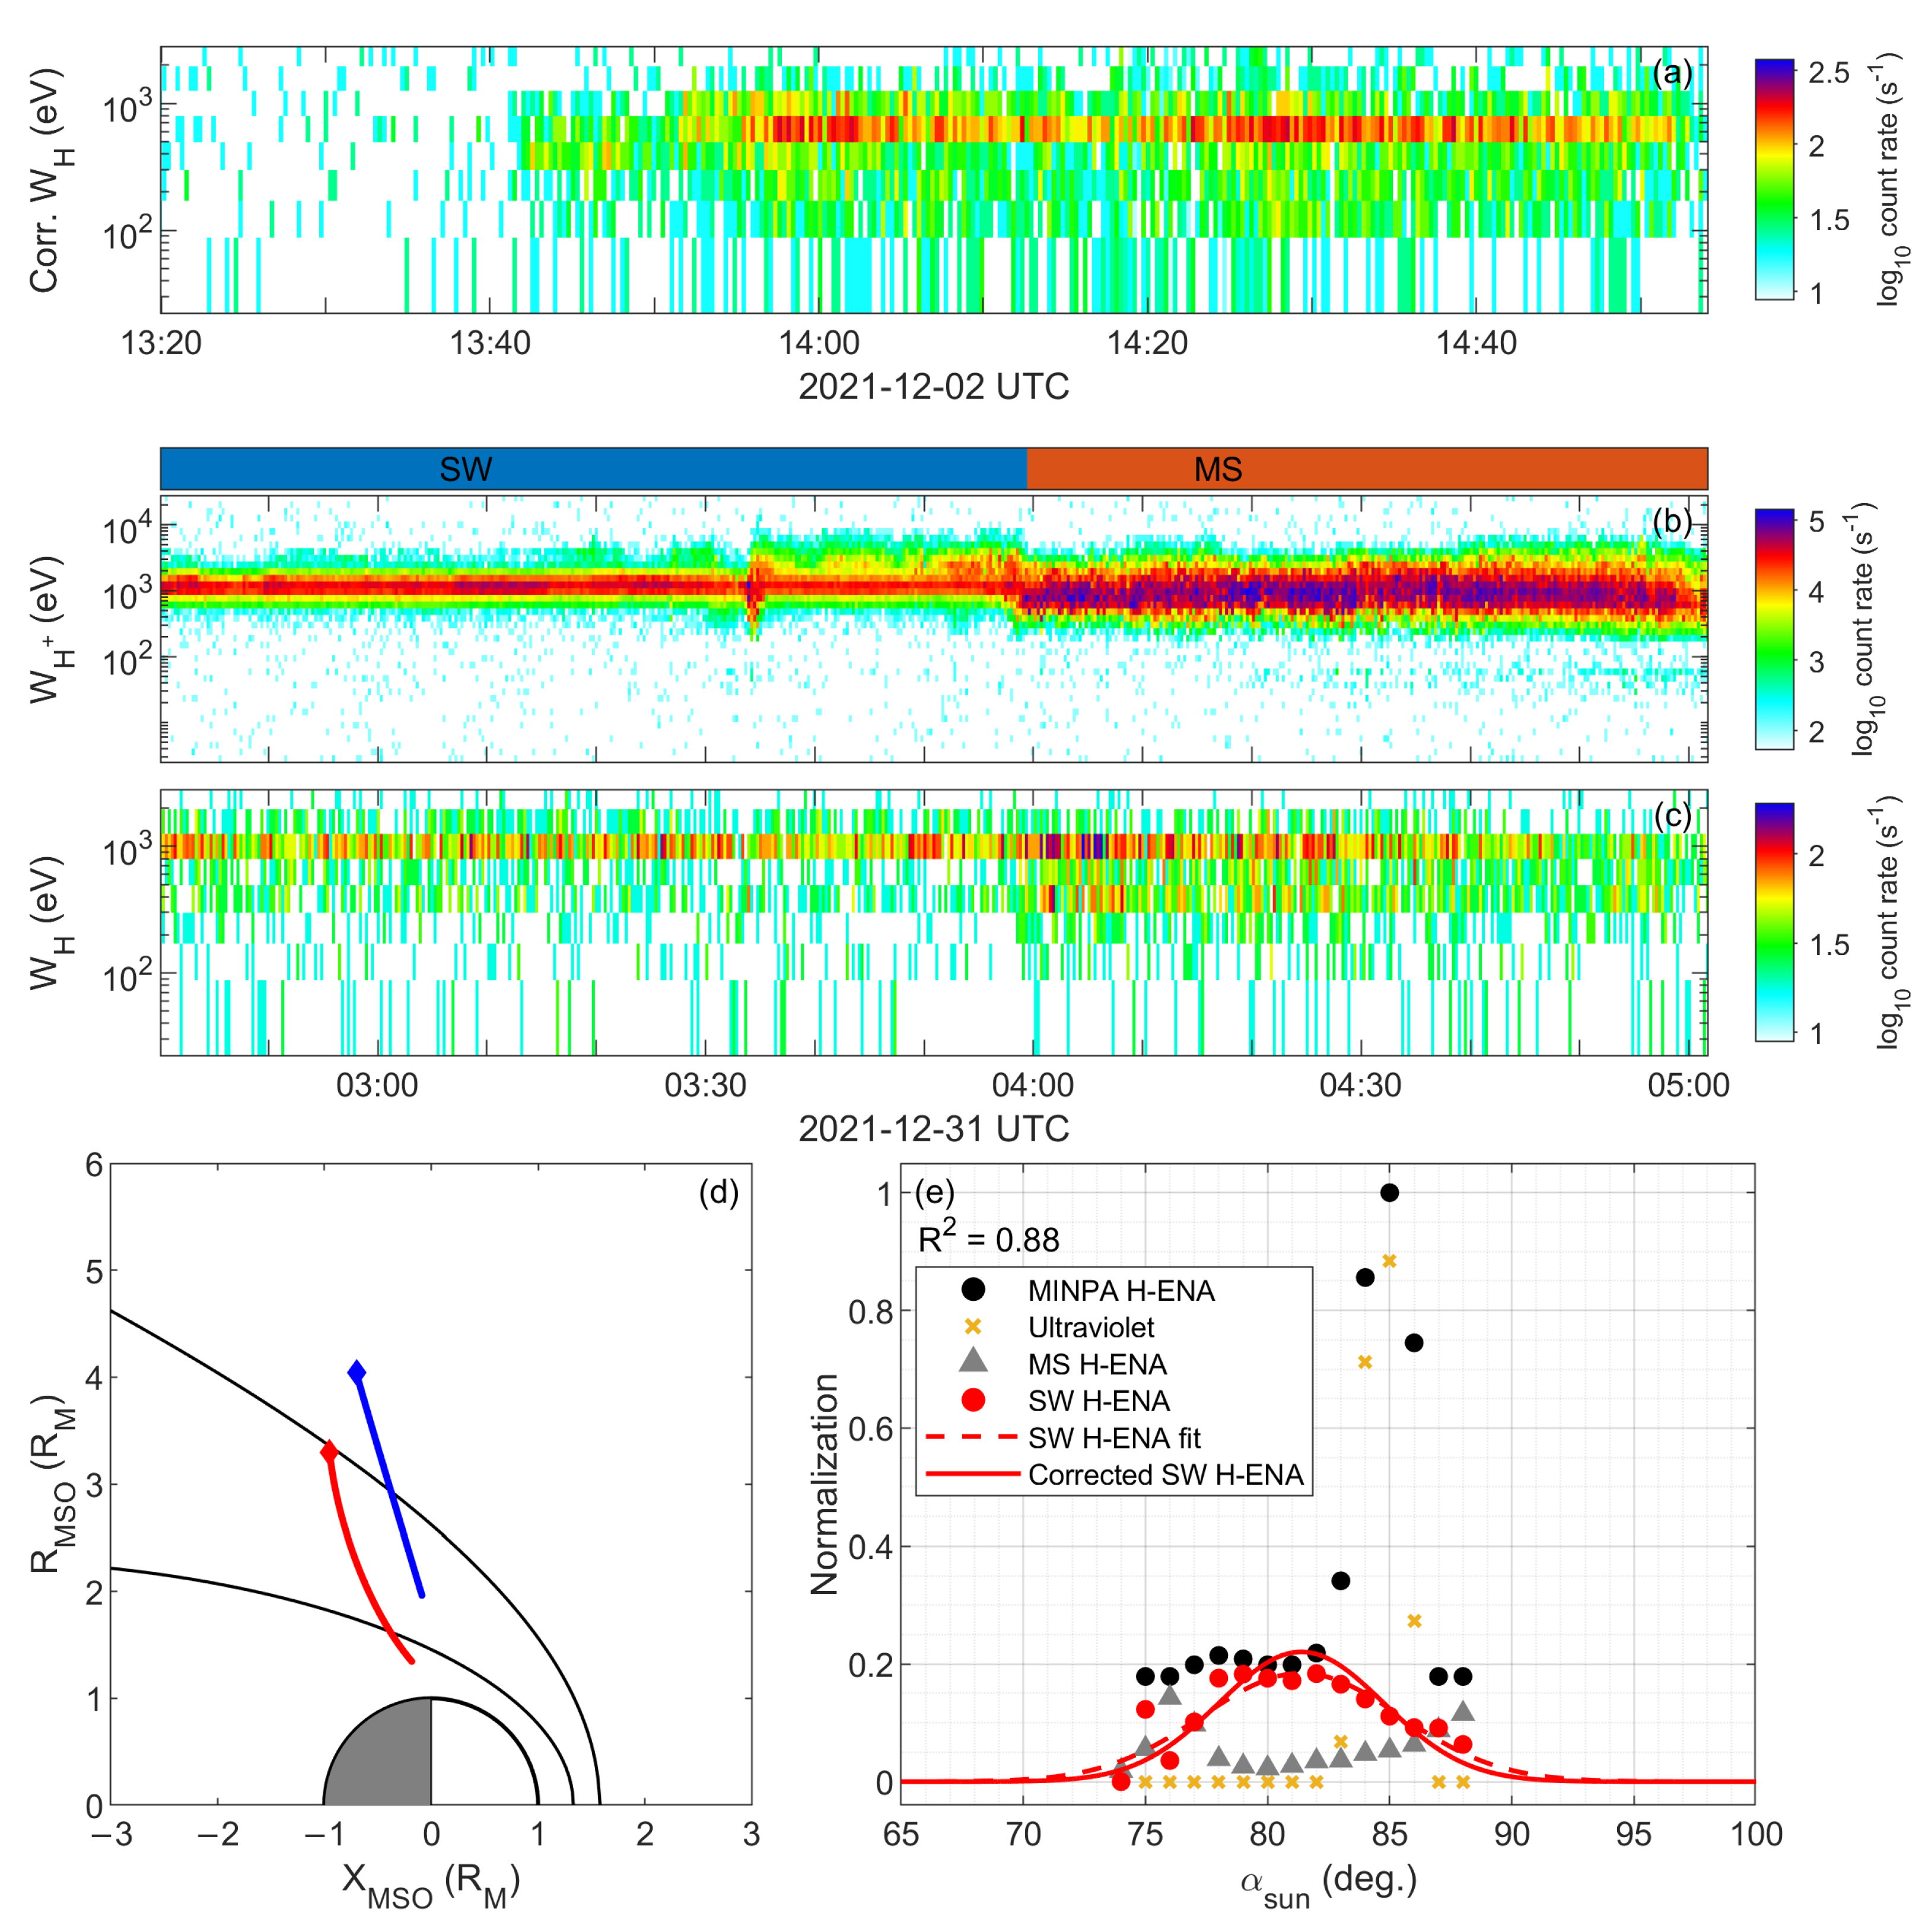
The SW H-ENA, which are generated through the charge exchange process between solar wind protons upstream of the bow shock and the neutral constituents in the exosphere, propagate in an approximately linear manner into the region within the bow shock. The interaction between solar wind protons and neutral particles in the magnetosheath downstream of the bow shock gives rise to H-ENA, denoted as MS H-ENA. Consequently, SW H-ENA and MS H-ENA produced in different spatial regions can be observed simultaneously downstream of the bow shock. As shown in Figure 4a, measurements of these ENA populations were taken during the attitude adjustment of Tianwen-1. Figure 4b,c show an example of ENA observations by MINPA during its transition from the solar wind to the magnetosheath. When located in the solar wind, the energy distribution of pure SW H-ENAs is relatively concentrated, while after entering the magnetosheath region, the energy range of H-ENAs becomes broader. Therefore, the scanning observation results in Figure 4a include not only the concentrated energy distribution of solar wind H-ENAs but also the broader energy range of MS H-ENAs. To obtain an accurate angular distribution of SW H-ENA, these two ENA populations must be effectively separated.
Figure 4.
(a) H-ENA energy spectrograms after UV interference correction. (b,c) Example of and H-ENA observations by MINPA during its transition from the solar wind to the magnetosheath region. (d) Orbital information of Tianwen-1. The red and blue curves represent the spacecraft trajectories corresponding to the observation intervals shown in panels (b,c), respectively. (e) The black dots represent the raw MINPA H-ENA observations as a function of . The yellow crosses show the UV-induced count rates derived from the observations. The gray triangles indicate the simulated MS H-ENA count rates. The red dots show the SW H-ENA angular distribution obtained by subtracting the UV and MS H-ENA contributions from the raw observations. The red dashed line denotes a Gaussian fit to the SW H-ENA distribution, whereas the solid red line shows the deconvolution-corrected distribution. All quantities shown in panel (e) were normalized using the raw H-ENA count rates as the reference.
This study uses the ENA model developed by Zhang to simulate the MS H-ENA observations for this event and separate the SW H-ENA and MS H-ENA components in the observational data [23]. The multi-fluid magnetohydrodynamic (MHD) model developed by Ma et al. [32] is used to characterize the Martian space plasma environment. The exosphere is described using the Mars Thermosphere General Circulation Model (MTGCM), specifically the one-dimensional parameterization of Modolo et al. [33]. Energy-dependent charge exchange cross sections are adopted from Lindsay and Stebbings [34]. During the attitude adjustment process, the upstream solar wind conditions maintained stability. We used the averaged H+ measurements from the SWIA as the input for the upstream solar wind conditions in the MHD simulation. This approach enables us to obtain detailed information about the direction and magnitude of H+ motion after the spacecraft’s crossing of the bow shock. During the time period marked by the yellow box in Figure 3, the remains constant, while the changes slowly. The entire scanning process is shown in Figure 2d,e, where the solar wind H-ENA signals are mainly concentrated in the 16th azimuthal sector and the 5th energy channel. Therefore, the subsequent analysis focuses on the observational data from the 5th energy channel in the 16th azimuthal sector.
Figure 4e shows the MINPA raw count rate as a function of , normalized over the entire scanning observation period. This figure shows the raw angular dependence of the H-ENA count rate and includes contributions from solar wind H-ENAs, MS H-ENAs, and UV induced counts. Initially, the UV-induced counts were quantified using the characteristic angular range of UV interference, and this component was subtracted from the raw data. Subsequently, the ENA simulation model is applied to estimate the MS H-ENA observations. At low angles , the H-ENA signal is predominantly contributed by the magnetosheath component. Therefore, the model was normalized to the average count rate within this low-angle region to estimate the magnetosheath contribution across the angular range. After accounting for these two contributions, the residual signal (red circles) is interpreted as the angular distribution of solar wind H-ENAs. The angular distribution of SW H-ENA is well described by a Gaussian fit, with a coefficient of determination (R2) of 0.88. By applying deconvolution to the fitted curve, the fine angular distribution of solar wind H-ENAs can be derived.
4.2. Distribution Characteristics of Solar Wind and H-ENAs
Near Earth (∼1 AU), modern in situ observations continue to show that the velocity distribution function of the solar wind proton core can be well approximated by a Maxwellian-type distribution [35,36]. The proton core is a near-thermal population centered on the bulk solar wind flow, while deviations from Maxwellian behavior are primarily attributed to secondary or non-thermal components such as beams and suprathermal tails. For a Maxwellian proton core, the thermal velocity spread naturally leads to a narrow angular dispersion about the bulk flow direction; in the small-angle limit, this angular distribution is well approximated by a Gaussian function, with a variance determined by the ratio of the thermal speed to the bulk flow speed. Consequently, representing the angular distribution of the proton core as Gaussian provides a physically consistent and widely adopted description when interpreting in-situ solar wind measurements. In the upstream region of Mars, the solar wind proton population observed by MAVEN/SWIA, which serves as the source population of SW H-ENAs, exhibits a narrow angular spread around the bulk-flow direction [29,30]. In analogy with near-Earth solar wind measurements, this angular distribution is commonly approximated as Gaussian in the inversion of particle data, allowing the angular width to be characterized by a single variance parameter.
SW H-ENAs are produced primarily when incident solar wind protons undergo charge exchange with the extended neutral corona of Mars. Because electron capture only weakly perturbs the projectile momentum, each resulting H-ENA largely retains the velocity, direction, and energy of its parent proton. The neutral atoms therefore form a collimated beam that preserves the kinematics of the upstream proton population. ENA imaging and modeling studies at Mars therefore commonly treat the H-ENA distribution as a kinematic mapping of the parent proton distribution, modulated by the spatial distribution of exospheric neutral hydrogen and the charge exchange cross section along the line of sight [37]. This correspondence enables SW H-ENA observations to diagnose the upstream conditions governing the solar wind Mars interaction.
4.3. Inversion of Solar Wind Parameters
The kinematic similarity between solar wind H-ENAs and their parent protons allows upstream solar wind parameters to be inferred from H-ENA observations. Finer angular sampling can improve the precision of this inversion.
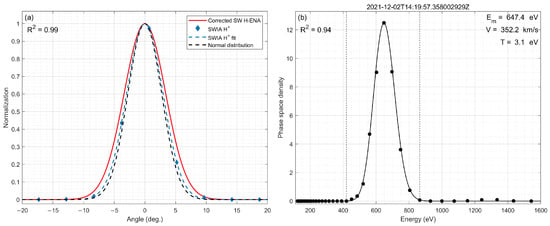
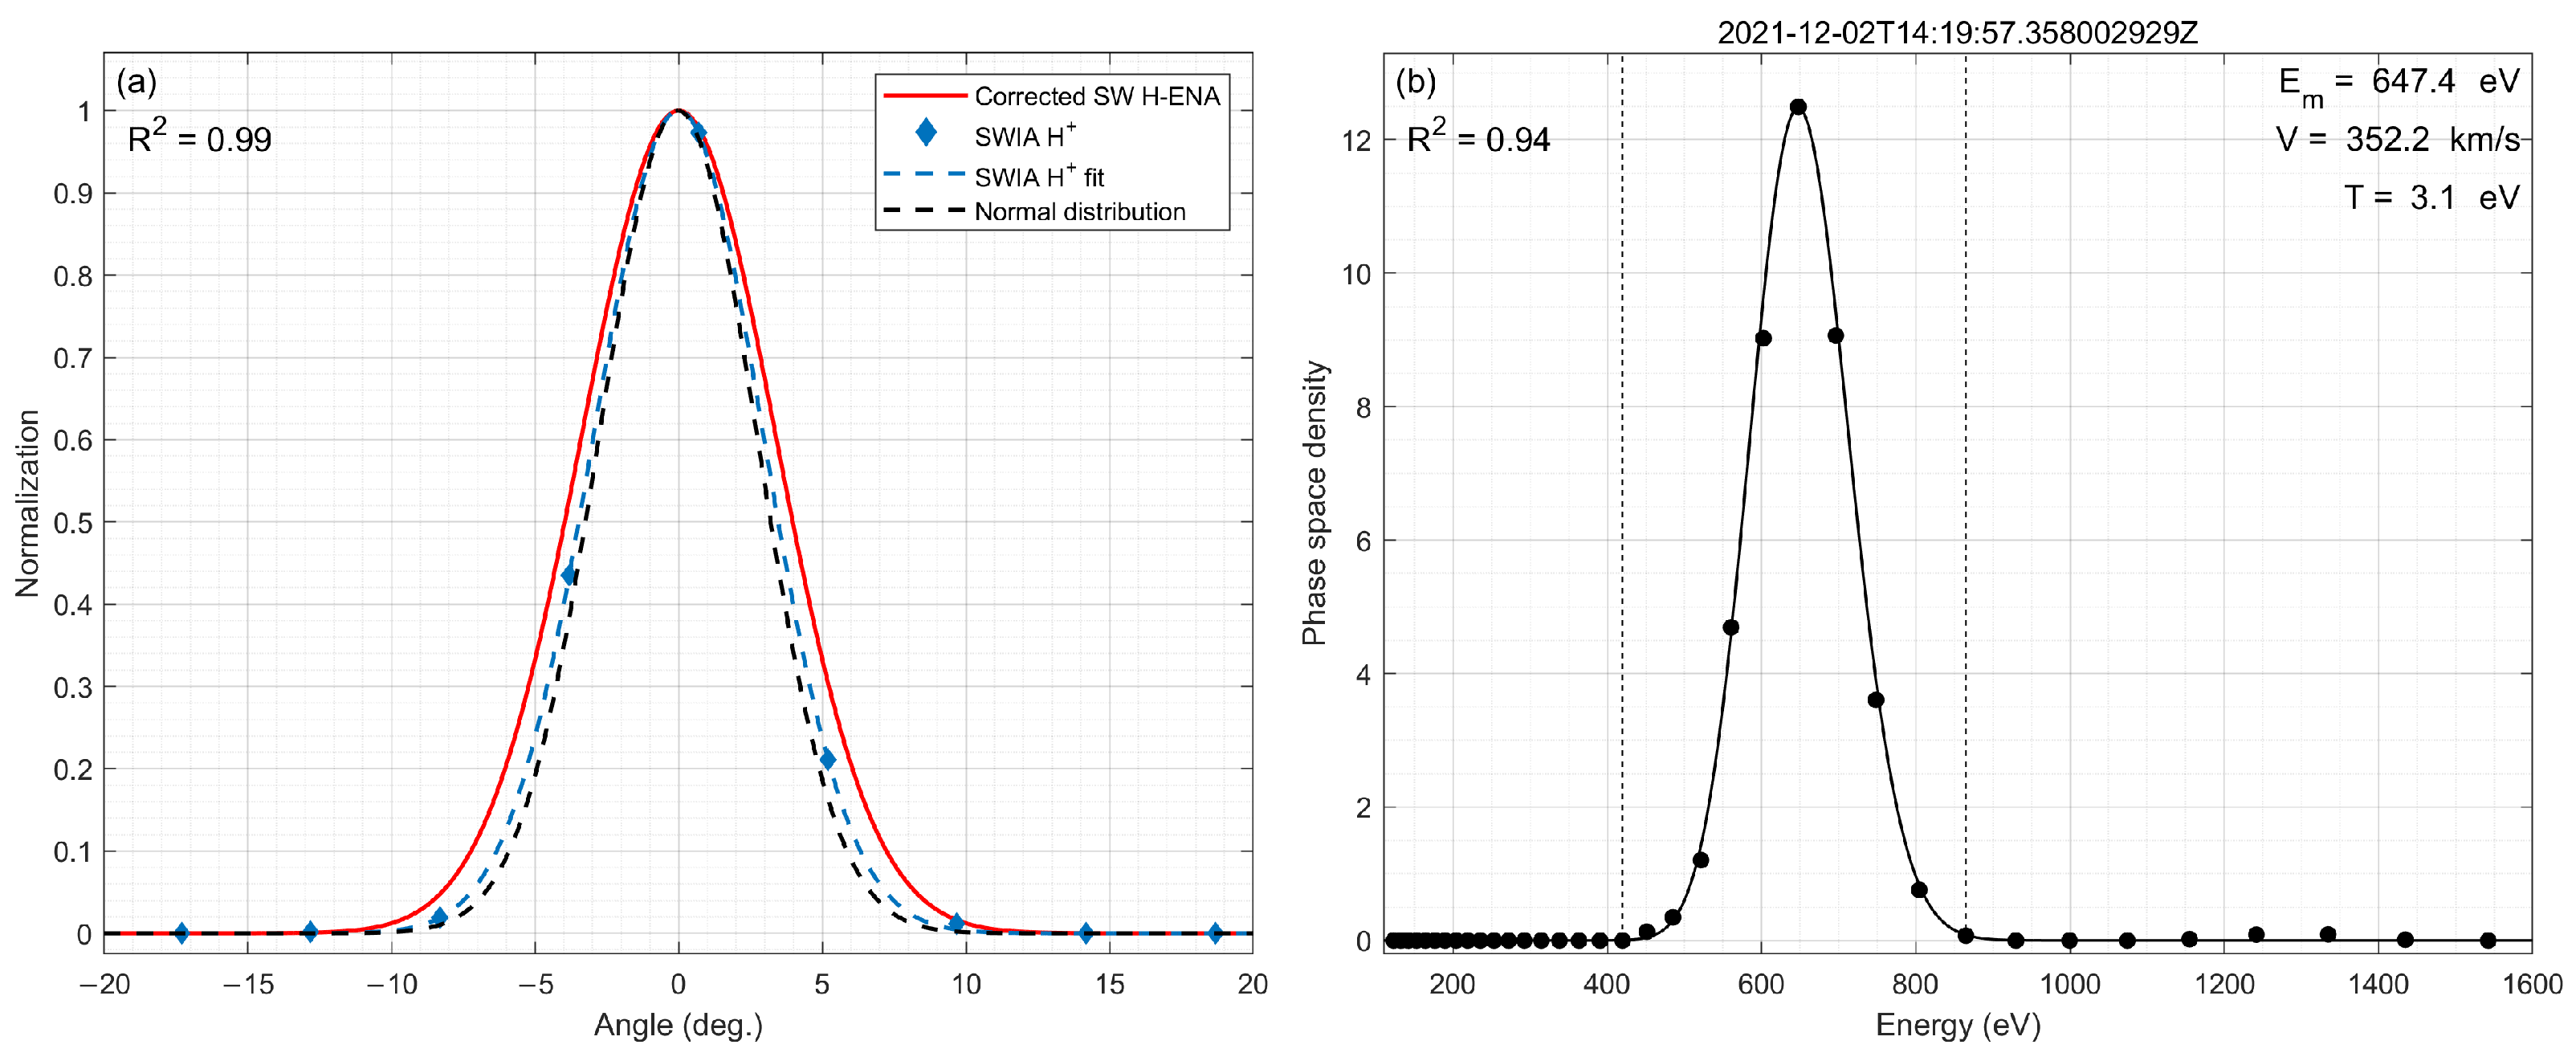
As shown in Figure 5a, the red solid line denotes the solar wind H-ENA angular distribution corrected using the data-processing method described earlier, while the blue diamonds represent the simultaneous SWIA proton measurements. The blue dashed line shows a Gaussian fit to the SWIA data, yielding an R2 of 0.99. The data are normalized to facilitate comparison. Both solar wind H-ENAs and solar wind H+ display Gaussian-type angular distributions, with only minor differences between the two populations. The Maxwell velocity distribution is used to fit the solar wind H+. As depicted in Figure 5b, the data points represent the proton phase space density (PSD) as a function of ion energy, which is computed from SWIA observations. The solid line denotes the fitted Maxwellian curve, with an R2 value as high as 0.94. Based on the fitted curve, during the H-ENA observation period, the average upstream solar wind central energy, and bulk flow velocity and temperature were 647.4 ± 11.7 eV, 352.2 ± 3.2 km/s and 3.1 ± 0.7 eV, respectively. As described in Section 3, we use the solar wind H-ENA observations from the fifth energy channel, whose count rate is significantly higher than those of the other channels (Figure 3j). The central energy of this channel is 612.1 eV. Considering the 58% energy resolution of MINPA, we estimate the bulk speed of solar wind H-ENAs in this event to be 342.2 ± 81 km/s. The uncertainty of 81 km/s reflects the energy resolution of MINPA. This H-ENA bulk speed estimate is provided for reference only.
Figure 5.
(a) Angular distribution of solar wind and H-ENA. The red solid line represents the corrected angular distribution of solar wind H-ENA. The blue diamonds and blue dashed line correspond to the SWIA measurements and their Gaussian fit, respectively; both have been normalized to their fitted peak values for comparison. The black dashed line shows the angular distribution of under the assumption of an ideal Maxwellian distribution. (b) PSD calculated from the SWIA measured differential flux and its Maxwellian distribution fit, with the fitting parameters at the corresponding time point indicated.
The black dashed line in Figure 5a represents the ideal Maxwellian distribution of phase space density as a function of velocity direction under the solar wind conditions of this event. For both solar wind H-ENAs and solar wind H+, when the phase space density follows a Gaussian-type distribution with respect to relative velocity, their directional distribution of relative velocity can also be approximated by a Gaussian-type function. The 1 angular width of this H+ distribution is . This angle is interpreted as the deviation between the total velocity and the bulk velocity induced by thermal motion. Using the thermal speed expression derived from the ideal gas law, the corresponding temperature is calculated to be eV, which is in agreement with the temperature obtained from the Maxwellian fitting (3.1 eV). Using the same method, the 1 angular width of the solar wind H-ENA distribution is determined to be , corresponding to a temperature of eV. The plasma temperatures derived from different methods, along with the corresponding standard deviations of the angular distributions, are summarized in Table 1. For parameters obtained from Gaussian fitting, the quoted uncertainties represent uncertainties. The uncertainties in temperatures derived from angular widths are propagated from the corresponding fitting uncertainties. The comparison of the velocity, temperature, and angular distributions of SW H-ENAs and upstream SW is consistent with a solar wind origin and charge exchange production process.
Table 1.
Temperatures Derived from Maxwellian and Gaussian Fits and Their Corresponding Angular Widths.
4.4. Charge Exchange Induced Angular Scattering
Comparing the SW H-ENA angular distribution reconstructed from the micro-step scan with simultaneous observations of upstream solar wind allows the angular broadening associated with charge exchange to be estimated. The angular distribution of solar wind H-ENAs is systematically broader than that of the parent solar wind protons, as evidenced by the larger angular width derived from the Gaussian fitting of the ENA observations. This result indicates that, although solar wind H-ENAs largely preserve the bulk flow direction of the incident protons, additional scattering is introduced during the charge exchange process.
It is widely recognized that this scattering angle depends on the incident ion energy and the differential charge exchange cross section. Swaczyna et al. [26] calculated the mean scattering angle based on the angular dependence of theoretical differential cross sections at different energies provided by Schultz et al. [38]. Following the same approach, this study uses the updated differential cross-section data from Schultz et al. [39] to derive a mean scattering angle of with a standard deviation of corresponding to an incident ion energy of approximately 662 eV. This standard deviation characterizes the physical scattering angle distribution rather than an uncertainty in the measured H-ENA angular width. The theoretical scattering angle distribution provides a reference for the observational analysis.
To assess the recovery bias introduced by the processing procedure, we conducted a simulation. A known Gaussian angular distribution was convolved with the MINPA angular response function (FWHM = ). The resulting signal was sampled using the angular step of the present micro-step scan, with an incompletely removed residual UV component taken into account. The magnitude of this residual component was determined from the recovery of count rates in other energy channels. The convolved distribution was then reconstructed using the same Lucy–Richardson procedure used for the observations. The recovered and input FWHMs differed by . The Gaussian fits to the recovered and input distributions differed by in angular standard deviation, . This test quantifies the recovery bias under the assumed response function, sampling conditions, and residual UV interference.
The broader angular distribution of solar wind H-ENAs than that of upstream solar wind is consistent with collisional scattering during charge exchange contributing to the observed angular broadening. The analysis method described above improves the angular resolving capability of the data and provides more detailed information on the angular distributions of solar wind H-ENAs and upstream solar wind .
5. Discussion
This study shows that micro-step scanning can improve the ability to resolve angular distributions from data using existing space instrumentation without requiring hardware modifications. The proposed method may be extended to other planetary exploration missions and applied to space plasma research.
The processing pipeline addressed two key sources of contamination: UV-induced counts and magnetosheath H-ENAs. The 3 criterion identified UV interference between and , with a peak at and an approximately Gaussian angular profile. Although the affected samples comprised only 0.38% of the full dataset, they overlapped the scan interval analyzed here and therefore required exclusion. We then used an H-ENA model based on MHD simulations and an exospheric neutral-density model to estimate the magnetosheath contribution and isolate the solar wind H-ENA signal.
To minimize calibration-related variability, we restricted the analysis to a single energy channel and azimuthal sector, for which the geometric factor was constant. This design improves the internal consistency of the angular comparison but limits the present analysis to relative distributions; absolute H-ENA fluxes cannot yet be derived. Full in-flight calibration of MINPA will be required to convert these relative distributions into absolute flux measurements.
Gravitational deflection can be neglected for the H-ENAs considered here. For an H-ENA speed of approximately 342 km/s and a conservative grazing trajectory with an impact parameter of , the Newtonian estimate gives a deflection angle of only . The H-ENAs investigated in this study are produced by charge exchange between solar wind protons and neutral particles in the Martian exosphere and nearby space, and subsequently travel to Tianwen-1/MINPA on local spatial scales. Their propagation distances are far smaller than interplanetary scales, and their flight times are only a few to several tens of seconds. Over this short interval, Martian gravity produces negligible changes in both velocity and trajectory. The H-ENAs can therefore be treated as propagating along straight trajectories, and gravitational effects are negligible for the present event.
MS H-ENAs have higher temperatures and broader angular distributions than solar wind H-ENAs, whereas solar wind H-ENAs have lower temperatures and narrower angular distributions. In the low region near in Figure 4e, the observed H-ENA signal is dominated by the MS H-ENA component. The model and observations were normalized in this region to reduce the influence of the instrument geometric factor. This procedure permits a comparison of relative angular distributions, rather than absolute H-ENA fluxes. The extracted solar wind H-ENA speed and angular distribution were then compared with SWIA observations. The H-ENA bulk speed is reported for reference only because of the limited energy resolution of MINPA, whereas the overall angular distributions are both Gaussian-type. These results provide observational evidence that solar wind produces H-ENAs through charge exchange.
The one standard deviation () angular width of the H+ distribution is , corresponding to a temperature of eV. In comparison, the 1 angular width of the solar wind H-ENA distribution is , corresponding to a temperature of eV. Assuming that the two distributions are independent and Gaussian, the observed additional angular width is . At an incident energy of 662 eV, the theoretical scattering angle distribution has a standard deviation of . The observed additional width therefore slightly exceeds the theoretical scattering standard deviation. We interpret charge exchange induced scattering as the main contribution to the observed greater angular width of H-ENAs relative to ions. This comparison provides observational support for solar wind H-ENAs originating from solar wind and broadly retaining the overall angular distribution of their parent population.
In addition to charge exchange scattering, the observed angular broadening may also be affected by data processing. The controlled simulation, which incorporates the assumed MINPA angular response function, the actual angular sampling, and an incompletely removed residual UV component, yielded a recovery bias of in the reconstructed H-ENA angular width. This bias consequently affects the inferred relative angular broadening. The remaining uncertainty associated with the model based separation cannot yet be quantitatively estimated for the present event, which remains a limitation of this analysis.
The separation procedure may support future studies of the relative contributions of solar wind and MS H-ENAs to atmospheric erosion and energy deposition at Mars. The observed angular broadening provides a quantitative reference for charge exchange scattering in Martian ENA studies. The scanning approach is applicable only when the incident particle population remains stable and narrowly collimated throughout the maneuver. By scanning a stable beam across the field of view, the approach can provide a finely sampled characterization of the instrument directional response. With suitable reference observations, such measurements may support future in-flight calibration of MINPA.
6. Conclusions
This study used micro-step scanning observations by Tianwen-1/MINPA during a spacecraft attitude adjustment to investigate the angular distribution of solar wind H-ENAs at Mars. After accounting for UV interference and the magnetosheath H-ENA contribution, the measurements were combined to reconstruct a finely sampled relative angular distribution. The scan yielded an angular sampling interval of approximately , whereas the intrinsic polar angular response width of MINPA remained . We used the Lucy–Richardson deconvolution algorithm to mitigate angular blurring associated with the instrumental response and scanning process.
The reconstructed solar wind H-ENA distribution and the simultaneous upstream solar wind distribution were both Gaussian-type. Their fitted angular widths were and , respectively. Under the assumptions that the two distributions are independent and Gaussian, the observed additional angular width was . This value is slightly greater than the theoretical scattering angle standard deviation of . The overall similarity between the two angular distributions provides observational support for solar wind as a source population of solar wind H-ENAs.
Micro-step scanning provides a practical approach to obtaining densely sampled ENA angular distributions from existing instruments when the incident particle population is stable and narrowly collimated. The present analysis concerns relative angular distributions rather than absolute H-ENA fluxes. The uncertainty associated with the model based separation of magnetosheath H-ENAs cannot yet be quantitatively estimated for the present event. Further in flight characterization and calibration of the MINPA directional response, supported by a larger set of scanning observations, could enable more robust assessments of ENA angular distributions and facilitate the conversion of relative distributions into absolute flux measurements.
Author Contributions
Conceptualization, Y.Z. and F.S.; methodology, F.S.; software, F.S. and Y.Z.; validation, Y.Z., L.L., L.W., F.Q., Q.X. and X.G.; formal analysis, F.S.; investigation, F.S.; resources, Y.Z., L.X., B.T., W.L., A.Z. and L.K.; data curation, F.S. and J.M.; writing—original draft preparation, F.S.; writing—review and editing, Y.Z. and L.L.; visualization, F.S.; supervision, L.L.; project administration, J.W.; funding acquisition, Y.Z. All authors have read and agreed to the published version of the manuscript.
Funding
This research was funded by the National Natural Science Foundation of China (Grant Nos. 42241112, 42574243, and 42508017) and the Pandeng Program of the National Space Science Center of the Chinese Academy of Sciences.
Institutional Review Board Statement
Not applicable.
Informed Consent Statement
Not applicable.
Data Availability Statement
The Tianwen-1/MINPA data can be requested through the CNSA data release system (https://moon.bao.ac.cn/mall/MarsDATA (accessed on 1 June 2026)). The MAVEN/SWIA and MAG data used in this study can be downloaded from NASA’s Planetary Data System, Planetary Plasma Interactions Node (https://pds-ppi.igpp.ucla.edu/search/default.jsp (accessed on 1 June 2026)).
Acknowledgments
The authors acknowledge the China National Space Administration (CNSA) and the Ground Research and Application System (GRAS) for enabling the Tianwen-1 mission and its observations at Mars. The authors also thank the entire MAVEN team for providing the MAG and SWIA data. The BATS-R-US code used in this study was developed by the Center for Space Environment Modeling (CSEM) at the University of Michigan, whose support is gratefully acknowledged.
Conflicts of Interest
The authors declare no conflicts of interest.
References
- Meinel, A.B. Doppler-shifted auroral hydrogen emission. Astrophys. J. 1951, 113, 50. [Google Scholar] [CrossRef] [Scilit]
- Burch, J.; Moore, T.E.; Green, J.L. Imager for Magnetopause-to-Aurora Global Exploration (IMAGE); NASA MIDEX Program; Southwest Research Institute: San Antonio, TX, USA, 1995. [Google Scholar]
- Mitchell, D.G.; Jaskulek, S.E.; Schlemm, C.E.; Keath, E.P.; Thompson, R.E.; Tossman, B.E.; Boldt, J.D.; Hayes, J.R.; Andrews, G.B.; Paschalidis, N.; et al. High energy neutral atom (HENA) imager for the IMAGE mission. Space Sci. Rev. 2000, 91, 67–112. [Google Scholar] [CrossRef] [Scilit]
- McComas, D.J.; Allegrini, F.; Bochsler, P.; Bzowski, M.; Collier, M.; Fahr, H.; Fichtner, H.; Frisch, P.; Funsten, H.O.; Fuselier, S.A.; et al. IBEX—Interstellar Boundary Explorer. Space Sci. Rev. 2009, 146, 11–33. [Google Scholar] [CrossRef] [Scilit]
- Fuselier, S.A.; Bochsler, P.; Chornay, D.; Clark, G.; Crew, G.B.; Dunn, G.; Ellis, S.; Friedmann, T.; Funsten, H.O.; Ghielmetti, A.G.; et al. The IBEX-Lo sensor. Space Sci. Rev. 2009, 146, 117–147. [Google Scholar] [CrossRef] [Scilit]
- Funsten, H.O.; Allegrini, F.; Bochsler, P.; Dunn, G.; Ellis, S.; Everett, D.; Fagan, M.J.; Fuselier, S.A.; Granoff, M.; Gruntman, M.; et al. The Interstellar Boundary Explorer High Energy (IBEX-Hi) neutral atom imager. Space Sci. Rev. 2009, 146, 75–103. [Google Scholar] [CrossRef] [Scilit]
- McComas, D.J.; Allegrini, F.; Bochsler, P.; Bzowski, M.; Christian, E.R.; Crew, G.B.; DeMajistre, R.; Fahr, H.; Fichtner, H.; Frisch, P.C.; et al. Global observations of the interstellar interaction from the Interstellar Boundary Explorer (IBEX). Science 2009, 326, 959–962. [Google Scholar] [CrossRef] [Scilit]
- Schwadron, N.A.; Bzowski, M.; Crew, G.B.; Gruntman, M.; Fahr, H.; Fichtner, H.; Frisch, P.C.; Funsten, H.O.; Fuselier, S.; Heerikhuisen, J.; et al. Comparison of Interstellar Boundary Explorer observations with 3D global heliospheric models. Science 2009, 326, 966–968. [Google Scholar] [CrossRef] [Scilit]
- Möbius, E.; Bochsler, P.; Bzowski, M.; Crew, G.B.; Funsten, H.O.; Fuselier, S.A.; Ghielmetti, A.; Heirtzler, D.; Izmodenov, V.V.; Kubiak, M.; et al. Direct observations of interstellar H, He, and O by the Interstellar Boundary Explorer. Science 2009, 326, 969–971. [Google Scholar] [CrossRef] [Scilit]
- Fuselier, S.A.; Funsten, H.O.; Heirtzler, D.; Janzen, P.; Kucharek, H.; McComas, D.J.; Möbius, E.; Moore, T.E.; Petrinec, S.M.; Reisenfeld, D.B.; et al. Energetic neutral atoms from the Earth’s subsolar magnetopause. Geophys. Res. Lett. 2010, 37, 2010GL044140. [Google Scholar] [CrossRef] [Scilit]
- Petrinec, S.M.; Dayeh, M.A.; Funsten, H.O.; Fuselier, S.A.; Heirtzler, D.; Janzen, P.; Kucharek, H.; McComas, D.J.; Möbius, E.; Moore, T.E.; et al. Neutral atom imaging of the magnetospheric cusps. J. Geophys. Res. Space Phys. 2011, 116, A07203. [Google Scholar] [CrossRef] [Scilit]
- Luhmann, J.G.; Brace, L.H. Near-Mars space. Rev. Geophys. 1991, 29, 121–140. [Google Scholar] [CrossRef] [Scilit]
- Nagy, A.F.; Winterhalter, D.; Sauer, K.; Cravens, T.E.; Brecht, S.; Mazelle, C.; Crider, D.; Kallio, E.; Zakharov, A.; Dubinin, E.; et al. The Plasma Environment of Mars. In Mars’ Magnetism and Its Interaction with the Solar Wind; Space Sciences Series of ISSI; Springer: Dordrecht, The Netherlands, 2004; pp. 33–114. [Google Scholar] [CrossRef] [Scilit]
- Barabash, S.; Lundin, R.; Andersson, H.; Brinkfeldt, K.; Grigoriev, A.; Gunell, H.; Holmström, M.; Yamauchi, M.; Asamura, K.; Bochsler, P.; et al. The Analyzer of Space Plasmas and Energetic Atoms (ASPERA-3) for the Mars Express Mission. Space Sci. Rev. 2006, 126, 113–164. [Google Scholar] [CrossRef] [Scilit]
- Brinkfeldt, K.; Gunell, H.; Brandt, P.C.; Barabash, S.; Frahm, R.A.; Winningham, J.D.; Kallio, E.; Holmström, M.; Futaana, Y.; Ekenbäck, A.; et al. First ENA observations at Mars: Solar-wind ENAs on the nightside. Icarus 2006, 182, 439–447. [Google Scholar] [CrossRef] [Scilit]
- Futaana, Y.; Barabash, S.; Grigoriev, A.; Holmström, M.; Kallio, E.; Brandt, P.C.; Gunell, H.; Brinkfeldt, K.; Lundin, R.; Andersson, H.; et al. First ENA observations at Mars: ENA emissions from the Martian upper atmosphere. Icarus 2006, 182, 424–430. [Google Scholar] [CrossRef] [Scilit]
- Gunell, H.; Brinkfeldt, K.; Holmström, M.; Brandt, P.C.; Barabash, S.; Kallio, E.; Ekenbäck, A.; Futaana, Y.; Lundin, R.; Andersson, H.; et al. First ENA observations at Mars: Charge exchange ENAs produced in the magnetosheath. Icarus 2006, 182, 431–438. [Google Scholar] [CrossRef] [Scilit]
- Halekas, J.S.; Lillis, R.J.; Mitchell, D.L.; Cravens, T.E.; Mazelle, C.; Connerney, J.E.P.; Espley, J.R.; Mahaffy, P.R.; Benna, M.; Jakosky, B.M.; et al. MAVEN observations of solar wind hydrogen deposition in the atmosphere of Mars. Geophys. Res. Lett. 2015, 42, 8901–8909. [Google Scholar] [CrossRef] [Scilit]
- Deighan, J.; Jain, S.K.; Chaffin, M.S.; Fang, X.; Halekas, J.S.; Clarke, J.T.; Schneider, N.M.; Stewart, A.I.F.; Chaufray, J.-Y.; Evans, J.S.; et al. Discovery of a proton aurora at Mars. Nat. Astron. 2018, 2, 802–807. [Google Scholar] [CrossRef] [Scilit]
- Wan, W.X.; Wang, C.; Li, C.L.; Wei, Y.; Liu, J.J. The payloads of planetary physics research onboard China’s First Mars Mission (Tianwen-1). Earth Planet. Phys. 2020, 4, 331–332. [Google Scholar] [CrossRef] [Scilit]
- Zhang, A.B.; Kong, L.G.; Li, W.Y.; Li, L.; Tang, B.B.; Rong, Z.J.; Wei, Y.; Ma, J.J.; Zhang, Y.T.; Xie, L.H.; et al. Tianwen-1 MINPA observations in the solar wind. Earth Planet. Phys. 2022, 6, 1–9. [Google Scholar] [CrossRef] [Scilit]
- Ma, J.; Kong, L.; Li, W.; Zhang, Y.; Wurz, P.; Galli, A.; Tang, B.; Xie, L.; Zhang, A.; Li, L. Solar Wind Energetic Neutral Atom Observation at Mars by MINPA Onboard the Tianwen-1 Orbiter. In Proceedings of the Fall Meeting 2022, AGU, Chicago, IL, USA, 12–16 December 2022. [Google Scholar]
- Zhang, Y.; Li, L.; Xie, L.; Kong, L.; Li, W.; Tang, B.; Ma, J.; Zhang, A. Inversion of upstream solar wind parameters from ENA observations at Mars. Remote Sens. 2023, 15, 1721. [Google Scholar] [CrossRef] [Scilit]
- Kong, L.G.; Zhang, A.B.; Tian, Z.; Zheng, X.Z.; Wang, W.J.; Liu, B.; Wurz, P.; Piazza, D.; Etter, A.; Su, B.; et al. Mars Ion and Neutral Particle Analyzer (MINPA) for Chinese Mars Exploration Mission (Tianwen-1): Design and ground calibration. Earth Planet. Phys. 2020, 4, 333–344. [Google Scholar] [CrossRef] [Scilit]
- Wang, L.; Li, L.; Li, W.; Kong, L.; Tang, B.; Ma, J.; Zhang, Y.; Xie, L.; Zhang, A.; Qiao, F.; et al. Characterizing and removing ultra-violet contamination in ion observations on board Tianwen-1. Atmosphere 2024, 15, 19. [Google Scholar] [CrossRef] [Scilit]
- Swaczyna, P.; McComas, D.J.; Zirnstein, E.J.; Heerikhuisen, J. Angular scattering in charge exchange: Issues and implications for secondary interstellar hydrogen. Astrophys. J. 2019, 887, 223. [Google Scholar] [CrossRef] [Scilit]
- Sullivan, J.D. Geometric factor and directional response of single and multi-element particle telescopes. Nucl. Instrum. Methods 1971, 95, 5–11. [Google Scholar] [CrossRef] [Scilit]
- Liu, K.; Hao, X.J.; Li, Y.R.; Zhang, T.L.; Pan, Z.H.; Chen, M.M.; Hu, X.W.; Li, X.; Shen, C.L.; Wang, Y.M. Mars Orbiter magnetometer of China’s First Mars Mission Tianwen-1. Earth Planet. Phys. 2020, 4, 384–389. [Google Scholar] [CrossRef] [Scilit]
- Halekas, J.S.; Taylor, E.R.; Dalton, G.; Johnson, G.; Curtis, D.W.; McFadden, J.P.; Mitchell, D.L.; Lin, R.P.; Jakosky, B.M. The Solar Wind Ion Analyzer for MAVEN. Space Sci. Rev. 2015, 195, 125–151. [Google Scholar] [CrossRef] [Scilit]
- Halekas, J.S.; Brain, D.A.; Luhmann, J.G.; DiBraccio, G.A.; Ruhunusiri, S.; Harada, Y.; Fowler, C.M.; Mitchell, D.L.; Connerney, J.E.P.; Espley, J.R.; et al. Flows, fields, and forces in the Mars–solar wind interaction. J. Geophys. Res. Space Phys. 2017, 122, 11320–11341. [Google Scholar] [CrossRef] [Scilit]
- Connerney, J.E.P.; Espley, J.; Lawton, P.; Murphy, S.; Odom, J.; Oliversen, R.; Sheppard, D. The MAVEN Magnetic Field Investigation. Space Sci. Rev. 2015, 195, 257–291. [Google Scholar] [CrossRef] [Scilit]
- Ma, Y.J.; Dong, C.F.; Toth, G.; van der Holst, B.; Nagy, A.F.; Russell, C.T.; Bougher, S.; Fang, X.; Halekas, J.S.; Espley, J.R.; et al. Importance of ambipolar electric field in driving ion loss from Mars: Results from a multifluid MHD model with the electron pressure equation included. J. Geophys. Res. Space Phys. 2019, 124, 9040–9057. [Google Scholar] [CrossRef] [Scilit]
- Modolo, R.; Hess, S.; Mancini, M.; Leblanc, F.; Chaufray, J.-Y.; Brain, D.; Leclercq, L.; Esteban-Hernández, R.; Chanteur, G.; Weill, P.; et al. Mars-solar wind interaction: LatHyS, an improved parallel 3-D multispecies hybrid model. J. Geophys. Res. Space Phys. 2016, 121, 6378–6399. [Google Scholar] [CrossRef] [Scilit]
- Lindsay, B.G.; Stebbings, R.F. Charge transfer cross sections for energetic neutral atom data analysis. J. Geophys. Res. Space Phys. 2005, 110, A12213. [Google Scholar] [CrossRef] [Scilit]
- Wilson, L.B., III; Stevens, M.L.; Kasper, J.C.; Klein, K.G.; Maruca, B.A.; Bale, S.D.; Bowen, T.A.; Pulupa, M.P.; Salem, C.S. The statistical properties of solar wind temperature parameters near 1 au. Astrophys. J. Suppl. Ser. 2018, 236, 41, Erratum in Astrophys. J. Suppl. Ser. 2023, 269, 62. https://doi.org/10.3847/1538-4365/aab71c. [Google Scholar] [CrossRef] [Scilit]
- Verscharen, D.; Klein, K.G.; Maruca, B.A. The multi-scale nature of the solar wind. Living Rev. Sol. Phys. 2019, 16, 5. [Google Scholar] [CrossRef] [Scilit]
- Futaana, Y.; Chaufray, J.-Y.; Smith, H.T.; Garnier, P.; Lichtenegger, H.; Delva, M.; Gröller, H.; Mura, A. Exospheres and energetic neutral atoms of Mars, Venus and Titan. Space Sci. Rev. 2011, 162, 213–266. [Google Scholar] [CrossRef] [Scilit]
- Schultz, D.R.; Ovchinnikov, S.Y.; Stancil, P.C.; Zaman, T. Elastic, charge transfer, and related transport cross sections for proton impact of atomic hydrogen for astrophysical and laboratory plasma modeling. J. Phys. B At. Mol. Opt. Phys. 2016, 49, 084004. [Google Scholar] [CrossRef] [Scilit]
- Schultz, D.R.; Wang, R.; Stancil, P.C.; Cariatore, N.D. Data for proton transport through atomic hydrogen environments: Elastic scattering. At. Data Nucl. Data Tables 2023, 154, 101601. [Google Scholar] [CrossRef] [Scilit]

Disclaimer/Publisher’s Note: The statements, opinions and data contained in all publications are solely those of the individual author(s) and contributor(s) and not of MDPI and/or the editor(s). MDPI and/or the editor(s) disclaim responsibility for any injury to people or property resulting from any ideas, methods, instructions or products referred to in the content. |
© 2026 by the authors. Licensee MDPI, Basel, Switzerland. This article is an open access article distributed under the terms and conditions of the Creative Commons Attribution (CC BY) license.