


Highlights
What are the main findings?
- We present a long-term remote sensing assessment of the dynamics of forest landscape disturbances in the Athabasca oil sands region of Canada by combining 41 years (1984–2025) of data from the Landsat series.
- Our results demonstrate significant forest cover loss within the study area, an expansion of open-pit mining operations, limited forest reclamation efforts, and, critically, ongoing surface water quality degradation in the Athabasca River.
What are the implications of the main findings?
- The results indicate that mining operations in the Athabasca oil sands region are increasing at a faster rate than previous optimistic projections, intensifying pressure on the surrounding boreal forest ecosystems.
Abstract
Monitoring the long-term cumulative impacts of industrial mining and environmental changes in sensitive ecosystems remains a critical challenge for sustainable resource management. This study investigates 41 years (1984–2025) of land use and land cover (LULC) dynamics in the Athabasca oil sands region (Alberta, Canada) using the historical Landsat archive (TM, ETM+, and OLI). The methodology integrated temporal and spectral features through two complementary phases: automated spectral trajectory-based change detection and a Support Vector Machine (SVM) classification combining original bands with multiple spectral indices, including normalized difference vegetation index (NDVI), soil adjusted vegetation index (SAVI), enhanced vegetation index (EVI), transformed difference vegetation index (TDVI), bare soil index (BSI), and Modified Normalized Difference Water Index (MNDWI). This framework quantified baseline LULC, mining expansion, tailings pond footprints, and reclamation operations across a 12,146-km2 study area. The spectral trajectory analysis effectively tracked multiple temporal disturbances, revealing accelerating mining activities alongside forest harvesting, wildfire stress, and insect damage. Additionally, it captured progressive and significant spectral variations in the Athabasca River’s surface water, reflecting cumulative industrial runoff and long-term environmental pressure. Concurrently, the SVM classifications (Overall accuracy ≥ 96.8% and Kappa coefficient ≥ 94%) measured major LULC shifts. Dense coniferous forests declined by 1200 km2, while mixed forests decreased from 4500 km2 in 1984 to a minimum of 1200 km2 in 2010, before recovering to 3040 km2 by 2025 due to reclamation efforts. Conversely, active mining infrastructure and tailings ponds expanded from 95 km2 (1984) to 900 km2 (2025), occupying 7.41% of the landscape. Ultimately, this integrated remote sensing approach captured the complex interactions between accelerating industrial development, climate stressors, and the localized progress of land reclamation, providing a scalable framework for ecosystem monitoring in heavily disturbed landscapes.
1. Introduction
Forest landscape disturbance dynamics are driven by various factors, including deforestation, agriculture, urbanization, climate change, and anthropogenic perturbations such as industrial mining and petroleum operations [1,2,3]. These factors are critical drivers affecting ecological systems and land cover change [4,5]. Accurate inventory of change in forest resources is essential for climate change effects assessment and the estimation of carbon stocks and sequestration in biomass and soils, as the forest environment plays a significant role in the global carbon budget [6,7,8,9]. Furthermore, forest management and land-use land-cover (LULC) changes significantly affect environmental, ecological and health parameters, including biodiversity, soil and air quality, water resources (surface and groundwater), and economic aspects [10,11]. Information on spatiotemporal changes in forestry is used to derive indicators of landscape and ecosystem status to assess impacts at regional and national scales [12]. In Canada, where forest area is a key indicator of environmental health and sustainable development, monitoring changes in forest cover is critical to assessing potential impacts on wildlife habitat, recreational opportunities, and ecosystem services [13,14,15,16]. Moreover, the Canadian boreal forest is an essential natural resource for climate regulation, permafrost preservation, carbon sequestration, and biodiversity, while also supporting local economies through sustainable wood products and providing a home for Indigenous and rural communities [17,18,19].
Situated in the heart of the boreal forest on the banks of the Athabasca River, northern Alberta’s Athabasca region is one of the most significantly modified landscapes in Canada. It is characterized by boreal forests on gently rolling plains, interspersed with vast wetlands [20,21]. Historically, climate change and natural disturbances, such as fires and insect infestation, have been the primary drivers of forest succession in this region [22,23]. Additionally, soil disturbances in these ecosystems directly affect landscape composition, including wetlands, herbaceous vegetation, and forest species. Agricultural practices, deforestation, urbanization, and industrialization further alter hydrological processes, ecosystem productivity, evapotranspiration, soil infiltration, and runoff [10]. Decades of oil sands mining have severely impacted local populations and ecosystems [24,25]. This environmental degradation is driven primarily by artificial tailings ponds located near critical water resources. These permeable basins store sand contaminated with toxic elements, polycyclic aromatic hydrocarbons, and heavy metals [26]. Consequently, these migrating toxins systematically degrade the surrounding boreal forest and wildlife habitats [27]. Moreover, they contaminate groundwater, emit greenhouse gases, degrade air quality, and encroach on Indigenous territories [22,28,29]. The long-term legacy of these environmental effects extends well beyond the lifespan of mining operations and represents some of the most difficult problems facing industry and regulatory bodies [24,30,31]. Assessing these effects is a critical aspect of sustainable development and natural resource management. Recently, the tension between the economic interests of the mining industry and environmental protection has intensified, necessitating reliable information to balance economic benefits against the risks of environmental degradation [32,33,34]. Ultimately, achieving an appropriate balance depends on a thorough assessment of the environmental impacts resulting from industrial mining developments.
Notably, the boreal forests of the Athabasca are under intense pressure from the oil sands industry. Driven by increasing global demand, large-scale industrial development for the extraction, processing, and transportation of petroleum products has accelerated since 1967 [35]. These industrial activities require intensive land use and high-water consumption, polluting the environment through exhaust fumes and leaks from settling ponds. These practices, combined with natural factors, lead to vegetation disruption, deforestation, hydrocarbon spills in the soil and waterways, and drastic topographical changes, complicating restoration efforts [36]. According to Lucas et al. [37], changes in the Athabasca can be gradual, seasonal, or abrupt. Gradual changes reflect vegetation disturbances caused by pollutant inputs or insect infestations [38,39]; seasonal changes are linked to the phenological cycle of vegetation and climate variability [40], while abrupt changes are often caused by forest harvesting, wildfires, mining, or urban expansion [23,41]. Consequently, managing these post-industrial environments presents major challenges, including restoring ecosystem integrity, biodiversity, and functionality. Land restoration is a critical aspect of responsible industrial development, as these activities result in profound landscape transformations that disrupt regional ecosystems, hinder forest development, and risk causing irreversible environmental damage [21]. In these oil sands regions, the assessment of environmental impacts has been the subject of numerous studies using in situ, aerial, and satellite observations. These studies have focused on the input of pollutants and trace elements from operations and their impact on wildlife, aquatic systems, and surrounding vegetation [42,43,44].
Although in situ observations and measurements are the most accurate, their spatial coverage is often insufficient to improve diagnoses and predictions in forest environments. Usually, satellite observations combined with temporal in situ measurements allow the extraction of reliable information on the impacts of climate, human footprint, and industrial development. In fact, satellite remote sensing offers remarkable potential for monitoring large areas due to the synoptic nature of the data and readily available archives of imagery. It enables major advances in understanding environmental impacts by quantifying spatiotemporal processes and states of land use, water quality, energy flux, photosynthesis, phenology, leaf area index, and forest disease [45], which cannot be detected by modelling or conventional in situ observations alone. Undoubtedly, remote sensing science and technology can effectively detect spatiotemporal variables related to trends and patterns specifically arising from industrial mining. By enhancing our knowledge of these impacts, these technologies support the development of prevention, adaptation, and mitigation scenarios for the sustainable development of the forest environment [46]. For instance, remote sensing provides industries and government agencies with effective methods to monitor active, abandoned, or rehabilitated mining sites. It enables the evaluation of pre-existing ecosystem variables, such as land cover, soil, water, and vegetation, providing key indicators to assess ecological consistency with previous conditions. Specifically, Gillanders et al. [47] demonstrated the importance of Landsat satellite imagery for monitoring land cover changes to quantify and distinguish different cover classes before land alteration and subsequent reclamation. Using NOAA-AVHRR imagery, Latifovic et al. [48] highlighted the impact of air temperature variations on vegetation cover surrounding mining operations. Furthermore, Thompson et al. [49] employed MSS data to monitor vegetation water stress caused by air pollutants near oil sands sites in Alberta. Ultimately, this technology plays a fundamental role in monitoring restoration activities by detecting environmental impacts caused by the mining industry. Indeed, many operations follow detailed plans to restore sites to their previous state, often incorporating remote sensing into their post-closure monitoring [50].
As a research hotspot in remote sensing, LULC changes detection has seen continuous development of methods and applications across a wide range of practical situations, including post-disaster assessment and land resources management [51,52,53]. Tracking and understanding these changes across vast territories at varying spatiotemporal scales is vital for resource management and decision-making [12]. To achieve this using multi-temporal satellite data, Lunetta et al. [54] emphasize three key factors for change detection: scale, complexity, and temporal frequency. These factors are essential for addressing phenology-induced errors and varying ecological regeneration rates. Grasping these aspects facilitates the selection of appropriate datasets and analytical approaches. With a record now exceeding 50 years and medium spectral, spatial, and radiometric resolutions, Landsat series sensors remain the most suitable space technology for detecting LULC changes at the level of medium-sized plots. Meanwhile, Kennedy et al. [51] provide a framework where change detection methods must meet two fundamental goals. First, methods need to better characterize long-term trends, for example, by leveraging data acquired by sensors onboard the Landsat platforms for more than half a century [39,55,56]. Second, automating change detection is essential for monitoring large areas; it reduces thresholding errors and separates real changes from spectral variability caused by geometric misregistration, variations in illumination and acquisition angles, and seasonal differences [57]. Accordingly, Kennedy et al. [51] proposed a method to automate the monitoring of changes in the forest environment by searching for ideal temporal signatures in a dense stack of Landsat imagery.
This approach relies on the principle that land-use changes alter spectral-temporal trajectories, creating distinct signatures before and after a change event. Specifically, these disturbances manifest as characteristic temporal signatures in the first shortwave infrared (SWIR1) band, corresponding to band 5 for Landsat TM/ETM+ and band 6 for OLI. This method laid the foundations for the “LandTrendrˮ (Landsat-based Detection of Trends in Disturbance and Recovery) algorithm [58], which introduced a flexible temporal segmentation approach utilizing spectral indices instead of the SWIR1 band, and continues to be refined [59]. Rather than detecting “pixel-wise” changes between discrete acquisition dates, the proposed method identifies target signatures across the complete temporal trajectory of spectral values. If an area aligns with the reference profile according to a temporal regression fit, it likely reflects the phenomenon captured by that trajectory. Since the entire trajectory sequence is considered, the method leverages the full depth of image archives to fit curves to each pixel’s history [51]. Furthermore, because detection is based on this curve fitting, thresholding is internally calibrated for each pixel rather than relying on arbitrary user-defined thresholds.
In this article, we examined the impacts of oil sands mining on LULC changes in the Athabasca region over a 41-year period (1984–2025) using Landsat time-series data. We identified and quantified initial land-use classes prior to their conversion and tracked their evolution over time. Our analysis focused on vegetation dynamics, soil and water pollution, mine tailings, and the implementation of restoration and rehabilitation operations. These objectives were achieved by analyzing images acquired by TM, ETM+, and OLI sensors on Landsat satellites. To achieve these objectives, our methodology combined temporal and spectral features through two distinct yet complementary analytical phases. First, we applied the automated spectral trajectory-based change detection method developed by Kennedy et al. [51]. This method leverages image archives based on the observation that LULC changes exhibit distinct temporal evolutions both before and after a change event, generating characteristic trajectories in spectral space. Second, several indices, including NDVI, SAVI, EVI, TDVI, BSI, and MNDWI, were derived and integrated with the original spectral bands in a support vector machine (SVM) supervised classification process to quantify LULC changes in km2 across the study site between 1984 and 2025.
2. Materials and Methods
This study evaluates the dynamics of forest landscape disturbances in Canada’s Athabasca oil sands region caused by the mining industry over nearly four decades. To achieve this, it exploits the synergy between the spectral trajectory-based change detection method and the support vector machine algorithm. Figure 1 presents the methodological framework, consisting of five interrelated steps. First, we verified the quality assurance of the downloaded L2SP imagery, including radiometric calibration, atmospheric corrections, and geometric registration. Second, 30 sampling locations representing the major LULC classes in the study area were selected for spectral and trajectory-based change detection analyses. Third, six spectral indices normalized difference vegetation index (NDVI), soil adjusted vegetation index (SAVI), enhanced vegetation index (EVI), transformed difference vegetation index (TDVI), bare soil index (BSI), and modified normalized difference water index (MNDWI) were computed to highlight discrimination among classes, including vegetation covers, wetlands, open water (lakes and rivers), bare soils, and mining wastes. Fourth, these indices were integrated into an SVM classification to analyze land-use change and environmental disturbances associated with mining activities. Finally, we calculated the total area (in km2) of LULC categories affected by expanding mining activities, as well as the potential for rehabilitation and restoration from 1984 to 2025. Note that all our processing steps were carried out using the Canadian PCI-Geomatica (2014) image processing system.
Figure 1.
Methodology flowchart.
2.1. Study Area
Considered the third-largest oil reserve in the world after Saudi Arabia and Venezuela, the Athabasca oil sands deposits of Northeastern Alberta cover approximately 140,000 km2 (Figure 2). In this region, the three major deposit areas are Athabasca, Cold Lake, and Peace River. Approximately 80% of the available bitumen is located in the Athabasca oil sands area, north of Fort McMurray [60]. These deposits of bitumen consist of a viscous form of petroleum that requires heat or dilution with lighter hydrocarbons to flow [61,62]. The majority of the reserves are contained in the “Lower Cretaceous McMurray Formation”, which consists of a continental sequence of uncemented sands and shales overlying a Devonian limestone surface. According to Sparks et al. [61], about 10% of the bitumen in this deposit is considered economically recoverable using conventional mining methods. The open-pit mining areas are located in the Athabasca River valley, north of Fort McMurray (Municipality of Wood Buffalo), where Cretaceous formations have been eroded so that the oil sands are found less than 50 meters below the surface. The remaining 90% of the deposit is too deep to be exploited via open pits and requires steam injection processes, which makes the oil extracted from Alberta bitumen sands economically viable [63].
Figure 2.
Study area: the Athabasca-McMurray oil sands, Alberta, Canada.
Furthermore, the Athabasca oil sands region is located in the Boreal Plains ecozone, which is composed of three ecoregions: the Wabasca Lowlands, the Slave River Lowlands, and the Boreal Highlands [64]. Characterized by rich and fertile soils, diverse ecosystems, and extensive wetlands, the region’s vegetation cover consists of mixed forests of varying density, ranging from medium to very dense stands. Tree species include white spruce (Picea glauca), black spruce (Picea mariana), balsam fir (Abies balsamea), aspen (Populus tremuloides), balsam poplar (Populus balsamifera), jack pine (Pinus banksiana Lamb.), and tamarack (Larix laricina [Du Roi] K. Koch). Additionally, fens and bogs with tamarack and black spruce are common throughout the region [47,65]. The region is also defined by its sub-humid and subarctic climate, prevalent Brunisolic and Luvisolic soils, and both natural and anthropogenic disturbances [66]. The Athabasca and Clearwater Rivers, as well as McClelland and Kearl lakes, define the main bodies of open water that sustain this ecosystem.
As for the region’s human landscape, according to the 2025 municipal Census, the Athabasca and McMurray regions had a population of 107,740, of whom 10% identified as Indigenous. Industrial operations significantly alter both the land and community. Figure 3 illustrates the ecological and environmental impacts of the oil sands mining industry in Athabasca. In addition to air quality degradation, these impacts include the expansion of oil extraction facilities (Figure 3a), open-pit mining sites (Figure 3b), and the destruction of forest cover (Figure 3c). Moreover, mining activities cause the pollution of surface waters (Figure 3d) and groundwater, which ultimately degrades the living conditions and health of benthic invertebrates, birds, fish, and other wildlife (Figure 3e).
Figure 3.
Ecological and environmental impacts of oil sands mining in Athabasca region, showing (a) the mining industry overview, (b) an open-pit mine site, and the resulting impacts on (c) forests, (d) water resources, and (e) wildlife (Public domain images accessed via Google).
2.2. Landsat Data
Managed by NASA and the USGS, the U.S. Landsat program provides the world’s longest continuous historical record of Earth-surface observations from space, offering medium-resolution imagery on a seasonal basis for more than five decades. Since 1972, archived data from Landsat sensors, including the MSS, TM, ETM+, and OLI, have been utilized across disciplines to better understand land surface changes and the environmental impacts of climate and human activity [67,68,69,70]. The evolution of the Landsat satellite series represents a steady, five-decade progression from basic multispectral imaging to highly sensitive, advanced radiometry [71,72,73,74,75,76,77,78].
In the present study, twelve images acquired by three different sensors (TM, ETM+, and OLI) were utilized. Because the spectroradiometric values of the images depend heavily on phenological conditions, particularly in mixed forests, it was necessary to limit the influence of seasonal variations in vegetation cover. Consequently, summer images were selected within a window between 23 July and 24 September, with maximum phenological development of vegetation cover, at approximately four-year intervals to detect, map, and evaluate the environmental impact of oil sands and LULC changes in northern Athabasca between 1984 and 2025. These images are cloud-free or have minimal cloud cover (less than 5%), with any minor clouds restricted to the outer boundaries of the study site. Furthermore, the data are largely unaffected by cirrus and free from topographic shadow effects due to the region’s minimal relief. Table 1 summarizes the basic characteristics of these scenes, which were downloaded from the USGS website as L2SP products. Note that images marked with an asterisk (*) were mosaicked from three individual scenes to cover the entire study area.
Table 1.
Landsat Images used in this study. (* Image mosaic generated from three images across two distinct orbits).
2.3. Data Preprocessing
The images acquired by TM, ETM+ and OLI are preprocessed into Level-2 (L2SP) products by USGS. This means the raw digital numbers were converted to the apparent reflectance at the top of the atmosphere (TOA) using gain, offset, extra-atmospheric irradiance, solar zenith angle and Earth–Sun distance (i.e., radiometrically calibrated). Then corrected for atmospheric effects, including scattering and removal of haze, clouds and water vapor, thus converting the apparent reflectances at the TOA into usable ground surface reflectance products for direct processing, allowing consistent long-term change detection. Moreover, the images were projected in the UTM coordinate system using the WGS84 geodetic reference and were geometrically corrected and orthorectified using ground control points (GCPs) and a digital elevation model (DEM) to correct topographic variations, making them suitable for pixel-level time series analyses. According to Markham et al. [79] and Crawford et al. [80], the Committee on Earth Observation Satellites (CEOS) certified that these L2SP products are Analysis Ready Data (CEOS-ARD).
Theoretically, these corrected images should appear as if they had been acquired with the same sensor under identical atmospheric conditions, illumination, and acquisition geometry [81]. However, although the images were Level-2 surface reflectance products (L2SP) ready for processing, we analyzed their spectroradiometric quality because several factors likely introduced minor spectroradiometric differences. These factors included differing spectral response profiles among the sensors (TM, ETM+, and OLI), nominal spectral differences between homologous bands, varying illumination geometries, and changing phenology (images acquired between 23 July and 24 September). Therefore, the coefficient of variation (CV = ), which measures relative variability and data homogeneity, was used to allow comparison between different uniform regions of our datasets in this analysis step. The results show that regardless of the spectral band analyzed, the recording sensor, or the acquisition period, CV values range between 2% and 5.5%, demonstrating excellent image calibration and data homogeneity. These CV values are significantly lower than the average total errors propagated and associated with Landsat preprocessing steps discussed above, which typically range from 5% to 10% depending on atmospheric conditions [81,82,83]. Moreover, Markham and Helder [84] noted that the 40-year history of Landsat data has shown consistent calibration with total uncertainties of approximately 10% or less across most sensors and bands.
Furthermore, considering that Earth’s natural surfaces do not exhibit a Lambertian spectral behavior, solar and observing zenith angles introduce angular variations in surface reflectances, known as the bidirectional reflectance distribution function (BRDF) effect. The Landsat series sensors (TM, ETM+, and OLI) are strictly nadir-aligned, meaning their optical axes point directly toward the center of the Earth (with a nominal viewing angle near 0°). Because of this narrow swath, these BRDF effects result in relatively minor reflectance variations, typically less than 6% from the image center to the edge [85]. To normalize the BRDF influence on ground surface reflectance images, a semi-empirical approach based on acquisition geometry was proposed by Qi [86]. However, Roy et al. (2016) [85] demonstrated that seasonal shifts in the solar angle led to an artificial, continuous drift in SWIR reflectance that can reach 0.02 to 0.04 in absolute value over an entire time series. Despite this, when evaluating overall error propagation, these angular effects are often overshadowed by other uncertainties. Specifically, atmospheric correction algorithms generally estimate parameters (such as aerosol optical depth) on a band-by-band basis or across coarse spatial grids, rather than resolving the true micro-variations in a heterogeneous atmosphere on a pixel-by-pixel level. Combined with sensor absolute radiometric calibration errors [79] and these atmospheric correction residuals [87], the relative impact of BRDF noise remains comparatively minimal.
Additionally, sensitivity to geometric misregistration among homologous pixels is a weakness of trajectory-based change detection methods; however, rigorous geometric registration obviously improves overall accuracy. Fortunately, misregistration can largely be overcome with sophisticated geometric correction methods [88]. For instance, according to Storey et al. [89] and Yan and Roy [90], the geometric quality and geolocation accuracy of the L2SP product are less than 4.1 m, while the achieved geometric RMSEs across all images (as indicated in metadata files) are less than or equal to 4.5 m. Furthermore, our geometric analyses across all considered images and homologous band pairs demonstrated very slight spatial variability, caused by geometric and topographic distortions, ranging from 2.5 to 4.1 m (less than 0.13 pixels). This is a highly satisfactory level of accuracy for trajectory change detection [91] and multi-sensor data analysis over time [88].
2.4. Spectral Indices
Since the emergence of remote sensing as a new discipline in the early 1970s, vegetation indices (VIs) have been developed as spectro-radiometric measurements of the spatial and temporal distribution of photosynthetically active vegetation [92]. Using the red and NIR bands, the NDVI was proposed by Rouse et al. [93] at the dawn of remote sensing. To minimize the effects caused by soil background (color and brightness) on the NDVI, the SAVI was suggested by Huete [94]. Moreover, to overcome the limitations of linearity and saturation, reduce the noise of atmospheric effects, and remove the artefacts of soil optical properties, the EVI was also developed by Huete et al. [95]. Furthermore, to describe the vegetation cover fraction independently of the soil background, to reduce the saturation problem, and to enhance the vegetation dynamic range linearly, Bannari et al. [96] established the TDVI.
Furthermore, several soil-specific indices have been proposed in the literature to distinguish bare soils from other land-use classes [97]. Rikimaru et al. [98] proposed the BSI to enhance the detection of exposed bare soil, particularly within the context of forest canopy mapping. This index was frequently used to identify uncultivated built-up areas and to map, inventory, and classify bare soil properties [99,100,101]. Moreover, it was used for excavation detection and monitoring mining activities [102], distinguishing open-pit areas from other land-use types, while also enabling the detection of waste dumping sites and disturbed land [103].
Additionally, Gaos [104] formulated the NDWI for total liquid water content within the soil-vegetation system and drought monitoring, exploiting the NIR and SWIR1 bands. While, McFeeters [105] NDWI was proposed to delimit areas of open water bodies and improve their visibility. This version was improved by Xu [106] to the Modified Normalized Difference Water Index (MNDWI), replacing the NIR band used in the NDWI with a SWIR1 band. According to Cheng et al. [103], MNDWI successfully highlights water bodies and tailings ponds within mining areas. The MNDWI and NDVI were combined for monitoring and analyzing temporal changes in mining sites in Alberta (Canada) and the tailings dam site in Brumadinho (Brazil). This integrated approach supports effective monitoring and decision-making in the mining industry and provides quantitative guidance for the safe operation and closure of mine sites [107]. These six indices (NDVI, SAVI, EVI, TDVI, BSI, and MNDWI) were selected for consideration in the present study.
BSI = [(ρSWIR1 + ρRed) − ( ρNIR + ρBlue)]/[(ρSWIR1 + ρRed) + ( ρNIR + ρBlue)]
2.5. Support Vector Machine
In tandem with innovations in remote sensing technology, numerous image processing methods and algorithms have been developed to advance thematic mapping. Although many supervised classification methods exist, the Support Vector Machine (SVM) has gained significant prominence. Originally rooted in the Generalized Portrait Method proposed by Vladimir N. Vapnik in 1964 at the Institute of Control Sciences, this early framework served as the precursor to modern SVM architecture [108]. Today, SVM is widely utilized across machine learning applications for its robust capacity to handle both linear and nonlinear classification. When datasets are not linearly separable, radial basis functions (RBFs) transform the data into a higher-dimensional space to enable linear separation. This adaptability yields highly balanced predictive performance across diverse applications [109,110]. Based on statistical learning theory, SVM makes no assumptions about data distribution; instead, it employs an iterative search for an optimal decision boundary (hyperplane) to separate training data in an N-dimensional space [111].
In a complex mining environment, SVM has repeatedly outperformed alternative classification methods. For instance, the algorithm has demonstrated superior efficacy in mapping land use within open-pit quarries [112] and has accurately identified opencast iron mines and solid waste using medium spatial resolution imagery [113]. Additionally, Karan and Samadder [114] found that SVM provided the highest accuracy when monitoring the temporal evolution of open-pit coalmines. When integrated with multi-temporal change detection, the algorithm enables precise monitoring of both active surface mining and subsequent reclamation efforts [115]. To address the computational complexities of massive remote sensing datasets, Li and Narayanan [116] successfully developed an integrative SVM approach tailored specifically for mapping mining waste. More broadly, the literature underscores SVM’s high classification accuracy when processing medium-resolution data characterized by high-dimensional feature spaces [117,118,119,120]. Given these proven capabilities, SVM was selected as the primary classification method for this study. The classification framework integrated six derived indices with the six original spectral bands. Training sites for the major classes (Section 2.4) were rigorously selected, and classification was implemented following a standard procedure that assumed equal a priori probabilities. To ensure strict pixel classification, a 90% probability threshold was applied; only pixels meeting or exceeding this threshold were assigned to a class, while all others were rejected.
In the present study, to discriminate forest species from other land cover classes, including water, bare soil, and mining operations, the RBF kernel SVM classifier was trained. To neutralize the effect of extreme spectral profiles from mines and water on forest dynamics, the variables were normalized using a RobustScaler. Class skewness was corrected by applying class weights inversely proportional to their frequency. Optimal hyperparameters were determined through grid search coupled with cross-validation, identifying the combination (C = 100 and γ = 0.01) as offering the best compromise. Finally, hyperplane distances were converted into calibrated probabilities using isotonic regression.
2.6. Trajectory-Based Change Detection
In this study, we adapted an approach from Kennedy et al. [51] to analyze land-use dynamics related to mine development and rehabilitation. Spectral trajectories were derived for each sampling location from the SWIR1 band reflectance of geometrically and radiometrically normalized image stacks. The efficacy of this spectral region is well documented for soil and forest cover characterization [121,122,123], land-use change detection [47,51], and fire severity assessment [121,124]. It reliably discriminates between mature forests and exposed bare soil [125,126], maps coniferous forest structure and condition [55,127], and is sensitive to canopy moisture, foliage greenness, and photosynthetic activity [128]. Furthermore, it is highly sensitive to variations in chlorophyll and woody biomass properties [129], and effectively distinguishes between herbaceous and shrub vegetation [130].
For each hypothetical time trajectory, initial shape parameters were estimated at each sampling location and fed into a fitting function to optimize the alignment between hypothetical and observed trajectories. These trajectories represent temporal transitions corresponding to major disturbances and active rehabilitation. By comparing each location’s trajectory against seven predefined disturbance curves (Figure 4) using statistical fitting routines, we predicted the most closely resembling scenario to define the local disturbance regime. These scenarios successfully capture a diverse range of landscape conditions and transitions. For instance, stable vegetation maintains consistent spectral trajectory over time (Figure 4a), whereas mine-induced disturbance appears as an abrupt, step-like increase in SWIR reflectance due to the removal of low-reflectance vegetation and the exposure of bare soil, gravel, and rock (Figure 4b). Conversely, active revegetation is represented by long rehabilitation trajectories (Figure 4c), and mining disturbances followed by progressive recovery show initial sparse growth developing into dense, stable vegetation over time as waste materials decrease (Figure 4d). In addition to direct clearing, vegetation near mining operations frequently experiences stress and stunted growth driven by soil, air, or water contamination (Figure 4e,f). Finally, adjacent water bodies reflect pollution and tailings disposal impacts resulting from mining and industrial activities (Figure 4g).
Figure 4.
Seven spectral trajectories representing different land-change scenarios related to the development and rehabilitation of mining activities in the Athabasca Oil Sands region (Adapted from Kennedy et al. [51]).
2.7. Sampling Locations Selection
For sampling locations where trajectory change detection was implemented, a reference map of land-use classes was established using the earliest Landsat-TM image (1984) and SVM classification (Figure 5). Existing ancillary data, historical vegetation maps [131], and the work of Gillanders et al. [47] supported this process. In addition to the six spectral bands, six indices (NDVI, SAVI, EVI, TDVI, BSI, and MNDWI) were integrated into the classification to improve spectral discrimination among vegetation cover, wetlands, open water, bare soil, and mining waste.
Figure 5.
Thematic map of our study area based on 1984 TM-image classification, showing the extent of main land cover classes and sampling site positions used for spectral trajectory change detection.
The 30 locations selected across the study area are displayed in Figure 5. These represent various LULC classes, including dense coniferous, dense broadleaf, and both open and dense mixed forests, as well as wetland shrubs, bare soil, exposed mine land, water (rivers and lakes), and reclaimed areas. Additionally, areas of mining activity, tailings, claims, and revegetated sites were selected based on known historical activity in the imagery time series and the presence of distinct spectral signals from relatively unmixed pixels. For water sampling, eight locations were chosen along the main river passing through the middle of the study area. One was located mid-river near mining activities, while three others were situated upstream, downstream, and at the southern junction of two watercourses (the Athabasca and Clearwater rivers). Additionally, four other locations were sampled: one from a secondary watercourse southeast of the site, one from the center of a lake, and two representing clear and polluted water conditions. Regarding vegetation cover, samples were picked on both sides of the river at varying distances to assess the impact of mining on the forest and rehabilitation processes. The collection included three samples of dense mixed forest, five of dense broadleaf, one of open broadleaf, one of sparse conifer, and five of dense conifer. Finally, two other samples were added, one from a shrubby wetland and another from a tailings pond. All these sampling locations were compiled into a shapefile within a GIS environment to accurately define their spatial reference for subsequent trajectory analyses.
3. Results and Analysis
Landsat time-series imagery reveals the spatiotemporal expansion of surface mining operations within the northeastern Alberta oil sands region over a 41-year period from 1984 to 2025, with substantial development starting from 2001 onward (Figure 6). The distinct contrast between active mining and the surrounding boreal forest environment facilitates easy detection, highlighting the efficacy of Landsat data for long-term monitoring. Open-pit mining requires the wholesale removal of boreal forest canopy and organic overburden to expose underlying geologic strata, manifesting in the imagery as highly reflective, irregularly shaped, light-grey terraced excavations. Following excavation, bitumen is extracted by mixing the oil sands with hot water to form a slurry; gravitational separation then isolates the heavy sand at the bottom, leaves fine clay and water suspended in the middle, and allows aerated bitumen to float to the surface. Once the bitumen is skimmed, the remaining wastewater and fine solids are discharged into tailings ponds. In the satellite imagery, these ponds appear as large, smooth expanses ranging from dark-brown to black colors, bounded by highly contrasting, light-beige borders of artificial containment dikes constructed from coarse silica sand and gravel (Figure 6).
Figure 6.
Time series of twelve Landsat images (RGB: NIR, SWIR1, SWIR2) used in the present study, acquired between 1984 and 2025 over the Athabasca-McMurray oil sands region.
Figure 5 presents the thematic LULC map of the study area, derived from baseline imagery acquired in 1984 by the Landsat-TM sensor. SVM classification was performed using historical auxiliary data, including the regional vegetation cover map established by Reid and Sherstabetoff [131], and supported by the ecological descriptions outlined by Gillanders et al. [47]. The map delineates distinct classes: dense conifer and broadleaf (trembling aspen) forests, open and dense mixed-wood forests (balsam poplar and white spruce), wetlands, shrubs, and a dominant mixed vegetation class. East of the river system and the primary mining footprint, dense conifer stands, predominantly composed of jack pine (Pinus banksiana), white spruce (Picea glauca), and black spruce (Picea mariana), constitute the primary landscape cover. The open water class delineates the Athabasca and Clearwater Rivers, as well as McClelland and Kearl lakes. Finally, two classes, representing early-stage mining operations and the initial tailings ponds, capture anthropogenic landscape modifications. This classification, and in parallel all other SVM classifications, was completed with an overall accuracy of ≥96.8% and a Kappa coefficient of ≥94% by measuring the main land cover changes. Errors of commission and omission occurred during transitions between forest classes because mixed forests combine regeneration layers (young shoots on recolonized former mining sites) with mature, dense canopies. Consequently, the SVM occasionally struggles to define a clear hyperplane between these subclasses of varying leaf density. Additionally, minor commission errors in the water class stem from spectral confusion with peatlands and wetlands containing standing water. Despite these localized variations, overall user and producer accuracies remain satisfactory (>93%).
The 30 sampling locations used to extract the spectral trajectories are displayed in Figure 5, representing distinct land cover classes. These sites were selected based on their continuous presence throughout the image time series and the various mining development and rehabilitation scenarios illustrated in Figure 4. Spectral trajectories were then generated from homogeneous and nearly pure pixels. Based on these profiles, the trajectories were classified into seven categories that match ground-truth observations across the 41-year study period: stable, stressed, modified, and rehabilitated forest sites, alongside stable, polluted, and completely transformed water sites.
3.1. Trajectories of Forest Sites (Stable and Stressed)
As expected, the method successfully captured abrupt disturbances, areas of relative stability, and ongoing rehabilitation processes. Temporal positions and spectral values of the spectral trajectory’s starting and ending vertices provide essential information regarding LULC changes in the 30 sampling locations. Figure 7 illustrates representative spectral trajectories of stable and stressed forest sites obtained from the analyzed image stack. The mixed dense forest site (25) and wetland-shrubs site (7) are located on either side of the Athabasca River, far from mining activities. Both sites are characterized by relative temporal stability over the 41 years of analysis (Figure 7a). The slight variations observed could be attributed to phenological differences, as images were acquired in mid-September in 1987, 1995, and 2009, whereas the remaining images were recorded in July and August.
Figure 7.
Spectral trajectories of stable (a) and stressed forest (b) sites, (a), and spectral signatures of stressed forest sites (c,d).
Additionally, the forest area-surrounding site 25 was harvested in 1989, making it more exposed to dust from forest harvest operations and pollution from nearby mining activities. As evidenced in the 1989 imagery (Figure 6), this clear-cutting operation severely altered dense conifer sites (12 and 24) and the dense mixed wood site (19). This disturbance induced a strong spectral trajectory deviation that lasted until 1995 (Figure 7b), followed by a period of slow natural regeneration between 1995 and 2000. Between 2000 and 2010, these same sites experienced progressive stress from insect damage (Figure 7b), as documented by Pouliot and Latifovic [39]. Fieldwork by these authors revealed that insect-driven tree mortality primarily affects coniferous forests, occurring mostly in the southeast near rivers or open areas, characteristics that directly match our study site.
Within the dense forest, several locations (sites 8, 12, 18, 19, and 24) exhibit clear signs of stress (Figure 7b); specifically, coniferous site 18 and mixed-forest sites 8 and 19 are experiencing significant environmental disturbances. Site 8 (similar to site 12), located south of the McClelland Lake wetland complex, and site 19, positioned in the southeast of the study area, have both become progressively encircled by mining activities. Their spectral trajectories reflect cumulative stress from mining pollution, shifting climate regimes, and secondary compounding effects. These include drought-induced hot summer winds, secondary fires, and insect infestations, all of which exert increasing pressure on northern natural ecosystems. Situated east of Fort McMurray near the Clearwater River, site 18 initially exhibited canopy densification between 1984 and 2008 before undergoing an abrupt successional shift in 2009. Subsequent disturbances in forest areas surrounding this site have included a massive infestation due to mountain pine beetle and a series of localized wildfires [132,133]. As a result, the spectral trajectory of site 18 captures the cumulative impact of these disturbances between 2008 and 2020, as well as a significant trend of natural post-fire regeneration extending through 2025 (Figure 7b).
Wildfires are an integral natural disturbance in the boreal forest biome; however, exacerbated by severe drought and driven by strong winds, the exceptionally intense May 2016 wildfire devastated the southwestern, southeast, and southern portions of the study area. Burn scars of varying dimensions are clearly visible in the southern portion of the 2017 imagery (Figure 6). In this false-colour composite, the scars are distinguished by pronounced blue and cyan tones, which contrast sharply with the surrounding healthy vegetation represented in shades of bright and dark brown. Notably, the expansion of this wildfire effectively surrounded the city of Fort McMurray, prompting a complete regional evacuation [23]. Located on the edge of the burned areas, sites 18 and 19 experienced convection currents driven by air superheated by the fire. Influenced by these combined anthropogenic and natural factors, the spatiotemporal spectral signatures of both sites reveal distinct, band-specific behaviors (Figure 7c,d). Specifically, pronounced fluctuations were observed in chlorophyll absorption within the red band, alongside remarked variations in NIR-derived biomass density (particularly for site 19), and SWIR-indicated canopy structure and moisture content. Moreover, the 1995 spectral profile reflects a historical environmental disturbance caused by a lightning-induced forest fire near site 18 [134].
3.2. Trajectories of Polluted Water Sites
Analysis of the eight selected water samples, whether extracted from rivers or lakes across the study area, revealed that none exhibited the spectral characteristics of uncontaminated water (Figure 8). Although located away from active infrastructure, a small lake north of the study area (site 28) exhibited a consistently high SWIR-1 signal (~12%). The relative stability of this signal between 1984 and 2020, prior to the lake’s eventual excavation for an open-pit mine, indicates that the water body was chronically impacted by surrounding mining waste throughout this 36-year period. Moreover, after the water has passed through mining areas for approximately 45 km, the three sites located furthest downstream (sites 27, 29, and 30) display unstable trajectories over time (Figure 8a), indicating persistent water quality degradation.
Figure 8.
Spectral trajectories (a) and spectral signatures (b,c) of polluted water sites.
Likewise, the four samples collected from the middle of the Athabasca River exhibited varying, yet significant, pollution levels (Figure 8a). These include sites 6, 13, and 14, situated in the center of the study area and flanked by mining activities on both banks, as well as site 10, located approximately 70 km downstream from the furthest extent of mining exploitation. Fluctuations in spectral response were most pronounced at sites 14 and 30. Site 14 exhibited sharp variations, particularly between 2005 and 2009, followed by a gradual decline from 2009 to 2017. Similarly, site 30 demonstrated high variability, most notably during 1985–1996 and 2005–2010 intervals. To provide an in-depth analysis of these sites’ dynamics over the 41-year study period, multi-temporal spectral signatures were generated using six spectral bands (Figure 8b,c). The resulting spectral signature curves do not reflect the typical signatures of clear water, algal absorption, or aquatic vegetation. Instead, reflectance increases toward the VNIR and SWIR regions, driven primarily by high turbidity. Typically, the primary distinction between the spectral signatures of pure and polluted water lies in how suspended contaminants alter light absorption, scattering, and reflection across different wavelengths.
Pure water typically absorbs nearly all electromagnetic radiation, exhibiting very low reflectance in the VNIR (~0.05) and dropping to near-zero in the SWIR. However, mining-related pollutants, including acid mine drainage, toxic elements from bitumen processing, and emulsified hydrocarbons, disrupt this characteristic signature. Hydrocarbons form surface films or emulsions that drastically alter the water’s optical properties. When coupled with high concentrations of suspended sediments, these pollutants induce intense light scattering across the VNIR spectrum, creating the irregular, arc-shaped profiles seen in Figure 8b,c. While individual diagnostic absorption features cannot be resolved due to the broad spectral resolution of Landsat bands, the physical presence of petroleum induces a significant macro-scale increase in the SWIR baseline reflectance. This results in unusual band values of around 0.14 in 2009 (Figure 8b), and around 0.12 for the other years. Indeed, hydrocarbons and toxic organic compounds can elevate broadband SWIR reflectance to this level depending on their physical state, thickness, and concentration. Theoretically, thick crude oils and heavy bitumen exhibit a baseline reflectance ranging between 0.10 and 0.20 in these spectral regions, whereas thin hydrocarbon films remain closer to 0.05 [135]. While these signatures are often dominated by sediment load, they also coincide with areas heavily impacted by industrial activities and potential hydrocarbon contamination. Ultimately, the contaminants highlighted in this analysis are highly consistent with the rising polycyclic aromatic hydrocarbon (PAH) levels observed in the region’s lake sediments [136], an issue historically exacerbated by the lack of an integrated regional environmental monitoring program.
3.3. Trajectories of Rehabilitated and Un-Rehabilitated Sites
As part of government rehabilitation mandates, exploited mining areas must be revegetated following the conclusion of extractive operations. This process typically involves capping disturbed areas with layers of uncontaminated sand and sediment before replanting with native species [137,138]. Spectral trajectory curves of six sites (1, 2, 4, 17, 23, and 26) indicate that rehabilitation occurred at various times between 1995 and 2025 (Figure 9a). Sites 2 and 26, originally characterized by very sparse mixed forest cover, have undergone natural densification over several decades. In contrast, sites 17 and 23 initially featured dense forest cover that was cleared for open-pit mining and subsequently revegetated; their rehabilitation sequences began in 2020 and 2005, respectively, as shown in the imagery of Figure 10 and the trajectories in Figure 9a. Sites 1 and 4, which both featured dense mixed forest in 1984, were converted into containment dikes (Figure 10) protecting a mine tailings spillway (small-scale for site 1; large-scale for site 4) before undergoing revegetation in 1995 and 2020, respectively. These results suggest that the current restored canopy density and spectral profiles are comparable to the baseline native state existing prior to industrial disturbance. Ultimately, these spectral trajectories successfully validate the a priori scenarios established in Figure 4d.
Figure 9.
Spectral trajectories of rehabilitated (a), and un-rehabilitated (b) sampling sites.
Figure 10.
Sampling locations for tracking significant historical LULC changes across the Athabasca oil sands region between 1984 and 2025 (i.e., the color of the small circles is solely to enhance visibility of sampling locations).
Furthermore, spectral trajectories (Figure 9b) and multi-temporal imagery (Figure 8) illustrate sites that underwent significant historical changes in LULC without subsequent rehabilitation. Initially dominated by lichens on rocky soil, site 11 transitioned to a mining area, then a tailings dike, and ultimately became a tailings pond around 2015. As previously noted, site 28 remained in its natural state from 1984 until 2020, after which it was excavated for a large open-pit mining operation (Figure 9b and Figure 10). Meanwhile, a majority of locations (sites 5, 9, 15, 16, 20, 21, and 22), initially covered by dense broadleaf, coniferous, and mixed forests, were progressively cleared for mining activities between 1984 and 2025. Site 5 transitioned to active mining in 1990, whereas sites 20 and 22 were transformed into tailings ponds in 2006. Site 16 became a tailings storage facility in 2010, and site 21 served as a tailings dike from 2010 to 2020 before transitioning into a tailings pond. Finally, sites 9 and 15 exhibited complex trajectories, initially operating as open-pit mines (1995–2020 and 2005–2016, respectively) before their eventual conversion into tailings ponds (Figure 9b and Figure 10).
3.4. LULC Areas in km2
The LULC dynamics and associated mining expansion within the study area from 1984 to 2025 are illustrated in Figure 11. A substantial expansion of mining sites and associated infrastructure occurred, including the development of tailings ponds and containment dikes (Figure 11a). The cumulative footprint of these industrial activities grew nearly tenfold, increasing from 95 Kkm2 in 1984 to 900 km2 in 2025, ultimately accounting for approximately 7.41% of the total study area (12,146 km2). Forest cover was significantly impacted by mining expansion, forestry operations, and natural disturbances. Specifically, the study area underwent several distinct phases of degradation, driven by intensive forest harvest (1989–1995), widespread forest loss due to insect infestations (2000–2010), and severe wildfires in May 2016. These transitions in forest composition and soil conditions underscore an unstable ecological history. The bare soil class expanded from approximately 550 km2 in 1984 to 4760 km2 by 2009 due to intensive forest harvesting, insect infestations, and severe wildfires. However, between 2017 and 2025, this trend reversed due to natural regeneration, with bare soil stabilizing at approximately 13.5% of the total study area (~1700 km2) by 2025 (Figure 11b).
Figure 11.
Dynamic of LULC area changes (km2) over time in the Athabasca oil sands region from 1984 to 2025: (a) mining operation sites, (b) soil, wetland and vegetation cover sites.
Surrounding vegetation classes exhibited varied responses to these cumulative stressors. The dense coniferous forest class experienced a sharp decline of 1200 km2, dropping from 1800 km2 in 1984 to 600 km2 by 2005. Meanwhile, the mixed forest class (comprising dense and open broadleaf and mixed-wood) exhibited the most severe degradation. Following cumulative disturbances, it decreased from 4500 km2 in 1984 to a minimum of 1200 km2 in 2010, before recovering to 3040 km2 by 2025 (Figure 11b). Despite the widespread degradation of tree canopy cover across the study area, wetland-shrubs, which occupy nearly half of the study area, remained relatively stable over time. However, this class experienced significant disturbances between 2000 and 2010, corroborating the work of Montgomery et al. [139], before showing a gradual increase, particularly between 2015 and 2025 (Figure 11b). Following the wildfires and logging events, marshes spontaneously emerged in topographic depressions, progressively recovering their ecological wetland functions. Moreover, collaborative initiatives between industry stakeholders and researchers have successfully designed and developed functional, experimental wetlands [140].
4. Discussion
The Athabasca oil sands in Alberta, Canada, represent a region experiencing profound environmental disturbances and recovery processes driven by both anthropogenic activities and natural factors. These drivers include mining exploration, forest resource exploitation, urban expansion, wildfires, climate change, insect infestations, forest regeneration, and restoration efforts. Collectively, they induce major spatiotemporal shifts in LULC and forest ecosystems, with cascading consequences for water and air quality, disease risks, food security, human health, and biodiversity. Mitigating these effects effectively requires accurate spatiotemporal data to connect LULC dynamics with ecosystem properties and assess cumulative impacts. Based on Landsat series images acquired over a 41-year (1984–2025), the method of spectral trajectory-based change detection accurately tracks and highlights distinct abrupt trends of development in the study area. Through the spatiotemporal analysis of 30 selected locations, we observed clear site-specific trends: some sites remained relatively stable, while others experienced environmental stress, waterway pollution, and various anthropogenic disturbances including mining activities, forest harvesting, forest fires, insect damage, water pollution, and site rehabilitation and revegetation.
4.1. Forest Sites
Stable forest sites are located at significant distances on either side of the Athabasca River. In contrast, the observed variations at stressed sites could be attributed to phenological differences, since some images were acquired in mid-September and others in July and August. This stress is also due to dust from forest harvesting operations (sites 12, 19, and 24), mining pollution (site 25), or cumulative impacts and progressive stress (sites 18 and 19) due to climate change (secondary wildfires) and insect infestations [39,132]. This severe insect invasion caused widespread ecological stress, damaging vast tracts of forest across the Athabasca and Fort McMurray regions [141,142]. These biotic pressures were compounded by climatic factors, including mild winters and premature spring thaws. Combined with increased fire frequency, fuel management challenges, and industrial “edge-effectsˮ from oil sands operations, the ecosystem became exceptionally vulnerable to ignition. This heightened sensitivity ultimately culminated in the catastrophic wildfire of May 2016 [23,143].
4.2. Water Sites
Understanding the impacts of oil sands exploitation on water resources is vital for ensuring sustainable resource development while protecting local communities and aquatic ecosystems. Spectral trajectories and multi-temporal spectral signatures (1984–2025) of water sites extracted from the center of the Athabasca River, adjacent to open-pit mines, reveal distinct anomalies corrupted by industrial activity. Rather than reflecting the typical patterns of clear water in the VNIR and SWIR spectra, these signatures align with highly turbid and polluted waters (Figure 8b,c). In the SWIR region specifically, hydrocarbons and toxic organic compounds elevate reflectance in proportion to their thickness and concentration [135]. Consequently, these spectral signatures are dominated by sediment load, heavy metals, and potential hydrocarbon contamination resulting from mining operations. This spectral evidence of contamination aligns with the elevated levels of polycyclic aromatic hydrocarbons (PAHs) documented in regional lake sediments [136], an issue historically exacerbated by inadequate environmental monitoring.
Furthermore, these remote sensing observations are heavily corroborated by broader hydrological literature. Zhang et al. [144] note that oil sands mining and bitumen extraction influence the Athabasca River via three primary pathways: atmospheric deposition, groundwater infiltration, and localized surface runoff from disturbed landscapes. Extensive terrain alteration and disrupted hydrological connectivity facilitate both surface runoff and the subsurface seepage of oil sands process-affected water from tailings pond management facilities into nearby streams. Indeed, the environmental impacts of these effluents are evident, stored in containment ponds located dangerously close to the Athabasca River. This process-affected water contains a toxic cocktail of naphthenic acids, benzene, phthalates, polycyclic aromatic hydrocarbons (PAHs), and heavy metals such as mercury, arsenic, nickel, thallium, vanadium, chromium, and selenium [26,145,146,147,148]. Because these tailings ponds are permeable, contaminants routinely leach into the groundwater and evaporate into the atmosphere, severely damaging the surrounding boreal forest ecosystems and wildlife habitats [27].
As a result, contaminant concentrations exhibit distinct spatial patterns across the watershed. Pollutant levels are markedly higher in tributaries whose catchments have been physically disturbed by mining activities [146,147,148,149]. Within the main stem of the Athabasca River, pollutant concentrations peak near active development zones and tailings treatment facilities compared to upstream baselines (specifically at monitoring sites 6, 13, and 14), and remain elevated far downstream within the Athabasca Delta (site 10). This spatial degradation is further reflected in chronic water quality violations. In a foundational study, Kelly et al. [145] revealed that Albertan water quality guidelines for the protection of aquatic life were exceeded for cadmium, copper, lead, mercury, nickel, silver, and zinc near or downstream of industrial sites. Decades of subsequent research indicate that this trend persists; Alexander and Chambers [150] identified long-term elevations of selenium, dissolved arsenic, and total vanadium relative to pre-development baselines, while Mahoney et al. [151] recently confirmed that aluminum and methylmercury concentrations consistently continue to exceed regulatory thresholds. Eventually, decades of intensive oil sands exploitation have left a substantial legacy of environmental damage that continues to threaten both local aquatic ecosystems and downstream human populations [24,25].
4.3. Rehabilitation Sites
Characterizing and restoring forest cover in the Athabasca oil sands region requires long-term monitoring, a task uniquely suited to remote sensing methodologies. In Alberta, regulatory frameworks mandate strict rehabilitation processes for disturbed lands [138], dictating that restoration efforts must integrate site-specific landscape characteristics to return ecosystems to their original states using native species. Furthermore, re-establishing viable wildlife habitats depends heavily on critical structural and environmental factors, including stand structure, species composition, biodiversity, and water availability. However, despite successful localized rehabilitation at sites 1, 2, 4, 17, 23, and 26, mining activities inflict persistent, long-term ecological losses. To offset these impacts, Gillanders et al. [47] proposed the establishment of dedicated protected areas. To be effective, these reserves must comprehensively represent Alberta’s boreal ecosystems and be sufficiently large to support viable native populations, maintain core ecological processes, and withstand wildfire, a natural and vital driver of boreal forest dynamics.
Compounding these landscape-scale conservation challenges are severe subterranean limitations that complicate surface-level restoration. Even when surface revegetation appears successful, restored mining soils frequently exhibit profound physical, chemical, and biological discrepancies compared to their natural counterparts. In particular, Wu [152] highlights critical deficiencies in organic matter content, baseline nitrogen levels, and nitrogen mineralization rates, underscoring the long-term functional gap between reclaimed and undisturbed boreal soils. Ultimately, detecting these complex dynamics, ranging from subterranean failures to macro-scale deforestation, requires the robust multi-decadal satellite tracking previously mentioned. As illustrated by the spectral trajectories in Figure 9b and the imagery in Figure 10, sites 5, 9, 15, 16, 20, 21, and 22 experienced extensive LULC changes between 1984 and 2025 with no subsequent rehabilitation. Originally characterized by dense broadleaf, coniferous, and mixed forests, these locations were progressively cleared and converted into open-pit mines, oil extraction facilities, tailings ponds, and tailings dikes.
4.4. Landscape Disturbances
This study demonstrates that the large-scale development of Athabasca oil mining has a direct and profound impact on the surrounding boreal forest cover. This development caused extensive landscape disturbances, including the physical clearing of pristine land, severe fragmentation of contiguous habitats, and structural modification of the overall ecosystem. Over the study period, the total footprint of mining activities grew nearly tenfold, expanding from 95 km2 in 1984 to 900 km2 in 2025, ultimately accounting for 7.41% of the total 12,146 km2 study area by the end of the period. This rapid expansion of mining infrastructure resulted in distinct, class-specific shifts across the landscape between 1984 and 2025. Coniferous forests experienced a steady net decline of 1200K km2. Mixed forests (including dense and open broadleaf and mixed-wood) exhibited the most severe degradation; this class decreased sharply from 4500 km2 to 1200 km2 between 1984 and 2010, before undergoing a partial recovery to 3040 km2 by 2025. Meanwhile, wetland-shrubs remained relatively stable over time, experiencing only minor disturbances between 2000 and 2010, followed by a gradual increase from 2015 to 2025 [139].
The structural fragmentation observed in this study has divided once-contiguous forest canopies into smaller, isolated patches. This introduces severe edge effects that degrade the health of the remaining forest margins, ultimately diminishing overall tree growth and biomass carbon intake [153]. Consequently, significant disruptions to regional carbon sequestration are certain to persist through ongoing land-use change and accelerated deforestation [154]. Beyond the direct physical removal of forest canopy cover, decades of intensive oil sands production raise ongoing concerns regarding the indirect impacts of atmospheric emissions, specifically dust, sulfur, and nitrogen, on adjacent, undisturbed forests. Interestingly, long-term monitoring highlights that these emissions have not triggered widespread structural degradation. Instead, data show a neutral to slightly positive fertilization effect, which has enhanced tree growth and understory vegetation productivity directly beneath the timber stands [44].
5. Conclusions
This study demonstrates the efficacy of synergizing long-term Landsat spectral trajectory analysis (1984–2025) with SVM classification for robust spatiotemporal monitoring in the Athabasca boreal region. Rigorous preprocessing, including radiometric calibration and topographic rectification, enabled the extraction of environmentally meaningful spectral trends. These trends successfully decoupled natural disturbances, such as wildfires and insect outbreaks, from intensive anthropogenic activities, while tracking the complete life cycle of open-pit mining, forest harvesting, and subsequent revegetation. Furthermore, extending trajectory analyses to adjacent aquatic systems like the Athabasca River highlighted the broader hydrological footprints of oil sands exploitation, capturing fluctuations in optically active water quality parameters linked to sediment loads and industrial contaminants. However, field validation is necessary to confirm these remote sensing findings regarding aquatic targets.
Over the four-decade study period, the long-term LULC analysis revealed a profound transformation of the boreal landscape. Pristine wetlands and dense forest stand experienced severe fragmentation, particularly near major development hotspots such as Fort McKay, Fort McMurray, and Kearl and McClelland lakes. Dense coniferous forests declined significantly, and mixed forests dropped sharply from 4500 km2 in 1984 to a low of 1200 km2 in 2010 before partial recovery to 3040 km2 by 2025 due to reclamation. Conversely, active mining infrastructure and tailings ponds expanded dramatically from 95 km2 to 900 km2, ultimately occupying 7.41% of the landscape. These findings underscore the cumulative pressure that accelerating industrial footprints place on regional ecosystems.
Finally, the Landsat series provides invaluable spatiotemporal data for monitoring the oil sands region, particularly for landscape-scale analyses. However, while Landsat archives can effectively characterize the evolution of an ecosystem over time, many critical ecological properties cannot be resolved remotely with sufficient reliability and accuracy, and establishing a true baseline of historical ecosystem functioning remains challenging. To overcome these limitations, future research should combine Landsat-derived trajectories with ground-based measurements and high-frequency data acquired by modern very-high spatial resolution satellites (e.g., WorldView, Pléiades, and PlanetScope). Such integration will enhance the accuracy of ecological monitoring and better support evidence-based reclamation strategies in heavily impacted boreal landscapes. Moreover, with the rapid development of artificial intelligence, it is possible to transform the assessment and temporal monitoring of forest canopies. This shifts the field from manual, reactive mapping to automated, real-time digital solutions, predictive risk modeling, and multi-sensory data fusion, enabling precise tracking of canopy health, dynamics, and structural changes over several decades.
Author Contributions
A.B. performed the paper concept, selected and downloaded the data, performed data preprocessing and verification, analyzed the results, and wrote the manuscript; I.M. and S.T. assisted with data processing, created the figures, and participated in the original draft preparation; T.T. and A.E.-G. contributed to the interpretation of results and paper writing. All authors have read and agreed to the published version of the manuscript.
Funding
This research received no external funding.
Data Availability Statement
The raw data used in this research are available from the USGS site: https://earthexplorer.usgs.gov.
Acknowledgments
The authors would like to thank NASA-USGS for Landsat datasets. They also express their gratitude to the anonymous reviewers for their constructive comments.
Conflicts of Interest
The authors declare no conflicts of interest, including any potential commercial interests.
Abbreviations
The following abbreviations are used in this manuscript:
| AVHRR | Advanced Very High-Resolution Radiometer |
| BSI | Bare Soil Index |
| CEOS | Committee on Earth Observation Satellites |
| CEOS-ARD | Committee on Earth Observation Satellites Analysis Ready Data |
| CV | Coefficient of Variation |
| DEM | Digital Elevation Model |
| ETM+ | Enhanced Thematic Mapper Plus |
| EVI | Enhanced Vegetation Index |
| FOV | Field Of View |
| GCP | Ground Control Point |
| L2SP | Level-2 surface reflectance |
| LULC | Land Use and Land Cover |
| MNDWI | Modified Normalized Difference Water Index |
| MSS | Multi-Spectral Scanner |
| NASA | National Aeronautics and Space Administration |
| NDVI | Normalized Difference Vegetation Index |
| NDWI | Normalized Difference Water Index |
| NIR | Near-Infra-Red |
| NOAA | National Oceanic and Atmospheric Administration |
| OLI | Operational Land Imager |
| PAH | Polycyclic Aromatic Hydrocarbon |
| SAVI | Soil Adjusted Vegetation Index |
| SNR | Signal-to-Noise Ratio |
| SWIR | Shortwave Infrared |
| TDVI | Transformed Difference Vegetation Index |
| TM | Thematic Mapper |
| TOA | Top of the Atmosphere |
| USGS | United States Geological Survey |
| UTM | Universal Transverse Mercator |
| VNIR | Visible and Near-Infrared |
| WGS84 | World Geodetic System 1984 |
References
- Jin, S.; Sader, S.A. Effects of forest ownership and change on forest harvest rates, types and trends in northern Maine. For. Ecol. Manag. 2006, 228, 177–186. [Google Scholar] [CrossRef] [Scilit]
- Wang, L.; Liu, S.; Song, W.; Ding, S.; Zhang, J. Global high-resolution forest disturbance type dataset. Earth Syst. Sci. Data 2026, 18, 1601–1617. [Google Scholar] [CrossRef] [Scilit]
- Zhang, X.; Chen, B.; An, J.; Lin, C.; Gong, P. Overlooked deforestation from global mining activities in the 21st century. Nat. Commun. 2026, 17, 804. [Google Scholar] [CrossRef] [Scilit] [PubMed]
- Vitousek, P.M. Beyond global warming: Ecology and global change. Ecology 1994, 75, 1861–1876. [Google Scholar] [CrossRef] [Scilit]
- Silapaswan, C.S.; Verbyla, D.L.; McGuire, A.D. Land cover change on the Seward Peninsula: The use of remote sensing to evaluate the potential influences of climate warming on historical vegetation dynamics. Can. J. Remote Sens. 2001, 27, 542–554. [Google Scholar] [CrossRef] [Scilit]
- Cohen, W.B.; Harmon, M.; Wallin, D.; Fiorella, M. Two decades of carbon flux from forests of the Pacific Northwest. BioScience 1996, 46, 836–844. [Google Scholar] [CrossRef] [Scilit]
- Houghton, J.T.; Ding, Y.; Griggs, D.J.; Noguer, M.; Van-der-Linden, P.J.; Dai, X.; Maskell, K.; Johnson, C.A. (Eds.) Climate Change 2001: The Scientific Basis. Contribution of Working Group I to the Third Assessment Report of the Intergovernmental Panel on Climate Change; Cambridge University Press: Cambridge, UK, 2001; 893p. [Google Scholar]
- Altman, J.; Fibich, P.; Trotsiuk, V.; Altmanova, N. Global pattern of forest disturbances and its shift under climate change. Sci. Total Environ. 2024, 915, 170117. [Google Scholar] [CrossRef] [Scilit] [PubMed]
- De-Miguel, S.; Birhanu, A.; Menor, I.O.; Ascoli, D.; Spadoni, G.L.; Erdozain, M. Carbon Emissions from Forest Disturbances Under Global Change. Curr. For. Rep. 2025, 11, 29. [Google Scholar] [CrossRef] [Scilit]
- Aryal, S.; Babel, M.S.; Gupta, A.; Farjad, B.; Khadka, D.; Hassan, Q.K. Assessment of hydrological baseline condition and its alteration in Athabasca River Basin, Canada. J. Hydrol. Reg. Stud. 2024, 53, 101805. [Google Scholar] [CrossRef] [Scilit]
- Travers-Smith, H.; Coops, N.C.; Wulder, M.A.; Lantz, T.C.; Ignace, D.D. Long-Term Vegetation Changes Across the Canadian Forest-Tundra Ecotone Using Historic Air Photos and Satellite Time-Series. Ecosystems 2026, 29, 41. [Google Scholar] [CrossRef] [Scilit]
- Chowdhury, S.; Peddle, D.R.; Wulder, M.A.; Heckbert, S.; Shipman, T.C.; Chao, D.K. Estimation of land-use/land-cover changes associated with energy footprints and other disturbance agents in the Upper Peace Region of Alberta Canada from 1985 to 2015 using Landsat data. Int. J. Appl. Earth Obs. Geoinf. 2021, 94, 102224. [Google Scholar] [CrossRef] [Scilit]
- Wulder, M.A.; Dechka, J.A.; Gillis1, M.A.; Luther, J.E.; Hall, R.J.; Beaudoin, A.; Franklin, S.E. Operational mapping of the land cover of the forested area of Canada with Landsat data: EOSD land cover program. For. Chron. 2003, 79, 1075–1083. [Google Scholar] [CrossRef] [Scilit]
- Coops, N.C.; Hermosilla, T.; Wulder, M.A.; White, J.C.; Bolton, D.K. A thirty year, fine-scale, characterization of area burned in Canadian forests shows evidence of regionally increasing trends in the last decade. PLoS ONE 2018, 13, e0197218. [Google Scholar] [CrossRef] [Scilit] [PubMed]
- Mulverhill, C.; Coops, N.C.; Wulder, M.A.; White, J.C.; Hermosilla, T.; Bater, C.W. Multidecadal mapping of status and trends in annual burn probability over Canada’s forested ecosystems. ISPRS J. Photogramm. Remote Sens. 2024, 209, 279–295. [Google Scholar] [CrossRef] [Scilit]
- Mulverhill, C.; Coops, N.C.; Hermosilla, T.; Wulder, M.A.; White, J.C.; Campbell, E.M.; Wotherspoon, A.R. Climate-driven changes in tree species dominance across Canada. Reg. Environ. Change 2026, 26, 72. [Google Scholar] [CrossRef] [Scilit]
- Nelson, T.A.; Coops, N.C.; Wulder, M.A.; Perez, L.; Fitterer, J.; Powers, R.; Fontana, F. Predicting Climate Change Impacts to the Canadian Boreal Forest. Diversity 2014, 6, 133–157. [Google Scholar] [CrossRef] [Scilit]
- Girona, M.M.; Aakala, T.; Aquilué, N.; Bélisle, A.C.; Chaste, E.; Danneyrolles, V.; Díaz-Yáñez, O.; D’Orangeville, L.; Grosbois, G.; Hester, A.; et al. Challenges for the Sustainable Management of the Boreal Forest under Climate Change. In Boreal Forests in the Face of Climate Change: Sustainable Management; Girona, M.M., Morin, H., Gauthier, S., Bergeron, Y., Eds.; Advances in Global Change Research; Springer: Cham, Switzerland, 2023; Volume 74, pp. 773–837. [Google Scholar]
- Smyth, C.E.; Metsaranta, J.; Tompalski, P.; Hararuk, O.; Le-Noble, S. 10-year progress on forest carbon research in Canada. Environ. Rev. 2024, 32, 611–637. [Google Scholar] [CrossRef] [Scilit]
- Weber, M.G.; Flannigan, M.D. Canadian boreal forest ecosystem structure and function in a changing climate: Impact on fire regimes. Environ. Rev. 1977, 5, 145–166. [Google Scholar]
- Audet, P.; Pinno, B.D.; Thiffault, E. Reclamation of boreal forest after oil sands mining: Anticipating novel challenges in novel environments. Can. J. For. Res. 2025, 45, 364–371. [Google Scholar]
- Landis, M.S.; Edgerton, E.S.; White, E.M.; Wentworth, G.R.; Sullivan, A.P.; Dillner, A.M. The impact of the 2016 Fort McMurray Horse River Wildfire on ambient air pollution levels in the Athabasca Oil Sands Region, Alberta, Canada. Sc. Total Environ. 2018, 618, 1665–1676. [Google Scholar] [CrossRef] [Scilit] [PubMed]
- Xu, E.; Wei, M.; Li, T.; Lei, V.; Gao, J.; Wang, N.; He, Y. Assessing burn severity and vegetation restoration in Alberta’s boreal forests following the 2016 Fort McMurray wildfire—A remote sensing time-series study. Sust. Environ. 2024, 10, 2361569. [Google Scholar] [CrossRef] [Scilit]
- Lima, A.T.; Mitchell, K.; O’Connell, D.W.; Verhoeven, J.; Cappellen, P.V. The legacy of surface mining: Remediation, restoration, reclamation and rehabilitation. Environ. Sc. Pol. 2016, 66, 227–233. [Google Scholar] [CrossRef] [Scilit]
- Roberts, D.R.; Bayne, E.M.; Beausoleil, D.; Dennett, J.; Fisher, J.T.; Hazewinkel, R.O.; Sayanda, D.; Wyatt, F.; Dubé, M.G. A synthetic review of terrestrial biological research from the Alberta oil sands region: 10 years of published literature. Integr. Environ. Assess. Manag. 2022, 18, 388–406. [Google Scholar] [CrossRef] [Scilit] [PubMed]
- Chow-Fraser, G.; Rougeot, A.; Gagnon, E.; Cheng, R.; Ross, A.; Gray, P. Canadian Parks and Wilderness Society Northern Alberta Chapter. In 50 Years of Sprawling Tailings Mapping: Decades of Destruction by Oil Sands Tailings; Environmental Defence: Toronto, ON, Canada, 2025; 67p, Available online: https://www.keepersofthewater.ca/news/did-you-know (accessed on 1 April 2026).
- Campbell, M.A.; Kopach, B.; Komers, P.E.; Ford, A.T. Quantifying the impacts of oil sands development on wildlife: Perspectives from impact assessments. Environ. Rev. 2020, 28, 129–137. [Google Scholar] [CrossRef] [Scilit]
- Behr, T.; Spak, S.; Cartwright, A. Fort Mckay First Nation Traditional Land Use Study; Fort McKay First Nation: Fort McMurray, AB, Canada, 2019; 153p, Available online: https://registrydocumentsprd.blob.core.windows.net/commentsblob/project-80521/comment-58578/BMX-TLUS-final%20report%202019-06-11.pdf (accessed on 1 April 2026).
- Moguel, R.G.; Vogel, F.; Ars, S.; Schaefer, H.; Turnbull, J.C.; Douglas, P.M.J. Using carbon-14 and carbon-13 measurements for source attribution of atmospheric methane in the Athabasca oil sands region. Atmos. Chem. Phys. 2022, 22, 2121–2133. [Google Scholar] [CrossRef] [Scilit]
- Cooke, C.A.; Emmerton, C.A.; Drevnick, P.E. Legacy coal mining impacts downstream ecosystems for decades in the Canadian Rockies. Environ. Poll. 2024, 344, 123328. [Google Scholar] [CrossRef] [Scilit] [PubMed]
- Westwood, A.R.; Mines, S.M.; Miglani, S.; Sharan, R.; Legault, A.; Fitzpatrick, P.; Sergeant, C.J.; Collison, B.R. Unearthing trends in environmental impact assessments for mines and quarries across Canada. Facets 2025, 10, 1–22. [Google Scholar] [CrossRef] [Scilit]
- Joseph, R. Environmental issues in Mining: A Comprehensive Review of Challenges and Strategies for Mitigation and Rehabilitation. Min. Rev. Rev. Min. 2025, 31, 51–71. [Google Scholar] [CrossRef] [Scilit]
- Pollon, C.; Al-Aini, E. Managing Environmental Risks of Mining Critical Minerals; Canadian Climate Institute: Ottawa, ON, Canada, 2025; 52p, Available online: https://climateinstitute.ca/wp-content/uploads/2025/05/Critical-minerals-environmental-risk.pdf (accessed on 5 June 2026).
- Giljum, S.; Maus, V.; Sonter, L.; Luckeneder, S.; Werner, T.; Lutter, S.; Gershenzon, J.; Cole, M.J.; Juliana Siqueira-Gay, J.; Bebbington, A. Metal mining is a global driver of environmental change. Nat. Rev. Earth Environ. 2025, 6, 441–455. [Google Scholar] [CrossRef] [Scilit]
- Government of Alberta. Alberta’s Oil Sands Industry; Alberta Government: Edmonton, AB, Canada, 2009; 16p, Available online: https://open.alberta.ca/publications/2614198/resource/84ee19fe-030a-4700-919c-a9acee32b96d (accessed on 1 June 2026).
- Doley, D.; Audet, P. Adopting novel ecosystems as suitable rehabilitation alternatives for former mine sites. Ecol. Process. 2023, 2, 22. [Google Scholar] [CrossRef] [Scilit]
- Lucas, M.; Dasgupta, A.; Björn Waske, B. Analyzing Gradual Vegetation Changes in the Athabasca Oil Sands Region Using Landsat Data. IEEE J. Sel. Top. Appl. Earth Obs. Remote Sens. 2023, 16, 1365–1377. [Google Scholar] [CrossRef] [Scilit]
- Vogelmann, J.E.; Gallant, A.L.; Shi, H.; Zhu, Z. Perspectives on monitoring gradual change across the continuity of Landsat sensors using time-series data. Remote Sens. Environ. 2016, 185, 258–270. [Google Scholar] [CrossRef] [Scilit]
- Pouliot, D.; Latifovic, R. Land change attribution based on Landsat time series and integration of ancillary disturbance data in the Athabasca oil sands region of Canada. GIScience Remote Sens. 2016, 53, 382–401. [Google Scholar] [CrossRef] [Scilit]
- Hu, J.; Zhang, Y. Seasonal change of land-use/land-cover (LULC) detection using MODIS data in rapid urbanization regions: A case study of the Pearl River delta region (China). IEEE J. Sel. Top. Appl. Earth Obs. Remote Sens. 2013, 6, 1913–1920. [Google Scholar] [CrossRef] [Scilit]
- Diniz, C.G.; De-Almeida-Souza, A.A.; Santos, D.C.; Dias, M.C.; Da-Luz, N.C.; De-Moraes, D.R.V. DETER-B: The new amazon near real-time deforestation detection system. IEEE J. Sel. Top. Appl. Earth Obs. Remote Sens. 2015, 8, 3619–3628. [Google Scholar] [CrossRef] [Scilit]
- Lynam, M.M.; Dvonch, J.T.; Barres, J.A.; Morishita, M.; Legge, A.; Percy, K. Oil sands development and its impact on atmospheric wet deposition of air pollutants to the Athabasca oil sands region, Alberta, Canada. Environ. Pollut. 2015, 206, 469–478. [Google Scholar] [CrossRef] [Scilit] [PubMed]
- Evans, M.; Davies, M.; Janzen, K.; Muir, D.; Hazewinkel, R.; Kirk, J.; De-Boer, D. PAH distributions in sediments in the oil sands monitoring area and western lake Athabasca: Concentration, composition and diagnostic ratios. Environ. Pollut. 2016, 213, 671–687. [Google Scholar] [CrossRef] [Scilit] [PubMed]
- Bartels, S.F.; Gendreau-Berthiaume, B.; Macdonald, S.E. The impact of atmospheric acid deposition on tree growth and forest understory vegetation in the Athabasca oil sands region. Sci. Total Environ. 2019, 696, 133877. [Google Scholar] [CrossRef] [Scilit] [PubMed]
- Yang, J.; Fu, R.; Zhang, M.; Chen, J.; Liang, S.; Xu, B.; Shi, J.; Dickinson, R. The role of satellite remote sensing in climate change studies. Nat. Clim. Change 2013, 3, 875–883. [Google Scholar] [CrossRef] [Scilit]
- O’Donnell, M.S.; Whipple, A.L.; Inman, R.D.; Tarbox, B.C.; Monroe, A.P.; Robb, B.S.; Aldridge, C.L. Remote Sensing for Monitoring Mine Lands and Recovery Efforts: U.S. Geological Survey; Circular 1525; U.S. Department of the Interior: Washington, DC, USA, 2024. [CrossRef] [Scilit]
- Gillanders, S.N.; Coops, N.C.; Wulder, M.A.; Goodwing, N.R. Application of Landsat satellite imagery to monitor land-cover changes at the Athabasca Oil Sands, Alberta, Canada. Can. Geogr. 2008, 52, 466–485. [Google Scholar] [CrossRef] [Scilit]
- Latifovic, R.; Fytas, K.; Chen, J.; Paraszczak, J. Assessing land cover change resulting from large surface mining development. Int. J. Appl. Earth Obs. Geoinf. 2005, 7, 29–48. [Google Scholar] [CrossRef] [Scilit]
- Thompson, M.D. Ecological Habitat Mapping of the AOSERP Study Area (Supplement): Phase 1; Report; AOSERP: Edmonton, AB, Canada, 1979; 56p. [Google Scholar] [CrossRef]
- Cowan, W.R.; Robertson, J.G.A. Mine rehabilitation in Ontario, Canada: Ten years of progress. In Proceedings of the 99 Conference on Mining and the Environment II, Sudbury, ON, Canada, 12–15 September 1999; Laurentian University: Sudbury, ON, Canada, 1999; Volume 3, pp. 1037–1043. [Google Scholar]
- Kennedy, R.E.; Cohen, W.B.; Schroeder, T.A. Trajectory-based change detection for automated characterization of forest disturbance dynamics. Remote Sens. Environ. 2007, 110, 370–386. [Google Scholar] [CrossRef] [Scilit]
- Kennedy, R.E.; Townsend, P.A.; Gross, J.E.; Cohen, W.B.; Bolstad, P.; Wang, Y.Q.; Adams, P. Remote sensing change detection tools for natural resource managers: Understanding concepts and Tradeoffs in the design of landscape monitoring projects. Remote Sens. Environ. 2009, 113, 1382–1396. [Google Scholar] [CrossRef] [Scilit]
- Zhu, Z.; Qiu, S.; Ye, S. Remote sensing of land change: A multifaceted perspective. Remote Sens. Environ. 2022, 282, 113266. [Google Scholar] [CrossRef] [Scilit]
- Lunetta, R.S.; Johnson, D.M.; Lyon, J.G.; Crotwell, J. Impacts of imagery temporal frequency on land-cover change detection monitoring. Remote Sens. Environ. 2004, 89, 444–454. [Google Scholar] [CrossRef] [Scilit]
- Cohen, W.B.; Goward, S.N. Landsat’s role in ecological applications of remote sensing. BioScience 2004, 54, 535–545. [Google Scholar] [CrossRef] [Scilit]
- Kennedy, R.E.; Yang, Z.; Braaten, J.; Copass, C.; Antonova, N.; Jordan, C.; Nelson, P. Attribution of disturbance change agent from Landsat time-series in support of habitat monitoring in the Puget Sound region, USA. Remote Sens. Environ. 2025, 166, 271–285. [Google Scholar]
- Lu, D.; Mausel, P.; Brondizio, E.; Moran, E. Relationships between forest stand parameters and Landsat TM spectral responses in the Brazilian Amazon Basin. For. Ecol. Manag. 2004, 198, 149–167. [Google Scholar] [CrossRef] [Scilit]
- Kennedy, R.E.; Yang, Z.G.; Cohen, W.B. Detecting trends in forest disturbance and recovery using yearly Landsat time series: 1. LandTrendrtemporal segmentation algorithms. Remote Sens. Environ. 2010, 114, 2897–2910. [Google Scholar] [CrossRef] [Scilit]
- He, L.; Hong, L.; Zhu, A.-X. An Improved LandTrendr Algorithm for Forest Disturbance Detection Using Optimized Temporal Trajectories of the Spectrum: A Case Study in Yunnan Province, China. Forests 2024, 15, 1539. [Google Scholar] [CrossRef] [Scilit]
- Timilsina, G.R.; LeBlanc, N.; Walden, T. Economic Impacts of Alberta’s Oil Sands, Volume 1; Canadian Energy Research Institute: Calgary, AB, Canada, 2005; 15p, Available online: https://inis.iaea.org/records/fgdex-7rh16 (accessed on 1 April 2026).
- Sparks, B.D.; Kotlyar, L.S.; O’carrol, J.B.; Chung, K.H. Athabasca Oil Sands: Effect of organic coated solids on bitumen recovery and quality. J. Pet. Sci. Eng. 2003, 39, 417–430. [Google Scholar] [CrossRef] [Scilit]
- Czarnecki, J.; Radoev, B.; Schramm, L.L.; Slavchev, R. On the nature of Athabasca Oil Sands. Adv. Colloid Interface Sci. 2005, 114–115, 53–60. [Google Scholar] [CrossRef] [Scilit] [PubMed]
- Flach, P.D. Oil Sands Geology—Athabasca Deposit North. Alta. Res. Counc. Bull. 1984, 46, 47. [Google Scholar]
- ESWG; Ecological Stratification Working Group. A National Ecological Framework for Canada; Agriculture and Agri-Food; ESGW: Ottawa, ON, Canada; Hull, QC, Canada, 1995; 132p, Available online: https://sis.agr.gc.ca/cansis/publications/manuals/1996/A42-65-1996-national-ecological-framework.pdf (accessed on 1 April 2026).
- Beckingham, D.; Archibald, J.H. Field Guide to Eco-Sites of Northern Alberta; Special report 1188-7419 5; Canadian Forest Service, Natural Resources Canada: Ottawa, ON, USA, 1996; 336p. [Google Scholar]
- Kishchuk, B.E.; Thiffault, E.; Lorente, M.; Quideau, S.; Keddy, T.; Sidders, D. Decadal soil and stand response to fire, harvest, and salvage-logging disturbances in the western boreal mixed wood forest of Alberta, Canada. Can. J. For. Res. 2015, 45, 141–152. [Google Scholar] [CrossRef] [Scilit]
- Roy, D.P.; Wulder, M.A.; Gorelick, N.; Hansen, M.; Healey, S.; Hostert, P.; Huntington, J.; Radeloff, V.C.; Scambos, T.; Schaaf, C.; et al. The next Landsat: Mission turning point? Remote Sens. Environ. 2026, 332, 115087. [Google Scholar] [CrossRef] [Scilit]
- Wulder, M.A.; Loveland, T.R.; Roy, D.P.; Crawford, C.J.; Masek, J.G.; Woodcock, C.E.; Allen, R.G.; Anderson, M.C.; Belward, A.S.; Cohen, W.B.; et al. Current status of Landsat program, science, and applications. Remote Sens. Environ. 2019, 255, 127–147. [Google Scholar] [CrossRef] [Scilit]
- Wulder, M.A.; Hermosilla, T.; White, J.C.; Hobart, G.; Masek, J.G. Augmenting Landsat time series with Harmonized Landsat Sentinel-2 data products: Assessment of spectral correspondence. Sci. Remote Sens. 2021, 4, 100031. [Google Scholar] [CrossRef] [Scilit]
- Wulder, M.A.; Roy, D.P.; Radeloff, V.C.; Loveland, T.R.; Anderson, M.C.; Johnson, D.M.; Healey, S.; Zhu, Z.; Scambos, T.A.; Pahlevan, N.; et al. Fifty years of Landsat science and impacts. Remote Sens. Environ. 2022, 280, 113195. [Google Scholar] [CrossRef] [Scilit]
- Markham, B.; Barker, J. Radiometric properties of U.S. processed Landsat MSS Data. Remote Sens. Environ. 1987, 22, 39–71. [Google Scholar] [CrossRef] [Scilit]
- Bannari, A.; Al-Ali, Z. Ground Reflectance Factor Retrieval from Landsat (MSS, TM, ETM+, and OLI) Time Series Data based on Semi-empirical Line Approach and Pseudo-invariant Targets in Arid Landscape. In Proceedings of the International Geoscience and Remote Sensing Symposium, Waikoloa, HI, USA, 19–24 July 2020; IEEE: New York, NY, USA, 2020; pp. 5990–5993. [Google Scholar]
- Schott, J.R. Remote Sensing the Image Chain Approach, 2nd ed.; Oxford University Press: New York, NY, USA, 2007; 666p. [Google Scholar]
- Flood, N. Continuity of Reflectance Data between Landsat-7 ETM+ and Landsat-8 OLI, for Both Top-of-Atmosphere and Surface Reflectance: A Study in the Australian Landscape. Remote Sens. 2014, 6, 7952–7970. [Google Scholar] [CrossRef] [Scilit]
- Markham, B.; Storey, J.; Morfitt, R. Landsat-8 Sensor Characterization and Calibration. Remote Sens. 2015, 7, 2279–2282. [Google Scholar] [CrossRef] [Scilit]
- Czapla-Myers, J.; McCorkel, J.; Anderson, N.; Thome, K.; Biggar, S.; Helder, D.; Aaron, D.; Leigh, L.; Mishra, N. The ground-based absolute radiometric calibration of Landsat 8 OLI. Remote Sens. 2015, 7, 600–626. [Google Scholar] [CrossRef] [Scilit]
- Mishra, N.; Helder, D.; Barsi, J.; Markham, B. Continuous calibration improvement in solar reflective bands: Landsat 5 through Landsat 8. Remote Sens. Environ. 2016, 185, 7–15. [Google Scholar] [CrossRef] [Scilit] [PubMed]
- Knight, E.J.; Kvaran, G. Landsat-8 Operational Land Imager design, characterization, and performance. Remote Sens. 2014, 6, 10286–10305. [Google Scholar] [CrossRef] [Scilit]
- Markham, B.; Barsi, J.; Kvaran, G.; Ong, L.; Kaita, E.; Biggar, S.; Czapla-Myers, J.; Mishra, N.; Helder, D. Landsat-8 operational land imager radiometric calibration and stability. Remote Sens. 2014, 6, 12275–12308. [Google Scholar] [CrossRef] [Scilit]
- Crawford, C.J.; Roy, D.P.; Arab, S.; Barnes, C.; Vermote, E.; Hulley, G.; Gerace, A.; Choate, M.; Engebretson, C.; Micijevic, E.; et al. The 50-year Landsat collection 2 archive. Sci. Remote Sens. 2023, 8, 100103. [Google Scholar] [CrossRef] [Scilit]
- Bannari, A.; Teillet, P.M.; Richardson, G. Necessity of radiometric calibration and standardization of remote sensing data. Can. J. Remote Sens. 1999, 25, 45–59. [Google Scholar]
- Chander, G.; Helder, D.L.; Markham, B.L.; Dewald, J.D.; Kaita, E.; Thome, K.J.; Micijevic, E.; Ruggles, T.A. Landsat-5 TM reflective-band absolute radiometric calibration. IEEE Trans. Geosci. Remote Sens. 2004, 42, 2747–2760. [Google Scholar] [CrossRef] [Scilit]
- Claverie, M.; Vermote, E.F.; Franch, B.; Masek, J.G. Evaluation of the Landsat-5 TM and Landsat-7 ETM+ surface reflectance products. Remote Sens. Environ. 2015, 169, 390–403. [Google Scholar] [CrossRef] [Scilit]
- Markham, B.L.; Helder, D.L. Forty-year calibrated record of earth-reflected radiance from Landsat: A review. Remote Sens. Environ. 2012, 122, 30–40. [Google Scholar] [CrossRef] [Scilit]
- Roy, D.; Zhang, H.; Ju, J.; Gomez-Dans, J.; Lewis, P.; Schaaf, C.; Sun, Q.; Li, J.; Huang, H.; Kovalskyy, V. A general method to normalize Landsat reflectance data to nadir BRDF adjusted reflectance. Remote Sens. Environ. 2026, 176, 255–271. [Google Scholar] [CrossRef] [Scilit]
- Qi, J. Compositing Multitemporal Remote Sensing Data. Ph.D Dissertation, Department of Soil and Water Science, University of Arizona, Tucson, AZ, USA, 1993; 200p. [Google Scholar]
- Gascon, F.; Bouzinac, C.; Thépaut, O.; Jung, M.; Francesconi, B.; Louis, J.; Lonjou, V.; Lafrance, B.; Massera, S.; Gaudel-Vacaresse, A.; et al. Copernicus sentinel-2 calibration and products validation status. Remote Sens. 2017, 9, 584. [Google Scholar] [CrossRef] [Scilit]
- Bannari, A.; Morin, D.; Bénié, G.B.; Bonn, F. A Theoretical Review of Different Mathematical Models of Geometric Corrections Applied to Remote Sensing Images. Remote Sens. Rev. 1995, 13, 27–47. [Google Scholar] [CrossRef] [Scilit]
- Storey, J.; Choate, M.; Lee, K. Landsat-8 Operational Land Imager On-Orbit Geometric Calibration and Performance. Remote Sens. 2014, 6, 11127–11152. [Google Scholar] [CrossRef] [Scilit]
- Yan, L.; Roy, D.P. Using Landsat 8 and 9 operational land imager (OLI) data to characterize geometric distortion and improve geometric correction of Landsat Multispectral Scanner (MSS) imagery. Remote Sens. Environ. 2025, 321, 114679. [Google Scholar] [CrossRef] [Scilit]
- Kennedy, R.E.; Spies, T.A.; Gregory, M.J. Relationships of dead wood patterns with biophysical characteristics and ownership according to scale in Coastal Oregon, USA. Landsc. Ecol. 2008, 23, 55–68. [Google Scholar] [CrossRef] [Scilit]
- Bannari, A.; Morin, D.; Huete, A.R.; Bonn, F. A Review of Vegetation indices. Remote Sens. Rev. 1995, 13, 95–120. [Google Scholar] [CrossRef] [Scilit]
- Rouse, J.W.; Haas, R.W.; Schell, J.A.; Deering, D.W.; Harlan, J.C. Monitoring the Vernal Advancement and Retro-Gradation (Green Wave Effect) Of Natural Vegetation; NASA/GSFCT Type III Final Report Number: NASA-CR-139243; Goddard Space Flight Center: Greenbelt, MD, USA, 1974; 250p.
- Huete, A.R. A soil-adjusted vegetation index (SAVI). Remote Sens. Environ. 1988, 25, 295–309. [Google Scholar] [CrossRef] [Scilit]
- Huete, A.R.; Didan, K.; Miura, T.; Rodriguez, E.P.; Gao, X.; Ferreira, L.G. Overview of the radiometric and biophysical performance of the MODIS vegetation indices. Remote Sens. Environ. 2002, 83, 195–213. [Google Scholar] [CrossRef] [Scilit]
- Bannari, A.; Asalhi, H.; Teillet, P.M. Transformed Difference Vegetation Index (TDVI) for Vegetation Cover Mapping. In Proceedings of the International Geoscience and Remote Sensing Symposium, Toronto, ON, Canada, 9–13 July 2002; IEEE: New York, NY, USA, 2005; pp. 3053–3055. [Google Scholar]
- Nguyen, C.T.; Chidthaisong, A.; Kieu Diem, P.; Huo, L.-Z. A Modified Bare Soil Index to Identify Bare Land Features during Agricultural Fallow-Period in Southeast Asia Using Landsat 8. Land 2021, 10, 231. [Google Scholar] [CrossRef] [Scilit]
- Rikimaru, A.; Roy, P.S.; Miyatake, S. Tropical forest cover density mapping. Trop. Ecol. 2002, 43, 39–47. [Google Scholar]
- Chen, W.; Liu, L.; Zhang, C.; Wang, J.; Wang, J.; Pan, Y. Monitoring the seasonal bare soil areas in Beijing using multi-temporal TM images. In Proceedings of the International Geoscience and Remote Sensing Symposium, Anchorage, AK, USA, 20–24 September 2004; IEEE: New York, NY, USA, 2004; Volume 5, pp. 3379–3382. [Google Scholar]
- Zhou, Y.; Yang, G.; Wang, S.; Wang, L.; Wang, F.; Liu, X. A new index for mapping built-up and bare land areas from Landsat-8 OLI data. Remote Sens. Lett. 2014, 5, 862–871. [Google Scholar] [CrossRef] [Scilit]
- Mzid, N.; Pignatti, S.; Huang, W.; Casa, R. An Analysis of Bare Soil Occurrence in Arable Croplands for Remote Sensing Topsoil Applications. Remote Sens. 2021, 13, 474. [Google Scholar] [CrossRef] [Scilit]
- Michałowska, K.; Pirowski, T.; Głowienka, E.; Szypuła, B.; Malinverni, E.S. Sustainable Monitoring of Mining Activities: Decision-Making Model Using Spectral Indexes. Remote Sens. 2024, 16, 388. [Google Scholar] [CrossRef] [Scilit]
- Cheng, Y.T.; Hoang, N.T.; Maupu, L.; Kanemoto, K. Classifying land use within 80,000 mining sites on a global scale. Sci. Data 2026, 13, 338. [Google Scholar] [CrossRef] [Scilit] [PubMed]
- Gao, B.-C. NDWI—A normalized difference water index for remote sensing of vegetation liquid water from space. Remote Sens. Environ. 1996, 58, 257–266. [Google Scholar] [CrossRef] [Scilit]
- McFeeters, S.K. The use of normalized difference water index (NDWI) in the delineation of open water features. Int. J. Remote Sens. 1996, 17, 1425–1432. [Google Scholar] [CrossRef] [Scilit]
- Xu, H. Modification of normalised difference water index (NDWI) to enhance open water features in remotely sensed imagery. Int. J. Remote Sens. 2006, 27, 3025–3033. [Google Scholar] [CrossRef] [Scilit]
- Prabin, A.; Fangzhou, L. Spectral Index Monitoring for Temporal Changes in Mining Areas. In Proceedings of Tailings and Mine Waste, Vancouver, BC, Canada, 5–8 November 2023; University of British Columbia: Vancouver, BC, Canada, 2023; pp. 1817–1828. [Google Scholar]
- Bruzzone, L.; Persello, C. Approaches Based on Support Vector Machine to Classification of Remote Sensing data. In Handbook of Pattern Recognition and Computer Vision, 4th ed.; Chen, C.H., Ed.; World Scientific: Singapore, 2009; Chapter 3.2; pp. 329–352. [Google Scholar]
- Yuan, R.; Li, Z.; Guan, X.; Xu, L. An SVM-based machine learning method for accurate internet traffic classification. Inf. Syst. Front. 2010, 12, 149–156. [Google Scholar] [CrossRef] [Scilit]
- Pisner, D.A.; Schnyer, D.M. Support Vector Machine. In Machine Learning: Methods and Application to Brain Disorder; Mechelli, A., Vieira, S., Eds.; Academic Press: Cambridge, MA, USA, 2019; Chapter 6; pp. 101–121. [Google Scholar]
- Zhu, G.; Blumberg, D.G. Classification using ASTER data and SVM algorithms; The case study of Beer Sheva, Israel. Remote Sens. Environ. 2002, 80, 233–240. [Google Scholar]
- Chen, W.; Li, X.; Wang, L. Fine Land Cover Classification in an Open Pit Mining Area Using Optimized Support Vector Machine and WorldView-3 Imagery. Remote Sens. 2020, 12, 82. [Google Scholar] [CrossRef] [Scilit]
- Gao, S.; Chen, Y.; Li, K.; Li, Y.; Yu, J.; Rao, R. Mapping Opencast Iron Mine and Mine Solid Waste Based on a New Spectral Index From Medium Spatial Resolution Satellite Data. IEEE J. Sel. Top. Appl. Earth Obs. Remote Sens. 2021, 14, 7788–7798. [Google Scholar] [CrossRef] [Scilit]
- Karan, S.K.; Samadder, S.R. Accuracy of land use change detection using support vector machine and maximum likelihood techniques for open-cast coal mining areas. Environ. Mon. Assess. 2016, 188, 2016. [Google Scholar] [CrossRef] [Scilit] [PubMed]
- Petropoulos, G.P.; Partsinevelos, P.; Mitraka, Z. Change detection of surface mining activity and reclamation based on a machine learning approach of multi-temporal Landsat TM imagery. Geocarto Int. 2013, 28, 323–342. [Google Scholar] [CrossRef] [Scilit]
- Li, J.; Narayanan, R.M. Integrated spectral and spatial information mining in remote sensing imagery. IEEE Trans. Geo. Remote Sens. 2004, 42, 673–685. [Google Scholar] [CrossRef]
- Mountrakis, G.; Im, J.; Ogole, C. Support vector machines in remote sensing: A review. ISPRS J. Photogramm. Remote Sens. 2011, 66, 247–259. [Google Scholar] [CrossRef] [Scilit]
- Sheykhmousa, M.; Mahdianpari, M.; Ghanbari, H.; Mohammadimanesh, F.; Ghamisi, P.; Homayouni, S. Support Vector Machine Versus Random Forest for Remote Sensing Image Classification: A Meta-Analysis and Systematic Review. IEEE J. Sel. Top. Appl. Earth Obs. Remote Sens. 2020, 13, 6308–6325. [Google Scholar] [CrossRef] [Scilit]
- Cohen, W.B.; Yang, Z.; Healey, S.P.; Kennedy, R.E.; Gorelick, N. A LandTrendr multispectral ensemble for forest disturbance detection. Remote Sens. Environ. 2018, 205, 131–140. [Google Scholar] [CrossRef] [Scilit]
- Bright, B.C.; Hudak, A.T.; Kennedy, R.E.; Braaten, J.D.; Khalyani, A.H. Examining post-fire vegetation recovery with Landsat time series analysis in three western North American forest types. Fire Ecol. 2019, 15, 8. [Google Scholar] [CrossRef] [Scilit]
- Brown, L.; Chen, J.M.; Leblanc, S.G.; Cihlar, J. A Shortwave Infrared Modification to the Simple Ratio for LAI Retrieval in Boreal Forests: An Image and Model Analysis. Remote Sens. Environ. 2000, 71, 16–25. [Google Scholar] [CrossRef] [Scilit]
- Healey, S.P.; Yang, Z.; Cohen, W.B.; Pierce, D.J. Application of two regression-based methods to estimate the effects of partial harvest on forest structure using Landsat data. Remote Sens. Environ. 2006, 101, 115–126. [Google Scholar] [CrossRef] [Scilit]
- Schultz, B.; Immitzer, M.; Formaggio, A.R.; Sanches, I.D.A.; Luiz, A.J.B.; Atzberger, C. Self-Guided Segmentation and Classification of Multi-Temporal Landsat 8 Images for Crop Type Mapping in Southeastern Brazil. Remote Sens. 2015, 7, 14482–14508. [Google Scholar] [CrossRef] [Scilit]
- Chhabra, A.; Rüdiger, C.; Hilton, J.; Nolan, R.H.; Bendall, E.R.; Yebra, M.; Jagdhuber, T. Combined use of R-VSPI and VSPI for enhanced quantification of fire severity in southeastern Australian forests. Remote Sens. Environ. 2026, 333, 115163. [Google Scholar] [CrossRef] [Scilit]
- Cohen, W.B.; Spies, T.; Alig, R.J.; Oetter, D.R.; Maiersperger, T.K.; Fiorella, M. Characterizing 23 years (1972–95) of stand replacement disturbance in western Oregon forests with Landsat imagery. Ecosystems 2002, 5, 122−137. [Google Scholar] [CrossRef] [Scilit]
- Coops, N.C.; Wulder, M.A.; White, J.C. Identifying and describing forest disturbance and spatial pattern: Data selection issues and methodological implications. In Understanding Forest Disturbance and Spatial Pattern: Remote Sensing and GIS Approaches; Wulder, M.A., Franklin, S.E., Eds.; CRC Press (Taylor and Francis): Boca Raton, FL, USA, 2006; Chapter 2; pp. 31–61. [Google Scholar]
- Crist, E.P. A Landsat-TM tasseled cap equivalent transformation for reflectance factor data. Remote Sens. Environ. 1985, 17, 301−306. [Google Scholar] [CrossRef] [Scilit]
- Massetti, A.; Rüdiger, C.; Yebra, M.; Hilton, J. The Vegetation Structure Perpendicular Index (VSPI): A forest condition index for wildfire predictions. Remote Sens. Environ. 2019, 224, 167–181. [Google Scholar] [CrossRef] [Scilit]
- Chuvieco, E.; Riaño, D.; Danson, F.M.; Martin, P. Use of a radiative transfer model to simulate the postfire spectral response to burn severity. J. Geophys. Res. Biogeosci. 2006, 111, G04S09. [Google Scholar] [CrossRef] [Scilit]
- Ahmad, I.; Stephen, H. Analyzing Surface Spectral Signature Shifts in Fire-Affected Areas of Elko County Nevada. Fire 2025, 8, 429. [Google Scholar] [CrossRef] [Scilit]
- Reid, R.E.; Sherstabetoff, J.N. Vegetation and Forest Productivity: Syncrude Lease 22; Hardy Associates Ltd.: Calgary, AB, Canada, 1984; 78p, Available online: https://ualberta.scholaris.ca/items/6cd938d3-27b9-4507-8419-f87637026937 (accessed on 1 April 2026).
- Government of Canada. Alberta Historical Wildfire Database: 2006 to 2025. Available online: https://app.geo.ca/en-ca/map-browser/record/a221e7a0-4f46-4be7-9c5a-e29de9a3447e (accessed on 25 May 2026).
- Cullingham, C.I.; Cooke, J.E.; Dang, S.; Davis, C.S.; Cooke, B.J.; Coltman, D.W. Mountain pine beetle host-range expansion threatens the boreal forest. Mol. Ecol. 2011, 20, 2157–2171. [Google Scholar] [CrossRef] [Scilit] [PubMed]
- Anderson, K.; Reuter, G.; Flannigan, M.D. Fire-growth modelling using meteorological data with random and systematic perturbations. Int. J. Wildland Fire 2007, 16, 174–182. [Google Scholar] [CrossRef] [Scilit]
- Hu, C.; Lu, Y.; Sun, S.; Liu, Y. Optical Remote Sensing of Oil Spills in the Ocean: What Is Really Possible? J. Remote Sens. 2021, 2021, 1–14. [Google Scholar] [CrossRef] [Scilit]
- Kurek, J.; Kirk, J.L.; Muir, D.C.G.; Wang, X.; Evans, M.S.; Smol, J.P. Legacy of a half century of Athabasca oil sands development recorded by lake ecosystems. Proc. Natl. Acad. Sci. USA 2013, 110, 1761–1766. [Google Scholar] [CrossRef] [Scilit]
- Strilesky, S.L.; Humphreys, E.R.; Carey, S.K. Forest water use in the initial stages of reclamation in the Athabasca Oil Sands Region. Hydrol. Process. 2017, 31, 2781–2792. [Google Scholar] [CrossRef] [Scilit]
- Government of Alberta. Oil Sands Facts and Statistics, 2026. Available online: https://www.alberta.ca/oil-sands-facts-and-statistics.aspx (accessed on 1 April 2026).
- Montgomery, J.; Mahoney, C.; Nasr, M.; Cobbaert, D. The Extent of Anthropogenic Disturbance on Wetland Area in the Oil Sands Region of Alberta, Canada Between 2000 and 2018. Land 2025, 14, 336. [Google Scholar] [CrossRef] [Scilit]
- Daly, C.A. History of wetland reclamation in the Alberta oil sands. In Mine Closure 2011: In Proceedings of the Sixth International Conference on Mine Closure; Fourie, A.B., Tibbett, M., Beersing, A., Eds.; Australian Centre for Geomechanics: Perth, Australia, 2011; pp. 535–544. [Google Scholar]
- Government of Alberta. Severe Infestation of Caterpillars Feeds on Alberta’s Aspen Forests, 2026. Available online: https://www.alberta.ca/release.cfm?xID=2173978080a16-e2e5-52a3-76ff171953c178b9 (accessed on 25 May 2026).
- Gonzalès, R.; Parrott, L. How stakeholders structure their collaborations to anticipate and tackle the threat of mountain pine beetle in the Jasper–Hinton (Alberta, Canada) area. Can. J. For. Res. 2019, 49, 480–490. [Google Scholar] [CrossRef] [Scilit]
- Li, W.; Bai, Y.; Chen, Z.; Lou, S.; Liao, Y. Spatiotemporal analysis of wildfires in Alberta, Canada over the past sixty years: Increased wildfire frequency by human activities. J. Environ. Man. 2025, 380, 124963. [Google Scholar] [CrossRef] [Scilit]
- Zhang, Y.; Shotyk, W.; Pelletier, R.; Zaccone, C.; Noernberg, T.; Mullan-Boudreau, G.; Martin, J.W. Sources, spatial-distributions and fluxes of PAH-contaminated dusts in the Athabasca oil sands region. Environ. Int. 2023, 182, 108335. [Google Scholar] [CrossRef] [Scilit]
- Kelly, E.N.; Schindler, D.W.; Hodson, P.V.; Short, J.W.; Radmanovich, R.; Nielsen, C.C. Oil sands development contributes elements toxic at low concentrations to the Athabasca River and its tributaries. Proc. Natl. Acad. Sci. USA 2010, 107, 16178–16183. [Google Scholar] [CrossRef] [Scilit]
- Wrona, F.J.; Di-Cenzo, P. Lower Athabasca Water Quality Monitoring Program. Phase 1: Athabasca River Mainstream and Major Tributaries, 2011. Available online: https://www.ec.gc.ca/doc/publications/pollution/COM1396/index-eng.htm (accessed on 25 May 2026).
- Klemt, W.H.; Brua, R.B.; Culp, J.M.; Hicks, K.; Wolfe, B.B.; Hal, R.I. Evaluating Lower Athabasca River Sediment Metal Concentrations from Alberta Oil Sands Monitoring Programs Using Predevelopment Baselines. Environ. Sci. Technol. 2021, 55, 8817–8828. [Google Scholar] [CrossRef] [Scilit]
- Yang, F.; Cheng, I.; Al-Mamun, A.; Zhang, L. Measurement constrained emission estimates of alkylated polycyclic aromatic hydrocarbons in the Canadian Athabasca oil sands region. Environ. Pol. 2024, 68, 123602. [Google Scholar] [CrossRef] [Scilit]
- Culp, J.M.; Droppo, I.G.; di Cenzo, P.D.; Alexander, A.C.; Baird, D.J.; Beltaos, S.; Bickerton, G.; Bonsal, B.; Brua, R.B.; Chambers, P.A.; et al. Ecological effects and causal synthesis of oil sands activityimpacts on river ecosystems: Water synthesis review. Environ. Rev. 2021, 29, 315–327. [Google Scholar] [CrossRef] [Scilit]
- Alexander, A.C.; Chambers, P.A. Assessment of seven Canadian rivers in relation to stages in oil sands industrial development, 1972–2010. Environ. Rev. 2016, 24, 484–494. [Google Scholar] [CrossRef] [Scilit]
- Mahoney, C.; Montgomery, J.; Connor, S.; Cobbaert, D. Oil Sands Wetland Ecosystem Monitoring Program Indicators in Alberta, Canada: Transitioning from Pilot to Long-Term Monitoring. Water 2023, 15, 1914. [Google Scholar] [CrossRef] [Scilit]
- Wu, S.Y. Soil and Vegetation Properties on Reclaimed Oil Sands in Alberta, Canada: A Synthetic Review; Report; Faculty of Forestry, University of British Columbia: Vancouver, BC, Canada, 2015; 52p, Available online: https://open.library.ubc.ca/media/stream/pdf/42591/1.0132674/4 (accessed on 26 May 2026).
- Rosa, L.; Davis, K.F.; Rulli, M.C.; D’Odorico, P. Environmental consequences of oil production from oil sands. Earth’s Future 2017, 5, 158–170. [Google Scholar] [CrossRef] [Scilit]
- Yeh, S.; Jordaan, S.M.; Brandt, A.R.; Turetsky, M.R.; Spatari, S.; Keith, D.W. Land use greenhouse gas emissions from conventional oil production and oil sands. Environ. Sci. Technol. 2010, 15, 8766–8772. [Google Scholar] [CrossRef] [Scilit]
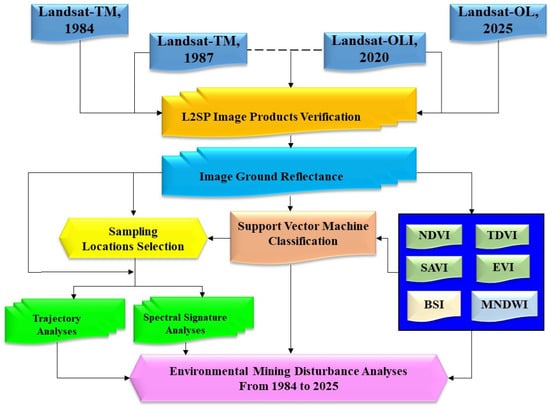
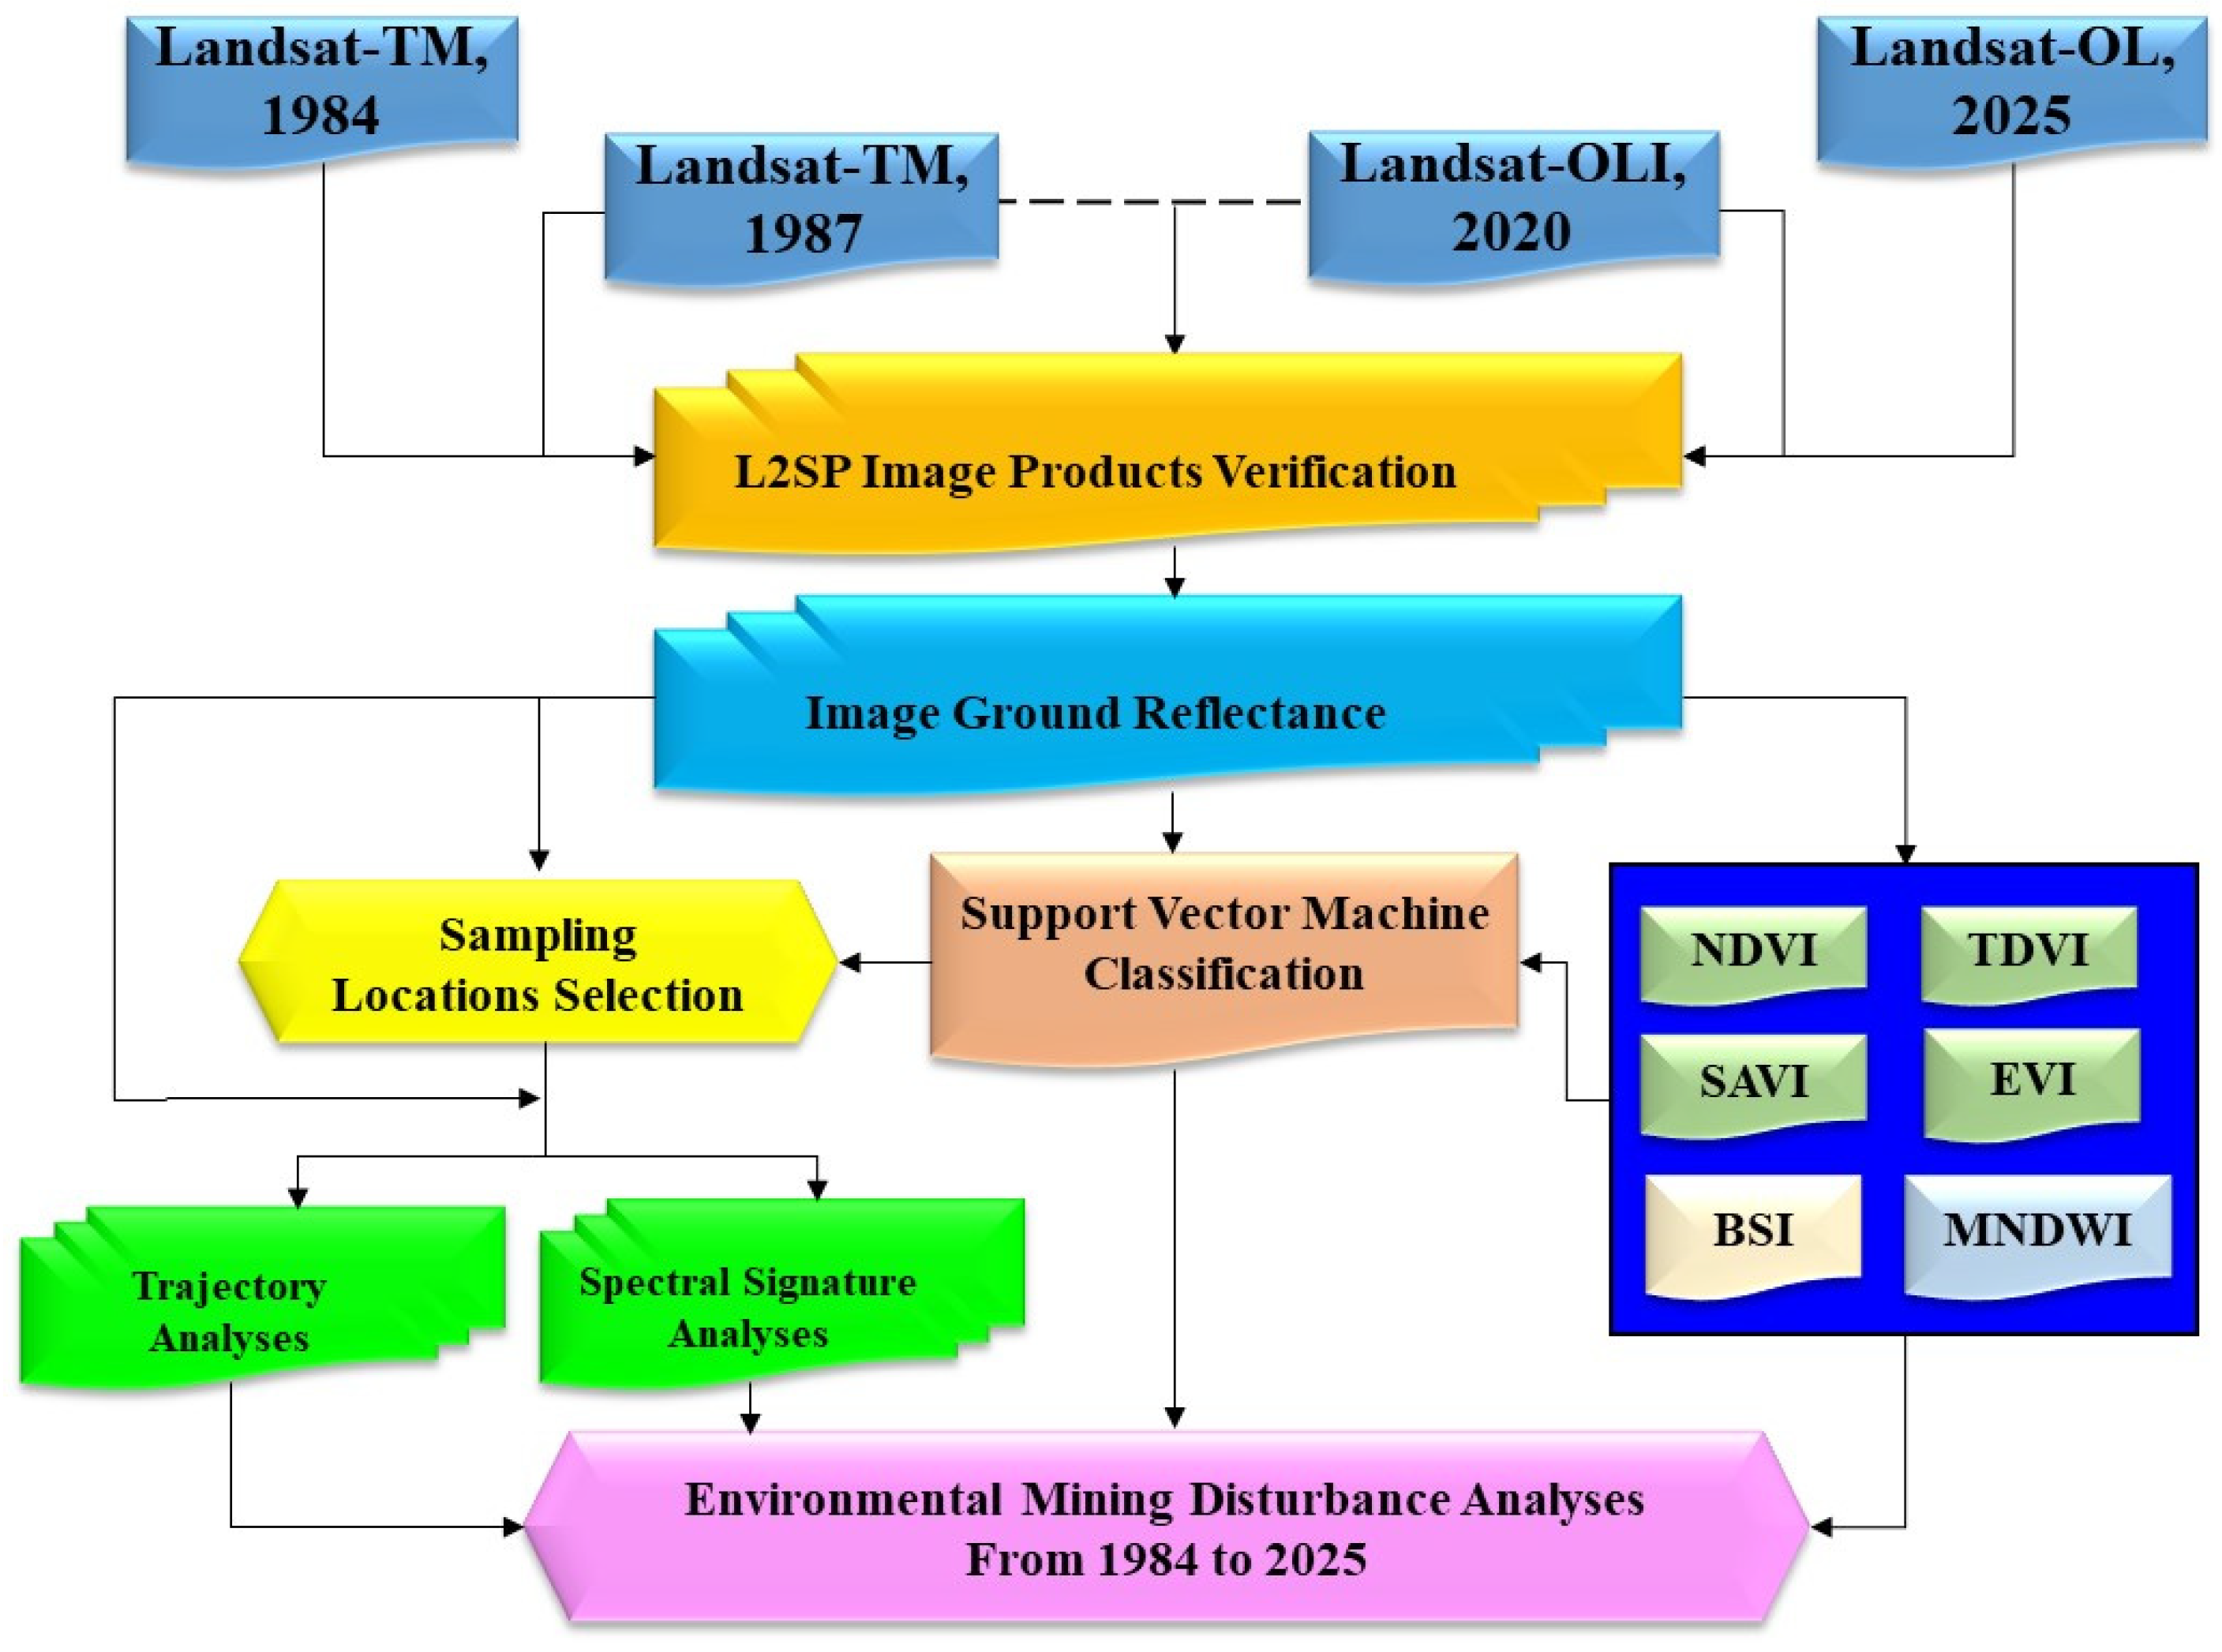
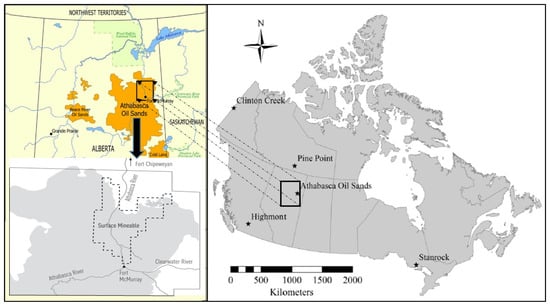
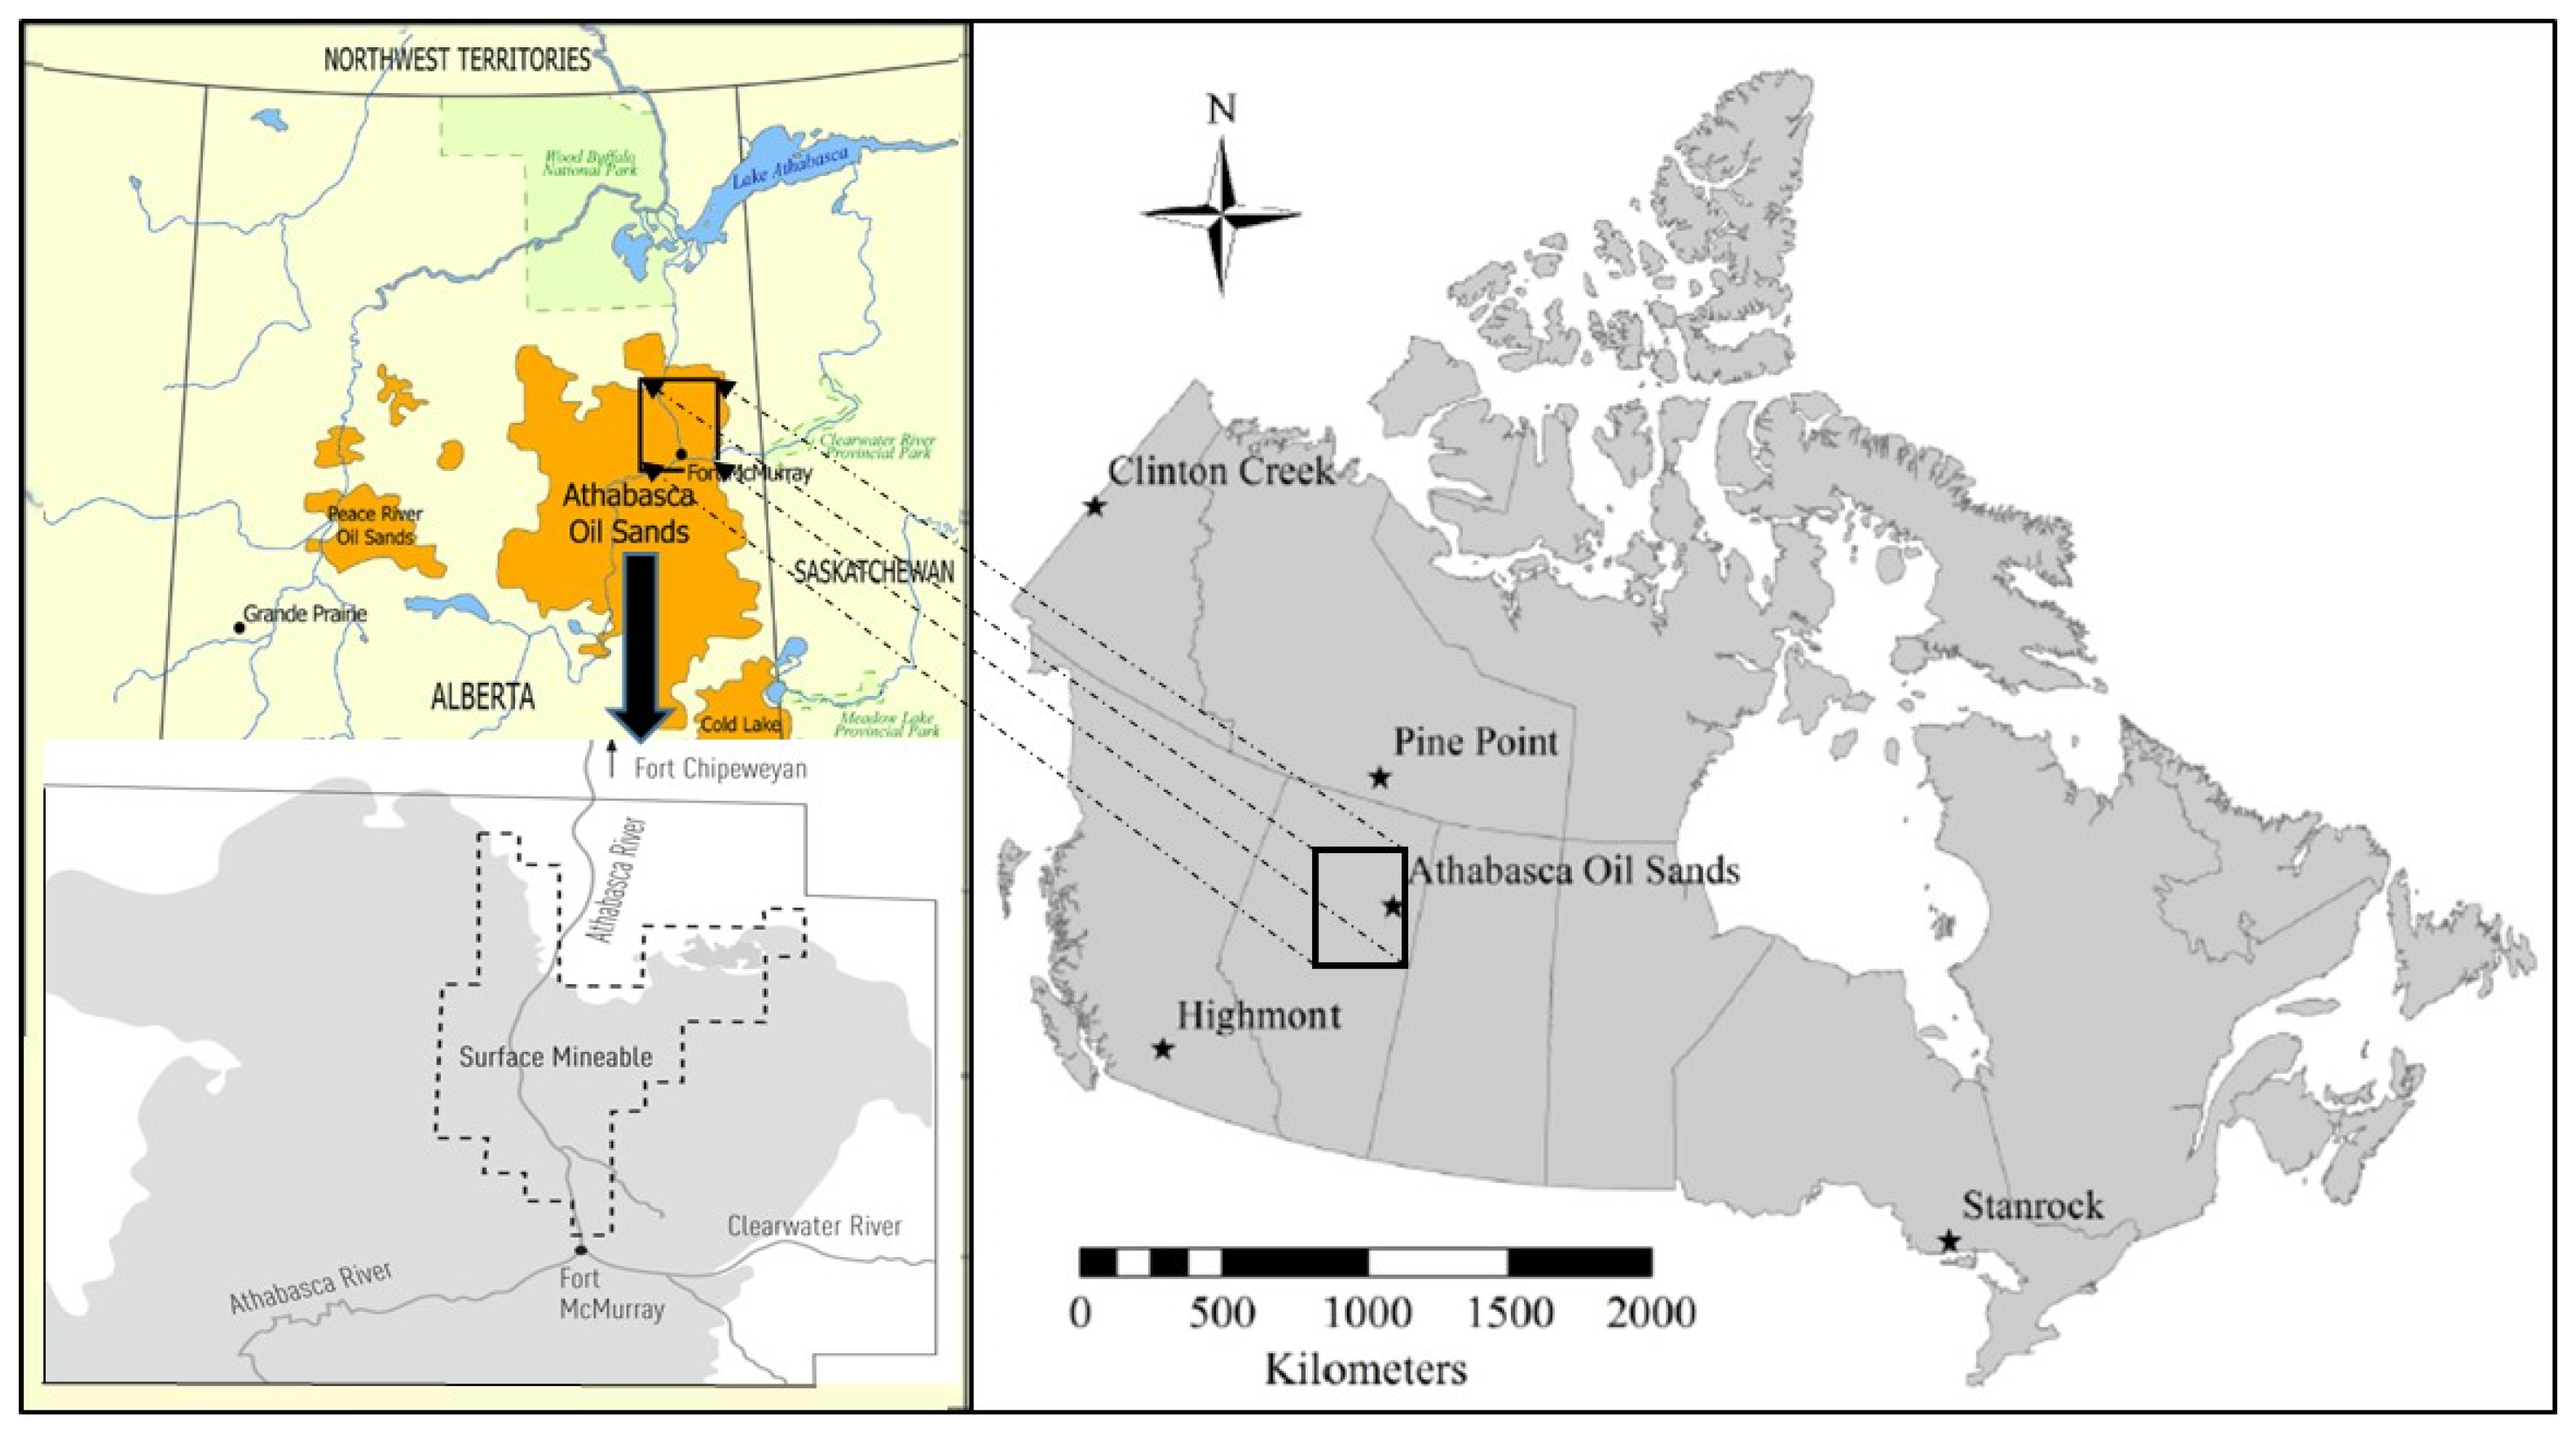
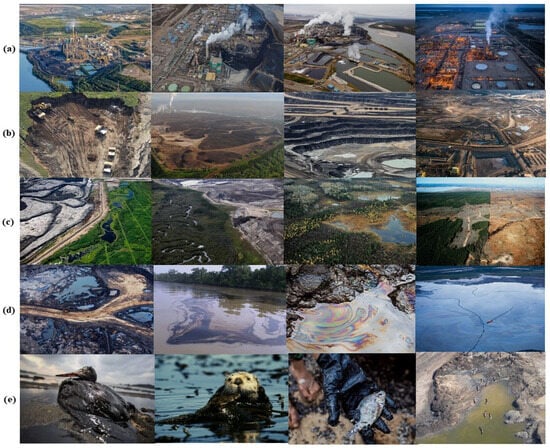
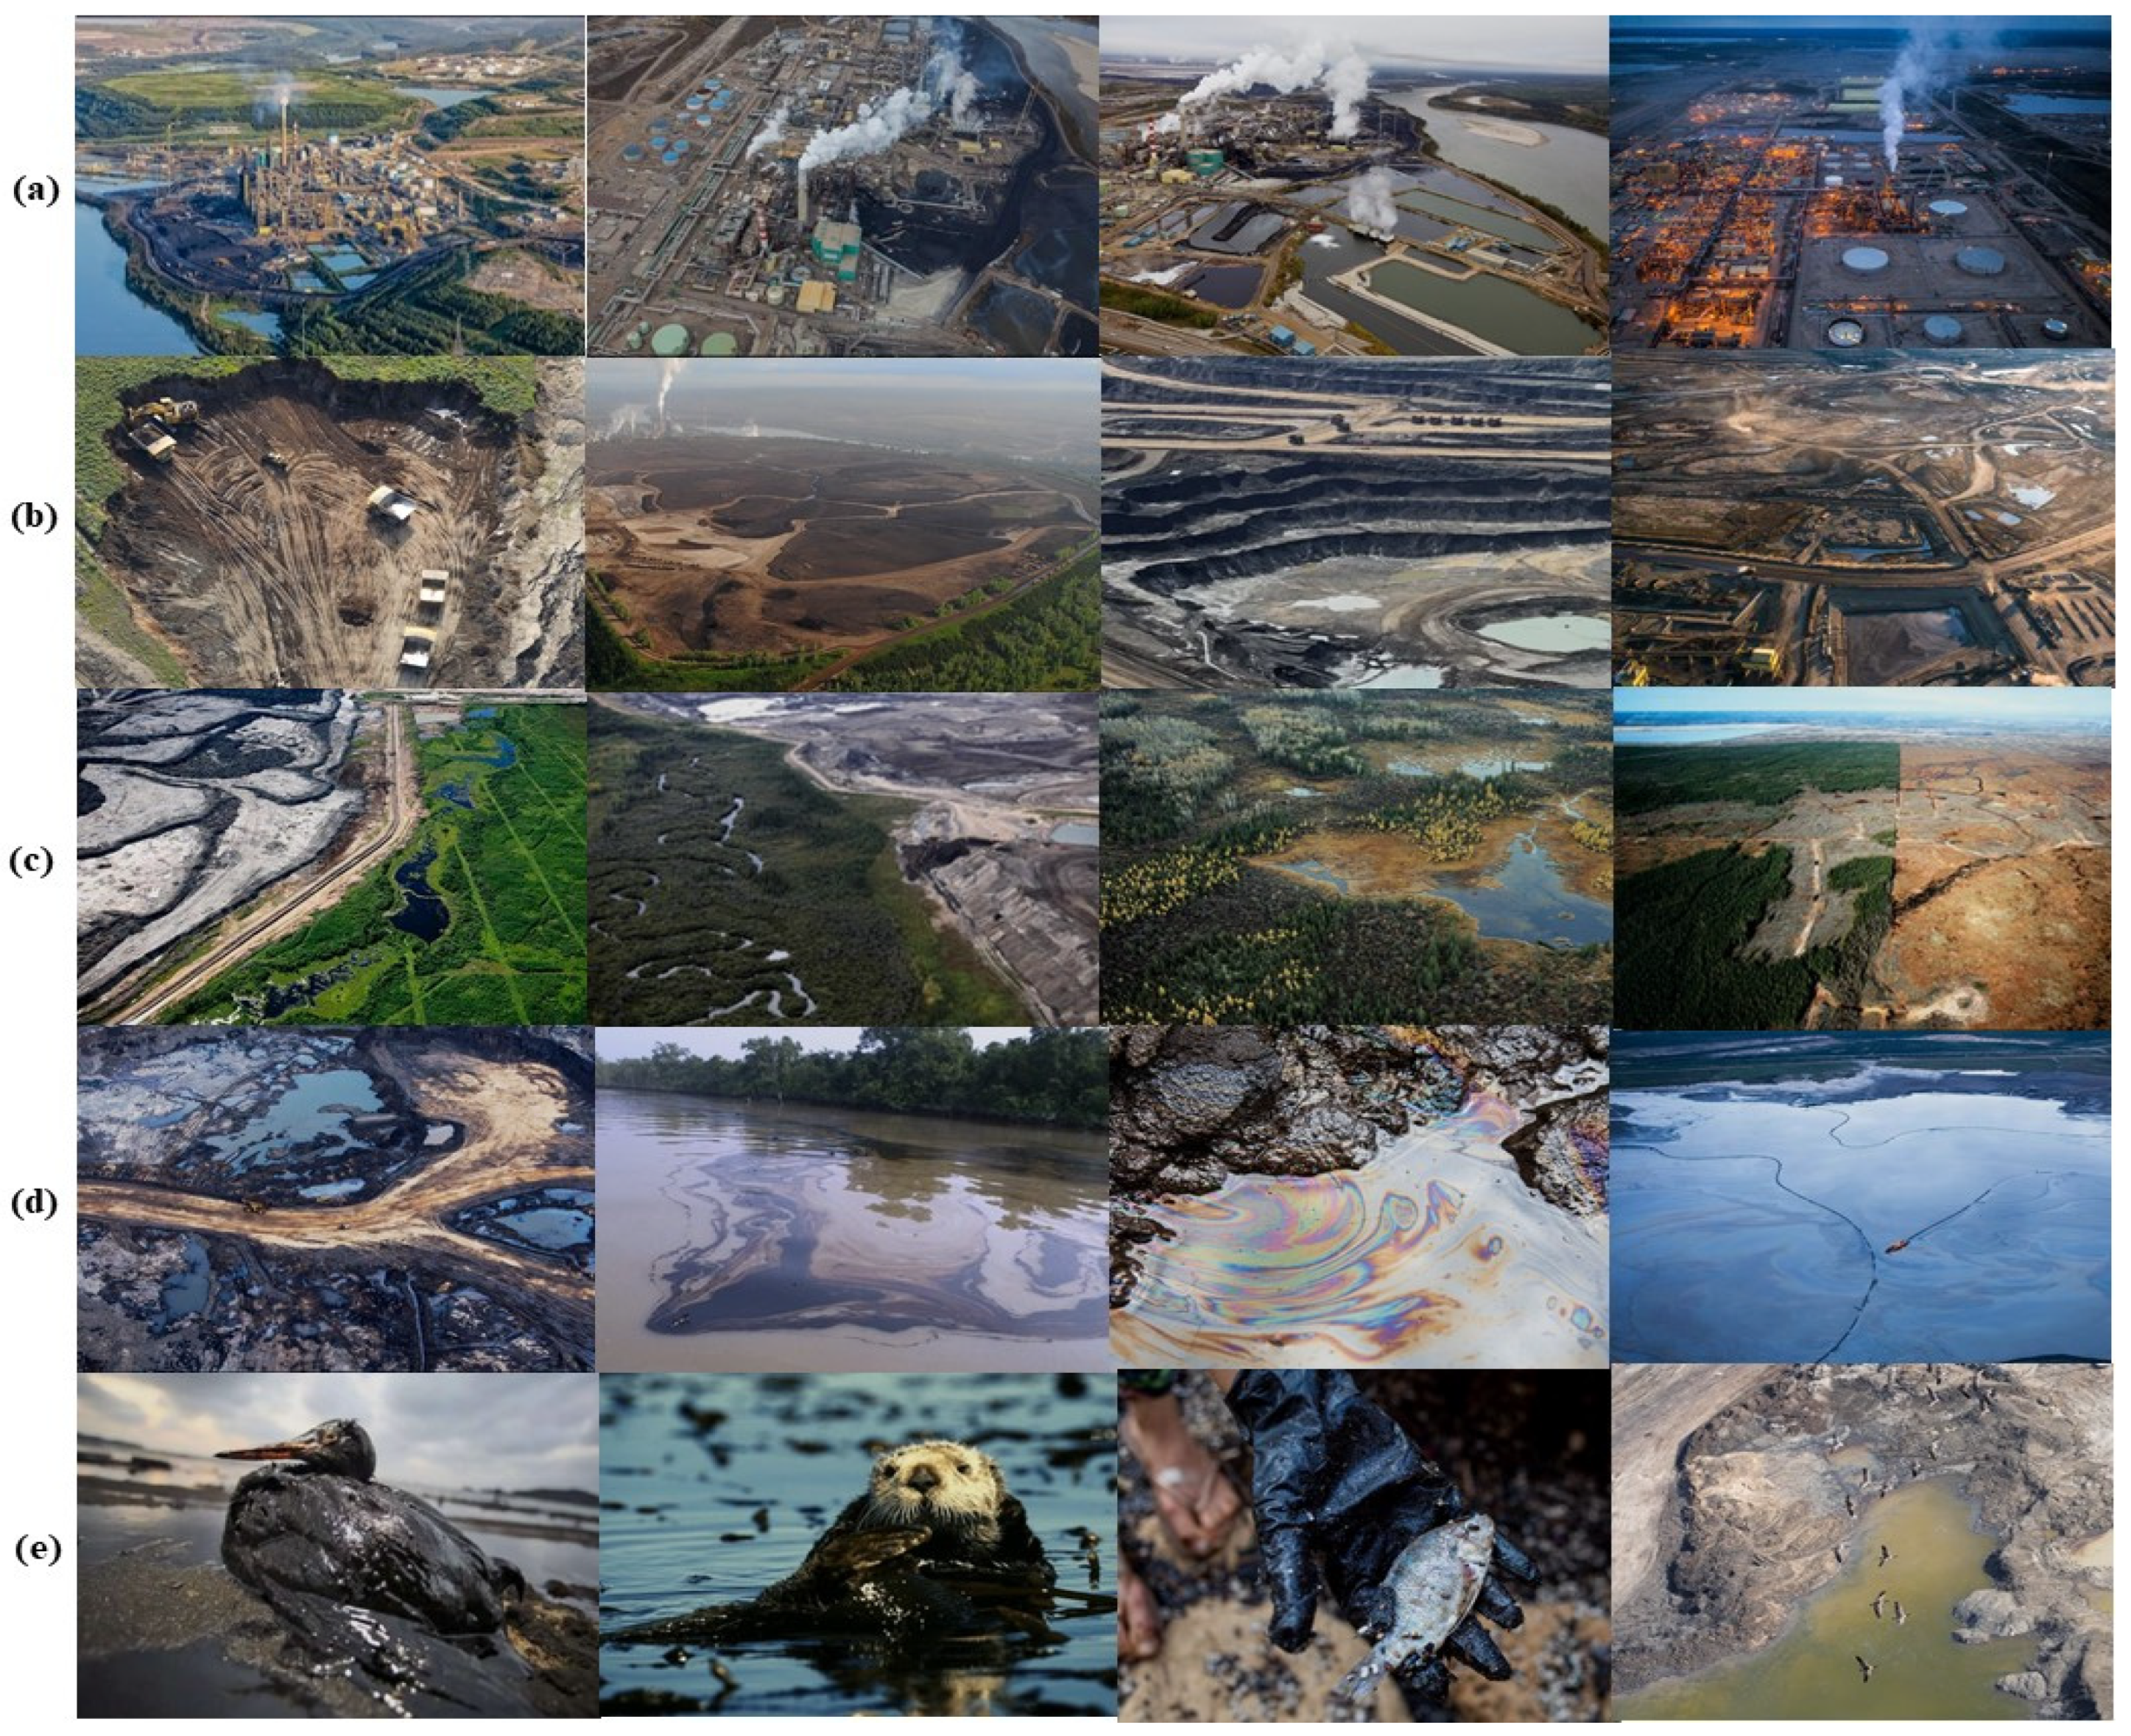
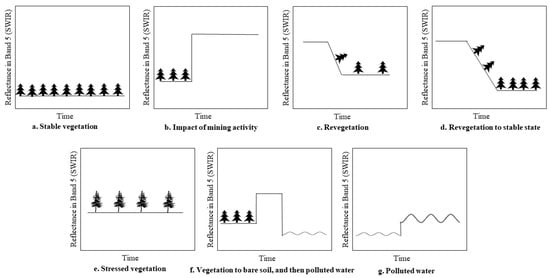
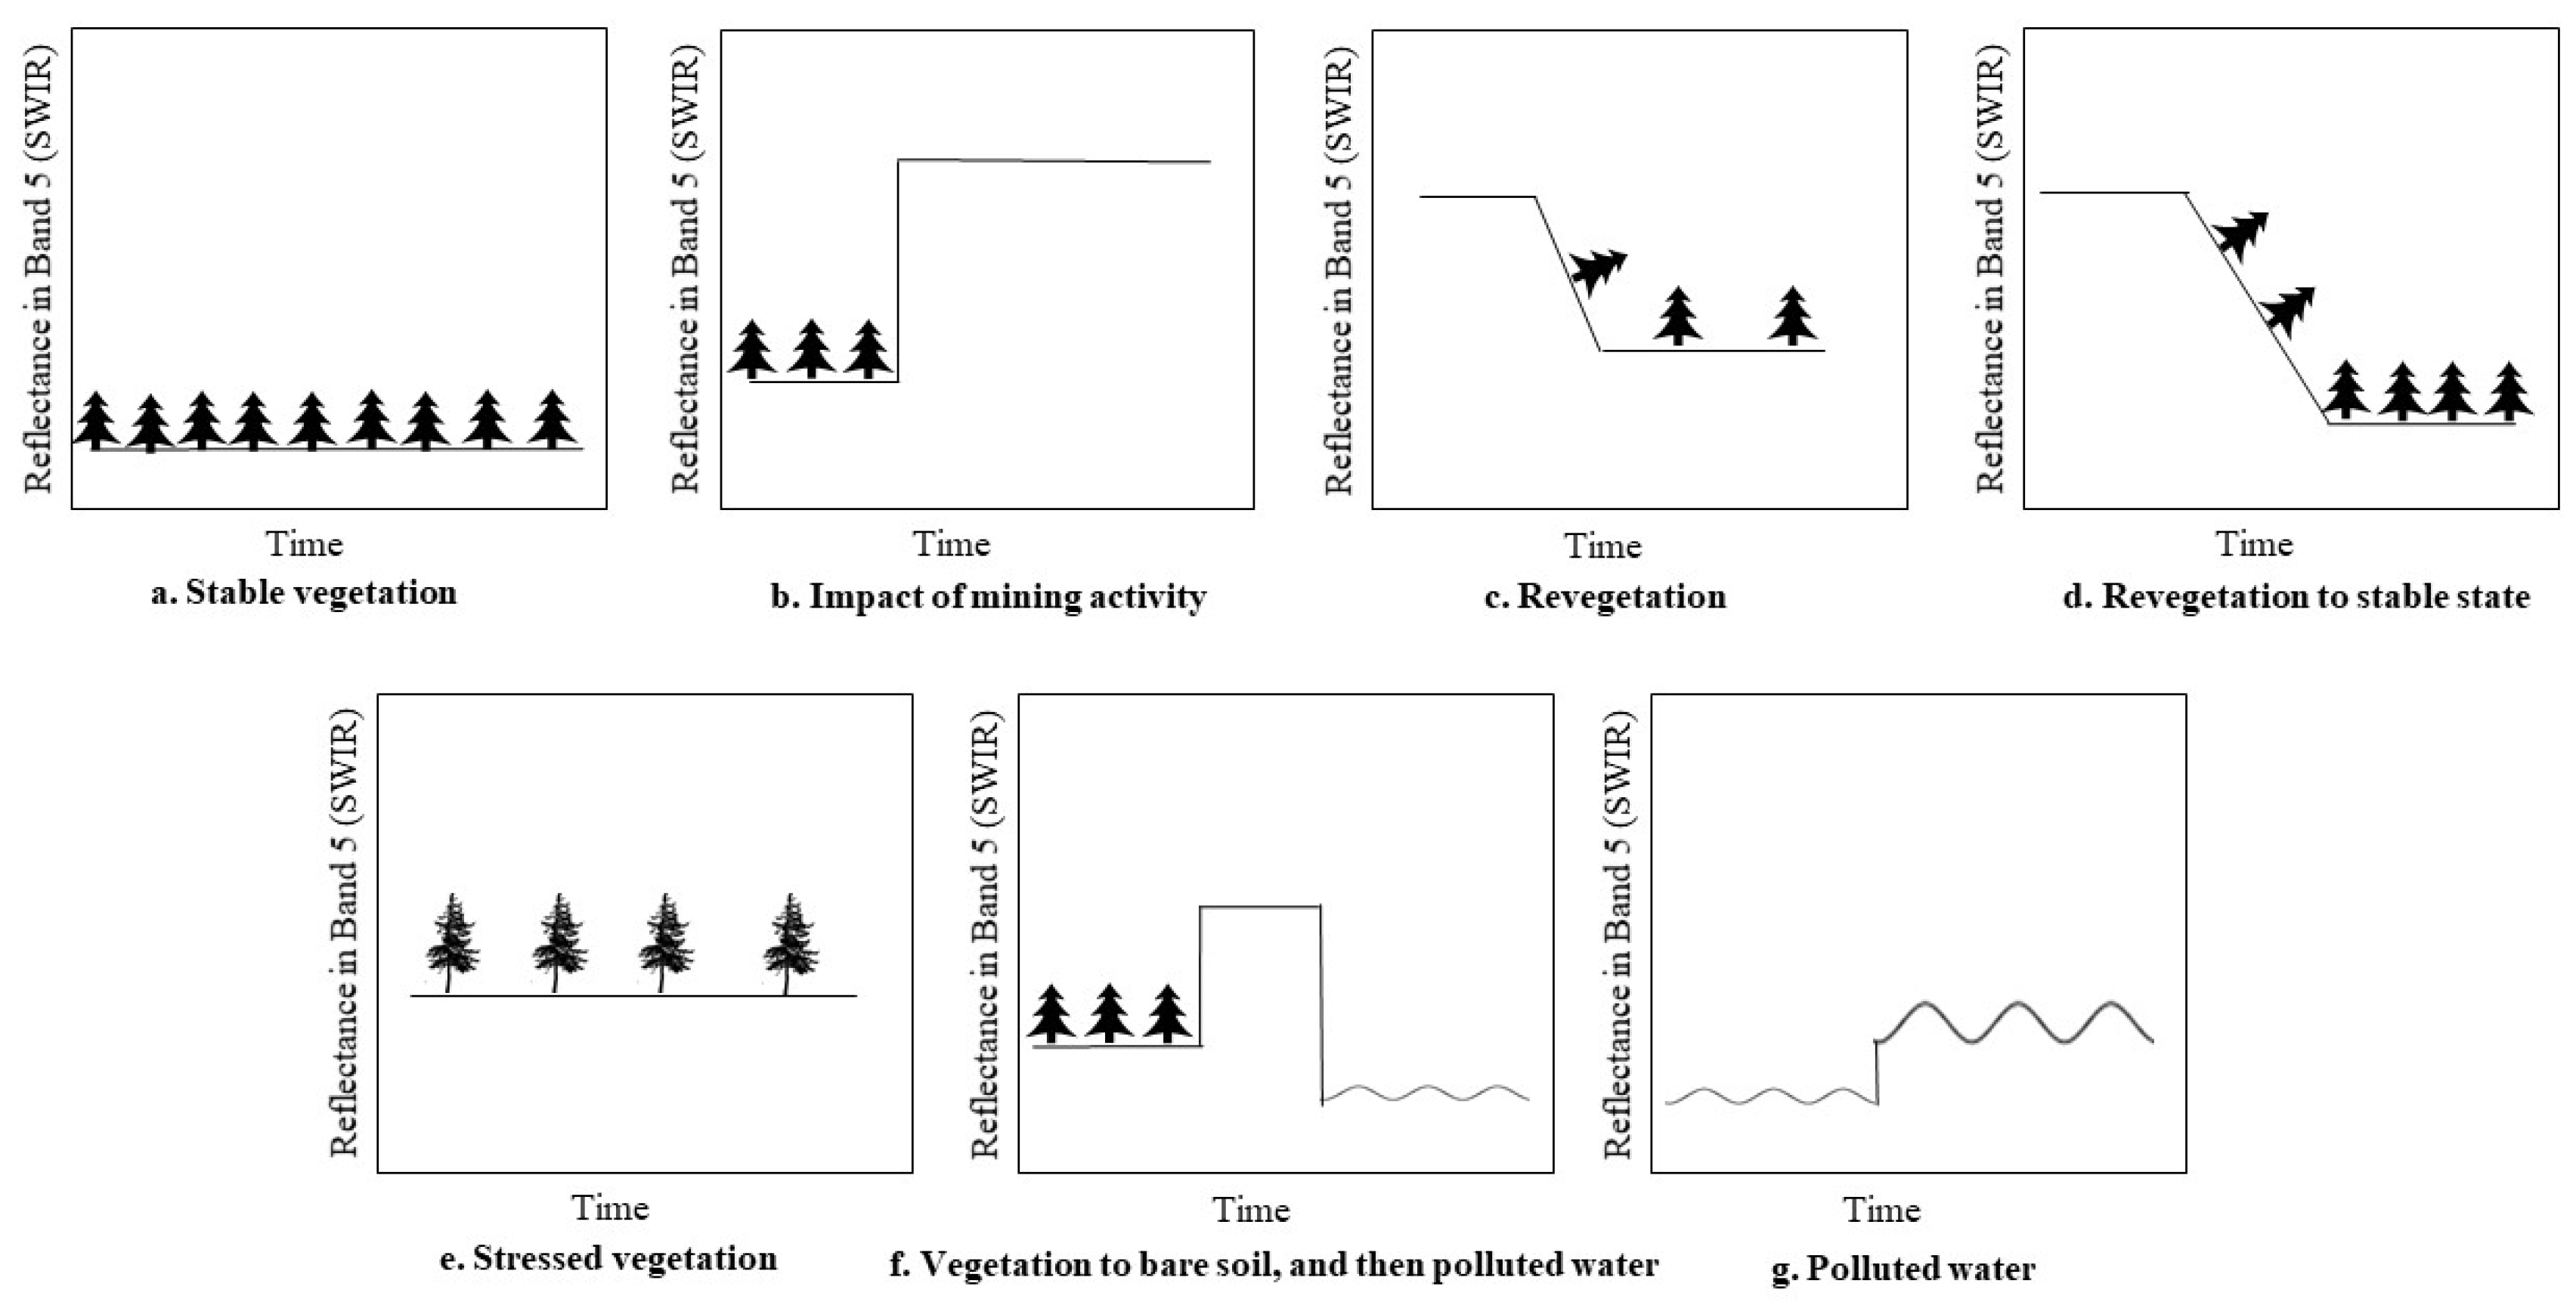
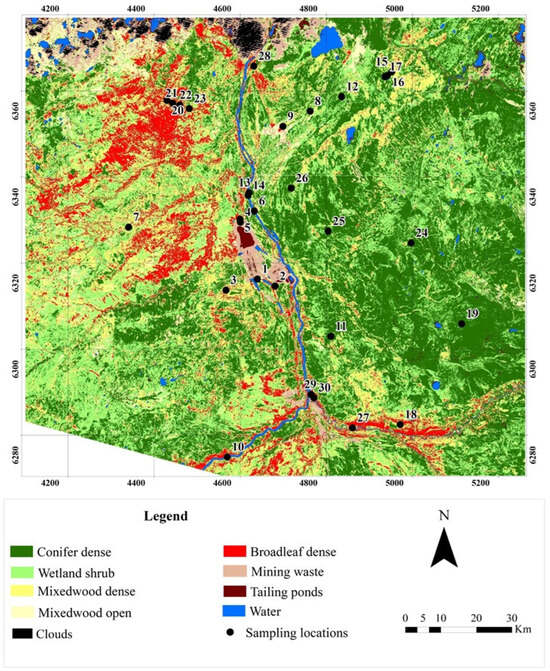
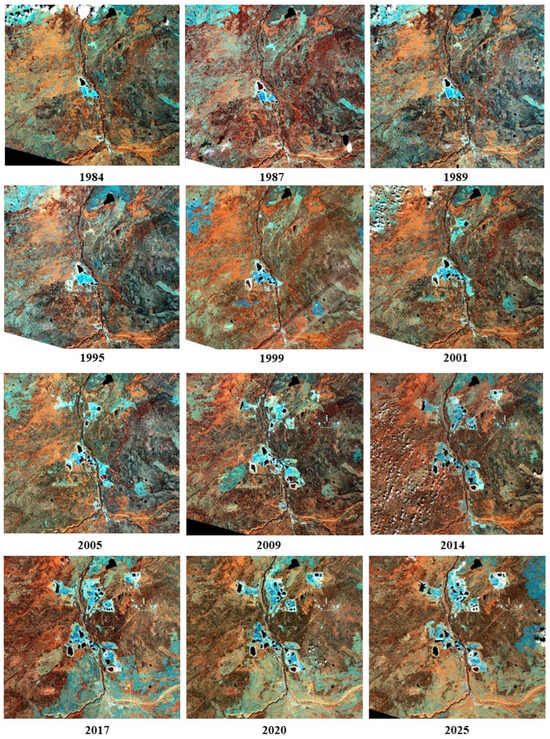
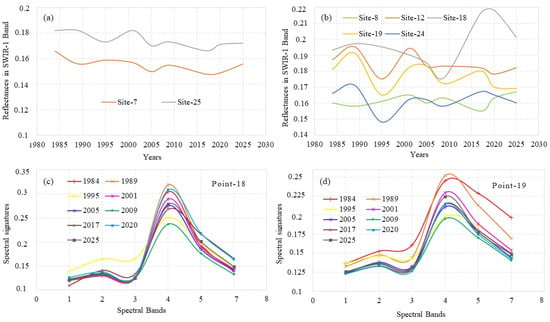
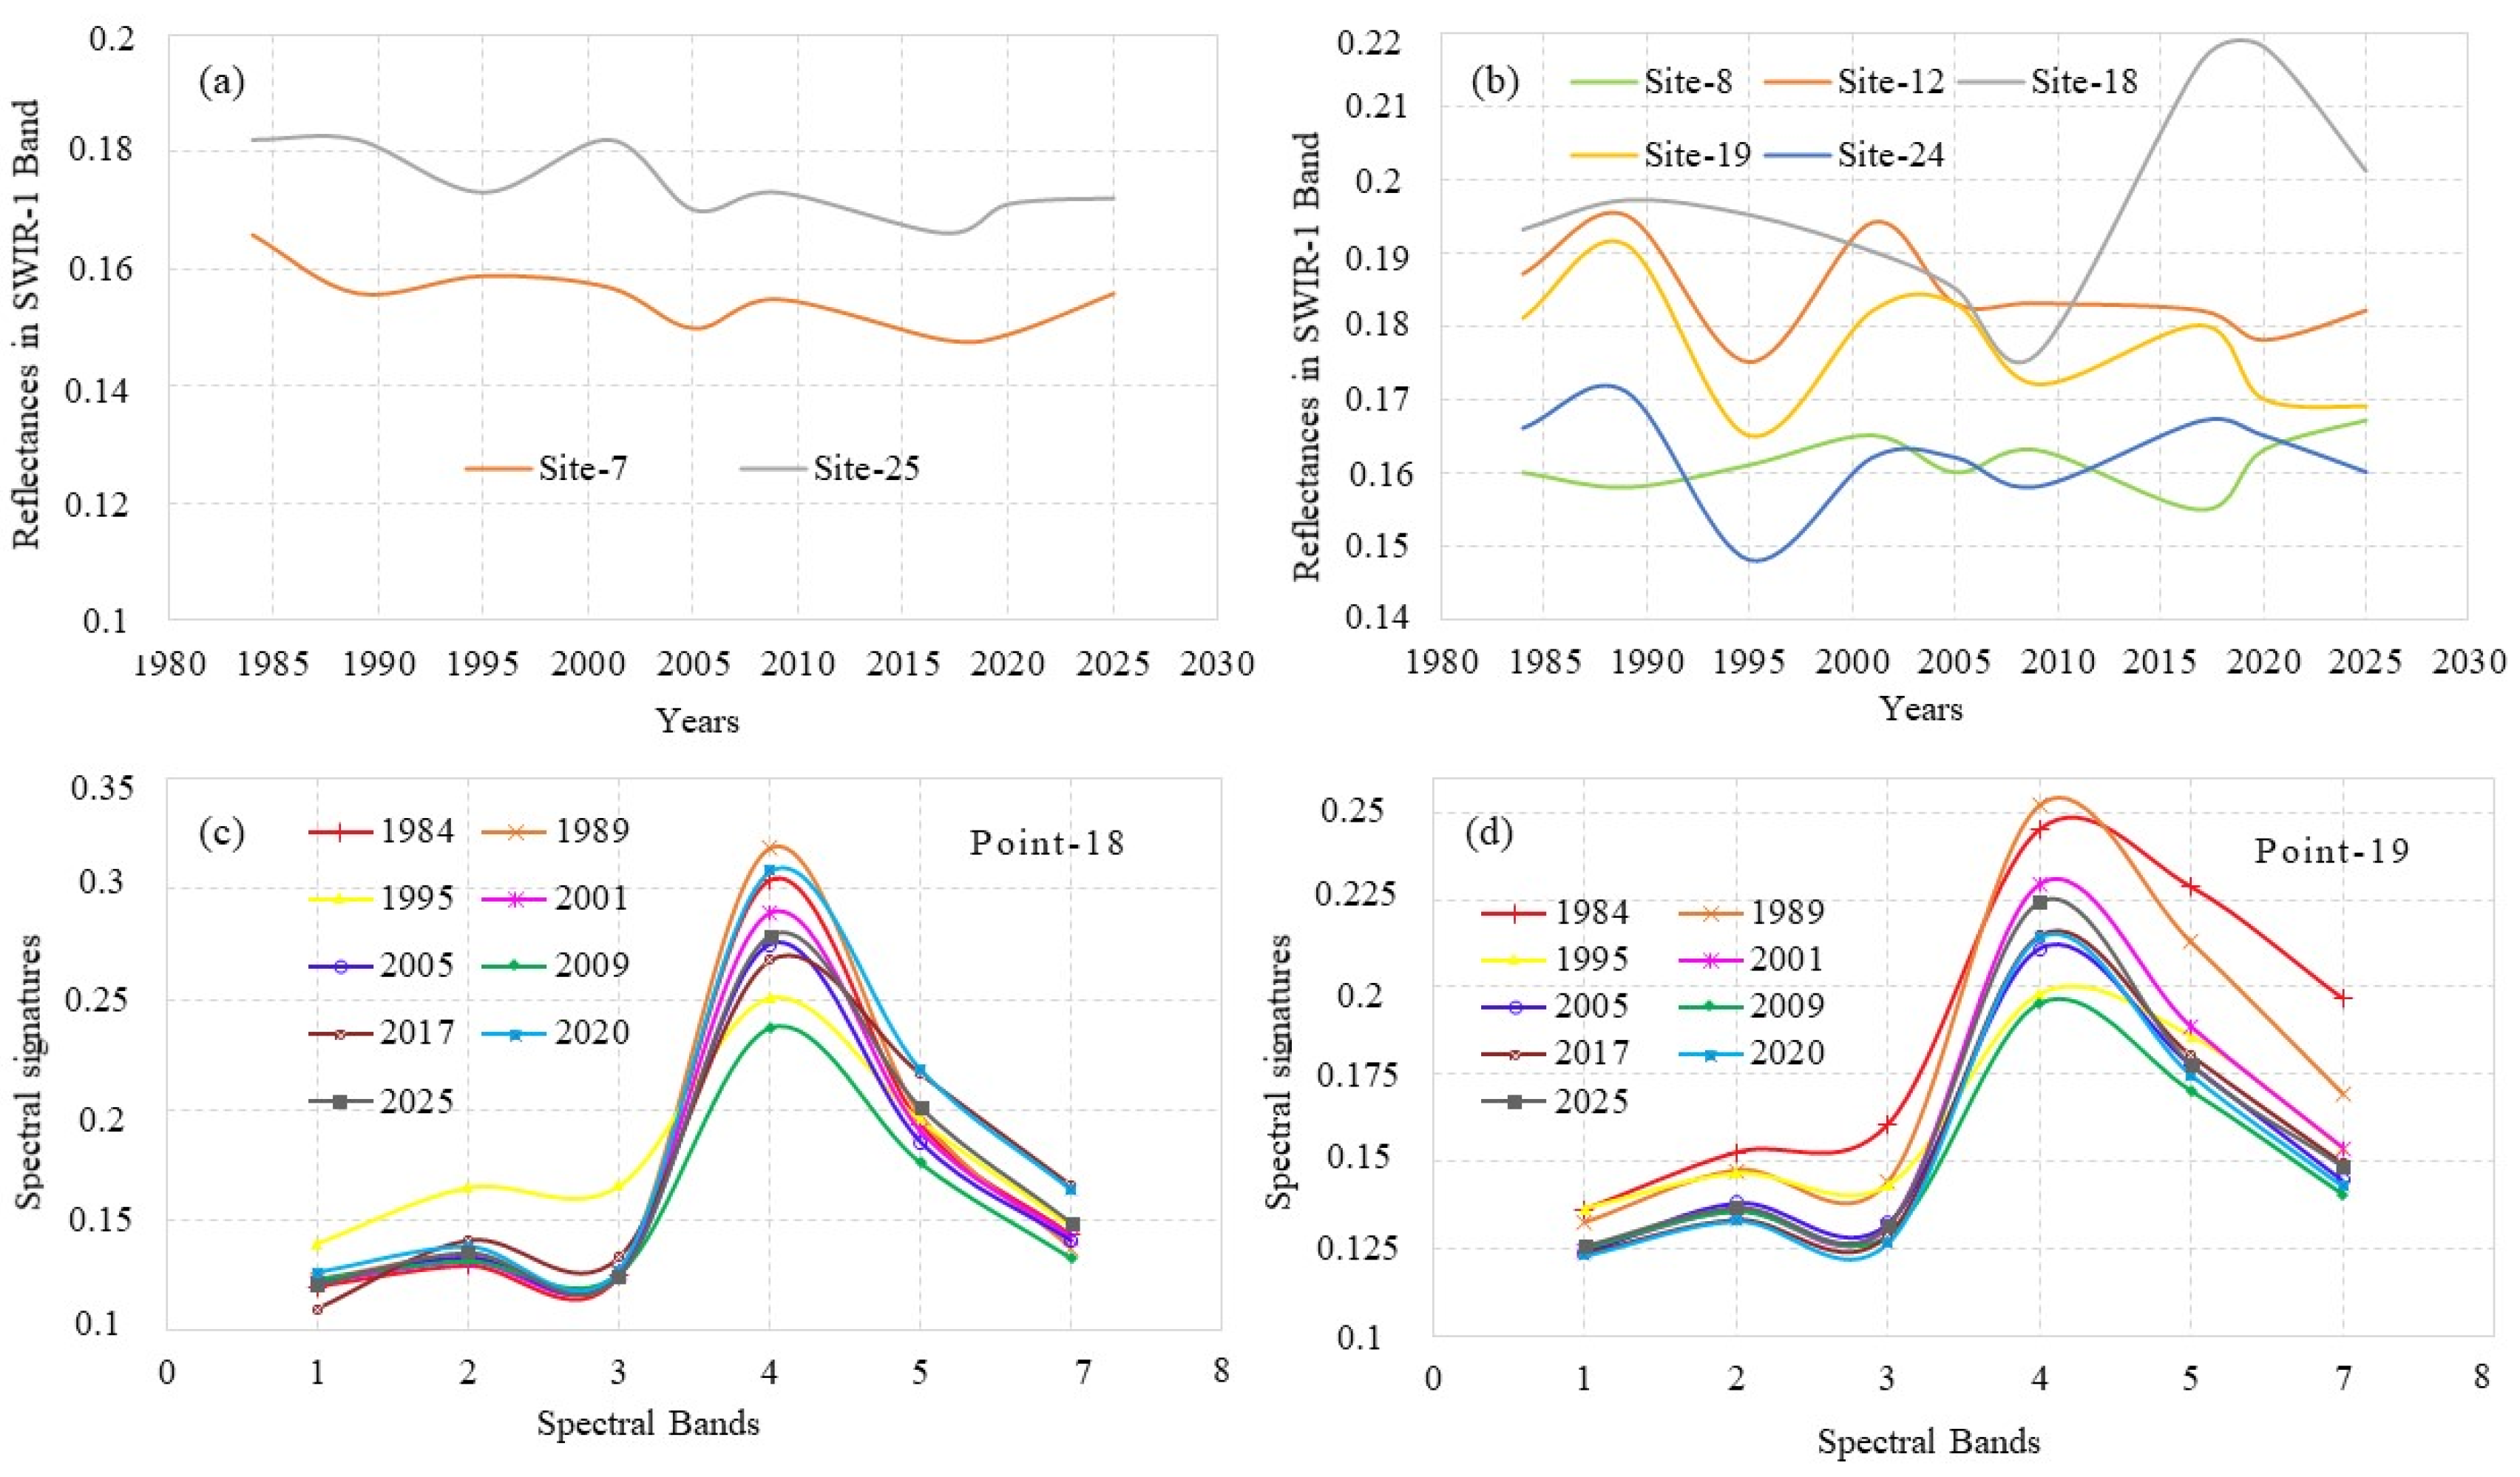
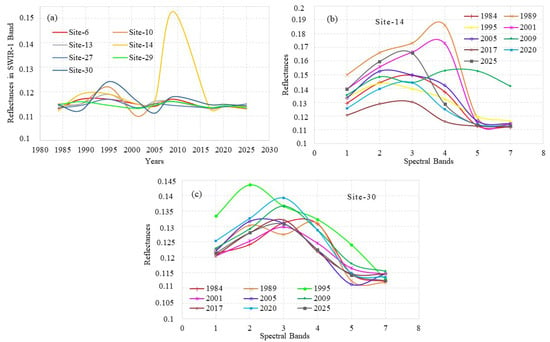
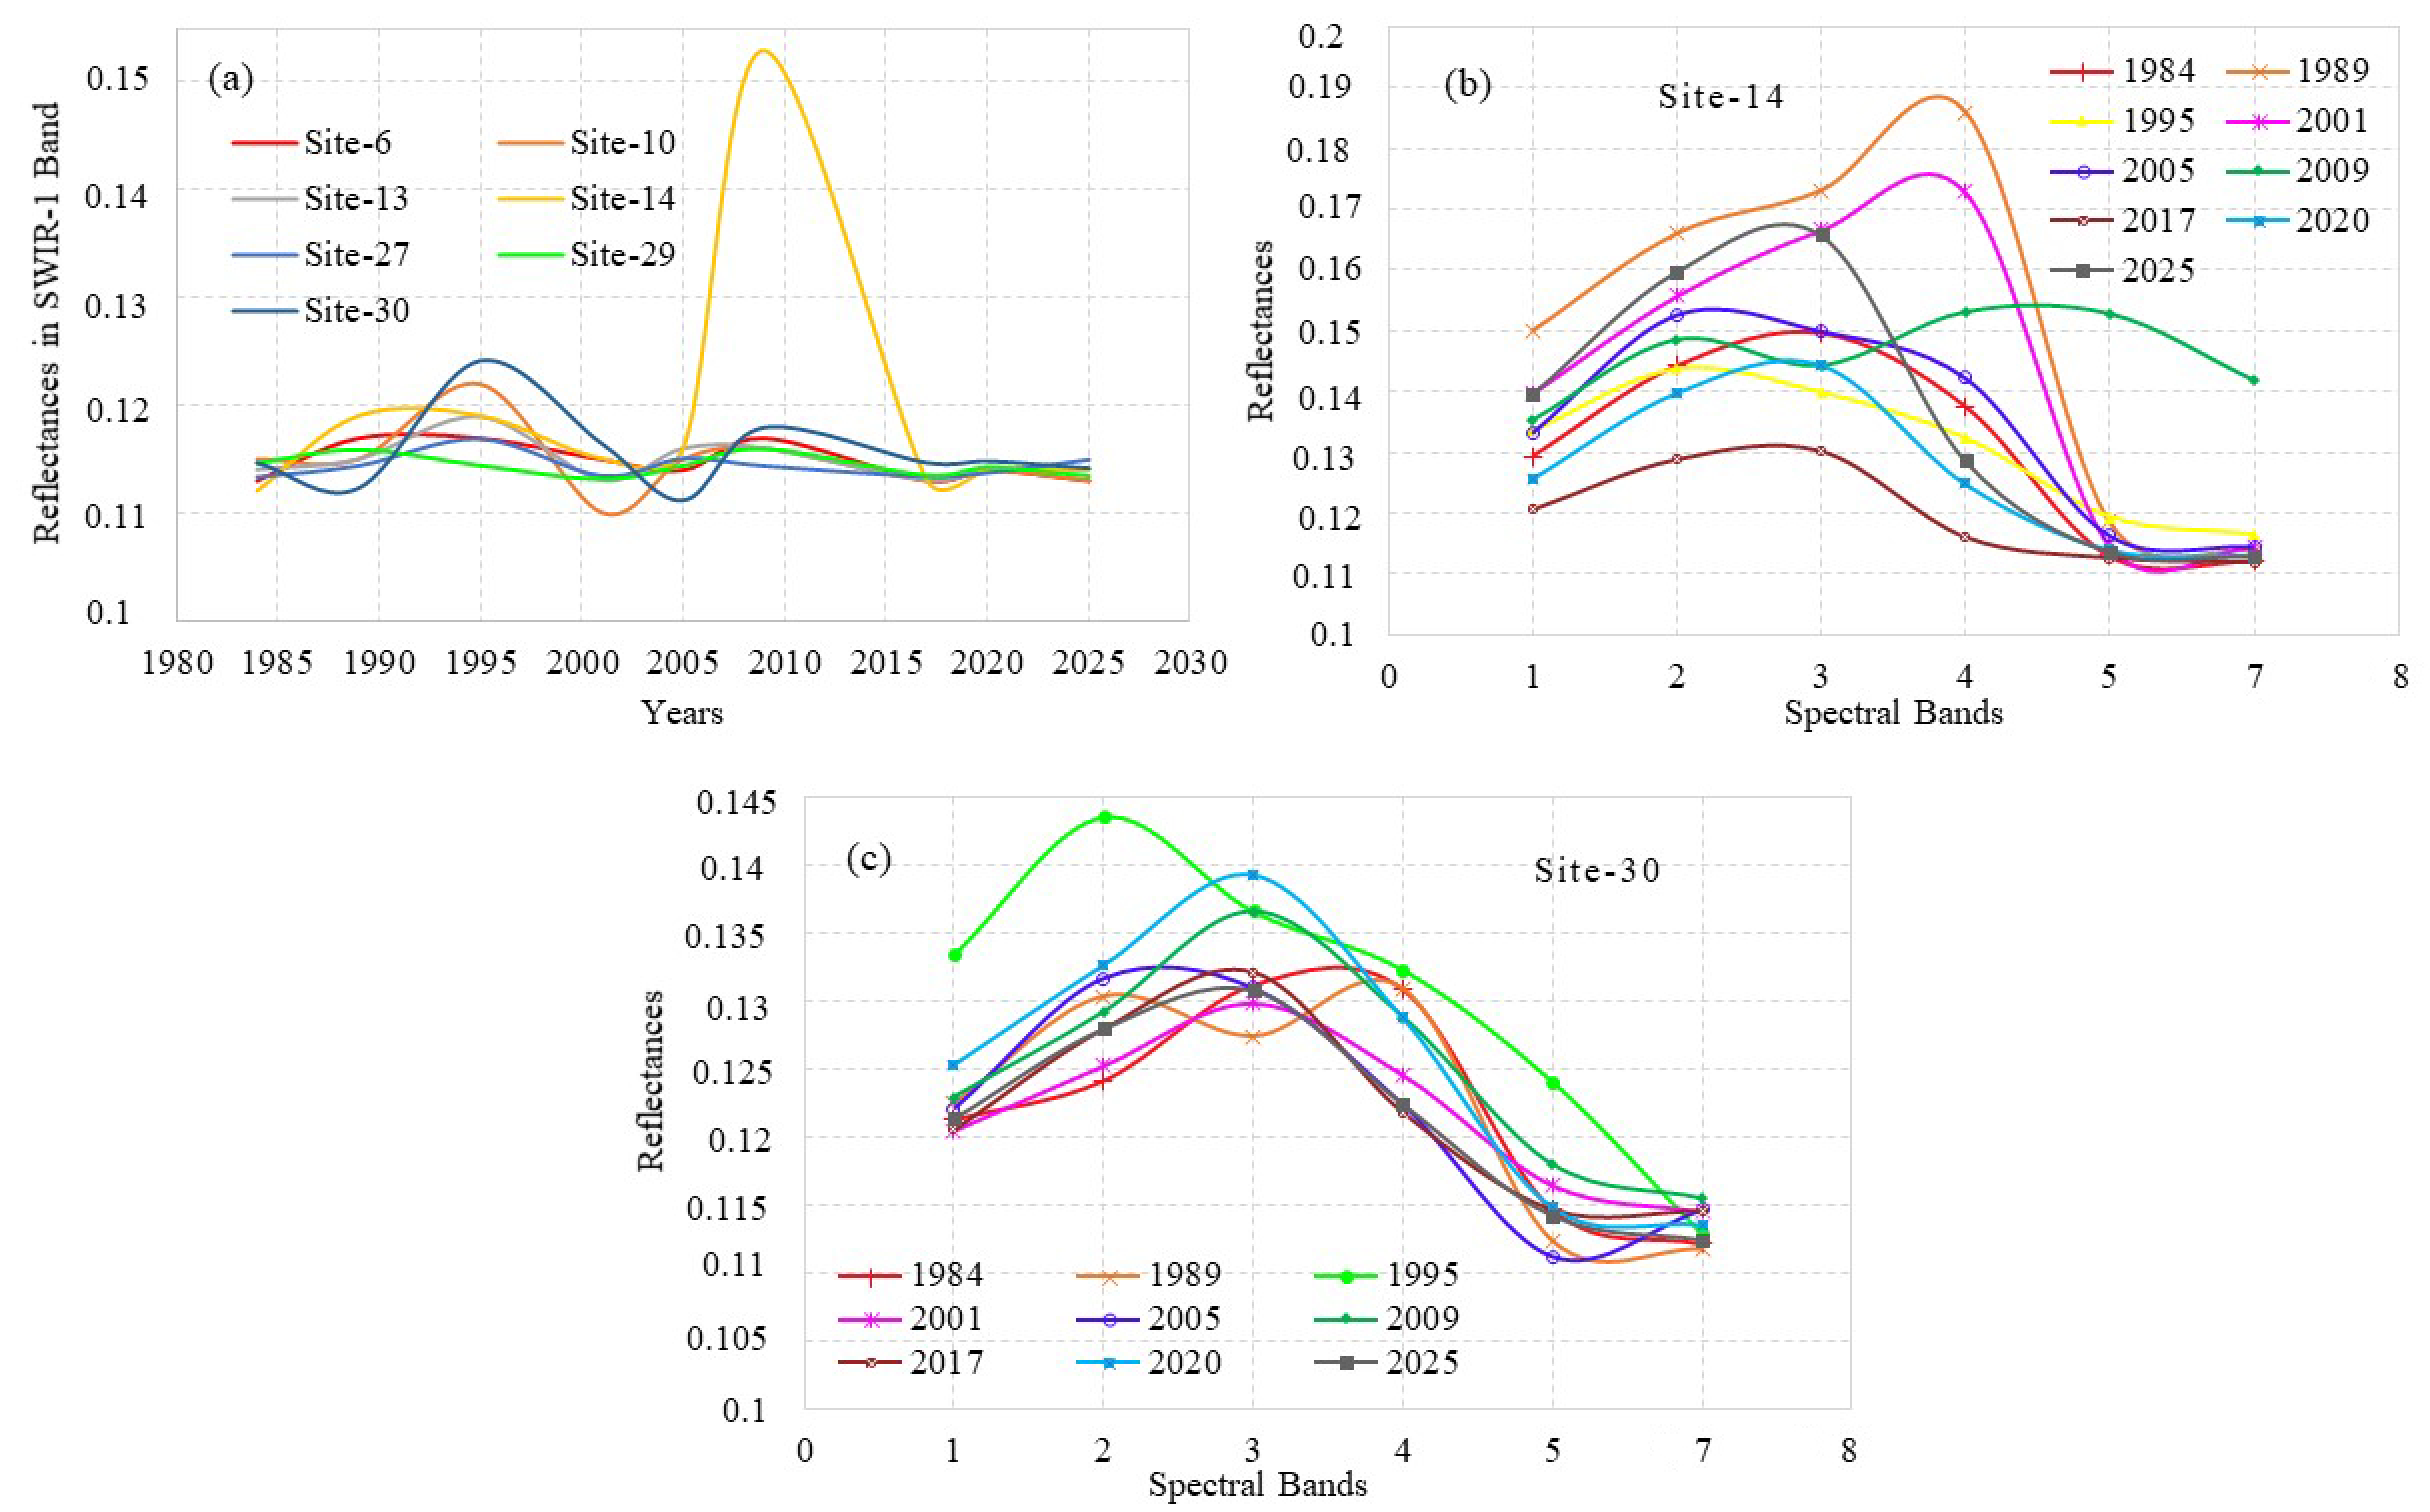
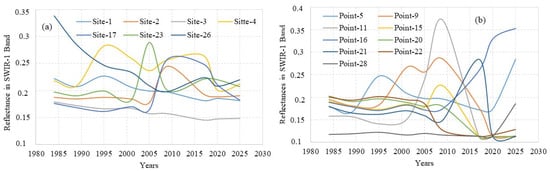
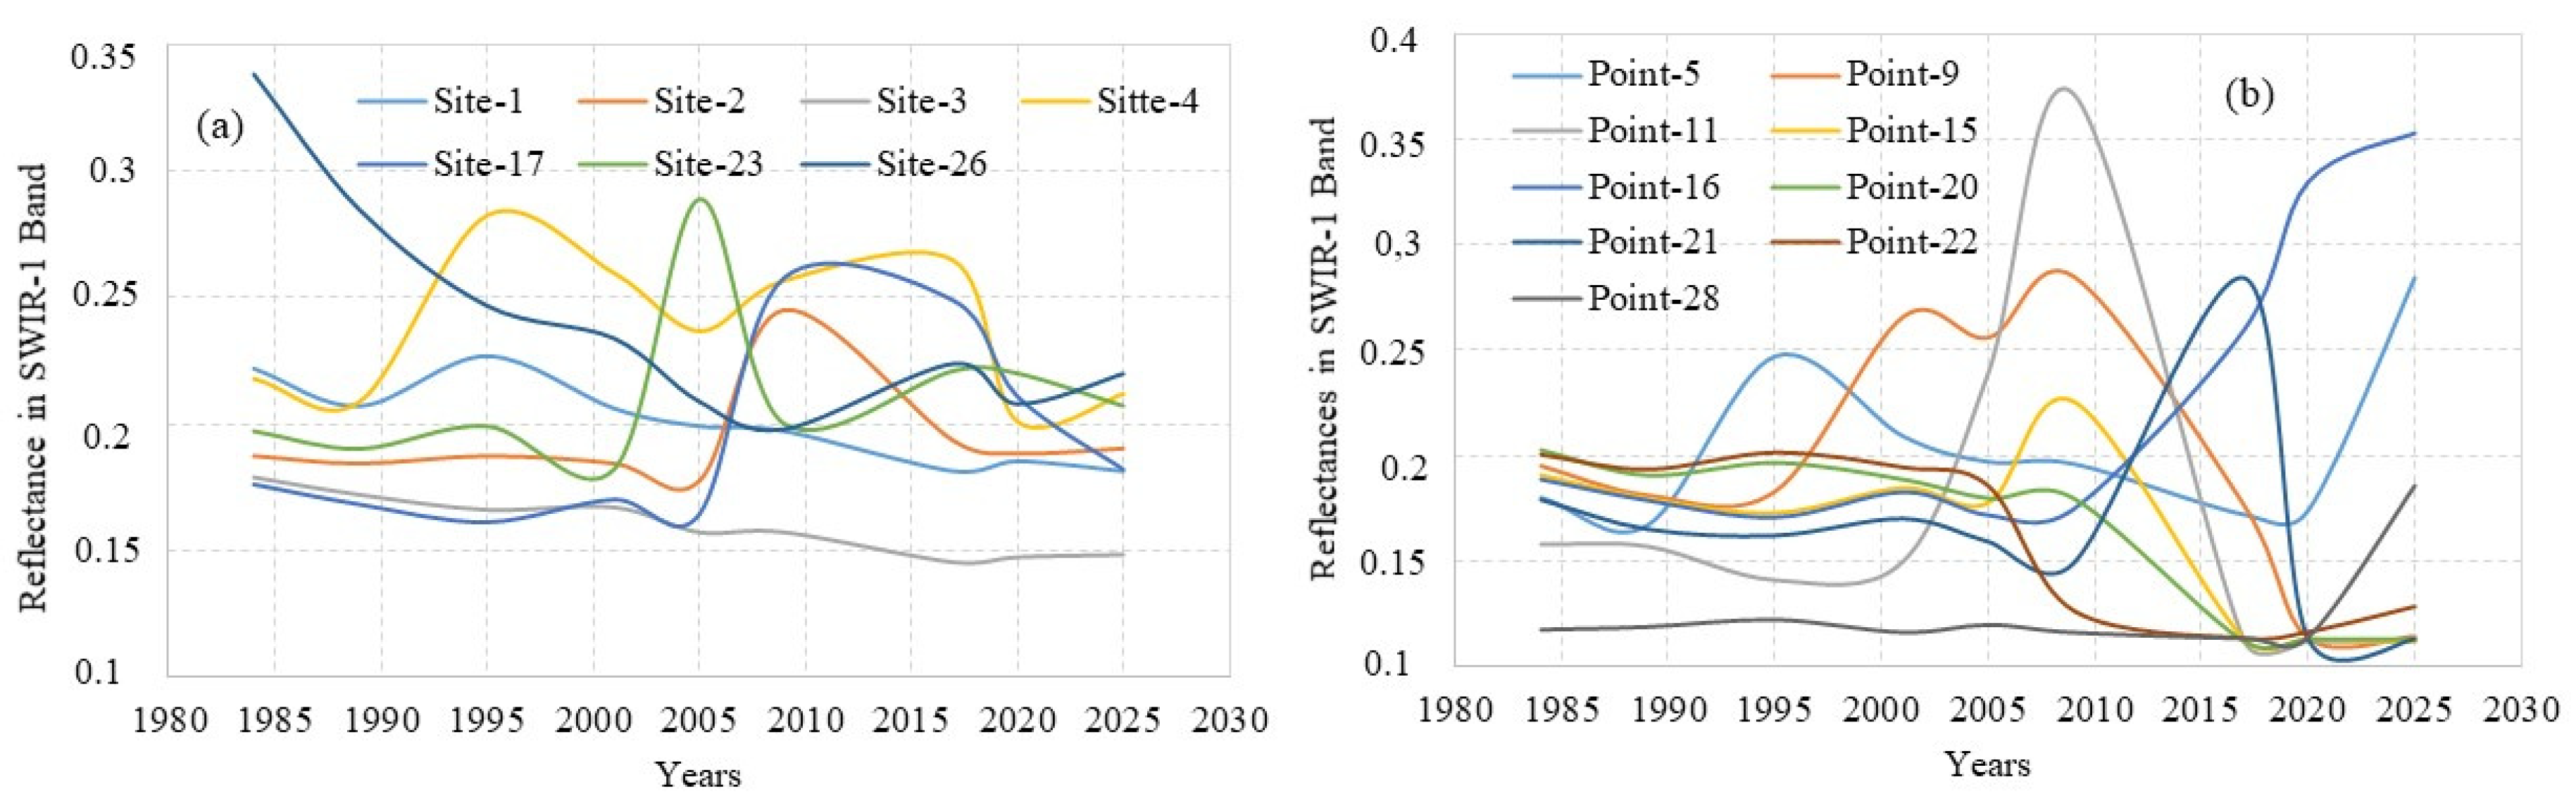
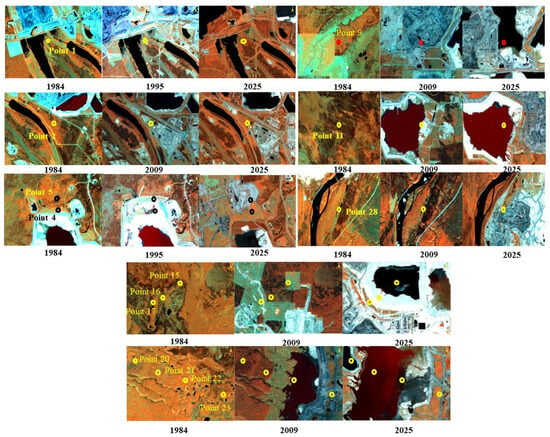
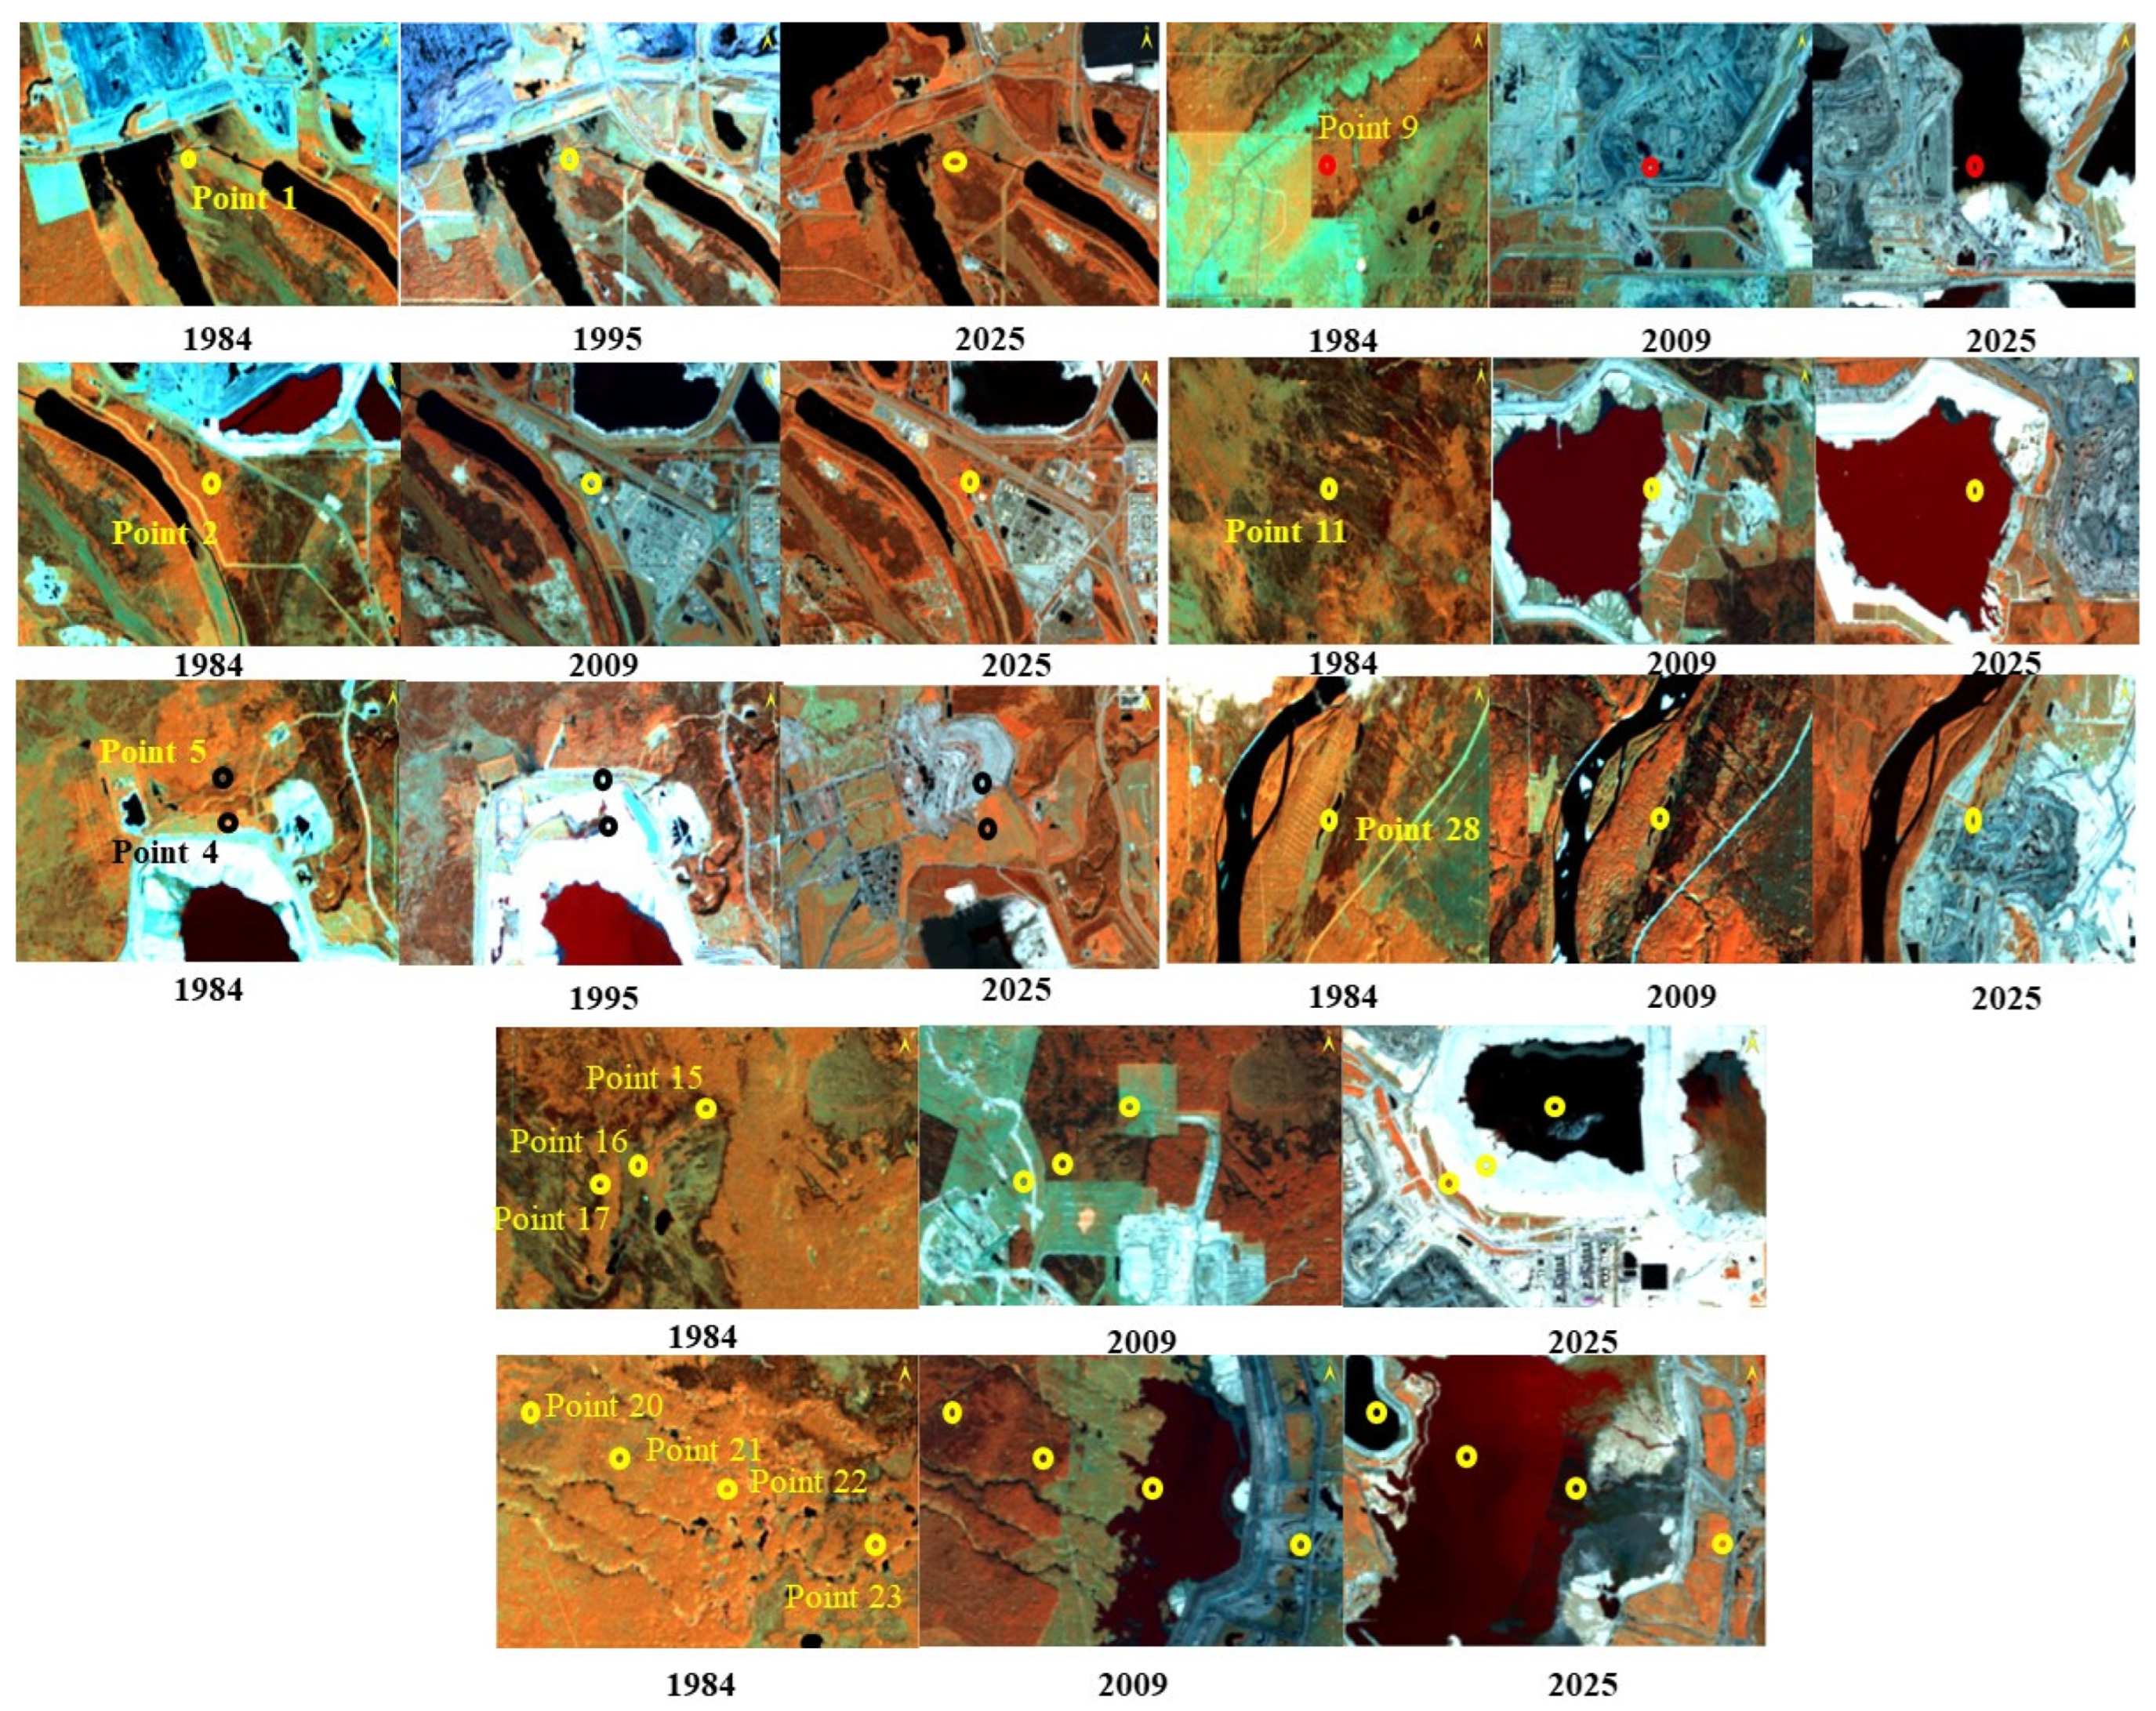
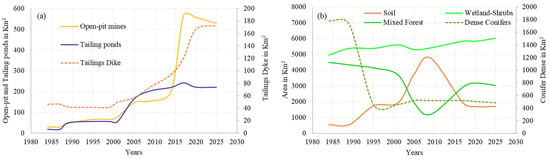
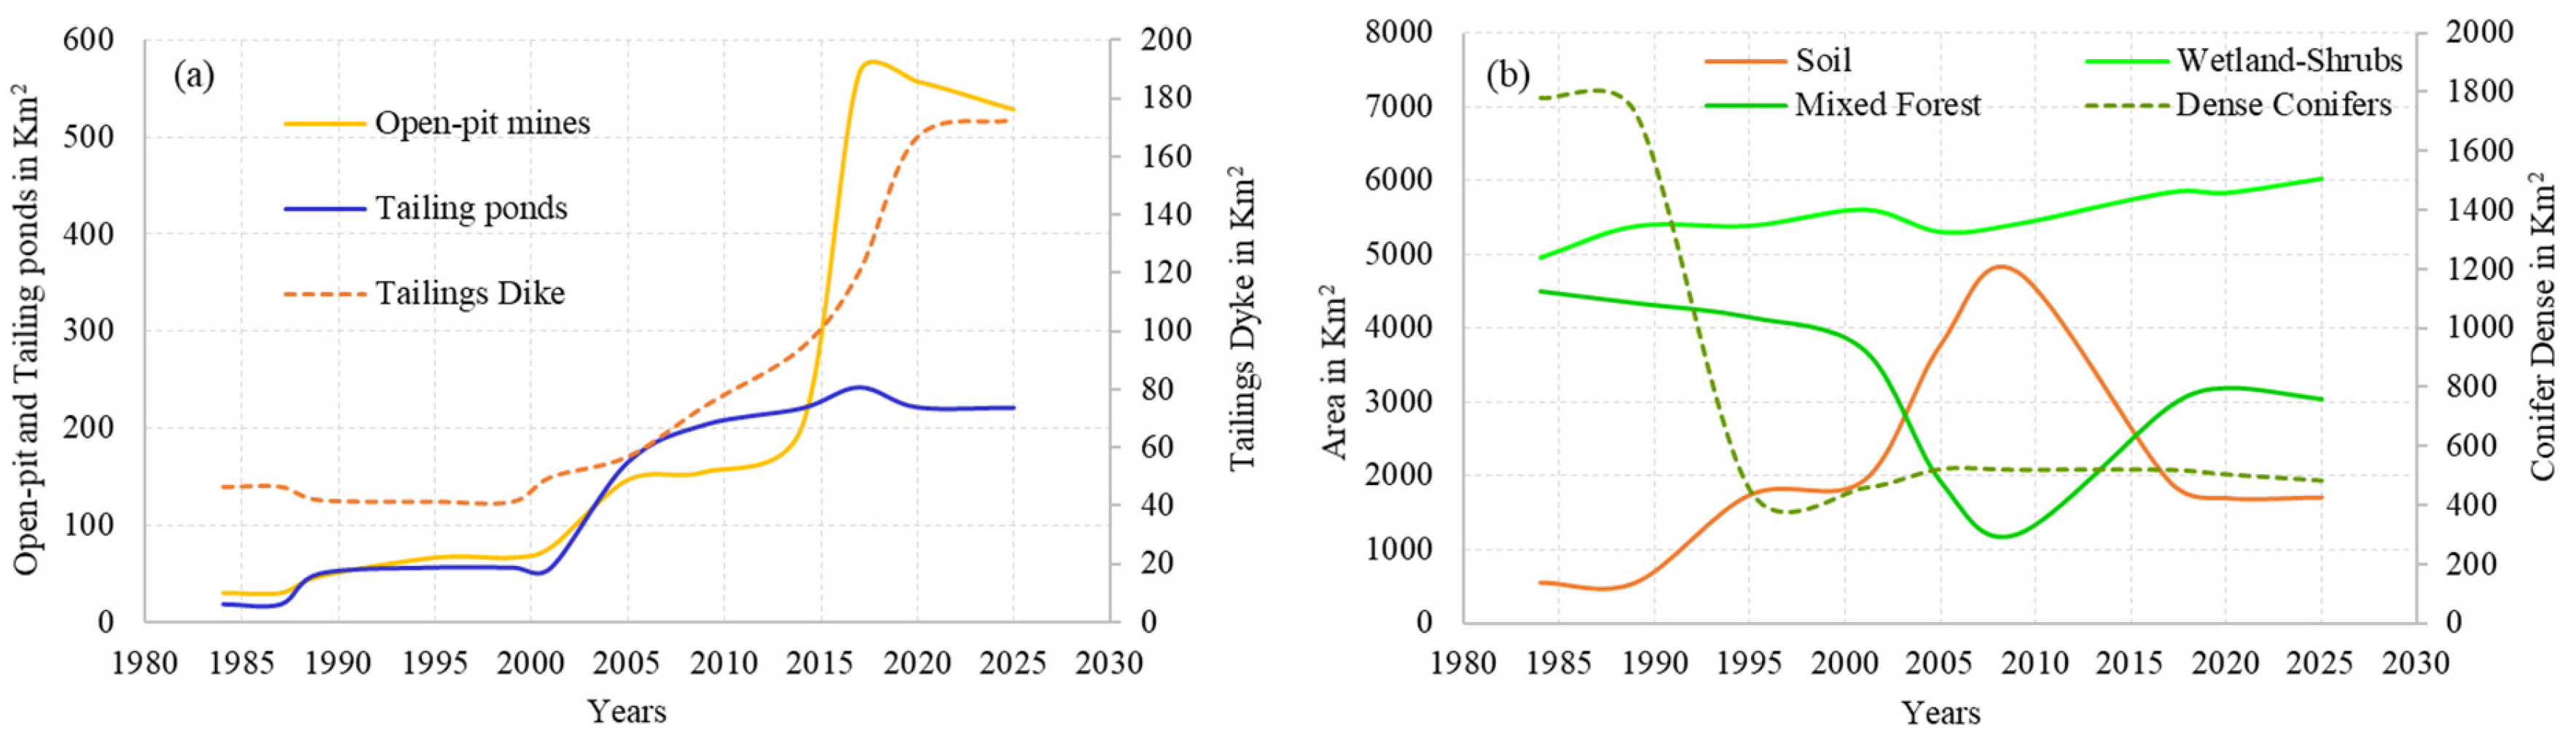

Disclaimer/Publisher’s Note: The statements, opinions and data contained in all publications are solely those of the individual author(s) and contributor(s) and not of MDPI and/or the editor(s). MDPI and/or the editor(s) disclaim responsibility for any injury to people or property resulting from any ideas, methods, instructions or products referred to in the content. |
© 2026 by the authors. Licensee MDPI, Basel, Switzerland. This article is an open access article distributed under the terms and conditions of the Creative Commons Attribution (CC BY) license.