


Highlights
What are the main findings?
- A multiscale biomass estimation framework integrating field plots, UAV observations, and Sentinel-2 imagery was developed for mangrove ecosystems.
- UAV-derived bridging labels substantially improved satellite-scale biomass estimation accuracy and enabled provincial-scale biomass mapping.
What are the implications of the main findings?
- The proposed UAV-bridged framework effectively alleviates the scale mismatch problem between field measurements and satellite observations.
- This approach provides a scalable pathway for blue-carbon monitoring and large-area biomass assessment in coastal ecosystems.
Abstract
Mangroves are important coastal blue-carbon ecosystems, and accurate biomass estimation is essential for carbon stock assessment and ecological monitoring. To address the limitation of regional-scale biomass estimation caused by the scale mismatch between field plots and satellite pixels, this study selected the Zhangjiangkou National Mangrove Nature Reserve in Fujian Province as the study area and the mangrove distribution region of Fujian Province as the extrapolation area. A multiscale biomass estimation framework integrating field plots, unmanned aerial vehicles (UAVs), and satellite remote sensing was established. The results showed that (1) the optimal UAV-scale models achieved R2 values of 0.69 and 0.78 for aboveground biomass (AGB) and belowground biomass (BGB), respectively, with corresponding root mean square error (RMSE) values of 18.55 and 9.52 t·ha−1 and normalized root mean square error (nRMSE) values of 0.14 and 0.17 demonstrating reliable predictive performance; (2) after introducing UAV-derived bridging labels, the R2 of the AGB model increased from 0.24 to 0.64, while the RMSE decreased from 29.02 to 10.86 t·ha−1. Similarly, the R2 of the BGB model increased from 0.43 to 0.63, accompanied by a reduction in RMSE from 14.89 to 6.35 t·ha−1, demonstrating a substantial improvement in satellite-scale biomass estimation accuracy; (3) the total AGB and BGB of mangroves in Fujian Province were estimated at 58,768.60 t and 24,575.14 t, respectively, with high-biomass areas mainly distributed along the coastal regions of Zhangzhou and Quanzhou. Unlike conventional field-to-satellite extrapolation approaches, the proposed framework introduces UAV-derived biomass maps as intermediate bridging labels for pixel-level supervised learning, thereby establishing an effective link between field measurements and satellite observations. This strategy effectively reduces the scale mismatch between field and satellite data, significantly improves satellite-scale biomass estimation accuracy, and provides a transferable and scalable framework for regional mangrove biomass mapping and blue-carbon assessment.
1. Introduction
Mangroves are unique forest ecosystems distributed in tropical and subtropical intertidal zones and possess significant ecological functions and economic value [1]. As a representative blue-carbon ecosystem, mangroves play an important role in carbon sequestration, oxygen release, and the reduction in greenhouse gas concentrations [2]. Previous studies have shown that mangroves, which occupy only 0.1% of the Earth’s surface area, account for approximately 5% of atmospheric carbon sequestration [3]. In addition, mangroves provide a variety of ecosystem services, including coastal protection, aquaculture habitats, and fish nurseries, effectively protecting coastlines from storm surges and erosion [4,5].
Traditional mangrove biomass estimation mainly relies on field measurements and satellite remote sensing [6,7]. Field surveys estimate biomass by measuring tree structural parameters, such as tree height and diameter at breast height, and applying allometric growth equations. Although this approach provides relatively high accuracy, it is labor-intensive, time-consuming, and spatially limited, making it difficult to characterize biomass distribution patterns at regional scales [8]. Satellite remote sensing, with its broad spatial coverage and high observation efficiency, has therefore become an important tool for large-scale mangrove biomass estimation [9]. Previous studies have successfully applied a variety of remote sensing data, including optical imagery, synthetic aperture radar (SAR), and Light Detection and Ranging (LiDAR), to estimate mangrove biomass [10,11]. Optical imagery is widely used for regional biomass mapping because of its extensive spatial coverage, whereas LiDAR provides more detailed canopy structural information and generally achieves higher estimation accuracy at local scales [12]. However, medium- and low-resolution satellite imagery is still susceptible to tidal fluctuations and mixed-pixel effects, leading to increased uncertainty in biomass estimation [13,14]. Moreover, most remote sensing inversion models rely on a limited number of field samples for calibration [15], making it difficult to establish an effective correspondence between field plots and satellite pixels. This scale mismatch consequently limits model generalization and estimation accuracy.
To address the scale mismatch between field plots and satellite pixels, unmanned aerial vehicle (UAV) remote sensing has recently emerged as a promising technology owing to its centimeter-level spatial resolution and flexible data acquisition capability [16,17]. UAV platforms can simultaneously acquire detailed canopy structural and spectral information while providing continuous spatial coverage. Their observation scale lies between field measurements and satellite remote sensing, offering new possibilities for linking data across different spatial scales [18,19]. Recent studies have increasingly integrated UAV observations with satellite imagery for mangrove mapping, species classification, and biomass estimation [20]. Owing to their high spatial resolution and flexible deployment, UAV observations provide an effective intermediate scale between field measurements and satellite imagery, facilitating multiscale biomass assessment and reducing the scale mismatch between ground observations and satellite data [21]. Furthermore, UAV-derived products have been successfully incorporated into multiscale biomass estimation frameworks to bridge field measurements and satellite observations, demonstrating their potential for improving regional biomass estimation accuracy [16,22]. Although UAV remote sensing has been widely applied to local-scale biomass estimation, its application in supporting large-scale biomass extrapolation through multiscale integration with satellite imagery remains an important research direction [21,23]. These characteristics make UAV observations an effective bridging scale between field measurements and satellite imagery for multiscale biomass estimation.
Therefore, this study selected the Zhangjiangkou National Mangrove Nature Reserve in Fujian Province as a representative study area and established a multiscale biomass estimation framework integrating field plots, UAV observations, and satellite remote sensing. The objectives were to systematically evaluate the role of UAV-derived bridging scales in regional mangrove biomass extrapolation and to generate biomass maps for mangroves across Fujian Province, thereby providing scientific support for regional blue-carbon resource monitoring and ecological conservation management.
2. Materials and Methods
2.1. Study Area and Data Sources
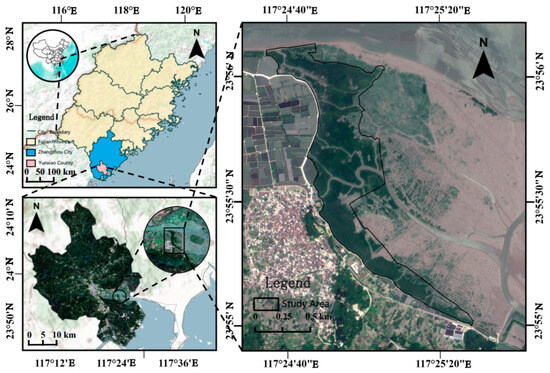
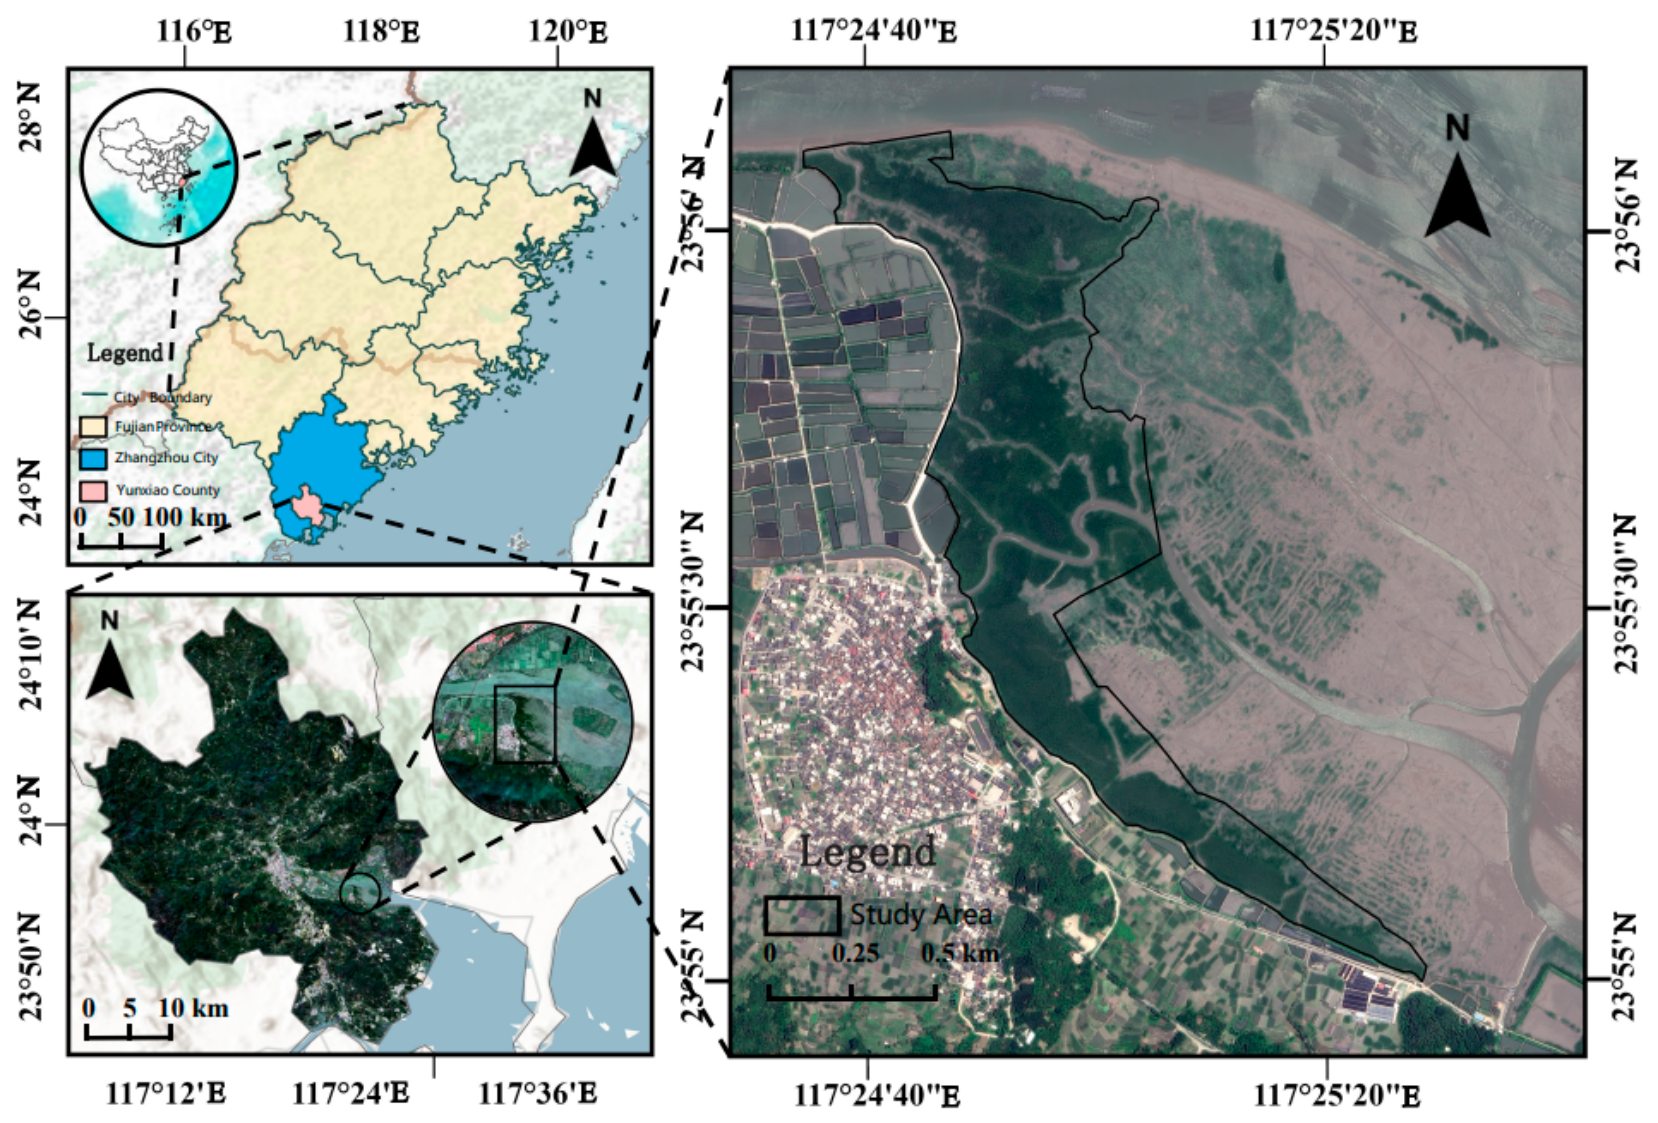
This study selected the Zhangjiangkou National Mangrove Nature Reserve in Fujian Province as the representative study area, the location of the study area is shown in Figure 1, while the mangrove distribution region of Fujian Province was used as the regional-scale extrapolation area. The Zhangjiangkou Nature Reserve is located in the coastal area of Yunxiao County, Fujian Province, and is characterized by a subtropical marine monsoon climate with pronounced tidal influence, providing favorable conditions for mangrove growth and development [24,25].
Figure 1.
Location of the Zhangjiangkou National Mangrove Nature Reserve.
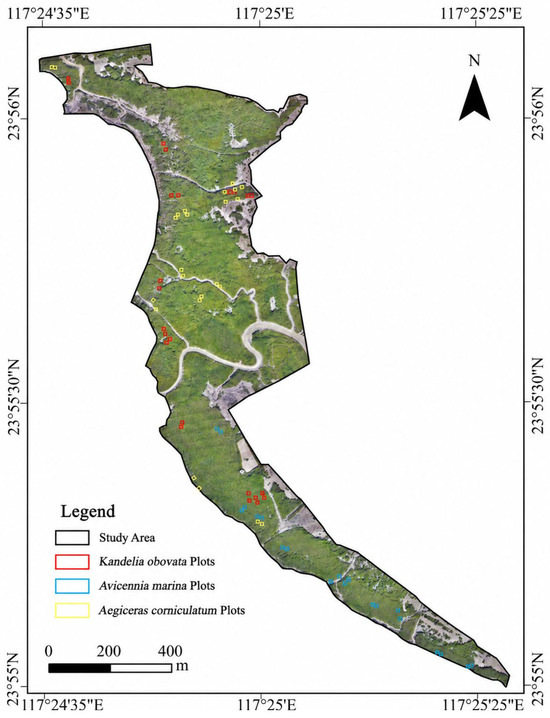
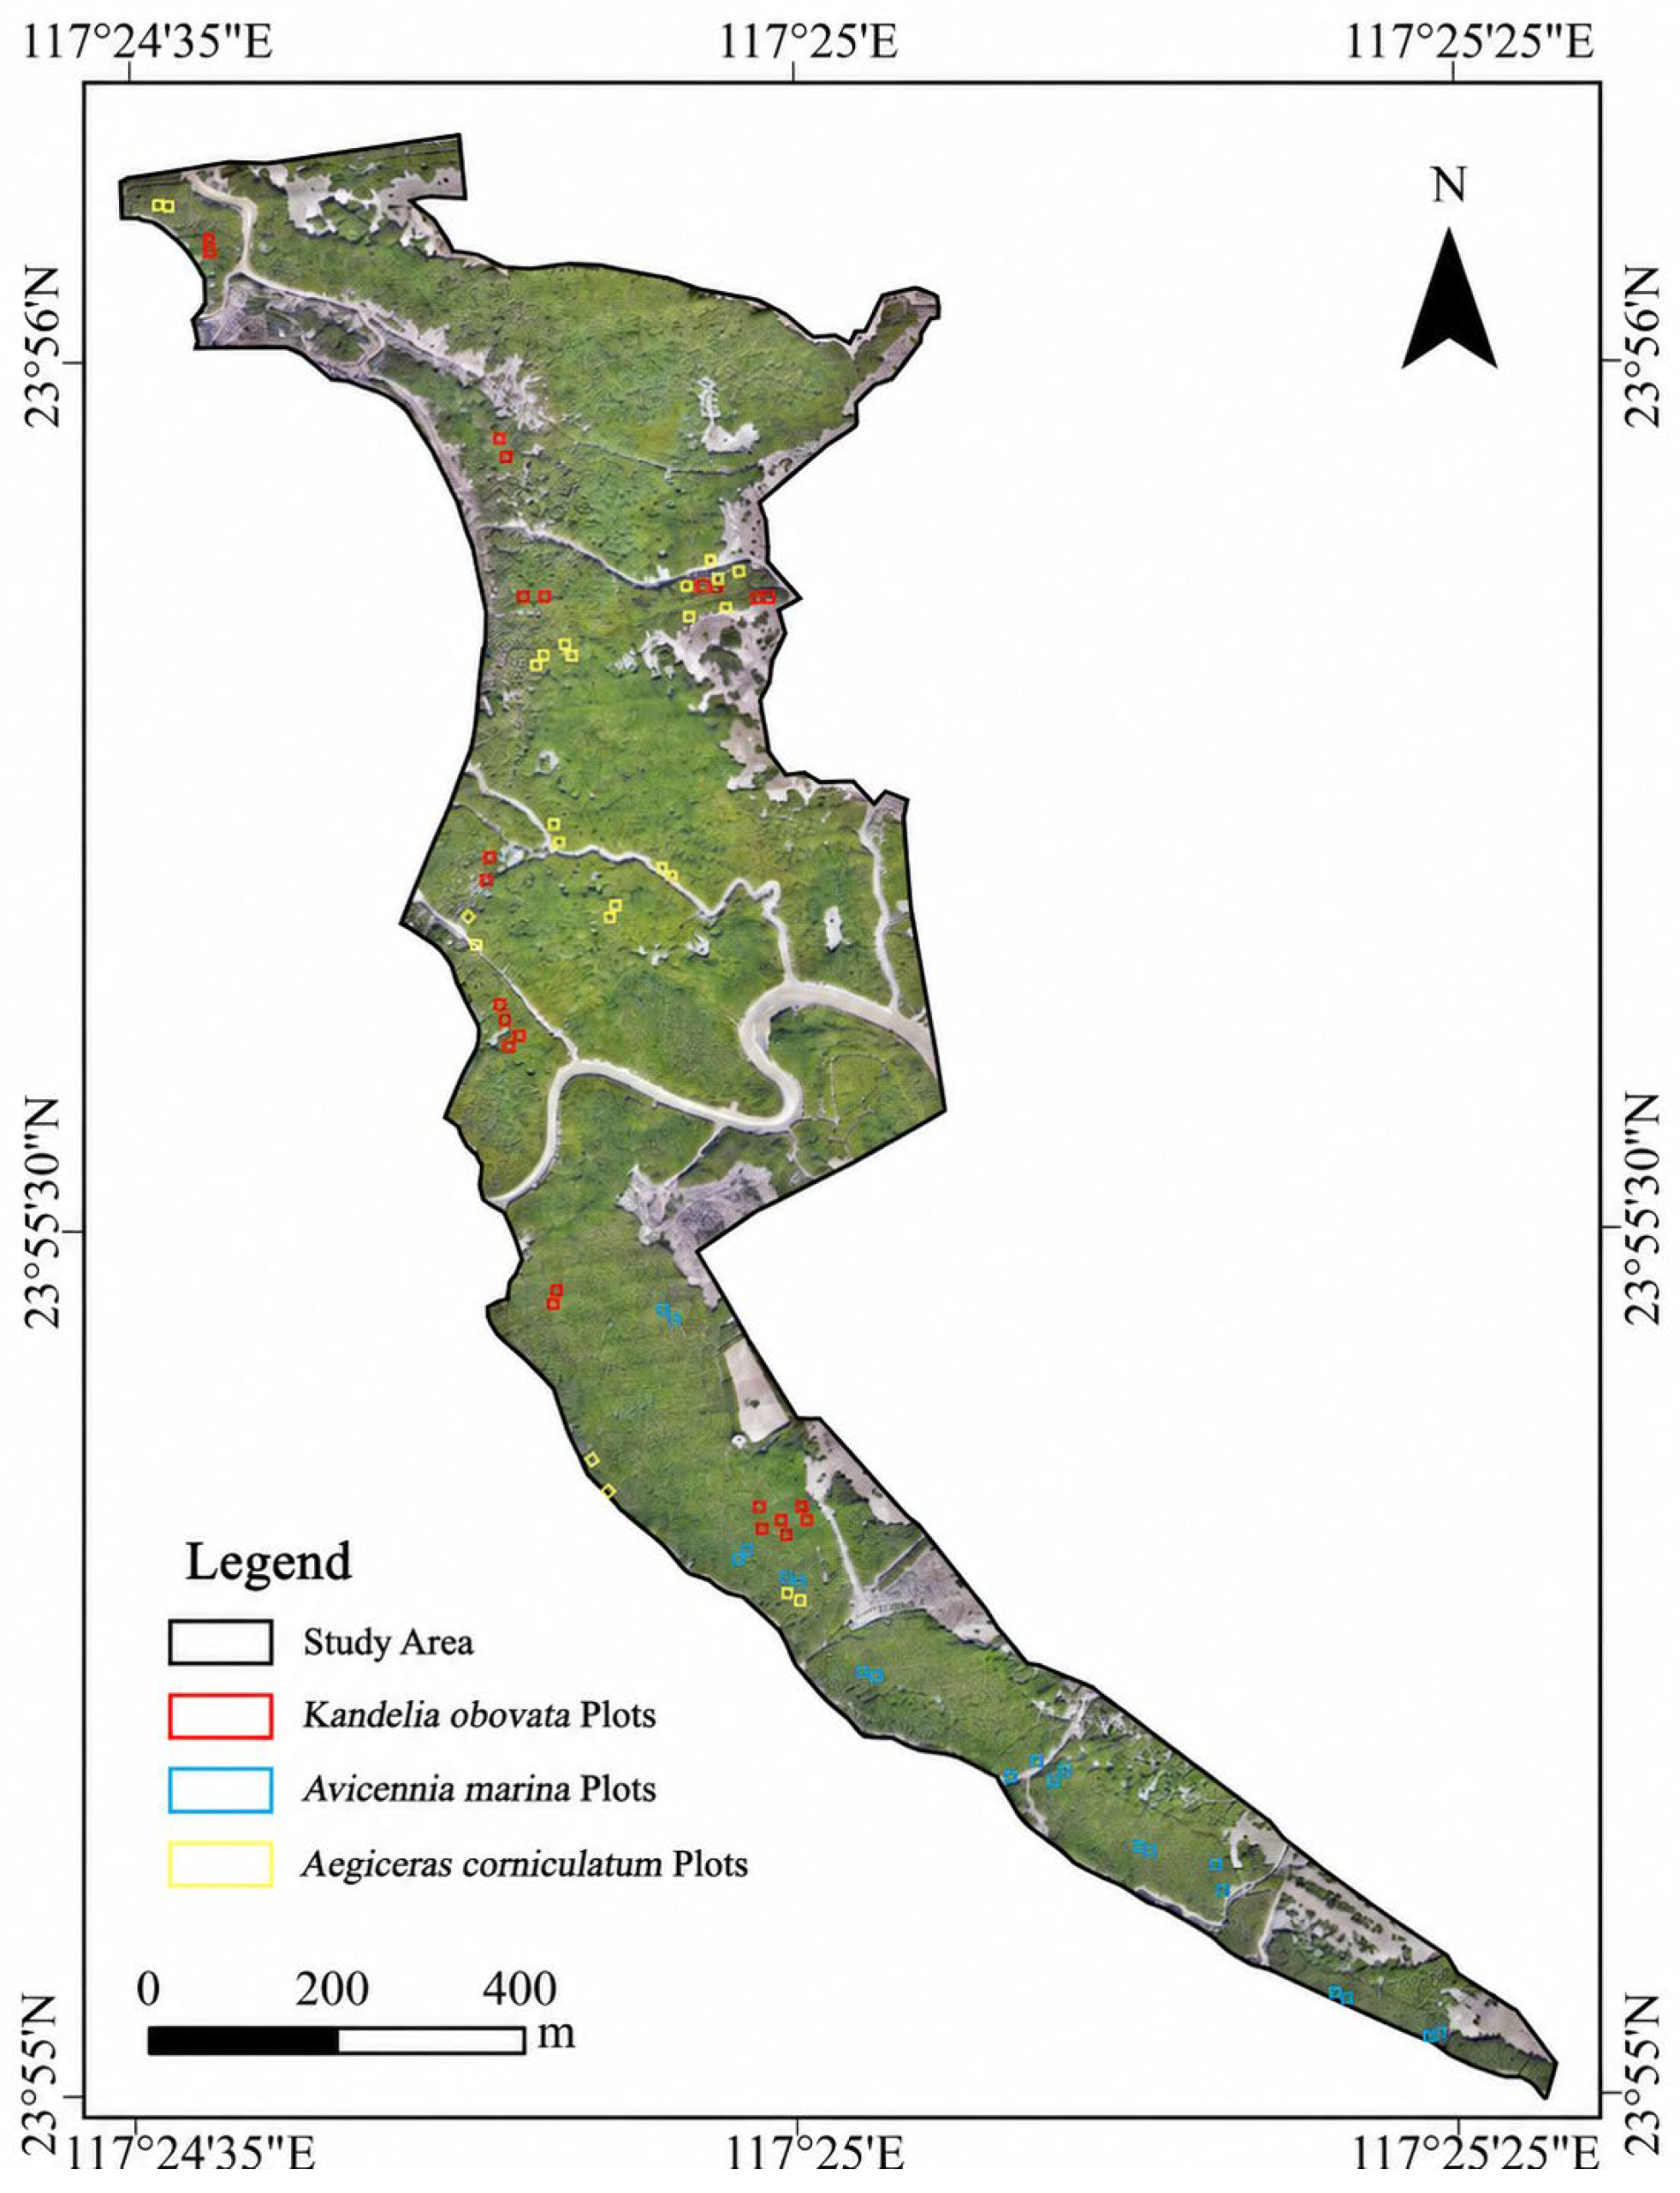
Field surveys were conducted in July and November 2025. A total of 68 standard plots (10 m × 10 m) were established, including 20 plots of Avicennia marina, 24 plots of Kandelia obovata, and 24 plots of Aegiceras corniculatum. The spatial distribution of the field plots is shown in Figure 2. For each plot, tree height, diameter at breast height (DBH), basal diameter, species information, and geographic coordinates were recorded. Tree height was measured using a measuring pole, DBH and basal diameter were measured using a diameter tape, and the geographic coordinates of each plot were recorded using a Real-Time Kinematic (RTK) Global Navigation Satellite System (GNSS). These measurements were subsequently used to calculate AGB and BGB using species-specific allometric equations.
Figure 2.
Distribution of field plots in the study area.
UAV data consisted of multispectral imagery acquired using a DJI Phantom 4 Multispectral (DJI, Shenzhen, China) UAV and LiDAR point cloud data acquired using a DJI Matrice 300 RTK (DJI, Shenzhen, China) equipped with a Zenmuse L1 sensor (DJI, Shenzhen, China). Detailed specifications of the multispectral and LiDAR data acquisition systems, including the UAV platforms, sensors, flight parameters, and derived products, are summarized in Table 1 and Table 2. The acquired multispectral imagery and LiDAR point cloud data were processed using DJI Terra (DJI, Shenzhen, China) to generate orthomosaic imagery, digital surface models (DSM), digital terrain models (DTM), and canopy height models (CHM), which were subsequently used for feature extraction and biomass estimation.
Table 1.
Main specifications of the DJI Phantom 4 Multispectral UAV.
Table 2.
Main technical specifications of the UAV LiDAR system.
Satellite data were obtained from the Sentinel-2 Level-2A surface reflectance product (COPERNICUS/S2_SR_HARMONIZED) available on the Google Earth Engine (GEE) platform [26]. Multiple Sentinel-2 images covering the mangrove distribution area of Fujian Province and acquired during July–August 2025 were selected as the data source. Cloud detection and masking were performed using a combination of the Sentinel-2 Cloud Probability dataset, the QA60 quality assurance band, and a blue-band threshold. Invalid edge pixels were further removed using multi-resolution band masks. Subsequently, all valid observations after cloud masking were composited using a mean reducer to generate a cloud-free composite image. The resulting image was clipped to the mangrove distribution area of Fujian Province and exported at a spatial resolution of 10 m. The mangrove distribution map of Fujian Province was derived from the China Major Mangrove Community Distribution Dataset [27] and further updated using the latest remote sensing imagery.
2.2. Biomass Calculation of Field Plots
AGB and BGB were calculated using tree height, DBH, and other structural parameters obtained from field surveys in combination with allometric growth equations. Candidate equations included the Futian mangrove allometric equations developed in Guangdong Province [28], the Kandelia obovata equation developed in Cangnan, Zhejiang Province [29], the Qinzhou Bay mangrove equation developed in Guangxi Province [30], and the general allometric equation for mangroves in China [31]. Considering the applicable species range, regional environmental similarity, and model consistency, the Futian mangrove allometric equations were ultimately selected as the basis for biomass calculation in this study. The candidate species-specific and general allometric equations used in this study are summarized in Table 3.
Table 3.
Candidate species-specific and general allometric equations for mangrove biomass estimation.
2.3. Feature Extraction and Selection
2.3.1. Feature Extraction
Based on UAV multispectral imagery and LiDAR point cloud data, a canopy height model (CHM) was generated by subtracting the digital terrain model (DTM) from the digital surface model (DSM) derived from the classified LiDAR point clouds [32]. Subsequently, four categories of features, including spectral, intensity, texture, and height features, were extracted from the UAV multispectral imagery, LiDAR point cloud data, and the derived CHM, resulting in a total of 87 variables. These variables included vegetation indices, LiDAR intensity statistics, gray-level co-occurrence matrix (GLCM) texture parameters, and canopy structural metrics, which were subsequently used for biomass modeling and feature selection analysis (Table 4).
Table 4.
Selected features, their formulas, and descriptions.
2.3.2. Multicollinearity Screening
To reduce feature redundancy and multicollinearity effects and improve model stability and generalization ability, Pearson correlation analysis was employed to screen the candidate features [33,34]. When the absolute value of the correlation coefficient between two features exceeded 0.95, strong multicollinearity was considered to exist. In such cases, redundant variables were removed, and only representative features were retained for subsequent analysis. The Pearson correlation coefficient was calculated using Equation (1).
where
r is the Pearson correlation coefficient;
and represent the observed values of two feature variables;
and represent the mean values of the corresponding variables;
n is the number of samples.
2.3.3. RF-RFE-OOB Feature Selection
To further identify key variables closely related to mangrove biomass, the RF-RFE-OOB method was employed for feature optimization. First, Random Forest (RF) [35] was used to calculate and rank feature importance. Subsequently, Recursive Feature Elimination (RFE) [36] was applied to construct feature subsets of different sizes, and model performance was evaluated using the Out-of-Bag (OOB) [35] error. The feature combination corresponding to the minimum OOB error was finally selected as the optimal feature set and used for subsequent biomass modeling and scale extrapolation.
2.3.4. UAV-Scale Mangrove Biomass Modeling
Using the AGB and BGB values obtained from field surveys as response variables and the optimal feature set selected by RF-RFE-OOB as input variables, RF, Extreme Gradient Boosting (XGBoost) [37], and CatBoost models [38] were established for biomass estimation. By comparing the predictive performance of different models, the optimal model was selected to conduct pixel-wise prediction across the study area, generating UAV-scale spatial distribution maps of AGB and BGB. These maps provided the fundamental data for subsequent bridge-label construction and satellite-scale extrapolation.
2.3.5. Accuracy Assessment
To evaluate the performance of the UAV-scale biomass estimation models, five-fold cross-validation was employed, and the average results from all folds were used as the final accuracy assessment. The evaluation metrics included the coefficient of R2, RMSE, MAE, and nRMSE, which were calculated as follows.
where
n is the number of samples; and represent the observed and predicted biomass values of the ith sample, respectively; and represents the mean observed biomass value of all samples.
2.3.6. UAV-Scale Mangrove Biomass Estimation
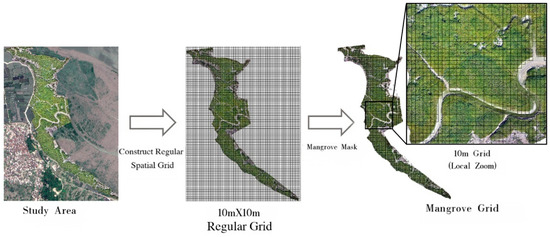
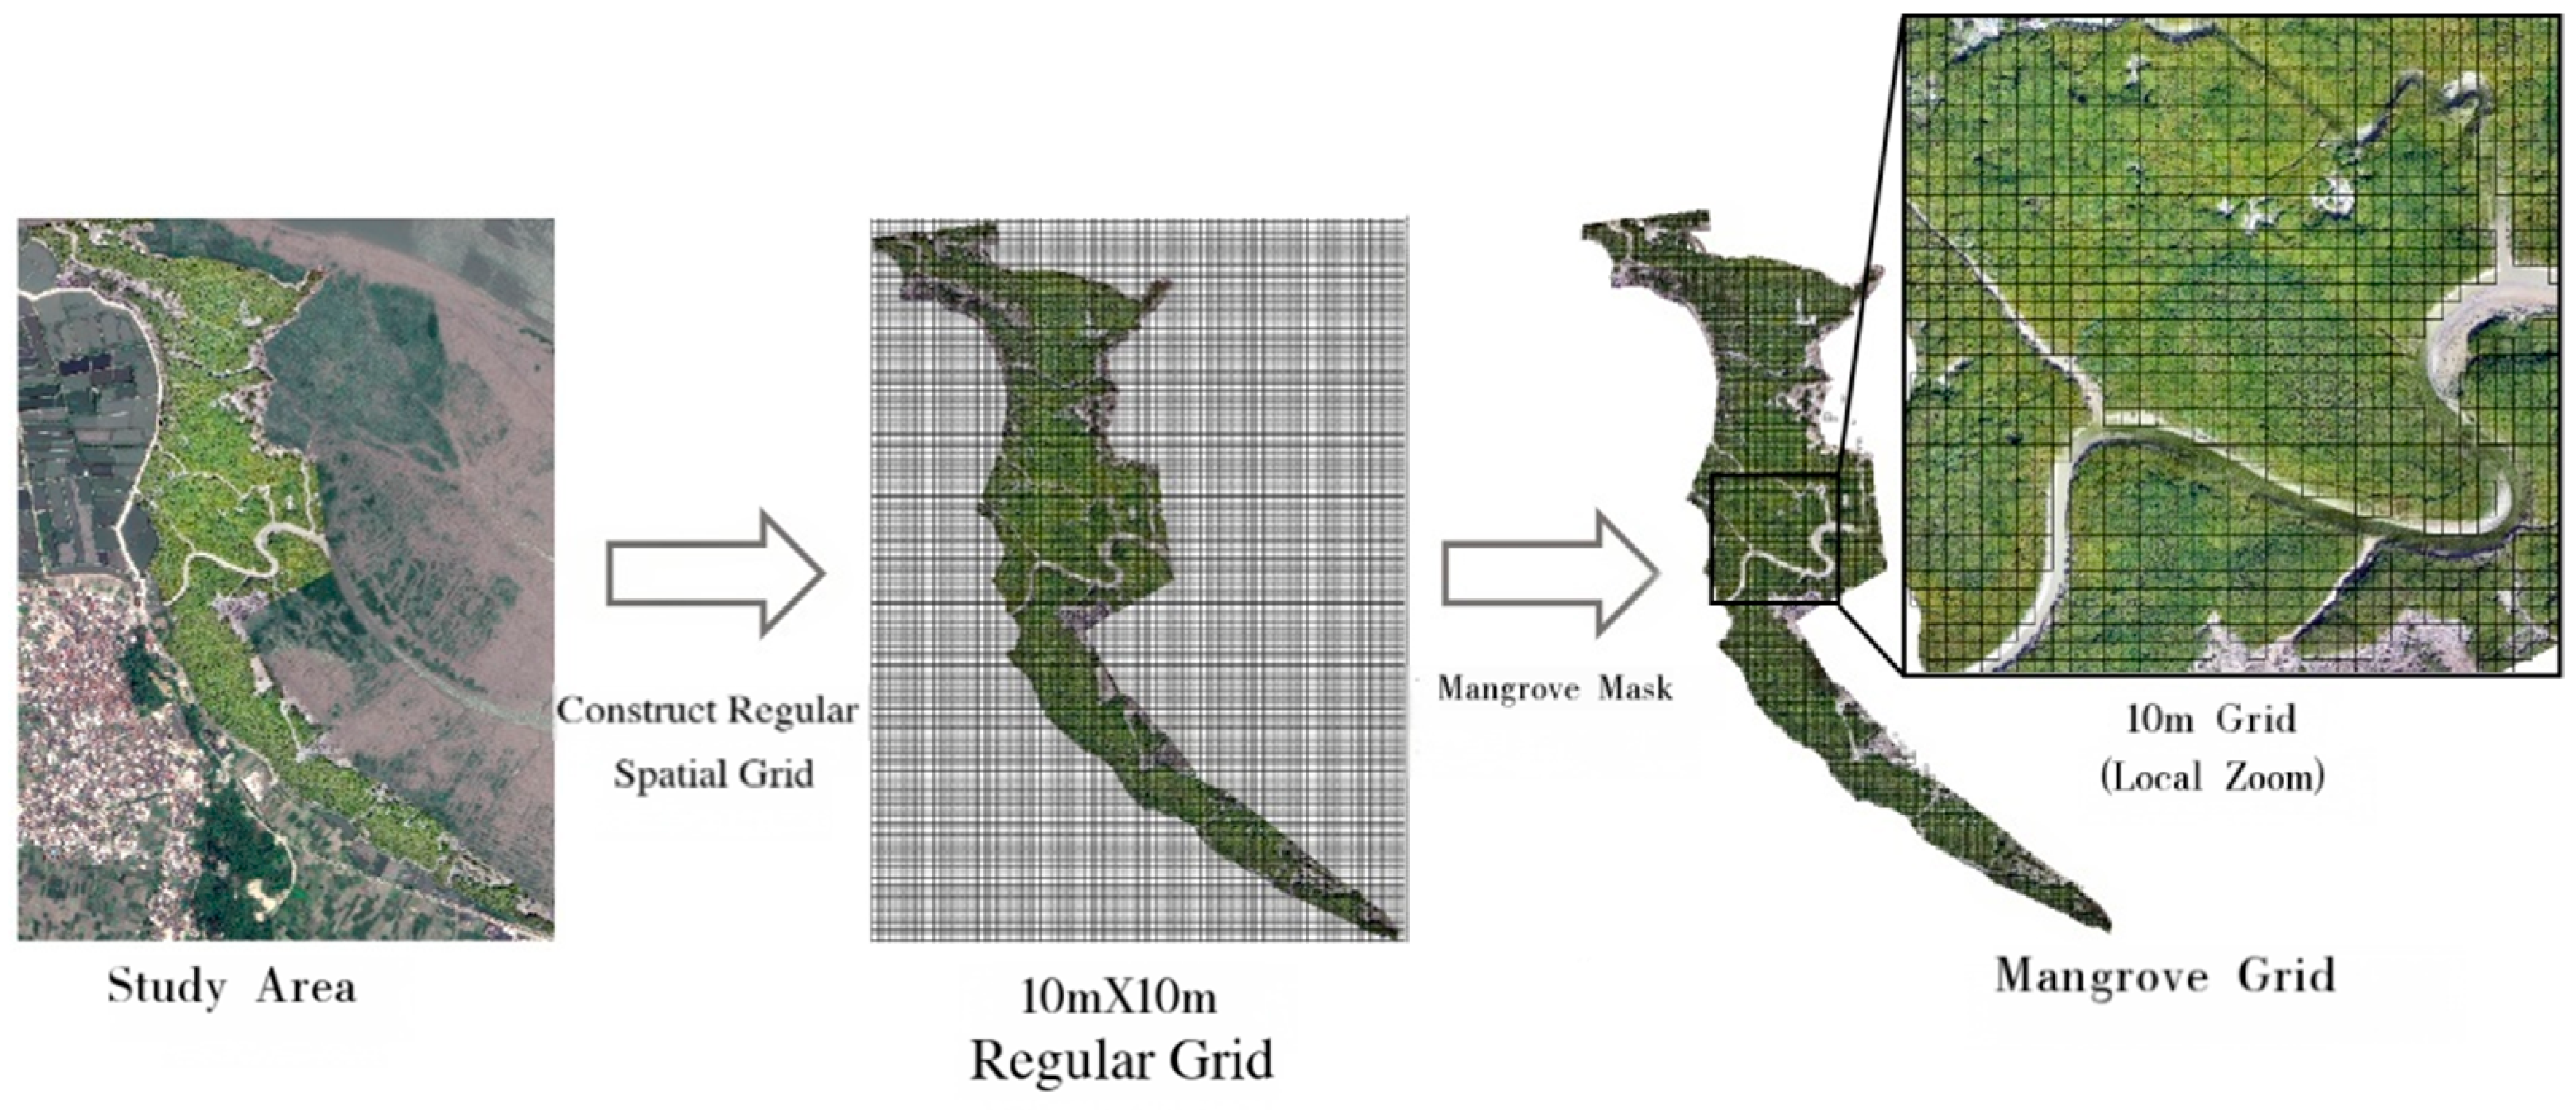
After the UAV-scale biomass models were established, the optimal models were applied to the UAV remote sensing data of the study area. First, a regular 10 m × 10 m grid was constructed over the study area and used as the basic analysis unit. A mangrove distribution mask was then applied to retain only mangrove grid cells. For each 10 m × 10 m grid cell, the corresponding 10 m remote sensing features derived from the UAV imagery and its derived products were extracted and used as inputs to the trained biomass estimation model. Consequently, spatial distribution maps of AGB and BGB were generated for the study area. The construction of the regular 10 m × 10 m grid and the mangrove area screening process are illustrated in Figure 3.
Figure 3.
Construction of 10 m × 10 m regular grids and mangrove area screening in the study area.
Based on these results, the total amounts of AGB, BGB, and TB were further calculated, and UAV-scale mangrove biomass distribution maps were produced. The resulting biomass maps not only reflect the spatial distribution patterns of mangrove biomass within the study area but also provide fundamental data for subsequent bridge-label construction and satellite-scale biomass extrapolation.
2.4. Scale Extrapolation and Satellite-Scale Mangrove Biomass Estimation
2.4.1. Spatial Alignment and Label Construction
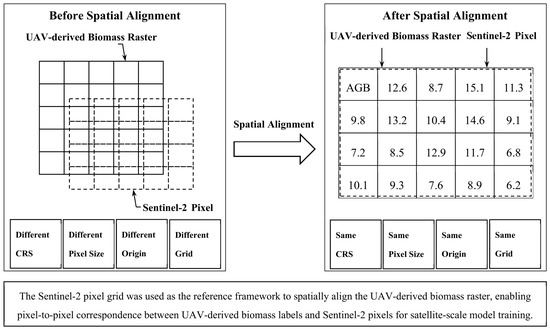
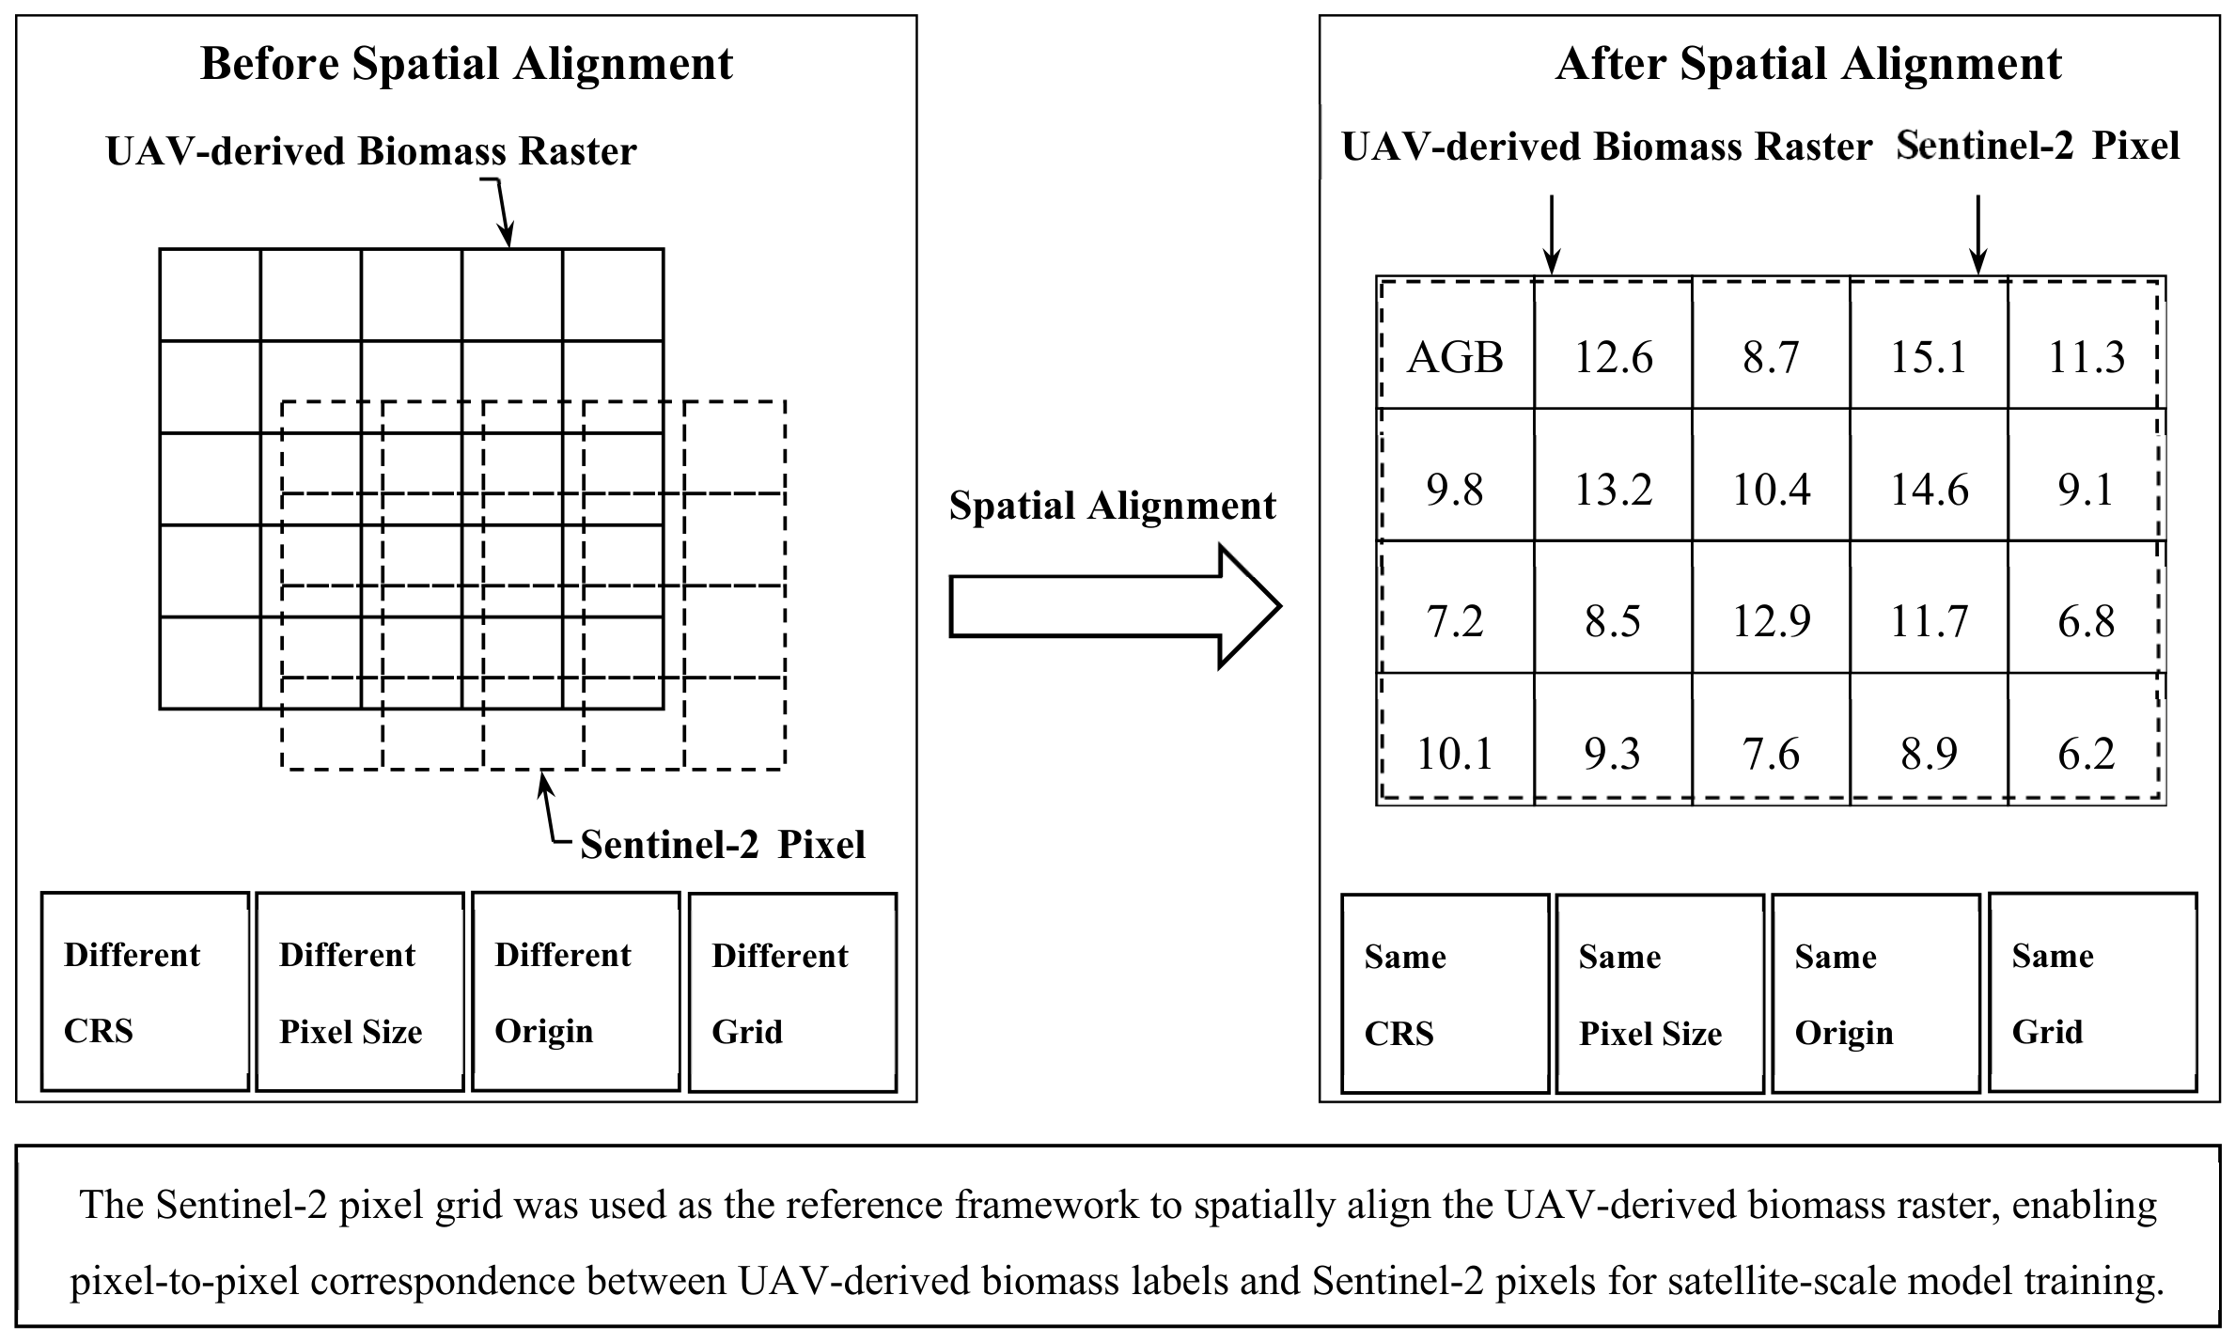
In the UAV stage, mangrove biomass raster maps with a spatial resolution of 10 m × 10 m had already been generated. To establish pixel-to-pixel correspondence between the UAV-derived biomass labels and Sentinel-2 imagery, the UAV biomass rasters were spatially aligned to the Sentinel-2 grid by unifying the coordinate reference system (CRS), pixel size, raster origin, and grid structure. Minor spatial discrepancies were corrected using nearest-neighbor resampling.
As illustrated in Figure 4, the aligned UAV biomass labels were subsequently matched with the corresponding Sentinel-2 pixels, enabling each Sentinel-2 pixel to correspond to a unique biomass label for satellite-scale model training. This alignment strategy established one-to-one pixel correspondence and ensured pixel-level spatial consistency for subsequent satellite-scale model development.
Figure 4.
Spatial alignment workflow between UAV-derived biomass labels and Sentinel-2 pixels for satellite-scale model training.
After spatial alignment, pixel samples were extracted within the mangrove distribution mask. The aligned UAV-derived biomass rasters were directly used as training labels at the Sentinel-2 pixel scale, enabling strict pixel-to-pixel supervised learning.
2.4.2. Feature Construction and Selection
Band Resolution Harmonization
The original Sentinel-2 bands have different spatial resolutions. To ensure consistency in spatial scale, all bands used in this study were resampled to a spatial resolution of 10 m. Since spectral reflectance is a continuous variable, bilinear interpolation was employed to resample the 20 m bands to 10 m in order to avoid the blocky effects introduced by nearest-neighbor interpolation and to preserve spatial continuity. All spectral indices were calculated after resolution harmonization to ensure consistency in the spatial scale of index computation.
Feature Construction
Considering the complex canopy structure of mangroves, their strong red-edge response, and the substantial influence of intertidal backgrounds [39,40], visible, red-edge, near-infrared, and shortwave infrared bands from Sentinel-2 imagery were selected in this study. In addition, vegetation indices and water-related indices were constructed as input features.
These features comprehensively characterize mangrove canopy structure, chlorophyll content, and moisture conditions, thereby providing a data foundation for satellite-scale biomass estimation. Detailed information on the selected features is presented in Table 5.
Table 5.
Sentinel-2 spectral features and their physical significance.
Feature Selection Method
To reduce the influence of redundant features on model stability and generalization ability, a two-stage feature selection strategy was adopted in this study. First, multicollinearity control was performed by calculating the Pearson correlation coefficient matrix among candidate features. Features with an absolute correlation coefficient greater than 0.95 (|r| > 0.95) were considered highly correlated, and redundant variables were removed. Subsequently, feature importance was evaluated based on RF and OOB error. An RF regression model was trained using the feature set after correlation filtering, and feature importance was assessed according to the OOB error. By progressively increasing the number of features, an OOB error curve was constructed, and the feature subset corresponding to the optimal OOB performance was selected as the final input for model development.
2.4.3. Control Extrapolation Scheme and Gain Validation
To evaluate the practical contribution of UAVs as an intermediate bridging scale in mangrove biomass extrapolation, a traditional “direct field plot–satellite” extrapolation scheme was established as a control. In the direct extrapolation scheme, field-plot biomass was used as the response variable, while Sentinel-2 features extracted from the corresponding plot locations were used as predictor variables to establish a direct relationship between field plots and satellite pixels.
The direct extrapolation scheme employed the same feature system, feature selection procedure, model set, and accuracy evaluation metrics as the UAV-bridged extrapolation scheme to ensure the comparability of the results.
By comparing the estimation accuracies of the two schemes for AGB and BGB, the improvements in model fitting ability, error control, and stability resulting from the introduction of the UAV intermediate scale were evaluated. This comparison provides direct empirical evidence for the effectiveness of the “UAV as a bridge” framework.
2.4.4. Satellite-Scale Mangrove Biomass Model Development
Construction of Training Samples
After feature extraction and selection, Sentinel-2 pixel-level spectral features were matched pixel by pixel with the corresponding UAV-derived 10 m biomass labels within the mangrove mask to construct the supervised learning dataset. All valid Sentinel-2/UAV pixel pairs remaining after quality control were included in the training dataset. Pixels containing missing values (NaN), infinite values (Inf), or abnormal biomass values were excluded before model development. Each remaining sample consisted of the Sentinel-2 spectral features of one 10 m pixel and its spatially corresponding UAV-derived biomass value. The constructed dataset was subsequently used for model training and evaluated using five-fold cross-validation.
Model Development
After the training dataset was established, machine learning regression methods were employed to develop Sentinel-2 pixel-scale mangrove biomass estimation models. The selected spectral features were used as input variables, while the UAV-derived 10 m biomass labels served as target variables. Separate satellite-scale regression models were developed for AGB and BGB estimation.
Considering the pronounced nonlinear relationships and feature interaction effects between biomass and spectral variables, three machine learning algorithms, namely RF, XGBoost, and CatBoost, were selected for comparative modeling. The main model parameters are listed in Table 6. All remaining parameters were set to their default values, and a fixed random seed was adopted to ensure reproducibility of the results.
Table 6.
Main hyperparameter settings of the models.
2.4.5. Provincial-Scale Biomass Extrapolation and Mapping
After the satellite-scale biomass models were developed and validated, the optimal models were applied to the mangrove distribution areas of Fujian Province to perform provincial-scale biomass extrapolation and spatial mapping. First, Sentinel-2 imagery was preprocessed, and the spatial resolution of all bands was unified. Subsequently, the spectral bands and vegetation index features required by the models were extracted to construct the predictor variable set. Based on the optimal models determined during the training stage, pixel-wise prediction was conducted for the mangrove areas of Fujian Province to generate the spatial distribution maps of AGB and BGB, respectively. Furthermore, a TB distribution map was produced.
Through the above procedure, the spatial extrapolation of mangrove biomass from the study area to the provincial scale was achieved, providing a data foundation for analyzing the spatial distribution patterns of mangrove biomass and assessing blue-carbon resources in Fujian Province.
2.5. Workflow
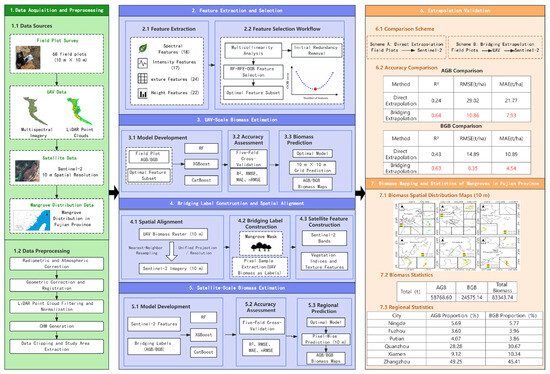
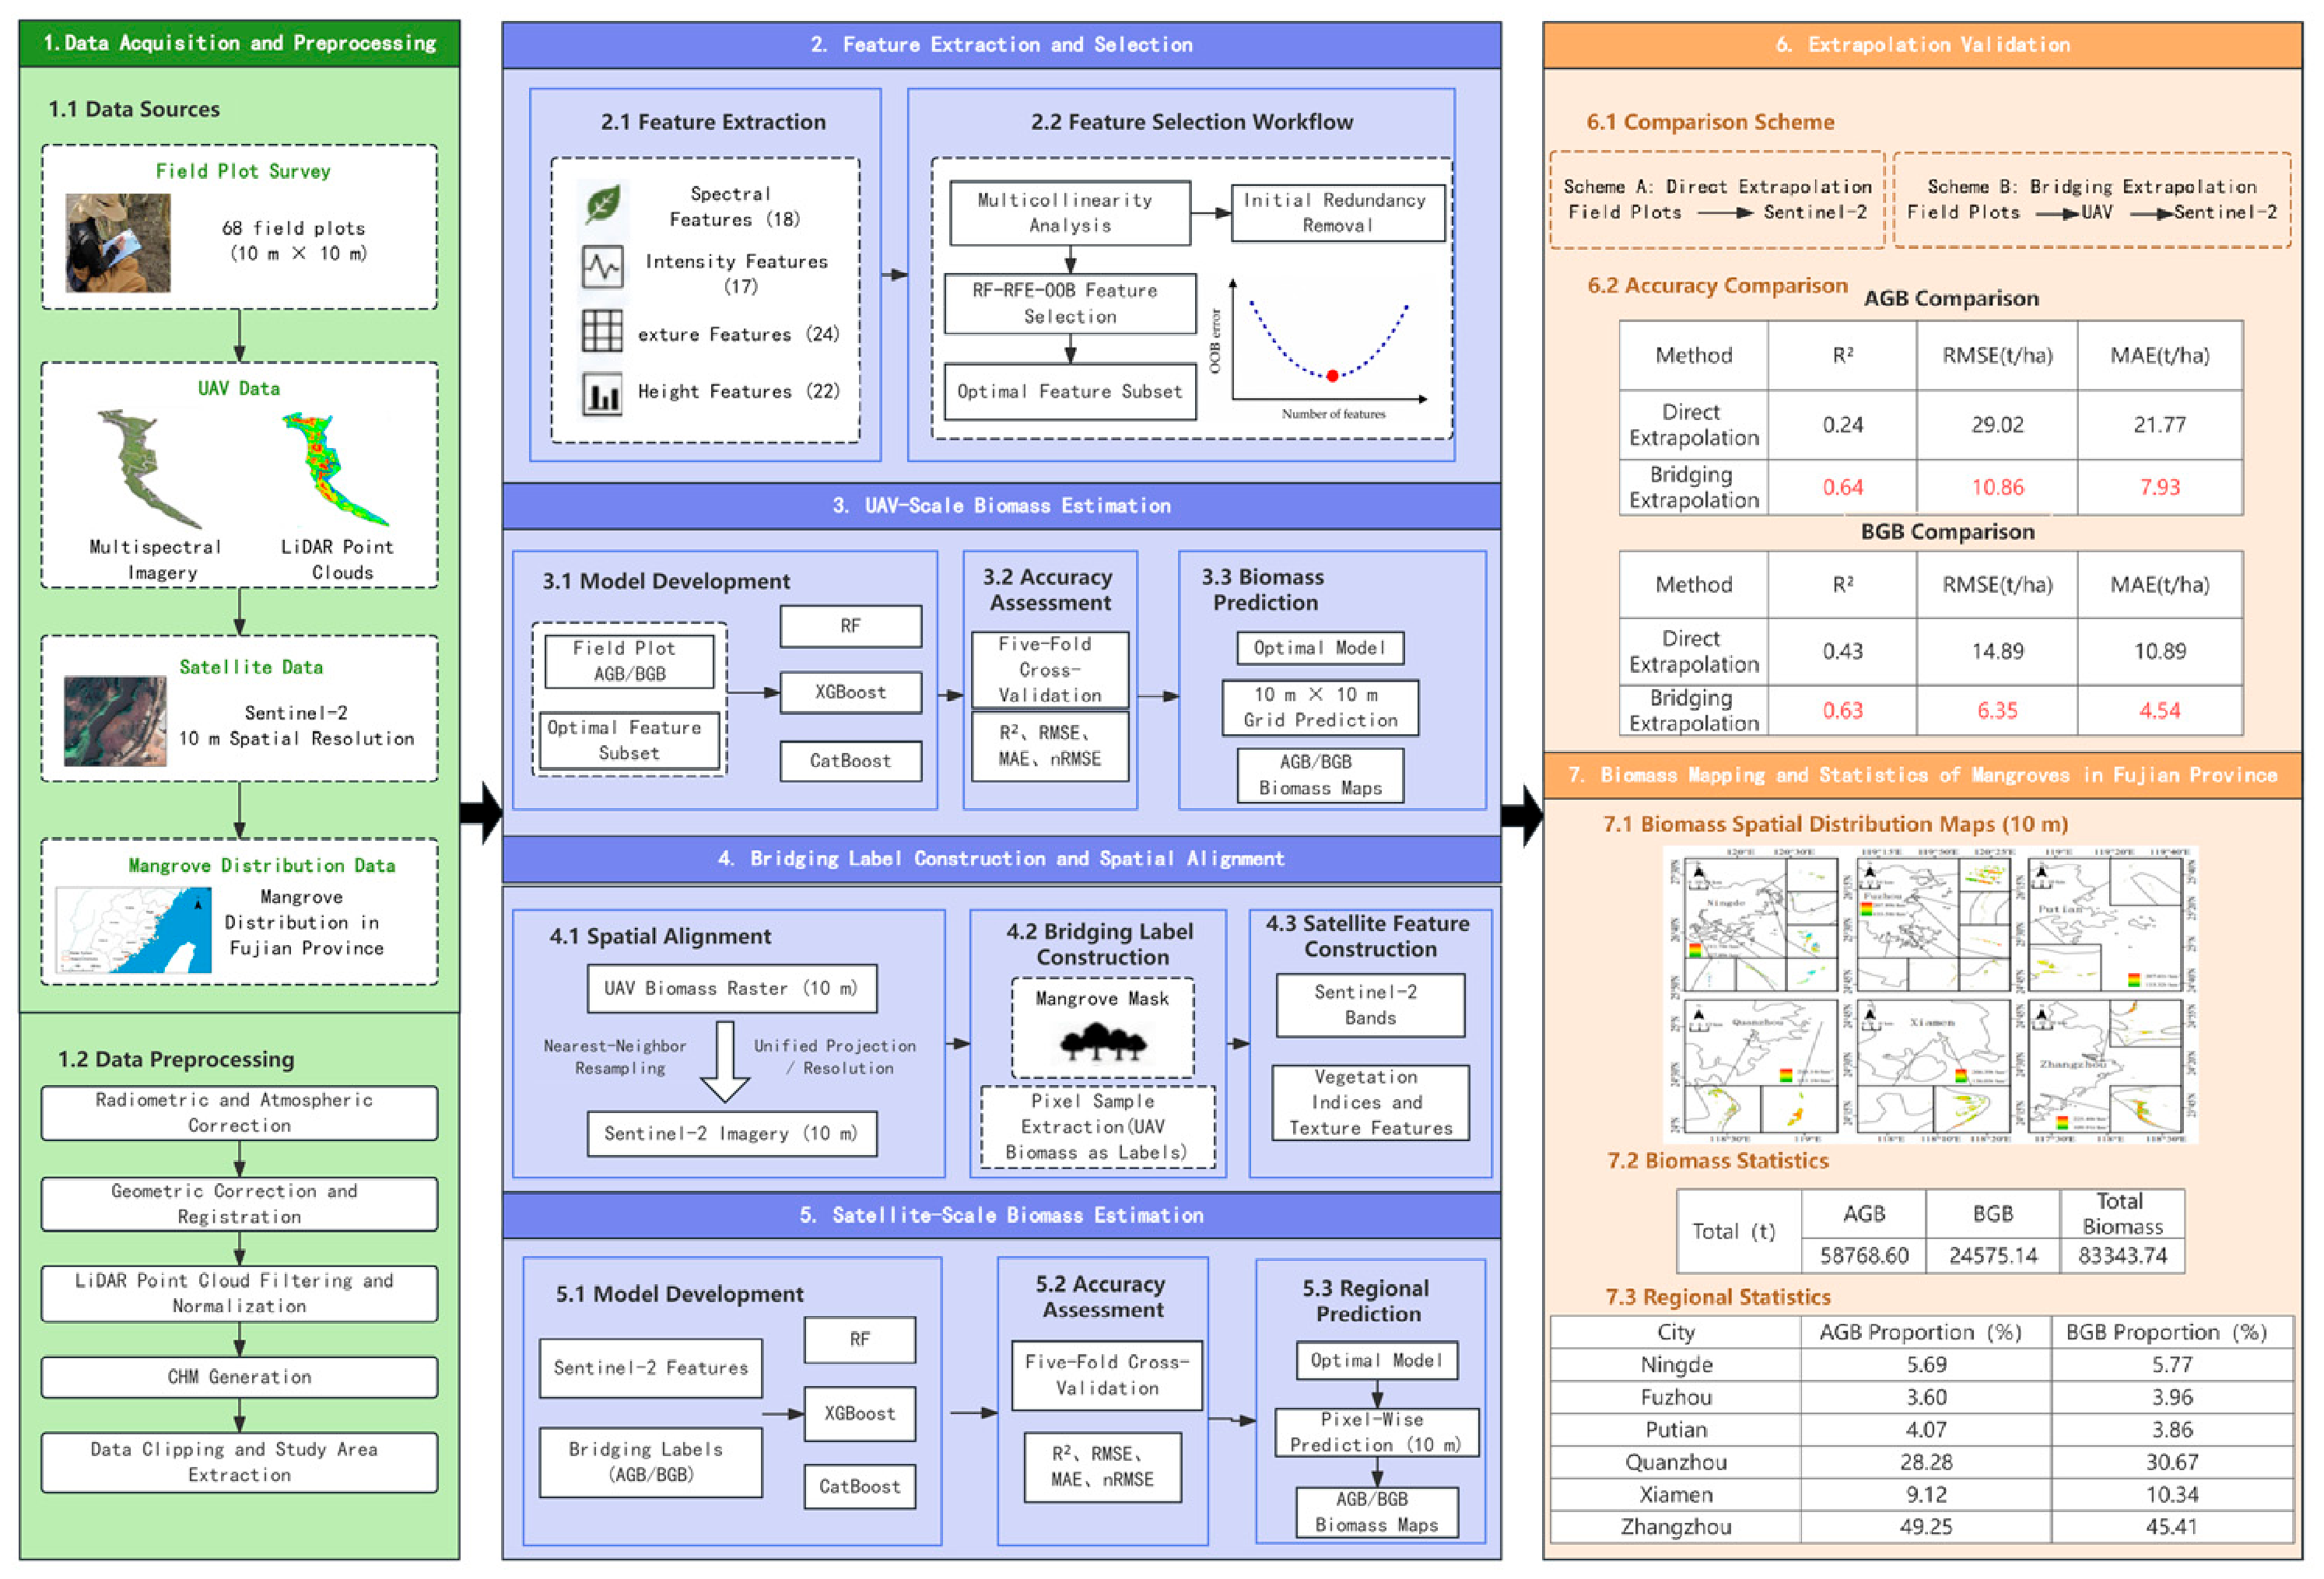
A multiscale biomass estimation framework integrating field plots, UAV observations, and satellite remote sensing was developed in this study. The overall workflow is illustrated in Figure 5. First, biomass reference data were obtained through field surveys and allometric growth equations. Subsequently, UAV-scale biomass models were established based on UAV multispectral imagery and LiDAR data, and UAV-derived bridging labels were constructed. On this basis, Sentinel-2 features were utilized to extrapolate mangrove biomass across Fujian Province. Finally, the effectiveness of the bridging-scale framework was evaluated through a comparison between direct extrapolation and UAV-bridged extrapolation approaches.
Figure 5.
Workflow of UAV-bridged mangrove biomass estimation and provincial-scale upscaling in Fujian Province, China.
3. Results and Analysis
3.1. Characteristics of Plot Biomass
Based on field surveys, structural parameters including tree height, diameter at breast height, and basal diameter were obtained for 68 sample plots. AGB, BGB, and TB were calculated using allometric growth equations and subsequently subjected to statistical analysis.
The results showed that the AGB of the sample plots ranged from 78.30 to 218.44 t·ha−1, with an average value of 132.25 t·ha−1. The BGB ranged from 12.84 to 109.81 t·ha−1, with an average value of 57.56 t·ha−1. The TB ranged from 144.74 to 274.63 t·ha−1, with an average value of 189.81 t·ha−1. Overall, the mangrove stands in the study area exhibited relatively high biomass levels, indicating favorable growth conditions and strong carbon accumulation capacity within the Zhangjiangkou Mangrove Nature Reserve.
3.2. Analysis of Feature Selection Results
3.2.1. Results of Multicollinearity Screening
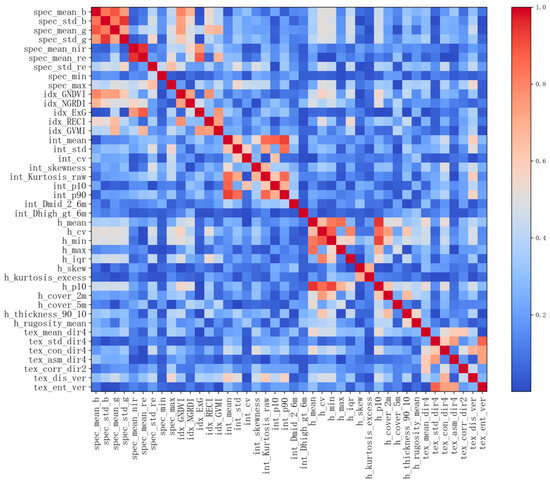
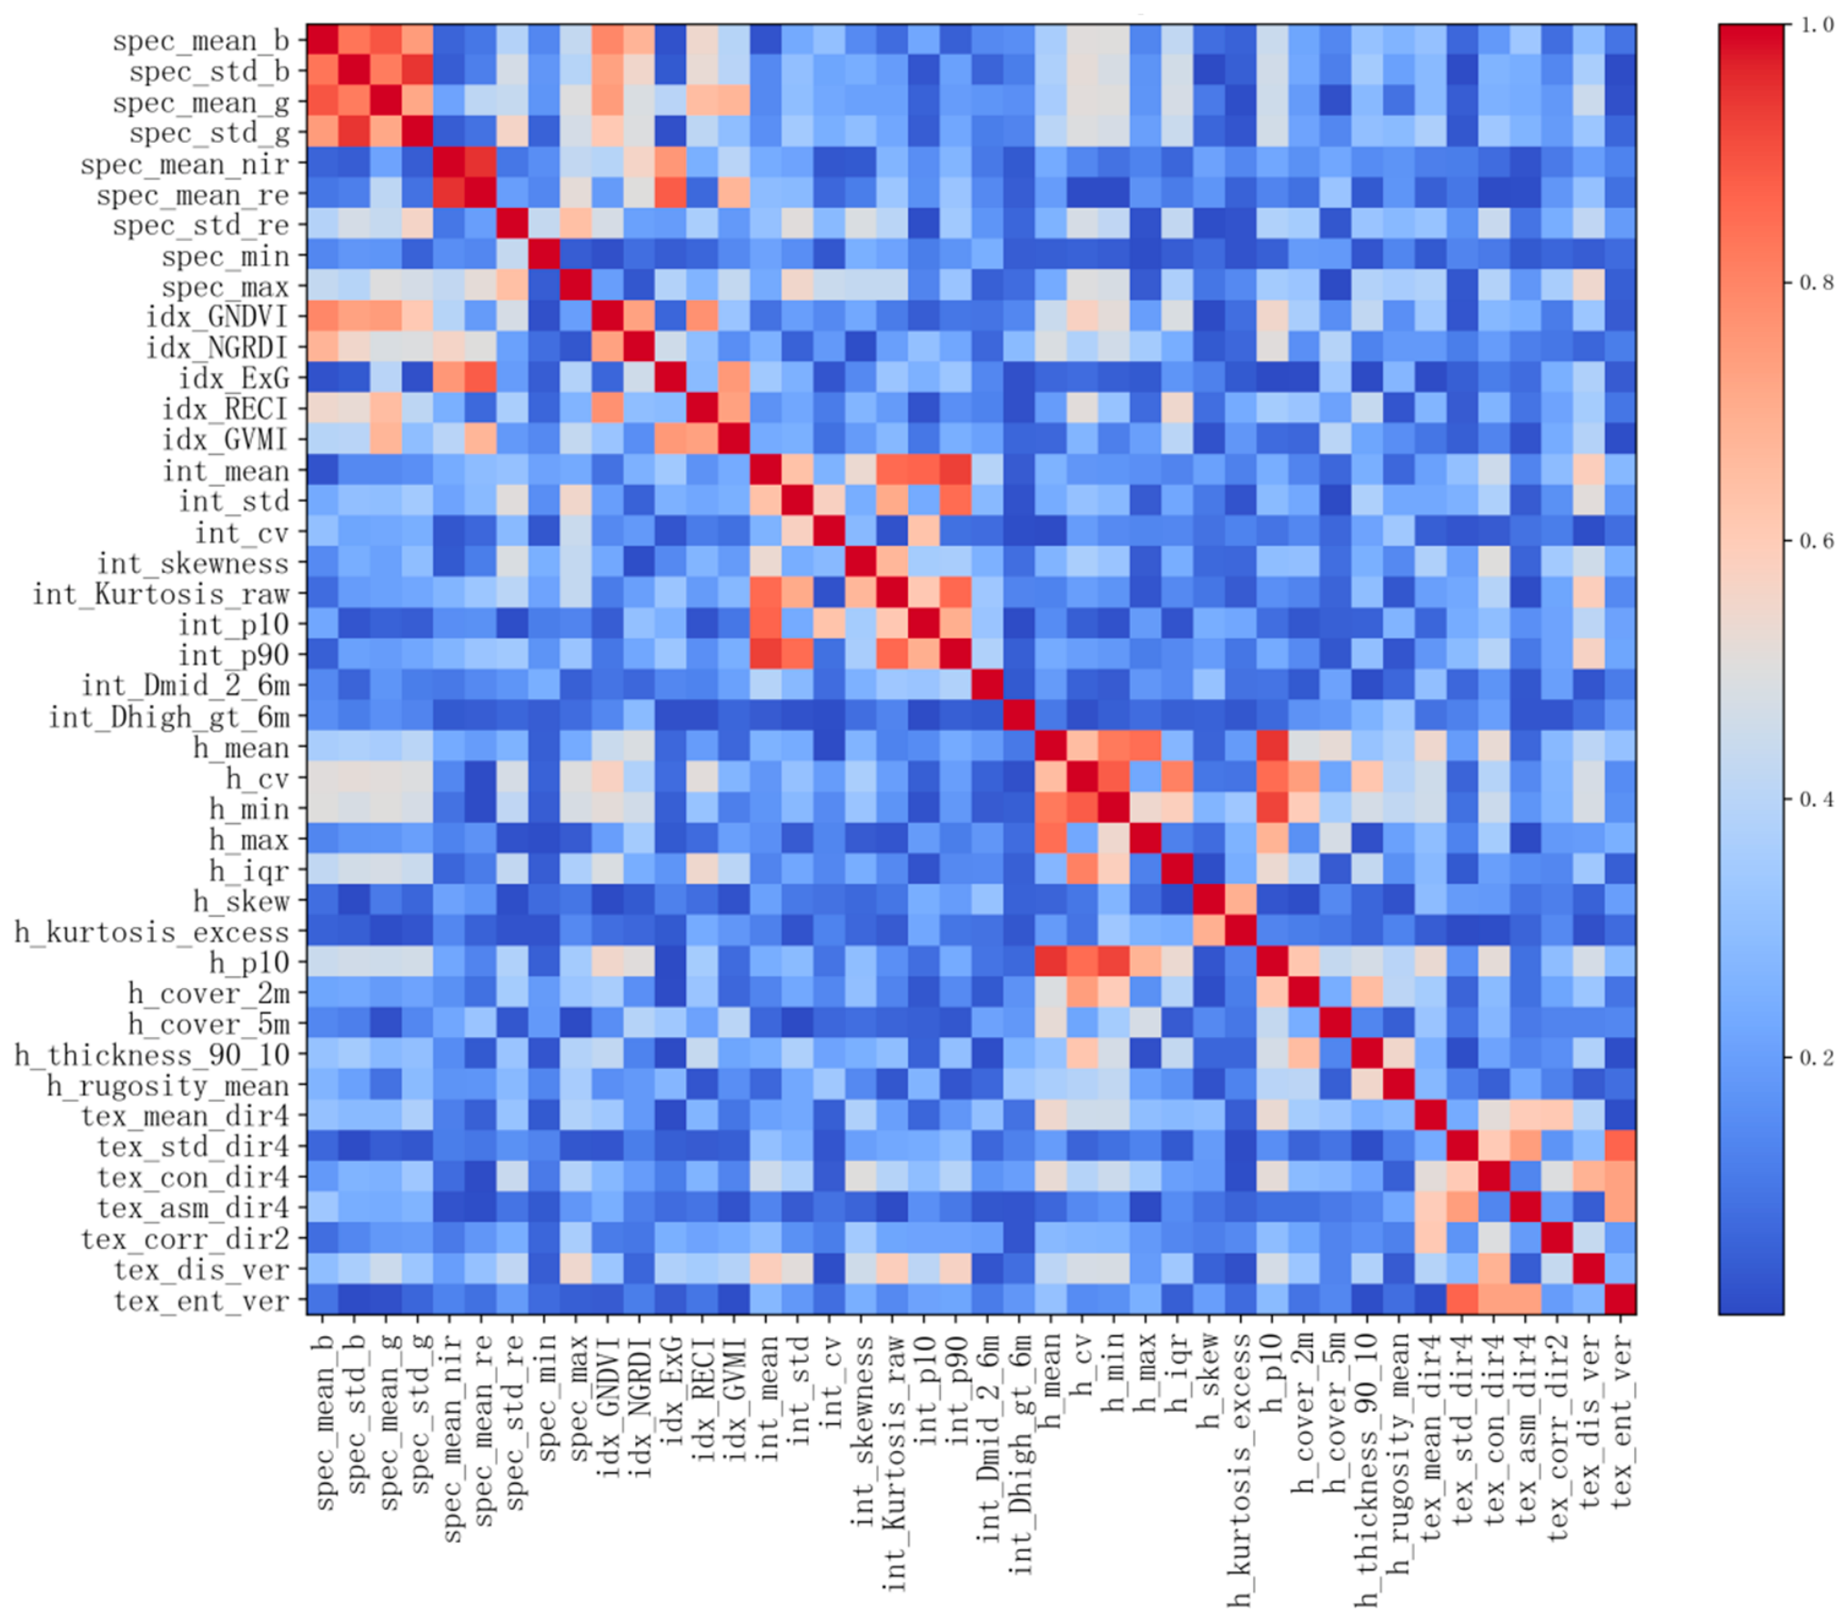
After Pearson correlation analysis, the number of features was reduced from 87 to 42, effectively decreasing feature redundancy and multicollinearity. The complete list of the 42 retained features is provided in Supplementary Table S1. Following the screening process, the absolute values of the correlation coefficients for most features were lower than 0.95, while only a small number of homologous features retained relatively high correlations. The heatmap of the absolute correlation coefficients after feature screening is shown in Figure 6. These results indicate that multicollinearity was effectively controlled, providing a relatively stable feature foundation for subsequent model development.
Figure 6.
Heatmap of absolute correlation coefficients after multicollinearity screening. Abbreviations: spec denotes spectral features; idx denotes vegetation indices; int denotes LiDAR intensity features; tex denotes texture features; h denotes canopy height features.
3.2.2. RF-RFE-OOB Feature Selection Results
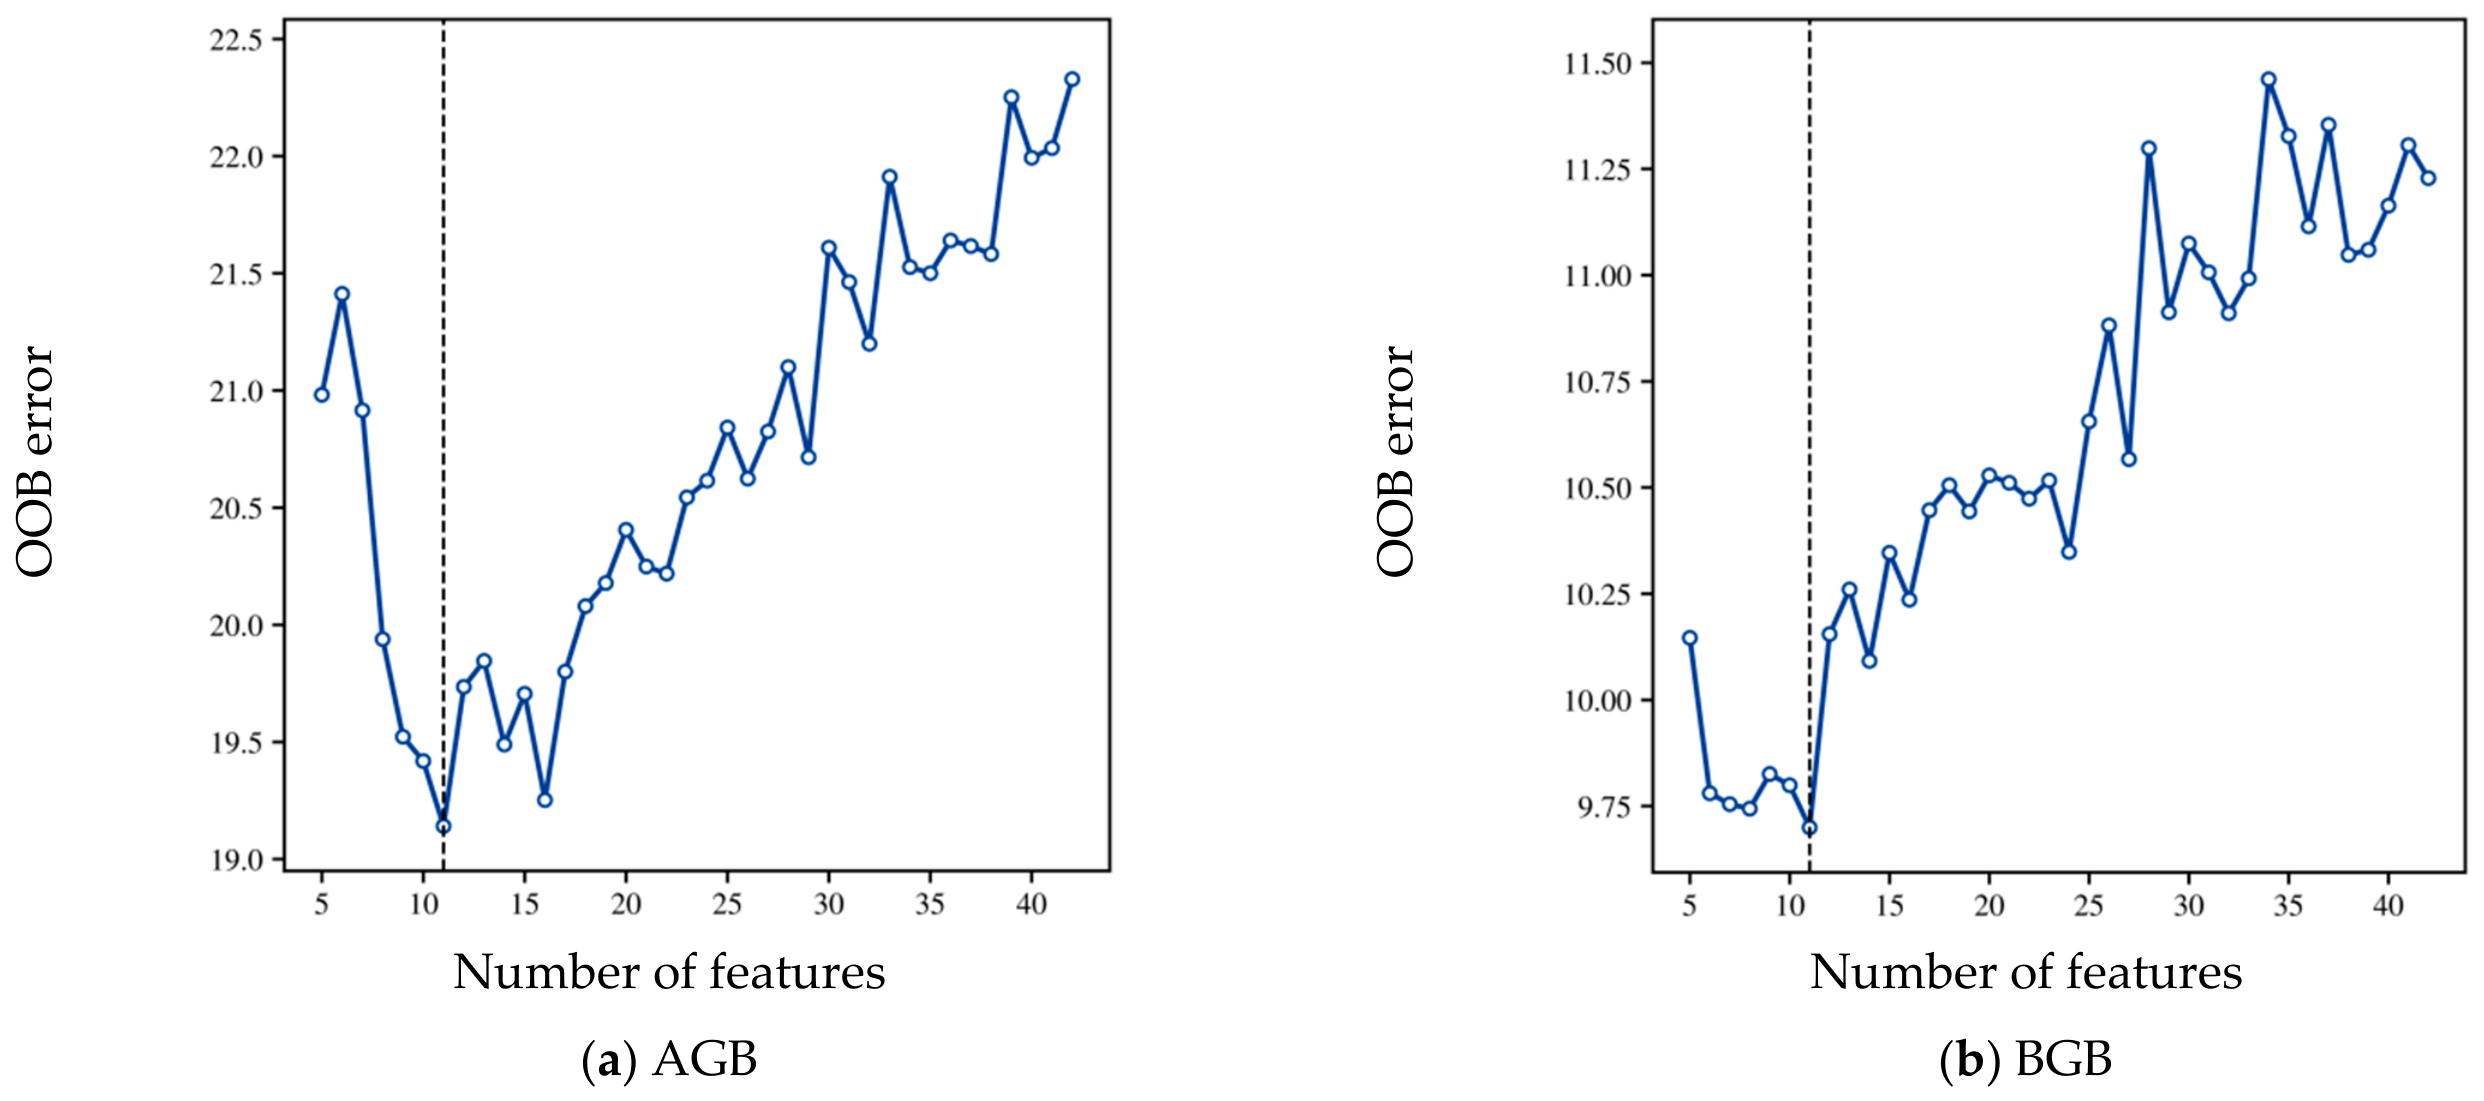
Feature selection was performed using the RF-RFE-OOB method. The results showed that the OOB error of both the AGB and BGB models initially decreased and then increased with the increasing number of features (Figure 7). The minimum OOB error was achieved when the number of features reached 11.
Figure 7.
OOB Error vs. Number of Features Curve for Biomass Feature Selection.
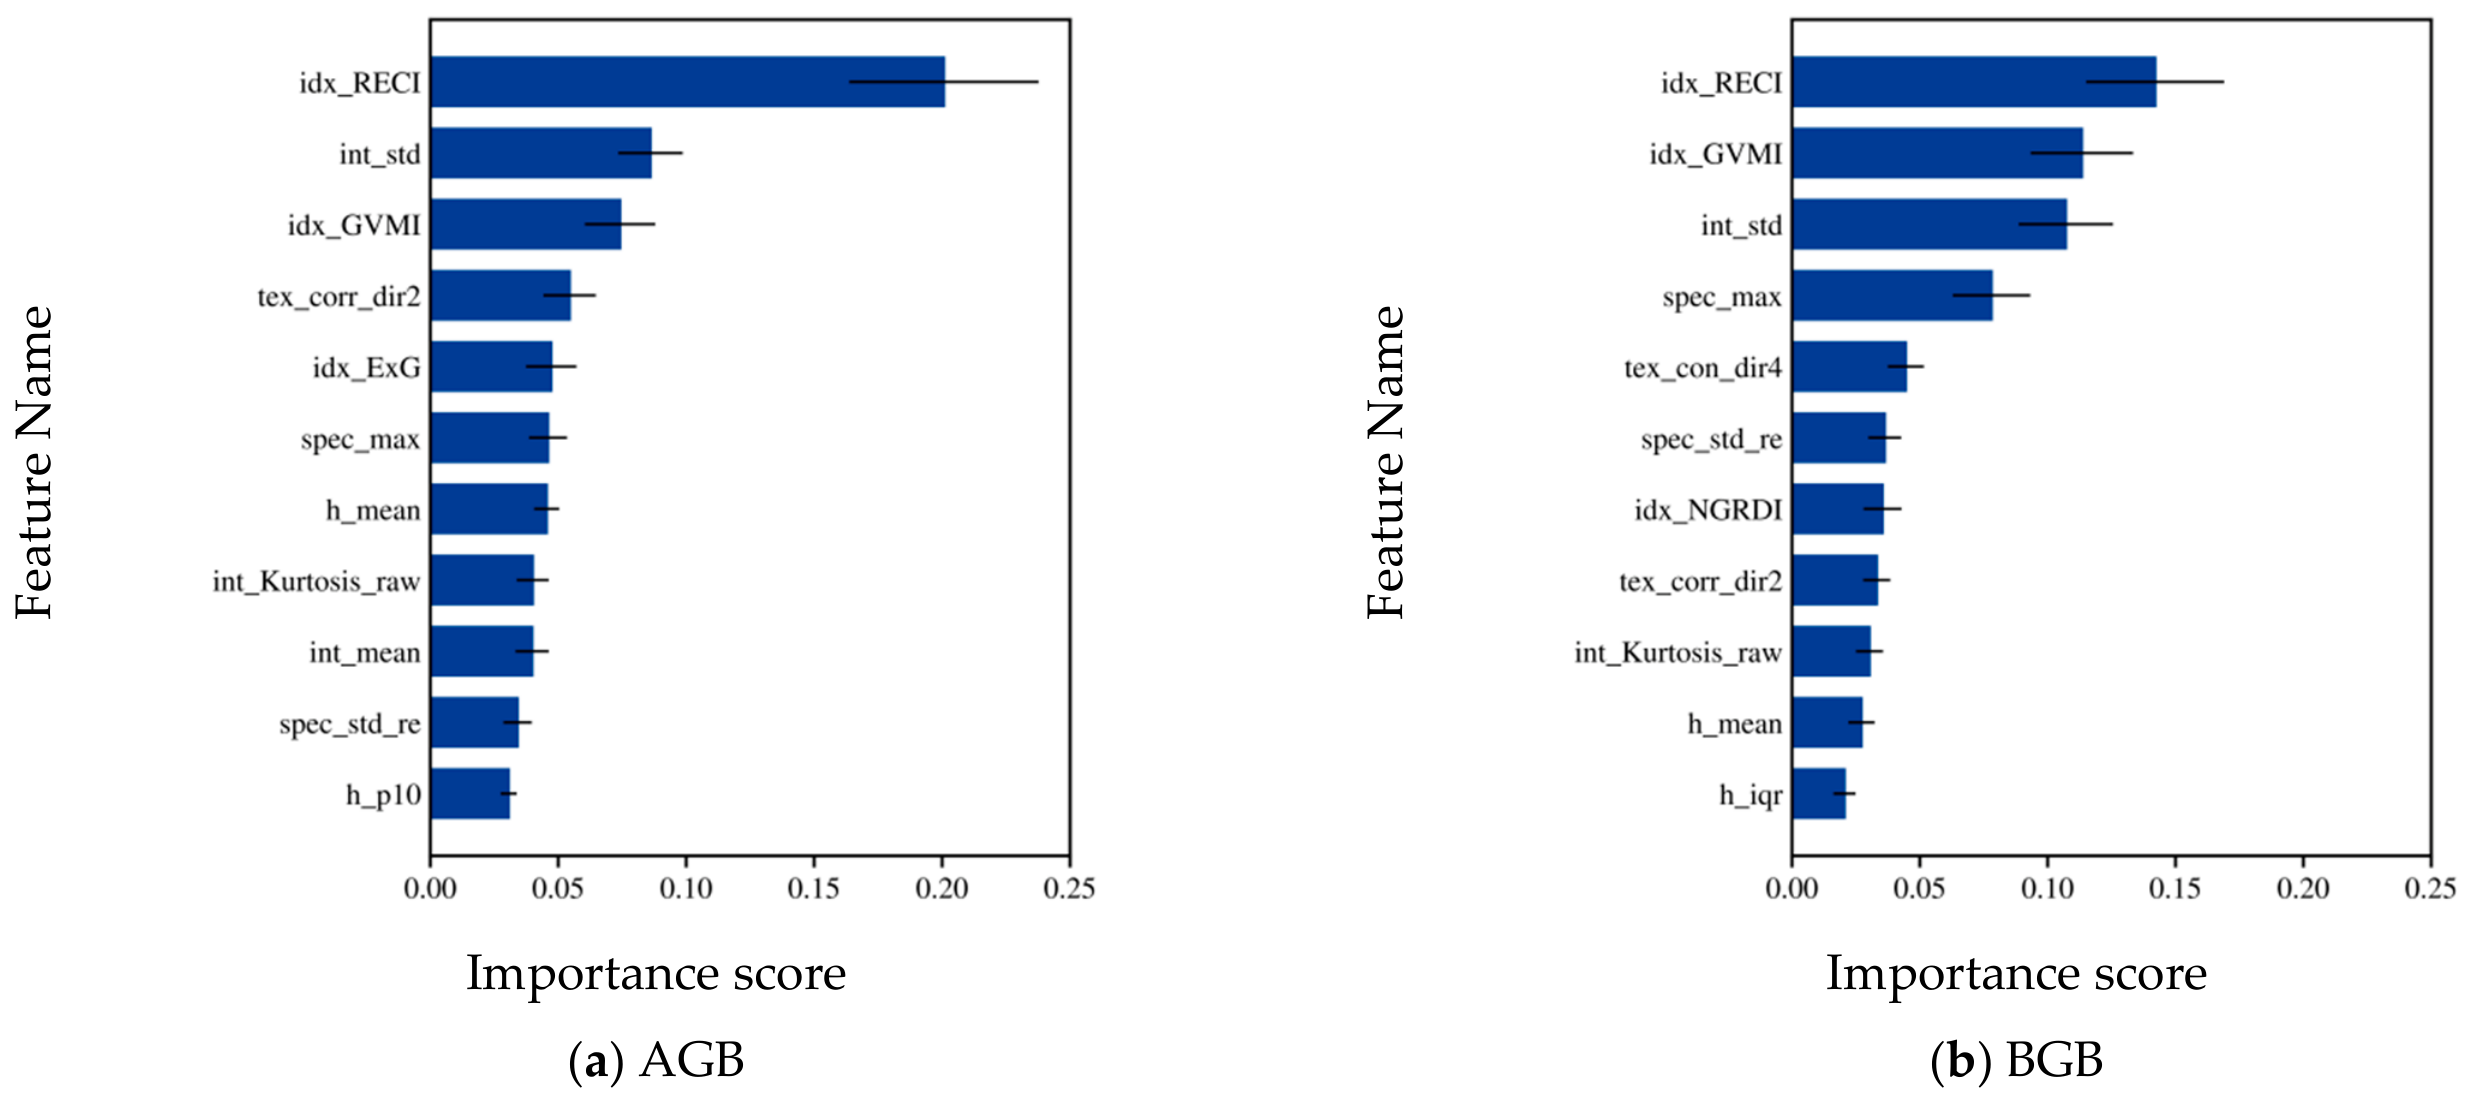
The optimal feature subsets and corresponding selected statistics are summarized in Table 7, while the feature importance rankings of the selected variables for the AGB and BGB models are shown in Figure 8. These results indicate that the integration of multisource remote sensing features can effectively improve the estimation accuracy of mangrove biomass.
Table 7.
UAV-scale feature selection results.
Figure 8.
Feature Importance Ranking for UAV-Scale Biomass Estimation Model. Abbreviations: spec denotes spectral features; idx denotes vegetation indices; int denotes LiDAR intensity features; tex denotes texture features; h denotes canopy height features.
3.3. UAV-Scale Mangrove Biomass Estimation Results
Based on the optimal feature combinations selected by the RF-RFE-OOB method, models for estimating AGB and BGB of mangroves were developed, and UAV-scale biomass mapping was conducted for the study area. As shown in Table 8 and Table 9, all models achieved satisfactory estimation performance. Among them, the XGBoost model performed best for AGB estimation, while the CatBoost model achieved the highest accuracy for BGB estimation, indicating that multisource remote sensing features can effectively characterize variations in mangrove biomass.
Table 8.
Comparison of AGB estimation accuracy for global models.
Table 9.
Comparison of BGB estimation accuracy for global models.
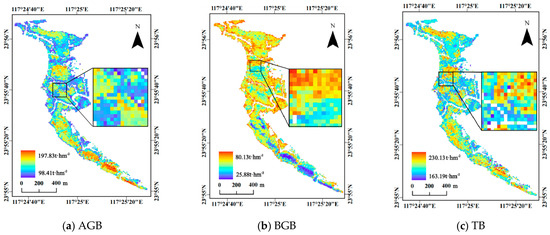
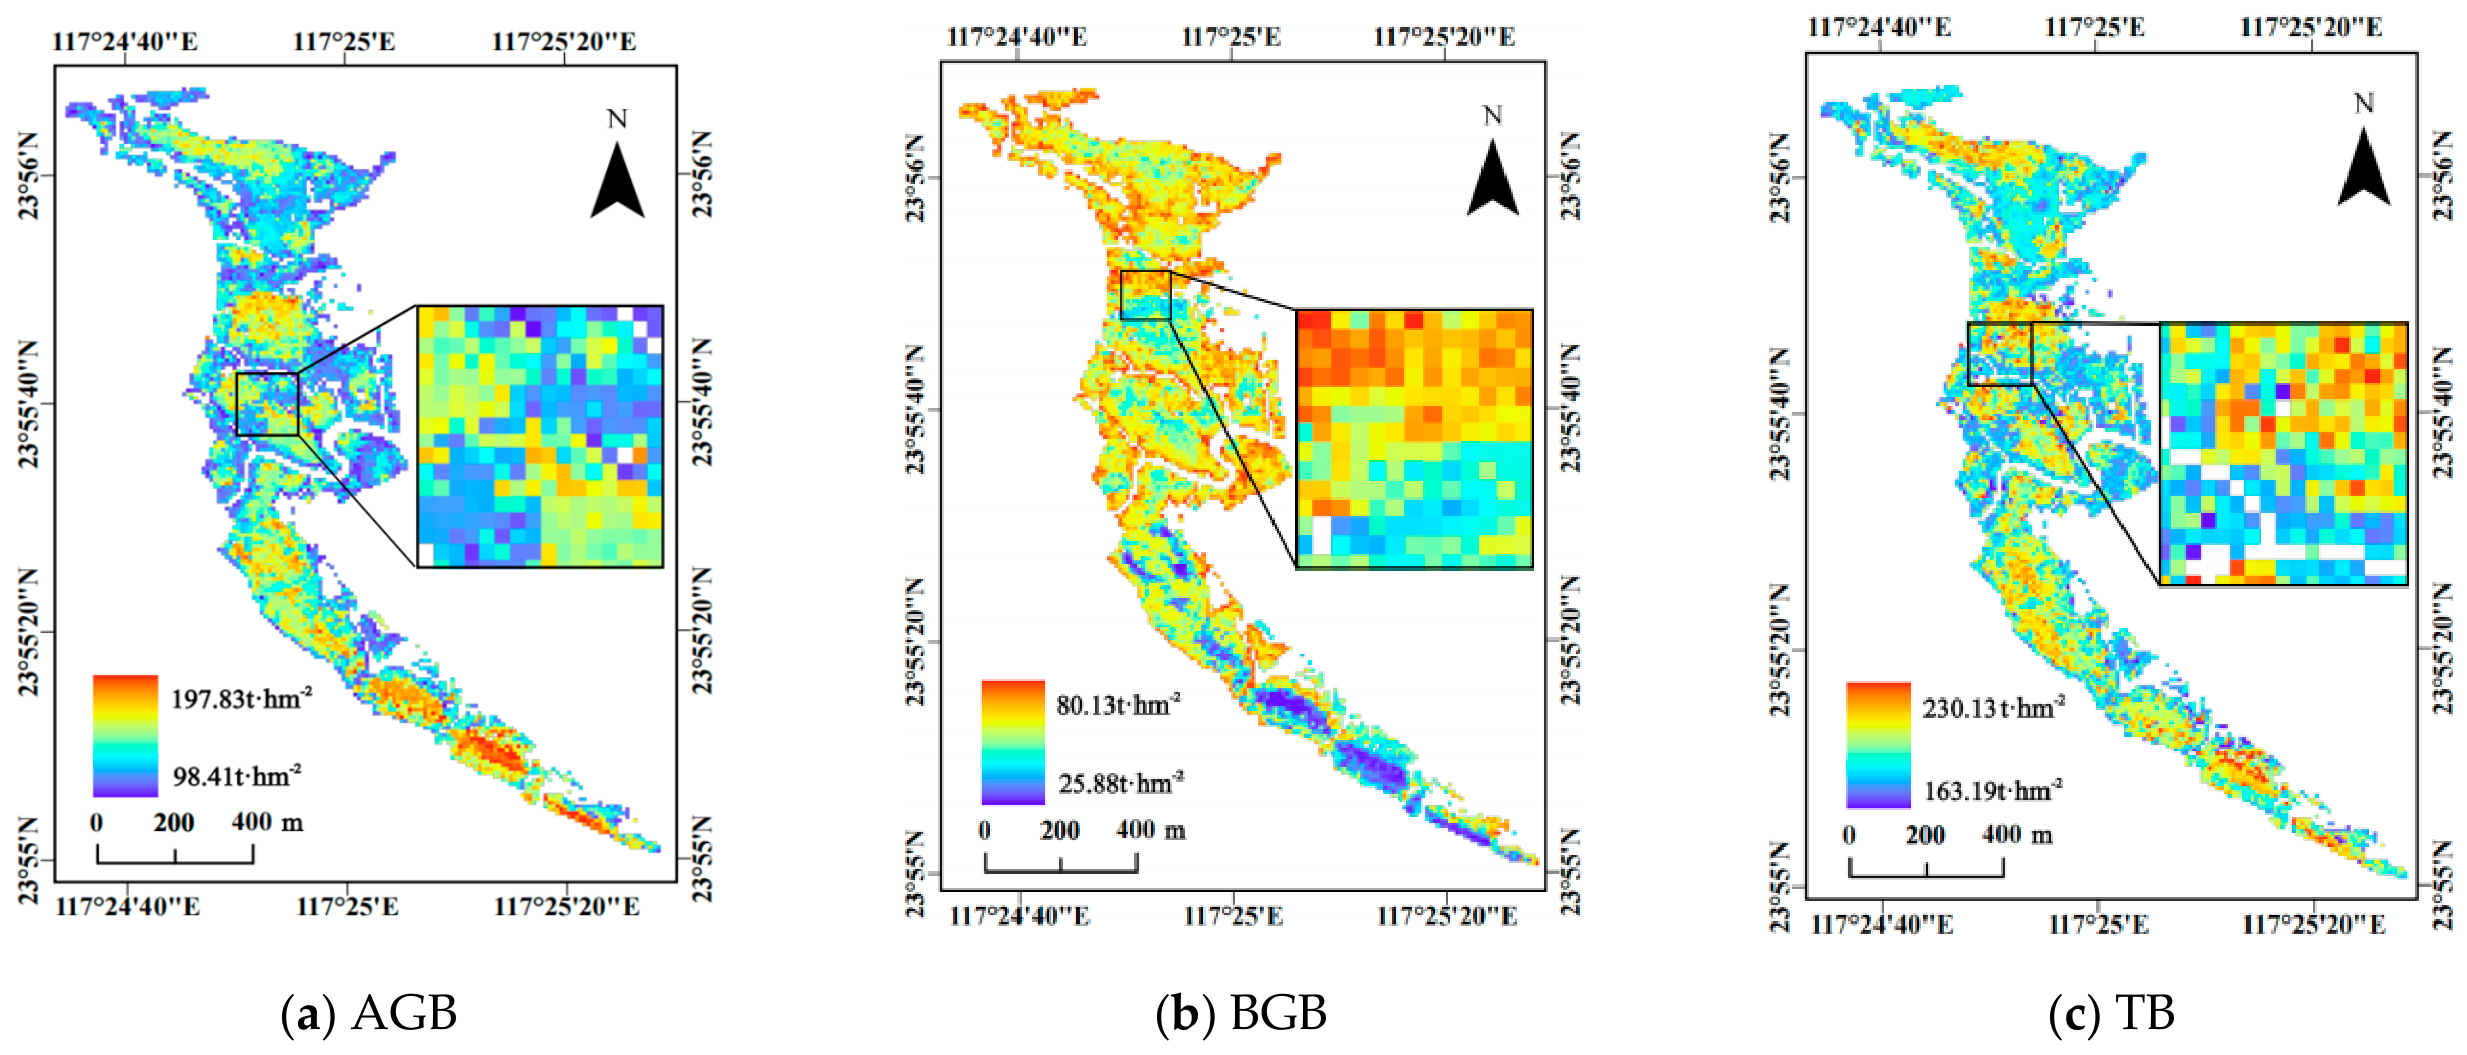
The optimal models were subsequently applied for grid-based prediction, generating the spatial distribution maps of AGB, BGB, and TB for the study area (Figure 9). The results revealed pronounced spatial heterogeneity in mangrove biomass. High-biomass areas were mainly distributed within large and continuous mangrove stands, whereas low-biomass areas were primarily located along forest edges and transitional zones between different communities.
Figure 9.
Spatial distribution of mangrove biomass in the study area predicted by the global model.
The statistical results showed that the total AGB and BGB of the study area were 6515.72 t and 3123.71 t, respectively, resulting in a total biomass of 9639.43 t. Among the three mangrove species, Kandelia obovata contributed the largest proportion, accounting for 62.05% of the total biomass. The UAV-scale biomass maps effectively reflected the spatial distribution patterns of mangrove biomass in the study area and provided fundamental data for subsequent bridge-label construction and biomass extrapolation at the provincial scale in Fujian Province.
3.4. Satellite-Scale Feature Selection Results
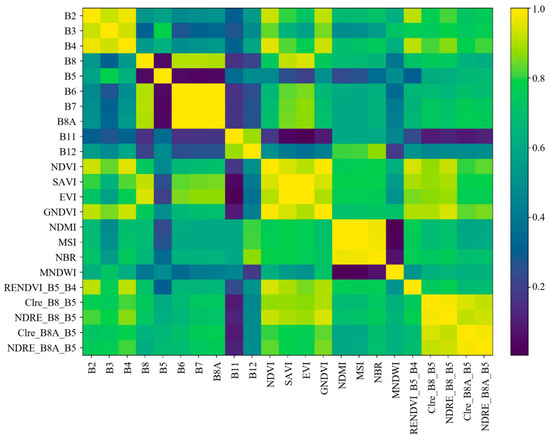
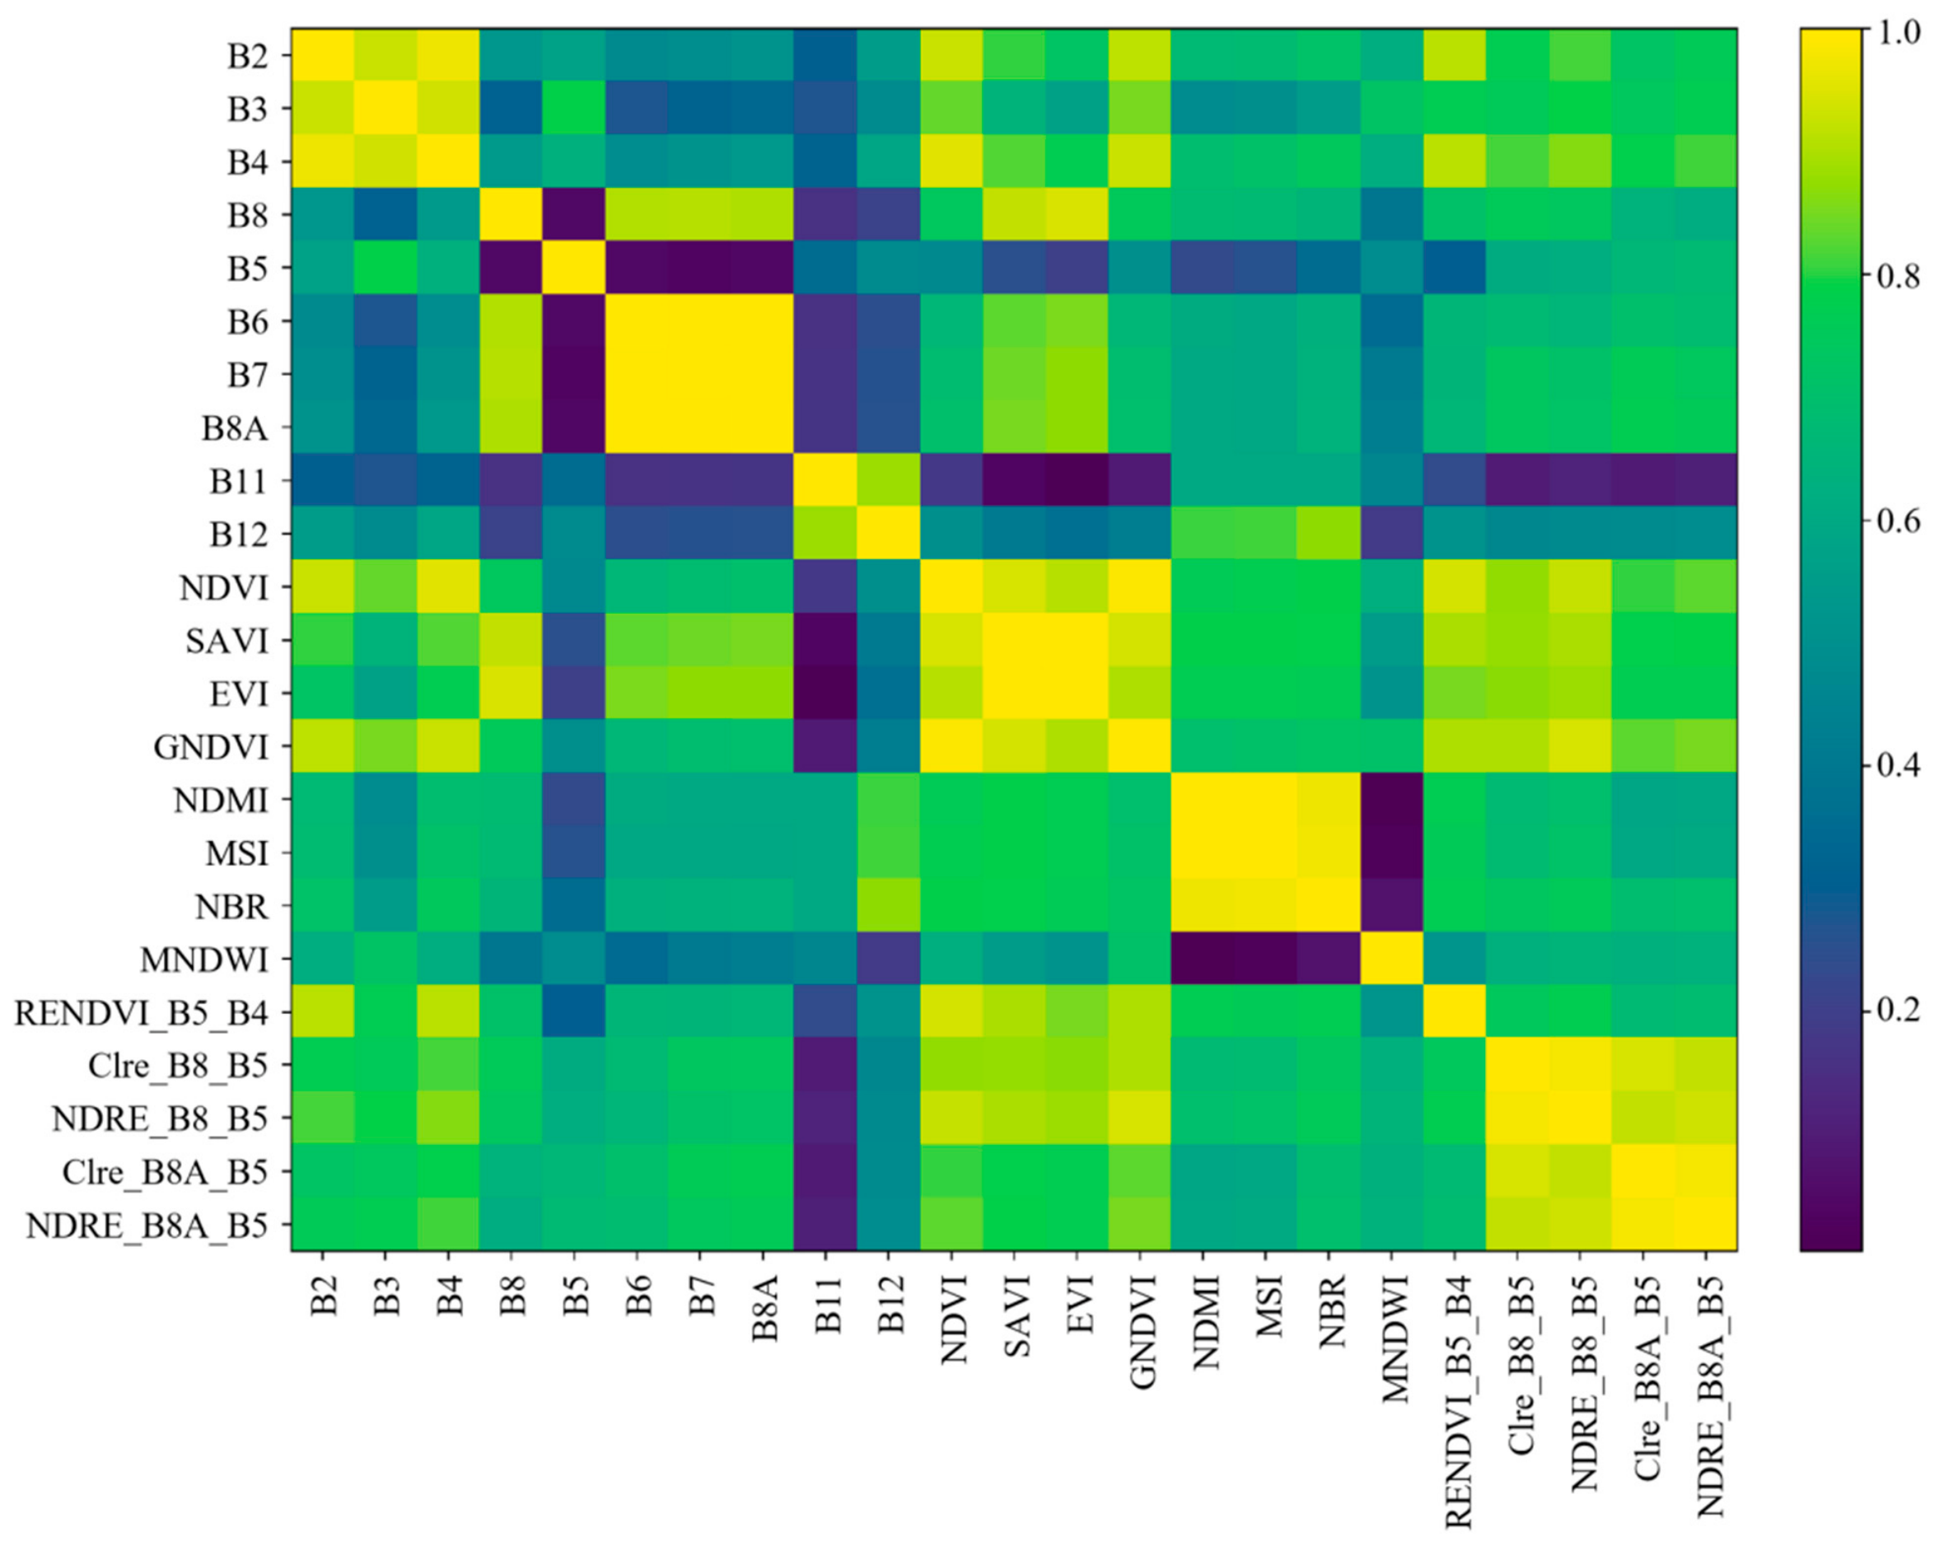
Multicollinearity analysis and RF algorithm were employed to select features for satellite-scale mangrove AGB and BGB estimation. The selected variables are presented in Table 10. Figure 10 illustrates the heatmap of the absolute correlation coefficients among the retained features after multicollinearity processing. Overall, the correlations among the selected features were substantially reduced, and the correlation coefficients of most feature pairs remained at relatively low levels, effectively decreasing feature redundancy.
Table 10.
Results of AGB and BGB feature selection at the satellite scale.
Figure 10.
Heatmap of absolute correlation coefficients after multicollinearity screening.
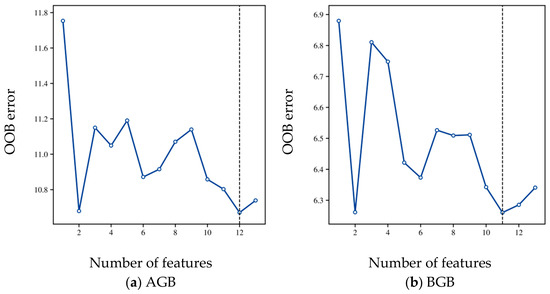
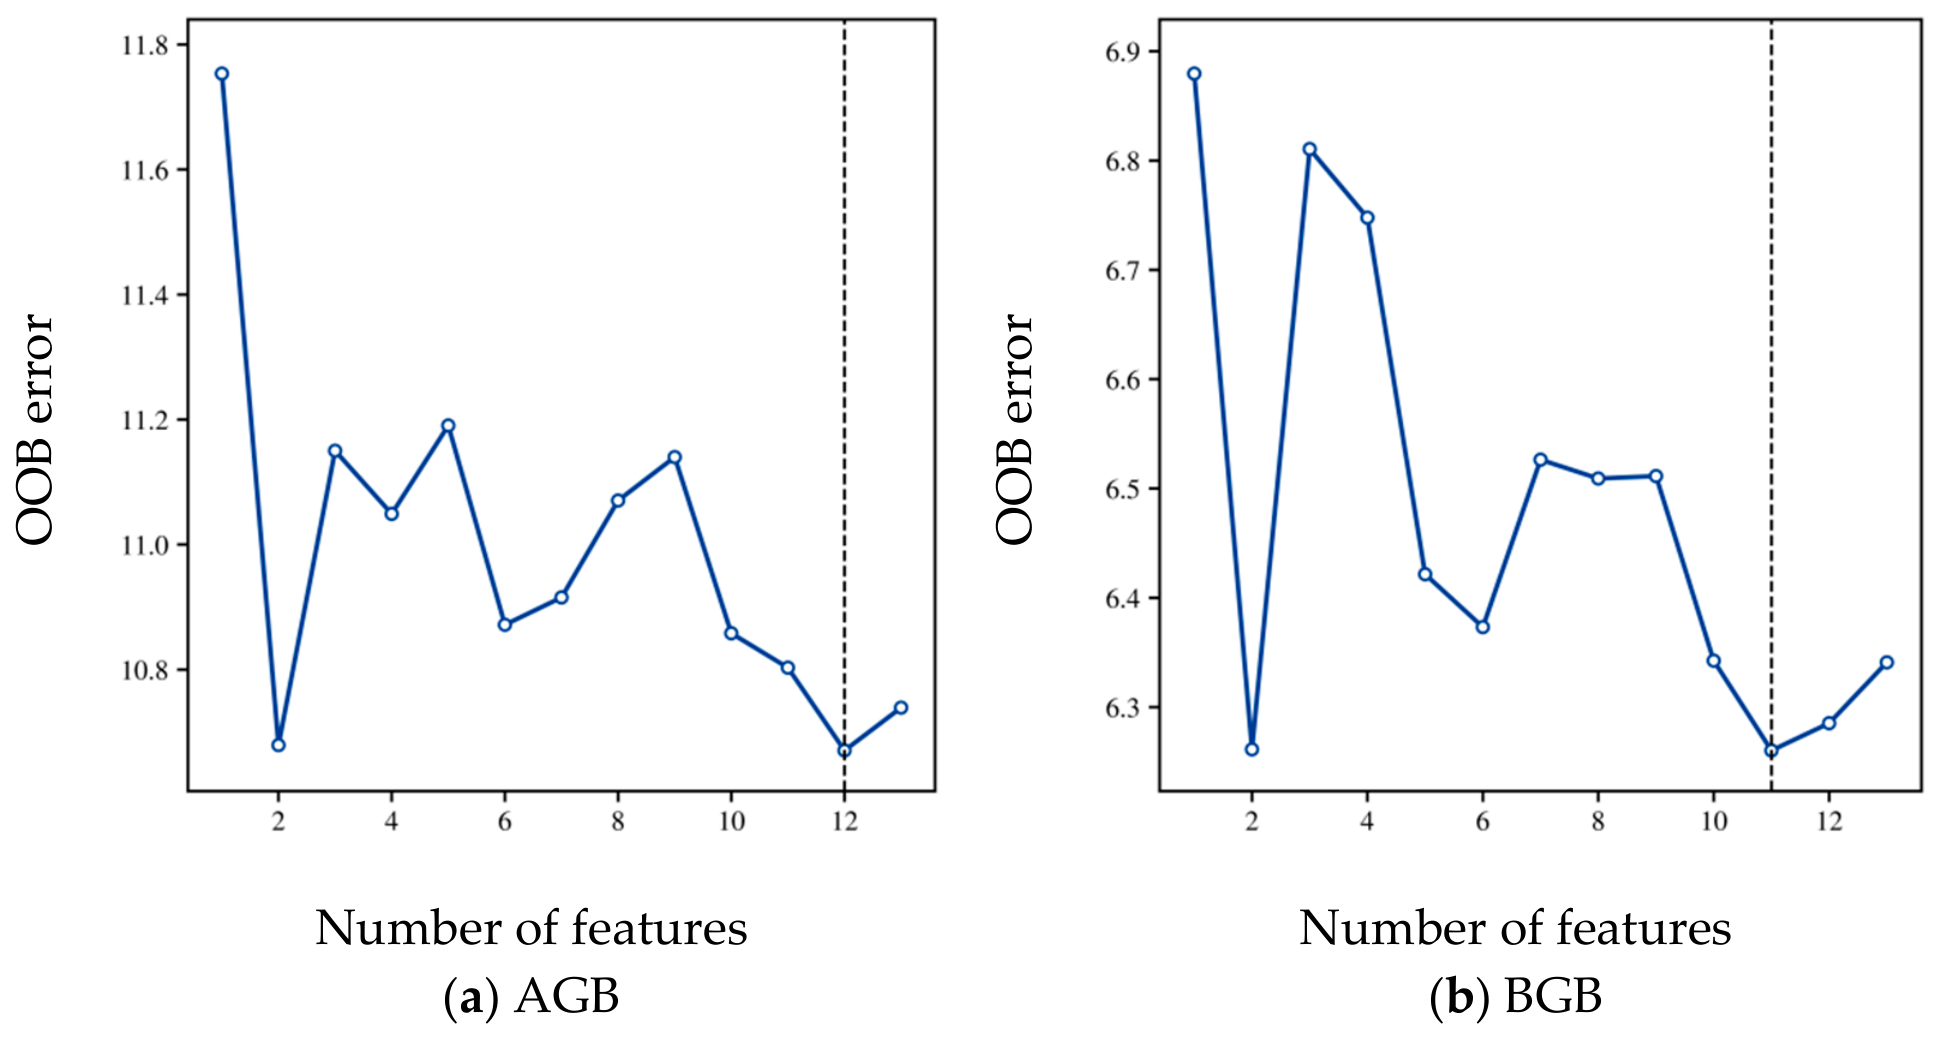
The relationship between the number of features and the OOB error (Figure 11) showed that the AGB and BGB models achieved the minimum OOB error when the numbers of selected features were 12 and 11, respectively, indicating the optimal model performance. The final selected features mainly consisted of three categories: red-edge and near-infrared bands, red-edge-based vegetation indices, and moisture- and background-related indices.
Figure 11.
OOB error versus number of features at the satellite scale.
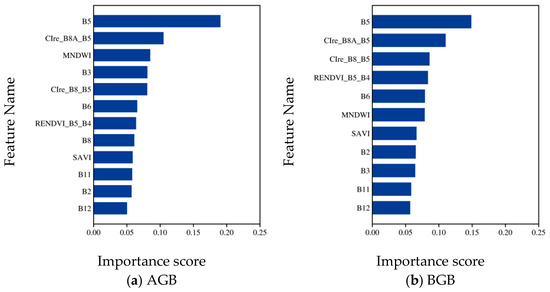
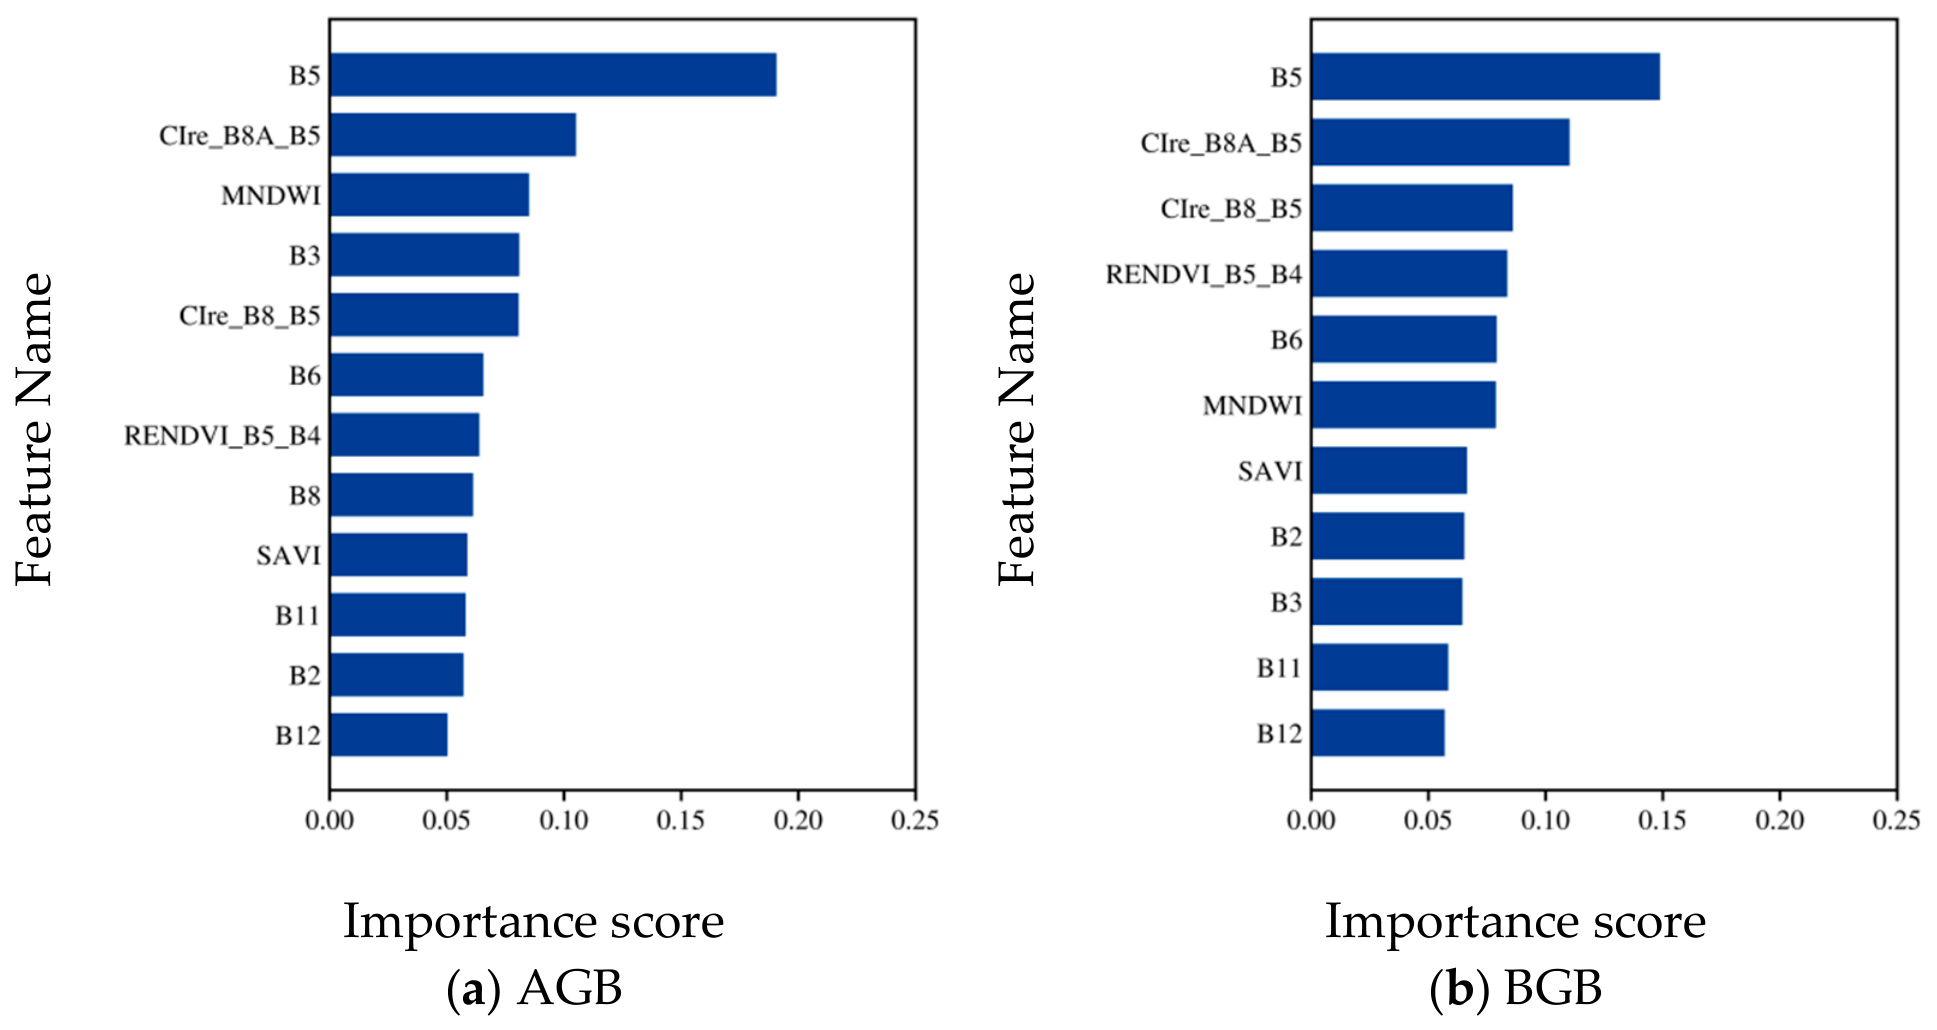
According to the feature importance ranking shown in Figure 12, the most influential variables in the AGB model were B5, CIre_B8A_B5, and MNDWI. Similarly, B5 and CIre_B8A_B5 were the dominant variables in the BGB model, while red edge-related indices and RENDVI_B5_B4 also exhibited relatively high importance.
Figure 12.
Feature importance scores at the satellite scale.
3.5. Satellite-Scale Biomass Estimation Results
3.5.1. Model Accuracy Evaluation
Satellite-scale biomass training samples were constructed using UAV-derived bridging labels, and RF, CatBoost, and XGBoost were employed to develop AGB and BGB estimation models, respectively. Model performance was evaluated using five-fold cross-validation, and the results are presented in Table 11.
Table 11.
Five-fold cross-validation accuracy comparison of satellite-scale extrapolation models.
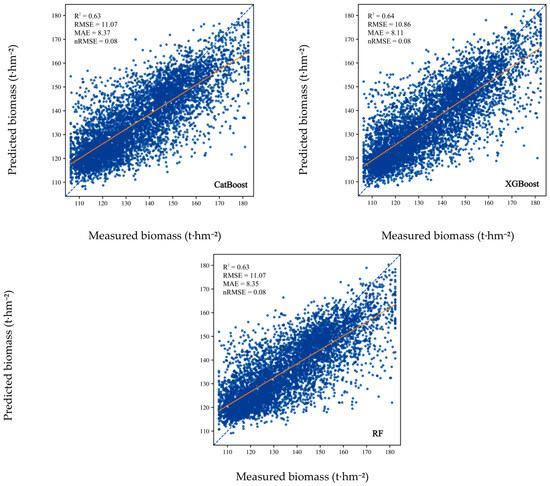
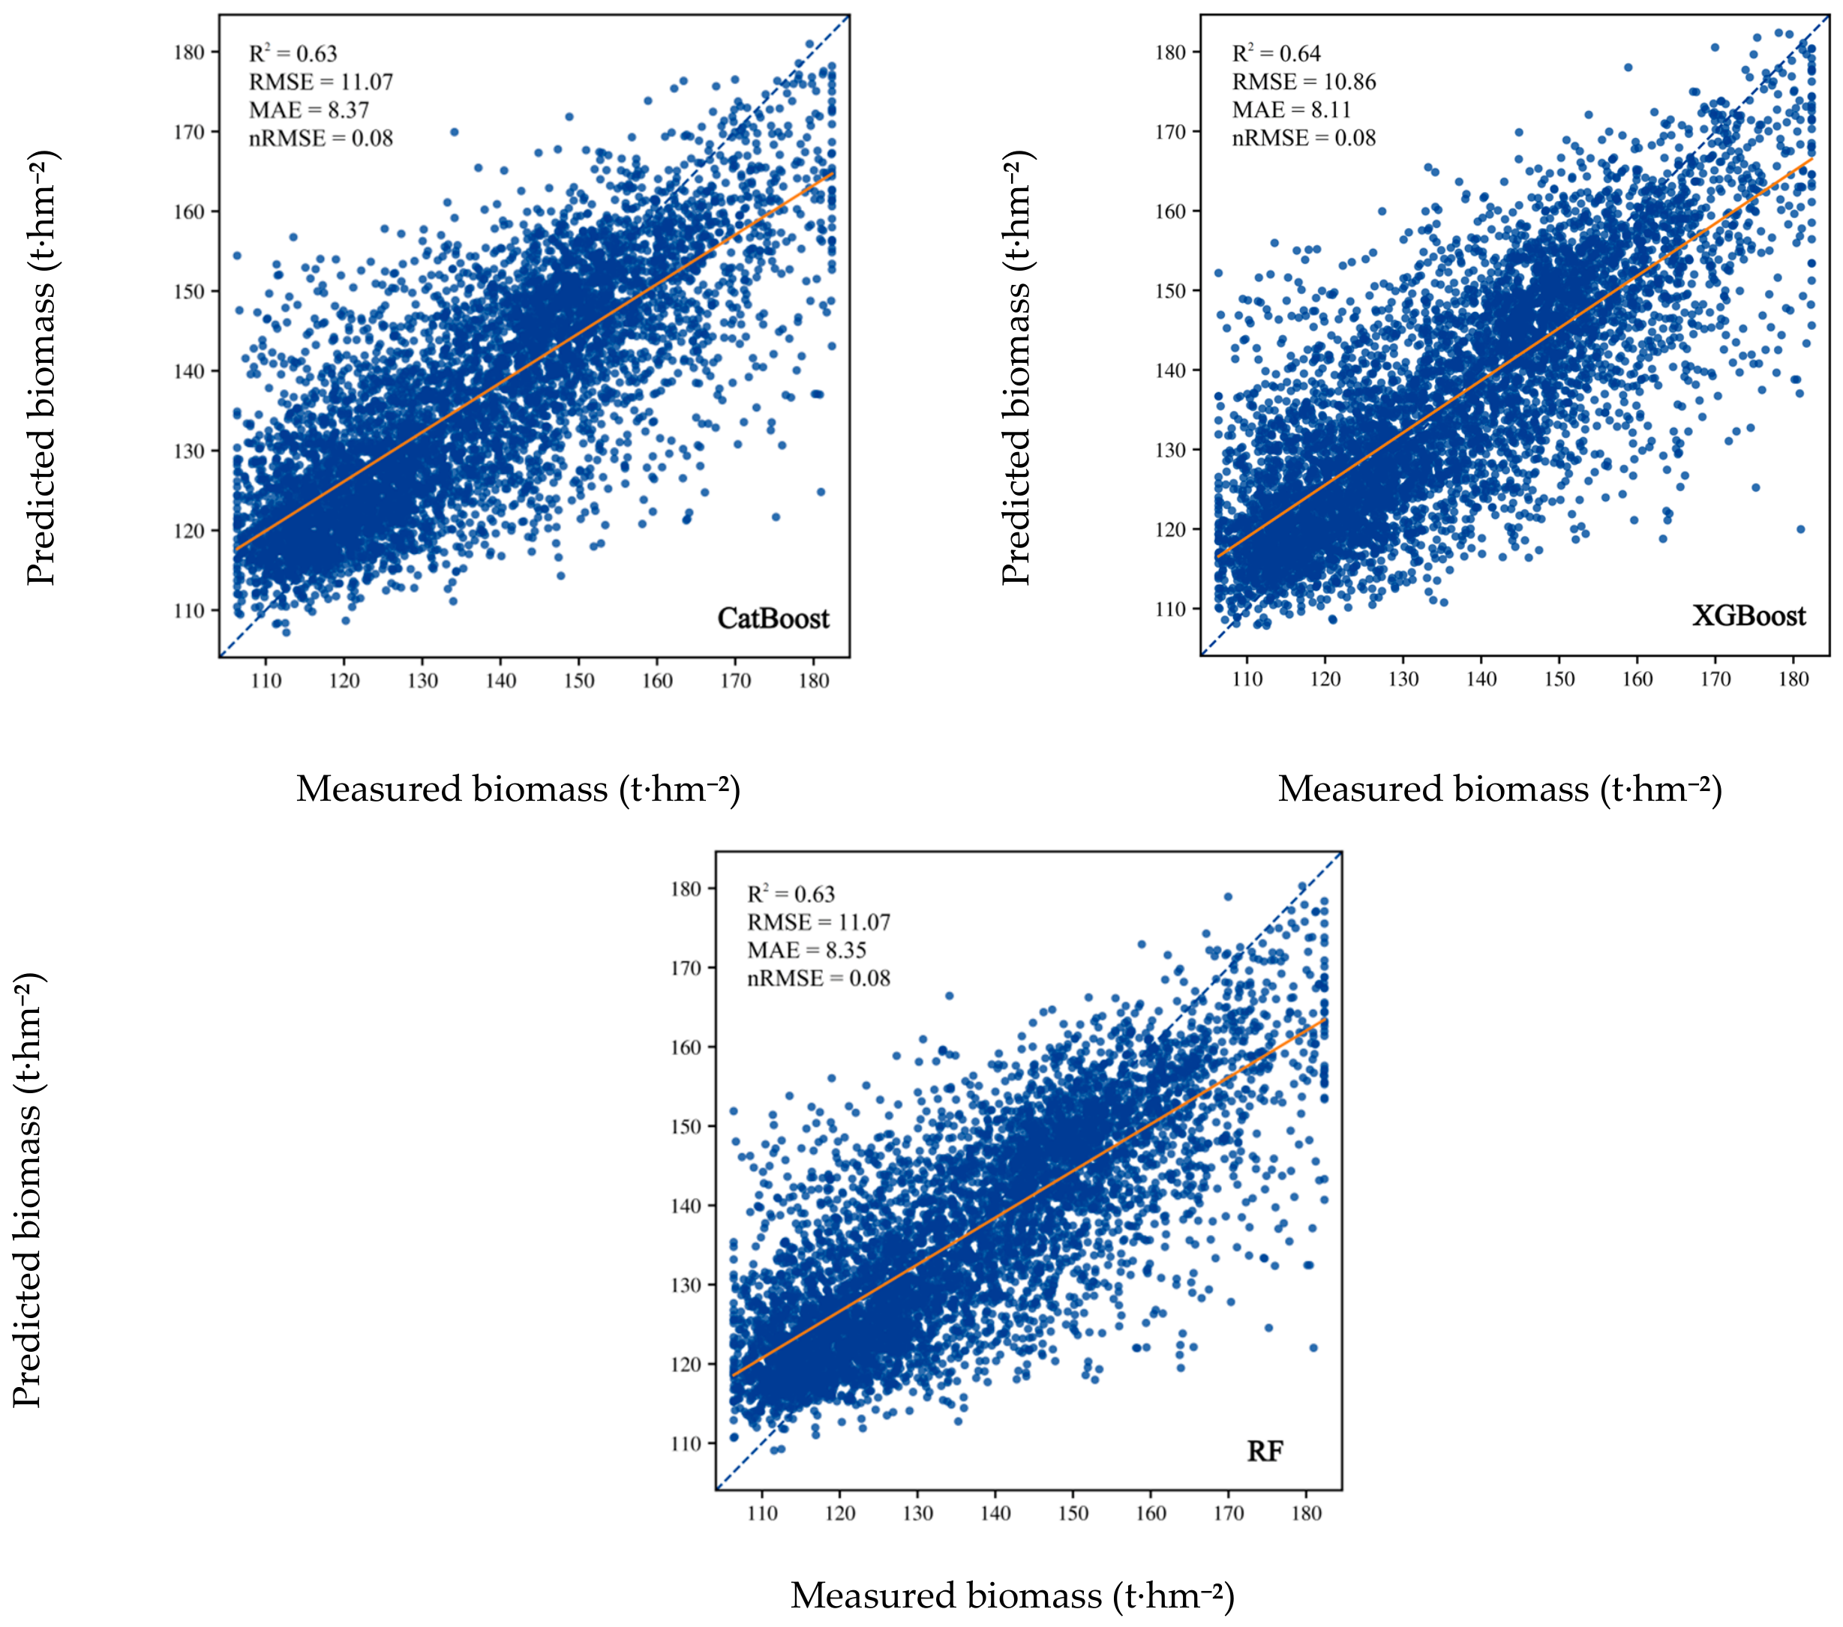
Overall, all three models were able to effectively characterize variations in mangrove biomass. For AGB estimation, the R2 values of all models were approximately 0.63. Among them, the XGBoost model achieved the best performance, with an R2 of 0.64, an RMSE of 10.86 t·ha−1, an nRMSE of 0.08, and an MAE of 8.11 t·ha−1. The CatBoost and RF models showed comparable performance, both with an R2 of 0.63.
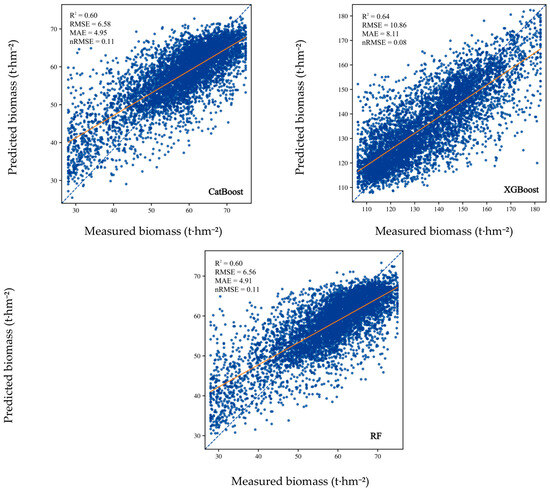
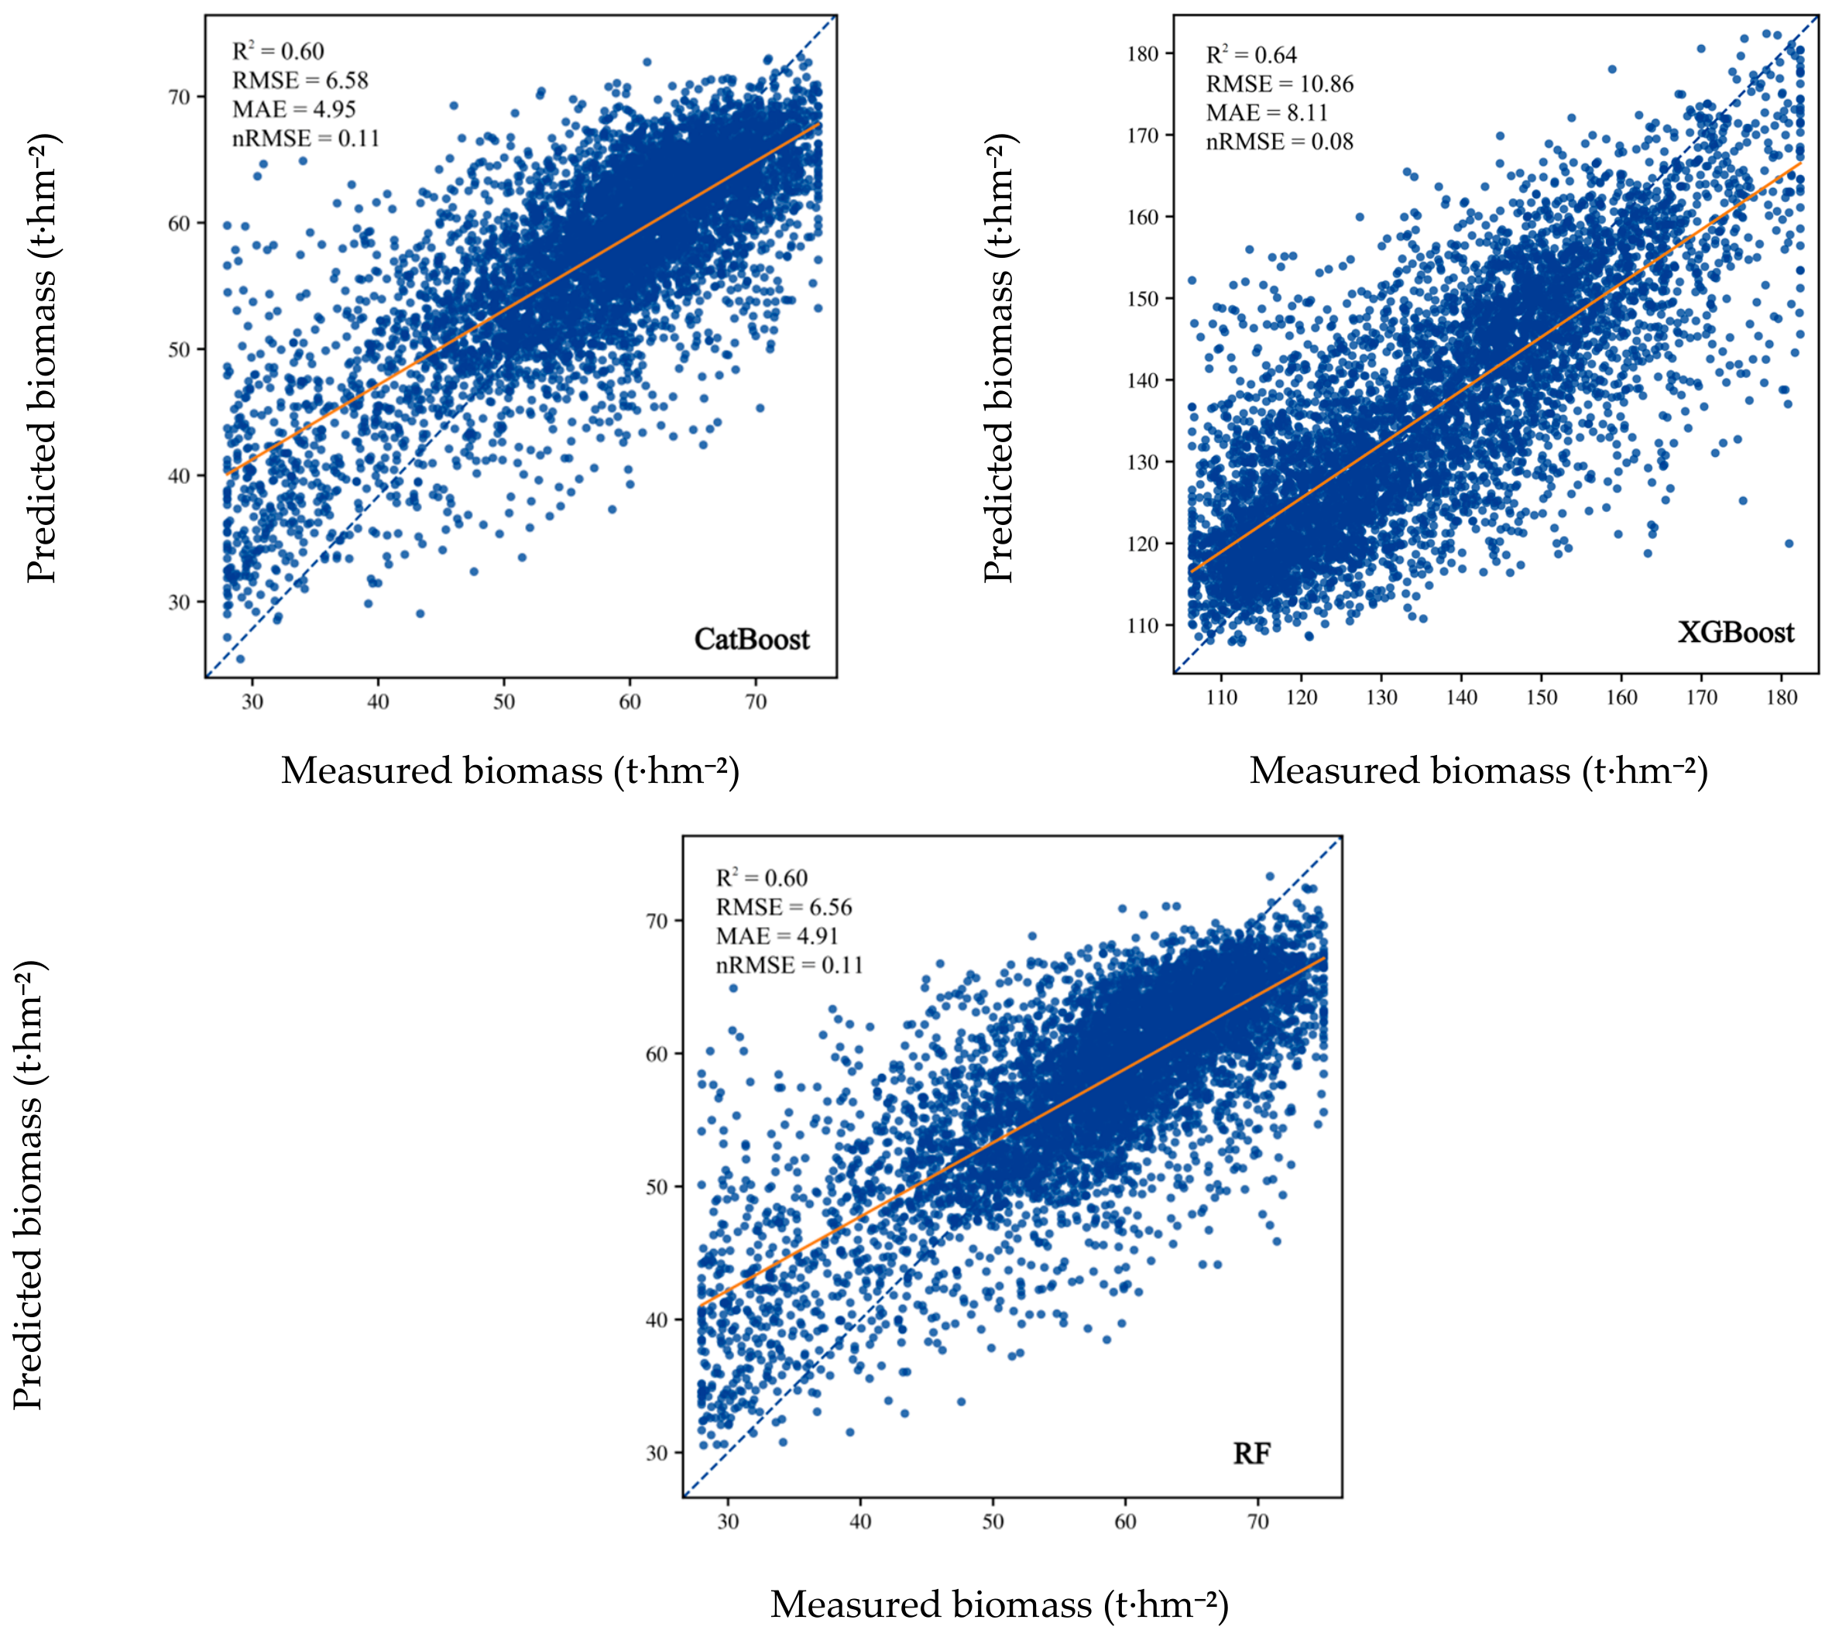
The overall accuracy of the BGB models was slightly lower than that of the AGB models; however, similar performance patterns were observed among the three algorithms. The XGBoost model achieved the highest accuracy, with an R2 of 0.63, an RMSE of 6.35 t·ha−1, an nRMSE of 0.08, and an MAE of 4.69 t·ha−1. The CatBoost and RF models both achieved an R2 value of 0.60.
From the distribution of the observed versus predicted scatter plots (Figure 13 and Figure 14), the data points of all models were generally distributed around the 1:1 reference line without obvious systematic deviations, indicating that the overall predictions were stable and reliable. Among the three models, the XGBoost model exhibited the most concentrated distribution of data points and achieved good agreement between observed and predicted values in both low- and high-biomass ranges. In contrast, the RF and CatBoost models showed slight underestimation in the high-biomass range.
Figure 13.
Observed-versus-predicted scatterplots for satellite-scale AGB estimation by different models.
Figure 14.
Observed-versus-predicted scatterplots for satellite-scale BGB estimation by different models.
Compared with the AGB models, the BGB models exhibited a slightly higher degree of scatter, suggesting that belowground biomass was indirectly estimated primarily based on canopy structural and spectral information and was therefore more susceptible to spatial heterogeneity. Overall, all three models were capable of effectively estimating mangrove biomass; however, XGBoost demonstrated superior fitting accuracy and better error control for both AGB and BGB estimation.
3.5.2. Determination and Rationality Analysis of the Optimal Model
Considering the evaluation metrics including R2, RMSE, nRMSE, and MAE, the XGBoost model achieved the best performance for both AGB and BGB estimation. The R2 values of the AGB and BGB models reached 0.64 and 0.63, respectively, while also exhibiting the lowest RMSE and MAE values, indicating strong predictive capability and generalization performance. Therefore, the XGBoost model was selected as the satellite-scale biomass extrapolation model for mapping the spatial distribution of mangrove AGB and BGB in Fujian Province.
3.6. Accuracy Comparison Between Direct Extrapolation and UAV-Bridged Extrapolation
To evaluate the practical benefits of using UAVs as an intermediate bridging scale, a comparative analysis was conducted between the traditional “direct field plot–satellite” extrapolation approach and the “field plot–UAV–satellite” bridging extrapolation approach. Both approaches were evaluated using the same feature system, model set, and five-fold cross-validation strategy.
The accuracy results of the direct extrapolation approach are presented in Table 12. For AGB estimation, the RF model achieved the best performance, with an R2 of 0.24, an RMSE of 29.02 t·ha−1, and an MAE of 24.49 t·ha−1. For BGB estimation, the XGBoost model performed best, with an R2 of 0.43, an RMSE of 14.89 t·ha−1, and an MAE of 11.36 t·ha−1.
Table 12.
Five-fold cross-validation accuracy comparison of direct extrapolation models.
Table 13 compares the proposed UAV-bridged extrapolation approach with the conventional direct extrapolation approach. In the direct extrapolation approach, Sentinel-2 biomass models were developed directly from field plot measurements without introducing UAV-derived biomass maps as intermediate training labels, whereas the UAV-bridged extrapolation approach incorporated UAV-derived biomass maps as an intermediate bridging layer for satellite model training.
Table 13.
Accuracy comparison between the direct field-to-satellite extrapolation scheme and the UAV-bridged extrapolation scheme.
Compared with the direct extrapolation approach, the UAV-bridged extrapolation approach demonstrated substantially higher explanatory power and lower prediction errors for AGB estimation, with an increase of 0.40 in R2, a reduction of 62.58% in RMSE, and a reduction of 66.88% in MAE. Similar improvements were observed for BGB estimation, where R2 increased by 0.20, RMSE decreased by 57.35%, and MAE decreased by 58.71%.
These results demonstrate that incorporating UAV-derived biomass maps as intermediate bridging labels effectively reduces the scale mismatch between field plot measurements and satellite pixels, thereby improving the accuracy of regional-scale mangrove biomass estimation.
3.7. Spatial Distribution Pattern of Mangrove Biomass in Fujian Province
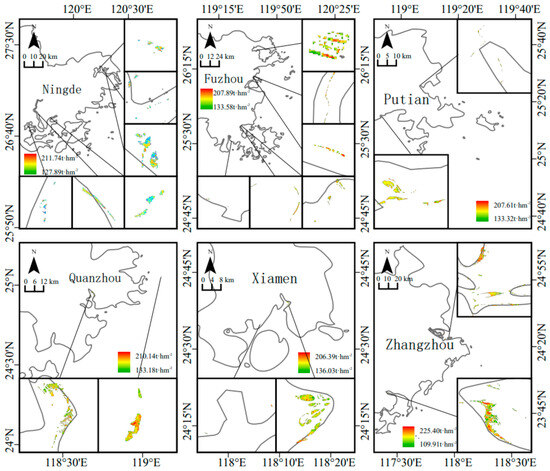
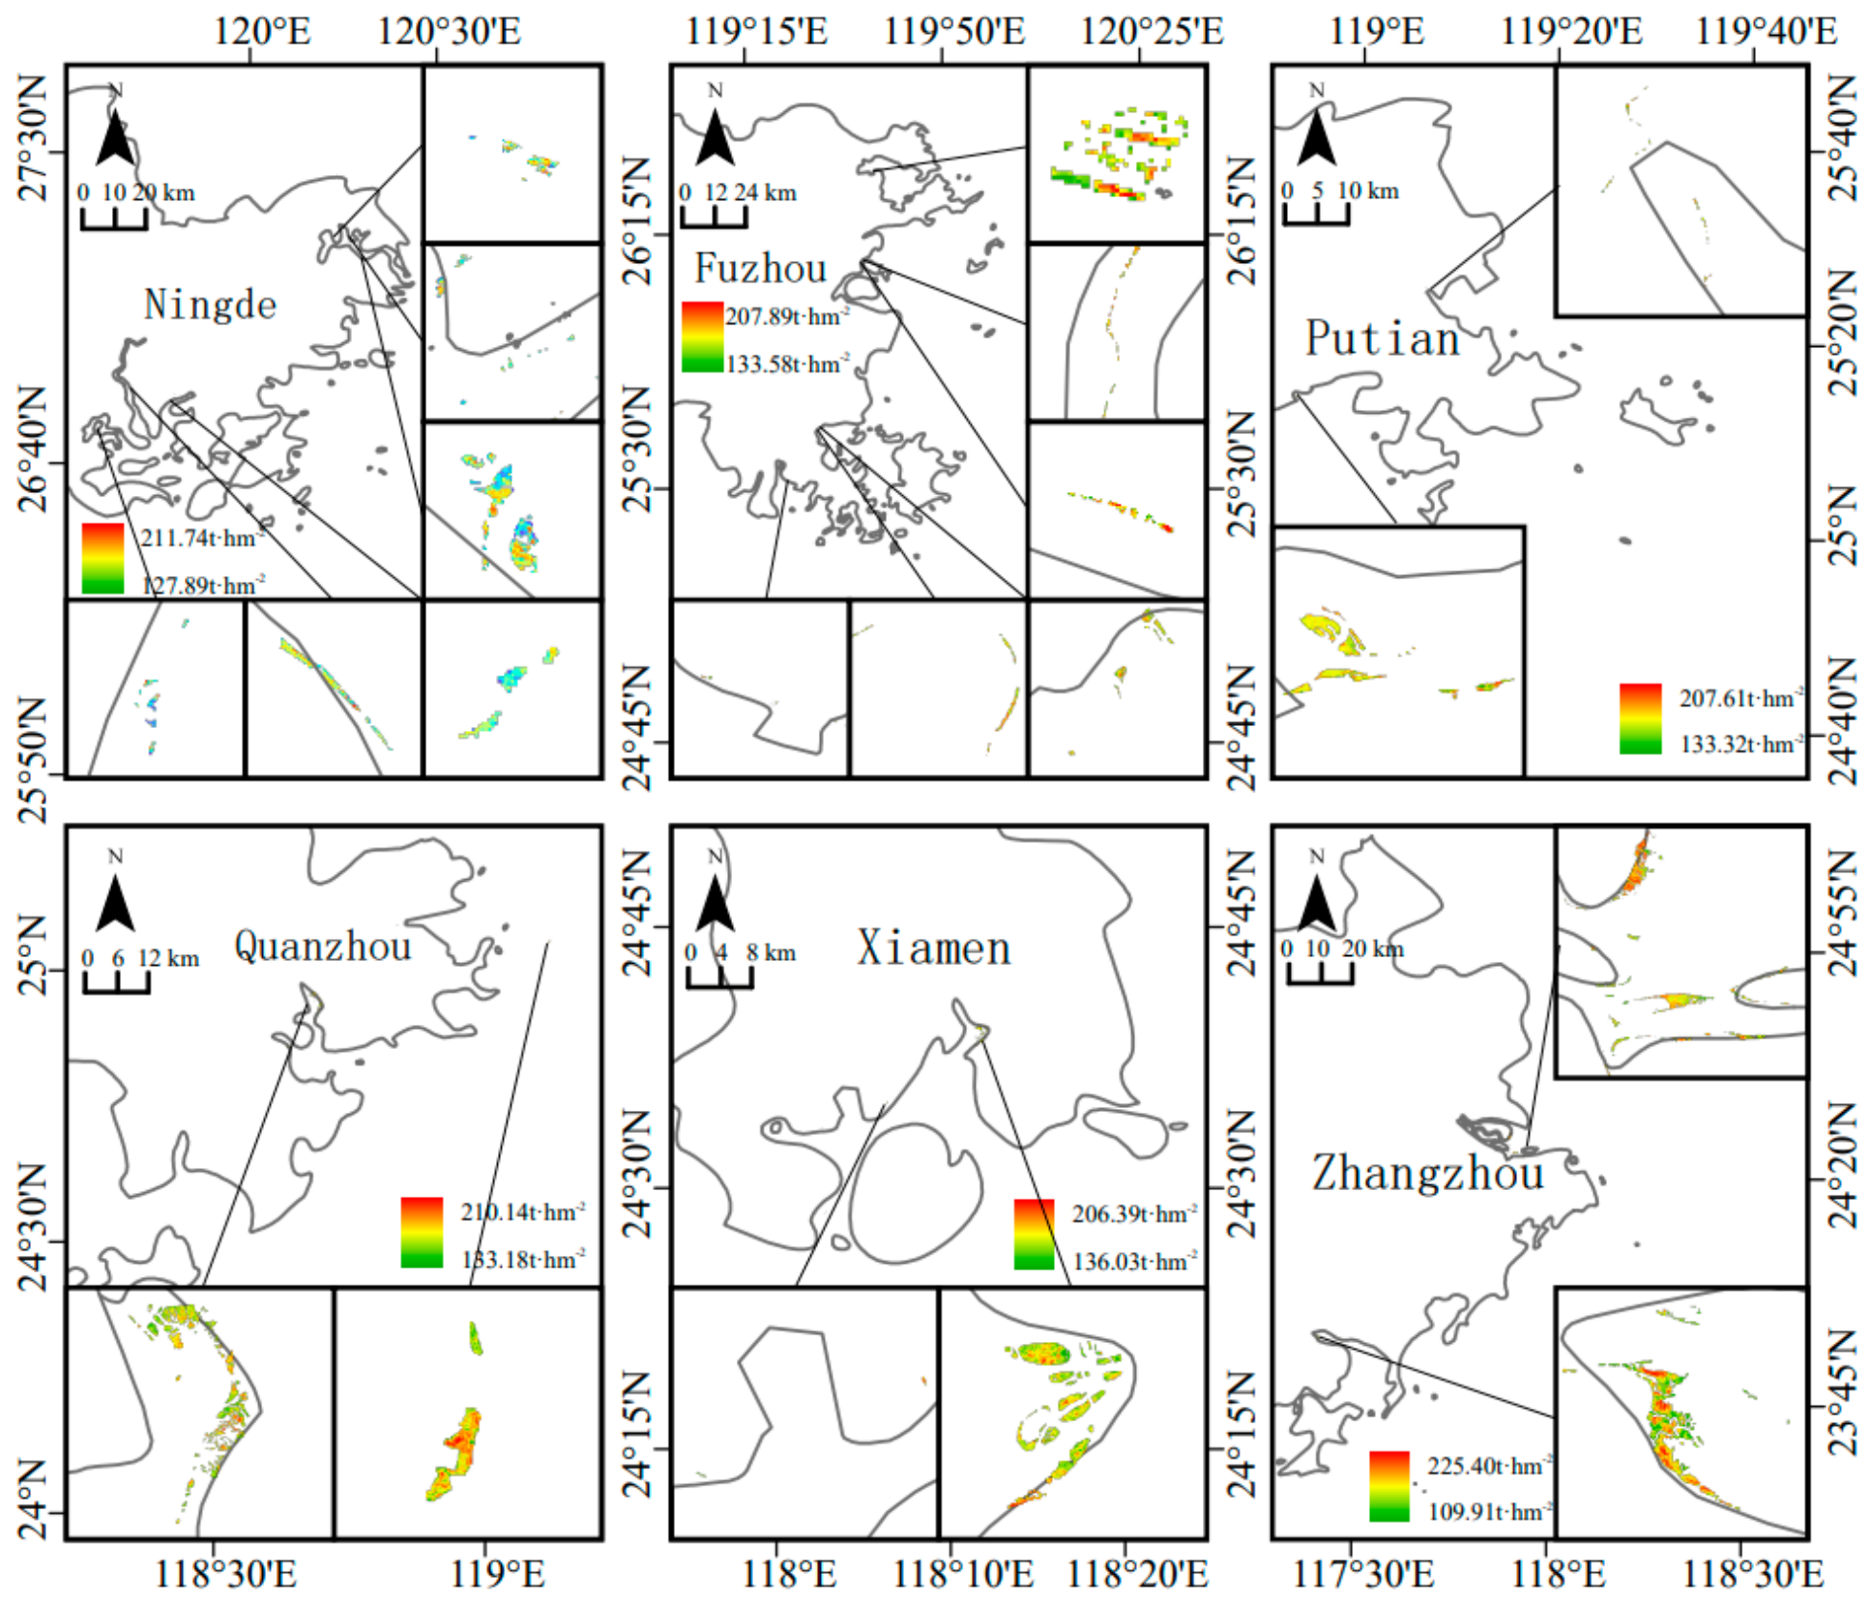
Figure 15 shows that the total mangrove biomass per unit area in Fujian Province exhibited a distinct patchy distribution pattern along the coastline, which was generally consistent with the actual distribution of mangrove forests. The total biomass density ranged from 109.91 to 225.40 t·ha−1, with medium-to-high biomass levels dominating the province. Zhangzhou and Quanzhou formed the primary high-biomass aggregation areas, where biomass density exceeded 210 t·ha−1 in some regions. In contrast, Ningde, Fuzhou, Putian, and Xiamen generally exhibited moderate biomass levels. Overall, the spatial distribution of biomass showed good consistency with the extent and continuity of mangrove distribution.
Figure 15.
Spatial distribution of total mangrove biomass in Fujian Province.
3.8. Total Biomass and Structural Characteristics of Mangroves in Fujian Province
According to the statistical results derived from the optimal model predictions (Table 14 and Table 15), the total AGB and BGB of mangroves in Fujian Province were estimated at 58,768.60 t and 24,575.14 t, respectively, resulting in a total biomass of 83,343.74 t. The average total biomass density was 189.70 t·ha−1.
Table 14.
Spatial statistics of mangrove AGB and BGB by city in Fujian Province.
Table 15.
Spatial statistics of total mangrove biomass by city in Fujian Province.
Zhangzhou and Quanzhou were the major contributors to mangrove biomass, accounting for 48.12% and 28.98% of the provincial total biomass, respectively. Together, these two cities contributed more than 77% of the total mangrove biomass in Fujian Province. The total biomass density among different cities was generally concentrated between 170 and 195 t·ha−1, indicating relatively small differences at the unit-area level.
Overall, the spatial pattern of mangrove biomass in Fujian Province can be characterized by substantial differences in total biomass among cities but relatively minor variations in biomass density per unit area.
4. Discussion
4.1. Role of the UAV Bridging Scale in Regional Biomass Extrapolation
Traditional regional mangrove biomass estimation generally relies on direct modeling between field plots and satellite remote sensing data. However, the large difference in spatial scale between these two data sources often leads to scale mismatch issues. In this study, UAVs were introduced as an intermediate bridging scale. By constructing continuous UAV-scale biomass maps and generating bridging labels corresponding to Sentinel-2 pixels, field-based biomass information was effectively transferred to satellite-scale training samples.
The results demonstrated that the satellite-scale models developed using UAV-derived bridging labels achieved satisfactory predictive performance, with R2 values exceeding 0.60 for both AGB and BGB estimation. These findings indicate that the UAV bridging scale can effectively alleviate scale mismatch problems and improve the accuracy of regional biomass estimation, thereby validating the feasibility of the proposed “field plot–UAV–satellite” multiscale estimation framework. This result is consistent with Wang et al. [16], who reported that integrating field plots, UAV-LiDAR data, and Sentinel-2 imagery improved mangrove AGB estimation compared with direct field-to-satellite modeling.
4.2. Contribution of Multisource Remote Sensing Features to Mangrove Biomass Estimation
The feature selection results showed that vegetation indices, spectral statistical features, LiDAR intensity features, texture features, and canopy structural features all contributed substantially to mangrove biomass estimation. Among them, vegetation indices and spectral statistical features exhibited relatively high importance, indicating that canopy spectral information is a key factor for characterizing variations in mangrove biomass.
The integration of multisource remote sensing data enabled the synergistic utilization of spectral and structural information, thereby effectively improving biomass estimation accuracy. These results suggest that multisource feature fusion is an important approach for enhancing the performance of mangrove biomass inversion.
4.3. Comparison with Previous Biomass Estimates
To further evaluate the reliability of the provincial biomass estimation, our results were compared with previously published studies. Wen et al. [41] estimated the total mangrove aboveground biomass in Fujian Province to be 73,551 t based on GEDI-derived canopy height and species-specific allometric equations. Compared with their estimate, the aboveground biomass obtained in this study was 58,768.60 t. The observed difference is likely attributable to differences in the study period (2019 versus 2025), mangrove distribution datasets, biomass estimation methods, and spatial resolution. In particular, the present study employed a UAV-bridged multiscale framework using UAV-derived biomass maps as intermediate labels for Sentinel-2 model training, whereas Wen et al. estimated biomass primarily from GEDI canopy height products. Therefore, although quantitative differences exist between the two estimates, the comparison provides additional evidence supporting the plausibility of our provincial biomass estimation.
4.4. Mechanism and Advantages of the UAV Bridging Framework
The improved biomass estimation accuracy observed in this study is mainly attributed to the introduction of a UAV-based bridging framework between field measurements and satellite observations. Conventional regional biomass estimation generally relies on direct relationships between limited field plots and satellite imagery, which are often affected by scale mismatch and insufficient spatial representativeness. In contrast, the proposed framework first generated spatially continuous UAV-derived biomass maps from field measurements and subsequently used these maps as bridging labels for Sentinel-2 model training. This intermediate scale effectively transferred fine-scale biomass information from field observations to satellite imagery, increased the spatial representativeness of training samples, and reduced the scale discrepancy between ground observations and satellite pixels, thereby improving regional biomass estimation accuracy.
Similar findings have also been reported in previous multiscale biomass estimation studies. Navarro et al. [23] demonstrated that UAV observations can provide spatially continuous forest inventory information over larger areas than conventional field surveys while maintaining comparable biomass estimation accuracy. These characteristics support the use of UAV observations as an intermediate scale for transferring local biomass information to regional remote sensing applications. Building upon this concept, the proposed framework further employs wall-to-wall UAV-derived biomass maps as bridging labels for Sentinel-2 model training, enabling the direct transfer of biomass information from local measurements to regional satellite mapping.
4.5. Limitations and Future Perspectives
Several limitations remain in this study. First, the field samples were primarily collected from the Zhangjiangkou study area, and their representativeness for different mangrove habitats across Fujian Province could be further improved. Although the developed biomass models were extrapolated to the provincial scale, their spatial transferability should be interpreted with caution because the training samples were derived from a single mangrove region. Nevertheless, the dominant mangrove species investigated in this study are widely distributed along the coast of Fujian Province, and the Sentinel-2 features used for model development mainly characterize canopy spectral and structural properties that are generally transferable under similar ecological conditions. Regional differences in stand age, canopy density, tidal environments, soil conditions, and species composition may still introduce uncertainties when the models are applied beyond the training area. Therefore, future studies should further evaluate the spatial transferability of the proposed framework using field observations collected from multiple mangrove regions across Fujian Province.
In addition, the superior performance of the proposed UAV-bridged framework can be primarily attributed to its ability to reduce the scale mismatch between field observations and satellite imagery. In conventional field-to-satellite extrapolation, biomass measurements from a limited number of field plots are directly linked to satellite pixels, although field plots represent only a small sampling area and cannot adequately capture the spatial heterogeneity within a satellite pixel. By introducing UAV-derived biomass maps as bridging-scale labels, biomass information becomes spatially continuous and spatially consistent with Sentinel-2 pixels after spatial aggregation. Consequently, each satellite pixel is associated with a more representative biomass value rather than an isolated field measurement, providing spatially continuous and scale-consistent supervision for satellite model training. This improved consistency between the predictor variables and biomass labels provides a plausible explanation for the superior performance of the proposed UAV-bridged framework observed in this study.
Second, despite these advantages, another source of uncertainty arises from the use of UAV-derived biomass maps as training labels for the Sentinel-2 models. Unlike field measurements, these biomass maps were generated using machine learning models and therefore inevitably contain prediction errors. Given that the proposed framework involves multiple modeling stages, including field measurements, UAV biomass estimation, Sentinel-2 model training, and provincial-scale extrapolation, uncertainties introduced at each stage may propagate and accumulate throughout the modeling process. Nevertheless, the UAV biomass estimation models achieved satisfactory predictive performance (AGB: R2 = 0.69; BGB: R2 = 0.78), and the resulting biomass maps provide spatially continuous biomass information that cannot be obtained directly from sparse field plots. Consequently, although some uncertainty propagation is unavoidable, the UAV-derived biomass maps provide dense and spatially continuous training labels that enable effective supervised learning at the satellite scale. Future studies should further quantify uncertainty propagation across different modeling stages through uncertainty mapping, sensitivity analysis, or formal error propagation analysis, thereby improving the robustness and reliability of multiscale biomass estimation.
Third, the models were developed using single-date remote sensing data and therefore did not fully account for the effects of seasonal variation and tidal conditions on biomass estimation. In addition, satellite-scale extrapolation remains affected by mixed-pixel effects. Furthermore, because Sentinel-2 is an optical remote sensing sensor, spectral saturation may occur in dense mangrove canopies with high biomass, potentially reducing the sensitivity of spectral features to further biomass increases. This limitation may affect biomass estimation accuracy in areas with dense vegetation. Future studies could integrate complementary data sources, such as spaceborne LiDAR or Synthetic Aperture Radar (SAR), to improve biomass estimation in high-biomass mangrove forests.
Future studies should expand the spatial coverage of field surveys and incorporate multi-temporal remote sensing data as well as spaceborne LiDAR observations to further improve regional-scale biomass estimation models. Such efforts will enhance the accuracy and applicability of mangrove biomass monitoring and blue-carbon assessment.
5. Conclusions
This study selected the Zhangjiangkou National Mangrove Nature Reserve in Fujian Province as the study area and established a multiscale mangrove biomass estimation framework integrating field plots, UAV observations, and satellite remote sensing. Regional biomass extrapolation and spatial mapping of mangroves across Fujian Province were successfully achieved. The main conclusions are as follows:
- (1)
- Biomass estimation models developed using UAV multispectral imagery and LiDAR data exhibited strong predictive capability. After RF-RFE-OOB feature selection, the optimal models achieved R2 values of 0.69 and 0.78 for AGB and BGB estimation, respectively, indicating that multisource remote sensing information can effectively characterize variations in mangrove biomass.
- (2)
- The UAV bridging scale significantly improved the accuracy of satellite-scale biomass estimation. Compared with the direct extrapolation approach, the UAV-bridged approach increased the R2 of the AGB model from 0.24 to 0.64 and that of the BGB model from 0.43 to 0.63, effectively alleviating the scale mismatch between field plots and satellite pixels.
- (3)
- The total AGB and BGB of mangroves in Fujian Province were estimated at 58,768.60 t and 24,575.14 t, respectively, resulting in a total biomass of 83,343.74 t. Mangrove biomass generally exhibited a coastal distribution pattern, with high-biomass areas mainly concentrated in the coastal regions of Zhangzhou and Quanzhou.
The results demonstrate that the UAV bridging scale can effectively connect field surveys and satellite remote sensing observations, providing a new technical pathway for regional-scale mangrove biomass estimation and blue-carbon resource monitoring.
Supplementary Materials
The following supporting information can be downloaded at: https://www.mdpi.com/article/10.3390/rs18162831/s1, Table S1: Complete list of the 42 retained remote sensing features used in this study.
Author Contributions
Conceptualization, S.C. and R.L.; Methodology, S.C.; Software, S.C.; Validation, S.C., X.H., Y.Z., X.Z. and Z.C.; Formal analysis, S.C., X.H., Y.Z., X.Z. and Z.C.; Investigation, S.C., X.H., Y.Z., X.Z. and Z.C.; Resources, R.L.; Data curation, S.C., X.H., Y.Z., X.Z. and Z.C.; Writing—original draft, S.C.; Writing—review & editing, R.L.; Visualization, S.C.; Supervision, R.L.; Project administration, R.L.; Funding acquisition, R.L. All authors have read and agreed to the published version of the manuscript.
Funding
This research was supported by the National Natural Science Foundation of China (Grant No. 32572055) and the Natural Science Foundation of Fujian Province, China (Grant No. KJB24113XA).
Data Availability Statement
The datasets generated and/or analyzed during the current study are available from the corresponding author upon reasonable request.
Conflicts of Interest
The authors declare no conflict of interest.
References
- Lin, P. Research on Mangrove Ecosystems in China; Xiamen University: Xiamen, China, 2002. (In Chinese) [Google Scholar]
- Zhu, J.J.; Yan, B. Blue carbon sink function and carbon neutrality potential of mangroves. Sci. Total Environ. 2022, 822, 153438. [Google Scholar] [CrossRef] [Scilit] [PubMed]
- Cao, Q.X. Remote Sensing Estimation of Mangrove Biomass and Carbon Storage in the Beibu Gulf Coastal Region; Chinese Academy of Forestry: Beijing, China, 2010. (In Chinese) [Google Scholar]
- Strain, E.M.A.; Kompas, T.; Boxshall, A.; Kelvin, J.; Swearer, S.; Morris, R. Assessing the coastal protection services of natural mangrove forests and artificial rock revetments. Ecosyst. Serv. 2022, 55, 101429. [Google Scholar] [CrossRef] [Scilit]
- Duke, N.C.; Meynecke, J.O.; Dittmann, S.; Ellison, A.M.; Anger, K.; Berger, U.; Cannicci, S.; Diele, K.; Ewel, K.C.; Field, C.D.; et al. A world without mangroves? Science 2007, 317, 41–42. [Google Scholar] [CrossRef] [Scilit] [PubMed]
- Weng, Q.; Lu, C.Y. Progress in the application of satellite remote sensing technology in mangrove ecological monitoring and research. J. Sanming Univ. 2006, 23, 141–147. (In Chinese) [Google Scholar]
- Giri, C. Observation and monitoring of mangrove forests using remote sensing: Opportunities and challenges. Remote Sens. 2016, 8, 783. [Google Scholar] [CrossRef] [Scilit]
- Jia, M.M.; Wang, Z.M.; Mao, D.H.; Huang, C.L.; Lu, C.Y. Spatial-temporal changes of China’s mangrove forests over the past 50 years: An analysis towards the Sustainable Development Goals (SDGs). Chin. Sci. Bull. 2021, 66, 3886–3901. (In Chinese) [Google Scholar] [CrossRef] [Scilit]
- Blasco, F.; Janodet, E.; Bellan, M.F. Natural hazards and mangroves in the Bay of Bengal. J. Coast. Res. 1994, 277–288. [Google Scholar]
- Pham, T.D.; Yokoya, N.; Xia, J.; Ha, N.T.; Le, N.N.; Nguyen, T.T.T.; Dao, T.H.; Vu, T.T.P.; Pham, T.D.; Takeuchi, W. Comparison of machine learning methods for estimating mangrove above-ground biomass using multiple source remote sensing data in the Red River Delta Biosphere Reserve, Vietnam. Remote Sens. 2020, 12, 1334. [Google Scholar] [CrossRef] [Scilit]
- Castillo, J.A.A.; Apan, A.A.; Maraseni, T.N.; Salmo, S.G. Estimation and mapping of above-ground biomass of mangrove forests and their replacement land uses in the Philippines using Sentinel imagery. ISPRS J. Photogramm. Remote Sens. 2017, 134, 70–85. [Google Scholar] [CrossRef] [Scilit]
- Kuenzer, C.; Bluemel, A.; Gebhardt, S.; Quoc, T.V.; Dech, S. Remote sensing of mangrove ecosystems: A review. Remote Sens. 2011, 3, 878–928. [Google Scholar] [CrossRef] [Scilit]
- Salum, R.B.; Souza-Filho, P.W.M.; Simard, M.; Silva, C.A.; Fernandes, M.E.B.; Cougo, M.F.; Do Nascimento, W.; Rogers, K. Improving mangrove above-ground biomass estimates using LiDAR. Estuar. Coast. Shelf Sci. 2020, 236, 106585. [Google Scholar] [CrossRef] [Scilit]
- Pham, T.D.; Yokoya, N.; Bui, D.T.; Yoshino, K.; Friess, D.A. Remote sensing approaches for monitoring mangrove species, structure, and biomass: Opportunities and challenges. Remote Sens. 2019, 11, 230. [Google Scholar] [CrossRef] [Scilit]
- Komiyama, A.; Ong, J.E.; Poungparn, S. Allometry, biomass, and productivity of mangrove forests: A review. Aquat. Bot. 2008, 89, 128–137. [Google Scholar] [CrossRef] [Scilit]
- Wang, D.; Wan, B.; Liu, J.; Su, Y.; Guo, Q.; Qiu, P.; Wu, X. Estimating aboveground biomass of the mangrove forests on northeast Hainan Island in China using an upscaling method from field plots, UAV-LiDAR data and Sentinel-2 imagery. Int. J. Appl. Earth Obs. Geoinf. 2020, 85, 101986. [Google Scholar] [CrossRef] [Scilit]
- Shi, Y.L.; Wang, Z.H.; Li, S.M.; Li, C.Y.; Xiao, P.Q.; Zhang, P.; Chang, X.G. Aboveground biomass inversion of sparse trees and shrubs based on optical remote sensing. Sci. Silvae Sin. 2022, 58, 13–22. (In Chinese) [Google Scholar]
- Wang, L.; Shi, C.; Tian, J.Y.; Song, X.N.; Jia, M.M.; Li, X.J.; Liu, X.M.; Zhong, R.F.; Yin, D.M.; Yang, S.S.; et al. Mangrove monitoring based on multisource remote sensing. Biodivers. Sci. 2018, 26, 838–849. (In Chinese) [Google Scholar] [CrossRef] [Scilit]
- Jayathunga, S.; Owari, T.; Tsuyuki, S. The use of fixed-wing UAV photogrammetry with LiDAR DTM to estimate merchantable volume and carbon stock in living biomass over a mixed conifer–broadleaf forest. Int. J. Appl. Earth Obs. Geoinf. 2018, 73, 767–777. [Google Scholar] [CrossRef] [Scilit]
- Lassalle, G.; Ferreira, M.P.; La Rosa, L.E.C.; Scafutto, R.; de Souza Filho, C.R. Advances in multi- and hyperspectral remote sensing of mangrove species: A synthesis and study case on airborne and multisource spaceborne imagery. ISPRS J. Photogramm. Remote Sens. 2023, 195, 298–312. [Google Scholar] [CrossRef] [Scilit]
- Xu, W.; Ouyang, X.; Xiao, X.; Hong, Y.; Zhang, Y.; Xu, Z.; Kwon, B.-O.; Yang, Z. A Review of Applying Drones and Remote Sensing Technology in Mangrove Ecology. Forests 2025, 16, 870. [Google Scholar] [CrossRef] [Scilit]
- Niu, X.; Chen, B.; Sun, W.; Feng, T.; Yang, X.; Liu, Y.; Liu, W.; Fu, B. Estimation of Coastal Wetland Vegetation Aboveground Biomass by Integrating UAV and Satellite Remote Sensing Data. Remote Sens. 2024, 16, 2760. [Google Scholar] [CrossRef] [Scilit]
- Navarro, A.; Young, M.; Allan, B.; Carnell, P.; Macreadie, P.; Ierodiaconou, D. The application of Unmanned Aerial Vehicles (UAVs) to estimate above-ground biomass of mangrove ecosystems. Remote Sens. Environ. 2020, 242, 111747. [Google Scholar] [CrossRef] [Scilit]
- Jiang, R.J.; Cheng, P.; Gao, J.H.; Wang, A.J. Effects of mangroves on the hydrodynamic processes of the tidal bottom boundary layer. Mar. Geol. Front. 2020, 36, 37–44. (In Chinese) [Google Scholar]
- Cao, J.; Liu, K.; Zhuo, L.; Liu, L.; Zhu, Y.; Peng, L. High-Resolution Mapping of Mangrove Species Height in Fujian Zhangjiangkou National Mangrove Nature Reserve Combined GF-2, GF-3, and UAV-LiDAR. Remote Sens. 2023, 15, 5645. [Google Scholar] [CrossRef] [Scilit]
- Gorelick, N.; Hancher, M.; Dixon, M.; Ilyushchenko, S.; Thau, D.; Moore, R. Google Earth Engine: Planetary-scale geospatial analysis for everyone. Remote Sens. Environ. 2017, 202, 18–27. [Google Scholar] [CrossRef] [Scilit]
- Jia, M.M. Spatial Distribution Dataset of Mangrove Species in China; International Research Center of Big Data for Sustainable Development Goals: Beijing, China, 2024. [Google Scholar]
- Tam, N.F.Y.; Wong, Y.S.; Lan, C.Y.; Chen, G.Z. Community structure and standing crop biomass of a mangrove forest in Futian Nature Reserve, Shenzhen, China. Hydrobiologia 1995, 295, 193–201. [Google Scholar] [CrossRef] [Scilit]
- Jin, C.; Wang, J.W.; Zheng, J.; Chen, Q.X.; Li, J.Q.; Lu, X. An assessment method of Kandelia obovata population biomass. Acta Ecol. Sin. 2012, 32, 3414–3422. (In Chinese) [Google Scholar] [CrossRef] [Scilit]
- He, Q.F.; Zheng, W.; Huang, X.R.; Liu, X.; Shen, W.H.; He, F. Carbon storage and allocation characteristics of mangroves in Qinzhou Bay, Guangxi. J. Cent. South Univ. For. Technol. 2017, 37, 121–126. (In Chinese) [Google Scholar]
- Wang, G.; Zhang, Q.P.; Guan, D.S. Distribution characteristics of biomass of plants in mangrove forest along latitude. Wetl. Sci. 2016, 14, 259–270. (In Chinese) [Google Scholar] [CrossRef]
- Otero, V.; Van De Kerchove, R.; Satyanarayana, B.; Martínez-Espinosa, C.; Fisol, M.A.B.; Ibrahim, M.R.B.; Sulong, I.; Mohd-Lokman, H.; Lucas, R.; Dahdouh-Guebas, F. Managing mangrove forests from the sky: Forest inventory using field data and unmanned aerial vehicle (UAV) imagery in the Matang Mangrove Forest Reserve, peninsular Malaysia. For. Ecol. Manag. 2018, 411, 35–45. [Google Scholar] [CrossRef] [Scilit]
- Wang, T.; Zhang, C.; Zhou, H. Estimation of aboveground biomass of major coniferous forests in Qujing City based on Landsat imagery. J. Zhejiang A&F Univ. 2025, 42, 1132–1141. (In Chinese) [Google Scholar]
- Dormann, C.F.; Elith, J.; Bacher, S.; Buchmann, C.; Carl, G.; Carré, G.; Marquéz, J.R.G.; Gruber, B.; Lafourcade, B.; Leitão, P.J.; et al. Collinearity: A review of methods to deal with it and a simulation study evaluating their performance. Ecography 2013, 36, 27–46. [Google Scholar] [CrossRef] [Scilit]
- Breiman, L. Random Forests. Mach. Learn. 2001, 45, 5–32. [Google Scholar] [CrossRef] [Scilit]
- Guyon, I.; Weston, J.; Barnhill, S.; Vapnik, V. Gene selection for cancer classification using support vector machines. Mach. Learn. 2002, 46, 389–422. [Google Scholar] [CrossRef] [Scilit]
- Chen, T.; Guestrin, C. XGBoost: A scalable tree boosting system. In Proceedings of the 22nd ACM SIGKDD International Conference on Knowledge Discovery and Data Mining; Association for Computing Machinery: New York, NY, USA, 2016; pp. 785–794. [Google Scholar]
- Prokhorenkova, L.; Gusev, G.; Vorobev, A.; Dorogush, A.V.; Gulin, A. CatBoost: Unbiased boosting with categorical features. In Advances in Neural Information Processing Systems 31 (NeurIPS 2018); HSE University: Moscow, Russia, 2018. [Google Scholar]
- Zhang, D.S.; Cong, L.X.; Quan, B.; Wang, Z.Q.; Wang, F. Remote sensing information extraction of Zhangjiangkou mangrove wetlands based on spectral characteristics. In Proceedings of the 2011 AASRI Conference on Artificial Intelligence and Industry Application (AASRI-AIIA 2011 V2); American Applied Sciences Research Institute: Wuhan, China, 2011; pp. 232–235. (In Chinese) [Google Scholar]
- Guo, X.; Wang, M.; Jia, M.; Wang, W. Estimating mangrove leaf area index based on red-edge vegetation indices: A comparison among UAV, WorldView-2 and Sentinel-2 imagery. Int. J. Appl. Earth Obs. Geoinf. 2021, 103, 102493. [Google Scholar] [CrossRef] [Scilit]
- Wen, X.; Liu, K.; Cao, J.; Zhu, Y.; Wang, Z. Estimation of Mangrove Aboveground Biomass in China Using Forest Canopy Height through an Allometric Equation. Trop. Geogr. 2023, 43, 1–11. [Google Scholar]

Disclaimer/Publisher’s Note: The statements, opinions and data contained in all publications are solely those of the individual author(s) and contributor(s) and not of MDPI and/or the editor(s). MDPI and/or the editor(s) disclaim responsibility for any injury to people or property resulting from any ideas, methods, instructions or products referred to in the content. |
© 2026 by the authors. Licensee MDPI, Basel, Switzerland. This article is an open access article distributed under the terms and conditions of the Creative Commons Attribution (CC BY) license.