


Highlights
What are the main findings?
- An acoustic–magnetic multi-source integration framework (MBES, SSS, SBP, and marine magnetics) was applied to the Nan’ao I Ming Dynasty shipwreck in 24 m water depth, enabling systematic spatial registration and feature superposition.
- The wreck was characterized as a semi-buried (~0.6 m), N–S-oriented elongated structure (~34 m × 12 m), with a −210 nT negative magnetic anomaly distinguishing it from natural reefs.
What are the implications of the main findings?
- Multi-source geophysical data integration and joint interpretation mitigate environmental interference and improve detection reliability for shallow-buried, small targets in complex nearshore settings.
- The methodology provides a transferable technical solution for the proactive discovery, efficient investigation, and protection of underwater cultural heritage (UCH) in similar nearshore environments.
Abstract
The search and discovery of underwater shipwreck sites represent the most arduous and critical phases of underwater archaeology. Wooden shipwrecks, in particular, are characterized by low acoustic impedance contrast and weak magnetic anomalies, coupled with their limited physical dimensions. Consequently, they predominantly exist as shallow-buried, discontinuous small targets scattered within confined areas, making their detection exceptionally challenging. Furthermore, the complexity of the submarine environment—including rugged topography, turbid water columns, and strong currents—poses formidable obstacles to the effective detection of these archaeological remains. Single geophysical methods are often limited by insufficient imaging resolution, interpretation ambiguity, and geological noise, making precise localization and characterization difficult. Focusing on the Nan’ao I Ming Dynasty shipwreck located in waters approximately 24 m deep off the coast of Nan’ao, Guangdong Province, China, this study proposes and validates an “acoustic-magnetic” multi-source data integration detection method. This approach systematically integrates high-resolution multibeam echo sounding (MBES), side-scan sonar (SSS), sub-bottom profiling (SBP), and marine magnetic data to establish a comprehensive framework for identification and integration analysis. The results indicate that the MBES bathymetric data reveal a regular, elongated structure oriented north–south (approximately 34 m × 12 m), closely matching the main hull and deck configuration. The SSS imagery exhibited high backscatter intensity and parallel linear textures, effectively delineating the hard shipwreck structure and the associated rigid protective frame employed for in situ preservation. SBP data confirmed the semi-buried state of the shipwreck (burial depth of approximately 0.6 m). Spatial variations in sediment thickness around the site suggested ongoing modification by strong hydrodynamic processes. Marine magnetic surveys identified localized negative anomalies (−210 nT relative to the ambient magnetic field), contrasting sharply with the positive anomalies of the surrounding natural reefs, thereby indicating an artificial ferromagnetic source. The spatial registration and feature superposition of multi-source data facilitated the characterization of the shipwreck, demonstrating its potential to mitigate environmental interference and enhance detection reliability in this complex environment. Using the Nan’ao I shipwreck site as a case study, this study provides a detailed characterization of the site’s 3D morphology, burial state, and physical properties. The proposed methodology offers a practical and robust technical solution for underwater shipwreck archaeology in complex nearshore environments, providing significant implications for proactive discovery, efficient investigation, and protection of underwater cultural heritage (UCH).
1. Introduction
Nearshore underwater shipwreck archaeology is a core component of underwater cultural heritage (UCH) preservation, offering irreplaceable insights into ancient maritime trade networks, the evolution of navigation technologies, and intercultural exchanges [1]. Governed by its unique tectonic setting, the Chinese continental shelf is characterized by a broad and gentle gradient, an intricate coastline, and numerous estuaries, resulting in a highly complex near-shore sedimentary environment. Subjected to prolonged marine environmental processes, ancient shipwrecks typically exhibit severe structural deterioration or even complete fragmentation. Subsequently, hydrodynamic forces often induce displacement, scour-induced winnowing, and eventual burial of this wreck debris. Wooden shipwrecks, in particular, pose significant detection challenges. Owing to their low acoustic impedance contrast and weak magnetic anomalies relative to the surrounding sediments, coupled with their limited physical dimensions, these sites are predominantly found in a dispersed and shallow-buried state within confined areas. Consequently, wooden wrecks are classified as typical shallow-buried, discontinuous small targets in underwater exploration. The detection of such targets remains extremely challenging, necessitating high-resolution geophysical investigations. However, hostile environments characterized by turbid water columns, buried wrecks, complex topography (e.g., reefs and steep slopes), and strong currents impose significant constraints on traditional archaeological paradigms that rely on diver-based visual inspection. These methods face inherent bottlenecks, including low efficiency, elevated safety risks, and limited spatial coverage [2,3].
Although geophysical technologies, such as multibeam echo sounding (MBES) [4,5,6], side-scan sonar (SSS) [7,8,9], sub-bottom profiling (SBP) [9,10,11,12], and marine magnetometry [13,14,15], have become primary tools for underwater archaeological prospection—capable of acquiring bathymetric data, acoustic imagery, shallow stratigraphy, and magnetic anomalies—their application in complex settings remains challenging. Advanced techniques, such as synthetic aperture sonar (SAS) and 3D SBP, can yield decimeter-resolution imagery and volumetric data, enabling high-fidelity reconstruction of buried hulls and quantification of reflection coefficients, thereby providing new avenues for assessing timber degradation [2,12,16,17,18]. Nevertheless, reliance on single-technique approaches is often inadequate for reliably detecting and identifying complex seafloor environments. MBES suffers from footprint enlargement and reduced resolution in deeper waters, potentially missing scattered debris or cargo [5,19]. Although SSS provides high-resolution seabed imagery, it lacks depth information and is susceptible to acoustic shadows and false high-backscatter anomalies in reef-dense areas, where irregular reefs often exhibit acoustic signatures that are highly similar to those of shipwrecks [7,19,20]. SBP experiences rapid signal attenuation in sandy or rocky substrates, and conventional spacing between survey lines may result in missed targets; furthermore, resolving the uppermost 30 cm of the seabed remains problematic [10,21]. Although magnetometers are capable of detecting buried metals, they are often obscured by geological background noise, hindering the independent determination of the precise location and physical state of a shipwreck [13,15,22].
The integration of multi-source geophysical data and 3D/4D visualization has emerged as a key frontier technology for comprehensive site interpretation, formation process studies, and long-term monitoring [3,15,23]. Integrating SSS, MBES, SBP, and magnetic data within a unified 3D geographic platform enhances the probability of discovery, confidence in identification, and interpretative completeness, thereby revealing the spatial morphology, depositional state, and environmental interactions of archaeological sites [1,9,22]. This integration approach not only supports enhanced visualization and interactive analysis of archaeological features [15,24] but also provides novel perspectives for cargo spatial analysis and vessel reconstruction studies [18]. Despite these advancements, core technical challenges persist in this interdisciplinary field, including the precise spatiotemporal registration of multi-source heterogeneous data, heavy reliance on expert experience for site interpretation, lack of quantitative interpretation models, and reliable extraction of archaeological and sedimentary environmental information [25].
To address these challenges, this study focuses on the Nan’ao I Ming Dynasty shipwreck site located off the coast of Guangdong Province, China. By utilizing high-resolution MBES, SSS, SBP, and marine magnetic data, we constructed and validated an “acoustic-magnetic” multi-source geophysical workflow—encompassing detection, processing, and integration analysis—specifically tailored for complex seafloor environments. Through synergistic processing and cross-validation of multi-source geophysical features, this research aims to achieve refined identification and extraction of the 3D morphology, burial state, and physical properties of the wreck site. The objective was to enhance the reliability of shipwreck detection in complex underwater environments and provide a transferable methodological framework for the investigation and assessment of UCH in comparable settings.
2. Study Area and Methods
2.1. Overview of the Study Area
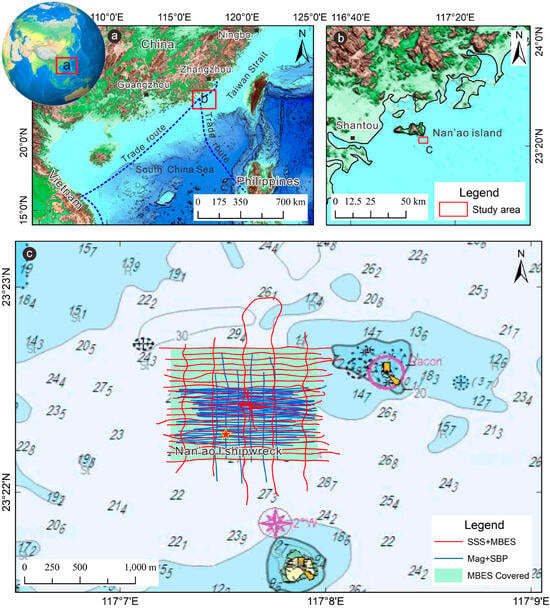
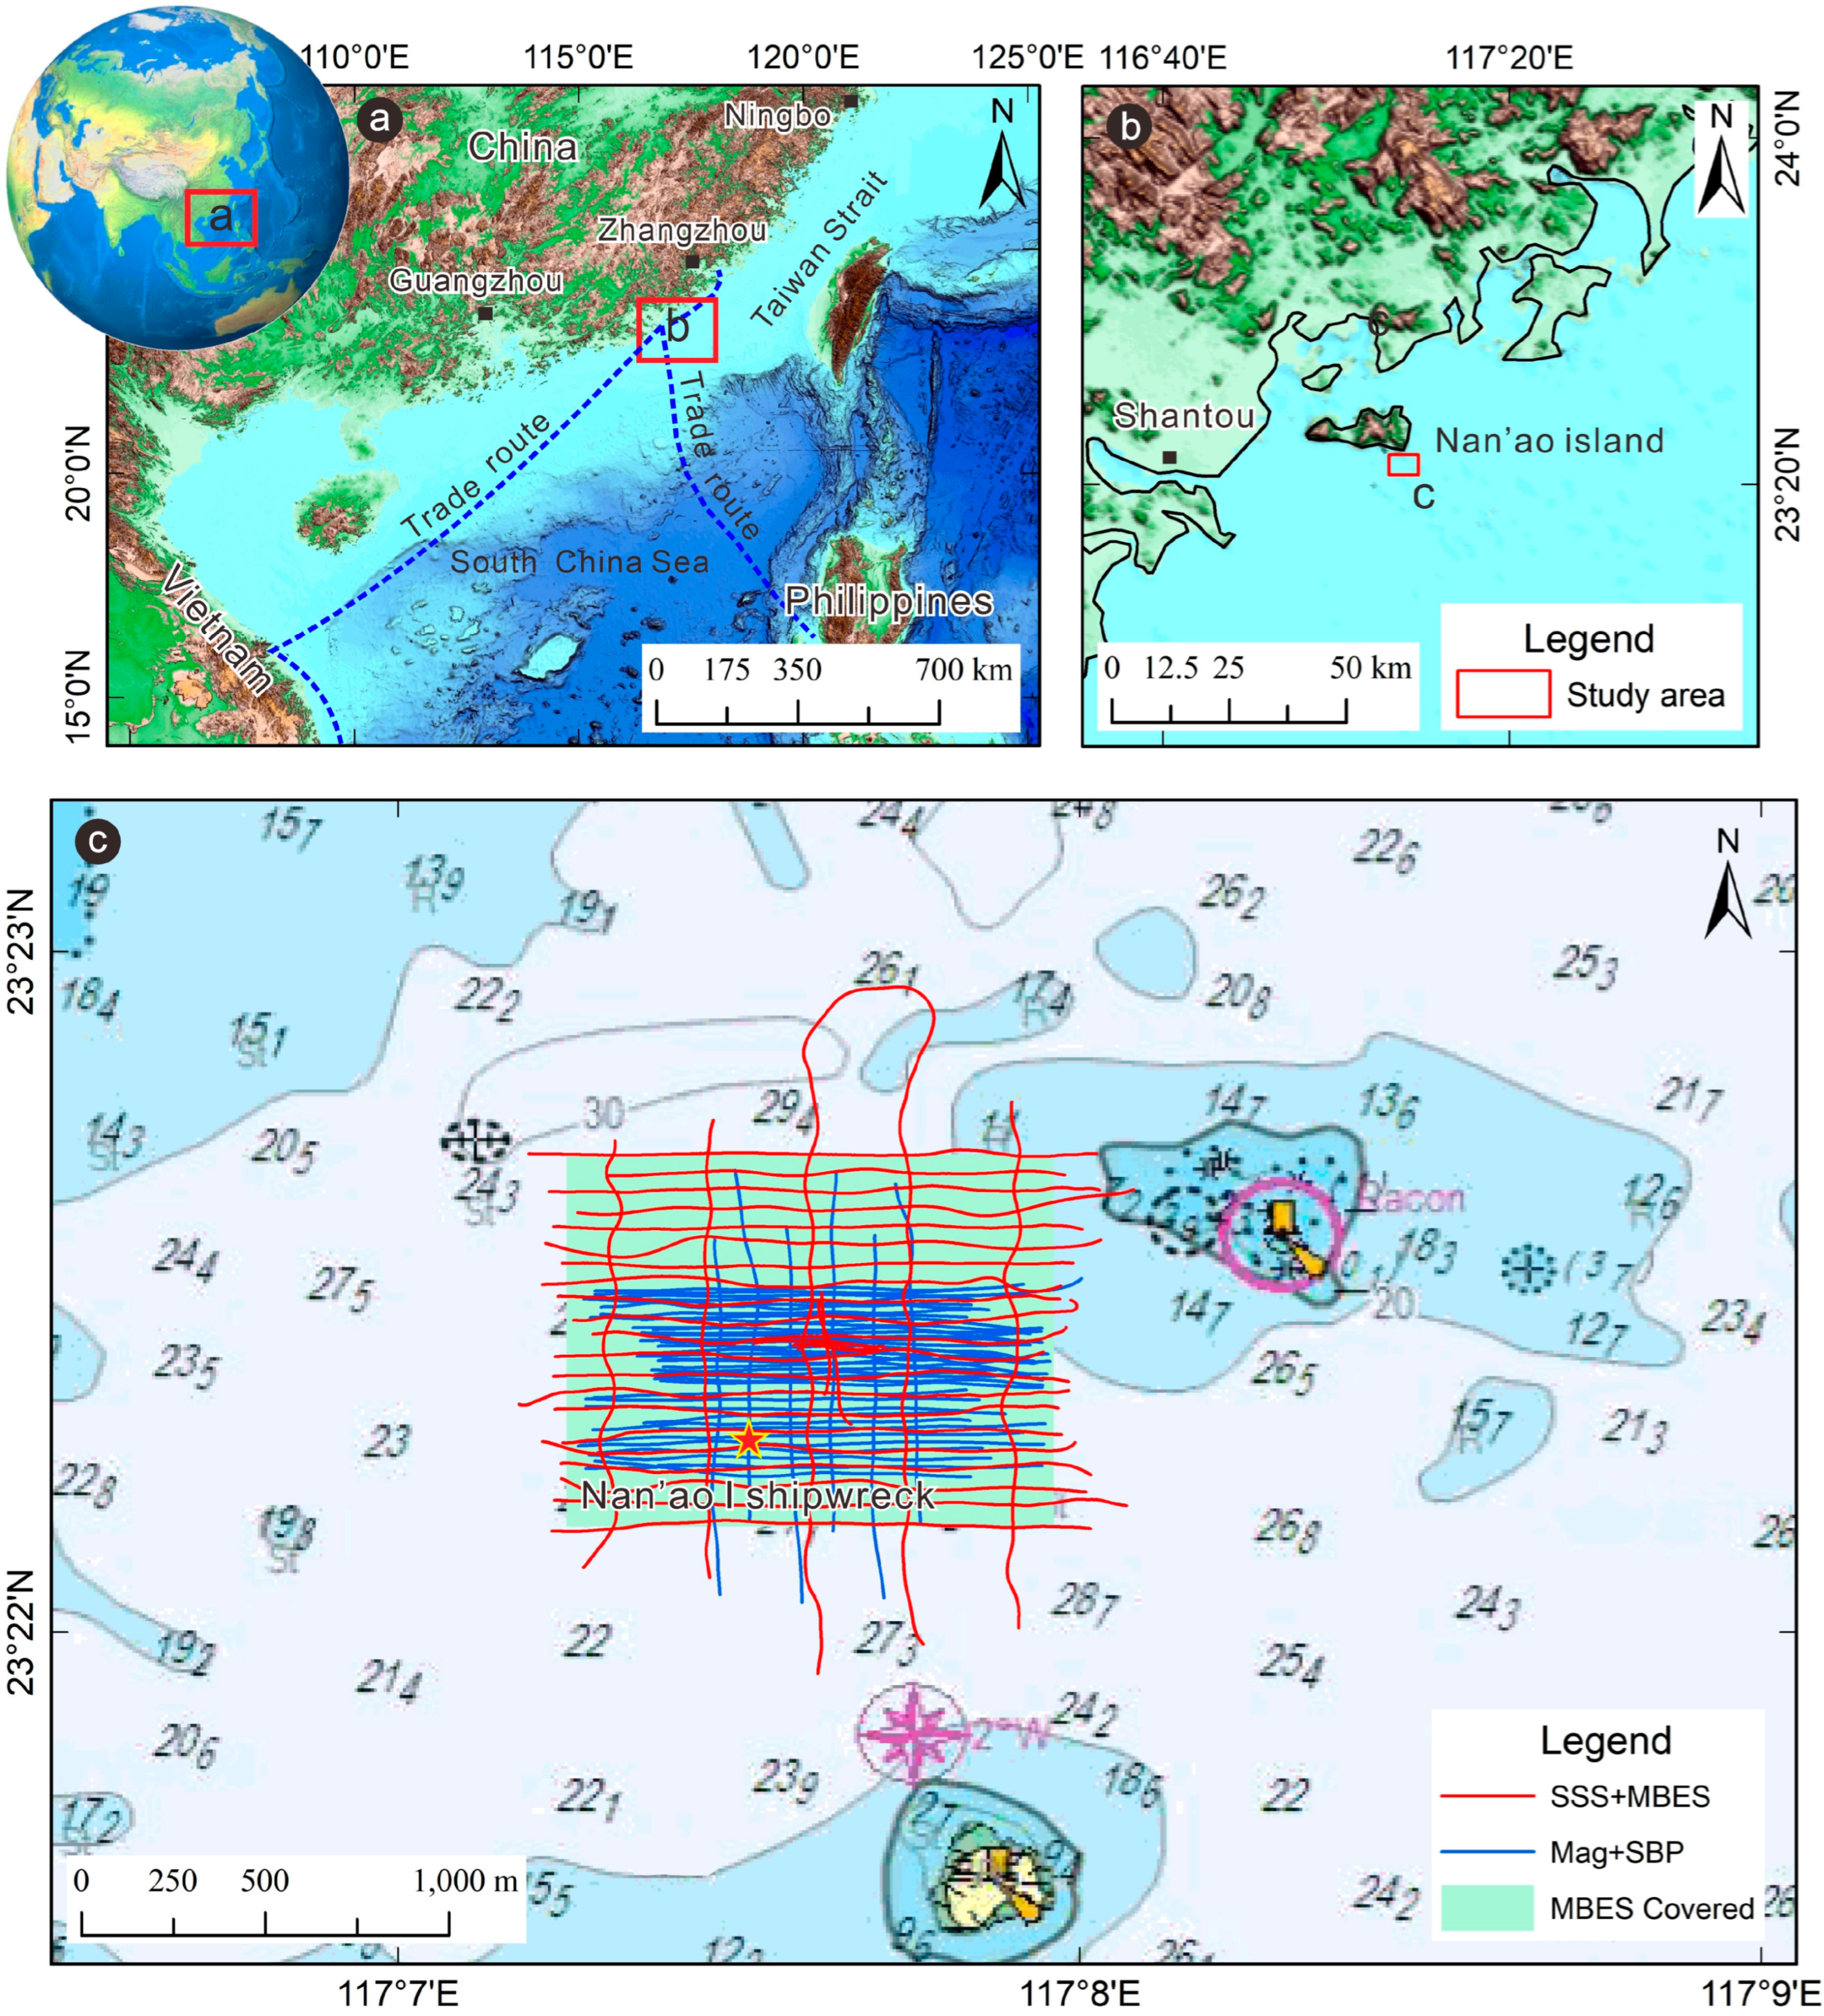
Historically, Nan’ao waters served as a critical node connecting major Chinese ports, such as Ningbo, Zhangzhou, and Guangzhou, with Southeast Asian countries along ancient maritime trade routes (Figure 1a). The Nan’ao I shipwreck site was discovered in 2007 in the waters off Yun’ao Town, Nan’ao County, Guangdong Province, located in the northern South China Sea near the southwestern entrance of the Taiwan Strait [26,27]. In April through July 2010, archaeological excavation was conducted on the sunken ship Nan’ao I. The discovered ship body was about 27 m long with 17 bulkheads and 16 compartments, the longest one of which was 7.5 m in length [28]. Over 10,000 pieces of artifacts of various categories were recovered, most of which were porcelains, followed by potteries, bronzes, and iron and tin wares, as well as over 15,000 bronze coins [28]. Most of the porcelains were blue-and-white porcelains produced in Zhangzhou Kiln at the end of the 16th and the beginning of the 17th centuries, and the date of the sinking of the ship would be roughly the same [28]. The discovery and recovery of Nan’ao I provided direct evidence for the research on the material cultural interchanges among different civilizations and regions. This represents the first commercial shipwreck discovered in the late Ming Dynasty. Archaeological evidence indicates that the vessel sank during the Wanli reign, specifically inferred to be between 1581 and 1588 [28,29]. Beyond being a testament to private maritime trade following the lifting of the sea ban in the Ming Dynasty, the Nan’ao I is recognized as a vital link in the Spanish Manila Galleon trade network, reflecting the global exchange of goods in the latter half of the 16th century following the opening of new maritime routes [30,31]. To prevent looting and destruction, cultural heritage authorities have constructed a rigid frame over the site to ensure in situ preservation [32].
Figure 1.
Location of the archaeological survey area and distribution of geophysical survey lines. (a) Global and regional geographical locations of the study area along the southeastern coast of China. The red box indicates the study area situated in the northern South China Sea near the southwestern end of the Taiwan Strait, adjacent to the coasts of Fujian and Guangdong. The blue dashed line represents ancient maritime trade routes connecting ports such as Ningbo, Zhangzhou, and Guangzhou, extending through the Taiwan Strait into the South China Sea and reaching Southeast Asia such as Vietnam and Philippines, etc. (b) Detailed view of the study area showing its location (red box) in the southeastern waters off Nan’ao Island, Guangdong, with visible islands and an intricate coastline. (c) Distribution of geophysical survey lines overlaid on a nautical chart base map; numbers indicate water depth (m). The red-yellow star indicates the approximate location of the Nan’ao I shipwreck site, where a rigid protective frame has been installed following previous excavations. The red lines represent the MBES and SSS survey lines (50 m × 250 m grid), whereas the blue lines represent the SBP and magnetic survey lines (20 m × 50 m grid). The light-green area denotes the full coverage extent of the multibeam bathymetry.
Given the prolonged exposure of the wreck to a complex marine environment, its structural state may have undergone significant alterations. To precisely relocate the site, determine its burial state, and assess the interaction between the hull and the surrounding geological environment, a high-precision, comprehensive geophysical survey was conducted in the adjacent waters. The study area was situated at a depth of approximately 24 m. The local seafloor topography is characterized by steep relief, dominated by sandy sediments interbedded with bedrock, weathered regoliths, and dense reef shoals (Figure 1b). Influenced by monsoons and strong tidal currents, the area experiences high turbidity and vigorous hydrodynamics, posing substantial challenges for underwater detection. A high-density survey grid covering an area of approximately 1.2 km × 1.2 km was established. The MBES and SSS were deployed on a 50 m × 250 m grid to achieve full acoustic coverage. In the core area, SBP and magnetic survey lines were densified to a 20 m × 50 m grid (blue lines in Figure 1c) to enable refined detection of the wreck site (red lines in Figure 1c). In 20–30 m water depth, the 50 m × 250 m grid ensures SSS and MBES full coverage; leveraging the equipment specifications, the MBES achieves a point cloud density of 0.5 m × 0.5 m and the SSS a resolution of 0.1–0.5 m, with simultaneous MBES/SSS acquisition reducing survey time. Following the identification of suspected wreck sites by MBES and SSS, a densified 20 m × 50 m grid is deployed for SBP and magnetometer surveys, thereby mitigating the risk of missed detection.
2.2. Equipment and Technical Methodology
This study established a technical workflow for the detection, identification, and integration analysis of shipwrecks based on multi-source geophysical data, comprising three stages: acoustic-magnetic collaborative detailed surveys and identification, fine processing of multi-source data targeting the wreck site, and spatial registration and overlay analysis.
Stage 1: Acoustic-Magnetic Collaborative Detailed Surveys and Identification
Initially, MBES and SSS were utilized to conduct broad-area reconnaissance, preliminarily extracting anomalies indicative of shipwrecks, such as “topographic mounds, acoustic shadows, and high backscatter.” Subsequently, SBP and marine magnetic surveys were intensified in key areas to obtain shallow stratigraphic structures, assess burial states, and identify ferromagnetic targets via local magnetic anomalies. The details of the equipment and parameters employed are provided in Table 1. The Kongsberg EM2040P MBES system (KONGSBERG, Kongsberg, Norway) provided centimeter-level depth accuracy [33]; the Edgetech 4200MP dual-frequency SSS (EdgeTech, West Wareham, MA, USA) achieved centimeter-level imaging resolution [34]; the Innomar SES 2000 light SBP (Innomar Technologie GmbH, Rostock, Germany) offered a penetration depth of up to 40 m and a vertical resolution of 3 cm for identifying shallow stratigraphy and burial characteristics [35]; and the SeaSPY2 Overhauser magnetometer (Marine Magnetics Corporation, Markham, ON, Canada) featured a sensitivity of 0.01 nT and a sampling rate of 1 Hz [36]. The magnetometer sensor was towed 100 m astern to effectively mitigate interference from the magnetic field of the vessel, allowing for the detection of local anomalies induced by the iron structure of the wreck. All data were positioned using DGPS (accuracy < 0.5 m) and corrected for heading, pitch, and roll using an Octans attitude correction system to ensure high-precision spatial consistency.
Table 1.
Equipment specifications and data acquisition parameters for the marine archaeological survey.
Stage 2: Fine Processing of Multi-source Data for the Shipwreck Site
MBES data were processed using Caris (v12.0, Teledyne CARIS, Fredericton, NB, Canada) software, involving sound velocity profile correction, tide correction, point cloud filtering, and editing, to generate a high-resolution digital bathymetric model with a grid spacing of 0.5 m. The SSS data were processed using SonarWiz (v7.11, Chesapeake Technology, Inc., New York, NY, USA) for bottom tracking, slant range correction, gain balancing, and image mosaicking to produce full-coverage sonar imagery. SBP data were processed using GeoSuite Allworks (2022R1, GEO Marine Survey Systems, Rotterdam, The Netherlands) with band-pass filtering and gain balancing to enhance shallow reflectors. Magnetic data were decoded, median-filtered to remove outliers, and corrected for sensor positioning, diurnal variation, and ship magnetic heading effects using proprietary software developed by the Guangzhou Marine Geological Survey, and then imported into SonarWiz. Natural neighbor interpolation was performed on the total magnetic field data—labeled as “Raw” trace in SonarWiz—with a grid cell size of 2 m to produce the magnetic intensity grid surface, followed by magnetic anomaly analysis.
Stage 3: Spatial Registration and Overlay Analysis of Multi-source Data
All datasets were referenced to WGS-84 and reprojected to UTM Zone 50N (EPSG:32650) for unified planar coordinates. Water depths from MBES and SBP data were tide-corrected using in situ tide gauge observations and reduced to the theoretical lowest low water datum. Sensor offsets for the MBES, SSS, SBP, and marine magnetometer were corrected based on their relative positions to the onboard GNSS. As data acquisition was not simultaneous across equipment, UTC timestamps were used to align all datasets onto a unified UTC time axis, enabling spatio-temporal registration. The processed geophysical datasets were imported into the CTI 3D Viewer module of SonarWiz. Given that the SSS and magnetometer sensors (towfish) lacked precise underwater positioning, a secondary horizontal registration was performed through multi-data comparison. Overlay analysis was then applied to identify seabed targets characterized by regular geometry, high backscatter, shallow strong reflection, and localized magnetic anomalies, thereby achieving accurate localization and evaluation of the shipwreck site through multi-dimensional feature mutual validation.
3. Results
3.1. Geophysical Characteristics of the Shipwreck Site
3.1.1. 3D Micro-Topography and Morphological Features
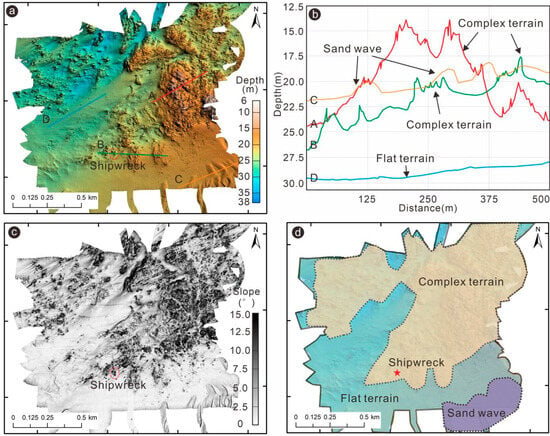
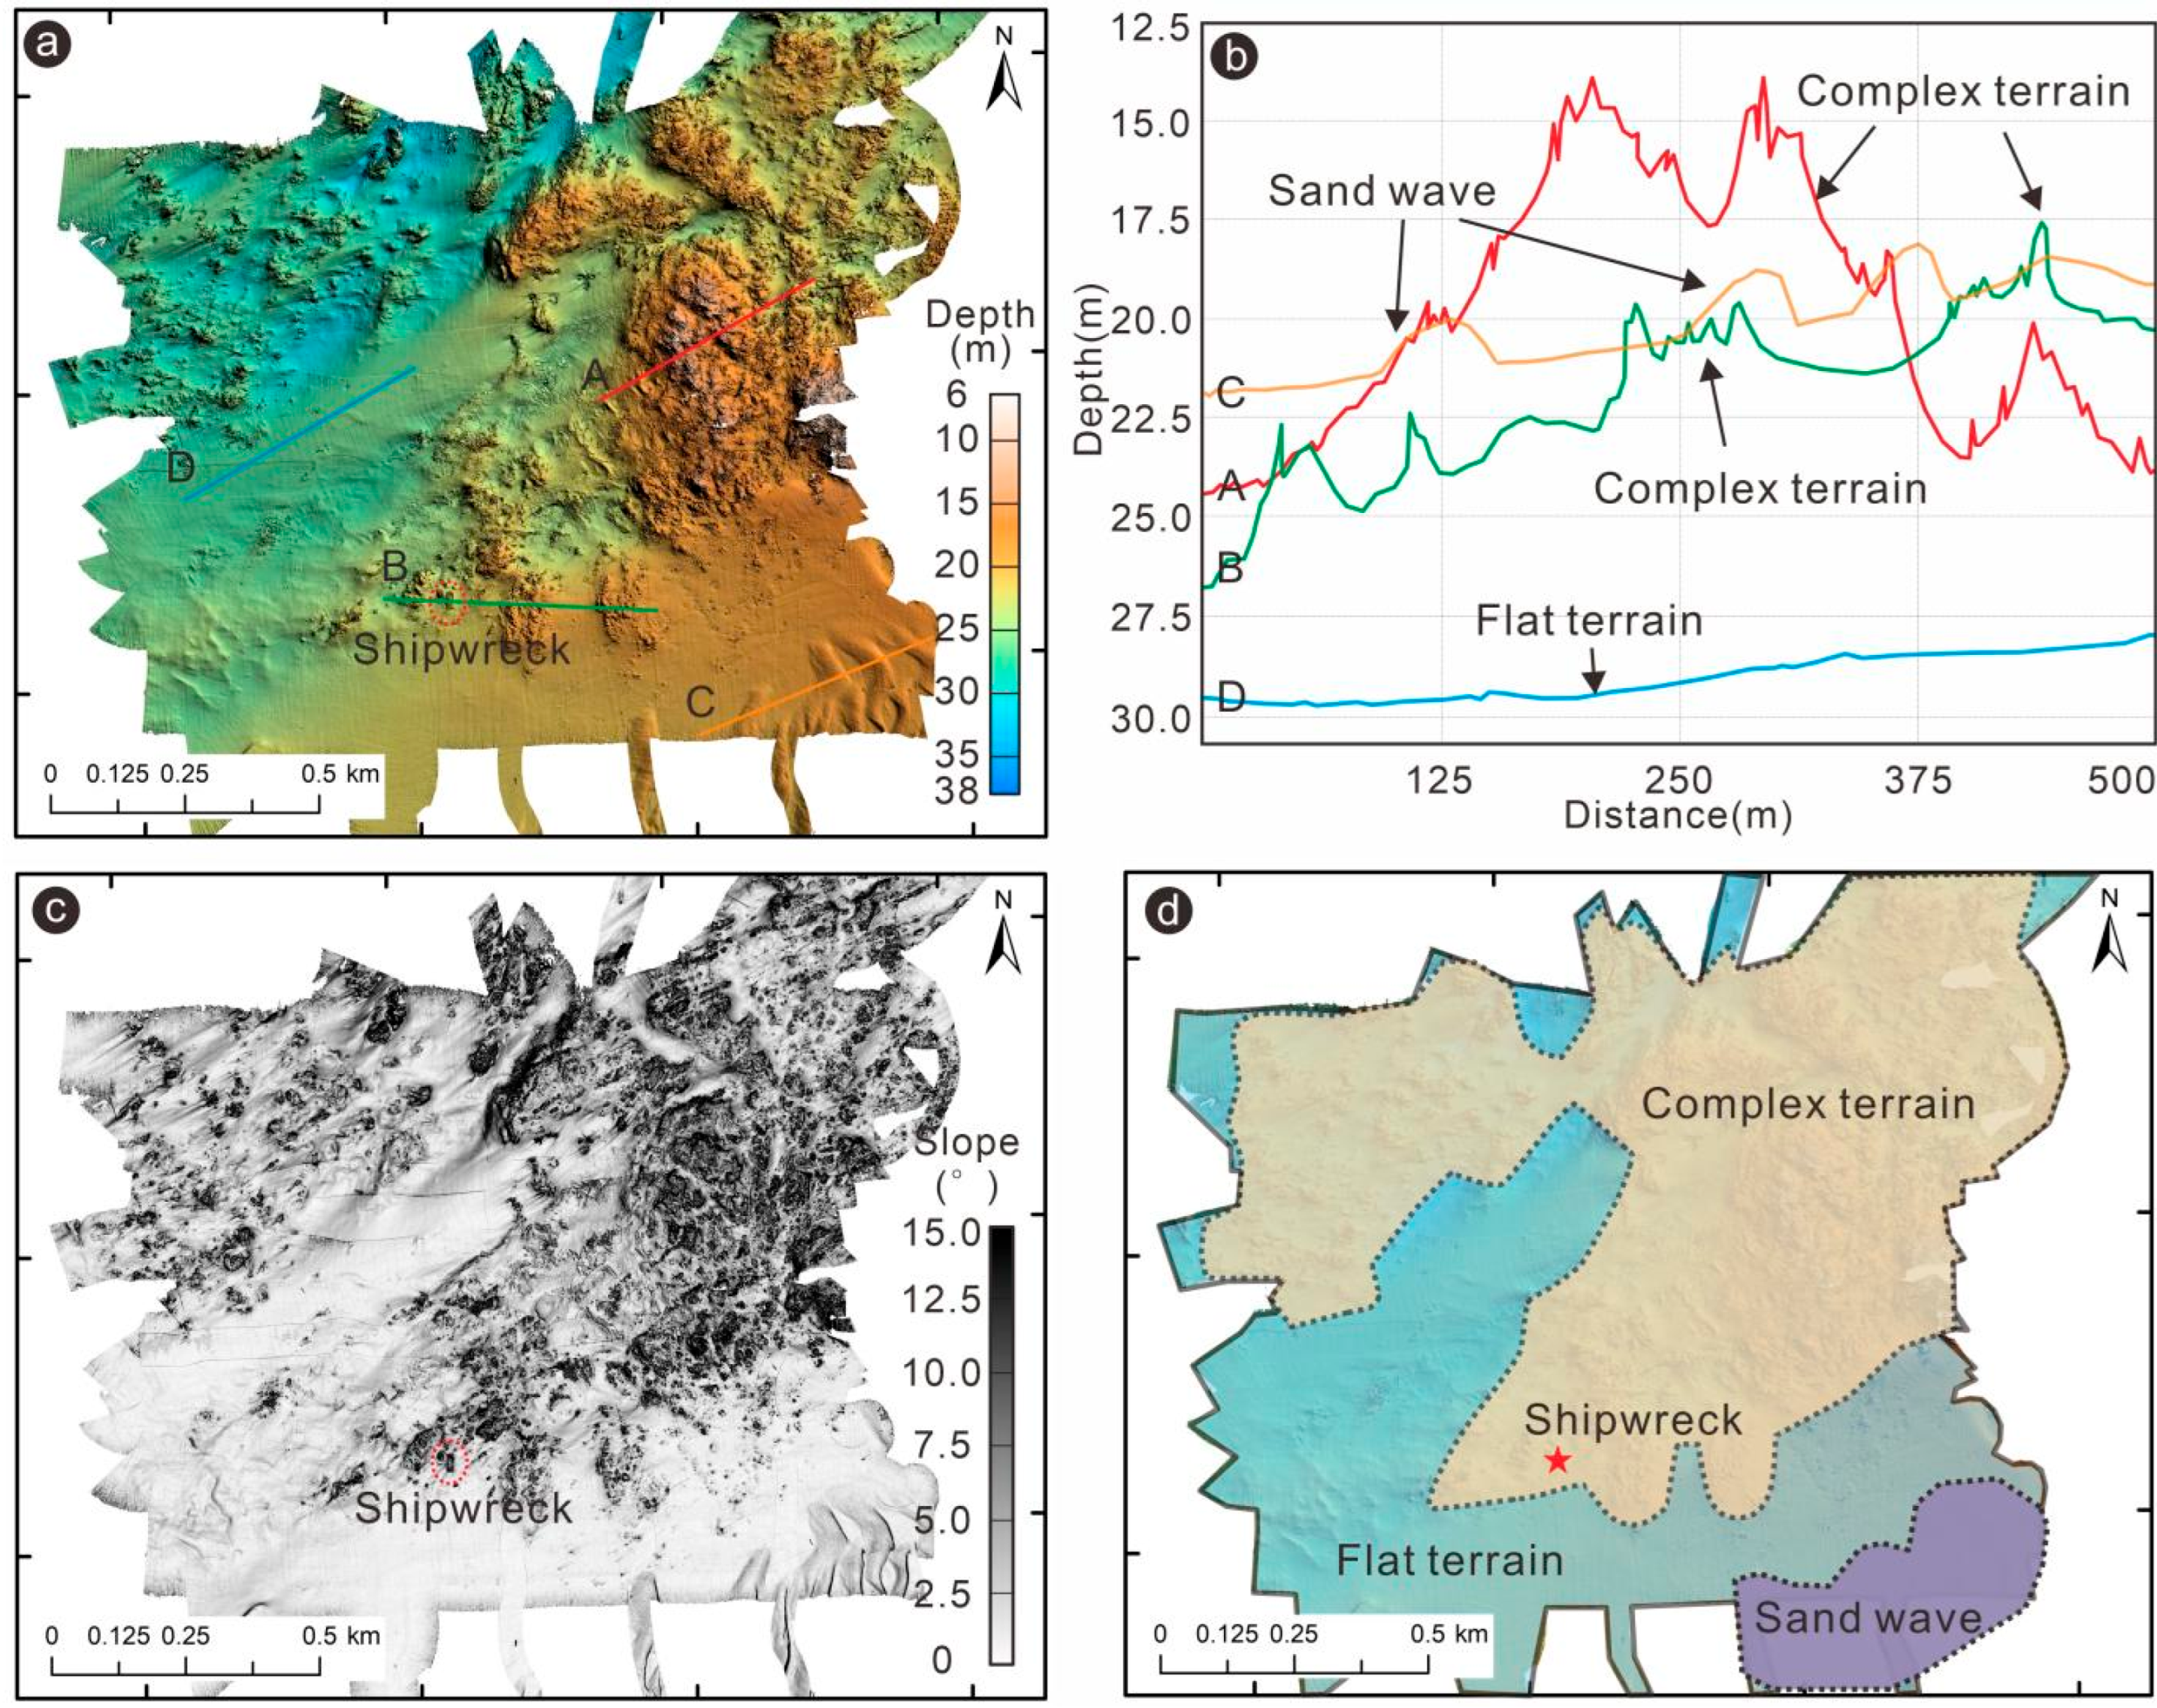
The seabed topography of the study area is complex, exhibiting significant relief with water depths ranging from 6 to 38 m, dominated by the 10–25 m interval (Figure 2a–c). Based on topographic characteristics, the area was classified into three distinct units: complex terrain, flat terrain, and sand waves (Figure 2d). The dominant complex terrain, located in the central and eastern regions, exhibited pronounced ruggedness, characterized by protruding reef clusters, incised gullies, and irregular relief, with slopes generally exceeding 10°. Flat terrain was primarily distributed in the western and southern parts of the study area, characterized by low relief and uniform sedimentary cover, with slopes generally less than 5° (Figure 2). Sand waves were located in the southeastern corner, manifesting as a series of linear, wavy topographic features trending NW–SE, with wavelengths of approximately 100–200 m and wave heights of 1–2 m. The suspected shipwreck site was located within a complex terrain unit at a water depth of 24 m (Figure 2d).
Figure 2.
Complex seafloor topographic features and terrain unit classification in the study area. (a) 3D terrain model of the study area displaying significant topographic relief. Four topographic profiles (A, B, C, and D) were selected for analysis. (b) Profiles A and B show undulating complex terrain, Profile C displays the morphological characteristics of sand waves, and Profile D shows a flat seabed. (c) The slope characteristics of the seafloor terrain indicated slopes < 5° in flat terrain areas and >10° in complex terrain areas. (d) Terrain unit distribution map, including flat terrain, complex terrain, and sand waves. The suspected shipwreck site (red star) is located within a complex terrain unit.
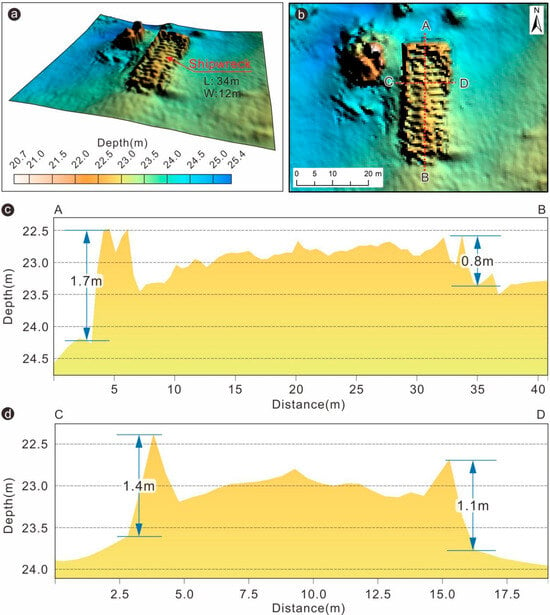
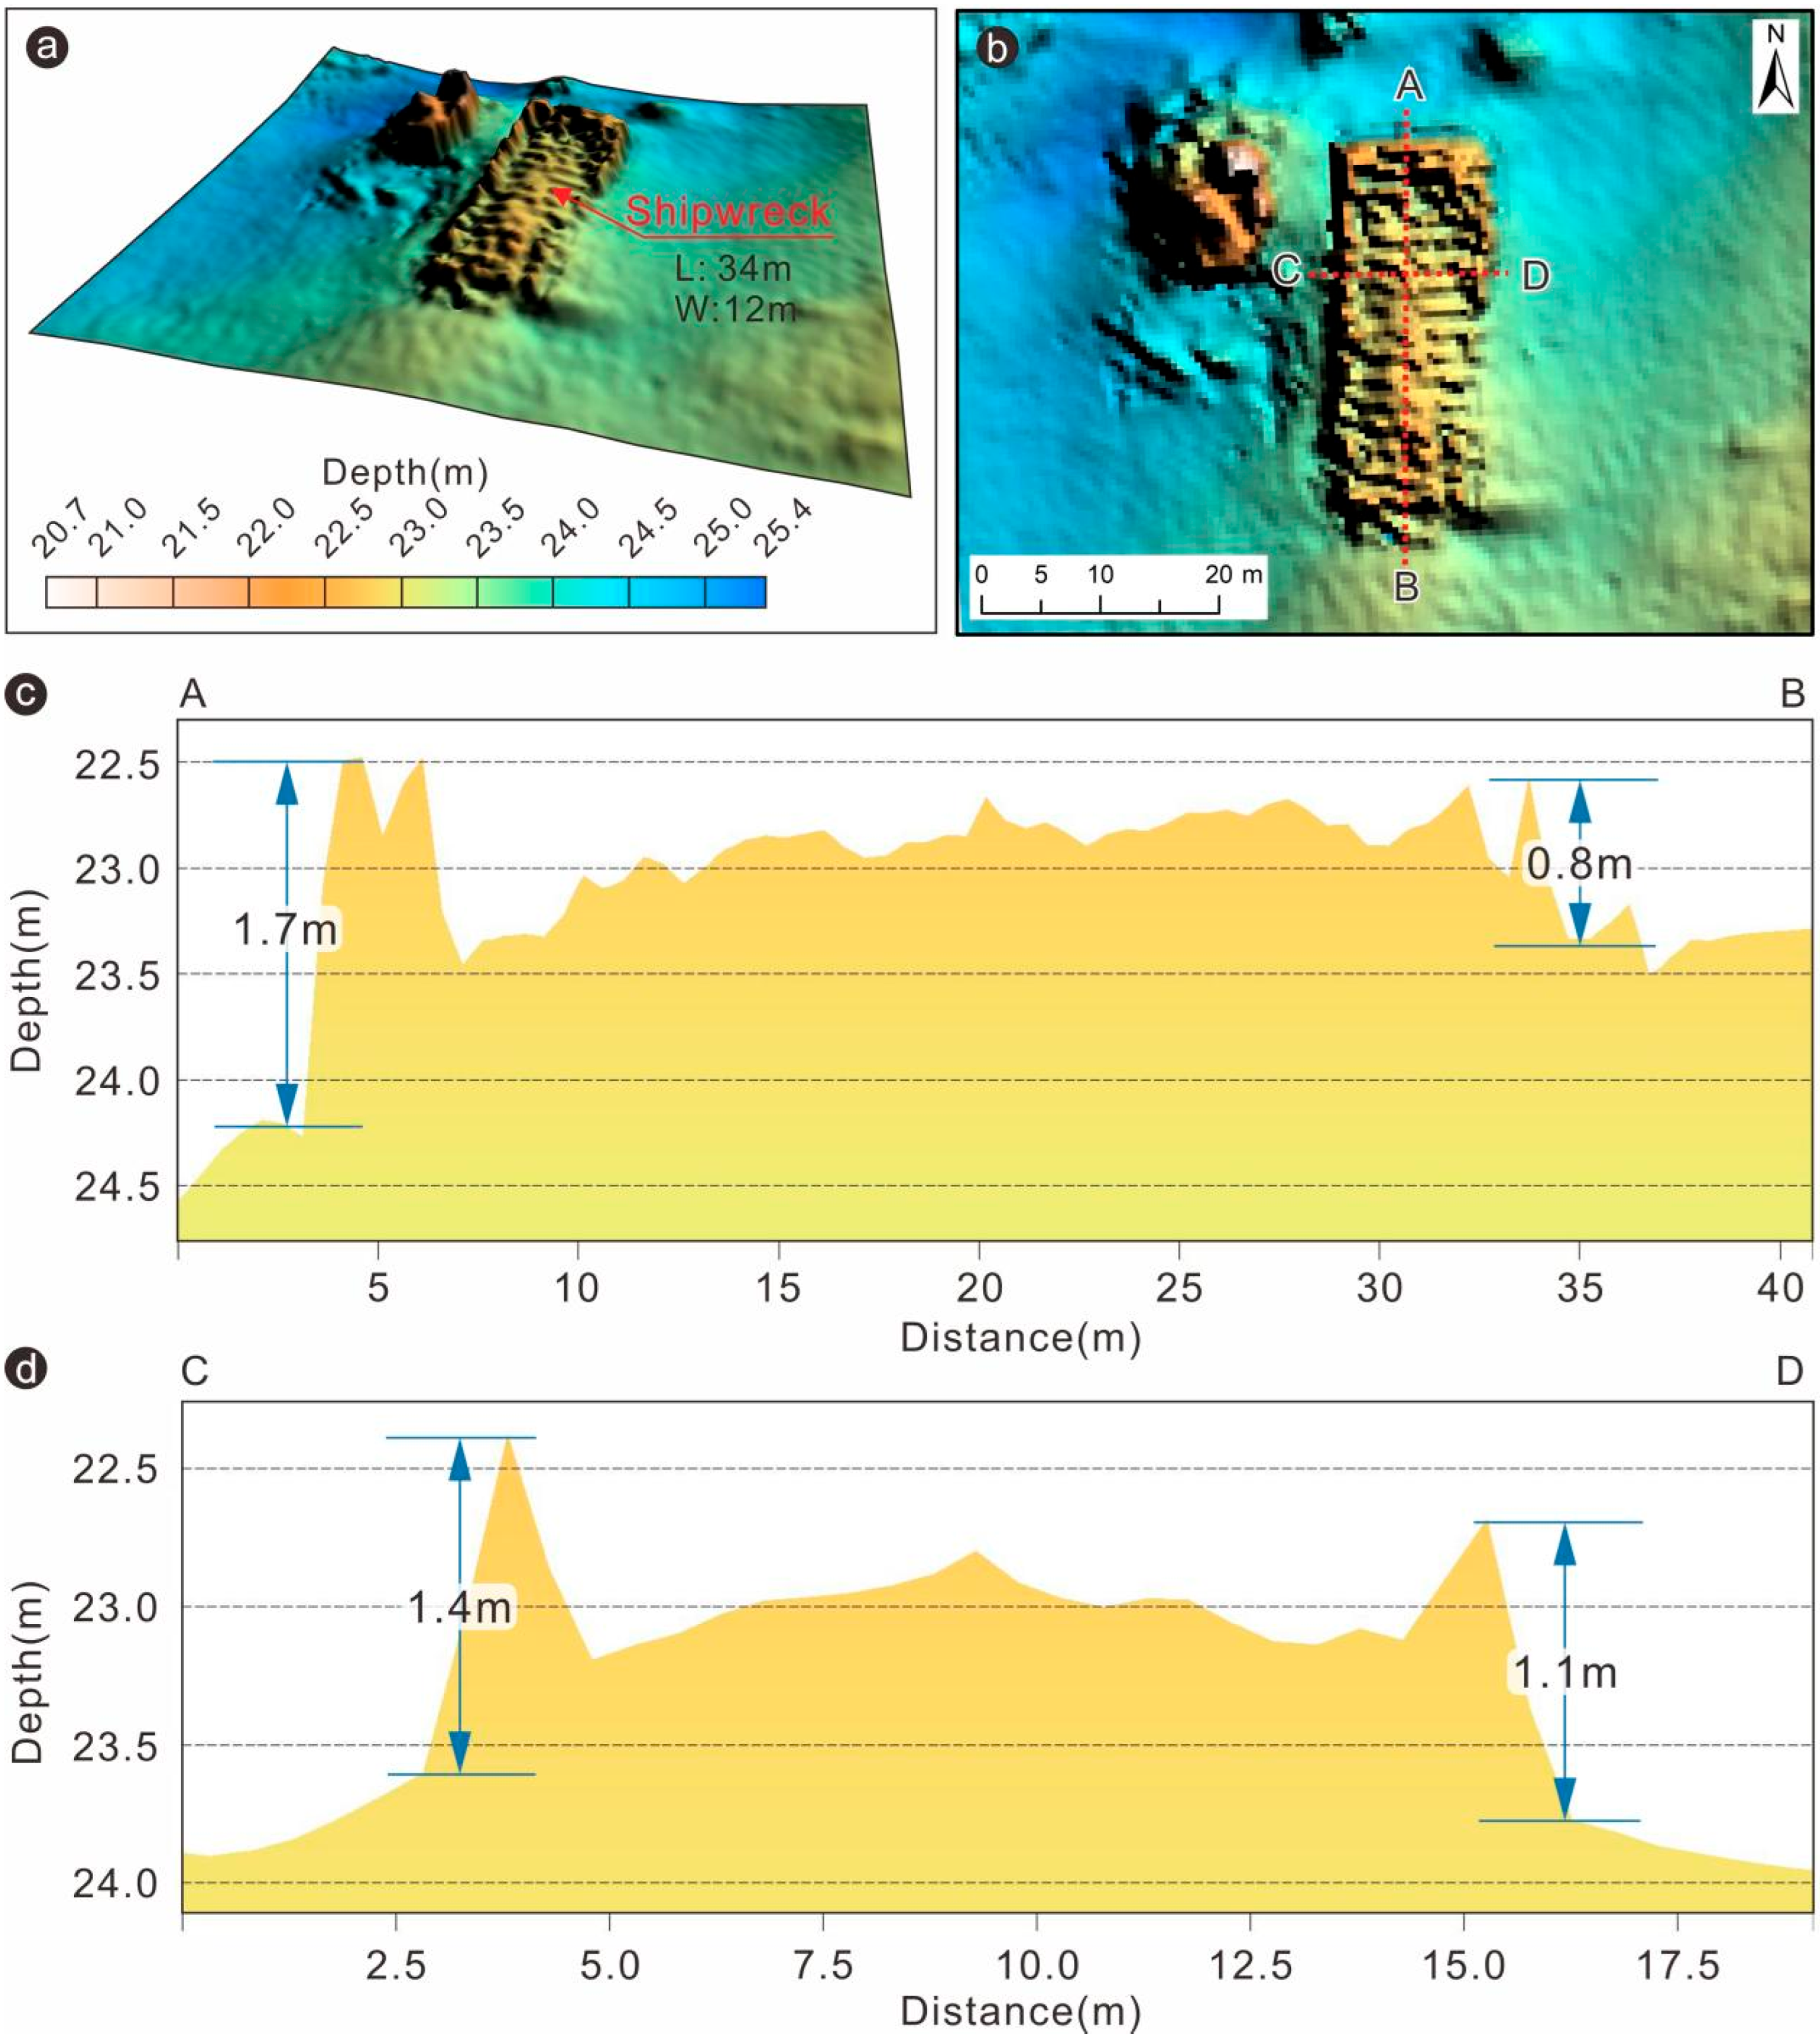
Multibeam bathymetric data clearly delineate the 3D morphology of the shipwreck site now enclosed within a rigid protective frame (Figure 3a). Compared with the surrounding seabed, the wreck manifested as a regular, north–south trending, elongated mound measuring approximately 34 m in length and 12 m in width, protruding approximately 1.2 m above the ambient seabed and presenting a distinct “hull” outline. The shipwreck surface appeared rough with localized depressions, suggesting remnant compartments or deck structures (Figure 3b). Quantitative analysis of topographic profiles revealed maximum elevation differences of 1.7 m along the north–south axis and 1.4 m along the east–west axis (Figure 3c,d). The gradual transition between the surrounding terrain and hull morphology suggests partial disintegration or burial of the shipwreck by sediment.
Figure 3.
3D morphological characteristics of the suspected shipwreck site. (a) The multibeam data revealed clear 3D morphological features of the shipwreck within the rigid protective frame. The wreck appeared as an elongated structure, approximately 34 m long and 12 m wide, oriented slightly along a north–south axis. (b) Quantitative analysis of shipwreck morphology, with topographic profiles extracted along lines AB (north–south) and CD (east–west). (c) Morphological characteristics of a shipwreck. The AB profile shows a maximum elevation difference of 1.7 m along the north–south direction. (d) The CD profile shows a maximum elevation difference of 1.4 m along the east–west direction.
3.1.2. Side-Scan Sonar Acoustic Texture Characteristics
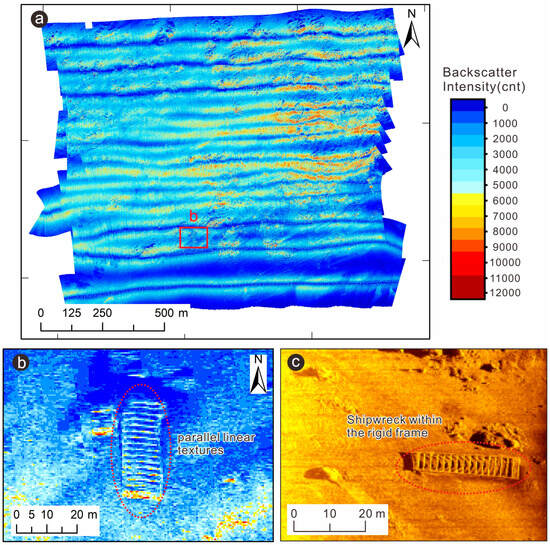
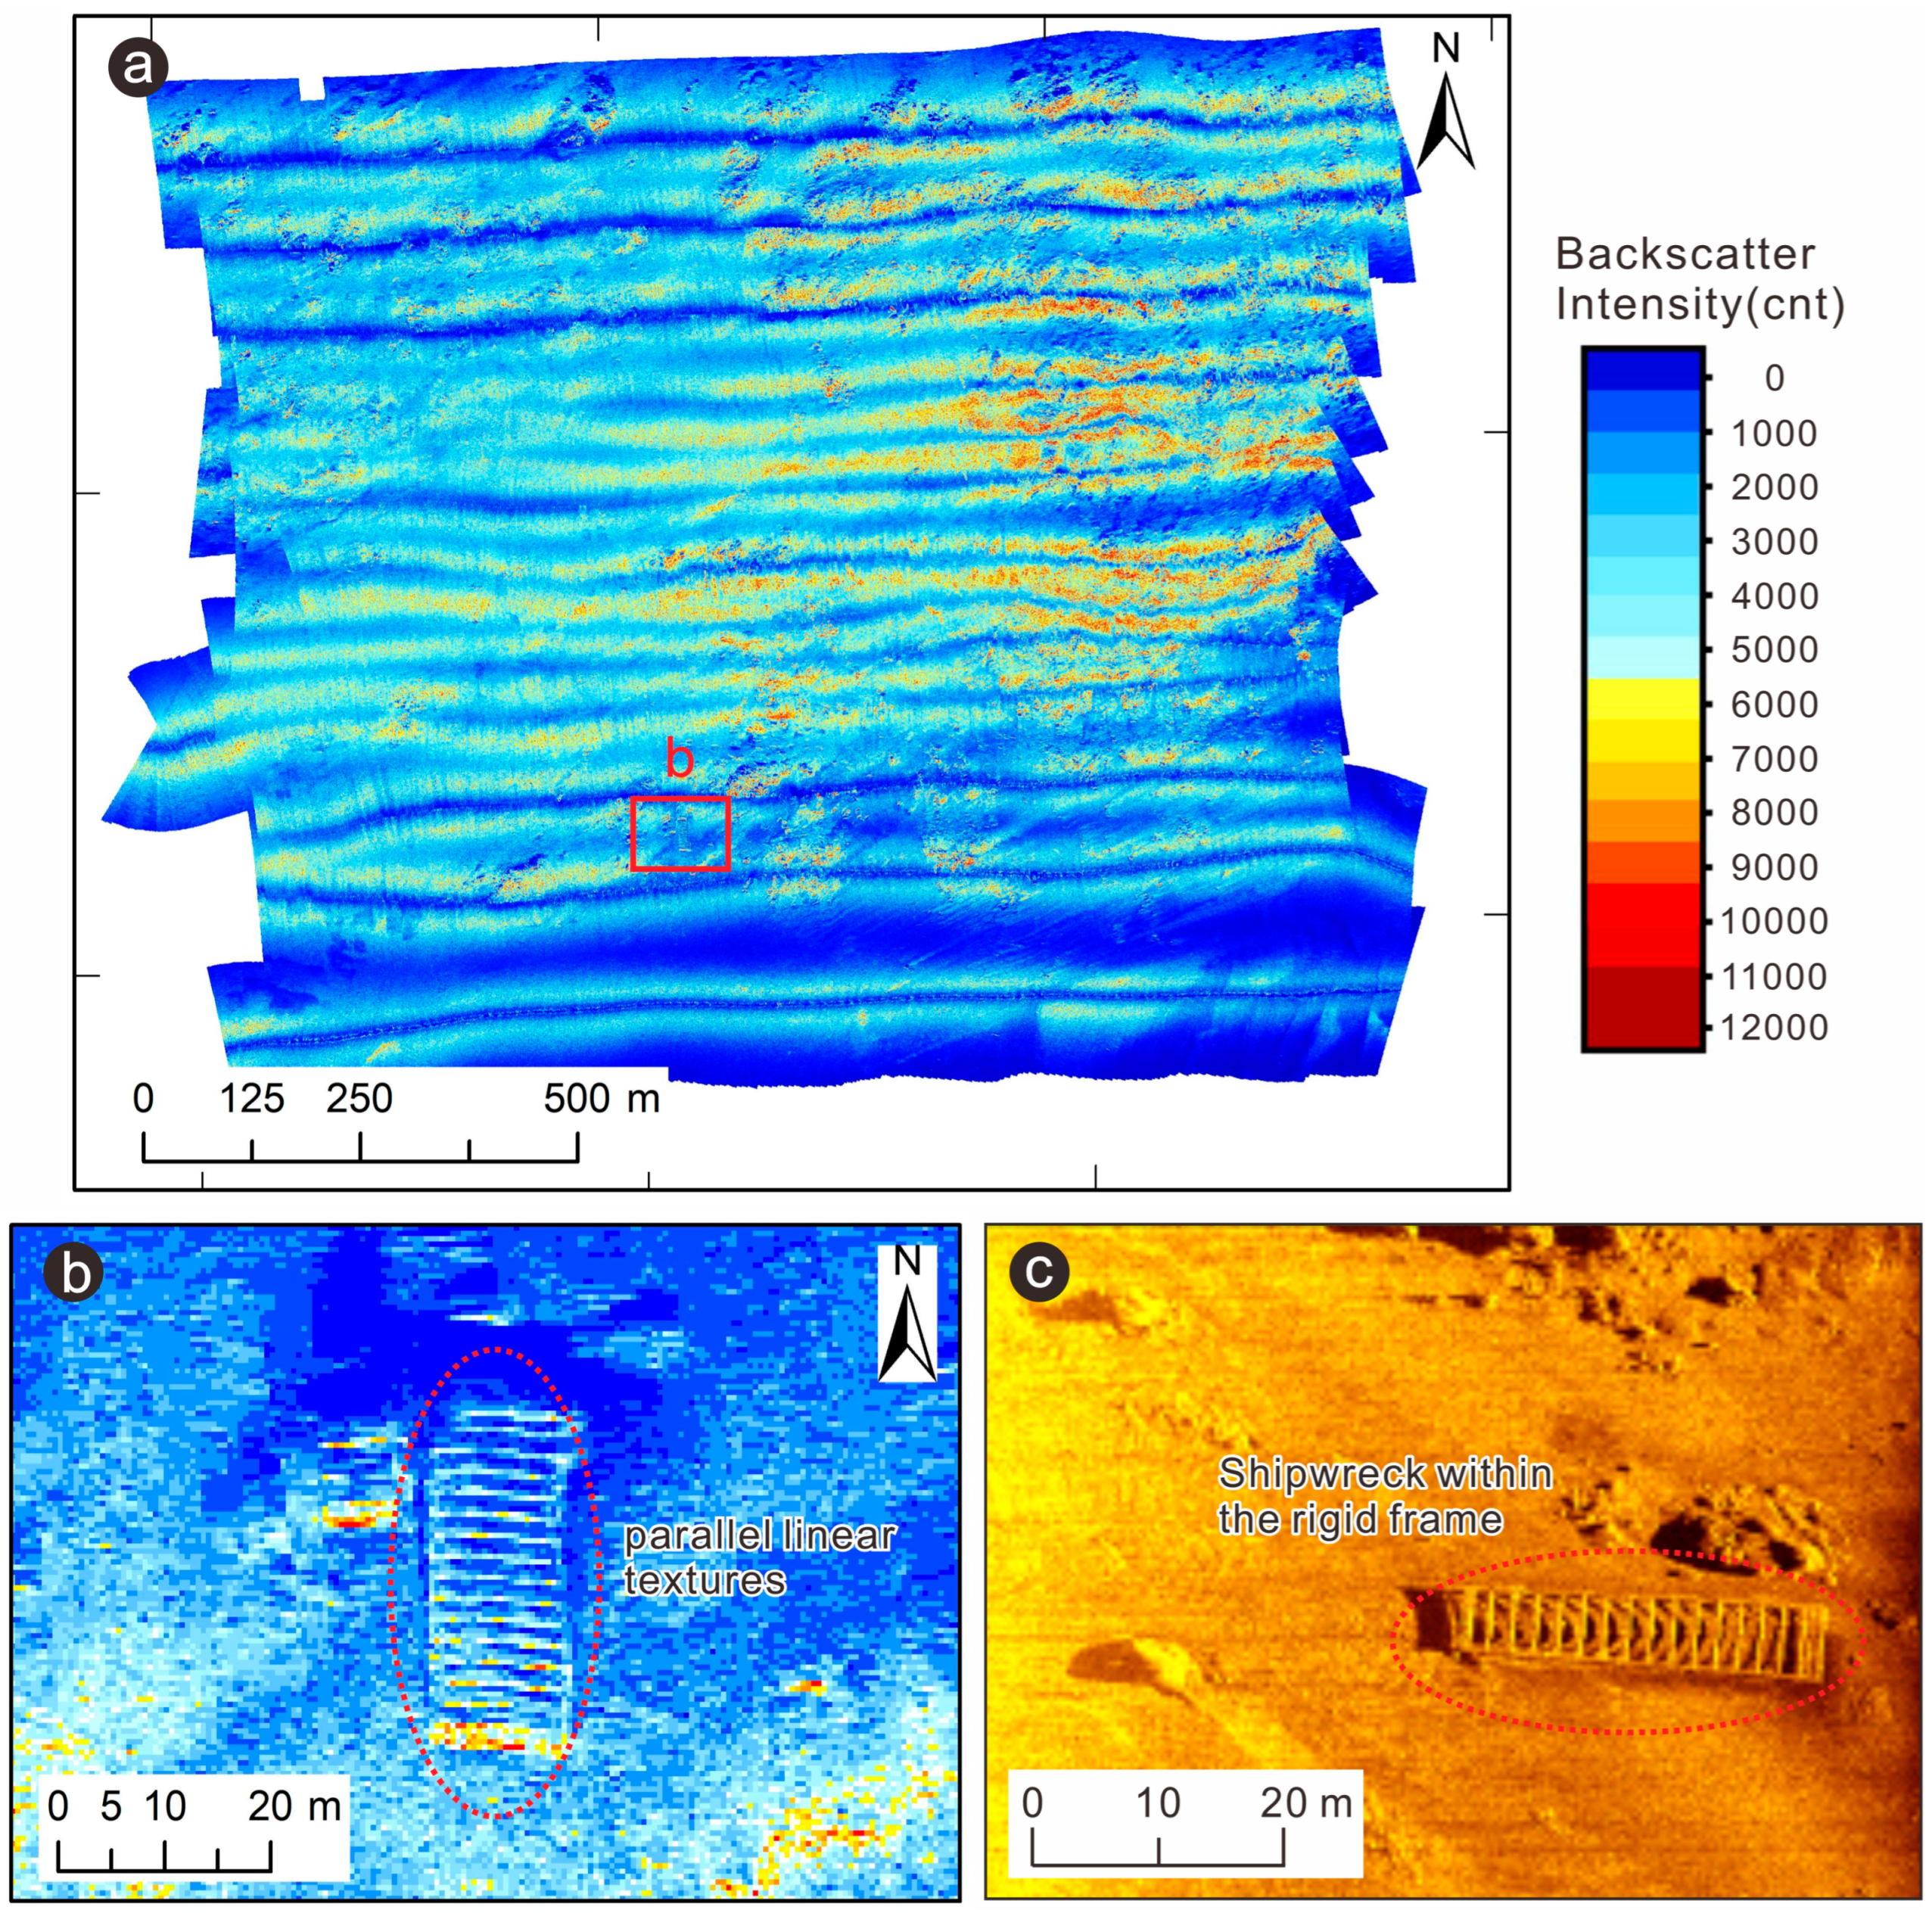
The SSS mosaic (Figure 4a) revealed spatial variations in acoustic backscatter across the seabed. High-backscatter zones (yellow-red) in the central and eastern regions correspond to exposed reef clusters, protruding topography, or artificial structures, whereas low-backscatter zones (dark blue) in the southwest correspond to flat sedimentary beds. In the core area of the imagery (Figure 4b), the shipwreck site within the rigid protective frame appeared as a well-defined, north–south trending, high-backscatter anomaly with an elongated shape (~34 m × 12 m). The peak backscatter intensity reached 8000 counts, which was significantly higher than the surrounding background values (0–3000 counts), indicating a dense and hard surface medium. Unlike the chaotic reflections from natural reefs, the wreck displayed continuous parallel linear textures (Figure 4c).
Figure 4.
SSS mosaic and characteristics of the shipwreck site. (a) General SSS mosaic of the study area, covering an area of approximately 1200 m × 1200 m. The color gradient represents echo intensity, with dark blue indicating low echo intensity corresponding to a flat seabed or sedimentary areas, and yellow to red indicating high echo intensity corresponding to reef clusters, protruding topography, or artificial structures. (b) Enlarged view of the area within the red box in Figure 4a. A prominent high-echo intensity target was identified as the shipwreck site within the rigid protective frame. This target appears as an elongated feature, approximately 34 m long and 12 m wide, extending along the north–south direction with visible parallel linear textures. (c) Raw SSS image of a shipwreck acquired by the Edgetech 4200MP sonar system.
3.1.3. Shallow Stratigraphy and Burial State
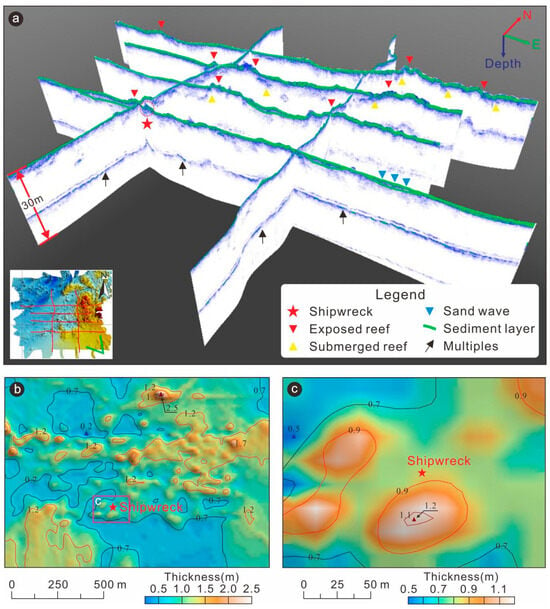
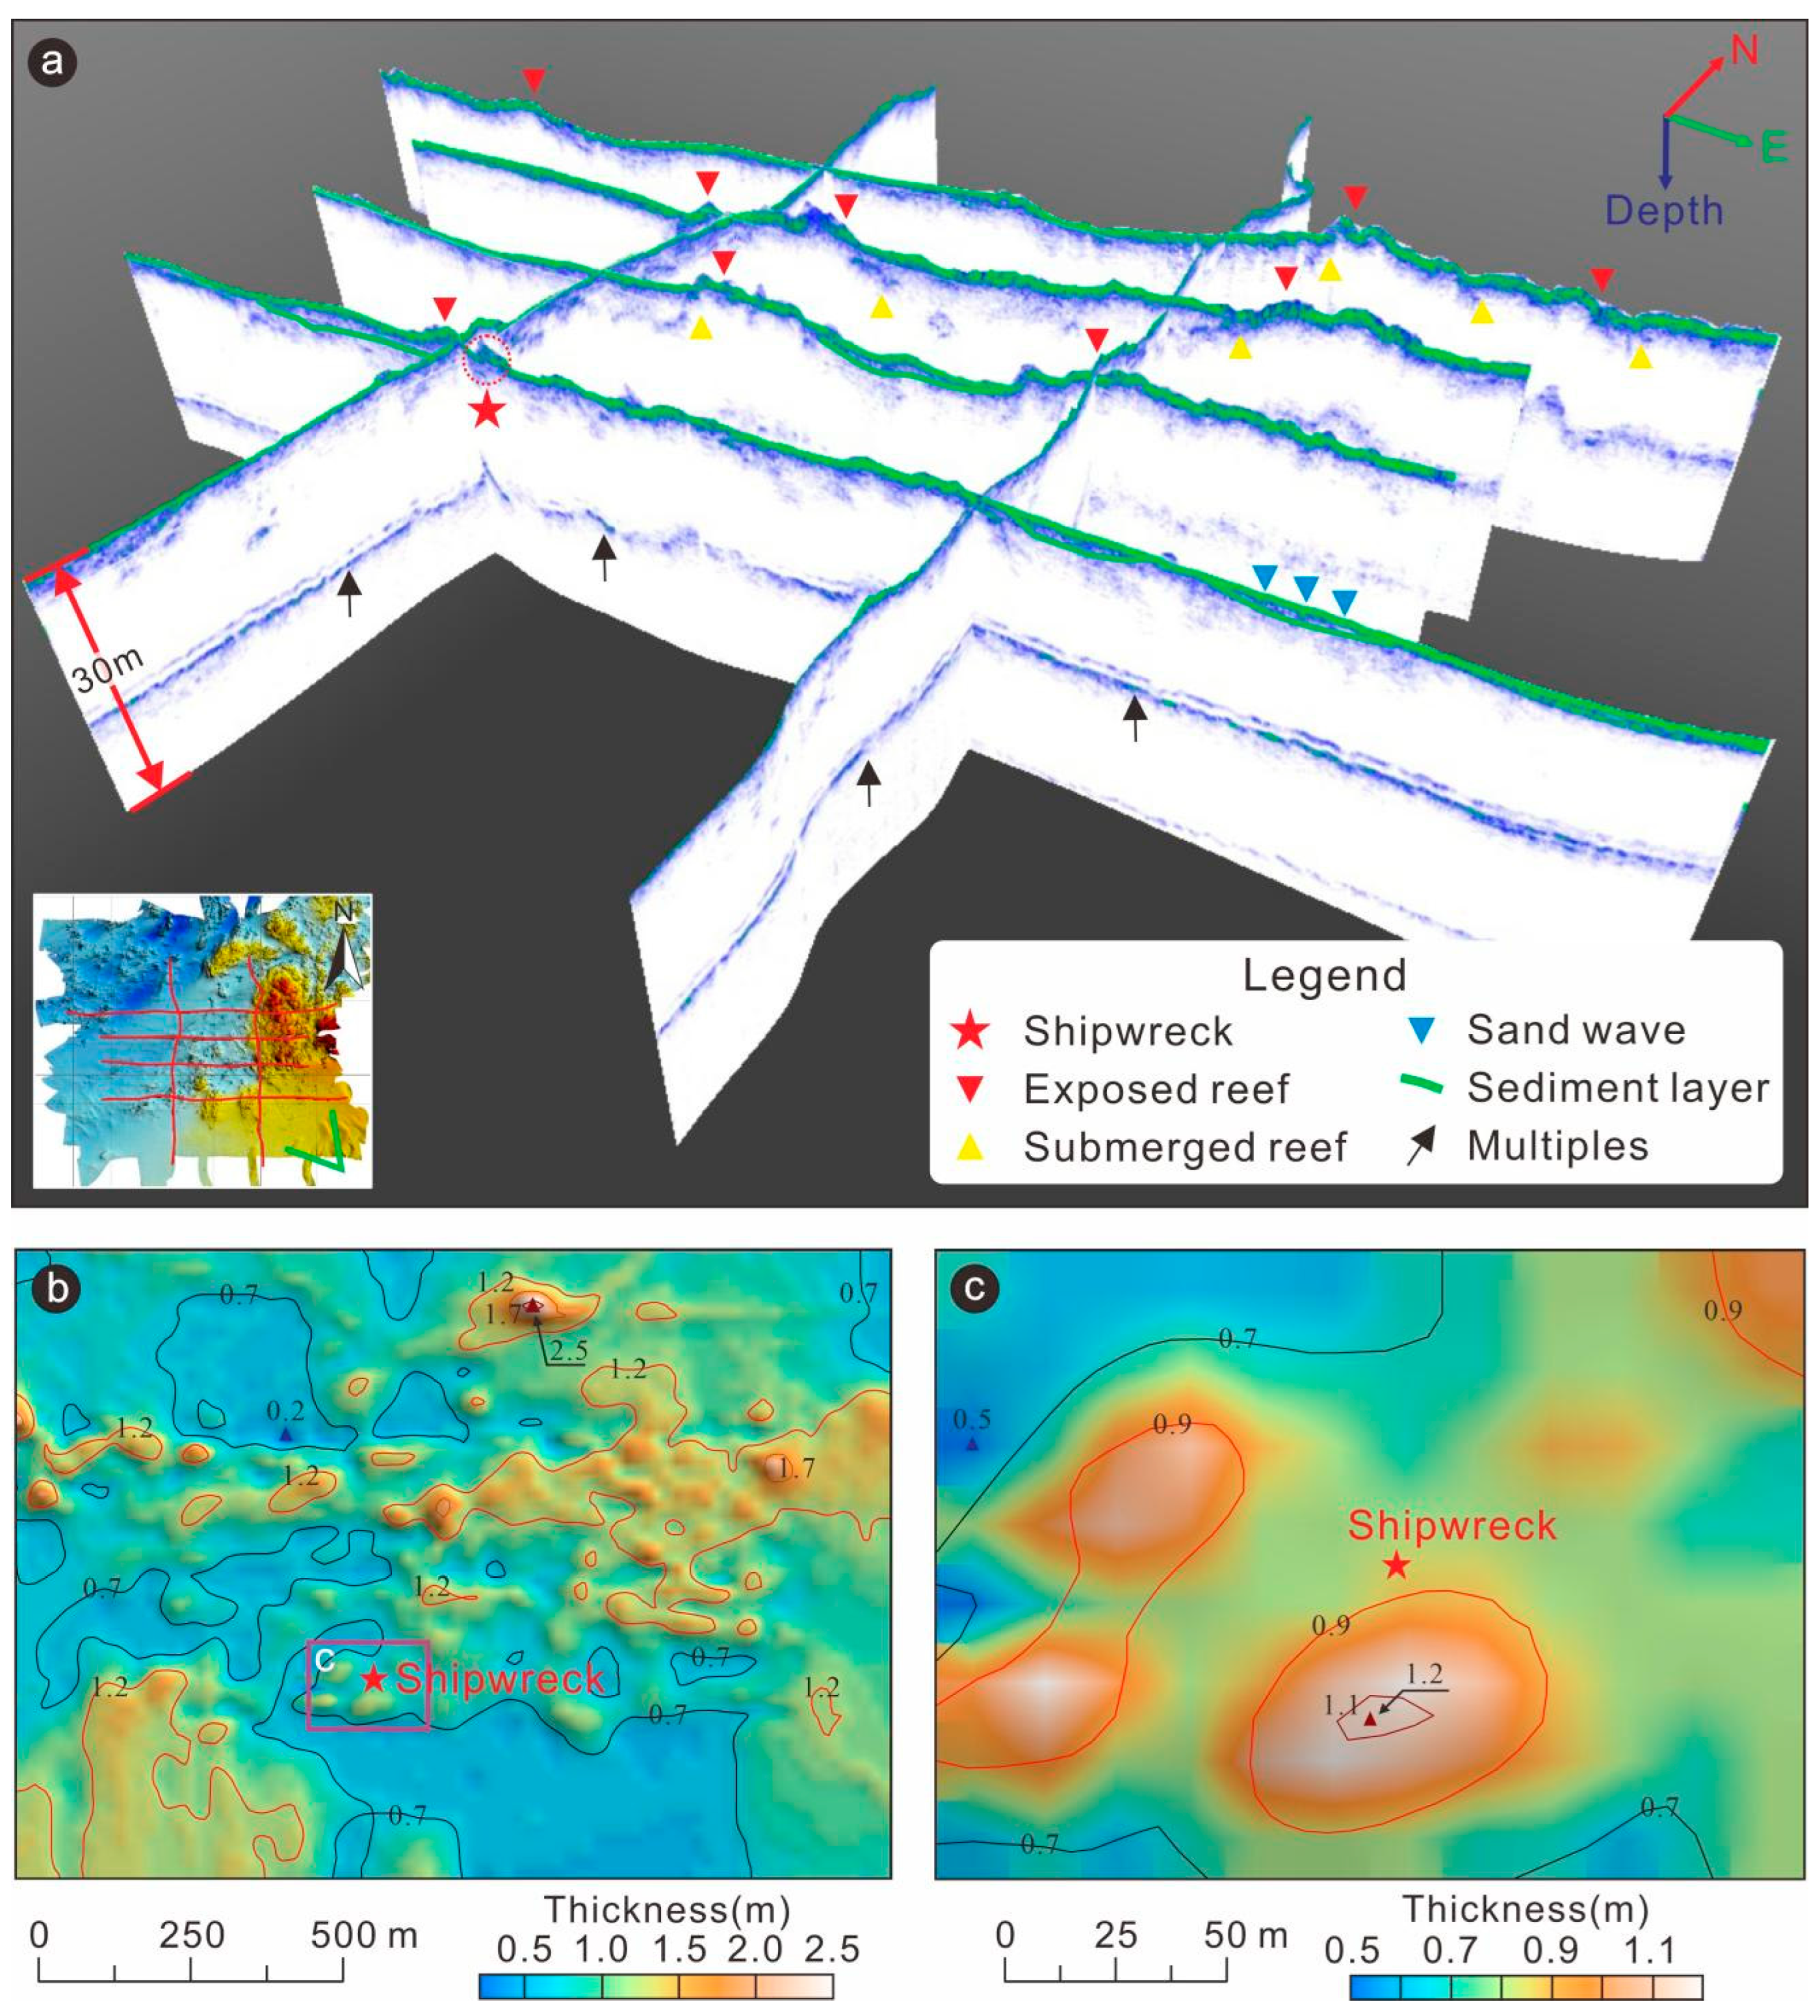
A 3D stratigraphic model constructed from SBPs visualized the spatial distribution of the exposed reefs, submerged reefs, sand waves, and sedimentary layers (Figure 5a). The exposed reefs, primarily in the northwest, appeared as continuous, high-amplitude, non-horizontal reflectors, indicating hard bedrock outcrops. The submerged reefs in the northeast exhibited discontinuous, localized, and high-reflection features, suggesting partially buried bedrock. Sand waves in the southeast are characterized by periodic, wavy reflectors associated with sediment migration under strong hydrodynamic conditions. Sedimentary layers were pervasive throughout the area and appeared as continuous, low-reflection, horizontal strata overlying the bedrock (Figure 5a).
Figure 5.
3D stratigraphic model of the archaeological survey area. (a) 3D stratigraphic model constructed from multiple SBP lines, revealing complex seafloor geomorphic features, including exposed reefs, submerged reefs, sand waves, sedimentary layers, and a shipwreck. (b) Sediment thickness distribution map showing spatial variations in sediment thickness across the study area. Thickness values were extracted from the SBP data and interpolated using kriging. (c) Close-up view of the shipwreck site displaying spatial variation in sediment thickness in the area.
Sediment thickness was unevenly distributed, ranging from 0.2 to 2.5 m. The northern and eastern regions exhibited thicker sediments (up to 2.5 m), representing primary deposition zones, whereas the southern and western regions were thinner (0.2–0.7 m). At the shipwreck site, sediment thickness was relatively thin (0.7–1.1 m), with a noticeable thinning directly above the structure (Figure 5c), suggesting localized scour and erosion caused by flow obstruction around the shipwreck.
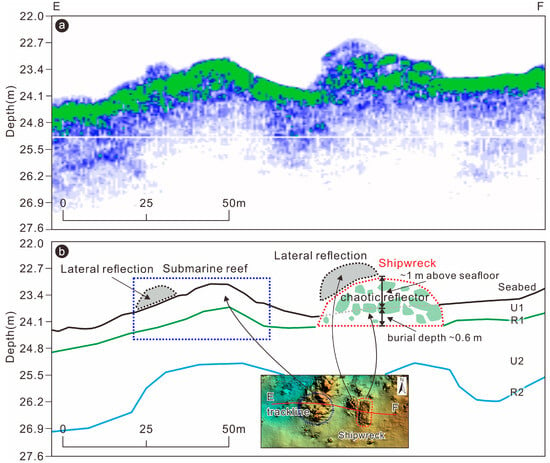
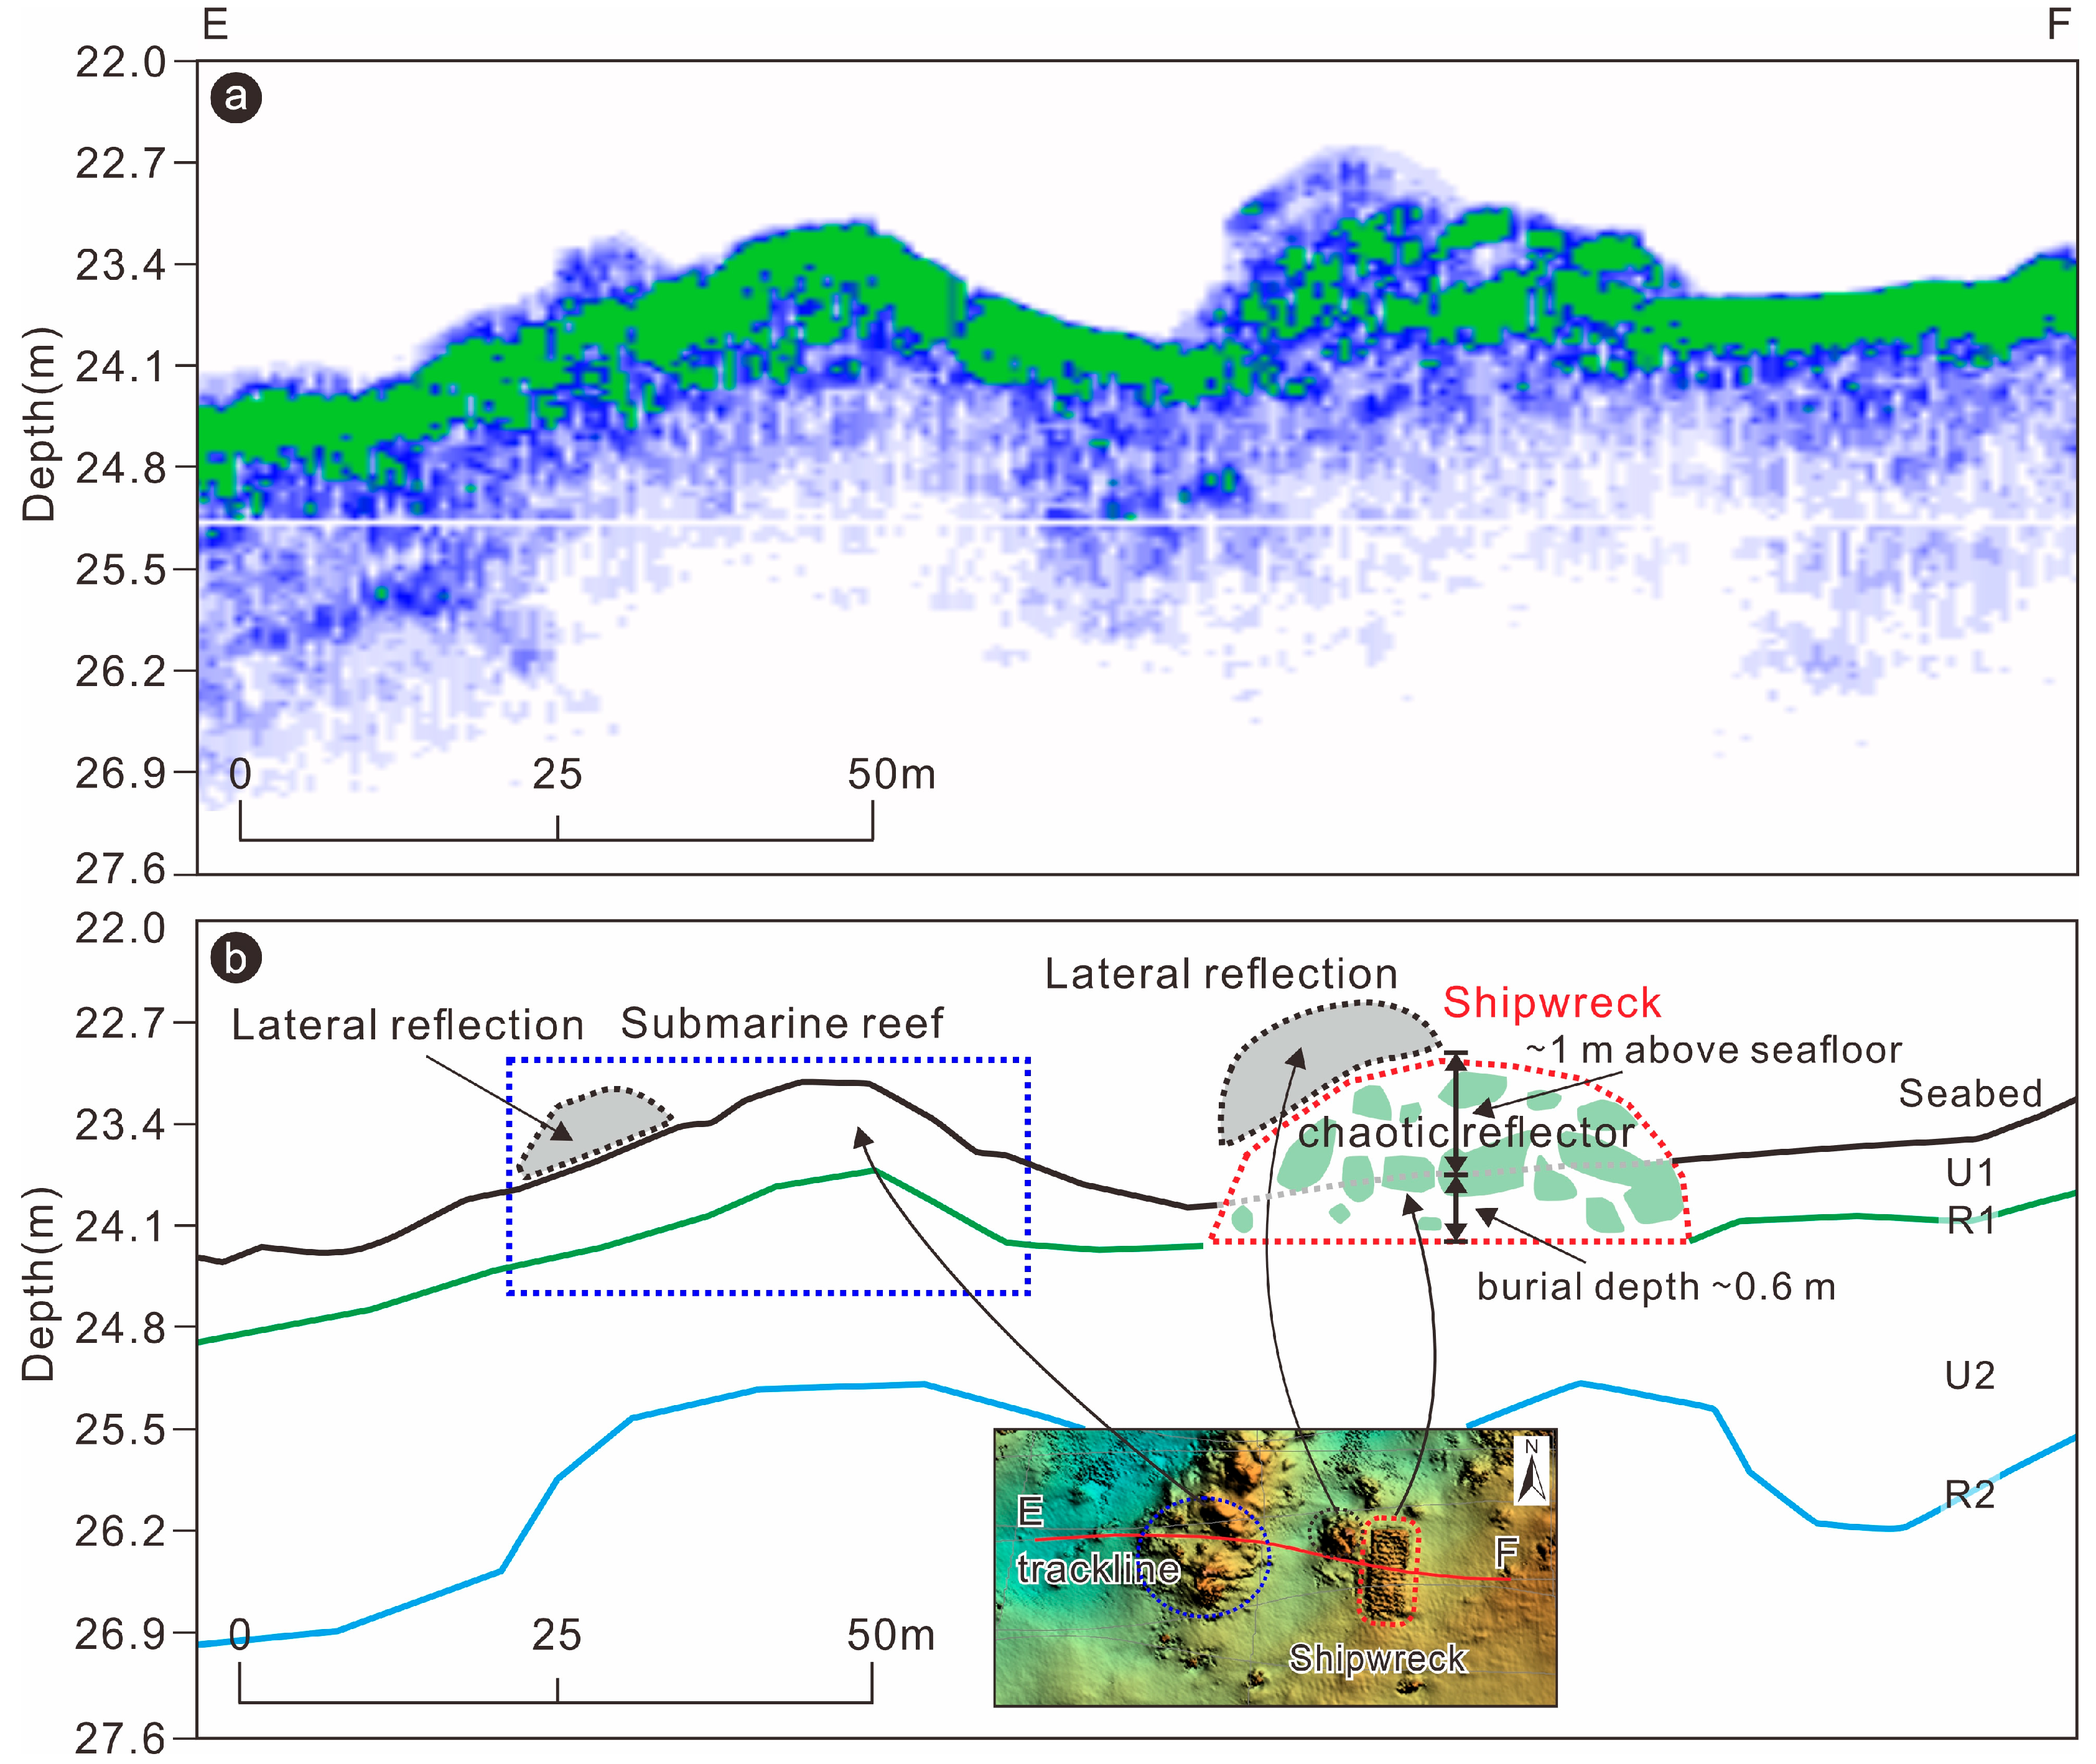
An SBP transecting the site (Line E–F) revealed the burial state (Figure 6). U1 was characterized by a homogeneous, continuous strong reflector, indicating a well-stratified sedimentary layer with good acoustic transparency (green in Figure 6a, corresponding to U1 in Figure 6b). U2 exhibited chaotic and discontinuous reflections, representing a dense basement (blue in Figure 6a, corresponding to U2 in Figure 6b). The suspected shipwreck (red dashed line) was in a semi-buried state, protruding ~1.0 m above the seabed and penetrating ~0.6 m into U1, with a lateral extent of ~12 m (Figure 6b). The top of the shipwreck showed discontinuous, strong reflections, whereas the interior was acoustically chaotic, likely indicating structural complexity. In addition, an exposed reef identified west of the shipwreck (blue dashed line) generated prominent lateral reflection effects, highlighting the complex local topography.
Figure 6.
Shipwreck characteristics identified using SBP data. (a) SBP data (Line EF) showing shipwreck reflection characteristics and shallow stratigraphic structure. The green and blue areas represent the upper sedimentary layer and lower substrate, respectively. (b) Interpretation of Figure 6a. The profile shows the seabed, continuous R1, discontinuous R2, and corresponding U1 and U2. The key features include an exposed reef (blue dashed box), a shipwreck (red dashed outline), and lateral reflection (black dashed outline). The interior of the shipwreck exhibited chaotic reflections. The inset in Figure 6a shows the location of the profile relative to the shipwreck, lateral reflection, and exposed reef.
3.1.4. Local Magnetic Anomaly Characteristics
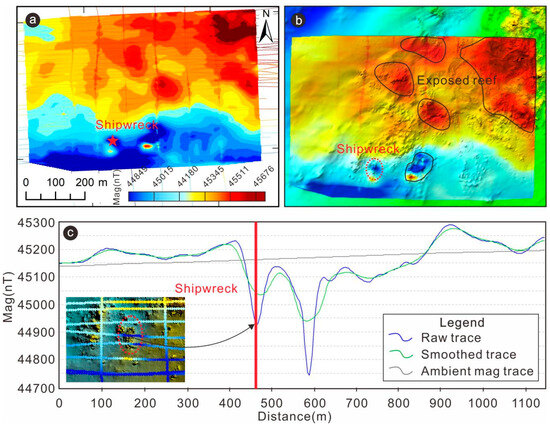
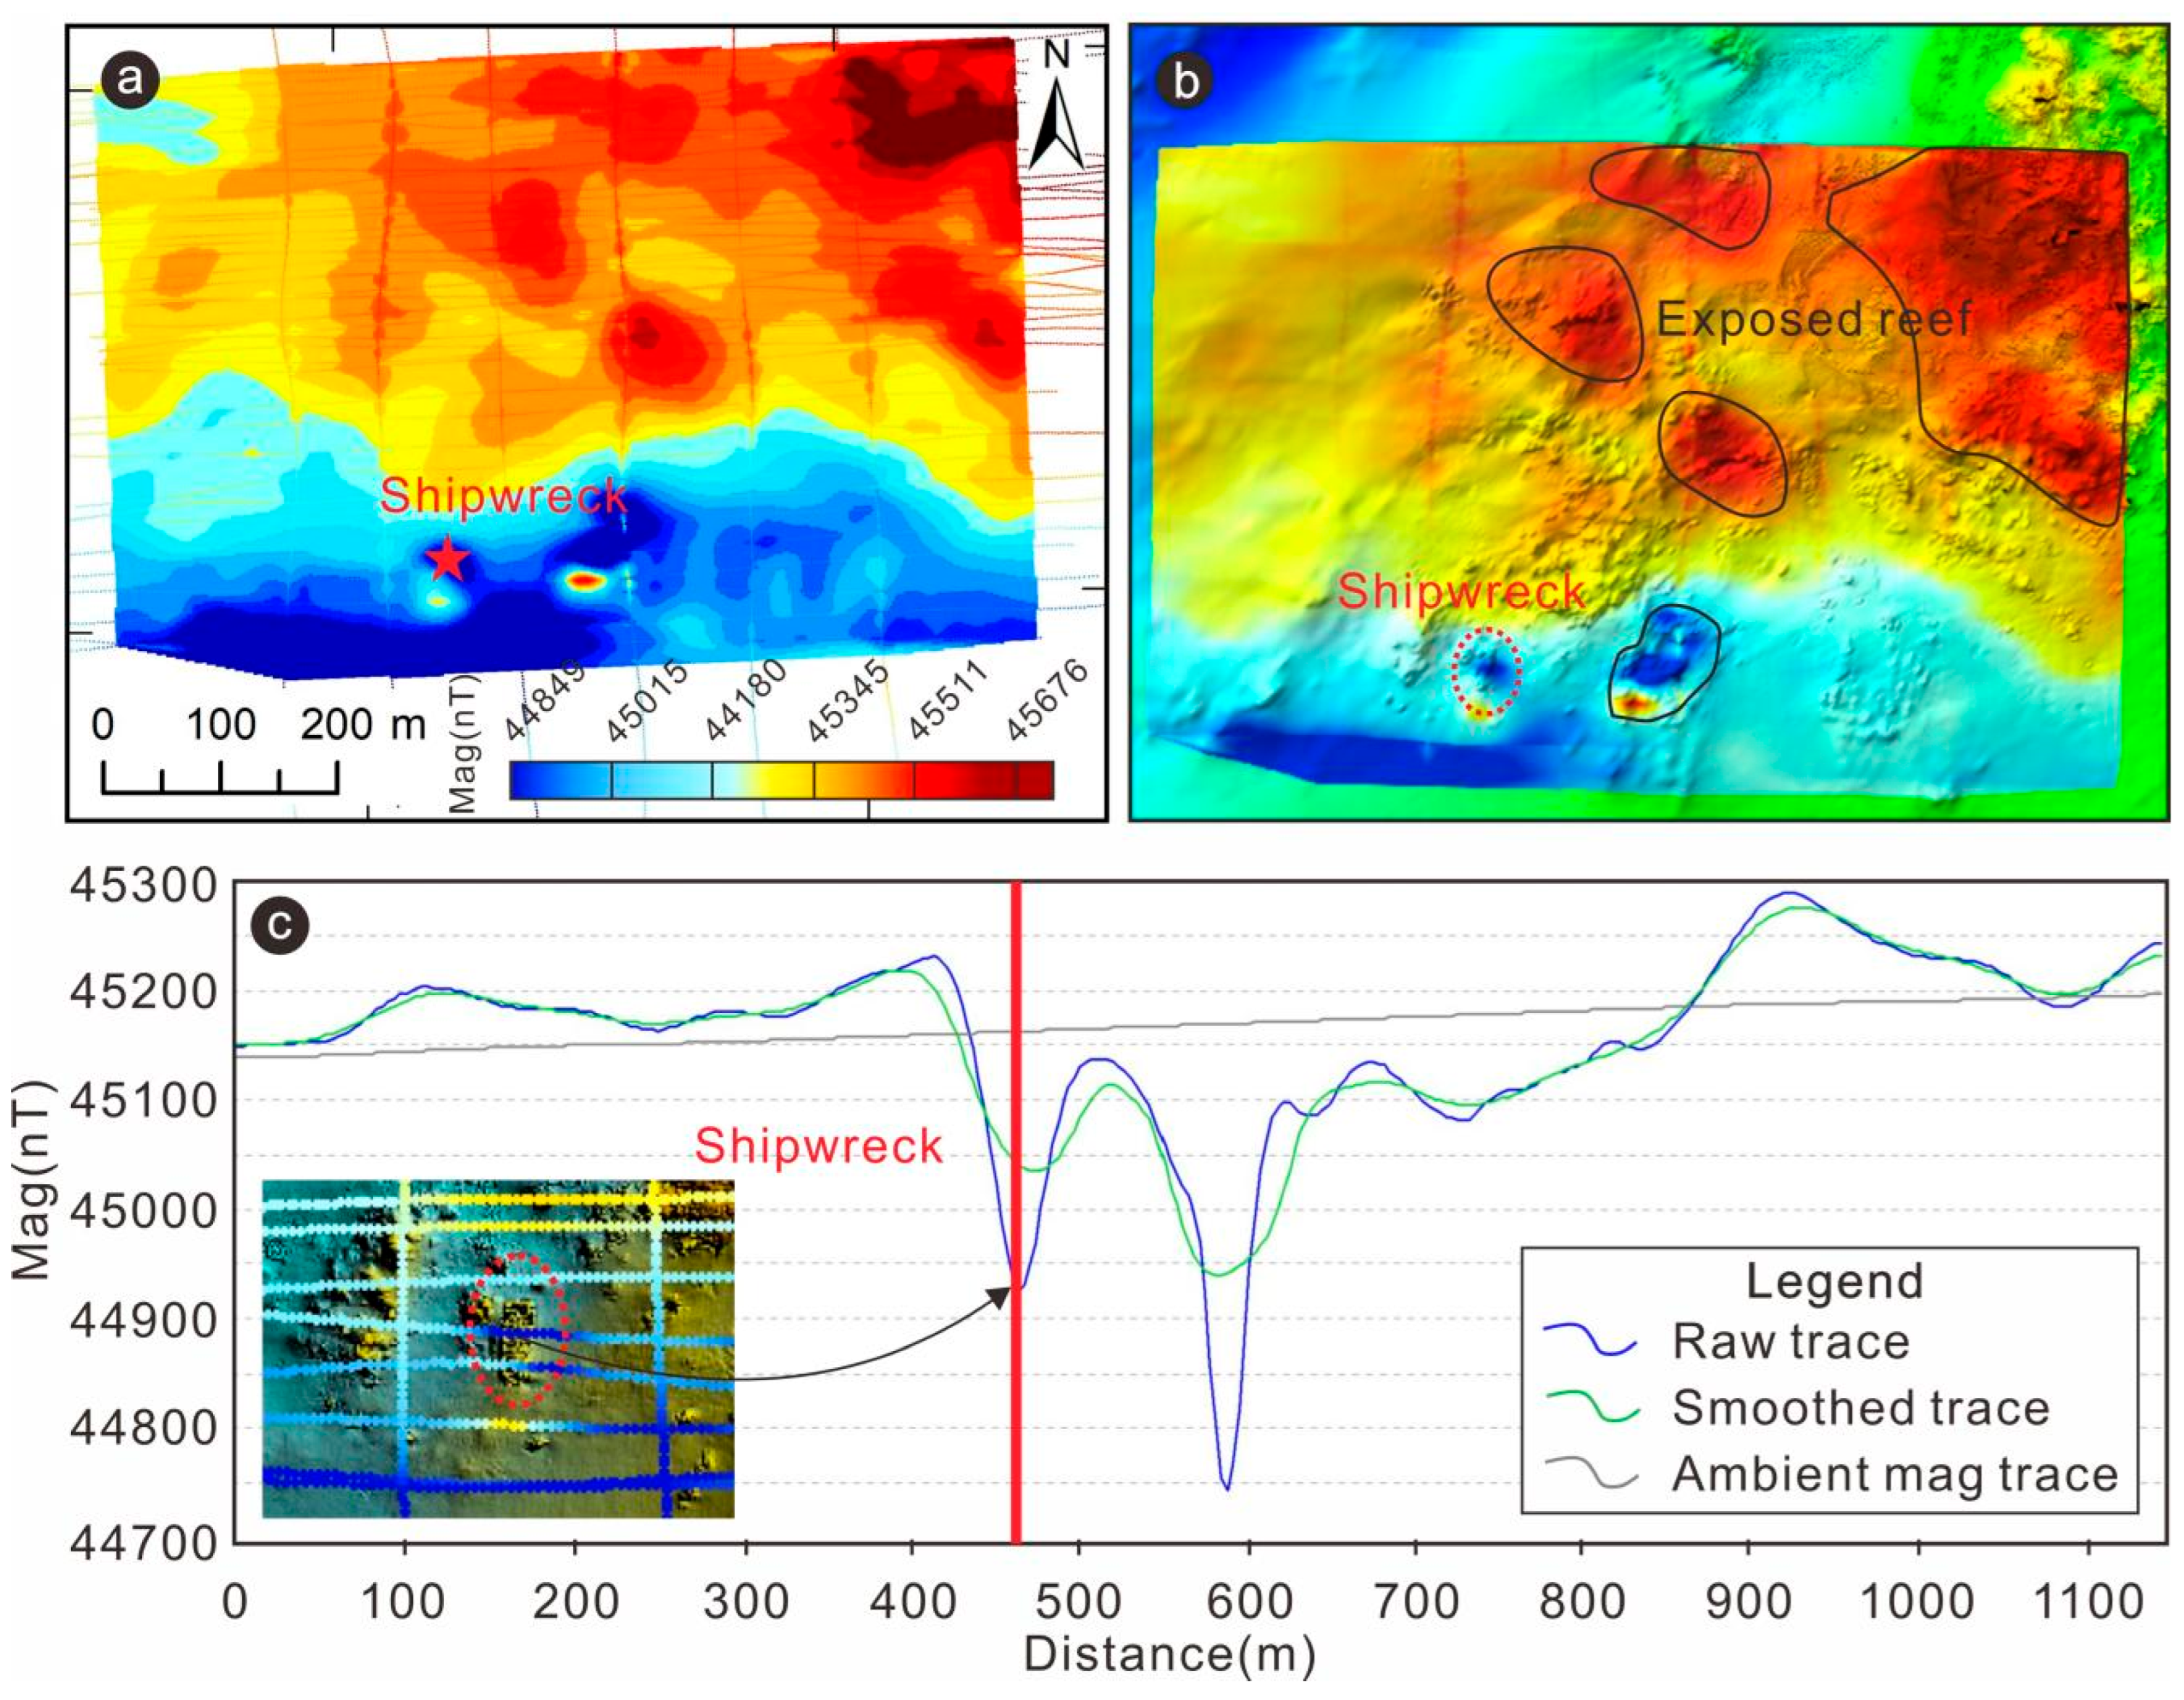
Magnetic data provided definitive evidence for discriminating the nature of the target. The magnetic total-field map revealed a sharp, steep-gradient negative anomaly (~44,950 nT) centered at the shipwreck location, strongly contrasting the high magnetic background (45,150–45,250 nT) of the surrounding area (Figure 7a). Overlaying the magnetic anomalies onto the multibeam terrain (Figure 7b) demonstrated that the highly positive anomalies spatially coincided with the exposed seabed reefs, indicating their origin as natural geological bodies containing magnetic minerals. Conversely, the negative anomaly at the shipwreck site did not correlate with the topographic relief, indicating a localized artificial ferromagnetic source superimposed on the regional geomagnetic field. The observed magnetic profile (Raw trace) clearly showed a localized negative anomaly over the shipwreck (Figure 7c), with a minimum value of ~44,950 nT, representing anomaly amplitudes of −210 nT (relative to the background/ambient value of 45,160 nT) and -95 nT (relative to the smoothed value of 45,045 nT. Following the international convention in magnetic surveying, a magnetic anomaly is defined as the observed total field minus the regional (background) field. In this study, the amplitude of −210 nT is adopted as the primary diagnostic anomaly amplitude, representing the total anomaly magnitude over the shipwreck site covered by the rigid protective frame.
Figure 7.
Magnetic anomaly characteristics of the archaeological area and shipwreck site. (a) Magnetic anomaly distribution map with a 2 m × 2 m grid generated by natural neighbor interpolation of raw marine magnetic observations, showing a significant magnetic anomaly at the shipwreck location (red star). (b) Overlay of magnetic anomalies (30% transparency) onto the 3D multibeam terrain, indicating that magnetic anomalies (black circle) closely correlate with protruding exposed reef topography, while the red dashed circle marks the location of the shipwreck site covered by a rigid protective frame. (c) Profile comparison of raw magnetic observations (Actually, the data are processed total magnetic field data, with the IGRF normal field not removed.), smoothed magnetic values, and ambient magnetic values along a line crossing the shipwreck site. The thick solid red line indicates a local magnetic anomaly at the shipwreck site. The inset in (c) shows the location of the shipwreck (red dashed circle).
3.2. Spatial Integration of Multi-Source Geophysical Characteristics
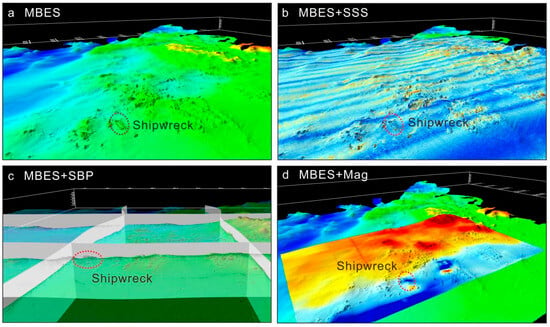
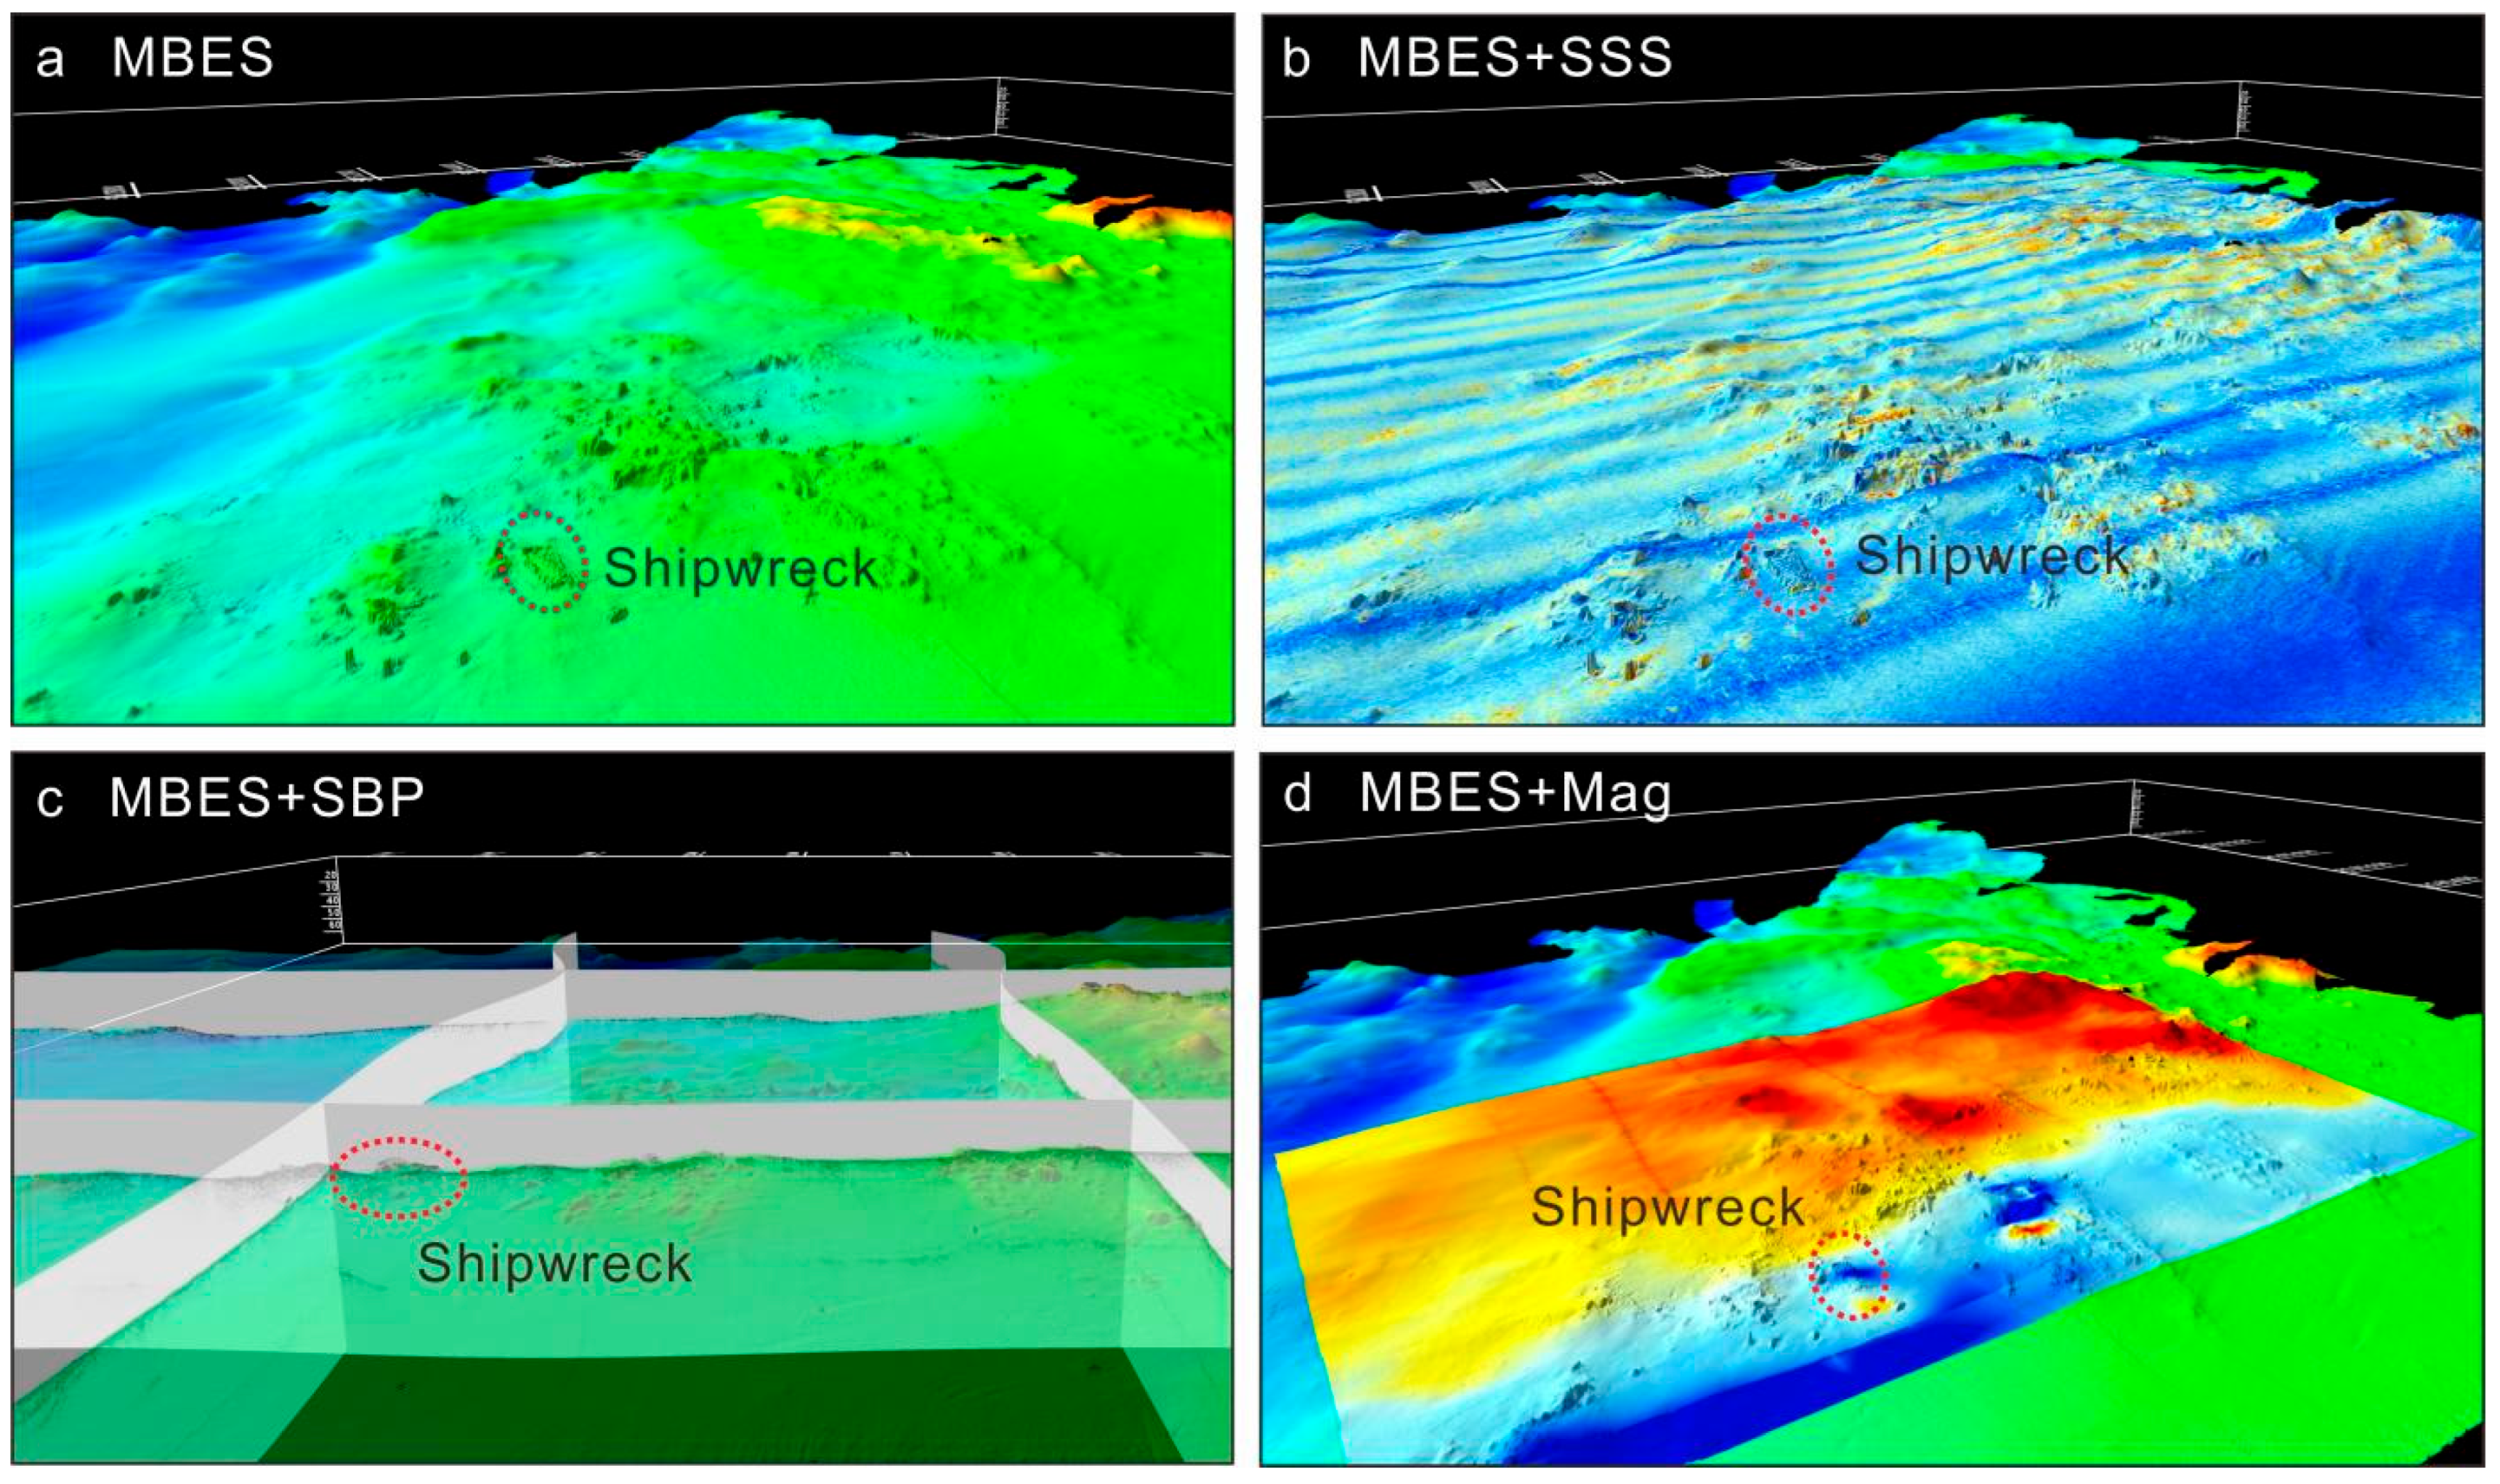
The integration of multi-source geophysical data within a unified spatial coordinate system enabled precise localization and detailed characterization of the shipwreck site. Multibeam bathymetry delineated the 3D morphology, revealing an irregular mound-like structure with clear contours and significant elevation changes, in contrast to the flat seabed (Figure 8a). SSS revealed finer textural details, highlighting parallel linear acoustic textures (Figure 8b). SBP confirmed the semi-buried state with a burial depth of 0.6 m (Figure 6 and Figure 8c). Marine magnetic data excluded interference from reef clusters, isolating the specific magnetic anomaly associated with the shipwreck (Figure 8d).
Figure 8.
Identification features of the shipwreck site based on multi-source geophysical data integration. (a) MBES data showing regional seafloor topography: The red dashed circle marks the suspected shipwreck area, which exhibits a distinct depth anomaly. (b) Overlay of MBES and SSS data: Draping techniques applied the acoustic texture to the 3D terrain, clearly visualizing seabed topographic relief and texture details of the shipwreck site covered by the rigid protective frame. (c) Overlay of MBES and SBP data revealing the depth and reflection characteristics of the shipwreck protective frame embedded within the sedimentary layer. (d) Overlay of MBES and marine magnetometer data, displaying the negative magnetic anomaly signature at the shipwreck site.
4. Discussion
4.1. Geo-Archaeological Interpretation of the Detection Results
The integration of multi-source acoustic and magnetic data in this study provides critical evidence for understanding the preservation status and formation processes of the Nan’ao I shipwreck site. In a complex bedrock reef geological setting, the regular mound-shaped morphology revealed by multibeam bathymetric data serves as the primary diagnostic feature for shipwreck identification, aligning with previous experience in utilizing 3D topography to detect artificial underwater targets [20,23]. Previous case studies indicate that the high backscatter intensity and parallel acoustic textures exhibited in the SSS imagery effectively delineate the remnant structures of the ship’s keel and decks [1,4]. Since being enclosed by a rigid protective frame after detailed investigations in 2010, Nan’ao I exhibits high backscatter and parallel linear textural patterns in SSS imagery; these acoustic signatures are thus interpreted as evidence of the shipwreck and its overlying protective frame.
The burial depth and micro-topographic features of the site reveal the influence of the dynamic environment on site evolution. The average burial depth of 0.6 m detected by SBP, coupled with the uneven distribution of surrounding sediments, confirms that the site is situated within an active sedimentary dynamic environment. According to the theory of underwater site formation processes, a shipwreck acts as a physical obstacle on the seabed, significantly altering the local bottom-current flow fields and inducing horseshoe and wake vortices, and leading to scour pits or erosion around the hull [37,38]. Such bottom-current scour explains why the hull is not completely buried and remains in a semi-exposed state over the long term [1,22].
Previous studies have demonstrated that extensive ferromagnetic artifacts within shipwrecks can produce distinctive magnetic anomaly responses [15,22]. The magnetic field data acquired in this study reveal a prominent negative anomaly response over the wreck site, which stands in sharp contrast to the positive magnetic responses over the surrounding reef areas. Given that the wreck site has been enclosed with a metal rigid protective frame, this contrast indicates that the rigid protective frame is the dominant contributor to the observed anomaly, while ferromagnetic artifacts inside the wreck play an extremely secondary role. At low magnetic latitudes, the effect of oblique magnetization causes highly susceptible magnetic bodies to generate dipole anomalies dominated by negative responses with weaker positive counterparts [13]. The negative response detected in this study is therefore consistent with the characteristic geomagnetic signature expected under such low-latitude oblique magnetization.
4.2. Advantages, Limitations, and Future Perspectives of the Multi-Source Integration Detection Method
Compared with single-detection methods, the acoustic–magnetic collaboration and multi-source data integration techniques employed in this study demonstrate significant advantages in identifying shipwreck targets in complex seafloor environments. The limited information dimensionality of single sensors often leads to missed detections or misjudgments. The core advantage of this study lies in establishing a multi-feature cross-validation mechanism within a unified geographic coordinate framework [39]. Through the systematic workflow of “MBES screening—SSS precision mapping—SBP/Magnetometer collaborative identification” [19], we defined four dimensions for determining a high-probability shipwreck: regular geometric morphology, artificial textures, shallow anomalous reflections, and localized magnetic responses. This approach focuses not merely on the spatial location of the target but also emphasizes the characterization of the geological background, material properties, and dynamic evolution process of the site [40,41], laying a foundation for physical modeling for subsequent high-precision 3D digital reconstruction [15]. Despite the improved identification accuracy and reliability afforded by multi-source geophysical integration, limitations remain in the detection of completely buried hulls and their internal structures. SBP signals attenuate rapidly when penetrating sandy or reef substrates, limiting their ability to resolve deeply buried objects beneath complex sedimentary layers. Moreover, this study is anchored on the known Nan’ao I shipwreck site. While the proposed approach successfully acquires and integrates the wreck’s geophysical expressions across MBES, SSS, SBP, and marine magnetometer datasets—thus offering a reference for detecting shipwrecks in comparable settings—its applicability is limited for small scattered artifacts or shapeless wreck remnants (small targets), fully buried wreck sites (non-exposed targets), and wooden structural sites (non-ferromagnetic targets), necessitating a re-assessment of its efficacy. In extreme scenarios—which commonly characterize unknown cultural heritage sites on the China continental shelf—where wrecks are entirely buried and have lost their original hull form, leaving only wooden remains and scattered artifacts, MBES, SSS, SBP, and marine magnetometry may all fail to register the site’s characteristic response. The effective detection of a shipwreck site is intimately tied to its size, material, and burial status, coupled with the spatial sensing and resolution capabilities of the survey equipment.
Future investigations in complex terrains with high turbidity and strong currents should incorporate advanced sensors, such as three-dimensional (3D) synthetic aperture sonar capable of greater penetration and high-resolution wide-swath imaging [2], as well as image enhancement algorithms or laser scanning systems specifically designed for turbid environments [42,43], to improve detection efficiency. Unmanned surface vessels [44,45,46], autonomous underwater vehicles [41,47,48], or drones should be employed to achieve high-density autonomous survey acquisition and obtain quasi-three-dimensional (3D) data volumes with higher precision. In addition, integrating deep learning algorithms for the automatic detection and classification of shipwreck sites [8,49,50,51] will reduce the uncertainty of manual interpretation and further advance the precision and intelligence level of UCH detection.
5. Conclusions
Addressing the challenges of detecting and identifying shipwreck sites in complex seafloor environments characterized by densely distributed exposed and submerged reefs, high water turbidity, and strong currents, this study used the investigation of the Ming Dynasty Nan’ao I shipwreck site off the coast of Guangdong, China, as a case study. We proposed and validated a high-precision “acoustic-magnetic” multi-source geophysical data integration detection method. The integration of multi-source data, including MBES, SSS, SBP, and marine magnetometry, effectively overcomes the limitations of single geophysical methods in complex nearshore environments, such as susceptibility to interference, limited information dimensions, and high interpretation ambiguity. This integration approach significantly enhances detection accuracy and reliability, enabling high-precision localization and refined characterization of shipwreck sites. The specific geophysical characteristics of the Nan’ao I shipwreck site are as follows: (a) Morphology: It manifests as a regular, north–south-trending, elongated mound measuring approximately 34 m in length and 12 m in width. (b) Acoustic texture: The surface exhibits a significantly high backscatter intensity and parallel linear acoustic textures. (c) Burial state: The shipwreck is in a semi-buried state with a burial depth of approximately 0.6 m, accompanied by intense local hydrodynamic scour features. (d) Magnetic signature: The site is distinguished from the reef background by a localized magnetic anomaly, exhibiting an amplitude of −210 nT relative to the ambient magnetic field. The technical workflow for detection, identification, and integration analysis based on the multi-source geophysical data established in this study provides a practical and robust technical solution for underwater shipwreck archaeology in complex nearshore environments. This methodology has significant reference value for promoting the efficient investigation and protection of UCH.
Author Contributions
Conceptualization and methodology, Y.L., J.C., Y.M. and H.L.; sample collection, J.C., H.L., Z.H., H.Z. and S.Z.; formal analysis, Y.L., J.C., D.X., S.Z. and Y.M.; writing—original draft preparation, Y.L.; writing—review and editing, J.C., H.Y. and Y.M. All authors have read and agreed to the published version of the manuscript.
Funding
This research was supported by the Guangdong S&T Program (Grant No. 2025B1111180002) and the Underwater Archaeological Survey Project of the Nan’ao II Wreck Site in Shantou, Guangdong (Grant No. 2023-H-SX-011).
Data Availability Statement
Data are available upon request from Y.L. (liyonghang@mail.cgs.gov.cn).
Conflicts of Interest
The authors declare no conflicts of interest.
References
- Geraga, M.; Christodoulou, D.; Eleftherakis, D.; Papatheodorou, G.; Fakiris, E.; Dimas, X.; Georgiou, N.; Kordella, S.; Prevenios, M.; Iatrou, M.; et al. Atlas of Shipwrecks in Inner Ionian Sea (Greece): A Remote Sensing Approach. Heritage 2020, 3, 1210–1236. [Google Scholar] [CrossRef] [Scilit]
- Ødegård, Ø.; Hansen, R.E.; Singh, H.; Maarleveld, T.J. Archaeological Use of Synthetic Aperture Sonar on Deepwater Wreck Sites in Skagerrak. J. Archaeol. Sci. 2018, 89, 1–13. [Google Scholar] [CrossRef] [Scilit]
- Plets, R.M.K.; Dix, J.K.; Adams, J.R.; Best, A.I. 3D Reconstruction of a Shallow Archaeological Site from High-Resolution Acoustic Imagery: The Grace Dieu. Appl. Acoust. 2008, 69, 399–411. [Google Scholar] [CrossRef] [Scilit][Green Version]
- Plets, R.; Quinn, R.; Forsythe, W.; Westley, K.; Bell, T.; Benetti, S.; McGrath, F.; Robinson, R. Using Multibeam Echo-Sounder Data to Identify Shipwreck Sites: Archaeological Assessment of the Joint Irish Bathymetric Survey Data. Int. J. Naut. Archaeol. 2011, 40, 87–98. [Google Scholar] [CrossRef] [Scilit]
- Masetti, G.; Calder, B. Remote Identification of a Shipwreck Site from MBES Backscatter. J. Environ. Manag. 2012, 111, 44–52. [Google Scholar] [CrossRef] [Scilit] [PubMed]
- Grządziel, A. Using Remote Sensing Data to Identify Large Bottom Objects: The Case of World War II Shipwreck of General von Steuben. Geosciences 2020, 10, 240. [Google Scholar] [CrossRef] [Scilit]
- Ferentinos, G.; Fakiris, E.; Christodoulou, D.; Geraga, M.; Dimas, X.; Georgiou, N.; Kordella, S.; Papatheodorou, G.; Prevenios, M.; Sotiropoulos, M. Optimal Sidescan Sonar and Subbottom Profiler Surveying of Ancient Wrecks: The ‘Fiskardo’ Wreck, Kefallinia Island, Ionian Sea. J. Archaeol. Sci. 2020, 113, 105032. [Google Scholar] [CrossRef] [Scilit]
- Wen, X.; Wang, J.; Cheng, C.; Zhang, F.; Pan, G. Underwater Side-Scan Sonar Target Detection: YOLOv7 Model Combined with Attention Mechanism and Scaling Factor. Remote Sens. 2024, 16, 2492. [Google Scholar] [CrossRef] [Scilit]
- Quinn, R.; Adams, J.R.; Dix, J.K.; Bull, J.M. The Invincible (1758) Site-an Integrated Geophysical Assessment. Int. J. Naut. Archaeol. 1998, 27, 126–138. [Google Scholar] [CrossRef] [Scilit]
- Winton, T. Quantifying Depth of Burial and Composition of Shallow Buried Archaeological Material: Integrated Sub-Bottom Profiling and 3D Survey Approaches. In 3D Recording and Interpretation for Maritime Archaeology; McCarthy, J.K., Benjamin, J., Winton, T., Van Duivenvoorde, W., Eds.; Coastal Research Library; Springer International Publishing: Cham, Switzerland, 2019; Volume 31, pp. 155–174. ISBN 978-3-030-03634-8. [Google Scholar]
- Kizildağ, N. Mapping and Recording of Ancient Shipwrecks by Using Marine Remote Sensing Techniques: Case Studies from Turkish Coasts. Mar. Sci. Technol. Bull. 2022, 11, 331–342. [Google Scholar] [CrossRef] [Scilit]
- Gutowski, M.; Malgorn, J.; Vardy, M. 3D Sub-Bottom Profiling-High Resolution 3D Imaging of Shallow Subsurface Structures and Buried Objects. In Proceedings of the OCEANS 2015—Genova; IEEE: Genova, Italy, 2015; pp. 1–7. [Google Scholar]
- Boyce, J.I.; Reinhardt, E.G.; Raban, A.; Pozza, M.R. Marine Magnetic Survey of a Submerged Roman Harbour, Caesarea Maritima, Israel. Int. J. Naut. Archaeol. 2004, 33, 122–136. [Google Scholar] [CrossRef] [Scilit]
- Gearhart, R. Archaeological Interpretation of Marine Magnetic Data; Oxford University Press: Oxford, UK, 2011. [Google Scholar]
- Gkionis, P.; Papatheodorou, G.; Geraga, M. The Benefits of 3D and 4D Synthesis of Marine Geophysical Datasets for Analysis and Visualisation of Shipwrecks, and for Interpretation of Physical Processes over Shipwreck Sites: A Case Study off Methoni, Greece. J. Mar. Sci. Eng. 2021, 9, 1255. [Google Scholar] [CrossRef] [Scilit]
- Bull, J.M.; Quinn, R.; Dix, J.K. Reflection Coefficient Calculation from Marine High Resolution Seismic Reflection (Chirp) Data and Application to an Archaeological Case Study. Mar. Geophys. Res. 1998, 20, 1–11. [Google Scholar] [CrossRef] [Scilit]
- Plets, R.M.K.; Dix, J.K.; Adams, J.R.; Bull, J.M.; Henstock, T.J.; Gutowski, M.; Best, A.I. The Use of a High-Resolution 3D Chirp Sub-Bottom Profiler for the Reconstruction of the Shallow Water Archaeological Site of the Grace Dieu (1439), River Hamble, UK. J. Archaeol. Sci. 2009, 36, 408–418. [Google Scholar] [CrossRef] [Scilit]
- Beltrame, C.; Costa, E. 3D Survey and Modelling of Shipwrecks in Different Underwater Environments. J. Cult. Herit. 2018, 29, 82–88. [Google Scholar] [CrossRef] [Scilit]
- Fang, X.; Zheng, J.; Zhou, S.; Huang, Z.; Liu, B.; Chen, P.; Xu, J. Applicability of Traditional Acoustic Technology for Underwater Archeology: A Case Study of Model Detection in Xiamen Bay. Acoustics 2025, 7, 59. [Google Scholar] [CrossRef] [Scilit]
- Grządziel, A. Using Remote Sensing Techniques to Document and Identify the Largest Underwater Object of the Baltic Sea: Case Study of the Only German Aircraft Carrier, Graf Zeppelin. Remote Sens. 2020, 12, 4076. [Google Scholar] [CrossRef] [Scilit]
- Wunderlich, J.; Wendt, G.; Müller, S. High-Resolution Echo-Sounding and Detection of Embedded Archaeological Objects with Nonlinear Sub-Bottom Profilers. Mar. Geophys. Res. 2005, 26, 123–133. [Google Scholar] [CrossRef] [Scilit]
- Quinn, R.; Breen, C.; Forsythe, W.; Barton, K.; Rooney, S.; O’Hara, D. Integrated Geophysical Surveys of the French Frigate La Surveillante (1797), Bantry Bay, Co. Cork, Ireland. J. Archaeol. Sci. 2002, 29, 413–422. [Google Scholar] [CrossRef] [Scilit]
- Menna, F.; Agrafiotis, P.; Georgopoulos, A. State of the Art and Applications in Archaeological Underwater 3D Recording and Mapping. J. Cult. Herit. 2018, 33, 231–248. [Google Scholar] [CrossRef] [Scilit]
- Papatheodorou, G.; Geraga, M.; Ferentinos, G. The Navarino Naval Battle Site, Greece-an Integrated Remote-Sensing Survey and a Rational Management Approach. Int. J. Naut. Archaeol. 2005, 34, 95–109. [Google Scholar] [CrossRef] [Scilit]
- Missiaen, T.; Sakellariou, D.; Flemming, N.C. Survey Strategies and Techniques in Underwater Geoarchaeological Research: An Overview with Emphasis on Prehistoric Sites. In Under the Sea: Archaeology and Palaeolandscapes of the Continental Shelf; Bailey, G.N., Harff, J., Sakellariou, D., Eds.; Coastal Research Library; Springer International Publishing: Cham, Switzerland, 2017; Volume 20, pp. 21–37. ISBN 978-3-319-53158-8. [Google Scholar]
- Cui, Y.; Li, F.; Shi, J.; Song, Z.; Lin, T.; Wang, Z.; Luo, J.; Yu, W.; Chen, B.; Liu, Z. 2007 Survey and Excavation of the Ship Nan’ao No. 1 of the Ming Dynasty. Cult. Relics 2011, 5, 25–47. (In Chinese) [Google Scholar]
- Song, Z.; Li, F. Porcelain Unearthed from the Ming Dynasty Shipwreck Nan’ao I in 2010. Cult. Relics 2012, 3, 60–78. (In Chinese) [Google Scholar]
- Cui, Y. The Ming Dynasty Shipwreck Nan’ao I in Shantou City, Guangdong Province. Archaeology 2011, 7, 39–46. (In Chinese) [Google Scholar]
- Ji, D. Re-study on the Nan’ao I Shipwreck. Huaxia Archaeol. 2019, 2, 83–91. (In Chinese) [Google Scholar] [CrossRef]
- Ding, J. Nan’ao I Shipwreck: Location, Connotation and Time. Museum 2018, 2, 39–49. (In Chinese) [Google Scholar] [CrossRef] [Scilit]
- Guo, X. The Age, Route, and Nature of the Nan’ao I Shipwreck. Archaeol. Cult. Relics 2016, 6, 118–132. (In Chinese) [Google Scholar]
- Guangdong Provincial Institute of Cultural Relics and Archaeology; Guangdong Museum; National Center for Underwater Cultural Heritage; State Administration of Cultural Heritage. Lone Sail Legacy: Catalogue of Fine Cultural Relics Unearthed from Nan’ao I. In Series of Underwater Archaeology of Nan’ao I, 1st ed.; Science Press: Beijing, China, 2014; ISBN 978-7-03-042471-6. (In Chinese) [Google Scholar]
- Kongsberg Maritime. EM 2040P MKII Multibeam Echo Sounder Technical Specifications; Kongsberg Maritime: Kongsberg, Norway, 2022. [Google Scholar]
- EdgeTech. Edgetech 4200 Series Side Scan Sonar System Technical Specifications; EdgeTech: West Wareham, MA, USA, 2016. [Google Scholar]
- Innomar. SES2000 Narrow-Beam Parametric Sub-Bottom Profilers User’s Manual; Innomar: Rostock, Germany, 2018. [Google Scholar]
- Marine Magnetics. SeaSPY2 Marine Magnetometer Brochure; Marine Magnetics: Markham, ON, Canada, 2023. [Google Scholar]
- Quinn, R. The Role of Scour in Shipwreck Site Formation Processes and the Preservation of Wreck-Associated Scour Signatures in the Sedimentary Record—Evidence from Seabed and Sub-Surface Data. J. Archaeol. Sci. 2006, 33, 1419–1432. [Google Scholar] [CrossRef] [Scilit]
- Quinn, R.; Smyth, T.A.G. Processes and Patterns of Flow, Erosion, and Deposition at Shipwreck Sites: A Computational Fluid Dynamic Simulation. Archaeol. Anthropol. Sci. 2018, 10, 1429–1442. [Google Scholar] [CrossRef] [Scilit]
- Gkionis, P.; Papatheodorou, G.; Geraga, M.; Fakiris, E.; Christodoulou, D.; Tranaka, K. A Marine Geoarchaeological Investigation for the Cultural Anthesis and the Sustainable Growth of Methoni, Greece. J. Cult. Herit. 2020, 42, 158–170. [Google Scholar] [CrossRef] [Scilit]
- Bates, C.R.; Lawrence, M.; Dean, M.; Robertson, P. Geophysical Methods for Wreck-Site Monitoring: The Rapid Archaeological Site Surveying and Evaluation (RASSE) Programme: Evaluating Geophysical Methods for Wreck-Site Monitoring. Int. J. Naut. Archaeol. 2011, 40, 404–416. [Google Scholar] [CrossRef] [Scilit]
- Ravnås, H.H.; Olsen, T.M.; Weibull, W.W.; Reiersen, H.; Ditta, M.; Vivås, A.S. Marine Geophysical Survey of a Medieval Shipwreck in Shallow Waters Using an Autonomous Surface Vehicle: A Case Study from Avaldsnes, Norway. J. Marit. Archaeol. 2023, 18, 707–731. [Google Scholar] [CrossRef] [Scilit]
- Davidde Petriaggi, B.; Gomez De Ayala, G. Laser Scanner Reliefs of Selected Archeological Structures in the Submerged Baiae (Naples). Int. Arch. Photogramm. Remote Sens. Spat. Inf. Sci. 2015, XL-5/W5, 79–83. [Google Scholar] [CrossRef] [Scilit][Green Version]
- Tian-Yuan Shih, P.; Chen, Y.-H.; Chen, J.-C. Historic Shipwreck Study in Dongsha Atoll with Bathymetric LiDAR. Archaeol. Prospect. 2014, 21, 139–146. [Google Scholar] [CrossRef] [Scilit]
- Li, Y.; Wen, M.; Wan, P.; Mu, Z.; Wu, D.; Chen, J.; Zhou, H.; Zhang, S.; Yao, H. Deformable USV and Lightweight ROV Collaboration for Underwater Object Detection in Complex Harbor Environments: From Acoustic Survey to Optical Verification. J. Mar. Sci. Eng. 2025, 13, 1862. [Google Scholar] [CrossRef] [Scilit]
- Merkouris, K.; Geraga, M.; Dimas, X.; Vlachopoulos, A.; Papatheodorou, G. Marine Geo-Archaeological Mapping Using Unmanned Surface Vehicle (USV). Case Study: Ancient Semi-Submerged Settlement of Grotta Naxos, Greece. J. Archaeol. Sci. Rep. 2025, 66, 105274. [Google Scholar] [CrossRef] [Scilit]
- Stanghellini, G.; Del Bianco, F.; Gasperini, L. OpenSWAP, an Open Architecture, Low Cost Class of Autonomous Surface Vehicles for Geophysical Surveys in the Shallow Water Environment. Remote Sens. 2020, 12, 2575. [Google Scholar] [CrossRef] [Scilit]
- Bingham, B.; Foley, B.; Singh, H.; Camilli, R.; Delaporta, K.; Eustice, R.; Mallios, A.; Mindell, D.; Roman, C.; Sakellariou, D. Robotic Tools for Deep Water Archaeology: Surveying an Ancient Shipwreck with an Autonomous Underwater Vehicle. J. Field Robot. 2010, 27, 702–717. [Google Scholar] [CrossRef] [Scilit]
- Olsen, T.M.; Weibull, W.; Escalona, A.; Vivås, A.S. A Novel Approach for Autonomous Densely Spaced Acquisition of Buried Objects in Intertidal Environments-Field Examples from Avaldsnes, Norway. Archaeol. Prospect. 2025, 32, 59–76. [Google Scholar] [CrossRef] [Scilit]
- Yu, Y.; Zhao, J.; Gong, Q.; Huang, C.; Zheng, G.; Ma, J. Real-Time Underwater Maritime Object Detection in Side-Scan Sonar Images Based on Transformer-YOLOv5. Remote Sens. 2021, 13, 3555. [Google Scholar] [CrossRef] [Scilit]
- Tang, Y.; Wang, L.; Jin, S.; Zhao, J.; Huang, C.; Yu, Y. AUV-Based Side-Scan Sonar Real-Time Method for Underwater-Target Detection. J. Mar. Sci. Eng. 2023, 11, 690. [Google Scholar] [CrossRef] [Scilit]
- Wei, C.; Bai, Y.; Liu, C.; Zhu, Y.; Wang, C.; Li, X. Unsupervised Underwater Shipwreck Detection in Side-Scan Sonar Images Based on Domain-Adaptive Techniques. Sci. Rep. 2024, 14, 12687. [Google Scholar] [CrossRef] [Scilit] [PubMed]

Disclaimer/Publisher’s Note: The statements, opinions and data contained in all publications are solely those of the individual author(s) and contributor(s) and not of MDPI and/or the editor(s). MDPI and/or the editor(s) disclaim responsibility for any injury to people or property resulting from any ideas, methods, instructions or products referred to in the content. |
© 2026 by the authors. Licensee MDPI, Basel, Switzerland. This article is an open access article distributed under the terms and conditions of the Creative Commons Attribution (CC BY) license.