


Highlights
What are the main findings?
- Even when embedded within the same synoptic system—the Northeast China Cold Vortex—differences in mesoscale environmental conditions can lead to markedly distinct triggering and maintenance mechanisms for squall lines. SL1 is sustained primarily by strong mesoscale boundary-layer forcing characterized by the superposition of gust fronts and convergence lines, with its maintenance governed by the Rotunno–Klemp–Weisman (RKW) balance between the cold pool and low-level wind shear. In contrast, SL2 is triggered within the overlapping zone of a temperature front and a dew-point front, further reinforced by topographic uplift. Its subsequent evolution diverges between the northern and southern segments due to disparities in their respective thermodynamic conditions.
- SL1 may have influenced SL2 via its cold pool and associated circulations. Outflow from SL1 triggered secondary convection and additional cold outflow. Together with the easterly flow north of the vortex, this indirectly modifies the low-level convergence ahead of SL2.
What are the implications of the main findings?
- This study deepens our understanding of the environment-dependent evolution in multiple squall-line systems under similar large-scale backgrounds. It highlights the critical role of combined diagnostic analysis—including mesoscale thermodynamic parameters (CAPE, LCL, cold pool–environment temperature difference) and dynamic conditions (vertical wind shear, RKW balance)—in squall-line forecasting.
- For monitoring and warning of dual or multiple squall-line events, forecasters must account for the remote, indirect effects of pre-existing convective system cold pools and their modification of the thermodynamic environment for subsequent systems. This case provides a useful reference for refined forecasting.
Abstract
Due to system interactions, the formation and maintenance of dual squall lines are more complex than for single squall lines. In this study, we use upper-air soundings, ERA5 reanalysis data, high-density surface automatic weather station observations, and Doppler radar data to analyze a dual squall-line system that occurred over North China on 13 June 2022 under the Northeast China Cold Vortex. We focus on the differences between the two squall lines in mesoscale environments, convective triggering mechanisms, and maintenance processes. The main results are as follows: (1) The dual squall-line event occurred in different sectors of the Northeast China Cold Vortex, with both lines exhibiting a “dry-cold aloft, warm-moist below” stratification. However, significant spatiotemporal differences in mesoscale thermodynamic and dynamic conditions across Hebei and Shandong provinces led to distinct evolutionary pathways between the two squall lines. (2) Squall Line 1 (SL1) was triggered by the superposition of cold-pool outflow from convective cells over the Bohai Bay and convergence lines associated with surface cyclonic circulations. Squall Line 2 (SL2) was triggered by the thermal instability in the overlapping region of the temperature and dew-point fronts on the eastern slope of the Taihang Mountains, in conjunction with topographic uplift driven by the easterly flow. (3) This case study shows that squall-line maintenance depends not only on environmental CAPE and vertical wind shear but may also be closely related to the coordinated interplay between local thermal conditions and low-level shear. SL1, situated in a high-CAPE, low-LCL warm-moist environment, experienced relatively weak low-level shear; however, the ratio of cold-pool propagation speed to low-level shear remained near the RKW optimum, favoring persistence. Additionally, cold-pool spreading on the southern flank triggered new convection that merged into the southern end of the squall line, enhancing the cold pool via evaporative cooling and further promoting longevity. By contrast, SL2 displayed a pronounced north–south disparity: the northern segment failed to satisfy RKW balance due to insufficient cold-pool propagation relative to shear, leading to rapid echo dissipation; the southern segment, featuring an overly strong cold pool and low-CAPE, high-LCL conditions, inhibited deep convection. As a result, SL2 gradually split due to the spatial mismatch of thermodynamic and dynamic conditions along its north–south extent.
1. Introduction
The cold vortex is a deep low-pressure system characterized by a colder core than its surroundings (also referred to as a cut-off low [1]) and is a key synoptic system that triggers severe convective weather in China [2]. Cold vortices are most evident at the 500 hPa [3], though some also display well-defined structures at 200 hPa [4]. Classified by impacted regions, China is mainly affected by cold vortices such as the Northeast China Cold Vortex, the Mongolian Cold Vortex, and the North China Cold Vortex [5,6]. Notably, Northeast China represents not only the most active cold vortex zone domestically [7] but also one of the global hotspots for cold vortex occurrence [1,3,4]. Among the diverse severe convective systems generated within cold vortex environments [8,9,10], squall lines are mesoscale convective systems consisting of linearly or quasi-linearly organized thunderstorm cells [11]. These systems have attracted sustained research interest due to their high frequency, large horizontal scale, strong organization, prolonged duration, and their tendency to produce widespread hazardous weather, including damaging winds, hail, short-term heavy rainfall, and occasionally tornadoes [12,13,14,15,16,17].
Statistical studies reveal distinct spatiotemporal characteristics of squall lines under cold vortex conditions over China. Most squall lines initiate in the afternoon to early evening hours of June–July, mature or dissipate overnight [18], typically have a duration of 3–5 h, and move mainly southeastward [17,19,20]. The majority develop in the southern or southeastern quadrant of the cold vortex center, at distances of approximately 500–2000 km from the core, and can be generated at any stage—from development through maturity to decay—of the vortex lifecycle [21,22].
Cold-vortex-induced squall lines form in environments with strong thermodynamic and dynamic characteristics. The northwesterly flow at the rear of the cold vortex (or at the bottom of its associated cold trough) continuously transports dry, cold air from mid-levels, which overrides the warm, moist air mass near the surface. This configuration creates a deep unstable stratification and a typical “dry-upper, moist-lower” vertical structure, favoring the substantial accumulation of Convective Available Potential Energy (CAPE) and Downdraft Convective Available Potential Energy (DCAPE) [23]. Meanwhile, the coupling of upper- and low-level jets associated with the cold vortex enhances vertical wind shear, moisture transport, and lifting conditions [24], thereby promoting frontogenesis, low-level cyclogenesis, and the downward transfer of mid-level dry cold air and momentum. Ultimately, these processes facilitate the development of the Rear Inflow Jet (RIJ) and the generation of bow echoes [25].
Multi-source observations, anchored primarily in radar data, are critical for elucidating the structural characteristics of squall lines. Radar observations show that cold vortex-induced squall lines typically evolve through the merger and organization of discrete convective cells. Mature squall lines frequently display a well-defined “leading convective line–trailing stratiform” structure, with reflectivity in the leading convective zone often reaching 50–60 dBZ [20,26]. This zone may contain embedded supercells [27] and is commonly accompanied by distinctive features such as a rear-inflow jet, mid-level radial convergence, and a weak echo region [12,28,29]. The bow echo [30] represents a classic morphology of severe squall lines in cold vortex environments; its apex is often linked to mesocyclones or tornado vortex signatures [31,32], which generally coincide with the strongest updraft zones and the most intense weather impacts [33]. Advances in observational technology have progressively refined the classification of squall-line morphology. For instance, using radar data, Bluestein et al. [11] classified severe spring squall lines in Oklahoma, USA, into four formative patterns: broken-line, back-building, broken areal, and embedded areal. Likewise, based on the position of the stratiform precipitation region, Parker & Johnson [34] further classified linear mesoscale convective systems into organizational types:trailing stratiform (TS), leading stratiform (LS), and parallel stratiform (PS).
Surface mesoscale systems (such as convergence lines, drylines, gust fronts and sea-breeze fronts), in conjunction with low-level shear lines and topographic lifting, constitute key triggering mechanisms for releasing convective instability energy [35,36]. The maintenance and propagation mechanisms of squall lines are generally understood within the RKW theoretical framework, which emphasizes the interaction between cold pools and environmental vertical wind shear [37]. The balance between cold-pool outflow boundaries and low-level environmental wind shear plays a decisive role in determining squall-line intensity and organizational structure [38,39,40,41]. Simultaneously, factors such as vertical wind shear intensity, moisture flux convergence, and the coupling between updrafts and downdrafts jointly regulate the evolution of squall lines [42]. Numerical simulations further indicate that triggering new convection along the leading edge of cold pool gust fronts—forming back-building propagation—is an important mechanism for sustaining squall line lifespan [40,43]. Additionally, the persistent transport of low-level warm, moist advection and the entrainment of mid-level dry air also contribute significantly to squall line maintenance [34,44,45,46]. The generation of extreme thunderstorm winds results from the combined effects of strong downdrafts, momentum transport, high-density cold-pool outflow, and topographic channeling [32,36,47,48,49].
Although existing studies have gained substantial insights into the environmental characteristics and evolutionary mechanisms of squall lines under cold vortex conditions, most have focused on single events. For “dual/multiple squall line” processes—where the same cold vortex system triggers consecutive squall lines affecting the same region within a relatively short period [50,51,52]—preliminary investigations have addressed their structural differences, the similarities and differences in their triggering and maintenance mechanisms, and potential interactions between the squall lines. For instance, Karan et al. [51] used the WRF model to simulate the convective environment and triggering processes of a dual squall-line event along the western Gulf coast on 29–30 April 2005. Their results showed that the first squall line was triggered by an atmospheric bore and associated gravity waves generated by a cold front, while the second formed in the unstable environment ahead of the first, initiated by a lower-tropospheric trough. These findings reveal that, under the same cold-front air mass background, convection at different scales and locations can be triggered sequentially or simultaneously through distinct physical processes, forming multiple squall lines. However, the interactions between the two squall lines were not explicitly addressed.
On 13 June 2022, a rare dual-squall-line event affected regions including Hebei and Shandong provinces in China (Figure 1). The first squall line (SL1) formed over the western Shandong Peninsula and propagated southeastward, successively influencing Shandong, Anhui, and northern Jiangsu. The second line (SL2) initiated from convection within Hebei Province, exhibited a relatively shorter spatial scale, and primarily affected parts of Hebei and Shandong. This dual-squall-line system produced widespread thunderstorm-induced winds, with 113 stations recording wind speeds at or above Force 10 (24.5–28.4 m s−1), 23 of which reached Force 11 (28.5–32.6 m s−1). In this study, we conduct a systematic analysis of this dual squall-line event using upper-air sounding data, ERA5 reanalysis, high-density surface automatic weather station observations, and weather radar data. We place particular emphasis on contrasting the two squall lines in terms of mesoscale environments, convective initiation, and maintenance mechanisms, thereby elucidating how localized environmental heterogeneities influence convection initiation and squall-line maintenance. The paper is organized as follows: Section 2 describes the data and methods. Section 3 presents the results, including the synoptic background, triggering mechanisms of the twin squall lines, and the roles of surface cold pools and vertical wind shear in their maintenance. Section 4 discusses of the key findings, and Section 5 summarizes the main conclusions.
Figure 1.
Distribution of strong winds and evolution of squall line systems on 13 June 2022. Solid gray lines indicate provincial boundaries in China. (a) Hourly strong winds (≥17.2 m s−1) from 04:00 to 16:00 UTC. (b) Schematic of the evolution of two squall lines (SL1, SL2). Solid and dashed contours denote the 45 dBZ echo cores of SL1 and 2, respectively; identical colors indicate simultaneous times.
2. Materials and Methods
This study used the following data for 13 June 2022: national upper-air observations at 00:00 and 12:00 UTC; ERA5 reanalysis data (European Centre for Medium-Range Weather Forecasts, Reading, UK) for 00:00 and 12:00 UTC (0.25° × 0.25°); nationwide maximum wind records from regional stations between 00:00 and 15:00 UTC; 5 min high-resolution surface observations across China; and data from six radars, including SA-type radars (Beijing Metstar Radar Co., Ltd., Beijing, China) at Handan, Binzhou, and Linyi, and SAD-type radars (Beijing Metstar Radar Co., Ltd., Beijing, China) at Shijiazhuang, Jinan, and Xuzhou. In addition, regional radar mosaic composite reflectivity data covering 112–121°E and 33–40°N, with a horizontal resolution of 0.01° × 0.01°, were also collected. The data used in this study were obtained from the China Meteorological Data Service Centre (Beijing, China). The distributions of the sounding and radar stations are shown in Figure 1b. The base map used is from the Standard Map Service provided by the Map Technology Examination Center of the Ministry of Natural Resources of the People’s Republic of China (approval number: GS (2024)0650) and remains unmodified. All data processing and analyses in this study were performed using C++Builder 6.0 (Borland Software Corporation, Scotts Valley, CA, USA), and all figures were generated using Surfer 15 (Golden Software, Golden, CO, USA).
To investigate the relationship between surface cold pools and ambient vertical wind shear, we calculated the cold-pool propagation speed. Radar base data within a 10–100 km range from the Handan, Linyi, Shijiazhuang, Jinan, and Xuzhou radars were subjected to quality control, including radial velocity dealiasing. All radars operated in Volume Coverage Pattern 21 (VCP21) scanning mode, completing a volume scan of nine elevation angles (0.5°, 1.5°, 2.4°, 3.4°, 4.3°, 6.0°, 9.9°, 14.6°, and 19.5°) every six minutes. From these data, we retrieved the mean horizontal wind and vertical wind shear vectors over the radar sites, spanning heights from 0.3 to 8 km with a vertical resolution of 0.3 km and a temporal resolution matching the radar volume scan period. We further derived the temporal evolution of the 0–3 km vertical wind shear (SHR3). All radar-derived products were generated consistently at the native temporal resolution of the radar scans, and no temporal smoothing was applied, except for the calculation of squall-line motion (i.e., propagation direction and speed).
2.1. Radial Velocity Dealiasing
This study employs the method of Xiao et al. [53] for velocity dealiasing. The main steps of this method include: (1) removal of isolated noisy points; (2) searching for the initial reference radial (located at the zero-velocity line or the region with the weakest wind); (3) dealiasing of the initial reference radial and its two adjacent radials (one on each side); (4) starting from the three initially processed radials, performing multiple rounds of full-azimuth, radial-by-radial dealiasing in both clockwise and counterclockwise directions, where the reference velocity is taken as the average velocity of the already processed neighboring gates near the current velocity gate; during the multiple rounds of dealiasing, the search range for the reference velocity and the shear condition is gradually relaxed; and (5) noise filtering.
2.2. Radar Wind Profiler Retrieval and Calculation of Vertical Wind Shear Vectors
2.2.1. Radar Wind Profile Retrieval
The layered Volume Velocity Processing (VVP) method retrieves the mean horizontal wind at each vertical level through multivariate linear regression, under the assumption of a linear wind field within each height layer. It is applied to radial velocity data within a radial range of 10–100 km from the radar and over altitudes from 0.3 to 8 km, with a vertical interval of 0.3 km [54]. The retrieval accuracy of this method depends on the spatial coverage of radial velocity samples within the radar sampling volume. Validation against 72 co-located radiosonde profiles at the Yangjiang S-band radar site shows that when the radar echo coverage is spatially uniform, the standard deviations of wind direction and wind speed are 10° and 2 m s−1, respectively, with correlation coefficients of 0.90 and 0.72; when the echo coverage is limited or spatially inhomogeneous, the standard deviations increase to 17° and 2.4 m s−1, with correlation coefficients of 0.62 and 0.70, respectively.
2.2.2. Vertical Wind Shear Vector Difference
Using these layered mean wind data, 0–3 km vertical wind shear [55] is calculated and compared with that derived from radiosonde observations, yielding a root-mean-square error of 1.97 m s−1. In Chinese operational forecasting [56], the criteria for classifying convective environments based on 0–3 km vertical wind shear are: weak shear < 8 m s−1, moderate shear 8–15 m s−1, and strong shear ≥ 15 m s−1. The standard deviation of shear values computed by the layered VVP method is substantially smaller than the threshold for weak vertical wind shear, indicating that the 0–3 km shear derived from radar-retrieved wind profiles has low uncertainty and is adequate for operational monitoring and warning requirements.
where is the wind direction, and where is the level index. Taking = 0 (0.3 km) and = 10 (3 km) as the lower and upper bounds, the resulting wind shear vector was projected onto the squall-line motion direction to derive SHR3.
2.2.3. Squall-Line Motion Direction and Vertical Wind Shear Relative to the Squall Line
Under the Rotunno–Klemp–Weisman (RKW) theoretical framework, the component of low-level (0–3 km) vertical wind shear perpendicular to the squall-line orientation—i.e., the component along the direction of squall-line motion—plays a primary role in the development and maintenance of the squall line [40]. In this study, a squall line is considered to have formed when the 40-dBZ echo band is continuous (or quasi-continuous) over a length of at least 100 km, with an aspect ratio exceeding 5:1, and persists for no less than 30 min. Dissipation is determined when these criteria are no longer satisfied (e.g., when the intense echo band breaks, the aspect ratio falls below 5:1, or the core convective region vanishes). The duration from formation to dissipation is defined as the system’s lifetime.
The direction and speed of squall-line movement are determined through the following procedure:
(1) On the composite reflectivity product, the main body boundary of the squall line is delineated using the 35-dBZ reflectivity contour.
(2) A point on the leading edge is identified when the average reflectivity of the five adjacent pixels inside the boundary exceeds that of the five adjacent pixels outside by more than 15 dBZ, and the leading-edge segment is required to have a minimum length of 50 km.
(3) The movement direction and speed at 6 min intervals are then computed using a temporal adjacent matching method.
This study primarily investigates the role of local environmental wind shear in sustaining squall lines during different temporal stages. When matching the shear with radar-retrieved vertical wind profiles, we did not segment the squall line along its length. Instead, we used the vector-averaged azimuth angle (measured clockwise from due north, in degrees) of the squall-line motion over the preceding 30 min as the overall movement direction. Based on the unit vector of this motion direction, the 0–3 km vertical wind shear was projected onto the squall-line motion to obtain (hereinafter referred to as the 0–3 km effective environmental shear). The time window for calculation was selected as the interval from the moment the squall line entered the 100-km range ring of the radar station to the time immediately preceding its passage over the radar site. Specifically, the values computed from the Linyi radar (08:39–09:33 UTC) and the Xuzhou radar (09:34–10:27 UTC) were compared with the cold-pool propagation speed of Squall Line 1, whereas those derived from the Handan radar (09:18–10:00 UTC) and the Jinan radar (10:54–11:58 UTC) were compared with the cold-pool speed of Squall Line 2.
2.2.4. Error Analysis
We used the Monte Carlo method [57] to propagate the uncertainties in the derived quantities. The uncertainty in the squall-line motion direction is denoted as , and the root-mean-square error of the wind-vector difference (i.e., the 0–3 km vertical wind shear) is 1.97 m s−1. We applied Gaussian random perturbations separately to the squall-line motion direction and to both the direction and magnitude of the wind-vector difference. This procedure yields the 6-min resolved projected shear values and their corresponding standard deviations. The results are presented in Appendix A Table A1, where column headings denote the radar station, data time, shear direction and magnitude, squall-line motion direction and its variability, and the projected shear with its standard deviation (see table notes to Appendix A Table A1 for definitions of abbreviations).
2.3. Cold-Pool Propagation Speed
2.3.1. Definition of Cold-Pool Boundary, Interior, Exterior, and Depth
Stations with surface temperatures at least 3 °C below the domain-averaged temperature of all available stations were objectively identified as cold-pool interior points, while the remaining stations were classified as ambient (exterior) points. The horizontal extent of the cold pool was subsequently delineated by the convex hull of these interior stations. Since direct sounding data were unavailable from the surface observation network, the cold-pool depth H was indirectly estimated using the hydrostatic approximation.
where is the pressure perturbation, and is the mean cold-pool air density.
2.3.2. Cold-Pool Propagation Speed
The propagation speed of the cold pool is interpreted as the spreading rate of a two-dimensional density current. Following the assumption that the cold pool is characterized by a potential temperature perturbation and a vertical depth , we estimated from the associated pressure perturbation [58]. Surface station pressure was first reduced to mean sea level pressure (MSLP) using the hypsometric equation. At each analysis time, the instantaneous pressure perturbation was computed as the difference between the average MSLP over the cold-pool interior and that over the ambient region, with temporal averaging confined to individual time steps to retain the cold pool’s instantaneous features.
where k is an empirical coefficient representing energy losses due to surface friction, turbulent mixing, and other dissipation processes [59,60,61], typically ranging from 0.4 to 0.6 times the ideal theoretical value.
2.3.3. Corrected Speed with Uncertainty Propagation
Let the uncertainties in temperature and pressure observations be denoted as and , respectively. A total of independent iterations (e.g., ) are performed, during which Gaussian random perturbations are applied separately to the cold-pool temperature, ambient temperature, cold-pool pressure, and ambient pressure. At each iteration, , , , and the boundary speed were recomputed. The mean and standard deviation across valid realizations were then calculated, allowing the pressure estimation error and the correction-factor range to be simultaneously propagated into the final speed estimates.
2.3.4. Data Coverage for Cold-Pool Calculations
Surface station data at 5 min resolution were used for RKW-based analysis of squall-line maintenance. For Squall Line 1, data from 08:00 to 12:00 UTC within 114–121°E and 32.5–36°N were utilized; for Squall Line 2, data from 09:00 to 12:00 UTC within 114–117°E and 36–38.5°N were used. The 5 min calculated parameters and results for both cases are listed in Appendix A Table A2 and Table A3. After correction, the standard deviations of the propagation speed ranged from 2.7 to 3.1 m s−1 for Squall Line 1 and from 2.8 to 3.2 m s−1 for Squall Line 2.
2.4. Availability of the ERA5 Reanalysis Data
The ERA5 reanalysis dataset was employed to analyze the thermodynamic and dynamic conditions over the squall-line-affected region during 00:00–12:00 UTC on 13 June. Yang et al. compared convective parameters derived from ERA5 with those from radiosonde observations and found that the 850–500 hPa temperature difference (T85), 0–6 km vertical wind shear (SHR6), and lifting condensation level (LCL) calculated from ERA5 correlated well with the sounding-derived values; however, ERA5 tended to underestimate (overestimate) CAPE for values greater than (less than) 2000 J kg−1, to underestimate the lifted index (LI), and to produce larger deviations in 0–3 km vertical wind shear (SHR3) and DCAPE [62].
To verify the applicability of ERA5 to this event, we compared temperature and dew-point profiles from ERA5 layer-by-layer with radiosonde profiles from five stations—53798, 54727, 57083, 58027, and 58203 (locations shown in Figure 1b)—at 00:00 and 12:00 UTC. CAPE and LCL were computed using the lowest model level (1000 hPa or 925 hPa) as the starting parcel, following a dry-adiabatic to pseudo-adiabatic lifting path. As shown in Appendix A Table A4, the mean standard deviations between ERA5 and soundings are 1.23 °C for temperature and approximately 4.4 °C for dew point; CAPE shows notable discrepancies at a few station times, while LCL from ERA5 is relatively close to sounding-derived values. Therefore, ERA5 fields of CAPE and LCL can be used for environmental background analysis in this event but should not be treated as precise threshold criteria.
3. Results
3.1. Synoptic Background
At 00:00 UTC on 13 June 2022, the center of the 500 hPa cold vortex was located over northeastern Inner Mongolia, with the 700 hPa and 850 hPa cold vortex centers closely aligned with the 500 hPa center. Northern Hebei and northern Shandong lay within a convergence zone formed by the 500 hPa cold trough, the 850 hPa warm ridge, and a moist tongue (Figure 2a). The atmospheric profile displayed a distinct “dry-cold aloft, warm-moist below” vertical structure, leading to pronounced conditional instability. A well-defined cyclonic circulation was evident in the surface wind field (Figure 2c), characterized by a cold convergence line extending from the vortex center into northern Henan and a warm convergence line stretching toward Bohai Bay. Collectively, these features provided near-surface convergent forcing and mesoscale dynamical boundaries favorable for convective initiation. By 12:00 UTC that day, the 500 hPa cold vortex had shifted slightly eastward and southward. Behind the trough, northwesterly flow strengthened, accompanied by persistent and notable cold advection. At 850 hPa, the shear line aligned approximately with the axis of the low trough, while the warm ridge remained over northern Shandong. The moist tongue had advanced into northern Anhui and northern Jiangsu. At this time, surface cyclonic circulations were observed over northern Jiangsu and along the Hebei–Shandong border (Figure 2d), corresponding respectively to the development of SL1 and SL2.
Figure 2.
Synoptic background and surface conditions on 13 June 2022. (a,b) 500-hPa geopotential height (contours) and 850-hPa wind fields (barbs) at 00:00 and 12:00 UTC, respectively. (c,d) Surface temperature (shaded) and surface wind fields (barbs) at 00:00 and 12:00 UTC, respectively.
Hourly ERA5 reanalysis data are used to examine the thermodynamic and dynamic conditions over the squall-line-affected regions during 00:00–12:00 UTC on 13 June. As evaluated by Yang et al. [62], ERA5-derived parameters including T85 (850–500 hPa temperature difference), SHR6 (0–6 km vertical wind shear), and LCL (lifting condensation level) show good agreement with sounding-derived values; however, CAPE is underestimated (overestimated) for values greater than (less than) 2000 J kg−1, LI is underestimated, and larger biases exist for SHR3 (0–3 km vertical wind shear) and DCAPE. Therefore, only the more reliable parameters are selected for the environmental analysis in this study.
At 00:00 UTC (Figure 3a), a region of high CAPE (≥1200 J kg−1) extended from western Shandong to northern Anhui, with the high T85 (≥26 °C) area generally collocated with the high-CAPE zone. The high 0–6 km vertical wind shear (SHR6 ≥ 16 m s−1) was located over central-western Hebei and central Shandong. Areas of low Lifted Index (LI < −2) and low LCL (<1000 m, approximately 900 hPa) were distributed in proximity to the high-CAPE region.
Figure 3.
ERA5 convective parameters over the squall-line-affected areas on 13 June 2022. (a) At 00:00 UTC, CAPE (shaded, J kg−1), T850–T500 (contours, °C), and SHR6 (dashed contours, m s−1) (left), and LI (shaded, °C) and LCL (contours, hPa) (right). (b) As in (a), but at 09:00 UTC. (c) As in (a), but at 12:00 UTC.
From 03:00 to 06:00 UTC, the spatial distribution of these variables exhibited relatively minor changes. By 09:00 UTC (Figure 3b), the high-CAPE region remained over Shandong, and the zone with T85 equal to or greater than 29 °C extended across southern Shandong, Henan, Anhui, and Jiangsu. The high SHR6 zone was centered over central-western Hebei, with values of approximately 14 m s−1 over southwestern Shandong. Low LI and low LCL (<1000 m) areas were distributed from northern Henan through western Shandong to northern Jiangsu.
At 12:00 UTC (Figure 3c), the high-CAPE areas became fragmented, mainly confined to western Shandong and northern Jiangsu. T85 remained greater than 26 °C over both Hebei and Shandong. The high SHR6 zone shifted to northern Henan–western Shandong. The low-LI area extended broadly, while low LCL values (<1000 m) were found over western Shandong and northern Jiangsu.
Overall, during the period from 00:00 to 12:00 UTC on 13 June, strong vertical wind shear (SHR6 ≥ 16 m s−1) and moderate-to-strong thermodynamic instability (CAPE ≥ 1200 J kg−1, T85 ≥ 26 °C) persisted over Hebei and Shandong. Coupled with favorable low-level lifting conditions (LI < −2, LCL < 1000 m), these environmental factors were conducive to the development and maintenance of convective systems.
3.2. Mechanisms of Convective Initiation for the Two Squall Lines
Squall Line 1 (SL1) developed into a southwest–northeast-oriented convective band over the western part of the Shandong Peninsula at approximately 08:00 UTC on June 13, and subsequently advanced southeastward at a speed of approximately 50 km h−1. By 09:00 UTC, its convective band had stretched across the Shandong Peninsula, with a total length of nearly 460 km. Behind the dense convective core, an extensive stratiform precipitation region was present. The northern segment of the squall line displayed a typical comma-shaped echo pattern, while new convective cells continuously merged into its southern tip, reflecting strong organizational capacity and maintenance ability. The system gradually shifted eastward and southward thereafter, and eventually dissipated over central Jiangsu around 15:30 UTC, with a total lifespan of approximately 7.5 h.
After 09:30 UTC, Squall Line 2 (SL2) developed into a compact linear convective band. The northern segment of the band gradually evolved into a comma-shaped echo structure, with the entire convective line extending approximately 270 km in length. The system as a whole moved southeastward at a speed of approximately 65 km h−1. Following 10:30 UTC, SL2 entered Shandong Province and split into two parts: the northern segment took on a slightly bow-shaped configuration, while the southern segment evolved into a blocky convective cluster. It weakened rapidly after 11:30 UTC (Figure 1b), with a total lifespan of approximately 2 h.
3.2.1. Convective Initiation of SL1
- Initiation by Gust Front
On 13 June 2022, convective activity over the Shandong Peninsula was initiated by outflow from convective cells over the Bohai Sea (Figure 4). At 02:50 UTC, a storm cell in the Bohai region developed a bow-shaped echo that moved southeastward (Figure 4a). A distinct convergence line ahead of the bow echo was evident in the radial velocity field (Figure 4b), whose lifting effect triggered several new convective cells (marked numerically in Figure 4a). As the bow echo advanced southeastward, it merged with pre-existing convective cells and gradually moved onto the Shandong Peninsula.
Figure 4.
Maps of reflectivity and radial velocity from the Binzhou radar at 0.5° elevation on 13 June 2022. (a) Radar reflectivity (dBZ) at 02:50 UTC. (b) Radial velocity (m s−1) at 02:50 UTC. (c) Radar reflectivity (dBZ) at 03:55 UTC. (d) Radial velocity (m s−1) at 03:55 UTC. (e) Radar reflectivity (dBZ) at 04:31 UTC; the arrow indicates a newly formed cell. (f) Radial velocity (m s−1) at 04:31 UTC. (g) Radar reflectivity (dBZ) at 05:18 UTC. (h) Radial velocity (m s−1) at 05:18 UTC. Orange dotted lines in all panels indicate gust front locations.
By 03:55 UTC, a gust front was clearly visible along the southern flank of the bow echo (orange dotted line in Figure 4c). In the radial velocity field, this gust front appeared as an arcuate, weakly convergent line (Figure 4d). To its west—on the warm-sector side near the center of a surface vortex system—new convection developed due to the accumulation of warm, moist air and the release of local instability energy. After moving onto the peninsula, the southern portion of the bow echo continued to intensify while its northern portion gradually weakened. Convection within the warm sector developed and intensified along the warm shear line, and multiple convective cells generated outflow boundaries upon reaching maturity (Figure 4e,f). Several outflow boundaries converged to form an elongated gust front that extended southward at approximately 20 km h−1. Surface stations recorded a wind shift from southeast to northeast as the gust front passed. The temperature gradient between stations affected by the gust front and neighboring unaffected stations (8.2 km apart) increased from 0.24 °C km−1 to 0.61 °C km−1, further enhancing dynamic and thermal instabilities in the boundary layer and continuously triggering convective initiation (Figure 4g). Numerous newly triggered cells subsequently merged and organized, gradually forming a continuous echo band. Within this band, strong echo cells exhibited distinct wind cores (Figure 4h), with radial velocity magnitudes reaching ≥20 m s−1, consistent with the high-wind events recorded in surface observations.
- 2.
- Initiation by Surface Convergence Lines
On the morning of 13 June, two distinct airflows were present over the North China Plain: a cold easterly current originating from Bohai Bay and advancing westward (blue arrows in Figure 5a–c), and a warm southwesterly flow extending northeastward from northern Henan (red arrows in Figure 5a–c). These two air masses converged near the Hebei–Shandong border, forming a surface vortex circulation system (corresponding to the surface vortex shown in Figure 2c). The associated cold-type convergence line remained quasi-stationary through the morning (marked by the black double lines on the western side in Figure 5a–c) and corresponded to a clear convergence signature in the Jinan radar’s 0.5–elevation radial-velocity field (black arrow in Figure 5(a2,b2)). The temperature contrast across the convergence line was small, indicating that convection initiation in this region depended primarily on dynamic convergence and lifting.
Figure 5.
Schematic diagram of SL1 triggered by surface convergence lines on 13 June 2022. (a–c) Analysis fields of 5 min surface elements at national stations: color-filled contours represent temperature (°C), green solid lines indicate dew-point lines (°C), and wind barbs denote the surface wind field. Blue and red arrows indicate cold and warm airflow, respectively; thick black lines denote surface convergence lines. (a1–c1) Radar reflectivity (dBZ) at 0.5° elevation from the Jinan radar at corresponding times; numbers 1 and 2 mark the locations of newly formed convective cells. (a2–c2) Radial velocity (m s−1) at 0.5° elevation from the Jinan radar at corresponding times; black arrows indicate the locations of surface convergence lines on the radial velocity maps. The black dashed line in panel (c2) denotes the banded convergence line, and the white dashed line marks the banded velocity divergence zone. (d–d4) Cross-sections along A0A1 for (d) reflectivity (dBZ), (d1) radial velocity (m s−1), (d2) ZDR (dB), (d3) , and (d4) KDP (° km−1). In panels (d,d1), black triangles mark the locations of stations reporting gale-force winds. The dashed lines in panels (d–d4) denote the 0 °C isothermal surface.
By 04:55 UTC, cold outflow generated by convection near Bohai Bay was advected southward by the easterly flow and merged into the vortex circulation. At this time, combined cold-warm air convergence and cyclonic lifting associated with the vortex triggered the first batch of new convective cells, providing the initial convective source for the subsequent squall-line development.
At 05:45 UTC, the convection near Bohai Bay merged with newly triggered cells initiated by its own outflow, forming an arcuate convective echo band composed of multiple cells. The corresponding 0.5–elevation radial-velocity image showed small-scale velocity-convergence pairs at several cell locations (marked “1” in Figure 5(b1)), reflecting pronounced convergent ascent within the storms. Simultaneously, a cold-pool outflow boundary developed ahead of the convective system (marked “1” in Figure 5b), enhancing local convergence and supporting storm maintenance and further development. Meanwhile, within the warm, moist air east of the cold convergence line (yellow circle in Figure 5a), thermodynamic instability combined with local wind-field convergence continuously triggered additional new cells. These eventually coalesced into another echo band (marked “2” in Figure 5(b1)), ahead of which a new outflow boundary formed (marked “2” in Figure 5). The corresponding 0––elevation radial-velocity image displayed divergence features at this location, although no surface winds exceeding 17.2 m s−1 (Beaufort force 8) were recorded by surface observations (marked “2” in Figure 5(b2)).
By 06:45 UTC, the convection originating from Bohai Bay extended further southwestward and gradually connected with the convective echo band in the warm sector, forming the complete structure of SL1 (Figure 5(c1)). A well-defined cold front characterized by wind-direction shear and a sharp temperature gradient developed ahead of the squall line (Figure 5c). In the corresponding 0.5–elevation radial-velocity image, a banded convergence line was evident (black dashed line in Figure 5(c2)), ahead of which surface winds reaching 25.6 m s−1 were observed. The banded velocity-divergence zone marked by the white dashed line in Figure 5(c2) corresponds to the downdraft region behind the squall line.
A vertical cross-section through a wind-producing cell within SL1 (Figure 5d) shows that the 45 dBZ echo tilts slightly in the direction of squall-line motion. The 55 dBZ strong echo extends to the surface and contains a core with reflectivity ≥ 60 dBZ. Within this core, ZDR ranges from 0.9 dB to 3.8 dB, from 0.94 to 0.98, and KDP from 1.4 ° km−1 to 3.3 ° km−1, indicating abundant raindrops and water-coated hail near the surface [63,64]. In the radial-velocity field, a zone of high positive velocity (Vr ≥ 20 m s−1; Figure 5(d1)) extends downward from approximately 4 km altitude in the stratiform region behind the squall line, reaching the surface ahead of the convective line. This reflects a deep and intense downdraft within the storm. The downdraft region corresponds to the region of the large vertical gradient of ZDR below the 0 °C level (Figure 5(d2)), where ZDR increases rapidly from the 0 °C level downward, reflecting that ice phase particles melt during falling, become coated with liquid water films on their surfaces, and tend to become oblate [65]. Ahead of the squall line, a narrow convergence zone exists in the lower levels and extends upward to above 6 km, corresponding to the updraft region where a ZDR column is visible (Figure 5(d2)), with ZDR maintaining positive values, indicating that supercooled large raindrops are lifted by strong updrafts [66]. In the same region, decreases to <0.95 (Figure 5(d3)), placing it within a typical mixed phase layer. This low region corresponds to positive ZDR, moderate enhancement of KDP (Figure 5(d4)), and moderate reflectivity (40–50 dBZ), which are significantly different from the typical large hail region (ZDR ≈ 0 dB, KDP insensitive, reflectivity > 60 dBZ) [65,66], thus ruling out the dominance of large hail. Meanwhile, the low region is spatially consistent with the reflectivity structure, and > 0.8, which does not conform to the characteristics of non-meteorological echoes [67], thus eliminating contamination effects. The multi-parameter consistency of the ZDR column, low , and moderate KDP above the 0 °C level in the forward updraft region indicates the existence of a mixed phase with coexisting supercooled raindrops and ice phase particles [68], while the rear downdraft region corresponds to the melting process of ice phase particles. Based on the above observations, the physical mechanism responsible for the strong winds generated by this storm can be described as follows: First, the intensity of the downdraft was enhanced by a combination of mid- to upper-level downward momentum transport, the drag effect of precipitation particles, and cooling from phase changes (e.g., evaporation and melting). This intense downdraft then rapidly transported cold air from the mid-upper levels down to the near-surface layer, where it accumulated to form a cold pool. Finally, the pressure gradient established between the cold pool and the surrounding environment drove the acceleration of the outflow, which manifested as strong surface winds.
3.2.2. Convective Initiation of SL2
Figure 6 presents a comprehensive analysis of radar composite reflectivity and surface meteorological elements during the formation of SL2 on 13 June 2022. The figure characterizes the near-surface humidity distribution using the temperature–dew point depression (T − Td), with T − Td ≤ 5 °C defined as moist zones and T − Td ≥ 20 °C as dry zones. The red solid lines denote isotherms, the black solid lines denote 1 h pressure tendency contours, and the surface wind field is shown quantitatively using wind barbs.
Figure 6.
Schematic diagram of the formation of squall line 2 on 13 June 2022. (a) Superimposed map of surface temperature (red isotherms, °C), dew-point front (blue dashed line), and composite reflectivity ≥ 15 dBZ (color-shaded, dBZ) at 03:30 UTC. (b) As in (a), but at 07:30 UTC. (c) As in (a), but at 09:00 UTC. (d) Temperature (black line, left axis, °C) and wind direction/speed (red wind barbs, right axis, m s−1) at station D7014 from 03:30 to 09:00 UTC [shown in panel (c)]. In panels (a–c), gray shading denotes terrain height (m), green arrows indicate the main influencing airflow, green and orange hatched areas represent T − Td ≤ 5 °C and T − Td ≥ 20 °C, respectively, thick black lines denote surface convergence lines, and black solid lines indicate 1-h pressure change (hPa).
During the daytime on 13 June, under the influence of a 500 hPa trough, a stratiform precipitation system over the Taihang Mountains moved slowly eastward. Surface observations showed weak cooling over the Taihang Mountains (1 h temperature change of –1 °C), while areas such as Hebei and the Shandong Peninsula warmed significantly under continental warm high-pressure influence (1 h temperature change > 2 °C). This non-uniform heating led to the formation of a distinct overlapping zone of the temperature front and dew-point front on the windward side of the eastern slope of the Taihang Mountains (blue dash-dotted line in Figure 6a). Notably, the moist airflow over the Beijing–Tianjin region diverged: its main branch turned southward into a surface vortex system (green arrow in Figure 6a), while a secondary branch converged dynamically with easterly flow from the Taihang Mountains in the windward slope region (yellow rectangle in Figure 6a).
The effects of the Taihang Mountains on the low-level wind field are well recognized, as terrain-induced blocking can alter the vertical wind profile and reinforce low-level convergence [69]. According to Sun [70], when the cross-mountain flow is stronger at lower levels than aloft, the windward slope experiences horizontal convergence, which enhances cyclonic vorticity and generates a meridional wind shear line, thereby amplifying precipitation on the windward side. In this event, before the squall line reached the Shijiazhuang radar (05:30–07:00 UTC), the retrieved wind speed difference between 0.9 km and 0.3 km (V0.9km − V0.3km) ranged from −1.77 to 0 m s−1, indicating that the low-level easterly wind decreased with height due to topographic blocking. This suggests that the terrain facilitated the organization of squall-line convection by enhancing low-level convergence and meridional wind shear.
As the stratiform precipitation region approached the overlapping zone of the temperature front and dew-point front, its extent and intensity both increased. A broad area of negative temperature tendency formed on the western side of the frontal zone, while on the eastern side, in the absence of cloud cover, surface radiational warming was pronounced. This led to a sharp enhancement of the cross-frontal temperature gradient, with the temperature gradient reaching approximately 0.16 °C km−1 and the dew-point gradient about 0.1 °C km−1, indicating markedly intensified thermal and moisture contrasts. In the coupled region between the dry zone in the southern segment of the dew-point front and the convergence zone, favorable thermodynamic conditions facilitated the initiation of new convection (Figure 6b). By this time, the banded structure of SL1 had become well established, with a cyclonic vortex developing behind the convective band (indicated by the black double line in Figure 6b). Surface temperatures within the convective band dropped to 16–18 °C, and the mean hourly positive pressure tendency at stations within the cold pool ranged from 2 to 4 hPa. The friction-corrected cold-pool outflow speed was estimated to be 12 m s−1. The separation between SL1 (to the northwest) and SL2 (to the southeast) was approximately 360 km. Considering the attenuation of cold-pool outflow over such a distance and the counteracting effects of ambient flow, it is unlikely that the cold pool of SL1 directly influenced SL2. In the region between the two squall lines, high temperatures of 30–33 °C persisted (red solid lines in Figure 6b). At the boundary where the cold pool of SL1 intersected the warm sector to its rear, small-scale convection was triggered (located southeast of station D7014 in Figure 6b). The cold outflow generated by this small-scale convection continuously spread northwestward into the warm sector, thereby influencing the area ahead of SL2. Analysis of 5 min temperature and wind data from the regional stations in Figure 6b shows that between 07:00 and 07:30 UTC, temperatures dropped sharply and wind direction shifted from northeasterly to easterly, indicating that the stations were affected by the cold pool associated with the small-scale convection to their southeast. After 07:30 UTC, temperatures exhibited little further change while remaining under the influence of easterly winds, suggesting that the stations had entered the cold-pool outflow region. Meanwhile, analysis of the surface cyclonic circulation associated with SL1 reveals that the easterly flow on the northern flank of the vortex contributed to the maintenance of easterly winds over Hebei (green arrows in Figure 6b), which likely enhanced low-level convergence and lifting ahead of SL2, thereby providing favorable dynamic conditions for its convective development.
The persistent convergence zone west of the front effectively promoted convective development and merging, ultimately forming a banded convective system. Owing to evaporative cooling from precipitation, the surface temperature decreased by 6 °C in one hour over the convective band and the adjacent stratiform precipitation area to the west, resulting in the development of a distinct cold pool. The interaction between the cold-pool outflow boundary and the easterly flow ahead of the convective band induced secondary convergence within the boundary layer, promoting new convection and further organizing the convective system. By approximately 09:00 UTC, the northern portion (the head) of SL1 displayed cyclonic curvature (Figure 6c), accompanied by marked cyclonic convergence and sharp cooling at the surface. The cold, moist outflow from the widespread stratiform precipitation behind SL1 propagated outward, with surface winds dominated by easterly and southeasterly flows, sustaining an easterly current over Hebei that reached the forward side of SL2 (green arrows in Figure 6c).
The convective initiation and development of SL2 resulted from the synergistic effects of multiple factors, which can be summarized in the following three key aspects:
(1) Thermodynamic conditions for convective initiation: Behind the upper-level cold trough, an overlapping zone of the temperature front and dew-point front developed along the eastern slope of the Taihang Mountains, with weak precipitation located in the vicinity of the frontal zone. As the cross-frontal temperature contrast intensified, baroclinicity increased and frontogenetic processes strengthened, establishing favorable thermodynamic instability for convective initiation in this region.
(2) Dynamic conditions for convective initiation: The easterly flow originating from the Bohai Bay was transported westward and encountered the topographic barrier of the Taihang Mountains, forming a horizontal convergence zone that accumulated low-level moisture and was forced to ascend, thereby providing the dynamic forcing for convection initiation.
(3) Convective organization and maintenance mechanisms: The terrain blocking modified the local wind structure; the resultant low-level convergence, combined with ambient vertical wind shear, favored the organization of discrete convective cells. As the system matured, the cold-pool outflow of squall line 2 collided with the pre-line easterly warm-moist flow within the boundary layer, generating convergence and uplift that continuously triggered new convective cells along the leading edge. These newborn cells were subsequently incorporated into the main convective band, thereby sustaining the linear structure and enhancing the organizational coherence of the squall system.
3.3. Maintenance of the Two Squall Lines
As shown in Section 3.1, conditions conducive to the development and maintenance of convective systems prevailed over Hebei and Shandong from 00:00 to 12:00 UTC. Here, we explore the maintenance mechanisms of the two squall lines in terms of the interplay between cold pools and the 0–3 km effective environmental shear.
3.3.1. Maintenance of SL1
After 09:00 UTC, the main echo of SL1 exceeded 50 dBZ. On the 0.5° elevation radial velocity display, a pronounced high-velocity zone appeared along the banded echo, with a maximum radial velocity of 28 m s−1 (receding), indicative of intense downdrafts or severe surface gusts. The 45 dBZ echo of individual convective cells extended vertically over a range of 3.6–6.8 km, with a weak-echo region ahead of the cells at low levels. The radial velocity cross-section revealed widespread divergent strong downdrafts in the lower mid-levels, while the strong updraft on the leading side ascended to form a deep mid-level convergence zone (3–9 km). This deep and vigorous convergence favored the persistence and organization of the convective system.
Between 09:00 and 12:00 UTC, the environment over southern Shandong to northern Jiangsu was characterized by CAPE > 1200 J kg−1, T85 > 29 °C, and a low LCL (around 850–925 hPa), with SHR6 decreasing from 10–14 to 6–10 m s−1. Although wind shear weakened, the high-CAPE, low-LCL thermodynamic environment still favored convection. At 09:00 UTC, the corrected cold-pool propagation speed of SL1 was approximately 11 m s−1 (Appendix A Table A2). Before the main body of SL1 reached the Linyi radar (08:39–09:33 UTC, Appendix A Table A1), fluctuated between 2.3 and 8.3 m s−1, with a mean value of 5.2 m s−1. The ratio of the cold pool propagation speed to the 0–3 km effective environmental shear was approximately 2.1. Prior to its arrival at the Xuzhou radar (09:29–10:27 UTC), ranged from 5.6 to 12 m s−1, averaging 7.8 m s−1, yielding a ratio of about 1.4. The relatively high ratio may be attributable to the fact that the effects of the strong rear-inflow jet were not incorporated into the low-level shear calculation during the mature stage of the squall line [40]. Under the combined influence of favorable thermodynamic conditions and dynamical balance, the squall line continued to develop steadily. Concurrently, cold outflow from the southern cold pool spread southwestward into the warm-dry region of northeastern Henan, triggering new convection (Figure 6c) that later merged into the southern end of SL1. This merger expanded precipitation, enhanced evaporative cooling, and reinforced the cold pool, further promoting squall-line maintenance.
3.3.2. Maintenance of SL2
After 09:30 UTC, SL2 developed into a dense convective band, with its northern segment exhibiting a comma-shaped echo pattern. The echo intensity of the main convective core exceeded 50 dBZ. On the 0.5° elevation radial velocity field, a pronounced region of high velocity values appeared along the banded echo zone, with the maximum radial velocity reaching 28 m s−1 (away from the radar). The vertical extent of the 45 dBZ echo within individual convective cells varied between 3 and 8 km. The radial velocity cross-section revealed widespread, intense downdrafts spreading out at low levels, with a mid-level radial convergence zone between 3 and 5 km in height, indicating mid-level inflow that provided convergent uplift for convective cell development.
Between 10:00 and 12:00 UTC, SL2 was located over southwestern to central Hebei, between the Shijiazhuang and Jinan radars, before moving into western Shandong. This region was characterized by CAPE values of 600–800 J kg−1, T85 around 26 °C, SHR6 of 12–18 m s−1, LI around 0, and LCL between 900 and 975 hPa—a regime of moderate CAPE, moderately low LCL, and moderate-to-strong wind shear, favorable for organized convection. During this period, the corrected cold-pool propagation speed of SL2 was 8–10.5 m s−1 (Appendix A Table A3). Before reaching the Jinan radar (10:54–11:35 UTC, Appendix A Table A1), ranged from 12.5 to 16.5 m s−1 (mean 15.4 m s−1). The cold-pool speed was considerably lower than the 0–3 km effective environmental shear, a condition unfavorable for squall-line maintenance, and thus the echoes weakened rapidly.
Between 10:00 and 12:00 UTC, the southern end of SL2 was situated over southwestern Hebei, where CAPE was less than 400 J kg−1, T85 was 29–32 °C, SHR6 increased from 8–12 to over 16–20 m s−1, LI decreased from 2 to 0, and LCL was around 850 hPa. This environment—characterized by low CAPE, relatively high LCL, large vertical temperature differences, and increasing wind shear—was unfavorable for deep convective development. Before the convection at the southern end of SL2 passed over the Handan radar (09:18–10:00 UTC), the average value of was only 1.67 m s−1. The cold-pool propagation speed far exceeded the 0–3 km effective environmental shear component, indicating that the cold pool was excessively strong and failed to satisfy the RKW balance condition. Meanwhile, the ambient environment was characterized by extremely low CAPE and relatively high LCL, which severely limited vertical development and prevented the convection from organizing into a continuous squall-line structure. Owing to the distinct environmental conditions encountered by its northern and southern segments, SL2 gradually split into two separate convective entities.
4. Discussion
Unlike the mechanisms typically documented for new squall-line initiation ahead of an pre-existing line [51], in the present event, SL2 developed independently upstream (to the northwest) of SL1, rather than following the classical leading-edge relationship. To assess the representativeness of this dual-squall-line event within the context of North China, we compared its key environmental parameters against the statistical characteristics of thunderstorm gale events previously reported for this region. Statistics indicate that environmental CAPE for such events in North China typically ranges from 800 to 2500 J kg−1 (mean ~1500 J kg−1), the 850-hPa temperature commonly exceeds 30 °C, the lifting condensation level (LCL) falls roughly between 0.8 and 1.8 km, and the 0–6 km vertical wind shear is mostly moderate to strong (12–22 m s−1) [71,72]. Both squall lines in the present event fall within these parameter ranges, suggesting that the environmental conditions were generally favorable for thunderstorm gales occurrence. However, under similar large-scale backgrounds, the successive initiation of two squall lines—each with durations exceeding 3 h—in this region is relatively uncommon. Thus, conventional environmental parameters alone cannot fullly account for the initiation and maintenance of these dual squall lines, underscoring the need to examine local differences in thermodynamic and dynamic conditions to better understand their distinct maintenance mechanisms of the two squall lines.
Between 11:00 and 12:00 UTC, the splitting of SL2 may be attributed to the contrasting surface thermodynamic environments encountered by its northern and southern segments. Over western Shandong, a broad cold region with surface temperatures below 20 °C had formed earlier under the influence of SL1. As the northern segment of SL2 moved into this region, the lower underlying surface temperatures reduced the thermal contrast between the cold pool generated by its own precipitation and the ambient air. This likely weakened the outflow-forcing intensity and consequently diminished gust-front convergence, leading to rapid echo decay. In contrast, the southern segment of SL2 remained over northern Henan, where surface temperatures within the convective area were 18–20 °C, while the warm sector ahead of its motion exhibited temperatures of 26–28 °C. This substantial temperature gradient facilitated convergence between the cold-pool outflow and the warm ambient air, allowing new convection to be triggered along the leading edge of the warm sector, and sustaining discrete convective activity. Nevertheless, owing to the low-CAPE environment, this convection failed to organize into a typical squall-line structure (Figure 7b).
Figure 7.
Superimposed maps of surface temperature, humidity, and pressure fields and reflectivity during the maintenance period of the two squall lines on 13 June 2022. (a) Surface temperature (red isotherms, °C), 1-h pressure change (black solid lines, hPa), composite reflectivity ≥ 15 dBZ (color-shaded, dBZ), T − Td ≤ 5 °C (green hatched areas), and T − Td ≥ 20 °C (orange hatched areas) at 10:00 UTC. (b) As in (a), but at 11:30 UTC.
Surface observations revealed that small convective cells triggered along the rear boundary of SL1’s cold pool produced secondary cold outflow that extended to the forward side of SL2. Meanwhile, the easterly flow associated with the surface vortex behind SL1 likely merged with the ambient low-level easterly winds, thereby enhancing the low-level convergence ahead of SL2. Based on these observations, we infer that SL1 primarily influenced SL2 through the outflow from the intervening convection and the surface vortical wind field. However, given the approximately 360 km separation between the two squall lines, these proposed mechanisms remain speculative within the current observational framework. Their quantitative contributions and general applicability warrant further investigation via high-resolution numerical simulations. This case highlights that cold-pool spreading from a squall-line system may influence on the initiation and decay of surrounding (or even upstream) convective systems by modifying the local thermodynamic environment. This also suggests that under similar synoptic circulation patterns (e.g., behind a cold vortex), forecasters should remain alert to the potential for convection triggered by mechanisms such as temperature- dew-point front overlap, orographic lifting, and low-level convergence.
It should be noted that the layered VVP method used in this study assumes a linear wind field within each height layer. This assumption may introduce considerable uncertainty during the mature stage of squall lines, when strong updrafts and downdrafts create highly non-uniform local wind fields, and thus limit the validity of the linear assumption. Consequently, the retrieved winds may smooth out small-scale wind shear signals within the convective core. However, the SHR3 retrieved in this study is primarily used to characterize the environmental background before the squall line reaches the radar site (i.e., during its developmental stage), rather than to resolve fine-scale wind field structures within the convective core. For fine-scale wind field features within the convective core at the mature stage, dual-Doppler radar synthesis or high-resolution numerical simulations are required to supplement and cross-validate the retrievals.
The effective component of low-level wind shear derived from radar-retrieved wind profiles did not account for the influence of rear-inflow. However, both squall lines exhibited prominent mid-level radial convergence during their development, indicating strong mid-level inflow. For SL1, embedded in a favorable thermodynamic environment with relatively weak low-level shear, the cold-pool-to-shear ratio was somewhat elevated. Nevertheless, the contribution of rear-inflow to the 0–3 km effective environmental shear during the mature stage may have shifted the system toward a more balanced state, thereby sustaining its development. For SL2, despite the presence of rear-inflow, environmental conditions were markedly inhomogeneous between its northern and southern segments. In the northern segment, the cold-pool propagation speed was substantially lower than the low-level shear, resulting in an imbalance in the cold-pool–shear configuration. The rear-inflow contribution to the 0–3 km effective environmental shear further increased the denominator, potentially exacerbating the relative weakness of the cold pool and accelerating the system’s decay. In the southern segment, the cold pool was excessively strong while low-level shear was extremely weak. Although rear-inflow may have reduced the effective shear ratio somewhat, the unfavorable thermodynamic environment—characterized by low CAPE and elevated LCL—still severely limited deep convection, preventing the development of organized convective structures. Future work should employ high-resolution numerical simulations with sensitivity experiments that hold thermodynamic conditions (e.g., CAPE and LCL height) constant while systematically varying dynamic factors (e.g., vertical wind shear and topographic slope) to further quantify the specific impacts of different dynamic environments on squall-line maintenance and organizational capacity.
5. Conclusions
We analyzed a dual-squall-line event over North China on 13 June 2022 within the Northeast China Cold Vortex using multisource observations. The two lines encountered different mesoscale environments and consequently had distinct initiation and maintenance mechanisms. The principal conclusions are as follows:
(1) The event occurred under a typical upper-level cold advection regime, characterized by a “dry-cold aloft, warm-moist below” thermodynamic instability stratification. Form 00:00 to 12:00 UTC, strong vertical wind shear and moderate-to-strong thermodynamic instability persisted over Hebei and Shandong, with favorable low-level lifting conditions conducive to the development and maintenance of convective systems.
(2) SL1 was initiated primarily by the superposition of the outflow boundary from convective cells over Bohai Bay and convergence lines associated with surface cyclonic circulations. The strong boundary-layer forcing, against a background of intense thermodynamic instability and strong vertical wind shear, provided stable lifting conditions for storm development. SL2 formed through the combined effects of multiple factors: the overlapping zone of the temperature front and dew-point front generated by non-uniform heating on the eastern slope of the Taihang Mountains combined with the topographic uplift of the easterly flow on the windward slope collectively constituted the initial triggering conditions.
(3) Squall-line maintenance depended on the combined local thermodynamic environment and low-level wind shear. SL1 was situated in a warm, moist environment characterized by high CAPE and low LCL, where the ratio of cold-pool propagation speed to the 0–3 km effective environmental shear component approached the RKW optimum. Concurrently, new convection triggered by cold-pool spreading on the southern flank merged into the southern end of the line, reinforcing the surface cold pool through evaporative cooling and thereby sustaining the continued development of the squall line. In contrast, SL2 encountered markedly different local conditions between its northern and southern segments. In the northern segment, the cold-pool propagation speed was substantially lower than the 0–3 km effective environmental shear, leading to dynamic imbalance that resulted in rapid echo decay. In the southern segment, the cold pool was excessively strong and thus deviated from the RKW balance; under low CAPE and relatively high LCL, deep convection was severely constrained. Ultimately, owing to the spatial mismatch in thermodynamic and dynamic conditions between its northern and southern portions, SL2 gradually split.
Observations suggest that cold-pool spreading from SL1 and its associated surface- vortex circulation may have modified the thermodynamic and low-level dynamic environment ahead of SL2. Because the two lines were widely separated, the magnitude and specific pathway of this influence remain uncertain and require high-resolution numerical simulations. Operational forecasting should jointly assess local instability, low-level shear, and possible indirect cold-pool effects from existing convective systems.
Author Contributions
Writing—review and editing, J.W. and Y.X.; data processing, Z.F.; writing—original draft preparation, J.W., Y.X. and Y.G.; funding acquisition, J.W., Y.X., Y.G. and Y.C. All authors have read and agreed to the published version of the manuscript.
Funding
This research was funded by the National Natural Science Foundation of China (Grant No. U2542207); The Open Fund Project for Heavy Rain (Grant No. BYKJ2024Z04, BYKJ2025M23); and the Hubei Provincial Natural Science Foundation of China (Grant No. 2026AFC0758).
Data Availability Statement
Upper-air observation and radar mosaic data used in this study are available from the China Meteorological Data Service Centre at http://data.cma.cn/. The surface station data (5 min temporal resolution) and single-station radar data can be acquired upon application to the National Meteorological Information Center. The ERA5 reanalysis dataset, including pressure, geopotential height, temperature, dew point, wind direction, and wind speed, was obtained from the European Centre for Medium-Range Weather Forecasts (ECMWF). Due to internal operational system modules and data usage agreements, the processing scripts are not publicly available; however, the calculation methods are described in detail in the text, and partial intermediate parameters and results are provided in the Appendix A tables.
Conflicts of Interest
The authors declare no conflicts of interest.
Appendix A
Table A1.
Parameters and errors of the 0–3 km vertical wind shear projected onto the squall-line motion direction, as retrieved from four radars.
Table A2.
Cold-pool speed parameters and associated error estimates for Squall Line 1.
Table A3.
Cold-pool speed parameters and associated error estimates for Squall Line 2.
Table A4.
Statistics of ERA5 biases in temperature, dew point, and derived thermodynamic parameters relative to radiosonde data.
References
- Nieto, R.; Gimeno, L.; De La Torre, L.; Ribera, P.; Gallego, D.; García-Herrera, R.; García, J.A.; Nuñez, M.; Redaño, A.; Lorente, J. Climatological Features of Cutoff Low Systems in the Northern Hemisphere. J. Clim. 2005, 18, 3085–3103. [Google Scholar] [CrossRef] [Scilit]
- Zheng, Y.G.; Song, M.M. Analysis of influence of cold vortexes on distribution of convective high winds and hail in China. J. Trop. Meteorol. 2021, 37, 710–720. (In Chinese) [Google Scholar] [CrossRef]
- Bell, G.D.; Bosart, L.F. A 15-year climatology of Northern Hemisphere 500 mb closed cyclone and anticyclone centers. Mon. Weather Rev. 1989, 117, 2142–2163. [Google Scholar] [CrossRef] [Scilit]
- Muñoz, C.; Schultz, D.; Vaughan, G. A midlatitude climatology and interannual variability of 200- and 500-hPa cut-off lows. J. Clim. 2020, 33, 2201–2222. [Google Scholar] [CrossRef] [Scilit]
- Hu, K.X.; Lu, R.Y.; Wang, D.H. Cold Vortex over Northeast China and Its Climate Effect. Chin. J. Atmos. Sci. 2011, 35, 179–191. (In Chinese) [Google Scholar] [CrossRef]
- Yu, Z.Y.; He, L.F.; Fan, G.Z.; Li, Z.C.; Su, Y.L. The Basic Features of the Severe Convection at the background of Cold Vortex Over North China. J. Trop. Meteorol. 2011, 27, 89–94. (In Chinese) [Google Scholar] [CrossRef]
- Zhang, L.X.; Li, Z.C. A Summary of Research on Cold Vortex over Northeast China. Clim. Environ. Res. 2009, 14, 218–228. (In Chinese) [Google Scholar]
- Sousounis, P.J.; Wallman, J.; Mann, G.E.; Miner, T.J. “Hurricane Huron”: An Example of an Extreme Lake-Aggregate Effect in Autumn. Mon. Weather Rev. 2001, 129, 401–419. [Google Scholar] [CrossRef] [Scilit]
- Davies, J.M. Tornadoes with Cold Core 500-mb Lows. Weather Forecast. 2006, 21, 1051–1062. [Google Scholar] [CrossRef] [Scilit]
- Schumacher, R.S.; Johnson, R.H. Quasi-Stationary, Extreme-Rain-Producing Convective Systems Associated with Midlevel Cyclonic Circulations. Weather Forecast. 2009, 24, 555–574. [Google Scholar] [CrossRef] [Scilit]
- Bluestein, H.B.; Jain, M.H. Formation of mesoscale lines of precipitation: Severe squall lines in Oklahoma during the spring. J. Atmos. Sci. 1985, 42, 1711–1732. [Google Scholar] [CrossRef] [Scilit]
- Fujita, T.T. Manual of Downburst Identification for Project NIMROD; SMRP No.156[R]; NASA Center for Aerospace Information (CASI): Hanover, MD, USA, 1978; 104p. Available online: https://ntrs.nasa.gov/citations/19780022828 (accessed on 20 March 2026).
- Johns, R.H.; Doswell, C.A., III. Severe Local Storms Forecasting. Weather Forecast. 1992, 7, 588–612. [Google Scholar] [CrossRef] [Scilit]
- Doswell, C.A., III. Severe Convective Storms—An Overview. Meteorol. Monogr. 2001, 28, 1–26. [Google Scholar] [CrossRef] [Scilit]
- Zhang, C.; Zhang, Q.; Wang, Y.; Liang, X. Climatology of warm season cold vortices in East Asia: 1979-2005. Meteorol. Atmos. Phys. 2008, 100, 291–301. [Google Scholar] [CrossRef] [Scilit]
- Zheng, Y.Y.; Zhang, X.C.; Zhu, H.F.; Yao, C.; Shi, S.H. Study of squall line genesis with northeast cold vortex. Plateau Meteorol. 2014, 33, 261–269. (In Chinese) [Google Scholar] [CrossRef]
- Yang, S.S.; Chen, Y.; Li, S.Q. Analysis of Squall Lines Under the Background of Cold Vortex. Meteorol. Mon. 2016, 42, 1079–1089. (In Chinese) [Google Scholar] [CrossRef]
- Li, J.; Chen, Y.; Xiao, T.G.; Zhu, K.Y. Statistical Characteristics of Squall Line Under Cold Vortex Background in Northeast China. J. Chengdu Univ. Inf. Technol. 2022, 37, 72–80. (In Chinese) [Google Scholar] [CrossRef]
- Duan, X.H.; Zhu, X.J. Analysis of squall lines in Beijing-Tianjin-Hebei Region under background of cold vortex. Tianjin Sci. Technol. 2025, 52, 95–98. (In Chinese) [Google Scholar] [CrossRef]
- Jiang, C.; Chen, C.L.; Zhang, K.; Ban, W.L.; Yang, L.; Cao, S.T.; Chen, Y. Squall Line Characteristics and Formation Conditions in Liaoning Province. Meteorol. Mon. 2024, 50, 791–803. (In Chinese) [Google Scholar] [CrossRef]
- Duan, X.H.; Chen, Y.; Zhu, K.Y. Analysis of a Squall Line Occurred with a Subdued Cold Vortex. J. Chengdu Univ. Inf. Technol. 2019, 34, 512–524. (In Chinese) [Google Scholar] [CrossRef]
- Yang, L.; Zheng, Y.G. Observational characteristics of thunderstorm gusts in Northeast China and their association with the Northeast China Cold Vortex. Acta Meteorol. Sin. 2023, 81, 416–429. (In Chinese) [Google Scholar] [CrossRef]
- Luo, Q.; Zheng, Y.G.; Chen, M. Evolution and development mechanisms of a rare strong arc-shaped squall line that occurred in northern Beijing in 2017. Acta Meteorol. Sin. 2019, 77, 371–386. (In Chinese) [Google Scholar] [CrossRef]
- Uccellini, L.W. On the Role of Upper Tropospheric Jet Streaks and Leeside Cyclogenesis in the Development of Low-Level Jets in the Great Plains. Mon. Weather Rev. 1980, 108, 1689–1696. [Google Scholar] [CrossRef] [Scilit]
- Wrona, B.; Mańczak, P.; Woniak, A.; Ogrodnik, M.; Folwarski, M. Synoptic conditions of the derecho storm. Case study of the derecho event over Poland on August 11, 2017. Meteorol. Hydrol. Water Manag. Res. Oper. Appl. 2022, 10, 8–25. [Google Scholar] [CrossRef] [Scilit]
- Meng, Z.Y.; Yan, D.C.; Zhang, Y.J. General features of squall lines in East China. Mon. Weather Rev. 2013, 141, 1629–1647. [Google Scholar] [CrossRef] [Scilit]
- Wang, X.M.; Yu, X.D.; Zhou, X.G.; Niu, S.Z. Study on the Formation and Evolution of ‘6.3’ Damage Wind. Plateau Meteorol. 2012, 31, 504–514. (In Chinese) [Google Scholar]
- Wilson, J.W.; Schreiber, W.E. Initiation of Convective Storms at Radar-Observed Boundary-Layer Convergence Lines. Mon. Weather Rev. 1986, 114, 2516–2536. [Google Scholar] [CrossRef] [Scilit]
- Liang, H.; Wang, S.F.; Liang, Y.J.; Meng, J.F.; Nong, M.S.; Su, Y.X. Analysis of supercell structure evolution and environmental characteristics of downburst in Guigang City of Guangxi on May 20, 2020. Torrential Rain Disasters 2022, 41, 631–639. (In Chinese) [Google Scholar] [CrossRef]
- Przybylinski, R.W. The bow echo: Observations, numerical simulations, and severe weather detection methods. Weather Forecast. 1995, 10, 203–218. [Google Scholar] [CrossRef] [Scilit]
- Lemon, L.R.; Doswell, C.A., III. Severe Thunderstorm Evolution and Mesocyclone Structure as Related to Tornado genesis. Mon. Weather Rev. 1979, 107, 1184–1197. [Google Scholar] [CrossRef] [Scilit]
- Weisman, M.L.; Trapp, R.J. Low-Level Mesovortices within Squall Lines and Bow Echoes. Part I: Overview and Dependence on Environmental Shear. Mon. Weather Rev. 2003, 131, 2779–2803. [Google Scholar] [CrossRef] [Scilit][Green Version]
- Zhang, L.N.; Ding, Z.Y.; Wang, Y.Q.; Zhang, L. Cause and evolution analysis of rear inflow in a squall line with the influence of strong wind after trough of Northeast cold vortex. J. Meteorol. Sci. 2019, 39, 488–501. (In Chinese) [Google Scholar] [CrossRef]
- Parker, M.D.; Johnson, R.H. Organizational modes of midlatitude mesoscale convective systems. Mon. Weather Rev. 2000, 128, 3413–3436. [Google Scholar] [CrossRef] [Scilit]
- Diao, X.G. Case study on severe local convective storms triggered by gust fronts, sea breeze fronts, and cold fronts. J. Mar. Meteorol. 2018, 38, 45–57. (In Chinese) [Google Scholar] [CrossRef]
- Wan, F.; Sun, M.; Pang, H.; Zhao, H.J.; Zhao, C.H. Evolution Mechanism of a Severe Squall Line Triggered by the Coupling of a Sea Breeze Front and a Gust Front. J. Trop. Meteorol. 2024, 30, 200–210. [Google Scholar] [CrossRef] [Scilit]
- Rotunno, R.; Klemp, J.B.; Weisman, M.L. A theory for strong, long-lived squall lines. J. Atmos. Sci. 1988, 45, 463–485. [Google Scholar] [CrossRef] [Scilit]
- Thorpe, A.J.; Miller, M.J.; Moncrieff, M.W. Two-dimensional convection in non-constant shear: A model of mid-latitude squall lines. Q. J. R. Meteorol. Soc. 1982, 108, 739–762. [Google Scholar] [CrossRef]
- Weisman, M.L.; Rotunno, R. “A theory for strong long-lived squall lines” revisited. J. Atmos. Sci. 2004, 61, 361–382. [Google Scholar] [CrossRef] [Scilit]
- Chen, M.X.; Wang, Y.C. Numerical simulation of the interaction between low-level vertical wind shear and cold pool affecting a North China squall line. Acta Meteorol. Sin. 2012, 70, 371–386. (In Chinese) [Google Scholar] [CrossRef]
- Gao, Y.Q.; Sun, L.; Ma, X.L.; Meng, Z.H.; Cheng, K.Q. The sensitivity of the structure and strength of squall line to low-level humidity and environmental vertical wind shear. Trans. Atmos. Sci. 2022, 45, 938–947. (In Chinese) [Google Scholar] [CrossRef]
- Sun, J.H.; Zheng, L.L.; Zhao, S.X. Impact of moisture on the organizational mode and intensity of squall lines determined through numerical experiments. Chin. J. Atmos. Sci. 2014, 38, 742–755. (In Chinese) [Google Scholar] [CrossRef]
- Skamarock, W.C.; Weisman, M.L.; Klemp, J.B. Three-dimensional evolution of simulated long-lived squall lines. J. Atmos. Sci. 1994, 51, 2563–2584. [Google Scholar] [CrossRef] [Scilit]
- Mulholland, J.P.; Peters, J.M.; Morrison, H. How does vertical wind shear influence entrainment in squall lines? J. Atmos. Sci. 2021, 78, 1931–1946. [Google Scholar] [CrossRef] [Scilit]
- Yang, J.; Zheng, Y.Y.; Xia, W.M.; Sun, K.Y. Numerical analysis of a squall line case influenced by northeast cold vortex over Yangtze-Huaihe River Valley. Meteorol. Mon. 2020, 46, 357–366. (In Chinese) [Google Scholar] [CrossRef]
- Yang, S.H.; Wang, L.L.; Liang, J.Q.; Jia, L.F.; Li, L.P.; Xu, X. Feature of Doppler radar data about a squall line strong wind in north of Shanxi Province. J. Nat. Disasters 2011, 20, 113–119. (In Chinese) [Google Scholar] [CrossRef]
- Liu, X.E.; Guo, X.L. Analysis and Numerical Simulation Research on Severe Surface Wind Formation Mechanism and Structural Characteristics of a Squall Line Case. Chin. J. Atmos. Sci. 2012, 36, 1150–1164. (In Chinese) [Google Scholar] [CrossRef]
- Sun, J.S. The pattern structure and thermodynamic and dynamic processes of severe storms associated with linear convective gales. Meteorol. Mon. 2023, 49, 1–11. (In Chinese) [Google Scholar] [CrossRef]
- Qian, Z.L.; Yan, P.W.; Shen, X.L.; Shen, Z.W.; Luo, L. Analysis of a Squall Line Evolution and Impact Factors of Extreme Strong Winds During the Meiyu Period in Zhejiang Province. J. Trop. Meteorol. 2025, 41, 310–321. (In Chinese) [Google Scholar] [CrossRef]
- Locatelli, J.D.; Stoelinga, M.T.; Hobbs, P.V. A new look at the Super Outbreak of tornadoes on 3-4 April 1974. Mon. Weather Rev. 2002, 130, 1633–1651. [Google Scholar] [CrossRef] [Scilit]
- Karan, H.; Fitzpatrick, P.J.; Hill, C.M.; Li, Y.; Xiao, Q.; Lim, E. The formation of multiple squall lines and the impacts of WSR-88D radial winds in a WRF simulation. Weather Forecast. 2010, 25, 242–262. [Google Scholar] [CrossRef] [Scilit][Green Version]
- Shen, X.L.; Sang, M.H.; Zhang, C.Q.; Yu, J.H.; Cao, N.N.; Zhang, W.W.; Chen, S.Q. Comparative analysis of two squall lines and extreme winds continuous affecting Zhejiang on April 2, 2024. Chin. J. Atmos. Sci. 2025, 50, 797–807. (In Chinese) [Google Scholar] [CrossRef]
- Xiao, Y.J.; Wang, J.; Wang, Z.B. An improved automated velocity dealiasing algorithm for Doppler weather radar. Acta Meteorol. Sin. 2026, 84, 362–374. (In Chinese) [Google Scholar] [CrossRef]
- Xiao, Y.J.; Wu, T.; Li, Z.H.; Wan, Y.F.; Wang, J. Retrieving vertical divergence and temperature advection profiles from Doppler weather radar data. Meteorol. Mon. 2016, 42, 987–995. (In Chinese) [Google Scholar] [CrossRef]
- Wang, J.; Xiao, Y.J.; Leng, L.; Fu, Z.K.; Guan, Z.Y. Doppler radar observation and analysis of two convective gale weather events in Wuhan in May 2021. Torrential Rain Disasters 2022, 41, 119–129. (In Chinese) [Google Scholar] [CrossRef]
- Yu, X.D.; Wang, X.M.; Li, W.L.; Fei, H.Y.; Yuan, W. Thunderstorm and Strong Convection Nowcasting; China Meteorological Press: Beijing, China, 2020; pp. 56–57. (In Chinese) [Google Scholar]
- Syndergaard, S.; Kirchengast, G.; Schwaerz, M. Integrating uncertainty propagation in GNSS radio occultation retrieval: From excess phase to atmospheric bending angle profiles. Atmos. Meas. Tech. 2018, 11, 2601–2618. [Google Scholar] [CrossRef] [Scilit]
- Chen, T.; Zhang, F.H.; Fu, J.L.; Yu, C. Analysis of two successive rainstorm-induced long-lived mesoscale convective systems struck Pearl River Estuary during 8-9 May 2014. Meteorol. Mon. 2020, 46, 449–461. (In Chinese) [Google Scholar] [CrossRef]
- Benjamin, T.B. Gravity currents and related phenomena. J. Fluid Mech. 1968, 31, 209–248. [Google Scholar] [CrossRef] [Scilit]
- Klemp, J.B.; Rotunno, R.; Skamarock, W.C. On the dynamics of gravity currents in a channel. J. Fluid Mech. 1994, 269, 169–198. [Google Scholar] [CrossRef] [Scilit]
- Falk, N.M.; Grant, L.D.; Heever, S.C.; Ascher, B.D.; Barbero, T.W.; Davis, C.M.; Escobedo, J.A.; Freeman, S.W.; Heffernan, B.K.; Leung, G.R.; et al. Do Cold Pools Propagate according to Theory? J. Atmos. Sci. 2025, 82, 1481–1497. [Google Scholar] [CrossRef] [Scilit]
- Yang, Y.Y.; He, N.; Yu, X.D.; Zhan, J.J.; Xu, L.Y. Comparison of Summer Convective Parameters Calculated from ERA5 Reanalysis Data and Soundings in Beijing. Chin. J. Appl. Meteorol. Sci. 2025, 36, 705–718. (In Chinese) [Google Scholar] [CrossRef]
- Dawson, D.T.; Mansell, E.R.; Jung, Y.; Wicker, L.J.; Kumjian, M.R.; Xue, M. Low-Level ZDR Signatures in Supercell Forward Flanks: The Role of Size Sorting and Melting of Hail. J. Atmos. Sci. 2014, 71, 276–299. [Google Scholar] [CrossRef] [Scilit]
- Feng, J.Q.; Zhang, S.S.; Wu, C.F.; Jiang, F.; Wu, X.H. Application of Dual Polarization Weather Radar Products to Severe Convective Weather in Fujian. Meteorol. Mon. 2018, 44, 1565–1574. (In Chinese) [Google Scholar]
- Kumjian, M.R.; Ryzhkov, A.V. Polarimetric signatures in supercell thunderstorms. J. Appl. Meteorol. Climatol. 2008, 47, 1940–1961. [Google Scholar] [CrossRef] [Scilit]
- Van Lier-Walqui, M.; Fridlind, A.M.; Ackerman, A.S.; Collis, S.; Helmus, J.; MacGorman, D.R.; North, K.; Kollias, P.; Posselt, D.J. On polarimetric radar signatures of deep convection: Columns of specific differential phase observed during MC3E. Mon. Weather Rev. 2016, 144, 737–758. [Google Scholar] [CrossRef] [Scilit] [PubMed]
- Park, H.S.; Ryzhkov, A.V.; Zrnić, D.S.; Kim, K.E. The hydrometeor classification algorithm for the polarimetric WSR-88D. Weather Forecast. 2009, 24, 730–748. [Google Scholar] [CrossRef] [Scilit]
- Ryzhkov, A.V.; Kumjian, M.R.; Ganson, S.M.; Zhang, P.F. Polarimetric radar characteristics of melting hail. Part II: Practical implications. J. Appl. Meteorol. Climatol. 2013, 52, 2871–2886. [Google Scholar] [CrossRef] [Scilit]
- Wang, C.M.; Yu, X.D.; Li, Z.X.; Li, J.B.; Wang, X.M. Investigation of extreme flash-rain events on the impact of Taihang Mountain. Meteorol. Mon. 2017, 43, 425–433. (In Chinese) [Google Scholar] [CrossRef]
- Sun, J.S. The Effects of Vertical Distribution of the Lower Level Flow on Precipitation Location. Plateau Meteorol. 2005, 24, 62–69. (In Chinese) [Google Scholar] [CrossRef]
- Fan, L.M.; Yu, X.D. Characteristic Analyses on Environmental Parameters in Short-Term Severe Convective Weather in China. Plateau Meteorol. 2013, 32, 156–165. (In Chinese) [Google Scholar] [CrossRef]
- Fang, C.; Wang, X.G.; Sheng, J.; Cao, Y.C. Temporal and spatial distribution of North China thunder-gust winds and the statistical analysis of physical characteristics. Plateau Meteorol. 2017, 36, 1368–1385. (In Chinese) [Google Scholar]
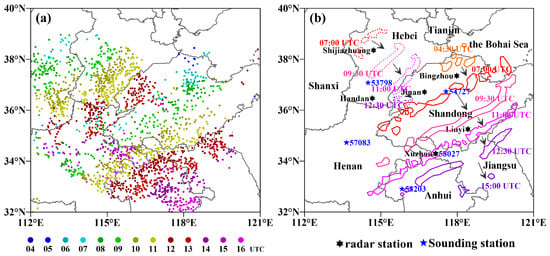
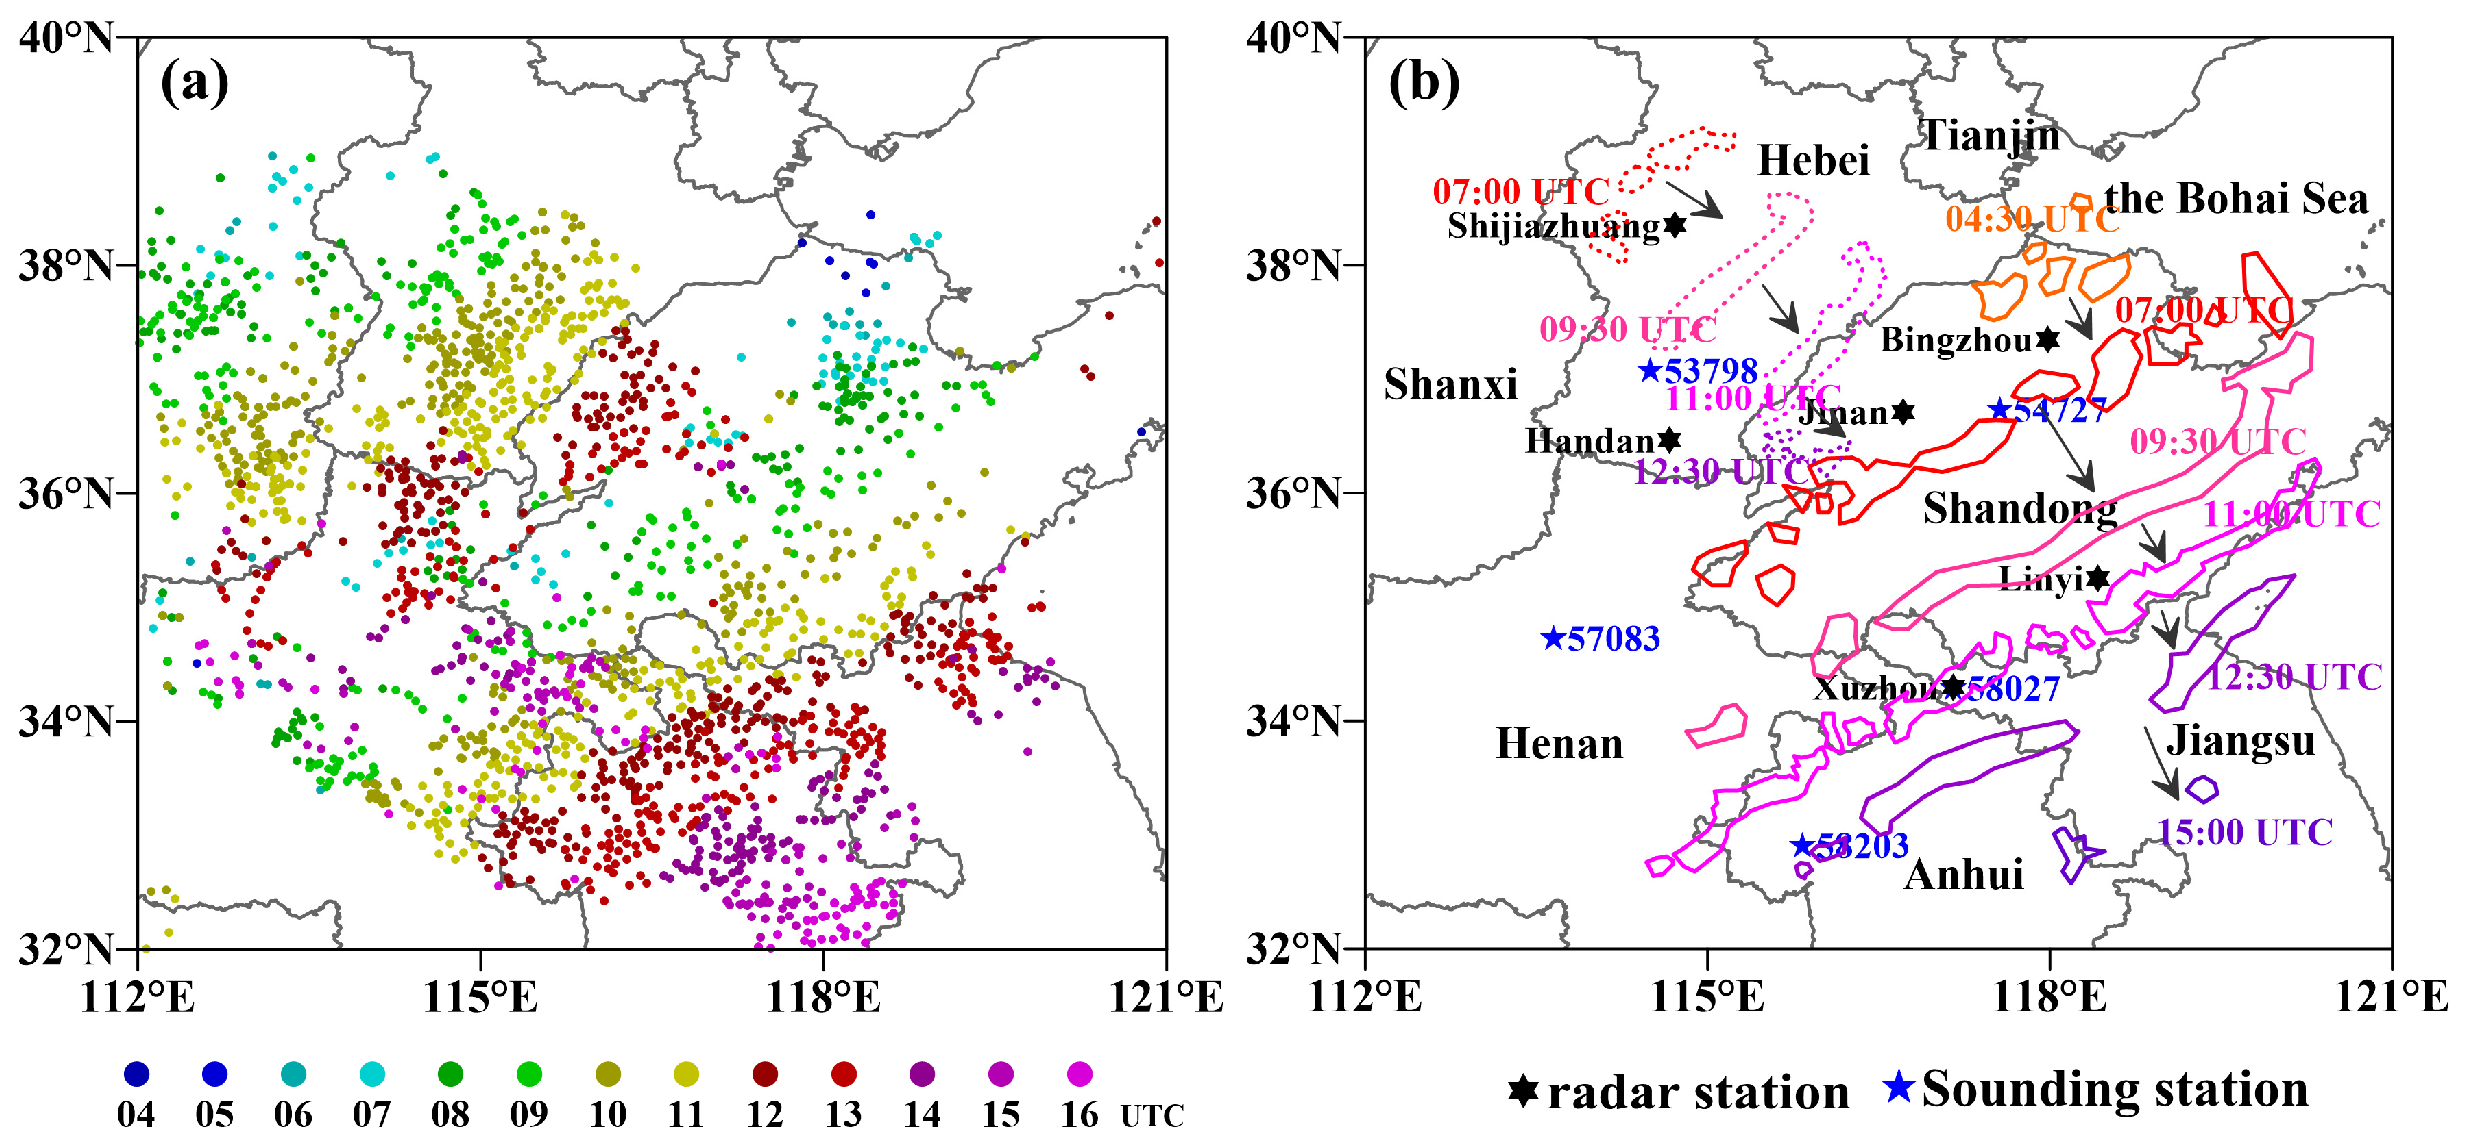
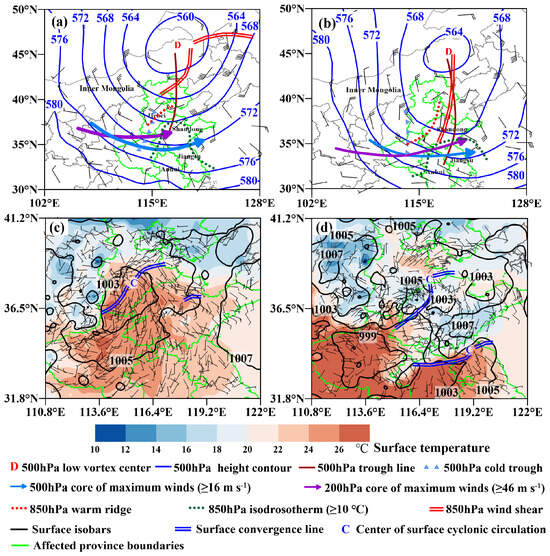
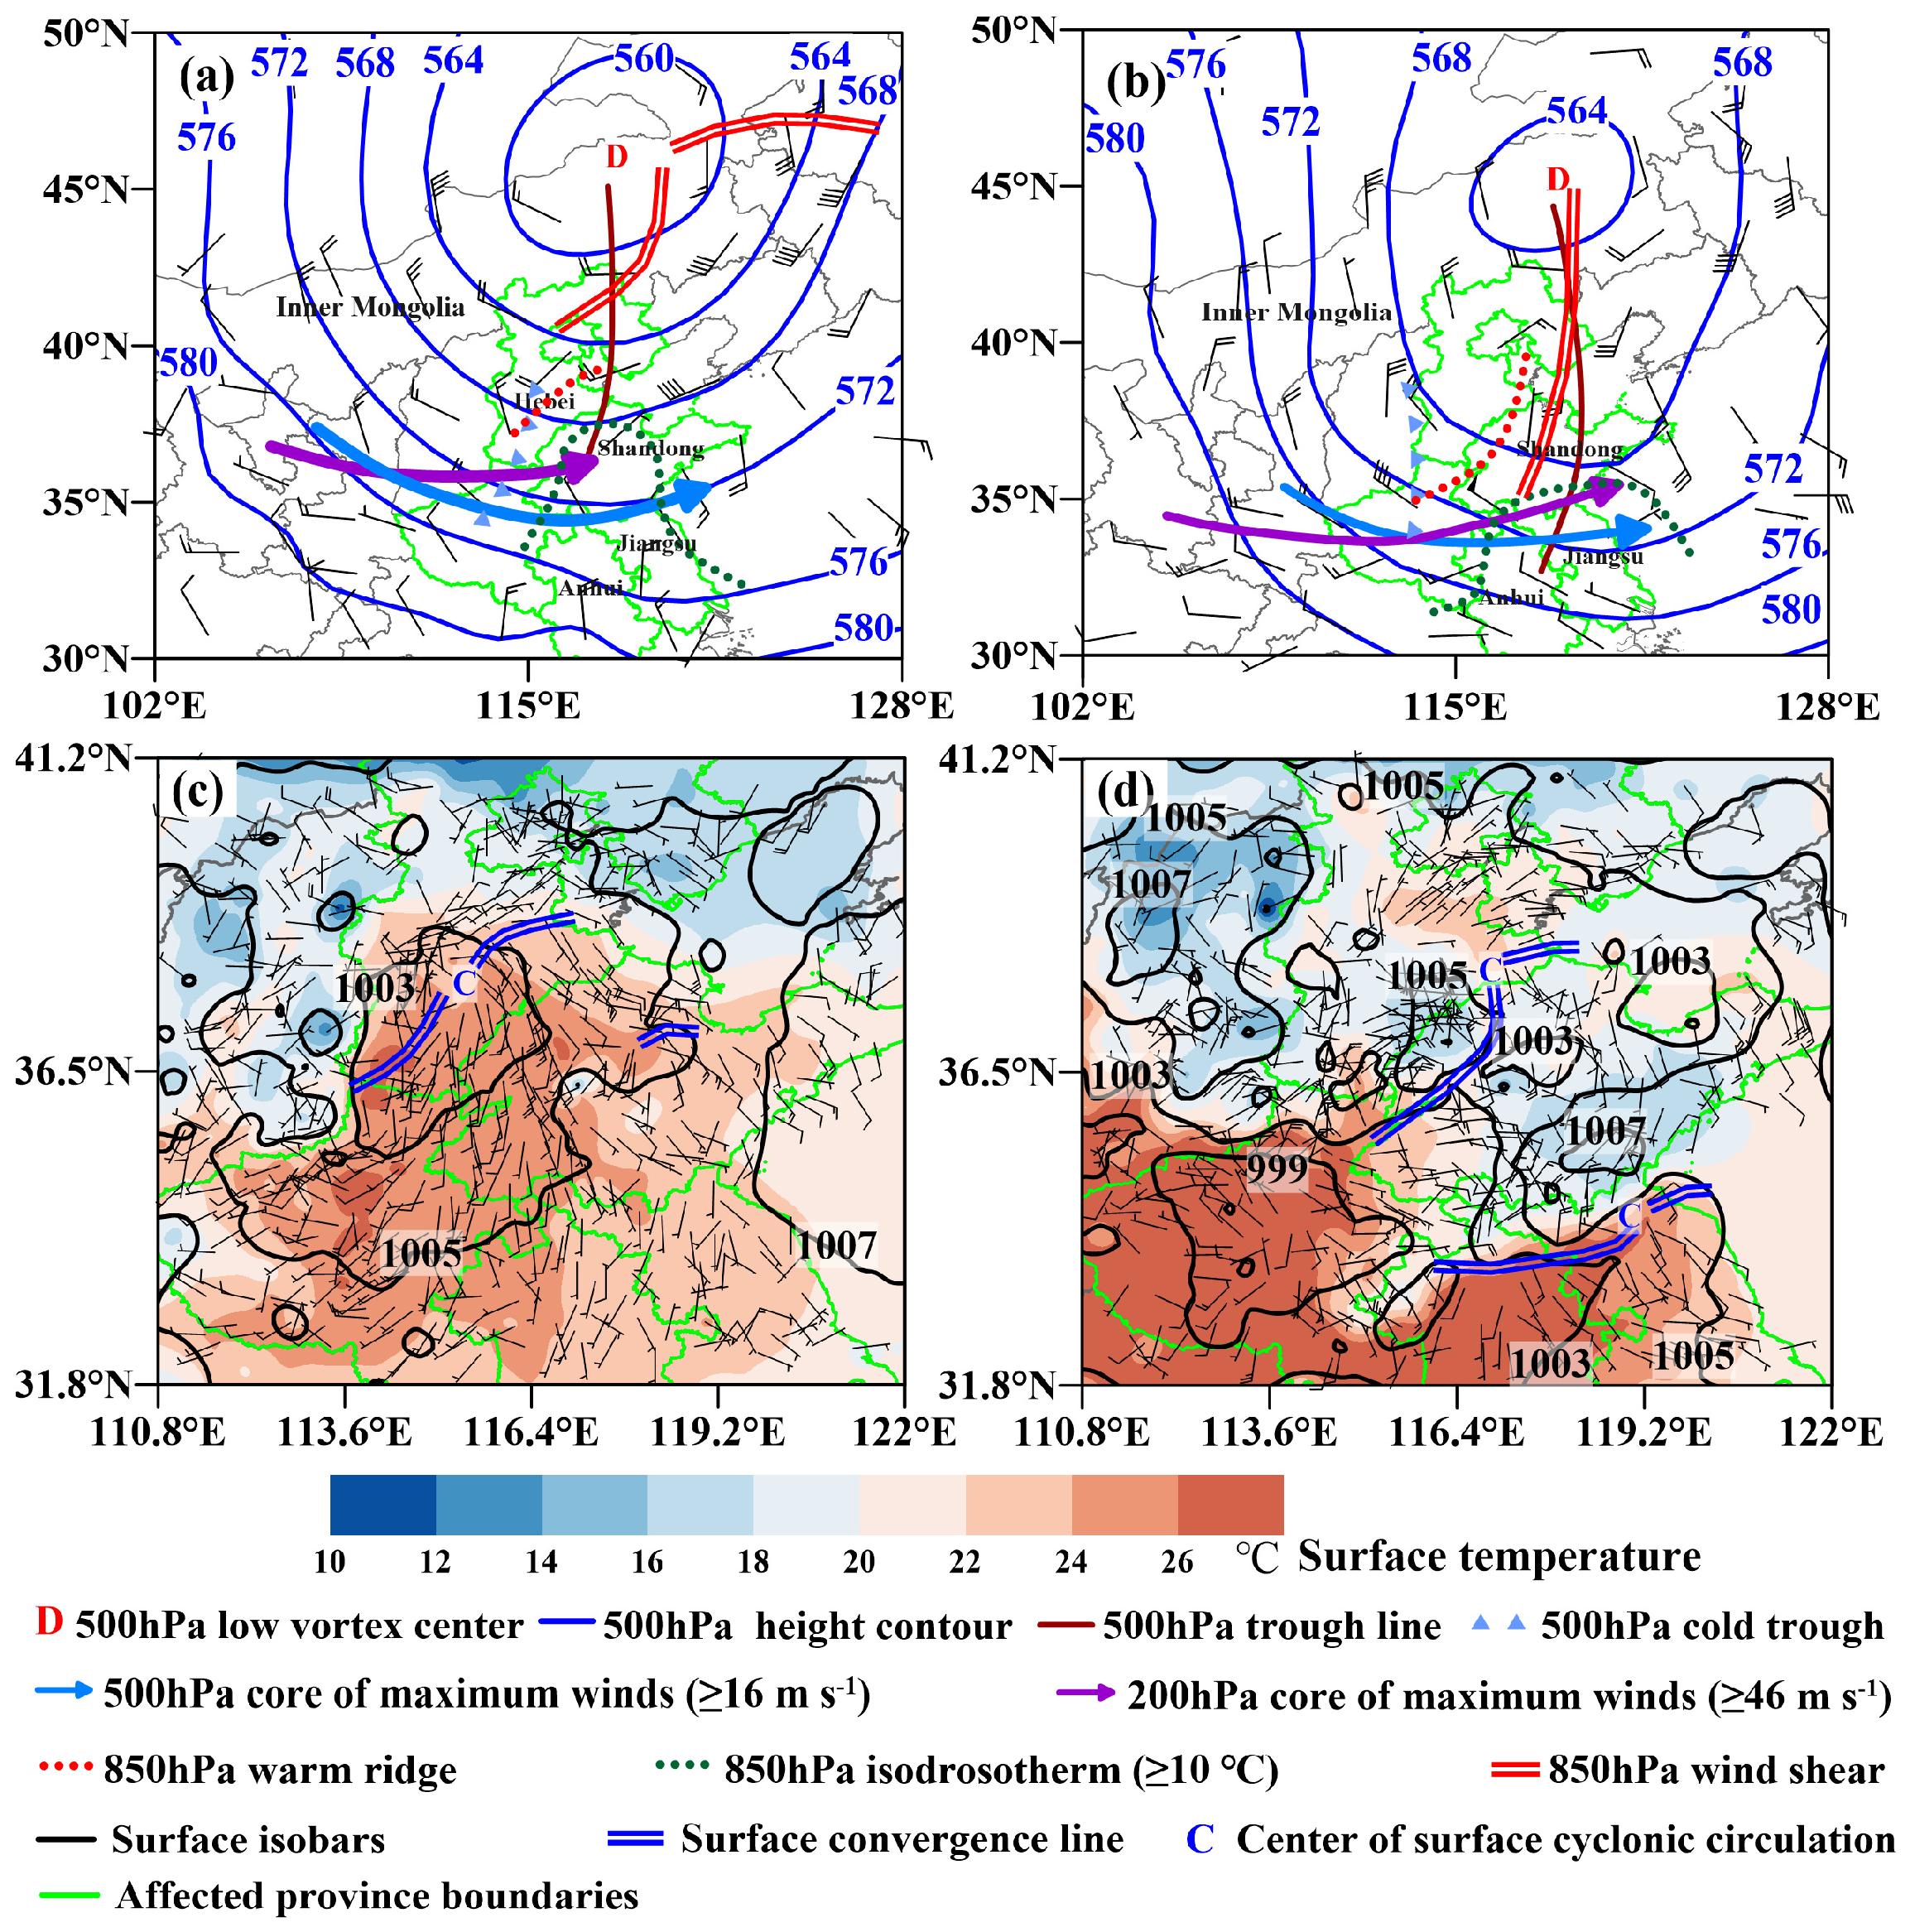
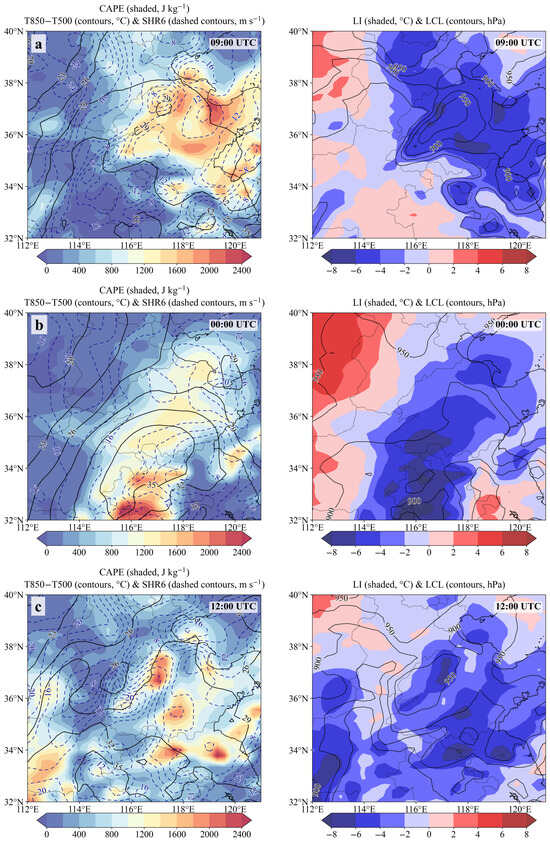
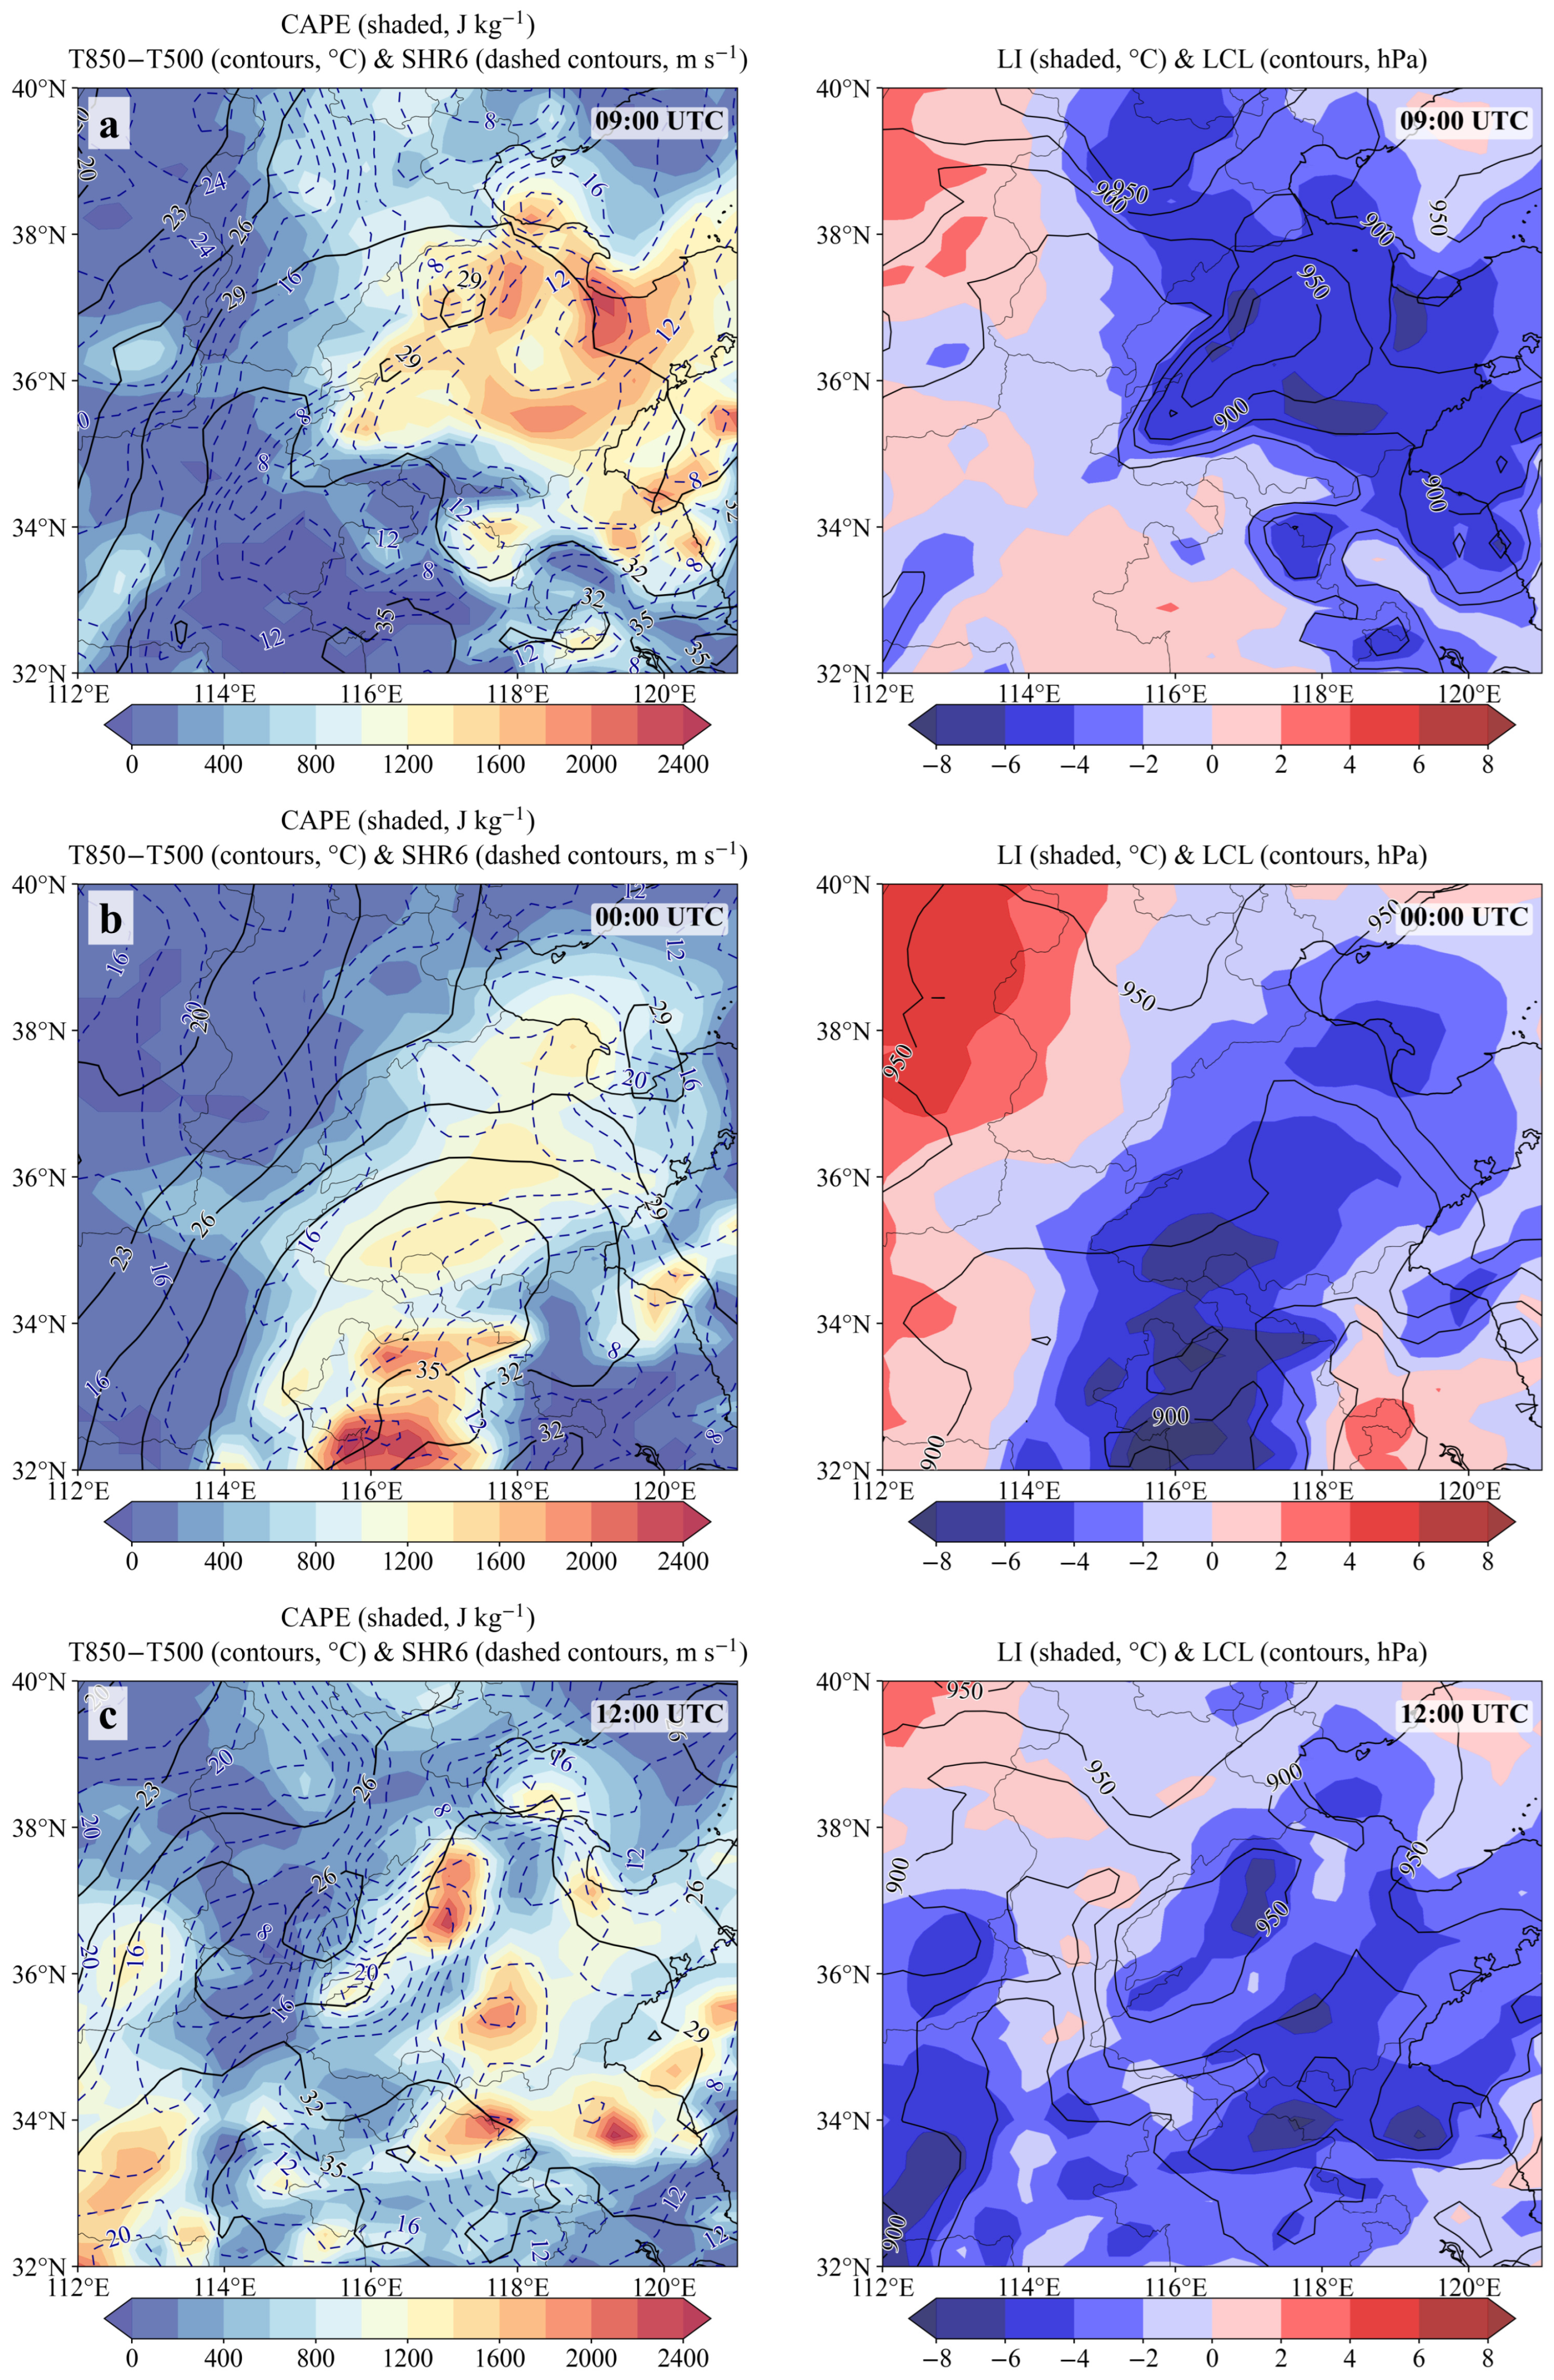
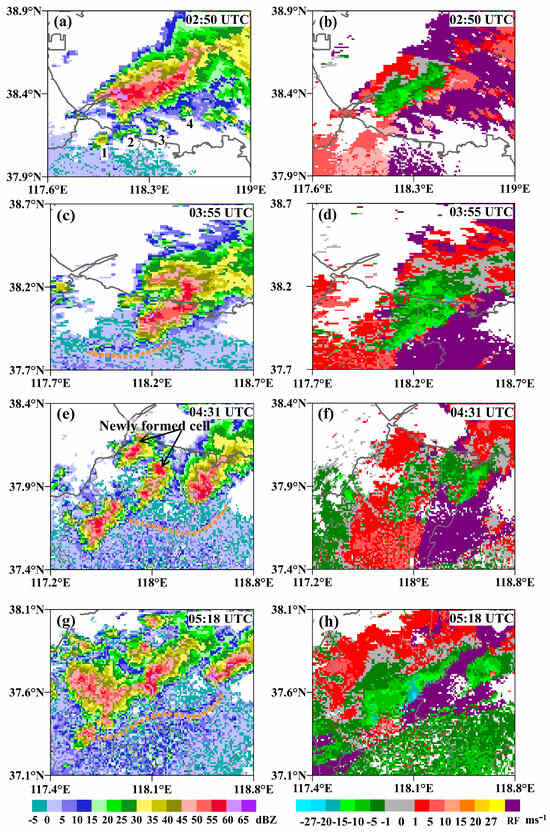
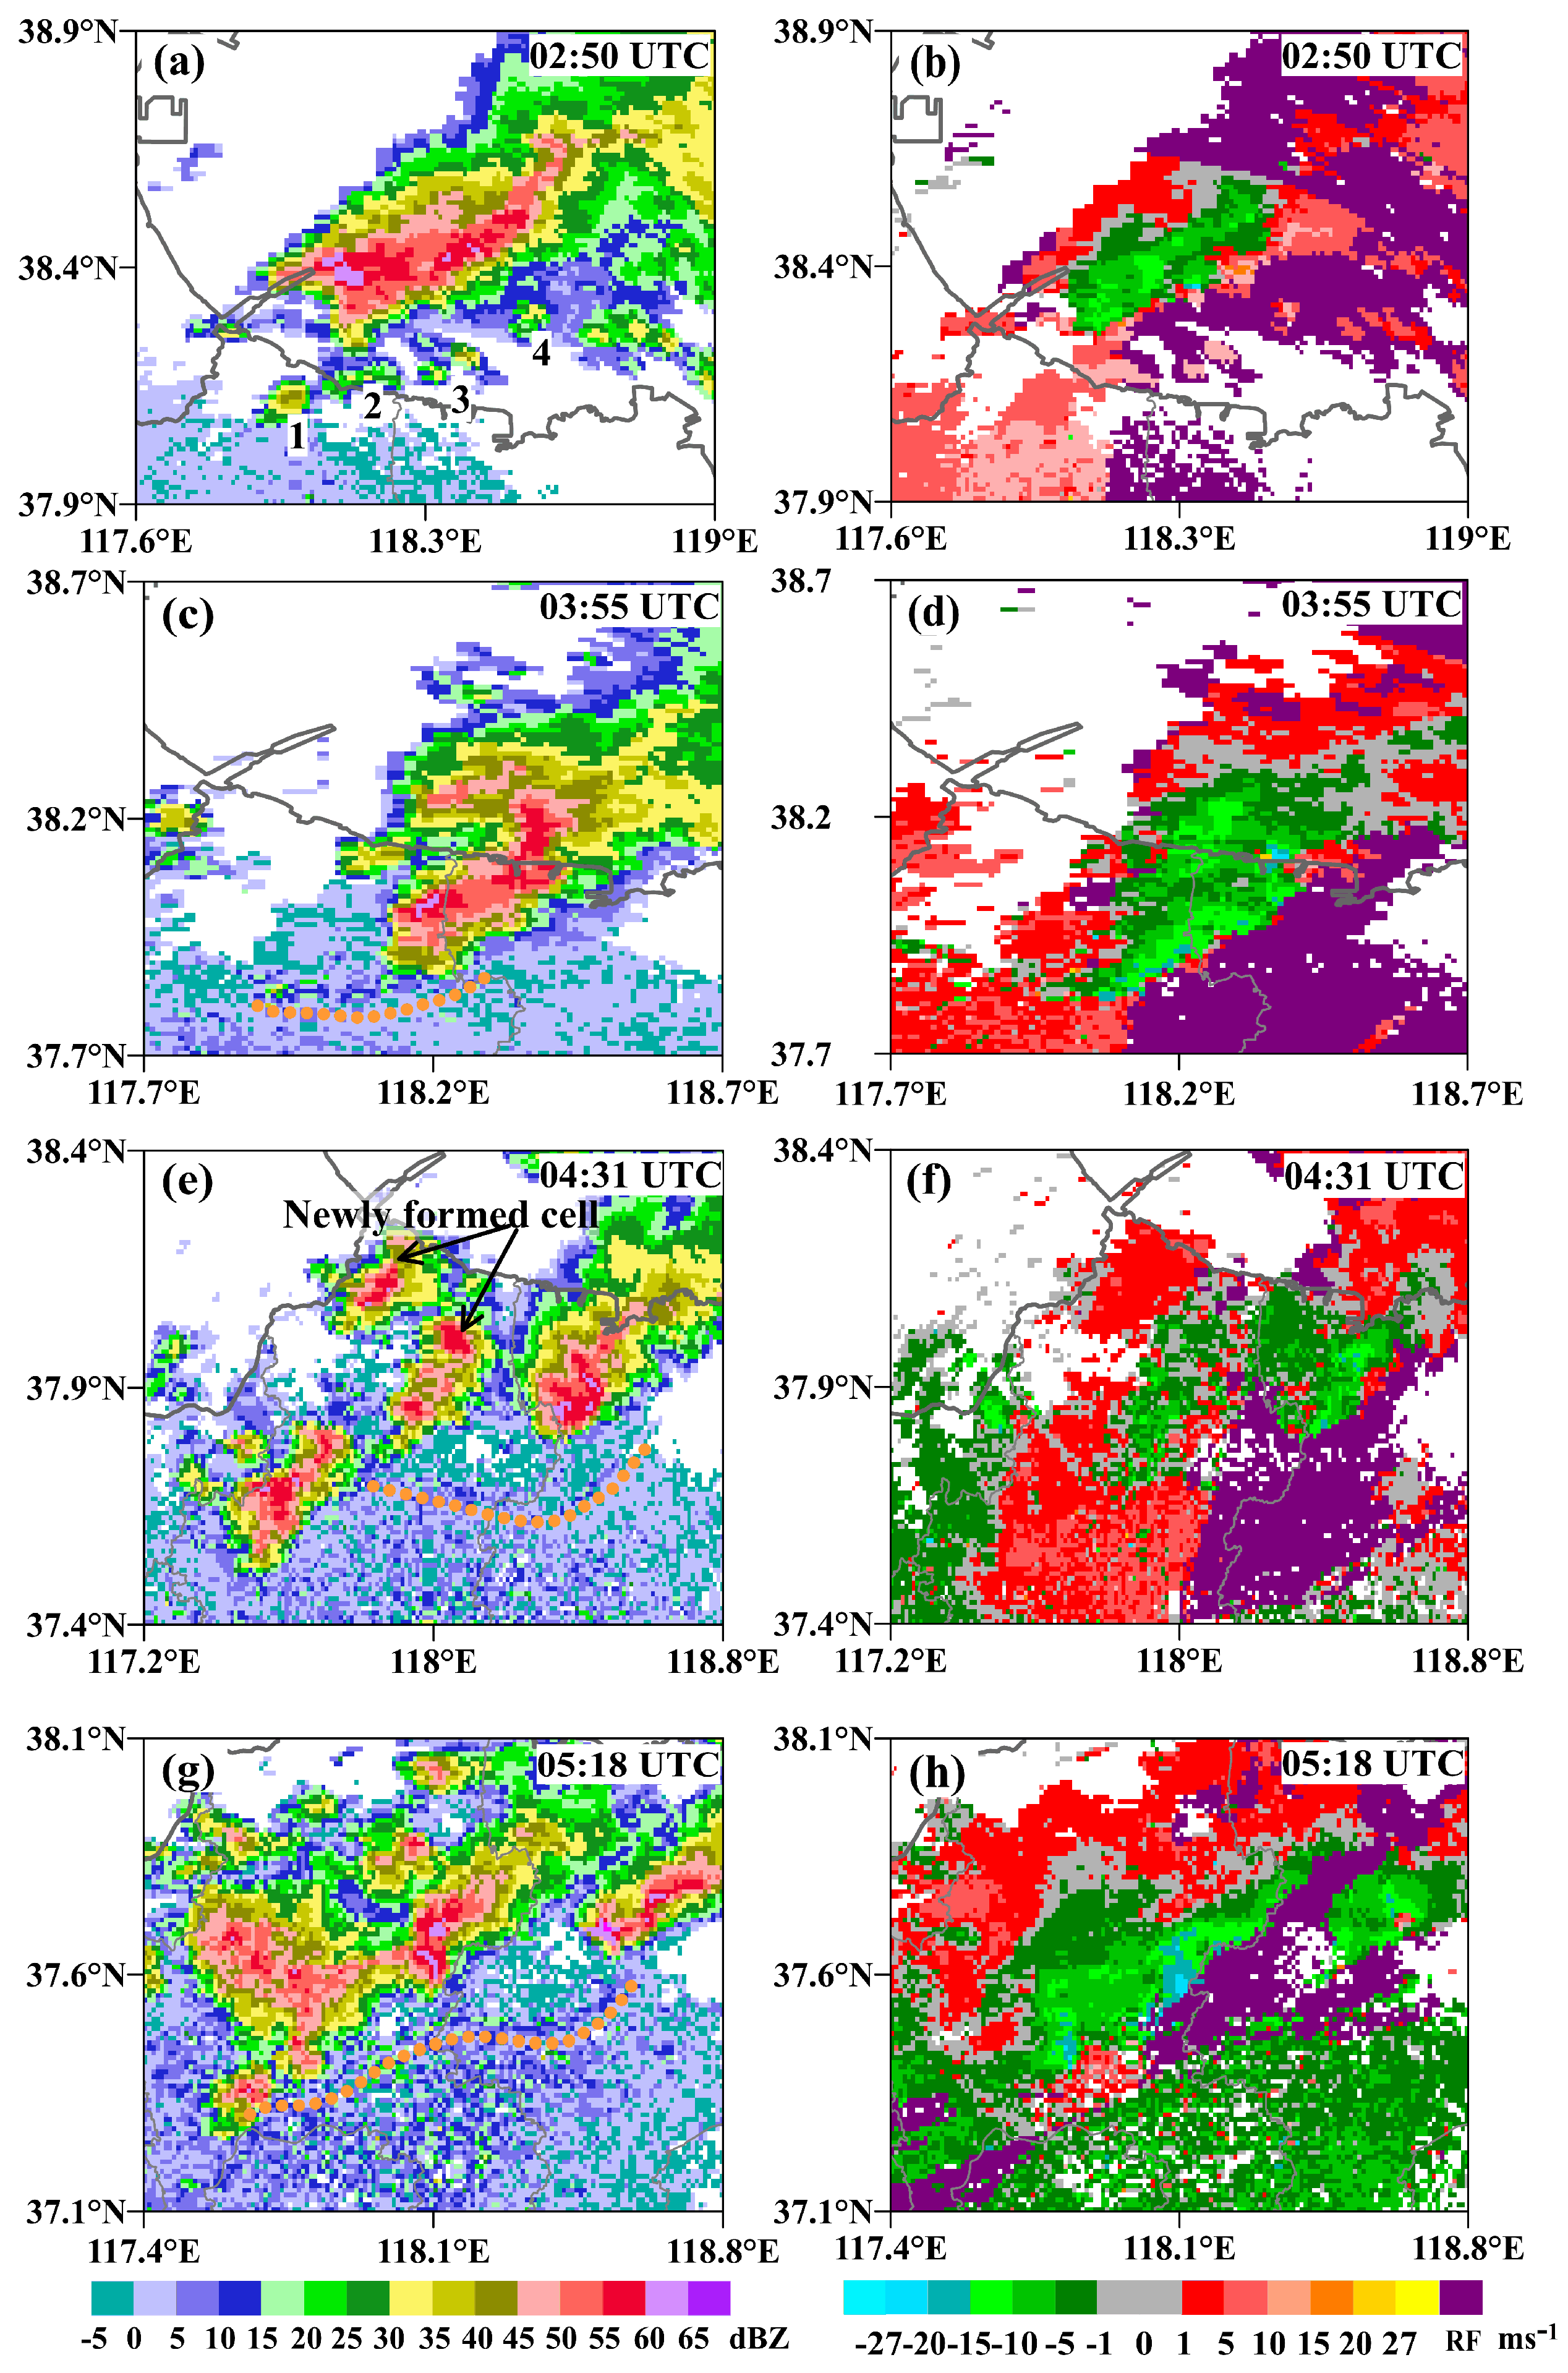
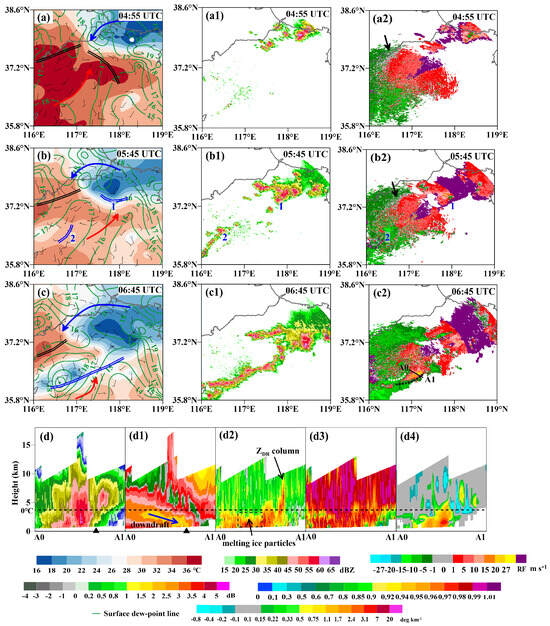
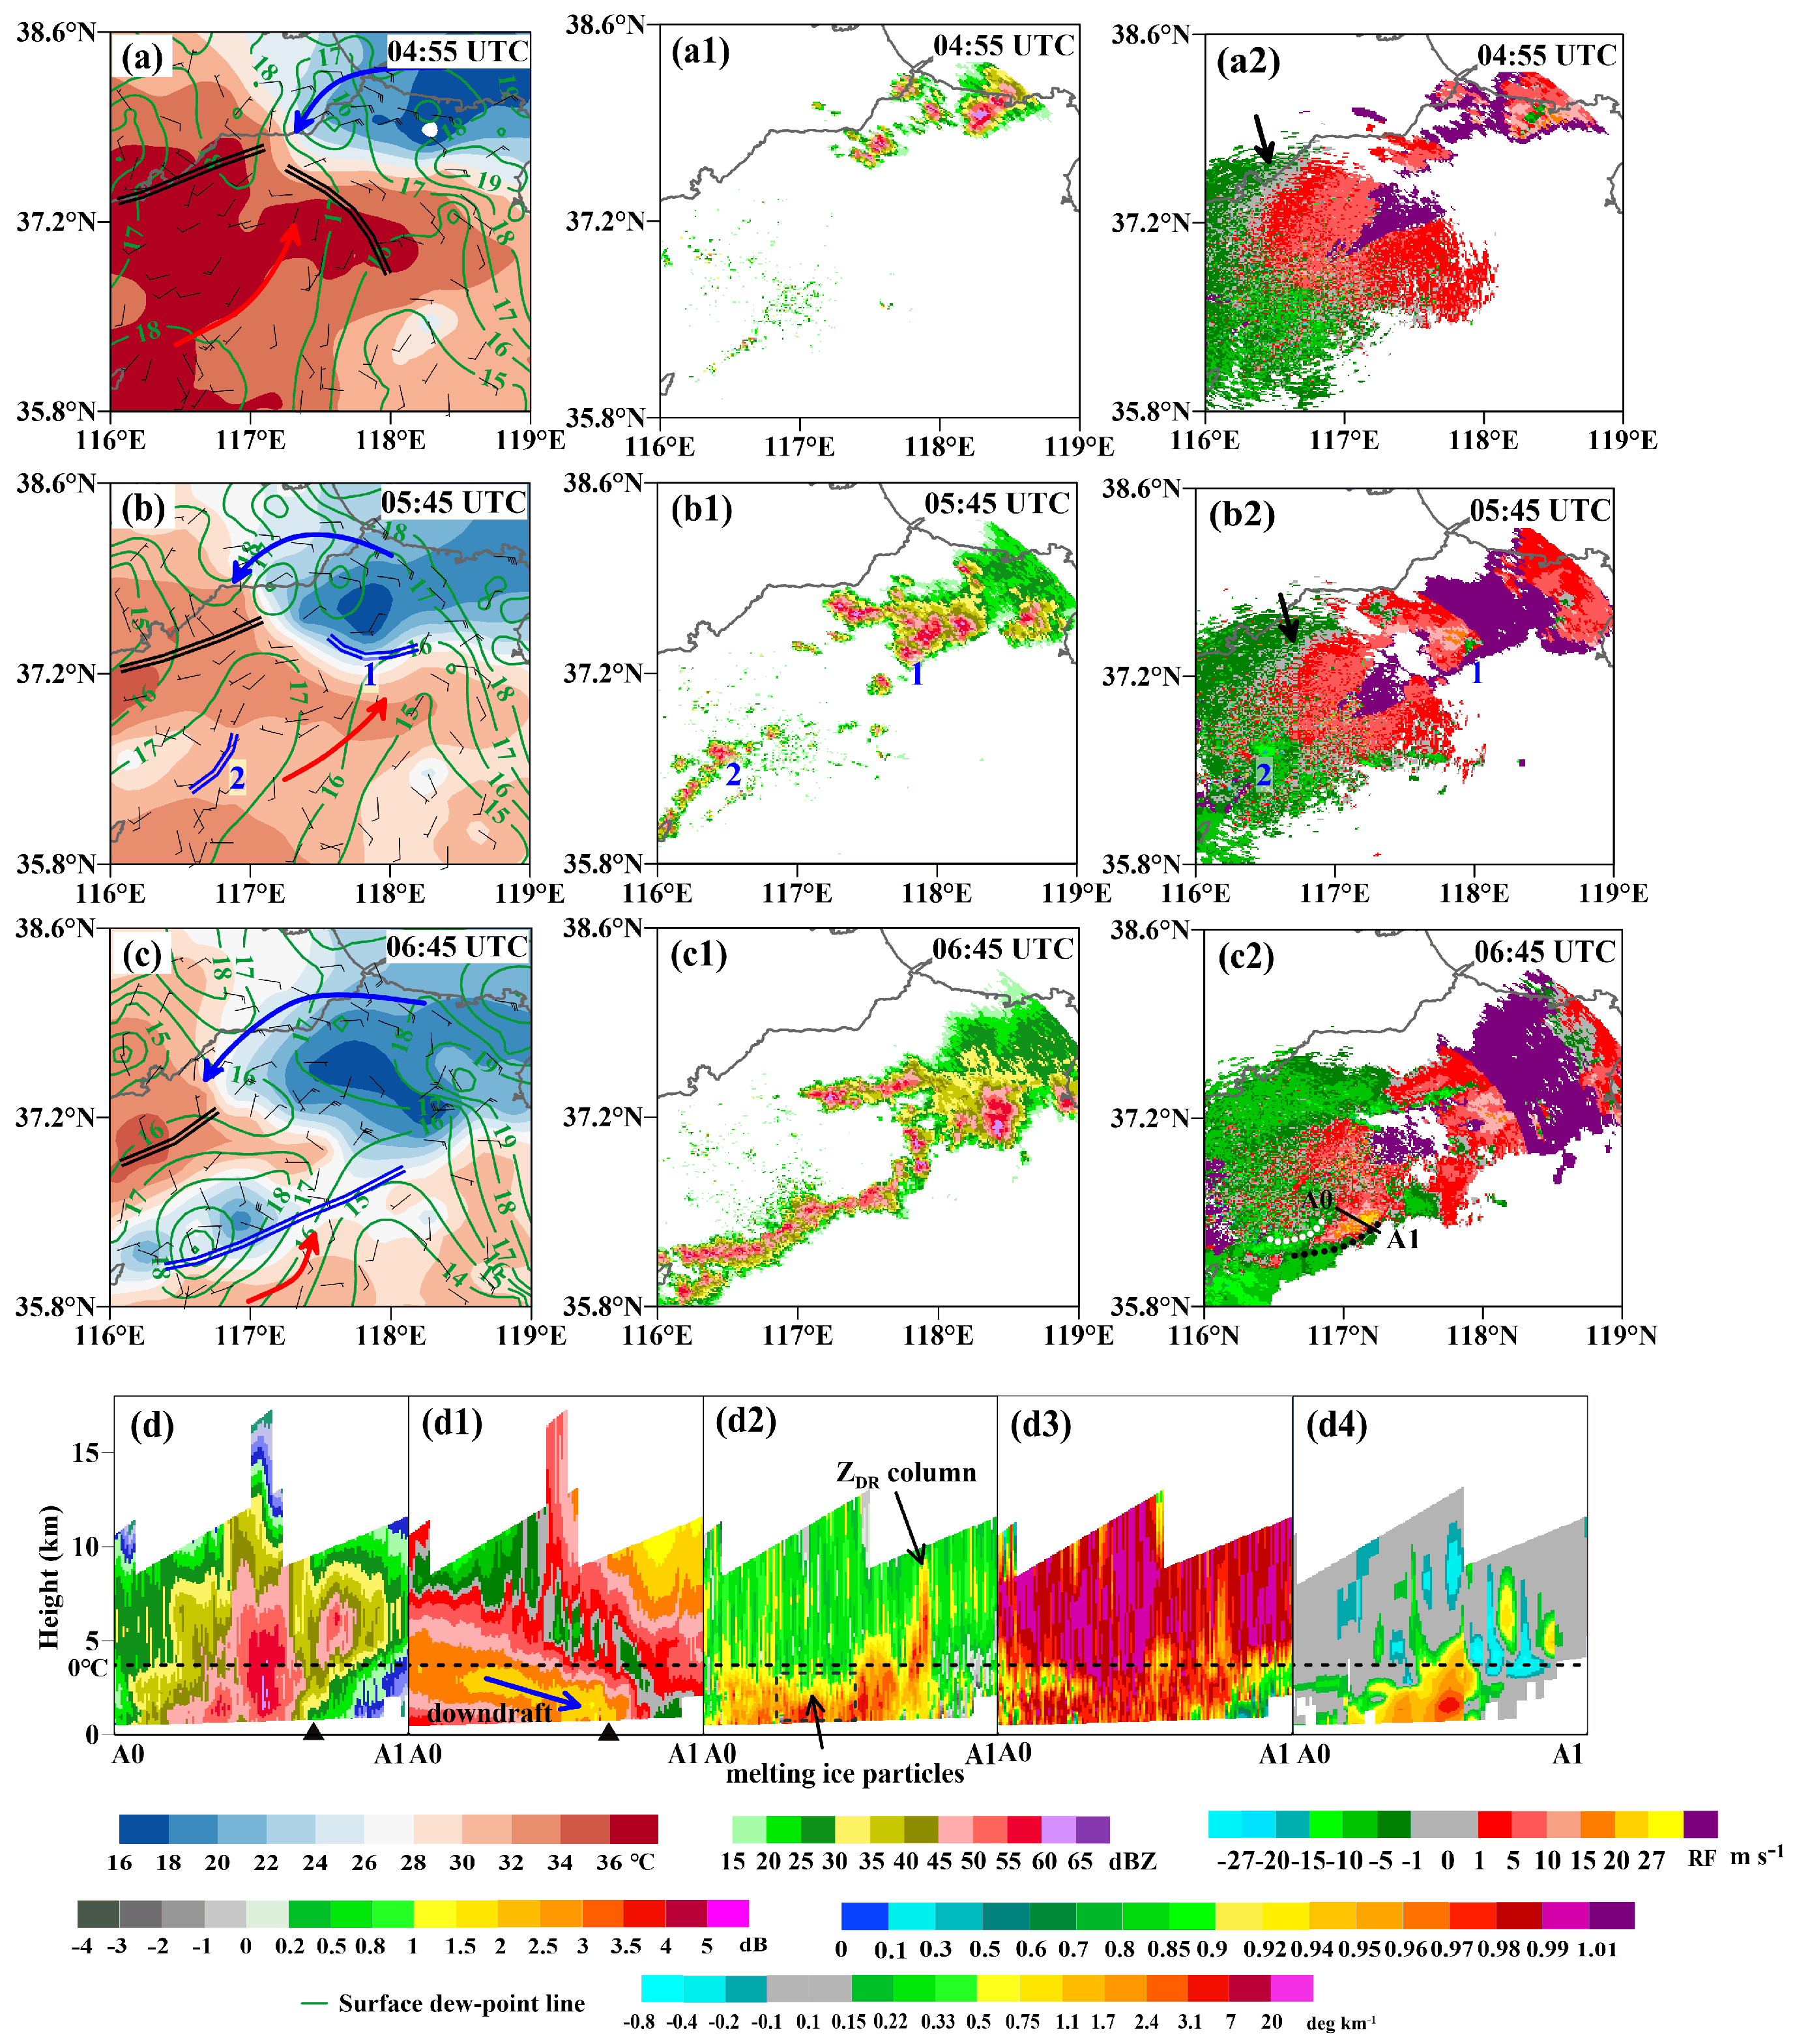
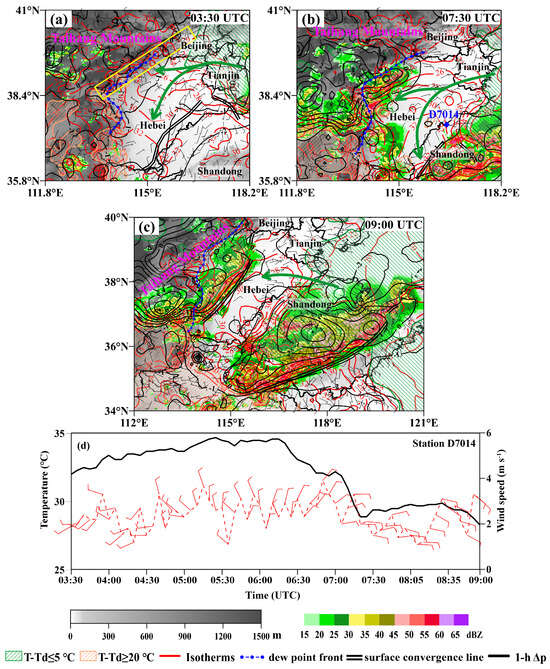
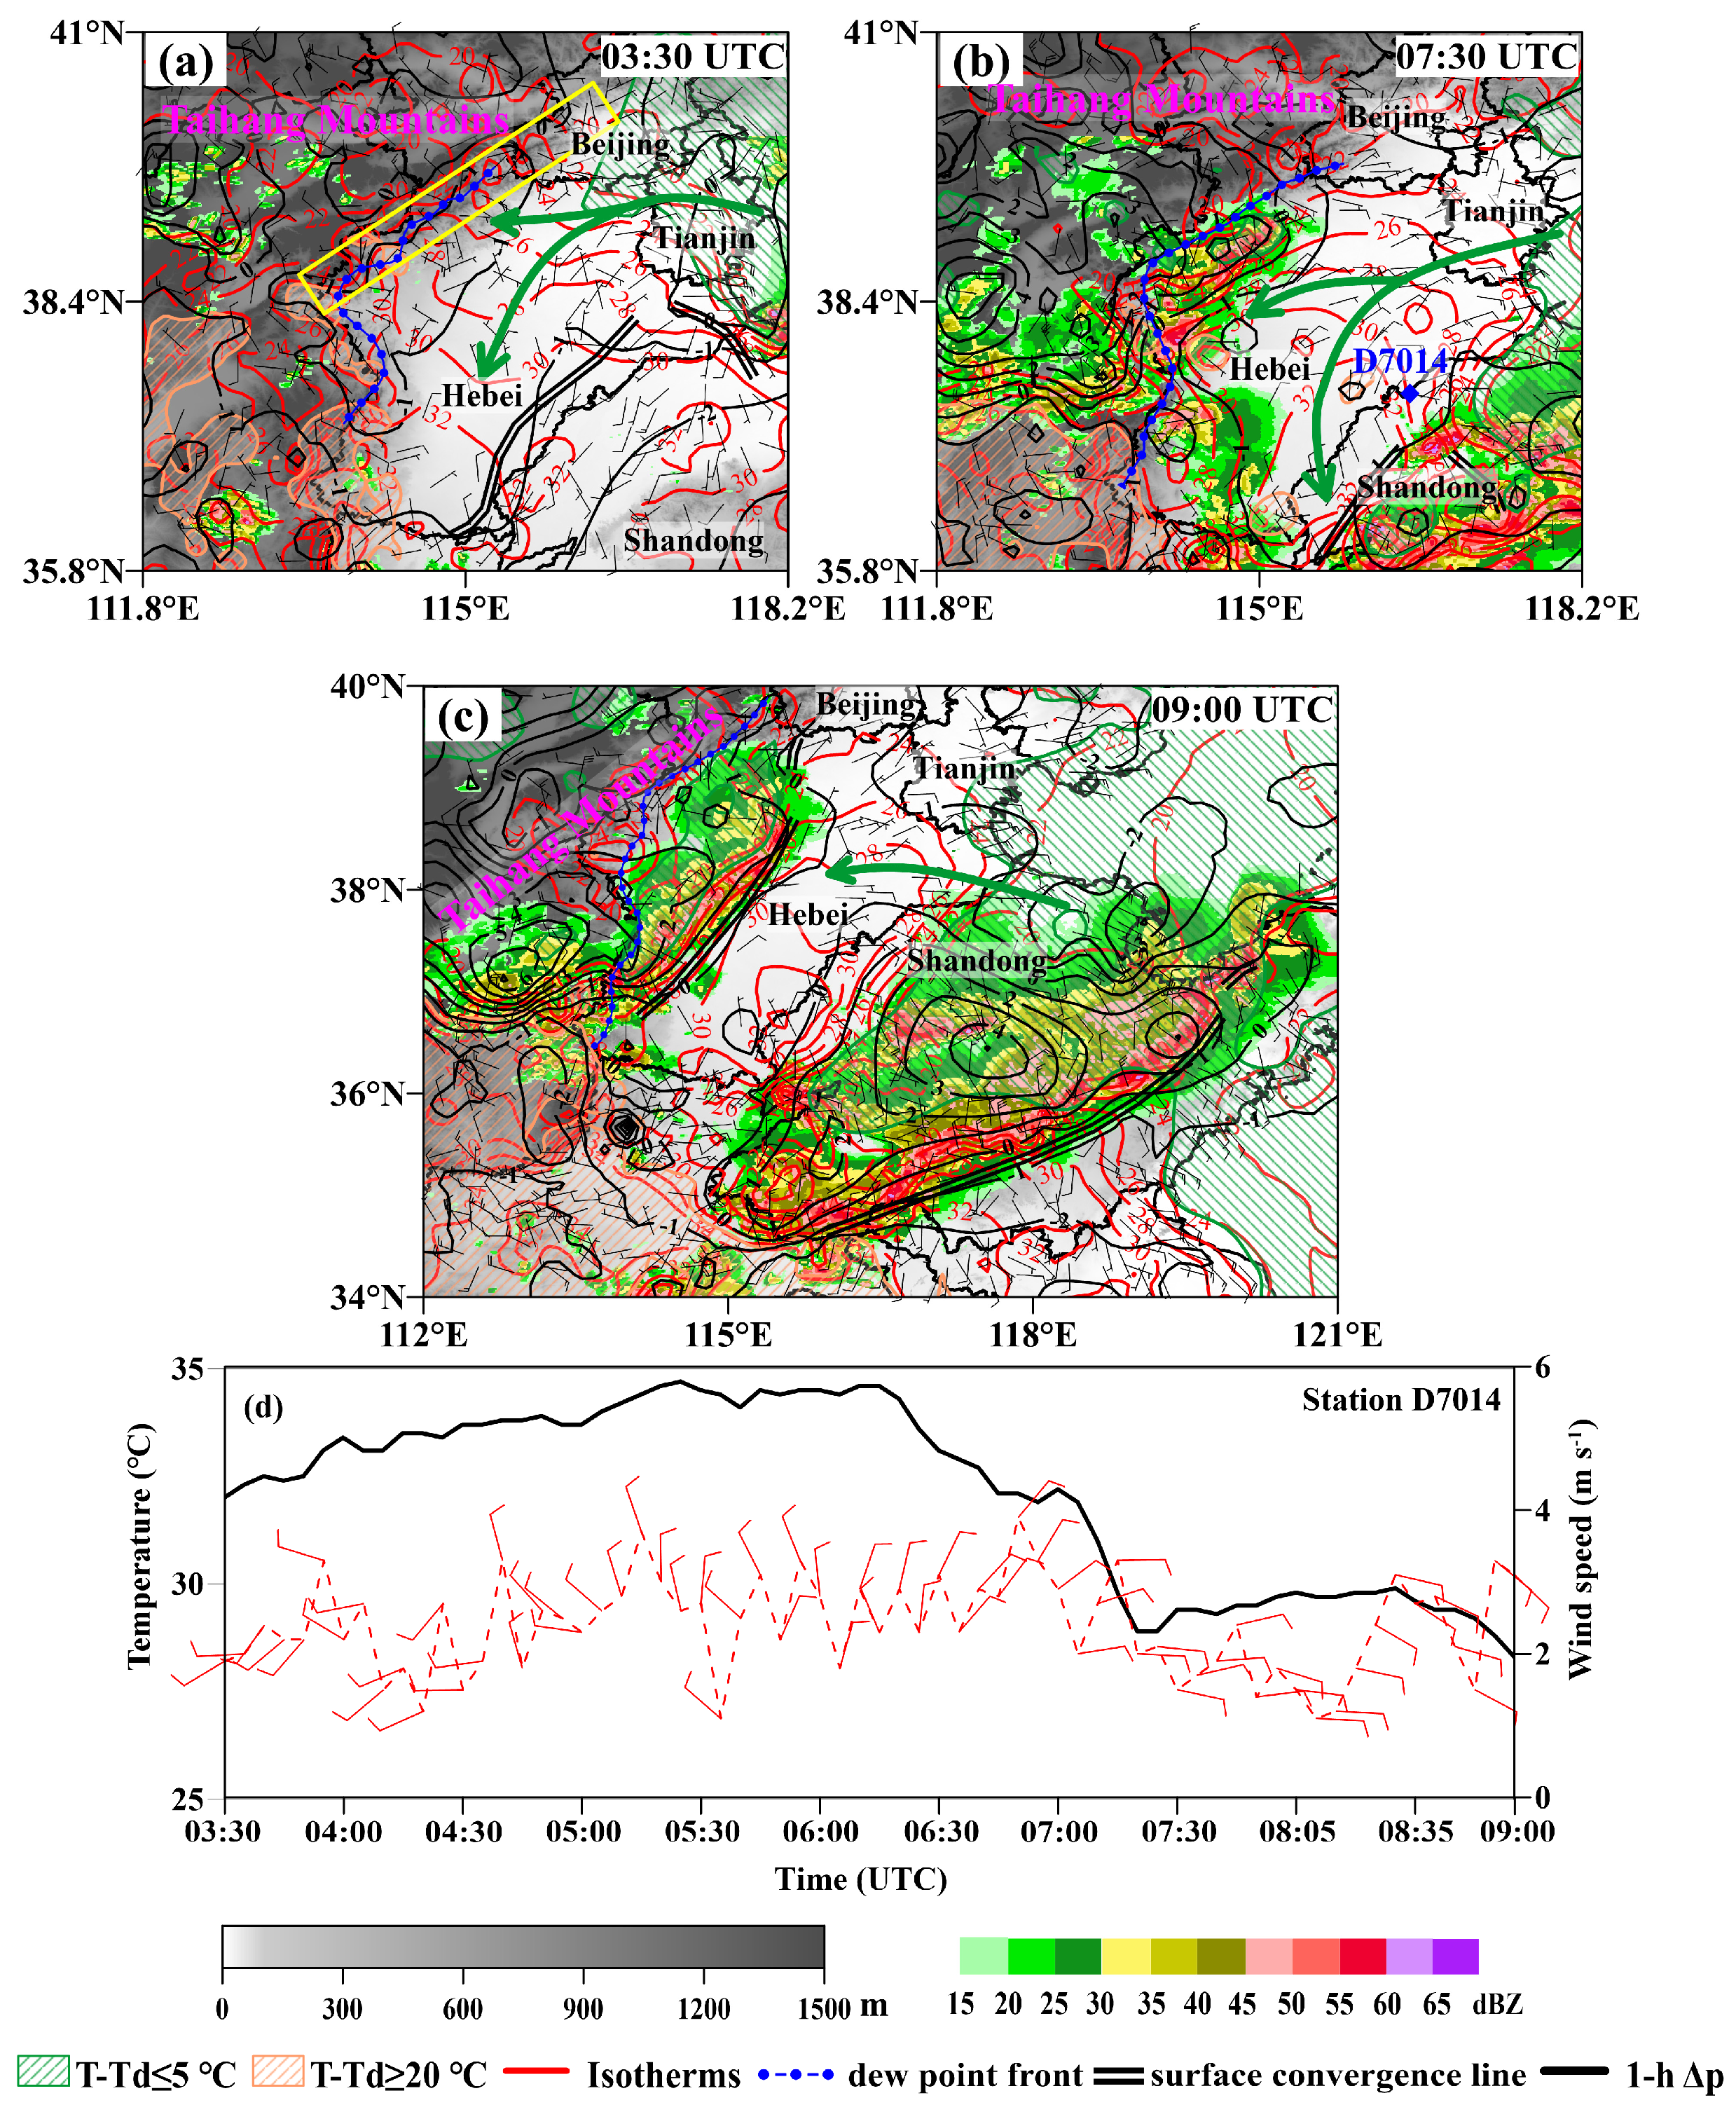
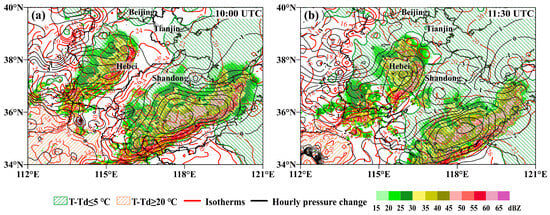
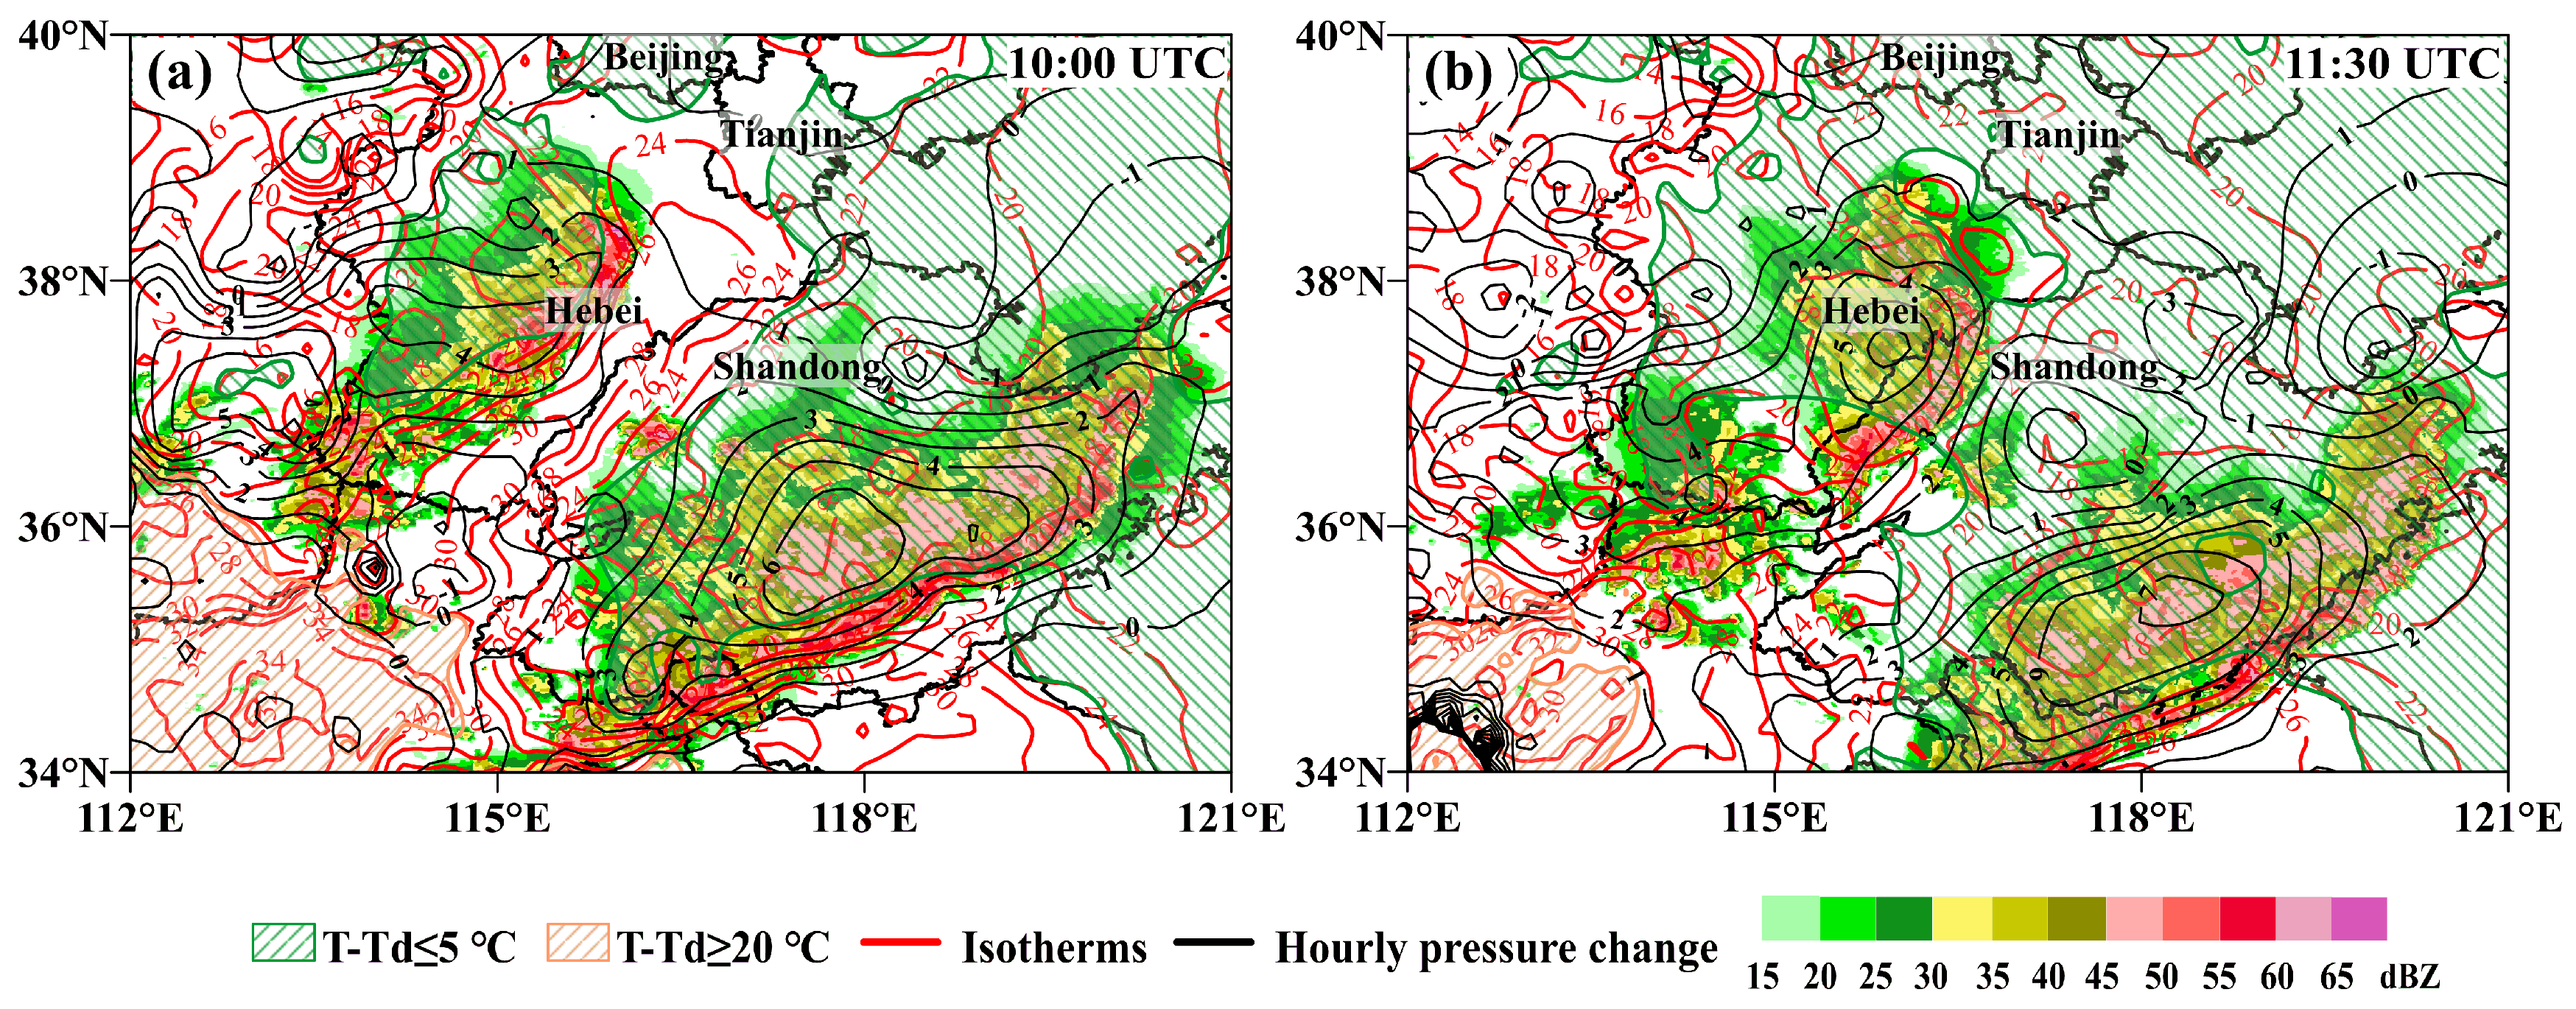
Disclaimer/Publisher’s Note: The statements, opinions and data contained in all publications are solely those of the individual author(s) and contributor(s) and not of MDPI and/or the editor(s). MDPI and/or the editor(s) disclaim responsibility for any injury to people or property resulting from any ideas, methods, instructions or products referred to in the content. |
© 2026 by the authors. Licensee MDPI, Basel, Switzerland. This article is an open access article distributed under the terms and conditions of the Creative Commons Attribution (CC BY) license.