


Highlights
- A novel hex-view BTSCAD framework integrates Biology, Task, Sensor, Condition, Algorithm, and Dataset to unify remote-sensing-based plant disease detection.
- Biological processes, sensing conditions, data characteristics and processing methods jointly constrain disease detectability and interpretation.
- Identifying the key limitations of using remote sensing for plant disease detection in real-world applications.
- Future directions toward multi-scale integration, large-scale datasets, and transferable models in precision agriculture and plant phenotyping.
Abstract
Plant diseases lead to substantial yield losses and pose a persistent threat to global food security, creating an urgent demand for high-throughput, accurate, scalable, and non-destructive disease-monitoring approaches. Remote sensing has emerged as a powerful tool, yet progress in plant disease detection remains fragmented across various disciplines, tasks, sensing methods, and data modalities. This review introduces a hex-view perspective to synthesise remote-sensing-based plant disease detection within a cohesive conceptual framework. Instead of treating sensing technologies, algorithms, and datasets independently, the hex-view incorporates six interconnected dimensions that jointly capture how biological processes, the measurement scale, and data characteristics constrain disease detectability, including when detection is possible and how reliably it can be achieved. The hex-view framework comprises six interconnected dimensions and forms an integrated framework called BTSCAD: (1) Biology (B): plant–pathogen interactions constituting the biological foundation of disease development and expression. (2) Task (T): the diverse disease-detection tasks and their corresponding research objectives. (3) Sensor (S): the sensing modalities that define the data acquisition type and richness of captured information. (4) Condition (C): the environmental conditions, sensing platforms, and spatial scales that shape disease observations and bridge controlled experiments and real-world deployment across leaf, canopy, plot, and regional scales. (5) Algorithm (A): the classical and state-of-the-art data-analysis algorithms used to extract disease-related information from sensor data. (6) Dataset (D): the data sources that underpin model development, evaluation, and generalisability. The hex-view perspective provides a clear framework for interpreting previous research and identifying future research directions. This review lays a structured foundation for developing robust, interpretable, and transferable disease-detection systems, supporting advancements in precision agriculture, high-throughput phenotyping, and sustainable crop production.
1. Introduction
Plant diseases pose a significant challenge to global agricultural production, causing major yield losses and an ongoing threat to food security, crop quality, and ecosystem sustainability. It is estimated that plant diseases can cause annual yield reductions of over 20–40% in key staple crops, with severe outbreaks leading to even greater losses in vulnerable regions [1]. This situation increases the reliance on chemical control, raises production costs, and results in greater environmental impacts, ultimately undermining the long-term sustainability of modern agricultural systems.
To address these issues, plant breeding programs are increasingly prioritising the development of disease-resistant cultivars as a primary strategy for mitigating yield losses and reducing reliance on chemical inputs [2]. Therefore, accurate and efficient disease assessment is essential throughout the breeding pipeline, from early-generation screening to multi-location field trials. Over the past few decades, advances in DNA-based and serological diagnostic techniques have significantly improved the identification and quantification of plant pathogens [3,4]. These methods provide high specificity and sensitivity, enabling the detection of infections before symptoms appear. However, their destructive nature, high costs, labour intensity, and limited throughput restrict their application in large-scale field phenotyping.
In practice, disease evaluation in breeding trials still primarily relies on visual assessment performed by trained experts. While there are detailed assessment guidelines and standardised protocols available [5], visually scoring across hundreds or thousands of breeding lines is time-consuming, subjective, and prone to inter- and intra-observer variability. These limitations can substantially reduce phenotyping accuracy and consistency, particularly when disease symptoms are spatially unevenly distributed or temporally dynamic [6]. As a result, there is a growing interest in automated, high-throughput disease phenotyping frameworks that integrate imaging sensors with machine-learning and deep-learning algorithms. Such systems promise the objective, repeatable, and scalable measurement of disease symptoms, offering the potential to transform disease assessment in breeding programs and accelerate the identification of resistant genotypes [7].
In addition to breeding, precise identification and mapping of diseases under field conditions are crucial in precision agriculture. Accurate information on the location, extent, and severity of diseases and pests is essential for implementing timely and targeted plant-protection strategies within managed production systems. The early detection of disease symptoms enables site-specific interventions that reduce pesticide use, lower production costs, and minimise environmental impacts, all while maintaining the yield and product quality [8]. Therefore, precision agriculture requires disease-detection approaches that are not only accurate but also scalable, spatially explicit, and capable of functioning effectively under real field conditions. This need has established remote sensing (RS) as a key enabling technology for modern disease-monitoring frameworks.
RS technologies offer the non-destructive monitoring of plant health across various spatial and temporal scales. When combined with real-time data analytics, RS enables site-specific disease monitoring and supports informed decision-making in both breeding and crop management. Conceptually, the RS of plant diseases can be viewed as a form of “radiodiagnosis” for plants, where disease-induced changes in plant structure, pigmentation, and physiology are inferred from reflected, emitted, or transmitted electromagnetic signals. A wide range of sensors and platforms have been applied to plant disease detection, including red–green–blue (RGB) cameras, multispectral and hyperspectral sensors, fluorescent systems, thermal sensors, and radar systems. These can be deployed on handheld devices, ground-based platforms, Unmanned Aerial Vehicles (UAVs), manned aircraft, and satellites. Such technologies enable disease detection at multiple biological and spatial scales, from leaf- and plant-scale measurements to canopy, field, and regional-scale assessments.
Coupled with advances in machine learning technologies, RS has been increasingly used for diverse disease-detection tasks. However, despite rapid technological progress, effective RS-based plant disease detection remains challenging. A fundamental limitation arises from the biological complexity of host–pathogen interactions. These relationships are inherently dynamic, with symptom expression and pathogen characteristics evolving as organisms develop [9,10]. Many diseases exhibit latent or asymptomatic stages during which physiological changes occur before visible symptoms appear, complicating early detection. In addition, disease symptoms vary widely across plant species, cultivars, growth stages, and environmental conditions. These factors, along with differences in sensor types, illumination, and data-acquisition protocols, introduce substantial variability in RS data [11,12]. Furthermore, disease symptoms manifest at multiple biological scales, ranging from microscopic tissue damage to canopy-level reductions in biomass and vigour. However, RS observations are constrained by the sensor resolution and platform characteristics, which can lead to scale mismatches between disease expression and measurement. As the spatial scale increases, disease signals often become mixed with the soil and shadowing backgrounds, canopy architecture, and neighbouring vegetation complicating signal interpretation [8,13].
Several review studies have examined different aspects of plant disease detection using non-destructive sensing and computational approaches. Earlier studies addressed non-destructive sensing techniques for disease detection ([14]), while subsequent works expanded to hyperspectral RS approaches for early disease detection [15,16]. Other contributions have investigated sensor technologies for detecting above-ground symptoms [17] and UAV-based RS applications ([18]). In parallel, algorithmic and data-driven aspects have been thoroughly reviewed, particularly deep learning approaches for RGB and hyperspectral imagery, as well as broader machine learning and deep learning frameworks for plant disease detection ([19,20]). While these reviews provide valuable insights, they often address sensors, algorithms, datasets, and detection tasks in isolation. Few studies systematically connect plant–pathogen interactions, disease-detection tasks, sensing environments, platforms, sensors, datasets, and algorithms across different scales (Refer to Table 1).
Table 1.
Comparison of the perspectives covered in previous review studies and the present review. SYN denotes the synthesis and integration of the six BTSCAD dimensions (Biology, Task, Sensor, Condition, Algorithm, and Dataset). ✓indicates available and ✗ indicates not available. The bold font highlights our study.
Through the review of the latest literature on plant disease detection using RS technologies (refer to Appendix A), this study aims to provide a comprehensive and structured synthesis of RS-based plant disease detection, focusing particularly on the interplay between key factors that determine successful disease detection. In this review, we adopt an inclusive definition of remote sensing that encompasses the full continuum of non-contact sensing modalities and platforms, from close-range laboratory imaging and ground-based proximal sensing to UAV, airborne, and satellite observations. Specifically, the close-range RGB imaging of detached or individual leaves under controlled conditions is included as a foundational component of the remote sensing workflow, as these studies establish mechanistic links between disease physiology and spectral or visual signatures that underpin larger-scale detection strategies. However, throughout this review, we explicitly differentiate between controlled-environment studies and operational field-scale deployments, and we discuss the limitations and domain gaps that emerge when transitioning from close-range laboratory observations to operational remote sensing applications at canopy, field, and regional scales. Specifically, it structures an interconnected framework BTSCAD, encompassing Biology, Task, Sensor, Condition, Algorithm, and Dataset.
- Biology (B): Understanding plant–pathogen interactions and the impact on disease detection.
- Task (T): Clarifying different disease-detection tasks and their evaluation methods.
- Sensor (S): Comparing the most commonly used RS sensors for plant disease detection.
- Condition (C): Examining how different conditions, including sensing environments, platforms, and scales, influence disease detectability.
- Algorithm (A): Reviewing algorithms, ranging from classical machine learning methods to state-of-the-art deep learning frameworks.
- Dataset (D): Analysing the role of datasets, including data availability, quality, and domain shifts.
In the end, we highlight the key challenges and future research directions needed for effective and scalable disease detection. By synthesising current knowledge within a unified framework, this review seeks to establish a solid foundation for developing more robust, interpretable, and transferable RS systems for plant disease detection. This will support sustainable breeding programs and precision disease management in real-world agricultural systems.
2. Biology (B): Plant–Pathogen Interactions and Implications for Disease Detection
Understanding plant–pathogen interactions is essential for the effective use of RS techniques in plant disease detection. Different classes of pathogens interact with their host plants through unique infection strategies, resulting in diverse physiological and structural changes that manifest as disease symptoms, which vary in their detectability through RS data. Additionally, abiotic disorders can induce symptoms that resemble those caused by biotic stresses, and the impact of diseases is often dynamic, as symptoms can accumulate and evolve over time. These biological complexities fundamentally constrain the ability to accurately detect plant pathogens using RS technologies.
Plant pathogens, including viruses, bacteria, fungi, and plant-parasitic nematodes, are biologically distinct groups that differ in their infection mechanisms, host responses, and symptom expression [21] (see Figure 1). These differences greatly influence the types and magnitudes of plant structural and physiological changes that RS sensors can capture.
Figure 1.
Plant pathogens and their effects on host plants. This figure illustrates the concept of plant–pathogen interactions; however, it does not comprehensively represent the entry pathways, biochemical and physiological impacts, or the full range of disease symptoms.
Plant viruses enter host plants primarily through insect vectors or mechanical wounds, and they replicate exclusively within living host cells. Viral infections are often systemic and can frequently lead to mosaics, chlorosis, deformation, and growth reduction, reflecting disruptions to photosynthesis, pigment synthesis, and hormone regulation [22]. Traditionally, the diagnosis of viruses relies on serological or molecular methods, including Enzyme-Linked Immunosorbent Assays (ELISA) and polymerase chain reaction (PCR). From an RS perspective, viral diseases are primarily detected through indirect physiological responses, such as changes in the chlorophyll content, canopy vigour, and associated plant stress signals [23].
Bacterial pathogens infect plants through natural openings, such as stomata and hydathodes, or through wounds and typically colonise intercellular spaces. Many species produce extracellular enzymes and polysaccharides that degrade host tissues, leading to water-soaked lesions, necrosis, wilting, blight symptoms, or canker formation [21]. These infections can substantially alter the canopy structure, tissue water relations, and biochemical composition, thus changing the plants’ optical properties and producing RS signatures that become increasingly detectable with disease severity progression [24,25].
Fungi constitute the most diverse and economically important group of plant pathogens. They penetrate host tissues either directly or through natural openings and subsequently spread within the plant through two principal mechanisms: hyphal growth and vascular colonisation. During hyphal growth, fungi grow as a network of thread-like filaments (hyphae) that infiltrate the plant’s cells and the spaces between them, enabling the fungi to absorb nutrients directly from the host, often killing plant tissue and leading to visible symptoms like rots, blights, and rusts. In vascular colonisation, certain fungi invade the plant vascular system responsible for water and nutrient transport, leading to rapid wilting and eventual death in severe cases [26]. These infections frequently induce localised necrotic, chlorotic lesions, defoliation, and structural damage, resulting in pronounced changes in plant biochemical and physiological characteristics. Such changes produce distinctive spatial and spectral signatures at leaf and canopy scales, rendering fungal diseases particularly well suited to RS-based detection and monitoring [6,8].
Plant-parasitic nematodes are microscopic roundworms that invade and feed on plant roots. They penetrate the epidermal tissues of roots using stylets, releasing degrading enzymes, and migrating within the root tissues. In sedentary species, they establish specialised feeding sites that disrupt the plant vascular function, impairing water and nutrient uptake. The symptoms of nematode infections often appear above ground and can be nonspecific and delayed, making field diagnosis challenging [27]. Nevertheless, severe infections can lead to recognisable symptoms such as stunting, yellowing, and wilting, as the compromised root system struggles to absorb water and minerals.
However, not all plant diseases and pests can be detected using RS technologies. Diseases that induce noticeable changes in the canopy structure, pigmentation, or water status over a large area are generally easier to detect than those that affect roots or cause minimal physiological changes. Conversely, some soil-borne and root diseases may still be indirectly detectable if they cause visible effects on the aboveground parts of the plant. Therefore, a fundamental prerequisite for RS-based disease monitoring is that the host responds in a way that alters its surface properties in a manner that can be measured by a specific sensor system. The success of detection depends jointly on the pathogen biology, host response, disease severity, spatial scale, and sensor characteristics.
Plant diseases and pest infestations are dynamic processes that evolve over time. Initially, symptoms may present as subtle physiological disturbances but can progress to significant structural damage as the disease advances. Time-series RS observations can track the accumulation and progression of these disease-related signals. By analysing characteristic temporal patterns in vegetation indices, pigment-sensitive features, or structural metrics, we can differentiate disease stages and minimise detection uncertainty [6]. It is important to note that multiple diseases or stressors may occur simultaneously during a growing season, which can further complicate interpretation.
In addition, plant health can be impacted by abiotic stressors, such as extreme temperatures, drought, waterlogging, salinity, nutrient imbalances, pesticide toxicity, mechanical injury, and air pollution. These factors disrupt normal plant physiological processes and may produce symptoms, such as chlorosis, necrosis, reduced vigour, deformation, or premature senescence, that closely resemble those caused by biotic pathogens [28]. However, unlike infectious diseases, abiotic stress symptoms do not exhibit contagious spatial spread and are often associated with relatively uniform or management-related distribution patterns. Consequently, spatial context and temporal dynamics serve as critical indicators for distinguishing abiotic stress symptoms from disease-induced symptoms in RS observations.
3. Task (T): Plant-Disease-Detection Tasks and Evaluation Framework
The term “plant disease detection” is commonly used in the literature, but refers to a range of different tasks. Without proper clarification, its meaning can be unclear. This section provides a structured overview of the various disease-detection tasks discussed in existing studies and summarises the evaluation criteria typically used to assess detection performance. Special attention is given to metrics from the fields of computer vision and machine learning, which may be unfamiliar to some readers. To provide readers with a clear understanding of how these tasks are accomplished, this section outlines the disease-detection conditions, data modalities, algorithms, and datasets used to train and evaluate the models, while a more detailed discussion of each aspect is presented in later sections. On top of that, the literature is selected carefully to cover different scenarios, including different environments, sensors, platforms, and scales.
3.1. Task 1: Leaf Image Classification
When analysing plant images, the primary goal of disease detection is to determine the plants’ health status. This process can be viewed as a binary classification task. However, if we identify a specific disease associated with the image, it becomes a multi-class classification problem (see Figure 2). The most commonly used evaluation metrics for image classification include accuracy, precision, recall (also known as sensitivity), and F1-score (refer to Table A1). Among these metrics, the F1 score is particularly valuable as it combines precision and recall into a single balanced measure, which is beneficial when both are equally important. In addition to the four standard metrics, several variations exist, such as the Fβ-score, Cohen’s Kappa, Receiver Operating Characteristic-Area Under the Curve (ROC-AUC), Precision Recall—Area Under the Curve (PR-AUC), and confusion matrix (Table A1).
Figure 2.
Disease-detection tasks. This figure provides an intuitive overview of different disease-detection tasks. The examples are at the organ (leaf) scale, but the same task can be applied at the canopy, plant, and regional scale. For clarity, the background (e.g., soil) is shown in white.
A series of studies has been conducted to classify leaf images from different species and disease infections in controlled environments with uniform backgrounds and illumination. In the study conducted by Balasundaram, et al. [29], the classification of tea tree leaf images began with background removal and disease feature extraction. These features were then utilised to train various machine learning models for image classification. The study used a tea leaf dataset for training and testing, which included 5876 images representing symptoms of several conditions: algal spot, brown blight, grey blight, Helopeltis damage, and red spot, as well as healthy leaves. Among the models tested, a multiple-layer perceptron achieved the highest accuracy 95.06%, outperforming both MobileNetV2 (94.55%) and Support Vector Machine (SVM) (93.33%). Similarly, Hassam et al. [30] introduced a deep learning framework designed to classify diseases in citrus fruit and leaves, specifically targeting black spot, canker, scab, greening, and melanose. The deep learning architecture combined a modified MobileNetV2 for feature extraction with an improved WOA incorporating entropy-based control for feature selection. Finally, a neural network classifier was employed to perform disease classification. The model was trained and tested on a dataset of approximately 15,000 images of citrus fruits and leaves, achieving an accuracy exceeding 99.0%. In addition, Sambana et al. [31] investigated disease classification in beans, strawberries, and tomatoes using transfer learning with the YOLOv7 and YOLOv8 object-detection models. The experiment was conducted using the Detecting Diseases dataset, which comprises 5494 images across twelve disease classes. Among the models tested, YOLOv8 demonstrated superior performance with an F1-score of 89.40. In another study, Chaitanya and Posonia [32] introduced a hybrid deep learning framework for image classification using the PlantifyDr dataset. This dataset contains over 125,000 images of ten plant types and 37 plant diseases, all collected under controlled environments. Image features were first extracted and then input into a hybrid Deep Neural Network-Recurrent Neural Network (DNN-RNN) model for classification, yielding an accuracy of 96.47%.
3.2. Task 2: Symptom Localisation and Classification
In some instances, it is essential to identify the locations of disease symptoms, such as necrosis, lesions, and pustules, and to assign a specific disease name to each detected region. In the field of computer vision, this task is called object detection, which involves two primary goals: object localisation and object classification. Localisation typically involves drawing bounding boxes around each detected object, while classification is performed within those bounding boxes (Figure 2). Evaluating object-detection models requires assessing both the accuracy of localisation and classification. The metrics most commonly used for this evaluation include Intersection over Union (IoU), mean Average Precision at IoU ≥ 0.50 (mAP@0.50), and mean Average Precision averaged over IoU thresholds from 0.50 to 0.95 (mAP@[0.50:0.05:0.95], often referred to simply as mAP in modern COCO-standard evaluations (see Table A2).
To localise and classify lesions on the leaves of orchard trees, Albattah et al. [33] introduced a deep learning framework using images from the PlantVillage dataset. The framework utilised DenseNet-77 for feature extraction, and the features were then fed into a CenterNet classifier. The system efficiently locates and classifies 38 crop disease types with an mAP of 0.99. Detecting maize leaf diseases in the field is challenging because maize images often feature complex backgrounds and varying lighting conditions. To tackle these challenges, Masood et al. [34] developed a deep learning framework based on Faster R-CNN with a ResNet-50 backbone, enhanced by a Convolutional Block Attention Module (CBAM). Using the Corn Disease and Severity (CD & S) database, which comprises 4455 images, the framework achieved an mAP of 0.94 for detecting four types of corn diseases, outperforming other models, including YOLO. To localise and classify grapevine lesions caused by Downy mildew (Plasmopara viticola) at the canopy scale in natural vineyards, Hernández et al. [35] presented a deep learning approach that used 14,754 labelled images to train and test state-of-the-art models. The EfficientNetV 2 S model surpassed ResNet 50, Xception, RegNetX, and Vision Transformers (ViT), achieving an IoU of 0.83. The trained model was then applied to full images using a sliding window technique to highlight symptomatic areas, yielding an IoU of 0.83 and an F1-score of 0.89. Moupojou et al. [36] argue that conventional plant-disease-detection models trained on laboratory images, such as those from PlantVillage, which features single leaves against uniform backgrounds, struggle when applied to field images that often contain multiple overlapping leaves, complex backgrounds, and varying lighting conditions. To tackle this issue, an ensemble model comprising three deep learning frameworks was proposed. First, the Segment Anything Model (SAM) was used to segment all visible objects in the field images, including leaves, stems, and background elements. Next, a Fully Convolutional Data Description (FCDD) was employed to distinguish actual leaves from background objects. Finally, a CNN classifier, trained on the PlantVillage dataset, was utilised to classify the segmented leaves into specific disease categories. This approach achieved a 10–15% improvement in classification accuracy on field datasets such as PlantDoc and FieldPlant, compared to traditional methods.
3.3. Task 3: Semantic Segmentation of Infected Tissues
Semantic segmentation involves classifying each pixel in an image into a predefined class. In contrast to disease image classification, symptom localisation, and classification, semantic segmentation provides a more detailed understanding of a scene by clearly defining the precise boundaries and shapes of objects and regions within the image. The output of a semantic segmentation model is a segmentation mask with the same dimensions as the input image, where each pixel’s value corresponds to its predicted class label. To evaluate the performance of a semantic segmentation model, the classification metrics and the object-detection metric can be applied to the pixels of an image. One specific metric, the boundary F1 score (BF1), focuses on the quality of the segmentation boundaries. It assesses how closely a predicted boundary aligns with the true boundary of an object by comparing pixels within a small distance, typically ranging from one to five pixels from the ground truth boundary.
The detection of spores of wheat stripe rust is a research direction receiving a lot of attention. Li et al. [37] investigated the semantic segmentation of wheat leaf rust in a wheat stripe rust dataset, known as CDTS. It was composed of 2353 high-resolution images, which were processed to generate 19,942 training images, 6648 validation images, and 6648 testing images using image cropping techniques. The Octave-UNet model used in this study achieved a mean IoU of 83.44% and an overall accuracy of 96.06%. However, the leaf images in the CDTS dataset were captured in a greenhouse with a uniform background and stable illumination, limiting its capability for field application. The early detection of cucumber powdery-mildew-infected tissues is essential for effective disease management. Zhang et al. [38] employed hyperspectral imaging and distance discriminant analysis to perform the semantic segmentation of infected areas, achieving an accuracy of 93.00%. However, the data were acquired under controlled conditions with uniform background and lighting, and the study did not assess the model’s ability to detect infection before visible symptoms emerged. To detect late blight lesions (Phytophthora infestans) in potato crops at the canopy scale under field conditions, Gao et al. [39] performed semantic segmentation using a dataset divided into training, validation, and test sets comprising 1600, 250, and 250 images, respectively. A SegNet model with an encoder–decoder architecture achieved IoU scores of 0.386 for lesion areas and 0.996 for the background.
3.4. Task 4: Instance Segmentation of Infected Tissues
Instance segmentation integrates object detection and semantic segmentation by going beyond merely classifying pixels or drawing bounding boxes around objects. It involves three main tasks: (1) locating each object instance in an image by drawing bounding boxes, (2) creating a precise pixel-level mask for each detected object within those boxes, and (3) assigning a class label to each segmented instance. The output of an instance segmentation model consists of a collection of instance masks, each linked to a unique object ID and a class label (Figure 2). Evaluation metrics for object detection are also applicable to instance segmentation, with the key difference being that IoU is calculated between the predicted segmentation mask and the ground truth segmentation mask, rather than between bounding boxes.
The majority of the studies based on the PlantVillage dataset were either leaf image classification or symptom localisation and classification. Bondre and Patil [40] expanded it to instance segmentation to identify tissues infected by fungi and bacteria in leaves of apple, tomato, potato, pepper, and corn. The process began with a Fast R-CNN model utilising a ResNet-50 backbone to localise infected tissues. The features extracted from these infected tissues were then used for classifying the plant diseases. The Improved Faster Mask Regional Convolutional Neural Network (IFMR-CNN) achieved the highest performance, with an overall accuracy of 96.91%. There are limited publicly available datasets for instance segmentation of plant diseases. To facilitate the development of deep learning algorithms for instance segmentation under complex background conditions, Afzaal et al. [41] introduced a dataset comprising 2500 images of seven types of strawberry diseases annotated for training instance segmentation models. Following data augmentation, they trained and evaluated a Mask R-CNN-based model with a ResNet backbone, achieving a final mAP of 82.43%.
3.5. Task 5: Panoptic Segmentation of Infected Tissues
Panoptic segmentation unifies both instance and semantic segmentation tasks into a single framework. In a study conducted by Kirillov et al. [42], the terms “Stuff” and “Things” were introduced to describe different segmentation labels. “Stuff” labels refer to uncountable and amorphous regions in an image (e.g., sky, ground), while “Things” labels refer to countable objects with definite shape, like disease lesions on leaves. When a pixel is labelled as “Stuff”, it only receives a semantic class label, and its corresponding instance ID is irrelevant. In contrast, pixels labelled as “Things” are assigned both a semantic class label and an instance ID. As a result, every pixel in the segmented image is assigned a unique combination of a class label and instance identifier. To evaluate the performance of panoptic image segmentation, the Panoptic Quality (PQ) metric is used (Table A2).
In a recent study, Madeleine, et al. [43] proposed the Mask2Former network, which incorporates a backbone feature extractor along with a multi-scale pixel decoder and a transformer decoder. This model is designed to perform the hierarchical panoptic segmentation of crops, weeds, and leaves. The Mask2Former model was evaluated on the PhenoBench dataset, a large-scale dataset of real agricultural fields that includes annotated instances of crop, weed, and leaf. It achieved a PQ score of 71.95 for crop instances and 66.31 for leaf instances.
3.6. Task 6: Disease Severity Scaling
Disease severity scaling or grading involves using predefined categorical scales to assess the infection levels of plants (Figure 2). Simple descriptive disease scales may categorise plants as healthy, mild, moderate, and severe. A numerical scale, for example, a 0–5 scale, can be structured as follows: 0 (no symptoms), 1 (1–5% infection), 2 (6–25% infection), 3 (26–50% infection), 4 (51–75% infection), and 5 (76–100% infection). The Horsfall–Barratt Scale (H-B Scale), which consists of eleven levels, is a widely used logarithmic scale designed to align with the human eye’s sensitivity to changes in disease severity. This scale recognises that our perception is more acute at both the lower and higher ends of the severity spectrum than in the middle [44]. Once trained, observers can assign scales to leaves, plants, or canopies. Essentially, a disease severity scaling task is a multiple-class classification task that can be evaluated using classification metrics.
In the study of Hayıt, et al. [45], the authors captured RGB images of single leaves in controlled environments with uniform backgrounds, comprising a dataset of 15,000 images across six severity levels, called the Yellow-Rust-19 dataset. The colour and texture features were manually extracted, while deep features were obtained using the pre-trained DenseNet-201. The combined features were input into an SVM to categorise the images into six grades, achieving an accuracy of 92.4%. In a subsequent study, Syeda et al. [46] presented an automated pipeline for assessing wheat rust disease severity at the canopy scale in natural field conditions. Initially, a binary classification model based on the Xception CNN was trained using transfer learning on the Yellow-Rust-19 dataset to differentiate healthy plants from those infected with yellow rust. The trained Xception model was subsequently used to identify infected plants in field images. Within the images displaying disease symptoms, leaves were segmented from the backgrounds and further analysed to calculate the ratio of infected pixels to the total pixels of leaves. Severity scales were then assigned to each canopy image: slight (<0.3), moderate (0.3–0.6), and severe (>0.6). Su et al. [47] utilised a two-stage Mask R-CNN model to assess wheat head infection due to Fusarium Head Blight. In the first stage, wheat spikes were segmented from the background, and in the second stage, infected areas within each spike were identified. The disease severity was evaluated by calculating the ratio of the infected area to the total spike area, which was then categorised into 14 severity scales, achieving an accuracy of 77.19%. In the context of natural orchard environments, Zhang et al. [48] introduced a deep learning approach for assessing the severity of anthracnose disease in mango leaves. They proposed a lightweight deep learning model named CBAM-DBIRNet, which was trained on 4217 mango leaf images to classify healthy, mild, moderate, and severe categories, achieving an F1-score of 97.89%. Zhang et al. [49] developed a YOLOv8n-based model to locate infected leaves and assign a disease severity scale ranging from 0 to 3 for each leaf. The model was trained on 13,730 images and tested on 1525 images, yielding an mAP of 90.3% at IoU thresholds from 0.5 to 0.95.
3.7. Task 7: Disease Severity Scoring
In contrast to disease severity scaling, disease severity scoring involves using continuous numerical values to represent disease severity levels (Figure 2). While assigning continuous values can be impractical for human experts, image analysis algorithms can automatically detect and quantify disease severity with high precision. For instance, disease scores can be represented by the total lesion area or the ratio of lesions to the overall leaf area. Additionally, specialised sensors can evaluate disease severity through physiological parameters such as the chlorophyll content, photosynthetic rate, or biomass, combined with regression algorithms. The advantages of automated disease scoring are evident. First, digital image analysis eliminates human subjectivity, ensuring consistent and highly accurate measurements. Second, it generates continuous data that are more sensitive to subtle treatment effects and disease progression. Third, results remain highly consistent across different measurements and operators. Furthermore, the availability of precise disease scores supports advanced statistical analyses and the modelling of disease epidemics. Two key metrics used to evaluate how well a model predicts continuous variables are the coefficient of determination, commonly known as R-squared (R2), and adjusted R2. Other metrics that assess regression models from different aspects include the Root Mean Square Error (RMSE), Mean Absolute Error (MAE), and Median Absolute Error (MedAE) (Table A3).
To score the disease severity based on the images collected from a UAV, Garg et al. [7] introduced an end-to-end deep learning framework called Cascaded Mask R-CNN (CMRCNN). The workflow started with segmenting individual leaf instances, after which disease severity was calculated as the ratio of the diseased area to the total leaf area. A total of 172 field images of maize canopies were manually labelled for training and testing, achieving an R2 of 73.0%. At the canopy scale in a field environment, Azadbakht et al. [50] investigated the scoring of wheat leaf rust disease under different levels of the leaf area index using a spectrometer ranging from 350 to 2500 nm. Utilising 284 samples for training and validation, they found that a v-Support Vector Regression (v-SVR) consistently outperformed other models across various levels of the leaf area index (low, medium, and high), achieving an R2 of 0.99. To estimate the foliar blight disease score, referred to as the blight index, in Pacific Madrone trees under different light conditions and tree structures, Winfield et al. [51] used multispectral imagery collected using the MicaSense Altum camera on a UAV flying at a 100 m altitude, which resulted in a spatial resolution of 4.3 cm. The blight index of 29 trees was derived from ground survey data. Initially, the crowns were separated from shadows and soil, after which multiple linear regression models were trained to predict the disease score, achieving an adjusted R2 of 0.25.
3.8. Task 8: Disease Early Prediction and Time Series Analysis
Plant disease early prediction involves forecasting the onset of disease before any visible symptoms emerge. In precision agricultural systems, early disease detection can prevent its spread by enabling timely disease-management actions. This helps maintain high crop yields while reducing the excessive use of pesticides. Moreover, early detection ensures precise phenotyping, allowing breeders to distinguish between plants that are genuinely resistant and those that appear healthy simply because the disease has not progressed yet at early stages. Consistent time-series data play a critical role in automating disease prediction and tracking disease progression. This involves collecting plant data over time, typically at regular intervals, to monitor changes in plant health indicators or to identify sudden deviations from normal patterns. A model designed for early disease prediction typically outputs a True or False indication of infection at an early stage, allowing it to be evaluated using binary classification metrics.
Crown rot is a fungal disease that affects all winter cereals and many types of grassy weeds. The symptoms of wheat crown rot disease are usually visible only at the lower stems, particularly during the late tillering to early heading stages. In a study by Xie et al. [52], they used RGB images to classify healthy wheat plants against those infected with crown rot in a greenhouse. They focused on the colour features of the lower stem regions, including the first node. The colour features were extracted and input into an SVM classifier. Based on images collected daily, infected plants could be detected as early as 14 days after infection, even before visible symptoms appeared on the shoots, achieving F1 scores above 0.75. As the duration of infection increased, the F1 score increased to over 0.80 by 21 days after infection, with symptoms on the shoot still not visible. Continuing this research, Xie et al. [53] investigated the use of hyperspectral images for early detection of crown rot disease before symptoms appear on the shoots. They analysed the average reflectance spectrum of individual plants in the wavelength region of 450–2400 nm, applying SVM to classify healthy plants versus infected ones. They found that detection was feasible after 30 days of infection, achieving an F1 score over 0.80. In a separate study, De Silva and Brown [54] explored the early detection of plant fungal diseases in the leaves of tomato, potato, and papaya using multispectral imagery. They created a multispectral dataset that covered both visible and near-infrared (NIR) wavelengths, including 2652 images across various filters (442 images per filter). A pre-trained ViT-B16 performed best across filters with an F1-score of 89.5%. However, this study did not specify the exact timeframe before visible symptoms appeared. Retkute et al. [55] introduced an RS framework to predict Banana Bunchy Top Disease (BBTD) and Fusarium wilt tropical race 4 (TR4) using satellite multispectral imagery and meteorological data from the Landsat-8 satellite. They trained the models to predict the vegetation indices of healthy plants under different meteorological conditions. Significant deviations in these indices indicated potential diseases. They established time-series datasets over a year, observing a strong R2 of 0.73 for BBTD in Australia and successfully tracking disease progression for TR4 in Mozambique with clear spatial spread patterns and an R2 as high as 0.98. Chi, et al. [56] proposed a framework for the large-scale monitoring of potato late blight using multi-source time-series radar and spectral data from the Sentinel-1 and Sentinel-2 satellites. Spectral data from Sentinel-2 and radar data from Sentinel-1 were collected monthly in major potato-producing regions in China from January to December 2021. A field survey was conducted from 11 to 13 August 2021, to evaluate the disease levels of 221 plots manually. Using 70% of the samples for training and 30% for validation, the multi-source time-series RF model achieved the best RMSE of 20.50 and R2 of 0.71.
3.9. Hybrid Disease-Detection Tasks
Some studies integrate two or more of the tasks mentioned above, leading to hybrid tasks. For example, Rehman, et al. [57] combined the semantic segmentation of infected tissues with image classification using the PlantVillage dataset. They first employed a Mask R-CNN model to segment disease-infected areas on individual leaves, achieving an mAP of 0.793. Subsequently, the segmented images were used to train a pre-trained ResNet50 model for feature extraction. These features were then input into a Linear Discriminant Analysis (LDA) model for final classification, resulting in an accuracy of 99.10% and an AUC of 0.9925 during five-fold cross-validation. To scale disease severity and early predict Sirex noctilio Fabricius (Hymenoptera: Siricidae) in pine forest, Hirigoyen and Villacide [58] collected multispectral images monthly from the PlanetScope satellite between 2019 and 2023 in Neuquén, Argentina. At the same time, ground-truth labels from a total of 776 circular plots were collected, reserving 80% for training and 20% for testing. The 32 spectral indices were calculated to assess vegetation health and stress. In the classification of damage levels, No damage, Incipient, Mild, Moderate, and Severe, RF outperformed SVM and ANN, achieving an accuracy of up to 98%. Further, time-series analysis identified seasonal and interannual variations linked to infestation.
4. Sensor (S): Sensors for Plant Disease Detection
Given an understanding of host–pathogen interactions and the tasks involved in plant disease detection, selecting appropriate data-acquisition strategies is a critical step in RS-based plant disease detection. Data acquisition is not only the first stage of any RS workflow but also fundamentally determines the type, quality, and interpretability of collected data. The selection of sensors is crucial for the feasibility, sensitivity, and scalability of RS-based plant disease detection. Instead of viewing sensors in isolation, it is essential to understand their effective application in relation to disease symptoms, detection tasks, and the environment–platform–scale configuration (see Figure 3).
Figure 3.
Sankey diagram illustrates the relationships among study year, sensor type, platform, scale, algorithm, and disease-detection task. The diagram was generated using a Python 3.13 program based on an analysis of the publications selected according to the literature-selection criteria described in Appendix A. The node order is arranged to minimise link crossings, thereby enhancing visual clarity. From 2020 to 2025, the number of published studies shows a clear increasing trend. The number of papers selected for 2026 is relatively low because studies published in this year have not yet been widely cited. RGB sensors are the most commonly used for disease detection, while handheld platforms are the most frequently adopted in research. Most studies are conducted at the organ scale, and deep learning approaches have largely surpassed classical machine learning methods. Among the tasks, leaf image classification (Task 1) is the most extensively studied. CM: classical algorithms that learn relatively simple patterns from data or using predefined features, for example, k-NN and SVM. DL: deep learning algorithms that use multi-layer neural networks to learn features automatically, for example, CNNs, RNNs, and transformers.
4.1. RGB Imaging
RGB cameras are the most widely used sensors for plant disease detection, primarily because of their long-standing use in computer vision, ease of deployment, low cost, and compatibility with established image-analysis and deep learning frameworks. By capturing light in the red, green, and blue regions, RGB imagery facilitates an intuitive interpretation of visible disease symptoms, such as leaf spots, chlorosis, necrosis, wilting, and morphological deformation. At both leaf and canopy scales, RGB imagery allows for the precise spatial delineation of disease symptoms, supporting various detection tasks such as image classification [29], lesion localisation [33], semantic segmentation [37], and severity estimation [49]. The extensive availability of annotated RGB datasets (see Table A4) has further accelerated the development and benchmarking of methodologies, particularly for deep-learning-based disease detection. However, RGB imaging has inherent limitations due to its restricted spectral content. Many plant diseases induce early physiological and biochemical changes, including changes in the water status, cellular structure, photosynthetic performance, and transpiration processes, which occur before the development of visible symptoms and can be detected through more sensitive and specialised sensors [59]. Consequently, RGB-based detection tends to be generally effective during moderate to late disease stages, and its performance may decline when distinguishing between diseases with similar visual symptoms [53].
4.2. Multispectral and Hyperspectral Imaging
Multispectral and hyperspectral imaging technologies enhance disease detection by capturing plant reflectance or transmittance spectra across multiple spectral dimensions, which are linked to physiological and biochemical processes, rather than relying solely on visual symptom observations. In field environments, multispectral imaging has become a practical solution because it balances spectral sensitivity, operational feasibility, and cost-effectiveness. The spectral bands are typically optimised for vegetation monitoring, enabling the development of vegetation indices that serve as effective indicators of disease-induced stress [56]. Hyperspectral imaging (HSI) extends this capability by providing hundreds of contiguous spectral bands with fine spectral resolution, allowing the detection of subtle physiological and biochemical changes associated with disease development. These changes may include alterations in pigment degradation, water content changes, nutrient imbalances, and cellular disruption [38,53]. Consequently, HSI is particularly valuable for early disease detection, disease differentiation, and mechanistic studies of plant–pathogen interactions [60,61]. Despite these advantages, hyperspectral sensing faces several practical challenges. The large number of spectral bands generates high-dimensional datasets that require significant storage capacity and computational resources and may introduce issues related to noise and multicollinearity [62,63]. Additionally, the relatively high cost, size, and weight of hyperspectral sensors can constrain operational deployment, particularly on UAV platforms, while field-based imaging may also be influenced by variations in illumination and environmental conditions [64]. Nevertheless, advances in sensor miniaturisation and platform integration have accelerated the adoption of multispectral and hyperspectral sensors across UAV, airborne, and spaceborne platforms. These technologies support disease detection and mapping from canopy to plot scales, while also enabling the temporal monitoring of disease progression and quantitative assessments of disease severity [58,65,66].
4.3. Thermal Imaging
Thermal cameras detect infrared radiation related to the surface temperature and therefore provide indirect information on plant physiological processes such as transpiration and respiration. Canopy temperature is closely linked to stomatal conductance and the water status, as reduced transpiration can lead to an increase in the canopy temperature [67,68]. Many plant diseases and pest infestations can alter stomatal behaviour and vascular function, resulting in measurable temperature changes in canopies that reflect plant stress [69,70]. Thermal imaging shows strong potential for the early detection of water-related stress, including conditions that disrupt water transport or increase water loss. Changes in the leaf or canopy temperature can occur before visible symptoms appear, providing opportunities for early diagnosis [71]. Thermal sensing is particularly effective in controlled or semi-controlled environments, where environmental variability can be minimised [72]. At larger scales, interpretation becomes more complex due to interactions with meteorological variables such as the air temperature, humidity, and radiation. To mitigate these effects, normalised thermal metrics, including canopy temperature depression (CTD) and the crop water stress index (CWSI), are commonly used to account for environmental variability [73,74]. Consequently, thermal imaging is most effective when combined with meteorological measurements or integrated with other sensing modalities [75].
4.4. Fluorescence Sensing
Fluorescence sensing provides unique insights into plant physiological function and has recently been regarded as one of the most sensitive approaches for detecting early plant stress [76]. This technique directly measures photosynthetic activity and energy dissipation processes, making it a reliable indicator of both biotic and abiotic stress in plants. Chlorophyll fluorescence is directly linked to the function of photosystem II (PSII). It can quantify key physiological parameters, such as the maximum quantum efficiency of PSII (Fv/Fm), effective quantum yield, and non-photochemical quenching (NPQ), all of which are highly responsive to pathogen infection and other biotic stresses [77,78,79]. Pathogen infection often disrupts photosynthesis before visible symptoms emerge, resulting in measurable changes in fluorescence emission. Consequently, fluorescence sensing has demonstrated strong potential for the early detection of plant diseases, particularly during asymptomatic or pre-symptomatic stages. The high physiological specificity of fluorescence signals enhances diagnostic accuracy in distinguishing disease stress from other environmental stressors [80]. Both laser-induced fluorescence in lab environments [81] and solar-induced chlorophyll fluorescence (SIF) in field environments [82] have enhanced the ability to detect pathogen-induced changes in photosynthetic processes. A pivotal study by Zarco-Tejada et al. [83] demonstrated the potential of solar-induced fluorescence for the pre-symptomatic detection of Xylella fastidiosa infection in olive trees using airborne facilities on a landscape scale. The study achieved accuracies exceeding 80% and successfully identified infected trees that were visually asymptomatic at the time of imaging. Despite these advantages, several practical limitations constrain the broader adoption of fluorescence sensing in operational disease monitoring. Fluorescence measurements are highly sensitive to the illumination conditions, canopy architecture, viewing geometry, and environmental variability. Furthermore, fluorescence emissions are inherently weak compared with reflected solar radiation, making signal acquisition susceptible to noise and environmental interference, particularly under field conditions and at larger spatial scales [84]. Recent advances in SIF provide new opportunities to overcome these constraints, enabling the monitoring of photosynthetic function from canopy to ecosystem scales [85,86,87,88,89].
4.5. SAR and LiDAR
Active RS technologies, including Synthetic Aperture Radar (SAR) and Light Detection and Ranging (LiDAR), provide complementary information that operates independently of solar illumination. As an active microwave system, SAR operates independently of weather and light conditions and can penetrate cloud cover, enabling reliable all-weather monitoring at regional scales. SAR backscatter is sensitive to the vegetation structure, dielectric properties, and soil moisture, allowing the retrieval of canopy and soil parameters that are influenced by plant stress and disease development [90]. In disease detection, SAR has shown promise for detecting structural changes associated with infections that alter the canopy architecture, such as wilting, lodging, or defoliation caused by fungal and bacterial pathogens. Recent studies have demonstrated that polarimetric SAR indices can differentiate between healthy and infected forest stands affected by bark beetle infestations and root rot, exploiting changes in canopy moisture and structural coherence [90,91]. However, SAR-based disease detection remains constrained by spatial resolution limitations for incipient or spatially sparse symptoms and by the complexity of decoupling disease-induced signals from other sources of backscatter variation, such as soil moisture and topography.
LiDAR sensors capture detailed three-dimensional point cloud representations of the plant canopy structure, supporting precise estimations of plant height, biomass, and other structural traits [92]. Temporal analysis of LiDAR-derived metrics can detect structural changes associated with plant stress, such as defoliation, lodging, or biomass loss [93]. LiDAR has been used to quantify canopy density reductions caused by foliar diseases and to map the spatial distribution of disease severity in tree crops based on variations in the canopy volume and gap fraction [94]. The primary limitations of LiDAR for disease detection include its high acquisition cost, limited spectral information (single-wavelength or discrete-return systems), and the computational demands of processing large point clouds. Although direct disease diagnosis using SAR or LiDAR alone remains challenging, these active sensing technologies provide essential information related to plant structure and soil moisture that passive optical sensors cannot capture. Their integration with spectral and thermal observations, through multi-sensor data fusion and machine learning frameworks, can significantly enhance the detection and interpretation of plant health dynamics across scales [95]. No single sensor satisfies all detection requirements; the choice of modality should be guided by the target disease symptoms, the detection task, and the environment–platform–scale configuration (Table 2).
Table 2.
A concise overview of the strengths, limitations, applicable spatial scales, and typical monitoring scenarios of the main sensing modalities discussed above.
5. Condition (C): Environments, Platforms and Scales
Different combinations of environments, sensors, and sensing platforms can operate at different spatial and temporal scales [13,96]. The scale of measurement influences both the physiological processes that can be captured and the feasibility of deployment in real-world applications. Small-scale measurements focus on a mechanistic understanding of disease development, whereas larger scales prioritise spatial epidemiology, disease distribution mapping, and management decision support. As the spatial scale increases, spectral signatures become more influenced by plant structural, background, and environmental factors, which places greater demands on the selection of platforms and the methods used for data processing [96]. Within the scope of this review, close-range and laboratory-based imaging are considered integral components of the remote sensing continuum. Controlled environments serve as essential platforms for establishing a mechanistic understanding of disease-induced spectral and structural changes at organ and tissue scales; however, findings from such settings are interpreted with explicit awareness of the constraints they impose on operational relevance.
5.1. Controlled Environments
Controlled environments, such as laboratories, growth rooms, and greenhouses, offer highly regulated illumination, background, and plant growth conditions. These settings are particularly effective for disease detection at various scales, including the cellular or tissue level, the organ level, and the individual plant level. In some cases, they can also be used for canopy-scale assessments under simplified conditions.
5.1.1. Microscope-Based Platforms
At the smallest scales, laboratory-based microscope platforms provide exceptional spatial resolution for probing plant–pathogen interactions. Techniques such as scanning electron microscopy [97,98], stereoscopic microscopy [98,99], and Hyperspectral Microscope Imaging (HMI) enable disease analysis at the levels of pathogen, cell, and tissue [100]. The spatial resolution, ranging from nanometres to millimetres, allows for precise linkage among optical signatures, plant phenotypes, physiological traits, and even genetic variations. Consequently, microscope-based phenotyping platforms are invaluable for fundamental research on disease resistance mechanisms and crop breeding. However, their low throughput inherently limits their applicability beyond controlled experimental studies.
5.1.2. Tripod and Tower Systems
For organ- and canopy-scale sensing in laboratory settings, such as darkrooms and greenhouses, sensors are typically mounted on fixed platforms such as tripods, towers, or gantry systems. This setup ensures controlled conditions for data acquisition [101,102]. Organ-scale measurements provide relatively pure optical signals that are primarily influenced by biochemical and internal structural properties, allowing for the accurate detection of disease symptoms with minimal interference from background effects [103]. In contrast, canopy-scale measurements yield an integrated signal influenced by factors such as canopy architecture, soil background, and illumination conditions, complicating interpretation [104,105]. As measurements scale from organs to canopies, structural and morphological influences increase, introducing complexity while enhancing the representativeness of real-world conditions [106]. Consequently, controlled-environment canopy sensing acts as an important intermediary linking detailed, small-scale studies with large-scale field observations from airborne and satellite platforms [107].
5.1.3. High-Throughput Plant Phenotyping Platforms
High-throughput indoor phenotyping systems integrate automated sensor deployment, environmental control, and time-series data acquisition through robotics and multi-sensor platforms [108,109]. These systems facilitate disease monitoring across leaf, whole plant, and simplified canopy scales. They also enable the tracking of disease progression over time through imaging-based approaches [16,61,71]. The capacity to generate high-resolution spectral data in tightly controlled and repeatable conditions allows for detailed analysis of plant responses and spectral dynamics [109,110]. These datasets are particularly valuable for identifying temporal disease signatures and developing spectral features that are sensitive to disease [61]. Nevertheless, the simplified and controlled nature of these environments limits the direct application of the models developed for real-world field conditions, where environmental variability and canopy complexity are much greater [101,110,111].
5.2. Field Environments
In field environments, disease detection is complicated by variable illumination, heterogeneous backgrounds, shadows, and motion blur. These factors significantly reduce data quality and limit model performance. Consequently, machine learning and deep learning models trained on controlled environment data often struggle to generalise to field conditions [61,101,112]. This domain gap highlights the need to explicitly consider environment–platform interactions when designing disease-detection systems. Field deployments benefit from a broader range of platforms, allowing disease detection across leaf, plant, canopy, plot, and regional scales.
5.2.1. Proximal Sensing Systems
Proximal sensing systems have become essential tools for detecting plant disease by providing high-resolution, non-destructive measurements of the physiological and biochemical status of crops at close range. These systems are typically deployed near the plant canopy using handheld instruments (Figure 3), such as RGB cameras and portable spectrometers, which are commonly used for in situ disease detection due to their low cost, operational flexibility, and ease of deployment. These tools are particularly effective for assessing leaves, plants, and canopies [29,37,47]. They play a crucial role in connecting laboratory measurements with large-scale RS observations, providing accurate ground-truth data for the calibration, validation, and interpretation of large-scale disease monitoring systems. However, their effectiveness can be limited by variability introduced by different operators, inconsistent repeatability, and restricted spatial coverage [13].
5.2.2. Ground-Based Platforms
Ground-based platforms, such as tripods, vehicle-mounted systems, robotic platforms, and rail or gantry-based phenotyping systems, enable high-spatial-resolution sensing at fine scales suitable for organ and plant-level measurements [113,114]. These systems provide sufficiently high resolution for detailed disease characterisation of organs and individual plants [96,115]. Ground-based platforms can integrate multiple sensors, such as RGB, hyperspectral, and thermal imaging. This capability is due to their relatively high payload capacity and relaxed power constraints, which enable multimodal data acquisition [116]. However, compared with aerial systems, ground-based approaches generally exhibit slower sampling speeds and lower efficiency in covering large [96,114].
5.2.3. Unmanned Aerial Vehicles
UAV-based platforms have increasingly become dominant in recent years due to their flexibility, efficiency, relatively low cost, and suitability for detecting diseases at both canopy and plot scales [18,117]. Operating at low altitudes, these platforms provide significantly higher spatial resolution compared to airborne high-altitude aircraft and space-borne satellite platforms, enabling detailed crop monitoring [118,119]. RGB and multispectral UAV imaging offer cost-efficient solutions with high spatial and temporal resolution, making them highly attractive for operational disease monitoring [65,120,121]. Few studies have successfully demonstrated the detection of symptoms induced by vascular plant pathogens in tree crops using airborne multispectral and thermal imagery [122]. However, UAV-based hyperspectral sensing remains challenging due to high sensor costs and the complexity of data processing workflows [123,124]. Operationally, the limited payload capacity and flight endurance constrain the deployment of heavier sensors and reduce spatial coverage [13,125]. Despite these limitations, the ongoing miniaturisation of hyperspectral sensors has demonstrated the feasibility of UAV-based physiological and biochemical trait estimation, highlighting their strong potential for disease-detection applications [13,123,126].
5.2.4. Spaceborne Satellite Platforms
Satellite-based RS offers extensive spatial coverage and long-term observational continuity, making it particularly valuable for epidemiological studies and disease-risk modelling driven by environmental factors [127,128]. In practice, multispectral satellite sensors are more commonly used than hyperspectral systems due to their simpler processing requirements, lower data volume, and cost [129,130]. Modern satellite platforms provide spatial resolutions ranging from sub-meter levels to hundreds of meters, enabling applications that vary from finer canopy-scale analyses for larger plots to regional-scale surveillance [131]. Poblete et al. [132] demonstrated the use of high-resolution Worldview-2 and -3 commercial satellite multispectral imagery to detect Xylella fastidiosa and Verticillium dahliae infections in olive and almond orchards across Spain, Italy, and Australia between 2011 and 2021. However, the effectiveness of satellite-based disease detection is constrained by factors such as cloud cover, atmospheric interference, fixed revisit intervals, restricted control over acquisition timing, and delays between data capture and availability [13].
To make these trade-offs explicit, Table 3 summarises the strengths and limitations of each platform–scale combination for plant disease detection. The relationship between scale and detection accuracy is systematic: as the measurement scale increases, spatial resolution and per-pixel signal purity generally decrease, and disease signals become progressively diluted by contributions from soil, shadows, and neighbouring vegetation. Detection accuracy for incipient or localised symptoms therefore declines with increasing scale, whereas spatial coverage, temporal continuity, and operational feasibility improve. This trade-off shifts the emphasis from mechanistic diagnosis at fine scales towards disease mapping and management decision support at coarser scales. In summary, effective plant disease detection increasingly relies on the integration of multi-scale and multi-platform approaches. Controlled-environment studies inform field deployments, while high-resolution UAV or ground-based data bridge the gap between mechanistic understanding and satellite-based regional assessment. This hierarchical sensing framework is essential for translating advances in RS technologies into robust, scalable solutions for disease management.
Table 3.
Summary of the strengths and limitations of different platform–scale combinations for plant disease detection.
6. Algorithm (A): Algorithms for Plant Disease Detection
6.1. Deep Learning Represents a Main Research Direction
Deep learning has become the dominant algorithmic approach in plant disease detection, particularly for tasks involving the image classification, lesion localisation, and pixel-level segmentation of RGB images (see Figure 3). Compared to classical machine learning approaches, DNNs can automatically learn hierarchical representations from complex data, making them particularly suited for handling diverse disease symptoms and varying imaging conditions. Reviews by Kamilaris and Prenafeta-Boldú [133] and Li et al. [19] highlighted the rapid adoption of deep learning models in agriculture and their promise for plant stress diagnosis.
CNN-based disease detection has achieved notably high accuracies in controlled environments. For example, Balasundaram et al. [29] used a multilayer perceptron to classify five types of tea tree leaf diseases, yielding an accuracy of 95.06%. In a task focused on symptom localisation and classification, Albattah et al. [33] combined DenseNet-77 with a CenterNet detector to identify and categorise 38 crop diseases in the PlantVillage dataset, achieving an mAP of 0.99. However, this level of performance often depends on the availability of large, well-labelled datasets in controlled environments. In more complex settings, such as maize fields, Masood et al. [34] utilised a customised Faster R-CNN enhanced with a CBAM, which achieved an mAP of 0.94 in lesion localisation and classification using the CD&S database. At the canopy scale, Hernández et al. [35] successfully demonstrated the localisation and classification of grapevine downy mildew lesions using a lightweight EfficientNetV2S model, achieving an IoU of 0.83. Moreover, deep learning frameworks have shown robustness in semantic segmentation, with models like U-Net (Li, et al. [37] and SegNet [39]) being notable examples. Faster mask R-CNN has become the widely adopted model for instance segmentation [40] and disease severity scaling [47].
Despite their remarkable performance, deep learning models remain sensitive to domain shifts between laboratory conditions and field imagery. Moupojou et al. [36] explicitly demonstrated that models trained on PlantVillage images perform poorly when applied to field datasets. These findings also highlight a persistent limitation that deep learning methods are data intensive. There is a scarcity of labelled field datasets that encompass diverse disease stages, cultivars, and environmental conditions, particularly in RS contexts. Bridging this gap is a major priority for advancing deep learning applications in plant disease detection.
6.2. Traditional Machine Learning and Statistical Methods Are Still Playing Critical Roles
Deep learning and traditional machine learning occupy complementary niches in plant disease detection, and the choice between them should reflect data availability and analytical requirements rather than prevailing trends. Traditional methods remain competitive and in some settings superior, particularly in hyperspectral RS and disease severity modelling, where sample sizes are limited and interpretability is important [134]. SVMs have demonstrated strong performance in various disease-detection tasks. For example, Römer, et al. [135] achieved a 93% accuracy in the early detection of wheat leaf rust using fluorescence features. Moreover, SVMs consistently outperformed LDA, Quadratic Discriminant Analysis (QDA), decision trees, and neural networks in detecting Huanglongbing in citrus plants [136,137]. Their robustness with small training datasets makes SVMs particularly appealing for RS applications. Additionally, Winfield et al. [51] combined SVM-based crown segmentation with multiple linear regression to estimate foliar blight severity from UAV multispectral imagery. Tree-based models, such as decision trees and random forests, are also commonly used for disease mapping and severity estimation from multispectral and satellite data. For instance, Retkute et al. [55] found that random forest outperformed decision trees and SVMs when predicting BBTD and Fusarium wilt using vegetation indices derived from Landsat-8 multispectral images.
Statistical discriminant analysis and regression methods are effective in relatively simple detection scenarios, such as differentiating a small number of diseases or estimating disease severity from selected spectral features. Techniques like LDA, logistic regression, and Partial Least Squares Regression (PLSR) have been successfully applied in studies of diseases affecting grapevine, wheat, sugar beet, pine wilt, and tomatoes [134,138,139]. PLSR, in particular, offers a favourable balance between dimensionality reduction and variance preservation, making it suitable for hyperspectral disease severity modelling [102,140].
6.3. Feature Extraction and Selection Remain Essential
Despite the rise of end-to-end deep learning, feature extraction and selection continue to play a crucial role, especially when training data are limited or interpretability is required. For RGB imagery, colour, texture, and morphological features remain widely utilised from the organ to plot scales [29,52,65]. Texture descriptors derived from colour co-occurrence matrices (CCMs) are particularly effective for leaf disease identification [45,141]. More recent studies increasingly combine handcrafted features with deep features. Hayıt et al. [45] demonstrated that fusing colour and texture features with DenseNet-based embeddings improved the classification of wheat yellow rust severity. Similar hybrid feature strategies were adopted by Chaitanya and Posonia [32], who used feature fusion and optimisation frameworks to improve performance on large plant disease datasets.
In hyperspectral and multispectral RS, VIs remain essential for disease detection. Indices sensitive to the pigments, canopy structure, biomass, or water status, such as the Normalised Difference Vegetation Index (NDVI), Green Normalised Difference Vegetation Index (GNDVI), Optimized Soil-Adjusted Vegetation Index (OSAVI), Red Edge Chlorophyll Index (RECI), and water indices, have consistently shown responses to plant stress and disease conditions [65,142]. Feature selection is particularly critical for hyperspectral datasets due to their high dimensionality and multicollinearity. Dimensionality reduction methods such as Principal Component Analysis (PCA), Independent Component Analysis (ICA), LDA, Variance Inflation Factor (VIF), and Successive Projections Algorithm (SPA) are widely used to assess informative spectral bands and reduce redundancy, improving model robustness and computational efficiency [62,143,144].
6.4. Transfer Learning for Cross-Domain Generalisation
Transfer learning has emerged as a critical strategy for addressing domain shifts caused by variations in geography, sensor characteristics, and environmental conditions. Among the various approaches, feature-based methods such as Transfer Component Analysis (TCA) explicitly reduce discrepancies between source and target feature distributions by projecting data into a shared latent space. This enables effective knowledge transfer, even with limited labelled samples in the target domain [145]. Previous studies have demonstrated that feature-alignment approaches based on distribution similarity can significantly enhance predictive performance in cross-domain settings, while requiring only a small proportion of labelled target data [146].
In parallel, deep learning-based transfer learning, particularly the fine-tuning of pre-trained CNNs and transformer architectures, has become standard practice. Models such as ResNet, DenseNet, and vision transformers, pre-trained on large-scale datasets, like ImageNet, are routinely adapted for plant-disease-detection tasks. These adaptations consistently achieve high accuracy and strong generalisation across different crop species and imaging conditions [147]. For instance, hybrid CNN–Vision Transformer frameworks have demonstrated robust performance in identifying plant diseases using multispectral images, highlighting the effectiveness of combining deep feature extraction with transfer learning [54].
Recent research further underscores the importance of transfer learning in UAV-based crop monitoring applications. In particular, transfer learning frameworks that incorporate temporal models, such as Long Short-Term Memory (LSTM) networks, have shown superior performance in estimating disease severity across various sites and growing seasons, especially when only limited target-domain data are available [148]. These findings collectively emphasise that transfer learning not only improves model robustness under variable conditions but also reduces data requirements, making it highly suitable for real-world agricultural deployment.
6.5. Data Augmentation for Enhanced Model Robustness
Data augmentation has become a nearly universal element of deep learning pipelines for plant disease detection. By applying geometric transformations, adjusting intensity, and introducing noise perturbations, augmentation effectively increases the size of the training data and improves model generalisation. For example, Zhang et al. [49] used techniques such as flipping, brightness variation, and Gaussian noise to enhance aphid damage detection using YOLOv8 in cotton canopies. Additionally, ref. [46] introduced an automated pipeline for scaling the severity of wheat rust disease at the canopy scale in natural field settings. Huang et al. [148] generated over 14,000 training samples from just 224 high-resolution vineyard images via tiling and augmentation, enabling robust lesion detection at the field scale. Moreover, Hassam et al. [30] relied heavily on augmentation to expand citrus disease datasets and improve classification accuracy. While augmentation helps alleviate data scarcity, it cannot entirely replace the need for real field data that captures a variety of disease expressions and environmental conditions. Future benchmarks should clearly distinguish between improvements gained from synthetic augmentation and genuine domain generalisation capabilities.
6.6. Selecting Between Deep Learning and Traditional Methods: A Decision Guide
For practitioners, the choice between deep learning and traditional machine learning should be driven by the specific constraints of the application. Table 4 summarises a practical decision guide. In general, deep learning is preferable when large, well-annotated datasets and sufficient computational resources are available, particularly for complex visual tasks such as lesion localisation, segmentation, and mixed-symptom classification. Traditional methods, especially SVMs and random forests, are advantageous when sample sizes are limited, annotation budgets are constrained, spectral data are high-dimensional, or interpretable outputs are required for agronomic decision support. In many settings, hybrid strategies offer the most effective compromise: combining handcrafted features or vegetation indices with deep features (Section 6.3), or applying transfer learning to reduce data requirements (Section 6.4). Regardless of the chosen approach, reporting experimental constraints and benchmarking against strong traditional baselines would improve the comparability and credibility of future studies.
Table 4.
A practical decision guide for algorithm selection.
7. Dataset (D): The Critical Role of Datasets
7.1. Overview of the Current Datasets
Datasets are foundational to RS-based plant disease detection, as they directly determine the feasibility, accuracy, robustness, and generalisability of detection models. Regardless of whether classical machine learning or modern deep learning methods are employed, the algorithmic performance is inherently constrained by the quality, diversity, and representativeness of the training data. In particular, data-driven deep learning techniques are increasingly dominant, highlighting the reliance on large, well-annotated datasets. Therefore, the design and availability of datasets have become central challenges in disease detection research.
Ideally, a high-quality dataset for plant disease detection should meet several key criteria: (1) Sufficient sample size: a large sample size is essential, particularly for deep learning models, which require numerous labelled samples to avoid overfitting. While high classification accuracies are frequently reported with small or simple datasets, such results often fail to generalise well beyond the original study conditions. (2) Balanced and representative data distributions: datasets should include healthy plants along with the disease types, severity levels, and growth stages, with attention to class imbalance. Skewed distributions can artificially inflate performance metrics, obscuring poor detection rates for rare but agronomically important diseases. (3) Diversity across environments and scales: RS applications must consist of a variety of environments and scales. These datasets should span multiple biological and spatial scales, from organ-scale to canopy- and plot-level observations. Such datasets can be used independently to train task-specific models or combined to develop large general-purpose models.
Currently, the most widely used datasets for plant disease detection rely on RGB imagery. Publicly available datasets with a substantial number of labelled RGB images have played a crucial role in advancing methods for disease image classification, lesion localisation, and segmentation [33]. Many of these RGB datasets focus on single leaves imaged under controlled conditions, often set against uniform backgrounds (see Table A4). As part of this review’s inclusive scope, these controlled-condition RGB datasets are considered within the remote sensing literature because they underpin foundational algorithm development and cross-study benchmarking. Nonetheless, we explicitly recognise their limitations for operational remote sensing applications and discuss the gap between laboratory benchmarks and field-scale deployment throughout the review. They often lack ecological realism, potentially leading to overly optimistic performance estimates. Recent efforts have increasingly included RGB images captured in natural field environments, which present complex backgrounds, occlusions, variable lighting, and mixed disease expressions, essential for evaluating algorithm robustness and operational readiness [149].
Beyond RGB imagery, there is a notable scarcity of multispectral and hyperspectral datasets for plant disease detection. Table A5 shows the benchmark datasets of multispectral and hyperspectral datasets for plant disease detection. Spectral data are highly sensitive to biochemical and physiological changes associated with diseases, making them particularly valuable for early detection and severity assessments. However, the high cost of sensors, complex calibration procedures, and large data volumes impede the large-scale dataset development. Most hyperspectral disease datasets tend to be small, often focus on specific crops or diseases, and are typically collected under controlled conditions or at limited spatial extents. Consequently, model development often relies on careful feature selection and classical machine learning methods rather than data-intensive deep learning architectures. The absence of shared, standardised spectral datasets also hampers cross-study comparisons and slows down methodological progress.
7.2. Data Standardisation and Sharing Initiatives
Beyond dataset content, the absence of standardised formats, annotation protocols, and metadata reporting severely impedes model generalisability and cross-study comparisons. Community initiatives in plant phenotyping and the life sciences provide a starting point. The Minimum Information About Plant Phenotyping Experiments (MIAPPE) specification defines the minimal metadata required to describe phenotyping experiments, covering the experimental design, environmental conditions, and measurement methods, and has been widely adopted in field and controlled-environment studies [150,151]. The COPO platform further operationalises such standards by supporting metadata capture and dataset brokering for plant science. At a general level, the FAIR Guiding Principles (Findable, Accessible, Interoperable, Reusable) provide an overarching framework for data management and stewardship that is increasingly required by funders and journals. However, remote-sensing-based disease-detection datasets rarely conform to these conventions, and existing phenotyping standards do not yet cover sensor-specific fields such as spectral calibration, acquisition geometry, and radiometric processing. Extending MIAPPE-style specifications with remote sensing metadata would directly address dataset fragmentation and enable rigorous benchmarking across studies.
7.3. Minimum Metadata Reporting Requirement
We recommend that plant-disease-detection datasets report, at minimum, the following metadata categories:
(i) sensor specifications, including sensor type, spectral bands, spatial resolution, calibration, and acquisition settings;
(ii) acquisition geometry, including platform, altitude, viewing angle, ground sampling distance, and illumination conditions;
(iii) environmental context, including crop species and cultivar, growth stage, disease pressure and severity range, and meteorological conditions;
(iv) disease scoring criteria, including the reference standard (e.g., visual scales, molecular assays), severity scale definition, and the timing of annotation relative to symptom development; and
(v) annotation protocols, including labelling granularity (image, patch, or pixel level), annotator qualifications, and inter-annotator agreement. Metadata should be published in machine-readable, FAIR-compliant formats alongside the data, with versioning and persistent identifiers, to enable automated discovery, harmonised integration, and reproducible evaluation.
7.4. Data Synthesis and Synthetic Data Generation
Two complementary strategies can mitigate data scarcity. First, data synthesis, the systematic combination of multiple existing datasets, increases sample diversity and coverage across environments, sensors, and cultivars. Its main challenge is interoperability: differing label taxonomies, annotation conventions, spectral band configurations, and radiometric scales can introduce systematic biases that degrade model performance. Harmonisation procedures, including unified class hierarchies, radiometric normalisation, and consistent preprocessing, are therefore prerequisites for reliable cross-dataset training. Second, synthetic data generation using generative models, such as generative adversarial networks and diffusion models [152], can produce photorealistic disease imagery with controlled symptom types, severities, backgrounds, and illumination. Synthetic data can augment scarce real samples and support controlled evaluations of model sensitivity. However, synthetic data may carry a distributional mismatch relative to real field conditions, and models trained predominantly on synthetic images risk overestimating performance at deployment. Careful validation based on real field data, combined with reporting of the synthetic-to-real data ratio, is therefore essential to ensure that reported gains reflect genuine generalisation rather than artefacts of data generation.
8. The BTSCAD Framework: An Integrated Modular Architecture for Plant Disease Detection via Remote Sensing
The six modules of the BTSCAD framework are interdependent and collectively form a complex system for plant disease detection using remote sensing technologies. Each module informs and constrains the others, establishing a closed-loop architecture that enables iterative refinement throughout the detection pipeline (Figure 4). The interactions among the modules of the BTSCAD framework are explained below. For specific examples, Appendix D demonstrates a case study of applying the hex-view framework to detect net blotch disease in barley.
Figure 4.
The BTSCAD Framework. The figure illustrates the interactions among the six modules of the BTSCAD framework. Each module is represented by a distinct colour, and the flow of information and effects between modules is indicated by arrows in the corresponding colour.
- Biology (B) Module
The Biology module serves as the foundational layer, providing essential knowledge of plant–pathogen interactions to all other modules. Understanding disease development patterns and symptom characteristics guides the selection of appropriate detection tasks (T). Symptom morphology and temporal dynamics inform the choice of suitable sensors (S) and platforms capable of achieving detection at the required spatial and temporal scale (C). Furthermore, the biological mechanisms underlying host–pathogen interactions direct data annotation strategies (D) and drive the development of robust detection algorithms (A).
- Task (T) Module
The Task module defines the detection objectives and operational requirements. It must first identify the most suitable sensor for successful detection, balancing detection performance against sensor availability, advantages, and limitations (S). Task design should account for the detection scale and data-collection frequency, thereby enabling the selection of feasible platforms. However, task fulfilment is constrained by the environmental conditions, platform availability, and the achievable scale of observation (C). Task selection directly guides algorithm design (A), and subsequent algorithm evaluation provides quantitative metrics to assess task success and determine whether task parameters require adjustment. The Task module also determines data-annotation methodologies (D), with annotation feedback informing potential refinements to the task specification.
- Sensor (S) Module
Sensor selection must consider the environmental context, platform compatibility, and detection scale (C). A sensor may be integrated into a platform and perform optimally within specific environmental conditions to achieve the required detection scale. Platform selection should account for the sensor weight, size, and power consumption. The Sensor determines the types and quality of data available to the Dataset module (D), which in turn provides feedback on data quality, including the signal-to-noise ratio, imaging angle, and spatial resolution.
- Condition (C) Module
The Condition module governs the scale and frequency of data collection (D). It specifies the operational parameters under which sensing is conducted and, in turn, receives feedback indicating whether the chosen scale and collection frequency are adequate for the detection task.
- Algorithm (A) Module
The Algorithm module formulates detailed requirements for the Dataset module (D), including the dataset size and annotation methodology. Conversely, the Dataset module conveys data properties and annotation limitations to guide algorithmic optimisation and model refinement.
- Dataset (D) Module
The Dataset functions as both a repository and a communication channel: it defines the scale of detection for Biology (B), receives annotation directives from the Task module (T), stores sensor-acquired data from the Sensor module (S), operates within the collection parameters set by Condition (C), and provides labelled data with known properties and constraints to the Algorithm module (A). In each interaction, the Dataset module returns feedback on data quality, annotation feasibility, and scale adequacy, enabling continuous system-wide optimisation.
9. Challenges and Further Research
Despite rapid progress in sensor technologies and algorithm development, RS-based plant disease detection still encounters a range of interconnected challenges that limit its applicability, reliability, and practical implementation. These challenges stem from the complexity of biological systems, discrepancies in scale, limited data availability, and substantial differences between experimental and natural field conditions. Overcoming these challenges will require coordinated advancements in data collection, modelling strategies, and system integration.
9.1. Biological Complexity and Symptom Ambiguity
Plant diseases are caused by diverse pathogens that use distinct infection strategies and temporal dynamics, resulting in heterogeneous and often subtle symptom expression. Many diseases induce physiological changes before any visible symptoms emerge, although pre-symptomatic detection has been demonstrated for specific pathosystems, such as Xylella fastidiosa infection in olive trees [83]. Others may exhibit spatially fragmented or transient symptoms that are difficult to detect accurately with RS techniques. Moreover, biotic stresses frequently co-occur with abiotic stresses such as drought, nutrient deficiencies, or heat stress, producing similar spectral or visual responses [28]. This overlap in symptoms significantly reduces diagnostic specificity [153]. Symptom heterogeneity further complicates sensor selection, because different pathogens perturb distinct physiological processes and therefore require different spectral, thermal, or structural indicators [8]. Future research should strengthen the integration of plant pathology knowledge with RS analytics. This could involve linking disease-specific physiological processes to spectral, structural, or temporal indicators. Conducting time-series analyses with repeated observations offers an important opportunity to differentiate disease progression from short-term environmental variability.
9.2. Cross-Scale Integration and Spatial Heterogeneity
Disease symptoms can appear at various biological scales, ranging from microscopic lesions at the tissue level to broader changes in biomass, pigment composition, or water status at the canopy level. However, RS observations are constrained by the spatial resolution of the sensors, which may not correspond to the scale at which symptoms are expressed. As the spatial scale increases, disease signals become increasingly mixed with background effects such as the soil reflectance, canopy architecture, shadows, and neighbouring plants [13]. Systematic comparisons of leaf-level and canopy-level datasets report markedly different detection performance, indicating that scale-induced signal dilution is a major source of model transfer failure [96,115]. Platform selection at each scale entails distinct trade-offs among spatial resolution, coverage, and operational cost, as documented for ground-based systems [113,114], UAV platforms [18,117], and satellite observations [13]. These challenges complicate the application of models developed at organ or plant scale to larger scales, such as canopy, plot, or regional levels. Future research should prioritise multi-scale sensing and modelling frameworks that integrate ground-based, UAV, and satellite observations. Developing hierarchical and scale-aware models that explicitly account for the aggregation of signals across different scales appears to be a promising direction.
9.3. Domain Adaptation and Model Generalisability
A persistent challenge in plant disease detection is the strong domain shift between datasets collected in controlled environments and those collected in the field. Moupojou et al. [36] explicitly demonstrated that models trained on PlantVillage images suffer substantial performance degradation when applied to field datasets, and similar transfer failures have been reported for cross-domain few-shot settings [11,12]. Variations in illumination, backgrounds, cultivar diversity, plant architecture, and management practices can lead to substantial performance degradation when models are transferred across domains. Most existing studies tend to focus on specific combinations of crops, diseases, environments, and sensors, resulting in narrowly specialised models. However, practical applications require detection frameworks that are capable of generalising across multiple crops, pathogen types, sensor platforms, and geographic regions. Recent advancements in feature-based transfer learning [145], the fine-tuning of pre-trained deep architectures [147], temporal transfer learning across sites and seasons [148], and physically grounded spectral simulation, such as extended PROSAIL simulations that mitigate phenological effects on disease quantification [77,78,79], present promising directions for developing reusable disease detection systems. Using large and diverse pretraining datasets, potentially enhanced with synthetic data, could serve as a foundation for widely applicable RS models in plant health monitoring.
The open sharing of datasets is essential for advancing RS-based plant disease detection. Public datasets enable reproducibility, fair algorithm comparisons, and rapid methodological development; for example, the FieldPlant dataset provides field-acquired images with complex backgrounds for benchmarking field-level generalisation [149]. Transfer learning, allowing models trained on one dataset to be adapted to new crops, sensors, or locations with minimal additional annotation efforts, is essential. Beyond data sharing, standardisation of dataset documentation is equally important. This includes sensor specifications, acquisition geometry, environmental conditions, annotation protocols, and disease scoring criteria. Adopting community standards, such as the FAIR principles for data management and the MIAPPE specification for phenotyping metadata [150,151], together with curation platforms that operationalise these standards, would greatly improve dataset interoperability and cross-study comparability. Such metadata is critical for interpreting model performance and understanding the applicability limits of a given dataset. Given the biological complexity of plant diseases and the diversity of RS platforms, future progress will depend on coordinated efforts to establish multi-scale, multi-sensor, and multi-environment datasets, with an emphasis on field realism and long-term accessibility to the research community.
9.4. Validation Strategies for Generalisable Disease Detection
Beyond model architecture and feature engineering, the reliability of disease-detection models is fundamentally determined by how they are validated. A prevalent practice in the reviewed literature is random image-level splitting, in which images from the same field, season, or sensor are arbitrarily distributed across training and test sets. This approach introduces data leakage: images acquired under shared conditions (same illumination, field location, or acquisition date) contain a correlated noise and background structure, inflating performance estimates and masking poor generalisation. Moreover, many studies lack an independent testing set that is entirely separate from the model development pipeline, raising concerns about the operational relevance of reported accuracies.
To obtain realistic estimates of model generalisability, validation strategies must account for the non-independent structure inherent in remote sensing data. Several cross-validation schemes are particularly relevant to plant disease detection:
- Leave-one-field-out (LOFO) cross-validation trains on data from all but one field and tests on the held-out field, assessing whether a model generalises across spatially distinct sites or merely memorises site-specific features.
- Leave-one-season-out (LOSO) cross-validation evaluates temporal robustness by training on one or more growing seasons and testing on a different season, revealing sensitivity to inter-annual weather variation, pathogen pressure, and phenological shifts.
- Leave-one-location-out (LOLO) cross-validation, analogous to LOFO but defined at coarser geographic scales (e.g., distinct agro-ecological regions), tests generalisation across broader climatic and edaphic gradients.
- Cross-sensor validation tests whether a model trained on data from one sensor (e.g., a laboratory hyperspectrometer) transfers to data from another (e.g., a UAV-mounted multispectral camera), directly probing sensor-agnostic feature extraction.
We recommend that future studies adopt one or more of these validation strategies as standard practice, complementing rather than replacing conventional random-split evaluations. Reporting results under both random and independent splits provides a transparent, multi-level assessment of model robustness. Within the BTSCAD framework, these protocols explicitly link the Condition dimension (field identity, season, location, sensor type) to the Dataset and Algorithm dimensions, enabling systematic tracking of which sources of variation a given validation covers.
10. Conclusions
RS has become a transformative tool for plant disease detection, offering non-destructive, scalable, and high-throughput monitoring capabilities across diverse agricultural systems. However, as this review highlights, successful disease detection cannot be achieved by optimising any single component in isolation. Instead, it requires a holistic and integrated perspective, as formalised in the proposed hex-view BTSCAD framework.
The BTSCAD framework provides a unified conceptual structure for understanding and advancing RS-based plant disease detection. Critically, these six components are not independent; they are deeply interconnected and mutually constraining. Biological processes determine how diseases develop and manifest, which directly influences the definition of detection tasks. These tasks guide the selection of appropriate sensors, whose effectiveness is further shaped by environmental and observational conditions. In turn, both sensor characteristics and conditions define the nature and quality of datasets, which fundamentally constrain the design and performance of algorithms. Finally, algorithmic outputs feed back into task formulation and biological interpretation, completing a tightly coupled system. This interdependence implies that limitations in any single component, such as inadequate datasets, inappropriate sensor selection, or poorly defined tasks, can propagate through the entire pipeline and hinder detection performance. Conversely, meaningful progress emerges when these components are co-designed and aligned, enabling systems that are biologically informed, task-relevant, sensor-aware, condition-robust, algorithmically effective, and data-driven. It should be noted that the proposed framework should be further refined and optimised to accommodate the specific requirements of different plant-disease-detection scenarios.
To translate these principles into practice, we identify four priority research directions. First, multi-sensor benchmark datasets spanning RGB, multispectral, hyperspectral, thermal, and LiDAR modalities under matched field conditions are urgently needed to enable fair cross-modal comparison and fusion. Second, field-scale time-series monitoring studies should be prioritised over single-time-point snapshot designs, as temporal signatures of disease progression provide critical discriminative information not available from static observations. Third, external validation based on independent sites, seasons, and cultivars must become a standard reporting requirement to assess genuine model generalisability beyond training conditions. Fourth, biologically informed model interpretation, linking spectral-spatial features to known physiological processes (e.g., pigment degradation, stomatal conductance changes, cell wall breakdown), should be integrated into algorithm development to improve diagnostic specificity and reduce reliance on spurious correlations. Addressing these four directions will accelerate the transition from proof-of-concept demonstrations to operational disease detection systems that are robust, interpretable, and scalable.
Author Contributions
Literature collection and selection: H.L. (Huajian Liu), Y.W., F.S. and R.P.; writing—original draft preparation: H.L. (Huajian Liu); writing—review and editing: Y.W., F.S., H.L. (Haoyu Lou) and R.P. All authors have read and agreed to the published version of the manuscript.
Funding
The Australian Plant Phenomics Network (APPN) is enabled by the Australian Government’s National Collaborative Research Infrastructure Strategy (NCRIS). APPN at Adelaide University also receives investment from the South Australian Department of State Development. This research benefited from additional funding from the Grains Research and Development Corporation (GRDC; UOA2306-002RTX).
Data Availability Statement
No new data were created or analyzed in this study. Data sharing is not applicable to this article.
Conflicts of Interest
The authors declare no conflicts of interest.
Abbreviations
The following abbreviations are used in this manuscript.
| BBTD | Banana Bunchy Top Disease |
| BTSCAD | Biology–Task–Sensor–Condition–Algorithm–Dataset |
| CBAM | Convolutional Block Attention Module |
| CD & S | Corn Disease and Severity |
| CMRCNN | Cascaded Mask R-CNN |
| DNN | Deep Neural Network |
| ELISA | Enzyme-Linked Immunosorbent Assays |
| FAIR | Findable, Accessible, Interoperable and Reusable |
| FCDD | Fully Convolutional Data Description |
| GNDVI | Green Normalised Difference Vegetation Index |
| H-B Scale | Horsfall-Barratt Scale |
| HMI | Hyperspectral Microscope Imaging |
| ICA | Independent Component Analysis |
| IFMR-CNN | Improved Faster Mask Regional Convolutional Neural Network |
| IoU | Intersection over Union |
| LDA | Linear Discriminant Analysis |
| LiDAR | Light Detection and Ranging |
| LSTM | Long Short-Term Memory |
| MAE | Mean Absolute Error |
| MedAE | Median Absolute Error |
| MIAPPE | Minimum Information About Plant Phenotyping Experiments |
| NDVI | Normalised Difference Vegetation Index |
| NIR | Near-InfraRed |
| OSAVI | Optimized Soil-Adjusted Vegetation Index |
| PCA | Principal Component Analysis |
| PLSR | Partial Least Squares Regression |
| PQ | Panoptic Quality |
| PR-AUC | Precision Recall—Area Under the Curve |
| QDA | Quadratic Discriminant Analysis |
| RECI | Red Edge Chlorophyll Index |
| RGB | Red-Green-Blue |
| RMSE | Root Mean Square Error |
| RNN | Recurrent Neural Network |
| ROC-AUC | Receiver Operating Characteristic—Area Under the Curve |
| RS | Remote Sensing |
| SAM | Segment Anything Model |
| SAR | Synthetic Aperture Radar |
| SPA | Successive Projections Algorithm |
| SVM | Support Vector Machine |
| TCA | Transfer Component Analysis |
| TR4 | Fusarium wilt tropical race 4 |
| UAV | Unmanned Aerial Vehicles |
| VI | Vegetation Index |
| VIF | Variance Inflation Factor |
| v-SVR | v-Support Vector Regression |
| WOA | Whale Optimisation Algorithm |
Appendix A. Literature Selection Criteria
Appendix A.1. Literature Search Strategy
This review is a narrative review rather than a formal systematic review. Nevertheless, to improve transparency and reduce selection bias, we adopted a structured literature identification and screening workflow informed by principles of transparent reporting commonly used in PRISMA (Figure A1). The literature search was conducted between 12 February 2026 and 15 May 2026 using major scholarly databases: Web of Science Core Collection, Scopus, Google Scholar, IEEE Xplore, and ACM Digital Library. The search focused on publications related to plant disease detection using image analysis, proximal sensing, and remote sensing technologies. Complete search strings for the Web of Science database are as follows:
TS = (
(plant disease OR crop disease OR plant pathogen OR rust OR blight OR powdery mildew)
AND
(detection OR monitoring OR classification OR diagnosis OR identification)
AND
(remote sensing OR UAV OR drone OR satellite OR ground-based OR controlled environment)
AND
(hyperspectral OR multispectral OR fluorescent OR thermal OR infrared OR RGB imaging OR computer vision OR LiDAR OR SAR)
AND
(machine learning OR deep learning OR statistical analysis OR transfer learning OR few-shot learning OR CNN OR transformer).
)
TS stands for Topic Search, and it is the Web of Science Topic field tag. The same keyword set was used across all databases, with minor syntax adjustments to comply with each platform’s search language.
Figure A1.
Structured literature identification and selection workflow, following the PRISMA 2020 four-phase structure.
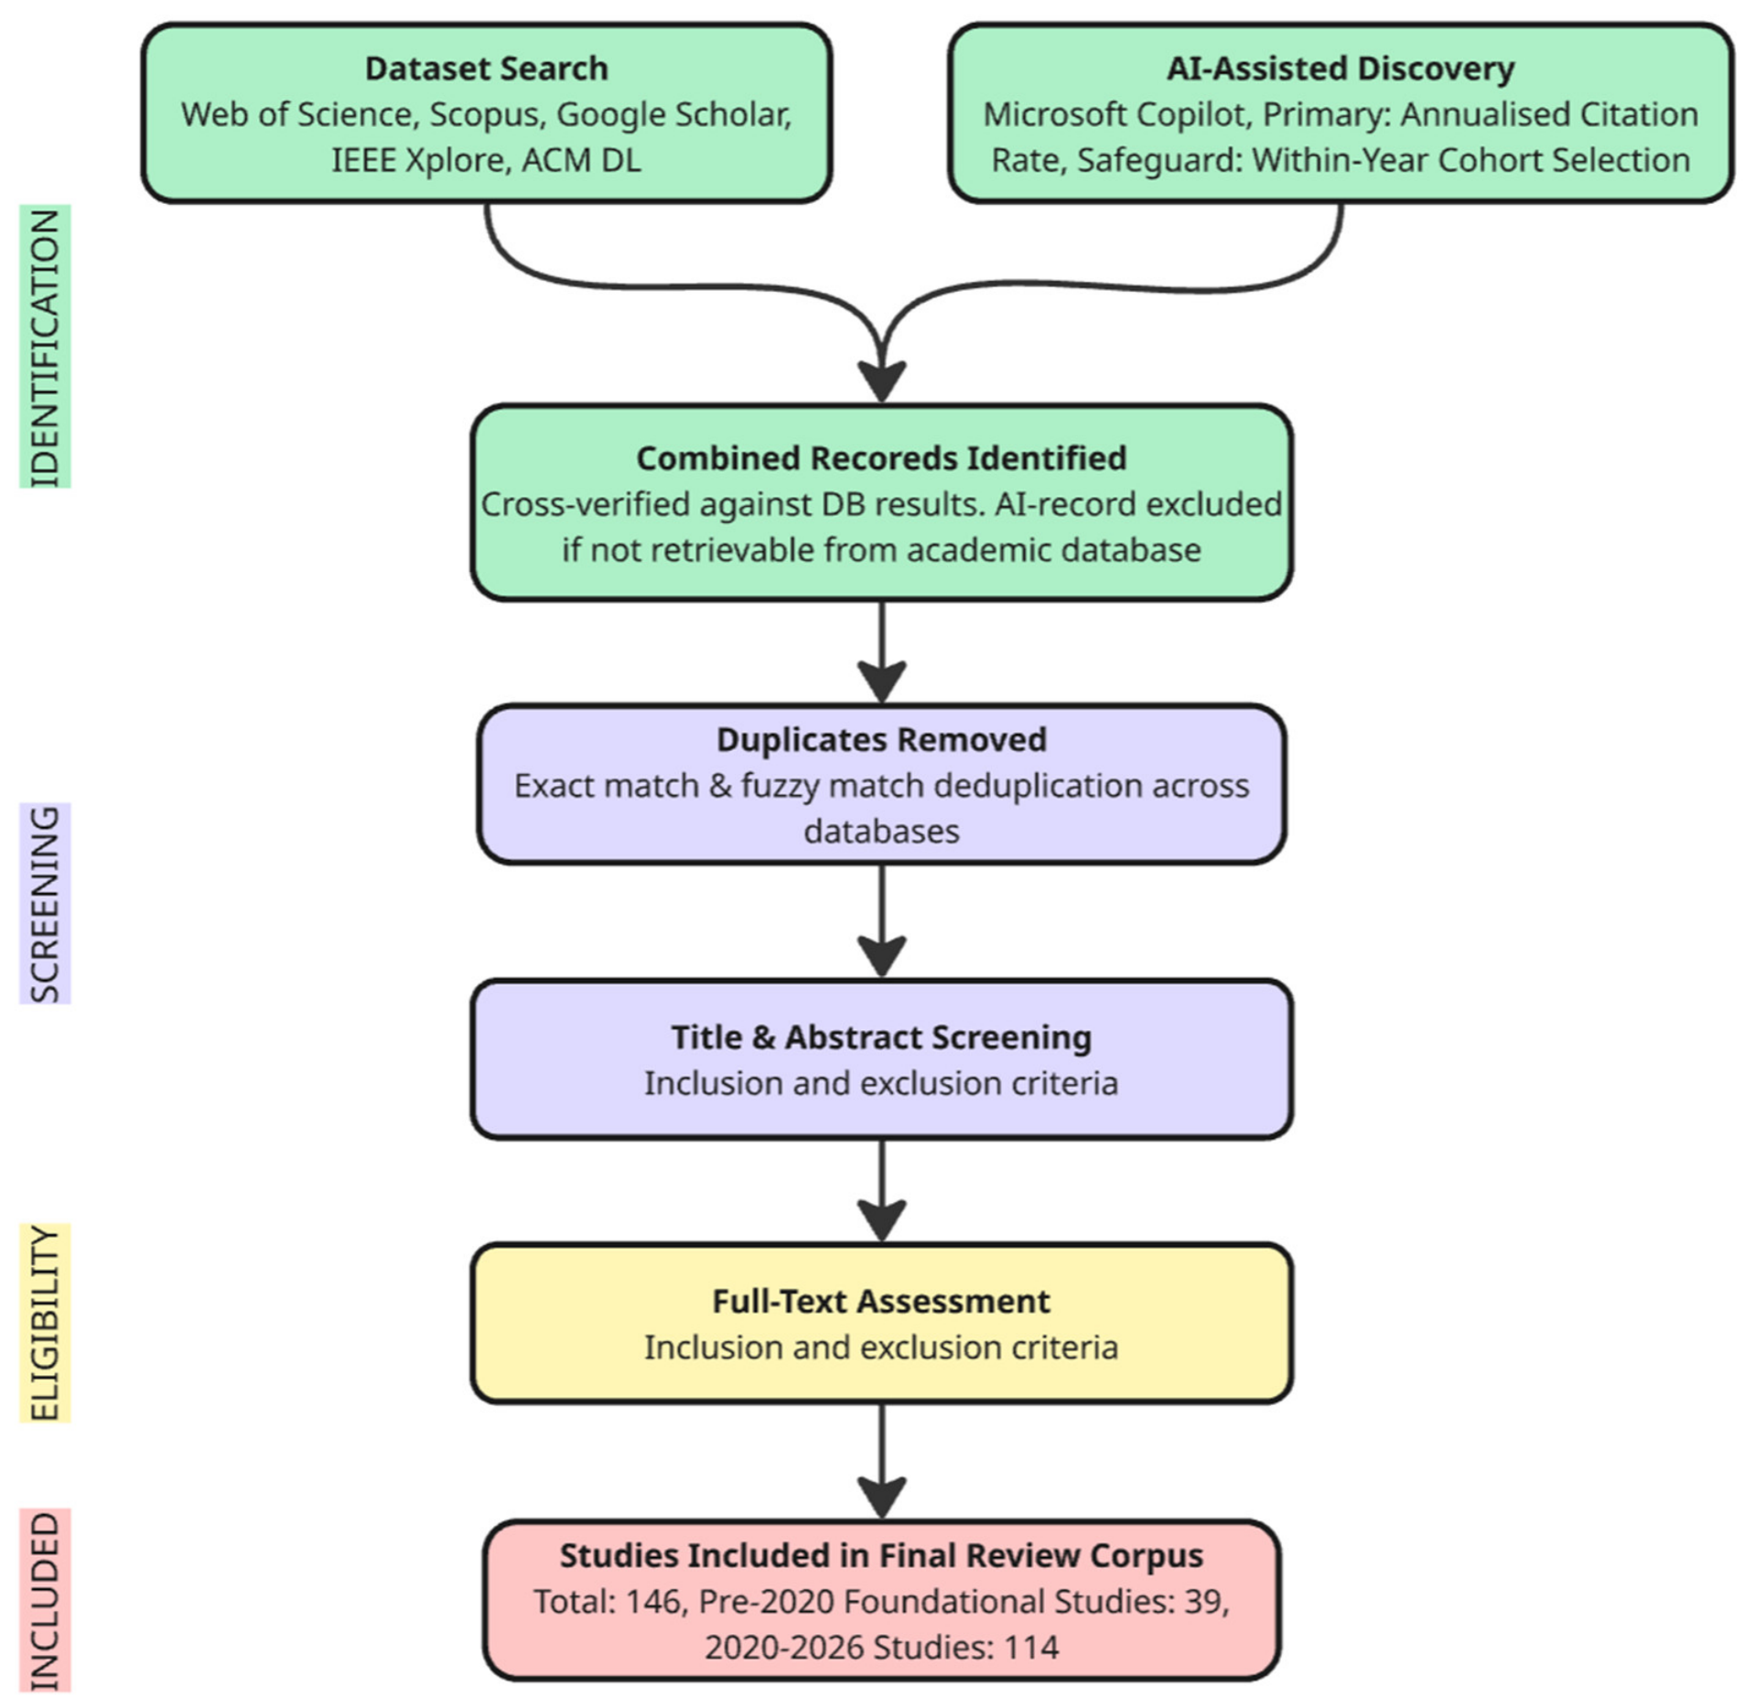
Appendix A.2. AI-Assisted Literature Identification
To improve coverage of the rapidly expanding literature, we employed Microsoft Copilot with ChatGPT 5.0 as an AI-assisted tool for literature discovery. The AI system was used only to assist in identifying potentially relevant publications and to retrieve citation information from publicly available scholarly databases. All candidate publications identified via AI were cross-verified against the database search results, and any publication not retrievable from the queried academic databases was excluded. To reduce temporal bias against recently published papers, publication ranking was based primarily on the annualised citation rate (citation velocity) rather than total citations alone (Equation (A1)). This metric normalises citation counts by years of availability, enabling fairer comparison between older and more recent publications.
Annualised Citation Rate = Total Citation/(Search Year − Publication Year + 1)
Because citation-based ranking inherently favours older publications, a secondary within-year cohort selection strategy was applied as a coverage safeguard. Specifically, candidate papers were first grouped by publication year (2020–2026). Within each year, publications were ranked by the total citations in this year. The top-10 papers from each year were then carried forward, ensuring adequate representation of recent studies (2025–2026) that may not yet have accumulated citation counts comparable to earlier publications despite their scientific significance. The annualised citation rate remained the primary ranking metric; the within-year cohort selection was used solely to maintain temporal balance and avoid under-representation of emerging research directions.
Appendix A.3. Inclusion and Exclusion Criteria and Screening Procedure
- Studies were included if they satisfied all of the following criteria:
- Published in English.
- Published between 2020 and 2026, except a small number of foundational studies published before 2020 (n = 39), which the authors selected as they provided essential methodological or conceptual contributions. These were identified through expert knowledge and citation-network inspection, and their inclusion is individually justified in the main text.
- Peer-reviewed journal articles, or conference papers published in established venues with rigorous peer-review processes (e.g., IEEE, ACM, CVPR, ICCV, ECCV, NeurIPS).
- Focused on plant disease detection, diagnosis, monitoring, severity assessment, or related tasks.
- Employed image analysis, computer vision, proximal sensing, remote sensing, machine learning, or deep learning approaches.
- Reported sufficient methodological and experimental details to enable independent interpretation of results.
- Studies were excluded if they met any of the following criteria:
- Non-peer-reviewed publications (preprints, white papers, technical reports).
- Editorials, commentaries, corrigenda, patents, abstracts, or short reports lacking methodological detail.
- Studies lack quantitative evaluation or sufficient validation information.
Records were screened by title and abstract against the inclusion and exclusion criteria. Records clearly outside the scope were discarded. Remaining records were read in full and assessed against all inclusion and exclusion criteria. Following the screening procedure, the final review corpus consisted of 153 publications spanning the six dimensions of the BTSCAD framework.
Appendix B. Evaluation Metrics of Different Disease-Detection Tasks
Table A1.
Metrics to evaluate disease classification, semantic segmentation, severity scaling, and early prediction.
Table A2.
Metrics to evaluate symptom localisation and classification, instance segmentation, and panoptic segmentation.
Table A3.
Metrics to evaluate disease scoring.
Appendix C. Benchmark Datasets
Table A4.
The progression of major benchmark RGB datasets for plant disease detection. E: environmental condition (C for controlled, F for field, M for mixed). S: scale (L for leaf, P for plant). NC: number of classes. NI: number of images. B: bounding boxes. M: segmentation mask. P: publicly available. Note: Image counts and class definitions follow the original dataset publications. ✓ indicates available and ✗ indicates not available.
Table A5.
The progression of major benchmark datasets of multispectral and hyperspectral datasets for plant disease detection.
Appendix D. A Case Study of Applying the Hex-View Framework to Detect Net Blotch Disease in Barley
Liu et al. [65] demonstrated how to apply the hex-view framework to detect net blotch disease of barley using UAV-based RGB and multispectral imagery at plot scale (refer to Figure A2).
Figure A2.
A case study of the hex-view framework conducted by Liu et al. [65]. It demonstrates how to apply the BTSCAD framework to detect net blotch disease of barley using UAV-based RGB and multispectral imagery at plot scale. Each module is identified by a unique colour, while arrows of the corresponding colour depict the directional flow of information and effects between modules.
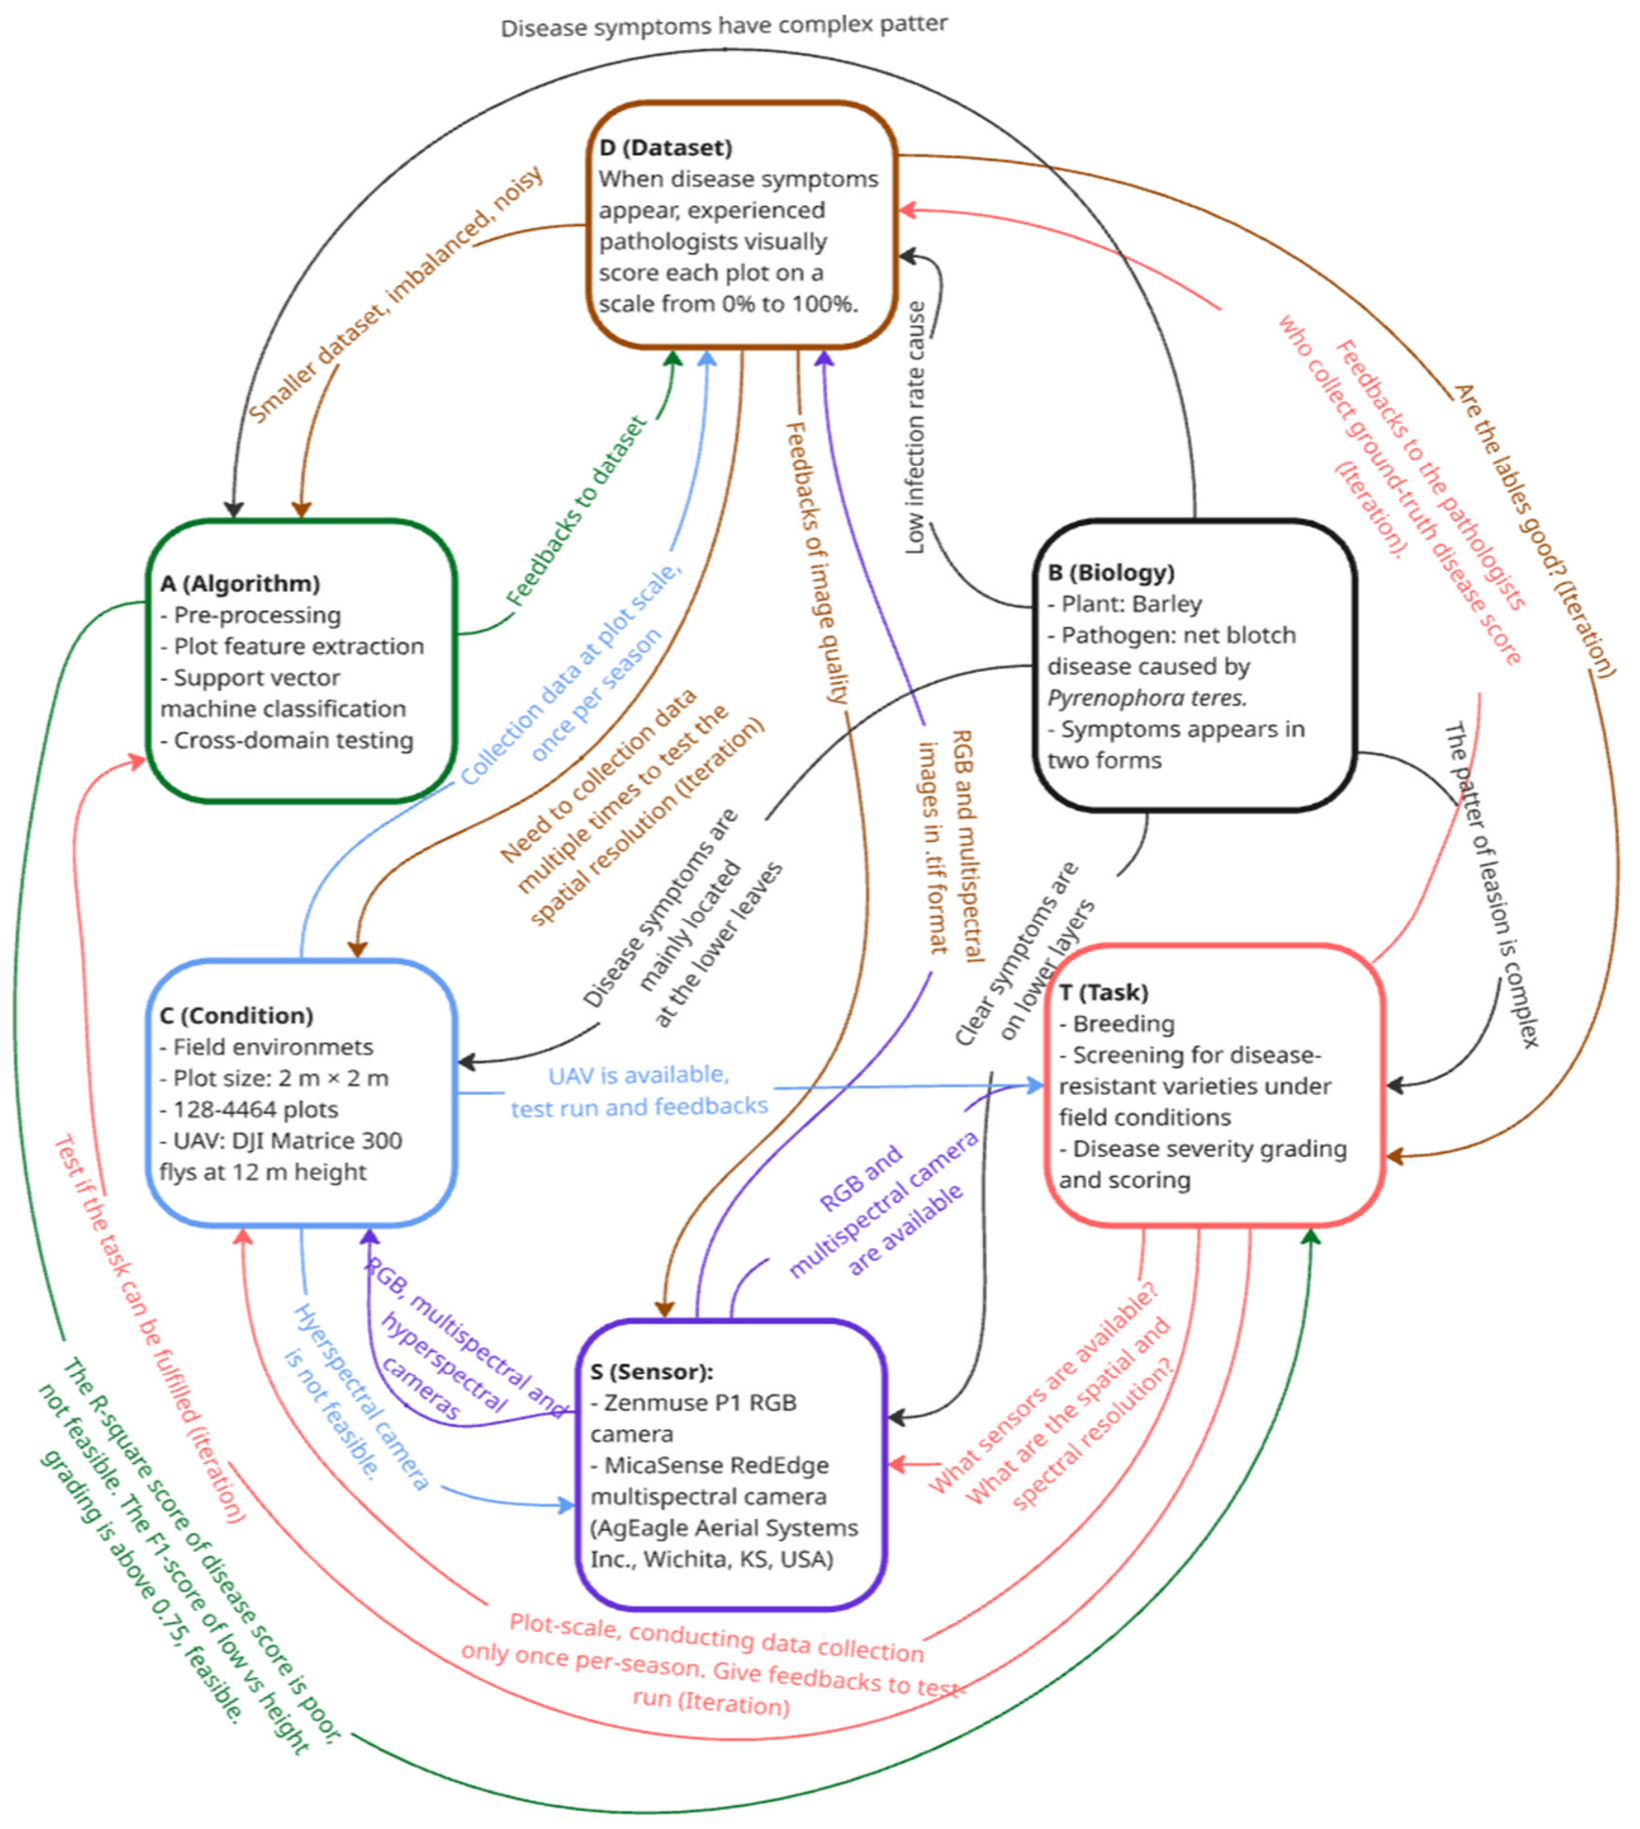
- Biology (B)
Barley (Hordeum vulgare L.) is one of the world’s most vital cereal crops. Among the main threats to barley production, net blotch, caused by the fungal pathogen Pyrenophora teres, is especially damaging. Net blotch appears in two forms: net form net blotch (NFNB), characterised by elongated, net-like dark-brown lesions, and spot form net blotch (SFNB), which features elliptical dark-brown lesions (guiding algorithm (A) development). Visible symptoms first appear on lower leaves or stems and become visible on top leaves at later growth stages (important information for sensor (S) selection and sensing angle (C)), causing challenges for early detection in the field environment (challenges in the T module). In field trials, the disease infection rate is not controllable, making it difficult to establish a dataset with an ideal distribution for machine learning model training (effects on D).
- Task (T)
The task was to develop a high-throughput disease-detection method in the field environment, enabling breeders to screen resistant cultivars, critical for fungicide-management strategies and sustainable barley production. Before data collection, pilot experiments were conducted multiple times to confirm the settings of the RGB and multispectral cameras, including the flying height and spatial resolution (multiple iterations with the S and C modules). The initial aim was to develop a regression model to predict exact disease scores, but this was found to be impractical because of the skewed dataset distributions and noisy data (the T module is constrained by the D module). Therefore, the task was simplified to disease severity scaling (low, medium and high) and further broken down to two scales (low and high) (multiple iterations with the A module). Feedback from the T module was forwarded to the pathologists who collected the ground-truth disease scores in the field to improve future data collection and communication (multiple iterations with the D module).
- Sensor (S)
Because limited disease symptoms are visible on the top canopy layers, this study adopted both the Zenmuse P1 RGB camera and the MicaSense RedEdge multispectral camera (AgEagle Aerial Systems Inc., Wichita, KS, USA) to achieve the best detection capabilities (the S module is affected by the B module). A hyperspectral camera was also proposed but was rejected due to the payload limitations of the UAV platform (the S module is constrained by the C module). The collected images were processed to match each plot to its ground-truth disease score to form a dataset for model training. The D module provided feedback to the S module regarding image quality.
- Condition (C)
Field trials were conducted in Horsham, Victoria, and Turretfield, South Australia, in 2023 and 2024. Barley varieties of varying net blotch resistance were sown with a plot size of approximately 2 m × 2 m. Spreader rows were interspaced in the middle of the trial to promote fungal infection. The Horsham trial had 128 plots in 2023 and 144 plots in 2024. The Turretfield trial dataset included 2791 plots in 2023 and 4464 plots in 2024. Under this environmental setting, the DJI Matrice 300 (SZ DJI Technology Co., Ltd., Shenzhen, China) was selected as the platform to balance the requirements of high-throughput and accurate detection at the canopy scale. Before the data collection, three test flights were conducted at 12 m, 20 m, and 30 m to confirm the best spatial resolution for symptom detection. The platform was set to a 12 m flying height, giving a ground resolution of approximately 1.5 mm/pixel for RGB images and 7.5 mm/pixel for the five-band multispectral images (multiple iterations between the C and D modules).
- Algorithm (A)
Although the dataset included more than 4000 samples, it was unbalanced: samples of low infection levels dominated the data distribution, and some trials had fewer than 200 samples. Initial tests using deep CNN models were not successful, so a classical SVM was selected instead after comparisons with other approaches (algorithm selection constrained by the D module). Model performance was evaluated using the accuracy, precision, recall, F1-score, Cohen’s Kappa coefficient (Kappa), and the area under the precision–recall curve (PR-AUC). In ten-fold cross-validation, both the RGB and multispectral cameras achieved F1 scores above 0.64; however, combining RGB and multispectral data did not yield significant improvement. This result confirmed that a multispectral camera was not necessary and that system cost could be reduced (the A module provides feedback to the S module). Cross-domain evaluations were further studied to assess the generalisability of models trained on a single dataset when applied to datasets collected across different years and geographic locations. Although the results were not satisfactory, the problems and further research directions were clarified (the A module provides feedback to the S, C, D, and T modules).
- Dataset (D)
When disease symptoms appeared, experienced pathologists scored each plot visually from 0 to 100. Each plot image was mapped to its ground-truth disease score using ArcGIS Pro 3.6.2 software (Environmental Systems Research Institute, Inc., Redlands, CA, USA). Due to the nature of disease progression in the field, most datasets exhibited a significant right skew, with observations concentrated in the low-severity range (the D module constrains the A module). Pathologists assessed disease severity by examining both the upper and lower canopy layers (the B module affects the D module). However, the UAV-based imaging system captured only top-down views, limiting observations to the upper canopy layers and missing symptoms on lower leaves (the C module affects the D module). This resulted in biased datasets, reducing the ability to detect early or low-level infections accurately and helping to explain the high number of false-negative errors observed in the model (the D module explains the A module).
References
- Derbyshire, M.; Newman, T.; Thomas, W.; Batley, J.; Edwards, D. The complex relationship between disease resistance and yield in crops. Plant Biotechnol. J. 2024, 22, 2612–2623. [Google Scholar] [CrossRef] [Scilit] [PubMed]
- Ma, J.; Cheng, Z.; Cao, Y. Artificial intelligence-assisted breeding for plant disease resistance. Int. J. Mol. Sci. 2025, 26, 5324. [Google Scholar] [CrossRef] [Scilit] [PubMed]
- Venbrux, M.; Crauwels, S.; Rediers, H. Current and emerging trends in techniques for plant pathogen detection. Front. Plant Sci. 2023, 14, 1120968. [Google Scholar] [CrossRef] [Scilit] [PubMed]
- Lau, H.; Botella, J. Advanced DNA-based point-of-care diagnostic methods for plant diseases detection. Front. Plant Sci. 2017, 8, 2016. [Google Scholar] [CrossRef] [Scilit] [PubMed]
- Bock, C.; Chiang, K.; Del Ponte, E. Plant disease severity estimated visually: A century of research, best practices, and opportunities for improving methods and practices to maximize accuracy. Trop. Plant Pathol. 2022, 47, 25–42. [Google Scholar] [CrossRef] [Scilit]
- Bock, C.H.; Poole, G.H.; Parker, P.E.; Gottwald, T.R. Plant disease severity estimated visually, by digital photography and image analysis, and by hyperspectral imaging. Crit. Rev. Plant Sci. 2010, 29, 59–107. [Google Scholar] [CrossRef] [Scilit]
- Garg, K.; Bhugra, S.; Lall, B. Automatic quantification of plant disease from field image data using deep learning. In IEEE Workshop on Applications of Computer Vision; IEEE: New York, NY, USA, 2021; pp. 1964–1971. [Google Scholar] [CrossRef] [Scilit]
- Mahlein, A. Plant disease detection by imaging sensors—Parallels and specific demands for precision agriculture and plant phenotyping. Plant Dis. 2016, 100, 241–251. [Google Scholar] [CrossRef] [Scilit] [PubMed]
- Munzert, K.; Engelsdorf, T. Plant cell wall structure and dynamics in plant–pathogen interactions and pathogen defence. J. Exp. Bot. 2025, 76, 228–242. [Google Scholar] [CrossRef] [Scilit] [PubMed]
- Osterbaan, L.; Fuchs, M. Dynamic interactions between plant viruses and their hosts for symptom development. J. Plant Pathol. 2019, 101, 885–895. [Google Scholar] [CrossRef] [Scilit]
- Yang, S.; Feng, Q.; Zhang, J.; Yang, W.; Zhou, W.; Yan, W. From laboratory to field: Cross-domain few-shot learning for crop disease identification in the field. Front. Plant Sci. 2024, 15, 1434222. [Google Scholar] [CrossRef] [Scilit] [PubMed]
- Pulicherla, S.; Senthilrajan, A. Cross-domain adaptation techniques for robust plant disease detection: A DANN-CORAL hybrid approach. Int. J. Exp. Res. Rev. 2024, 42, 68–84. [Google Scholar] [CrossRef] [Scilit]
- Liu, H.; Bruning, B.; Garnett, T.; Berger, B. Hyperspectral imaging and 3D technologies for plant phenotyping: From satellite to close-range sensing. Comput. Electron. Agric. 2020, 175, 105621. [Google Scholar] [CrossRef] [Scilit]
- Ali, M.; Bachik, N.; Muhadi, N.; Yusof, T.T.; Gomes, C. Non-destructive techniques of detecting plant diseases: A review. Physiol. Mol. Plant Pathol. 2019, 108, 101426. [Google Scholar] [CrossRef] [Scilit]
- Zhang, N.; Yang, G.; Pan, Y.; Yang, X.; Chen, L.; Zhao, C. A review of advanced technologies and development for hyperspectral-based plant disease detection in the past three decades. Remote Sens. 2020, 12, 3188. [Google Scholar] [CrossRef] [Scilit]
- Terentev, A.; Dolzhenko, V.; Fedotov, A.; Eremenko, D. Current state of hyperspectral remote sensing for early plant disease detection: A review. Sensors 2022, 22, 757. [Google Scholar] [CrossRef] [Scilit] [PubMed]
- Tanner, F.; Tonn, S.; de Wit, J.; Van den Ackerveken, G.; Berger, B.; Plett, D. Sensor-based phenotyping of above-ground plant-pathogen interactions. Plant Methods 2022, 18, 35. [Google Scholar] [CrossRef] [Scilit] [PubMed]
- Kouadio, L.; El Jarroudi, M.; Belabess, Z.; Laasli, S.; Roni, M.; Amine, I.; Mokhtari, N.; Mokrini, F.; Junk, J.; Lahlali, R. A Review on UAV-Based applications for plant disease detection and monitoring. Remote Sens. 2023, 15, 4273. [Google Scholar] [CrossRef] [Scilit]
- Li, L.; Zhang, S.; Wang, B. Plant disease detection and classification by deep learning-A Review. IEEE Access 2021, 9, 56683–56698. [Google Scholar] [CrossRef] [Scilit]
- Khan, S.; Alsuhaibani, A.; Alabduljabbar, A.; Almarshad, F.; Altherwy, Y.; Akram, T. A review on automated plant disease detection: Motivation, limitations, challenges, and recent advancements for future research. J. King Saud Univ. Comput. Inf. Sci. 2025, 37, 34–36. [Google Scholar] [CrossRef] [Scilit]
- Mansfield, J.; Genin, S.; Magori, S.; Citovsky, V.; Sriariyanum, M.; Ronald, P.; Dow, M.; Verdier, V.; Beer, S.V.; Machado, M.A.; et al. Top 10 plant pathogenic bacteria in molecular plant pathology. Mol. Plant Pathol. 2012, 13, 614–629. [Google Scholar] [CrossRef] [Scilit] [PubMed]
- Hull, R. Plant Virology; Academic Press: London, UK, 2014. [Google Scholar]
- Choudhury, F.K.; Rivero, R.M.; Blumwald, E.; Mittler, R. Reactive oxygen species, abiotic stress and stress combination. Plant J. Cell Mol. Biol. 2017, 90, 856–867. [Google Scholar] [CrossRef] [Scilit] [PubMed]
- West, J.; Bravo, C.; Oberti, R.; Lemaire, D.; Moshou, D.; McCartney, H. The potential of optical canopy measurement for targeted control of field crop diseases. Annu. Rev. Phytopathol. 2003, 41, 593–614. [Google Scholar] [CrossRef] [Scilit] [PubMed]
- Zhang, J.; Huang, Y.; Pu, R.; Gonzalez-Moreno, P.; Yuan, L.; Wu, K.; Huang, W. Monitoring plant diseases and pests through remote sensing technology: A review. Comput. Electron. Agric. 2019, 165, 104943. [Google Scholar] [CrossRef] [Scilit]
- Calderón, R.; Navas-Cortés, J.; Zarco-Tejada, P. Early detection and quantification of verticillium wilt in olive using hyperspectral and thermal imagery over large areas. Remote Sens. 2015, 7, 5584–5610. [Google Scholar] [CrossRef] [Scilit]
- Eves-van den Akker, S. Plant–nematode interactions. Curr. Opin. Plant Biol. 2021, 62, 102035. [Google Scholar] [CrossRef] [Scilit] [PubMed]
- Schumann, G.; D’Arcy, C. Essential Plant Pathology; APS Press: St. Paul, MN, USA, 2010. [Google Scholar]
- Balasundaram, A.; Sundaresan, P.; Bhavsar, A.; Mattu, M.; Kavitha, M.; Shaik, A. Tea leaf disease detection using segment anything model and deep convolutional neural networks. Results Eng. 2025, 25, 103784. [Google Scholar] [CrossRef] [Scilit]
- Hassam, M.; Khan, M.; Armghan, A.; Althubiti, S.; Alhaisoni, M.; Alqahtani, A.; Kadry, S.; Kim, Y. A Single stream modified mobileNet V2 and whale controlled entropy based optimization framework for citrus fruit diseases recognition. IEEE Access 2022, 10, 91828–91839. [Google Scholar] [CrossRef] [Scilit]
- Sambana, B.; Nnadi, H.; Wajid, M.; Fidelia, N.; Camacho-Zuniga, C.; Ajuzie, H.; Onyema, E. An efficient plant disease detection using transfer learning approach. Sci. Rep. 2025, 15, 19082. [Google Scholar] [CrossRef] [Scilit] [PubMed]
- Chaitanya, K.; Posonia, A. Tuned weighted feature fusion with hybridized DNN-RNN framework for plant disease detection and classification. Int. J. Remote Sens. 2024, 45, 1608–1639. [Google Scholar] [CrossRef] [Scilit]
- Albattah, W.; Nawaz, M.; Javed, A.; Masood, M.; Albahli, S. A novel deep learning method for detection and classification of plant diseases. Complex Intell. Syst. 2022, 8, 507–524. [Google Scholar] [CrossRef] [Scilit]
- Masood, M.; Nawaz, M.; Nazir, T.; Javed, A.; Alkanhel, R.; Elmannai, H.; Dhahbi, S.; Bourouis, S. MaizeNet: A deep learning approach for effective recognition of maize plant leaf diseases. IEEE Access 2023, 11, 52862–52876. [Google Scholar] [CrossRef] [Scilit]
- Hernández, I.; Gutiérrez, S.; Barrio, I.; Íñiguez, R.; Tardaguila, J. In-field disease symptom detection and localisation using explainable deep learning: Use case for downy mildew in grapevine. Comput. Electron. Agric. 2024, 226, 109478. [Google Scholar] [CrossRef] [Scilit]
- Moupojou, E.; Retraint, F.; Tapamo, H.; Nkenlifack, M.; Kacfah, C.; Tagne, A. Segment anything model & fully convolutional data description for plant multi-disease detection on field images. IEEE Access 2024, 12, 102592–102605. [Google Scholar] [CrossRef] [Scilit]
- Li, Y.; Qiao, T.; Leng, W.; Jiao, W.; Luo, J.; Lv, Y.; Tong, Y.; Mei, X.; Li, H.; Hu, Q.; et al. Semantic segmentation of wheat stripe rust images using deep learning. Agronomy 2022, 12, 2933. [Google Scholar] [CrossRef] [Scilit]
- Zhang, X.; Wang, P.; Wang, Y.; Hu, L.; Luo, X.; Mao, H.; Shen, B. Cucumber powdery mildew detection method based on hyperspectra-terahertz. Front. Plant Sci. 2022, 13, 1035731. [Google Scholar] [CrossRef] [Scilit] [PubMed]
- Gao, J.; Westergaard, J.; Sundmark, E.; Bagge, M.; Liljeroth, E.; Alexandersson, E. Automatic late blight lesion recognition and severity quantification based on field imagery of diverse potato genotypes by deep learning. Knowl.-Based Syst. 2021, 214, 106723. [Google Scholar] [CrossRef] [Scilit]
- Bondre, S.; Patil, D. Crop disease identification segmentation algorithm based on Mask-RCNN. Agron. J. 2024, 116, 1088–1098. [Google Scholar] [CrossRef] [Scilit]
- Afzaal, U.; Bhattarai, B.; Pandeya, Y.; Lee, J. An instance segmentation model for strawberry diseases based on Mask R-CNN. Sensors 2021, 21, 6565. [Google Scholar] [CrossRef] [Scilit] [PubMed]
- Kirillov, A.; He, K.; Girshick, R.; Rother, C.; Dollar, P. Panoptic segmentation. In Proceedings of the IEEE/CVF Conference on Computer Vision and Pattern Recognition (CVPR), Long Beach, CA, USA, 15–20 June 2019; pp. 9396–9405. [Google Scholar] [CrossRef] [Scilit]
- Madeleine, D.; Elizabeth, S.; Simon, P. Hierarchical Mask2Former: Panoptic segmentation of crops, weeds and leaves. arXiv 2023. [Google Scholar] [CrossRef] [Scilit]
- Horsfall, G.; Barratt, R. An improved grading system for measuring plant diseases. Phytopathology 1945, 115, 655. [Google Scholar] [CrossRef] [Scilit] [PubMed]
- Hayıt, T.; Erbay, H.; Varçın, F.; Hayıt, F.; Akci, N. The classification of wheat yellow rust disease based on a combination of textural and deep features. Multimed. Tools Appl. 2023, 82, 47405–47423. [Google Scholar] [CrossRef] [Scilit] [PubMed]
- Syeda, F.; Jameel, A.; Alani, N.; Humayun, M.; Alwakid, G. Automated detection and severity prediction of wheat rust using Cost-Effective Xception architecture. Plant Cell Environ. 2025, 48, 4126–4139. [Google Scholar] [CrossRef] [Scilit] [PubMed]
- Su, W.; Zhang, J.; Yang, C.; Page, R.; Szinyei, T.; Hirsch, C.; Steffenson, B. Automatic evaluation of wheat resistance to Fusarium head blight using dual Mask-RCNN deep Learning frameworks in computer vision. Remote Sens. 2021, 13, 26. [Google Scholar] [CrossRef] [Scilit]
- Zhang, B.; Wang, Z.; Ye, C.; Zhang, H.; Lou, K.; Fu, W. Classification of infection grade for anthracnose in mango leaves under complex background based on CBAM-DBIRNet. Expert Syst. Appl. 2025, 260, 125343. [Google Scholar] [CrossRef] [Scilit]
- Zhang, Z.; Yang, Y.; Xu, X.; Liu, L.; Yue, J.; Ding, R.; Lu, Y.; Liu, J.; Qiao, H. GVC-YOLO: A lightweight real-time detection method for cotton aphid-damaged leaves based on edge computing. Remote Sens. 2024, 16, 3046. [Google Scholar] [CrossRef] [Scilit]
- Azadbakht, M.; Ashourloo, D.; Aghighi, H.; Radiom, S.; Alimohammadi, A. Wheat leaf rust detection at canopy scale under different LAI levels using machine learning techniques. Comput. Electron. Agric. 2019, 156, 119–128. [Google Scholar] [CrossRef] [Scilit]
- Winfield, M.; Wing, M.; Wood, J.; Graham, S.; Anderson, A.; Hawks, D.; Miller, A. Applying unoccupied aircraft system multispectral remote sensing to examine blight in a Pacific Madrone Orchard. Int. J. For. Hortic. 2024, 10, 20–30. [Google Scholar] [CrossRef] [Scilit]
- Xie, Y.; Darren, P.; Liu, H. Detecting crown rot disease in wheat in controlled environment conditions using digital color Imaging and machine Learning. AgriEngineering 2022, 4, 141–155. [Google Scholar] [CrossRef] [Scilit]
- Xie, Y.; Plett, D.; Evans, M.; Garrard, T.; Butt, M.; Clarke, K.; Liu, H. Hyperspectral imaging detects biological stress of wheat for early diagnosis of crown rot disease. Comput. Electron. Agric. 2024, 217, 108571. [Google Scholar] [CrossRef] [Scilit]
- De Silva, M.; Brown, D. Multispectral plant disease detection with vision transformer–convolutional neural network hybrid approaches. Sensors 2023, 23, 8531. [Google Scholar] [CrossRef] [Scilit] [PubMed]
- Retkute, R.; Crew, K.; Thomas, J.; Gilligan, C. Detection of banana diseases based on Landsat-8 data and machine learning. Remote Sens. 2025, 17, 2308. [Google Scholar] [CrossRef] [Scilit]
- Chi, Z.; Chen, H.; Chang, S.; Li, Z.; Ma, L.; Hu, T.; Xu, K.; Zhao, Z. Large-Scale monitoring of potatoes late blight using multi-source time-series data and Google Earth Engine. Remote Sens. 2025, 17, 978. [Google Scholar] [CrossRef] [Scilit]
- Rehman, Z.; Khan, M.; Ahmed, F.; Damaševičius, R.; Naqvi, S.; Nisar, W.; Javed, K. Recognizing apple leaf diseases using a novel parallel real-time processing framework based on MASK RCNN and transfer learning: An application for smart agriculture. IET Image Process. 2021, 15, 2157–2168. [Google Scholar] [CrossRef] [Scilit]
- Hirigoyen, A.; Villacide, J. Assessing Sirex noctilio Fabricius (Hymenoptera: Siricidae) damage in pine plantations using remote sensing and predictive machine Learning models. Remote Sens. 2025, 17, 537. [Google Scholar] [CrossRef] [Scilit]
- Kior, A.; Yudina, L.; Zolin, Y.; Sukhov, V.; Sukhova, E. RGB imaging as a tool for remote sensing of characteristics of terrestrial plants: A review. Plants 2024, 13, 1262. [Google Scholar] [CrossRef] [Scilit] [PubMed]
- Cheshkova, A. A review of hyperspectral image analysis techniques for plant disease detection and identification. Vavilov J. Genet. Breed. 2022, 26, 202–213. [Google Scholar] [CrossRef] [Scilit] [PubMed]
- Bai, Y.; Jin, X. Hyperspectral approaches for rapid and spatial plant disease monitoring. Trends Plant Sci. 2024, 29, 711–712. [Google Scholar] [CrossRef] [Scilit] [PubMed]
- Morales, G.; Sheppard, J.; Logan, R.; Shaw, J. Hyperspectral dimensionality reduction based on inter-band redundancy analysis and greedy spectral selection. Remote Sens. 2021, 13, 3649. [Google Scholar] [CrossRef] [Scilit]
- Altamimi, A.; Ben Youssef, B. A Systematic review of hardware-accelerated compression of remotely sensed hyperspectral images. Sensors 2021, 22, 263. [Google Scholar] [CrossRef] [Scilit] [PubMed]
- Ferreira, L.; Carvalho, I.; Jorge, L.; Quezado-Duval, A.M.; Rossato, M. Hyperspectral imaging for the detection of plant pathogens in seeds: Recent developments and challenges. Front. Plant Sci. 2024, 15, 1387925. [Google Scholar] [CrossRef] [Scilit] [PubMed]
- Liu, H.; Pullanagari, R.; Campbell, D.; Denlay, M.; Hennekam, M.; Dadu, H.; Telfer, P.; Coventry, S.; Berger, B. Detection of net blotch disease of barley using UAV-based RGB and multispectral imagery at plot scale. Biol. Life Sci. Forum 2026, 57, 7. [Google Scholar] [CrossRef] [Scilit]
- Albetis, J.; Duthoit, S.; Guttler, F.; Jacquin, A.; Goulard, M.; Poilvé, H.; Féret, J.-B.; Dedieu, G. Detection of Flavescence dorée Grapevine Disease Using Unmanned Aerial Vehicle (UAV) Multispectral Imagery. Remote Sens. 2017, 9, 308. [Google Scholar] [CrossRef] [Scilit]
- Leinonen, I.; Jones, H. Combining thermal and visible imagery for estimating canopy temperature and identifying plant stress. J. Exp. Bot. 2004, 55, 1423–1431. [Google Scholar] [CrossRef] [Scilit] [PubMed]
- Deery, D.; Rebetzke, G.; Jimenez-Berni, J.; James, R.; Condon, A.; Bovill, W.; Hutchinson, P.; Scarrow, J.; Davy, R.; Furbank, R.T. Methodology for high-throughput field phenotyping of canopy temperature using airborne thermography. Front. Plant Sci. 2016, 7, 1808. [Google Scholar] [CrossRef] [Scilit] [PubMed]
- Pineda, M.; Barón, M.; Pérez-Bueno, M. Thermal imaging for plant stress detection and phenotyping. Remote Sens. 2021, 13, 68. [Google Scholar] [CrossRef] [Scilit]
- Gerchow, M.; Kühnhammer, K.; Iraheta, A.; Marshall, J.; Beyer, M. Enhanced flight planning and calibration for UAV based thermal imaging: Implications for canopy temperature and transpiration analysis. Front. For. Glob. Change 2025, 8, 1457762. [Google Scholar] [CrossRef] [Scilit]
- Mertens, S.; Verbraeken, L.; Sprenger, H.; De Meyer, S.; Demuynck, K.; Cannoot, B.; Merchie, J.; De Block, J.; Vogel, J.T.; Bruce, W.; et al. Monitoring of drought stress and transpiration rate using proximal thermal and hyperspectral imaging in an indoor automated plant phenotyping platform. Plant Methods 2023, 19, 132. [Google Scholar] [CrossRef] [Scilit] [PubMed]
- Mayanja, I.; Diepenbrock, C.; Vadez, V.; Lei, T.; Bailey, B. Practical considerations and limitations of using leaf and canopy temperature measurements as a stomatal conductance proxy: Sensitivity across environmental conditions, scale, and sample Size. Plant Phenomics 2024, 6, 169–432. [Google Scholar] [CrossRef] [Scilit] [PubMed]
- Yu, M.; Ding, G.; Gao, G.; Zhao, Y.; Yan, L.; Sai, K. Using plant temperature to evaluate the response of stomatal conductance to soil moisture deficit. Forests 2015, 6, 3748–3762. [Google Scholar] [CrossRef] [Scilit]
- Yadav, A.; Upreti, H.; Singhal, G. Crop water stress index and its sensitivity to meteorological parameters and canopy temperature. Theor. Appl. Climatol. 2024, 155, 2903–2915. [Google Scholar] [CrossRef] [Scilit]
- Psomiadis, E.; Philippopoulos, P.; Kakaletris, G. Non-Invasive estimation of crop water stress index and irrigation management with upscaling from field to egional level using remote sensing and agrometeorological data. Remote Sens. 2025, 17, 2522. [Google Scholar] [CrossRef] [Scilit]
- Mohammed, G.; Colombo, R.; Middleton, E.; Rascher, U.; van der Tol, C.; Nedbal, L.; Goulas, Y.; Pérez-Priego, O.; Damm, A.; Meroni, M.; et al. Remote sensing of solar-induced chlorophyll fluorescence (SIF) in vegetation: 50 years of progress. Remote Sens. Environ. 2019, 231, 111177. [Google Scholar] [CrossRef] [Scilit] [PubMed]
- Jiao, Q.; Hu, X. Recent advances and emerging trends in chlorophyll fluorescence parameter F. Phyton 2025, 94, 2615. [Google Scholar] [CrossRef] [Scilit]
- Belwalkar, A.; Poblete, T.; Zarco-Tejada, P. Airborne subnanometer hyperspectral imaging reveals early biotic-stress symptoms via Fraunhofer lines. IEEE Geosci. Remote Sens. Lett. 2026, 23, 1–5. [Google Scholar] [CrossRef] [Scilit]
- Xue, B.; Kong, Y.; Zarco-Tejada, P.; Tian, L.; Poblete, T.; Wang, X.; Zheng, H.; Jiang, C.; Yao, X.; Zhu, Y.; et al. Mitigating the phenological influence on spectroscopic quantification of rice blast disease severity with extended PROSAIL simulations. Remote Sens. Environ. 2026, 332, 115063. [Google Scholar] [CrossRef] [Scilit]
- Grishina, A.; Sherstneva, O.; Mysyagin, S.; Brilkina, A.; Vodeneev, V. Detecting plant Infections: Prospects for Chlorophyll fluorescence imaging. Agronomy 2024, 14, 2600. [Google Scholar] [CrossRef] [Scilit]
- Senesi, G.; De Pascale, O.; Marangoni, B.; Caires, A.R.; Nicolodelli, G.; Pantaleo, V.; Leonetti, P. Chlorophyll Fluorescence Imaging (CFI) and laser-Induced breakdown spectroscopy (LIBS) applied to investigate tomato plants infected by the root knot nematode (RKN), Meloidogyne incognita and tobacco plants infected by Cymbidium ringspot virus. Photonics 2022, 9, 627. [Google Scholar] [CrossRef] [Scilit]
- De Cannière, S.; Vereecken, H.; Defourny, P.; Jonard, F. Remote sensing of instantaneous drought stress at canopy level using sun-induced chlorophyll fluorescence and canopy reflectance. Remote Sens. 2022, 14, 2642. [Google Scholar] [CrossRef] [Scilit]
- Zarco-Tejada, P.J.; Camino, C.; Beck, P.S.A.; Calderon, R.; Hornero, A.; Hernández-Clemente, R.; Kattenborn, T.; Montes-Borrego, M.; Susca, L.; Morelli, M.; et al. Previsual symptoms of Xylella fastidiosa infection revealed in spectral plant-trait alterations. Nat. Plants 2018, 4, 432–439. [Google Scholar] [CrossRef] [Scilit] [PubMed]
- Zhang, C.; Pfündel, E.; Atherton, J.; Aalto, J.; Bai, J.; Pohja, T.; Rajewicz, P.A.; Porcar-Castell, A. A practical guide to long-term field PAM chlorophyll fluorescence measurements: Setup, installation, data processing with R package ‘LongTermPAM’ and interpretation. Photosynth. Res. 2025, 163, 45. [Google Scholar] [CrossRef] [Scilit] [PubMed]
- Pullanagari, R.; Dehghan-Shoar, M.; Zhu, J.; Orsi, A.; Yule, I. Mapping of sun-induced fluorescence (SIF) in kiwifruit canopy using a 3D radiative transfer modeling and airborne hyperspectral imaging. Remote Sens. Appl. 2026, 41, 101840. [Google Scholar] [CrossRef] [Scilit]
- Du, S.; Liu, X.; Chen, J.; Liu, L. Prospects for solar-induced Chlorophyll fluorescence remote sensing from the SIFIS payload onboard the TECIS-1 satellite. J. Remote Sens. 2022, 2022, 9845432. [Google Scholar] [CrossRef] [Scilit]
- Belwalkar, A.; Poblete, T.; Hornero, A.; Hernández-Clemente, R.; Zarco, P.J. Improving the accuracy of SIF quantified from moderate spectral resolution airborne hyperspectral imager using SCOPE: Assessment with sub-nanometer imagery. Int. J. Appl. Earth Obs. Geoinf. 2024, 134, 104198. [Google Scholar] [CrossRef] [Scilit]
- Sun, Y.; Gu, L.; Wen, J.; Tol, C.; Porcar-Castell, A.; Joiner, J.; Chang, C.Y.; Magney, T.; Wang, L.; Hu, L.; et al. From remotely sensed solar-induced chlorophyll fluorescence to ecosystem structure, function, and service: Part I—Harnessing theory. Glob. Change Biol. 2023, 29, 2926–2952. [Google Scholar] [CrossRef] [Scilit] [PubMed]
- Sun, Y.; Wen, J.; Gu, L.; Joiner, J.; Chang, C.; Tol, C.; Porcar-Castell, A.; Magney, T.; Wang, L.; Hu, L.; et al. From remotely-sensed solar-induced chlorophyll fluorescence to ecosystem structure, function, and service: Part II—Harnessing data. Glob. Change Biol. 2023, 29, 2893–2925. [Google Scholar] [CrossRef] [Scilit] [PubMed]
- Bouchat, J.; Tronquo, E.; Orban, A.; de Macedo, K.; Davidson, M.; Verhoest, N.; Defourny, P. The BELSAR dataset: Mono- and bistatic full-pol L-band SAR for agriculture and hydrology. Sci. Data 2024, 11, 513. [Google Scholar] [CrossRef] [Scilit] [PubMed]
- Marselis, S.; Tang, H.; Armston, J.; Calders, K.; Labrière, N.; Dubayah, R. Distinguishing vegetation types with airborne waveform lidar data in a tropical forest-savanna mosaic: A case study in Lopé National Park, Gabon. Remote Sens. Environ. 2018, 216, 626–634. [Google Scholar] [CrossRef] [Scilit]
- Farhan, S.M.; Yin, J.; Chen, Z.; Memon, M. A comprehensive review of LiDAR applications in crop management for precision agriculture. Sensors 2024, 24, 5409. [Google Scholar] [CrossRef] [Scilit] [PubMed]
- Young, T.; Chiranjeevi, S.; Elango, D.; Sarkar, S.; Singh, A.; Singh, A.; Ganapathysubramanian, B.; Jubery, T.Z. Soybean canopy stress classification using 3D point cloud data. Agronomy 2024, 14, 1181. [Google Scholar] [CrossRef] [Scilit]
- Pickering, B.; Hillman, S.; Medlin, C.; Wallace, L.; Bennett, L.; Cawson, J. Testing the utility of terrestrial laser scanning for fuel hazard assessments in temperate forests and woodlands of south-eastern Australia. Fire Ecol. 2026, 22, 62. [Google Scholar] [CrossRef] [Scilit]
- Liu, C.; Chen, Z.; Shao, Y.; Chen, J.; Hasi, T.; Pan, H. Research advances of SAR remote sensing for agriculture applications: A review. J. Integr. Agric. 2019, 18, 506–525. [Google Scholar] [CrossRef] [Scilit]
- Sumith, N.; Rashmi, M. A systematic review of deep learning and super resolution techniques for leaf level and canopy level plant disease detection. Discov. Artif. Intell. 2026, 6, 316. [Google Scholar] [CrossRef] [Scilit]
- Caldwell, D.; Iyer-Pascuzzi, A. A Scanning electron microscopy technique for viewing plant−microbe interactions at tissue and cell-type resolution. Phytopathology 2019, 109, 1302–1311. [Google Scholar] [CrossRef] [Scilit] [PubMed]
- Watts, S.; Kaur, I.; Singh, S.; Jimenez, B.; Chavana, J.; Kariyat, R. Desktop scanning electron microscopy in plant–insect interactions research: A fast and effective way to capture electron micrographs with minimal sample preparation. Biol. Methods Protoc. 2022, 7, bpab020. [Google Scholar] [CrossRef] [Scilit] [PubMed]
- Colin, L.; Martin-Arevalillo, R.; Bovio, S.; Bauer, A.; Vernoux, T.; Caillaud, M.; Landrein, B.; Jaillais, Y. Imaging the living plant cell: From probes to quantification. Plant Cell 2022, 34, 247–272. [Google Scholar] [CrossRef] [Scilit] [PubMed]
- Kuska, M.; Wahabzada, M.; Leucker, M.; Dehne, H.; Kersting, K.; Oerke, E.; Steiner, U.; Mahlein, A.-K. Hyperspectral phenotyping on the microscopic scale: Towards automated characterization of plant-pathogen interactions. Plant Methods 2015, 11, 28–73. [Google Scholar] [CrossRef] [Scilit] [PubMed]
- Omia, E.; Park, E.; Semyalo, D.; Joshi, R.; Cho, B. Advancements in 3D field-crop phenotyping using point clouds: A comparative review of sensor technology, target traits, and challenges under controlled and field conditions. Front. Plant Sci. 2026, 17, 1731852. [Google Scholar] [CrossRef] [Scilit] [PubMed]
- Liu, H.; Bruning, B.; Garnett, T.; Berger, B. The performances of hyperspectral sensors for proximal sensing of nitrogen levels in wheat. Sensors 2020, 20, 4550. [Google Scholar] [CrossRef] [Scilit] [PubMed]
- Yu, F.; Xu, C.; Xiang, S.; Bai, J.; Jin, Z.; Zhang, H.; Zhu, S. Hyperspectral leaf reflectance simulation considering internal structure. Sci. Rep. 2025, 15, 13639. [Google Scholar] [CrossRef] [Scilit] [PubMed]
- Martínez-Martínez, V.; Pinto, F.; Machado, M.; Gomez-Gil, J. Leaf and canopy reflectance spectrometry applied to the estimation of angular leaf spot disease severity of common bean crops. PLoS ONE 2018, 13, e0196072. [Google Scholar] [CrossRef] [Scilit] [PubMed]
- Moncholi-Estornell, A.; Van Wittenberghe, S.; Cendrero-Mateo, M.; Alonso, L.; Malenovský, Z.; Moreno, J. Impact of structural, photochemical and instrumental effects on leaf and canopy reflectance variability in the 500–600 nm range. Remote Sens. 2022, 14, 56. [Google Scholar] [CrossRef] [Scilit]
- Liu, W.; Mõttus, M.; Gastellu-Etchegorry, J.; Fang, H.; Atherton, J. Seasonal and vertical variation in canopy structure and leaf spectral properties determine the canopy reflectance of a rice field. Agric. For. Meteorol. 2024, 355, 110132. [Google Scholar] [CrossRef] [Scilit]
- Miraglio, T.; Coops, N.; Wallis, C.; Crofts, A.; Kalacska, M.; Vellend, M.; Serbin, S.P.; Arroyo-Mora, J.P.; Laliberté, E. Mapping canopy traits over Québec using airborne and spaceborne imaging spectroscopy. Sci. Rep. 2023, 13, 17179. [Google Scholar] [CrossRef] [Scilit] [PubMed]
- Hamidon, M.; Ahamed, T.; Ahamed, T. High-Throughput Plant Phenotyping Techniques in Controlled Environments; Springer Nature: Singapore, 2024; pp. 159–181. [Google Scholar] [CrossRef] [Scilit] [PubMed]
- Pérez-Valencia, D.; Rodríguez-Álvarez, M.; Boer, M.; Kronenberg, L.; Hund, A.; Cabrera-Bosquet, L.; Millet, E.J.; van Eeuwijk, F.A. A two-stage approach for the spatio-temporal analysis of high-throughput phenotyping data. Sci. Rep. 2022, 12, 3177. [Google Scholar] [CrossRef] [Scilit] [PubMed]
- Langstroff, A.; Heuermann, M.; Stahl, A.; Junker, A. Opportunities and limits of controlled-environment plant phenotyping for climate response traits. Theor. Appl. Genet. 2022, 135, 1–16. [Google Scholar] [CrossRef] [Scilit] [PubMed]
- Xu, R.; Ferguson, J.; Breil-Aubert, M.; Kromdijk, J.; Nikoloski, Z. Generalizability and transferability of machine learning models using hyperspectral reflectance data for maize traits. Sci. Rep. 2026, 16, 5865. [Google Scholar] [CrossRef] [Scilit] [PubMed]
- Wu, J.; Rogers, A.; Albert, L.; Ely, K.; Prohaska, N.; Wolfe, B.; Oliveira, R.C.; Saleska, S.R.; Serbin, S.P. Leaf reflectance spectroscopy captures variation in carboxylation capacity across species, canopy environment and leaf age in lowland moist tropical forests. New Phytol. 2019, 224, 663–674. [Google Scholar] [CrossRef] [Scilit] [PubMed]
- Xu, R.; Li, C. A review of high-throughput field phenotyping systems: Focusing on ground robots. Plant Phenomics 2022, 2022, 9760269. [Google Scholar] [CrossRef] [Scilit] [PubMed]
- Wang, Y.; An, J.; Shao, M.; Wu, J.; Zhou, D.; Yao, X.; Zhang, X.; Cao, W.; Jiang, C.; Zhu, Y. A comprehensive review of proximal spectral sensing devices and diagnostic equipment for field crop growth monitoring. Precis. Agric. 2025, 26, 54. [Google Scholar] [CrossRef] [Scilit]
- Gold, K. Plant disease sensing: Studying plant-pathogen interactions at scale. mSystems 2021, 6, e0122821. [Google Scholar] [CrossRef] [Scilit] [PubMed]
- Jiang, Y.; Li, C.; Robertson, J.; Sun, S.; Xu, R.; Paterson, A. GPhenoVision: A ground mobile system with multi-modal Imaging for field-based high throughput phenotyping of cotton. Sci. Rep. 2018, 8, 1213. [Google Scholar] [CrossRef] [Scilit] [PubMed]
- Zhu, H.; Lin, C.; Liu, G.; Wang, D.; Qin, S.; Li, A.; Xu, J.-L.; He, Y. Intelligent agriculture: Deep learning in UAV-based remote sensing imagery for crop diseases and pests detection. Front. Plant Sci. 2024, 15, 1435016. [Google Scholar] [CrossRef] [Scilit] [PubMed]
- Li, L.; Zheng, X.; Zhao, K.; Li, X.; Meng, Z.; Su, C. Potential evaluation of high spatial resolution multi-spectral images based on unmanned aerial vehicle in accurate recognition of crop types. J. Indian Soc. Remote Sens. 2020, 48, 1471–1478. [Google Scholar] [CrossRef] [Scilit]
- Bazrafkan, A.; Igathinathane, C.; Bandillo, N.; Flores, P. Optimizing integration techniques for UAS and satellite image data in precision agriculture-a review. Front. Remote Sens. 2025, 6, 1622884. [Google Scholar] [CrossRef] [Scilit]
- Caroppo, A.; Diraco, G.; Leone, A. A systematic eeview of available multispectral UAV image datasets for precision agriculture applications. Remote Sens. 2026, 18, 659. [Google Scholar] [CrossRef] [Scilit]
- Imran; Li, J. Technological Advances in UAV-Assisted Crop Monitoring; Springer: Singapore, 2025; Volume 13, pp. 237–275. [Google Scholar] [CrossRef] [Scilit]
- Poblete, T.; Camino, C.; Beck, P.S.A.; Hornero, A.; Kattenborn, T.; Saponari, M.; Boscia, D.; Navas-Cortes, J.; Zarco-Tejada, P. Detection of Xylella fastidiosa infection symptoms with airborne multispectral and thermal imagery: Assessing bandset reduction performance from hyperspectral analysis. ISPRS J. Photogramm. Remote Sens. 2020, 162, 27–40. [Google Scholar] [CrossRef] [Scilit]
- Adão, T.; Hruška, J.; Pádua, L.; Bessa, J.; Peres, E.; Morais, R.; Sousa, J. Hyperspectral Imaging: A Review on UAV-Based Sensors, Data Processing and Applications for Agriculture and Forestry. Remote Sens. 2017, 9, 1110. [Google Scholar] [CrossRef] [Scilit]
- Agrawal, J.; Arafat, M. Transforming farming: A review of AI-Powered UAV technologies in precision agriculture. Drones 2024, 8, 664. [Google Scholar] [CrossRef] [Scilit]
- Yao, W.; Liu, C.; Liu, Y.; Zheng, Q.; Wang, J.; Yu, H.; Chen, C.; Guo, S. Unmanned aerial vehicle payload technology applications in agriculture and other low-altitude scenarios: A review. Front. Plant Sci. 2025, 16, 1721484. [Google Scholar] [CrossRef] [Scilit] [PubMed]
- Zhang, H.; Zhang, B.; Wei, Z.; Wang, C.; Huang, Q. Lightweight integrated solution for a UAV-borne hyperspectral imaging system. Remote Sens. 2020, 12, 657. [Google Scholar] [CrossRef] [Scilit]
- Teitelbaum, C.; Ferraz, A.; De La Cruz, S.; Gilmour, M.; Brosnan, I. The potential of remote sensing for improved infectious disease ecology research and practice. Proc. R. Soc. B Biol. Sci. 2024, 291, 20241712. [Google Scholar] [CrossRef] [Scilit] [PubMed]
- Abbasi, E. Application of remote sensing and geospatial technologies in predicting vector-borne disease outbreaks. R. Soc. Open Sci. 2025, 12, 250536. [Google Scholar] [CrossRef] [Scilit] [PubMed]
- Nalepa, J. Recent advances in multi- and hyperspectral image analysis. Sensors 2021, 21, 6002. [Google Scholar] [CrossRef] [Scilit] [PubMed]
- Chen, X.; Miao, Y.; Kusnierek, K.; Li, F.; Wang, C.; Shi, B.; Wu, F.; Chang, Q.; Yu, K. Potential of multi-source multispectral vs. hyperspectral remote sensing for winter wheat nitrogen monitoring. Remote Sens. 2025, 17, 2666. [Google Scholar] [CrossRef] [Scilit]
- Sishodia, R.; Ray, R.; Singh, S. Applications of remote sensing in precision agriculture: A review. Remote Sens. 2020, 12, 3136. [Google Scholar] [CrossRef] [Scilit]
- Poblete, T.; Navas-Cortes, J.A.; Hornero, A.; Camino, C.; Calderon, R.; Hernandez-Clemente, R.; Landa, B.; Zarco-Tejada, P. Detection of symptoms induced by vascular plant pathogens in tree crops using high-resolution satellite data: Modelling and assessment with airborne hyperspectral imagery. Remote Sens. Environ. 2023, 295, 113698. [Google Scholar] [CrossRef] [Scilit]
- Kamilaris, A.; Prenafeta-Boldú, F. Deep learning in agriculture: A survey. Comput. Electron. Agric. 2018, 147, 70–90. [Google Scholar] [CrossRef] [Scilit]
- García-Vera, Y.; Polochè-Arango, A.; Mendivelso-Fajardo, C.; Gutiérrez-Bernal, F. Hyperspectral image analysis and machine learning techniques for crop disease detection and identification: A review. Sustainability 2024, 16, 6064. [Google Scholar] [CrossRef] [Scilit]
- Römer, C.; Bürling, K.; Hunsche, M.; Rumpf, T.; Noga, G.; Plümer, L. Robust fitting of fluorescence spectra for pre-symptomatic wheat leaf rust detection with Support Vector Machines. Comput. Electron. Agric. 2011, 79, 180–188. [Google Scholar] [CrossRef] [Scilit]
- Mishra, A.; Karimi, D.; Ehsani, R.; Lee, W. Identification of citrus greening (HLB) using a VIS-NIR spectroscopy technique. Trans. ASABE 2012, 55, 711–720. [Google Scholar] [CrossRef] [Scilit]
- Garcia-Ruiz, F.; Sankaran, S.; Maja, J.M.; Lee, W.S.; Rasmussen, J.; Ehsani, R. Comparison of two aerial imaging platforms for identification of Huanglongbing-infected citrus trees. Comput. Electron. Agric. 2013, 91, 106–115. [Google Scholar] [CrossRef] [Scilit]
- Cao, X.; Luo, Y.; Zhou, Y.; Duan, X.; Cheng, D. Detection of powdery mildew in two winter wheat cultivars using canopy hyperspectral reflectance. Crop Prot. 2013, 45, 124–131. [Google Scholar] [CrossRef] [Scilit]
- Zhang, S.; Huang, J.; Hanan, J.; Qin, L. A hyperspectral GA-PLSR model for prediction of pine wilt disease. Multimed. Tools Appl. 2020, 79, 16645–16661. [Google Scholar] [CrossRef] [Scilit]
- Burnett, A.; Anderson, J.; Davidson, K.; Ely, K.; Lamour, J.; Li, Q.; Morrison, B.D.; Yang, D.; Rogers, A.; Serbin, S.P. A best-practice guide to predicting plant traits from leaf-level hyperspectral data using partial least squares regression. J. Exp. Bot. 2021, 72, 6175–6189. [Google Scholar] [CrossRef] [Scilit] [PubMed]
- Pydipati, R.; Burks, T.F.; Lee, W.S. Identification of citrus disease using color texture features and discriminant analysis. Comput. Electron. Agric. 2006, 52, 49–59. [Google Scholar] [CrossRef] [Scilit]
- Winfield, M.; Wing, M.; Wood, J.; Graham, S.; Anderson, A.; Hawks, D.; Miller, A. Assessing pacific madrone blight with UAS remote sensing under different Skylight conditions. Remote Sens. 2025, 17, 3141. [Google Scholar] [CrossRef] [Scilit]
- Rogers, M.; Blanc-Talon, J.; Urschler, M.; Delmas, P. Wavelength and texture feature selection for hyperspectral imaging: A systematic literature review. J. Food Meas. Charact. 2023, 17, 6039–6064. [Google Scholar] [CrossRef] [Scilit]
- Jarocińska, A.; Kopeć, D.; Kycko, M. Comparison of dimensionality reduction methods on hyperspectral images for the identification of heathlands and mires. Sci. Rep. 2024, 14, 27662. [Google Scholar] [CrossRef] [Scilit] [PubMed]
- Pan, S.; Tsang, I.; Kwok, J.; Qiang, Y. Domain adaptation via transfer component analysis. IEEE Trans. Neural Netw. 2011, 22, 199–210. [Google Scholar] [CrossRef] [Scilit] [PubMed]
- Zhong, X.; Guo, S.; Shan, H.; Gao, L.; Xue, D.; Zhao, N. Feature-based transfer learning based on dstribution similarity. IEEE Access 2018, 6, 35551–35557. [Google Scholar] [CrossRef] [Scilit]
- Shafik, W.; Tufail, A.; De Silva Liyanage, C.; Apong, R. Using transfer learning-based plant disease classification and detection for sustainable agriculture. BMC Plant Biol. 2024, 24, 136. [Google Scholar] [CrossRef] [Scilit] [PubMed]
- Huang, Z.; Bai, X.; Gouda, M.; Hu, H.; Yang, N.; He, Y.; Feng, X. Transfer learning for plant disease detection model based on low-altitude UAV remote sensing. Precis. Agric. 2025, 26, 15. [Google Scholar] [CrossRef] [Scilit]
- Moupojou, E.; Tagne, A.; Retraint, F.; Tadonkemwa, A.; Wilfried, D.; Tapamo, H.; Nkenlifack, M. FieldPlant: A dataset of field plant images for plant disease detection and classification with deep learning. IEEE Access 2023, 11, 35398–35410. [Google Scholar] [CrossRef] [Scilit]
- Ćwiek-Kupczyńska, H.; Altmann, T.; Arend, D.; Arnaud, E.; Chen, D.; Cornut, G.; Fiorani, F.; Frohmberg, W.; Junker, A.; Klukas, C.; et al. Measures for interoperability of phenotypic data: Minimum information requirements and formatting. Plant Methods 2016, 12, 44. [Google Scholar] [CrossRef] [Scilit] [PubMed]
- Papoutsoglou, E.; Faria, D.; Arend, D.; Arnaud, E.; Athanasiadis, I.; Chaves, I. Enabling reusability of plant phenomic datasets with MIAPPE 1.1. New Phytol. 2020, 227, 260–273. [Google Scholar] [CrossRef] [Scilit] [PubMed]
- Li, Y.; Guo, J.; Qiu, H.; Chen, F.; Zhang, J. Denoising diffusion probabilistic models and transfer learning for citrus disease diagnosis. Front. Plant Sci. 2023, 14, 1267810. [Google Scholar] [CrossRef] [Scilit] [PubMed]
- Ghosal, S.; Blystone, D.; Singh, A.; Ganapathysubramanian, B.; Singh, A.; Sarkar, S. An explainable deep machine vision framework for plant stress phenotyping. Proc. Natl. Acad. Sci. USA 2018, 115, 4613–4618. [Google Scholar] [CrossRef] [Scilit] [PubMed]
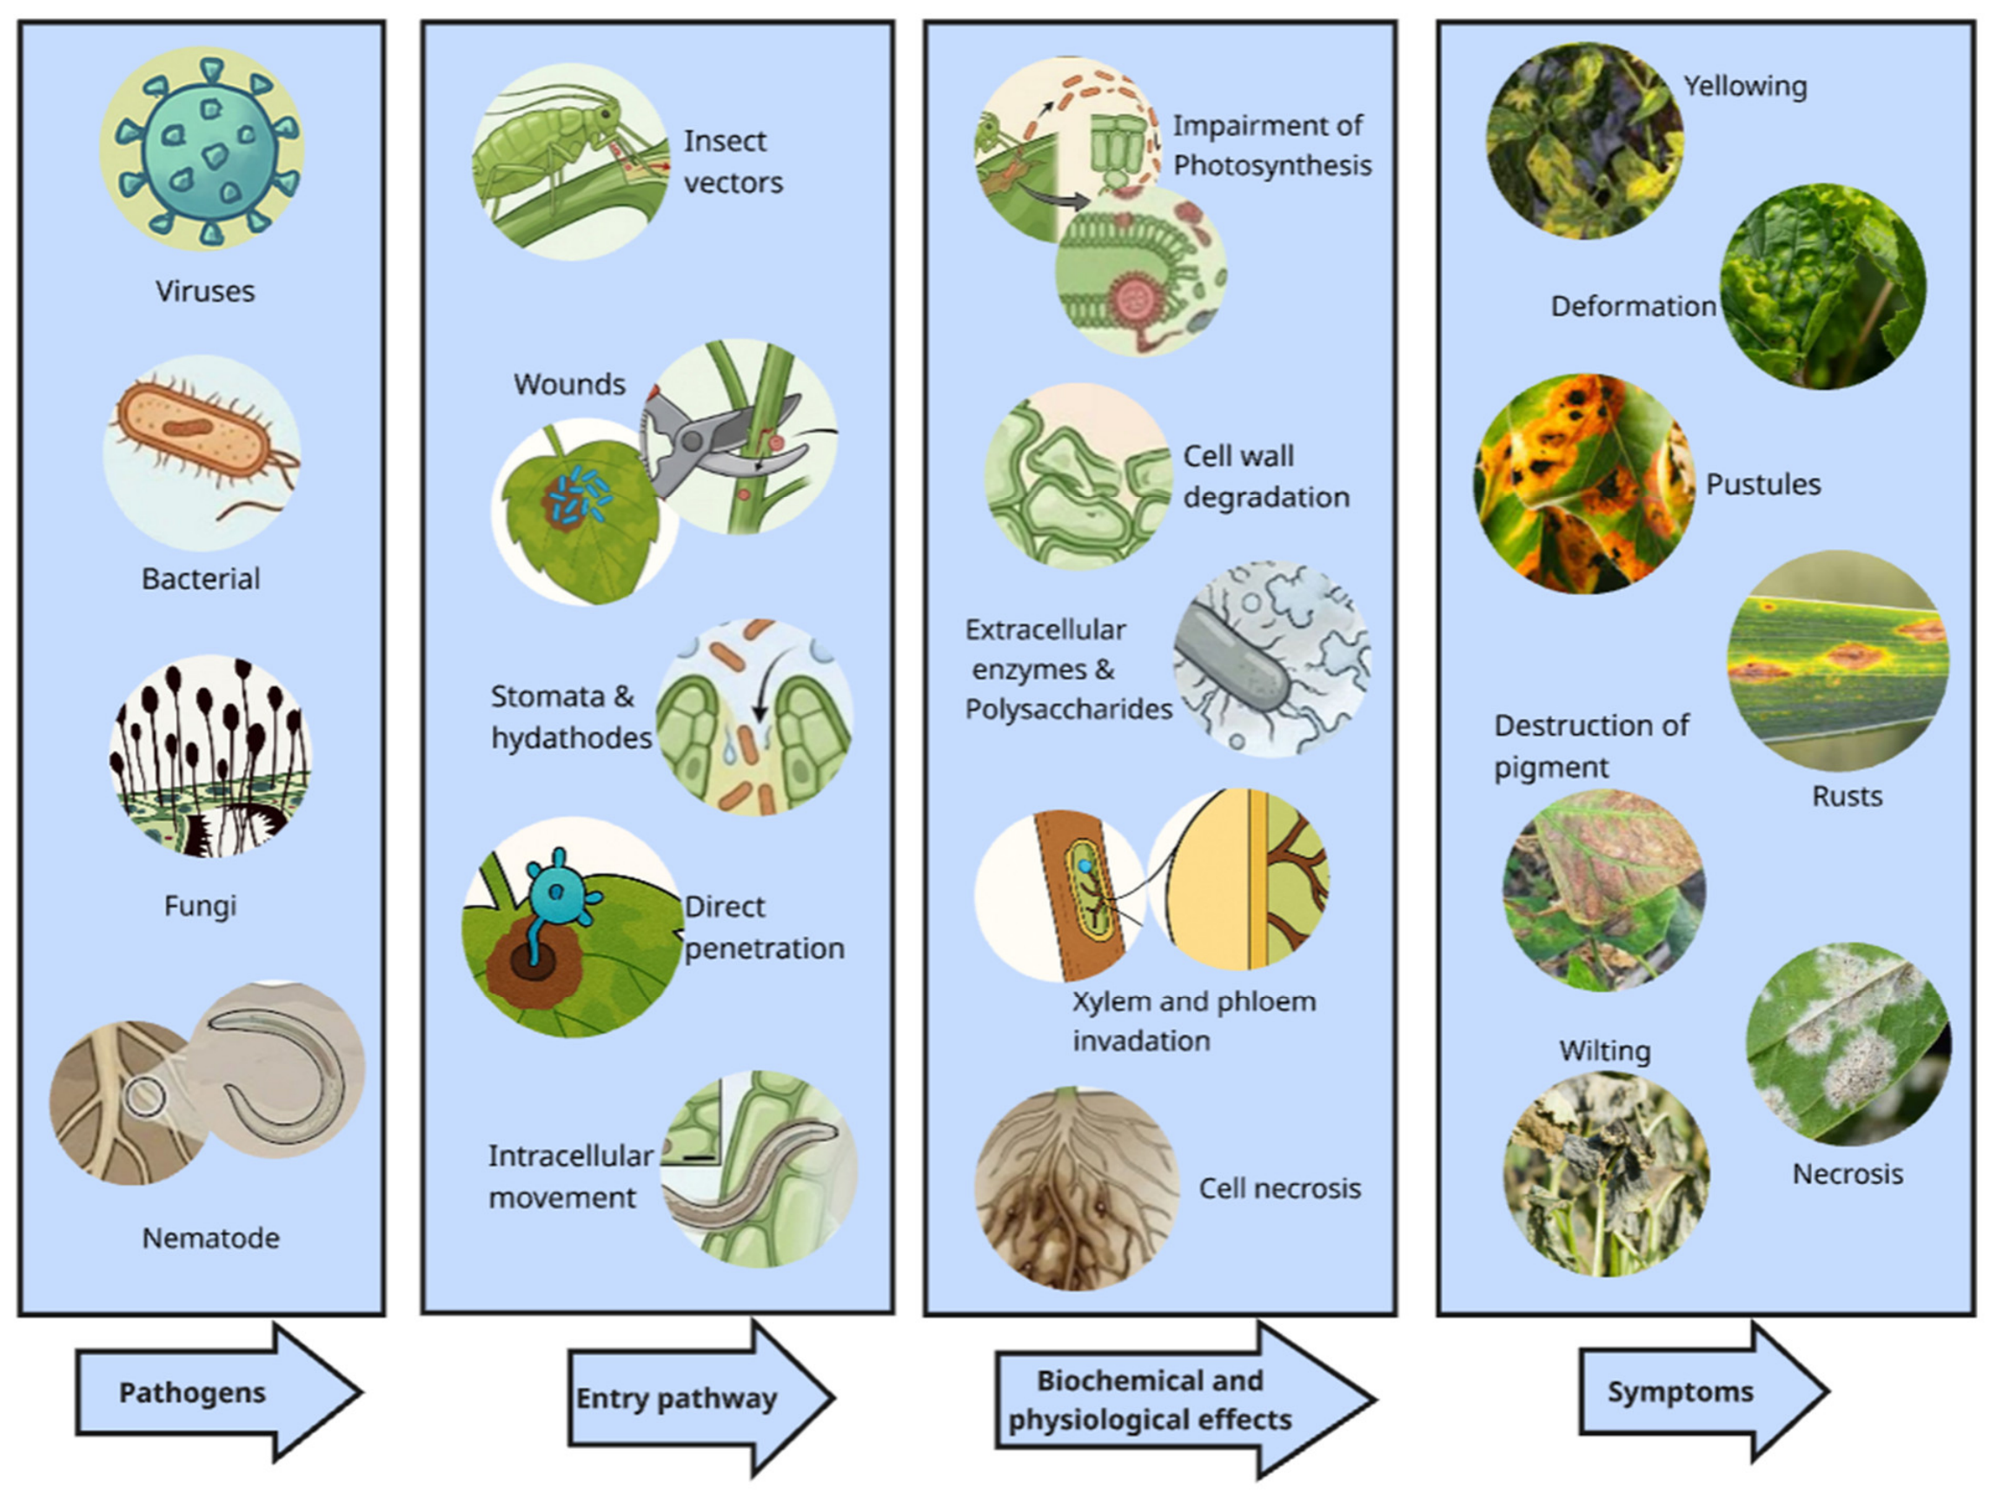
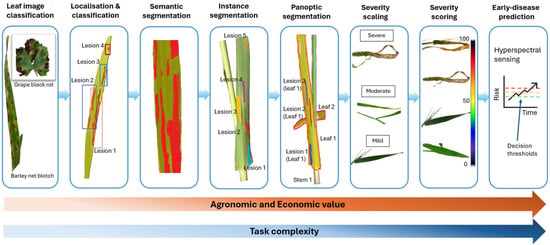
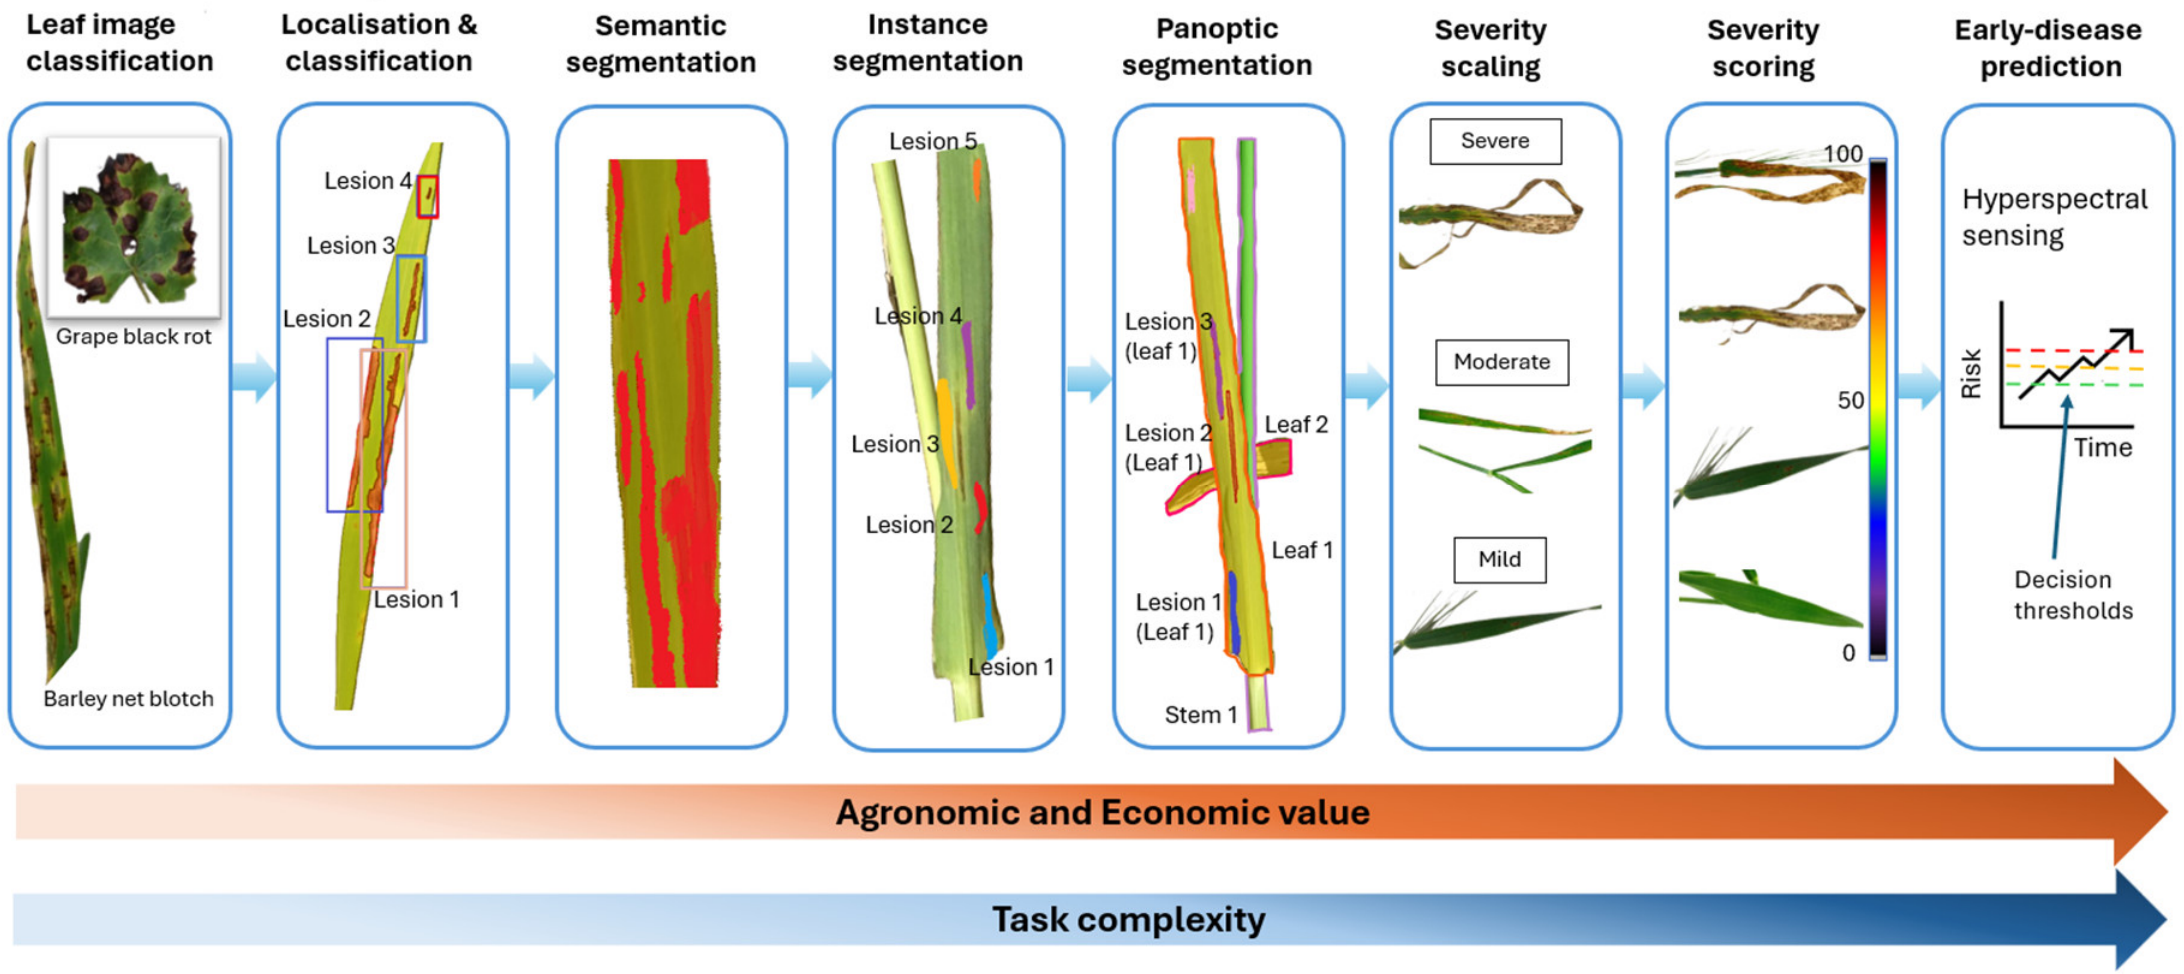
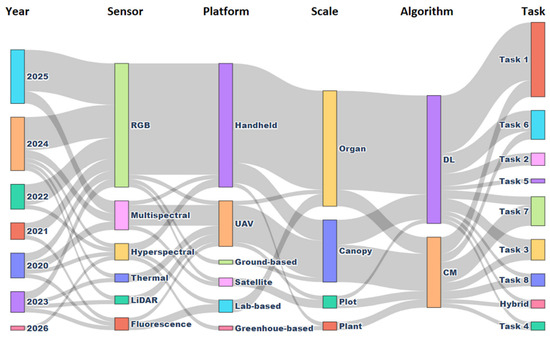
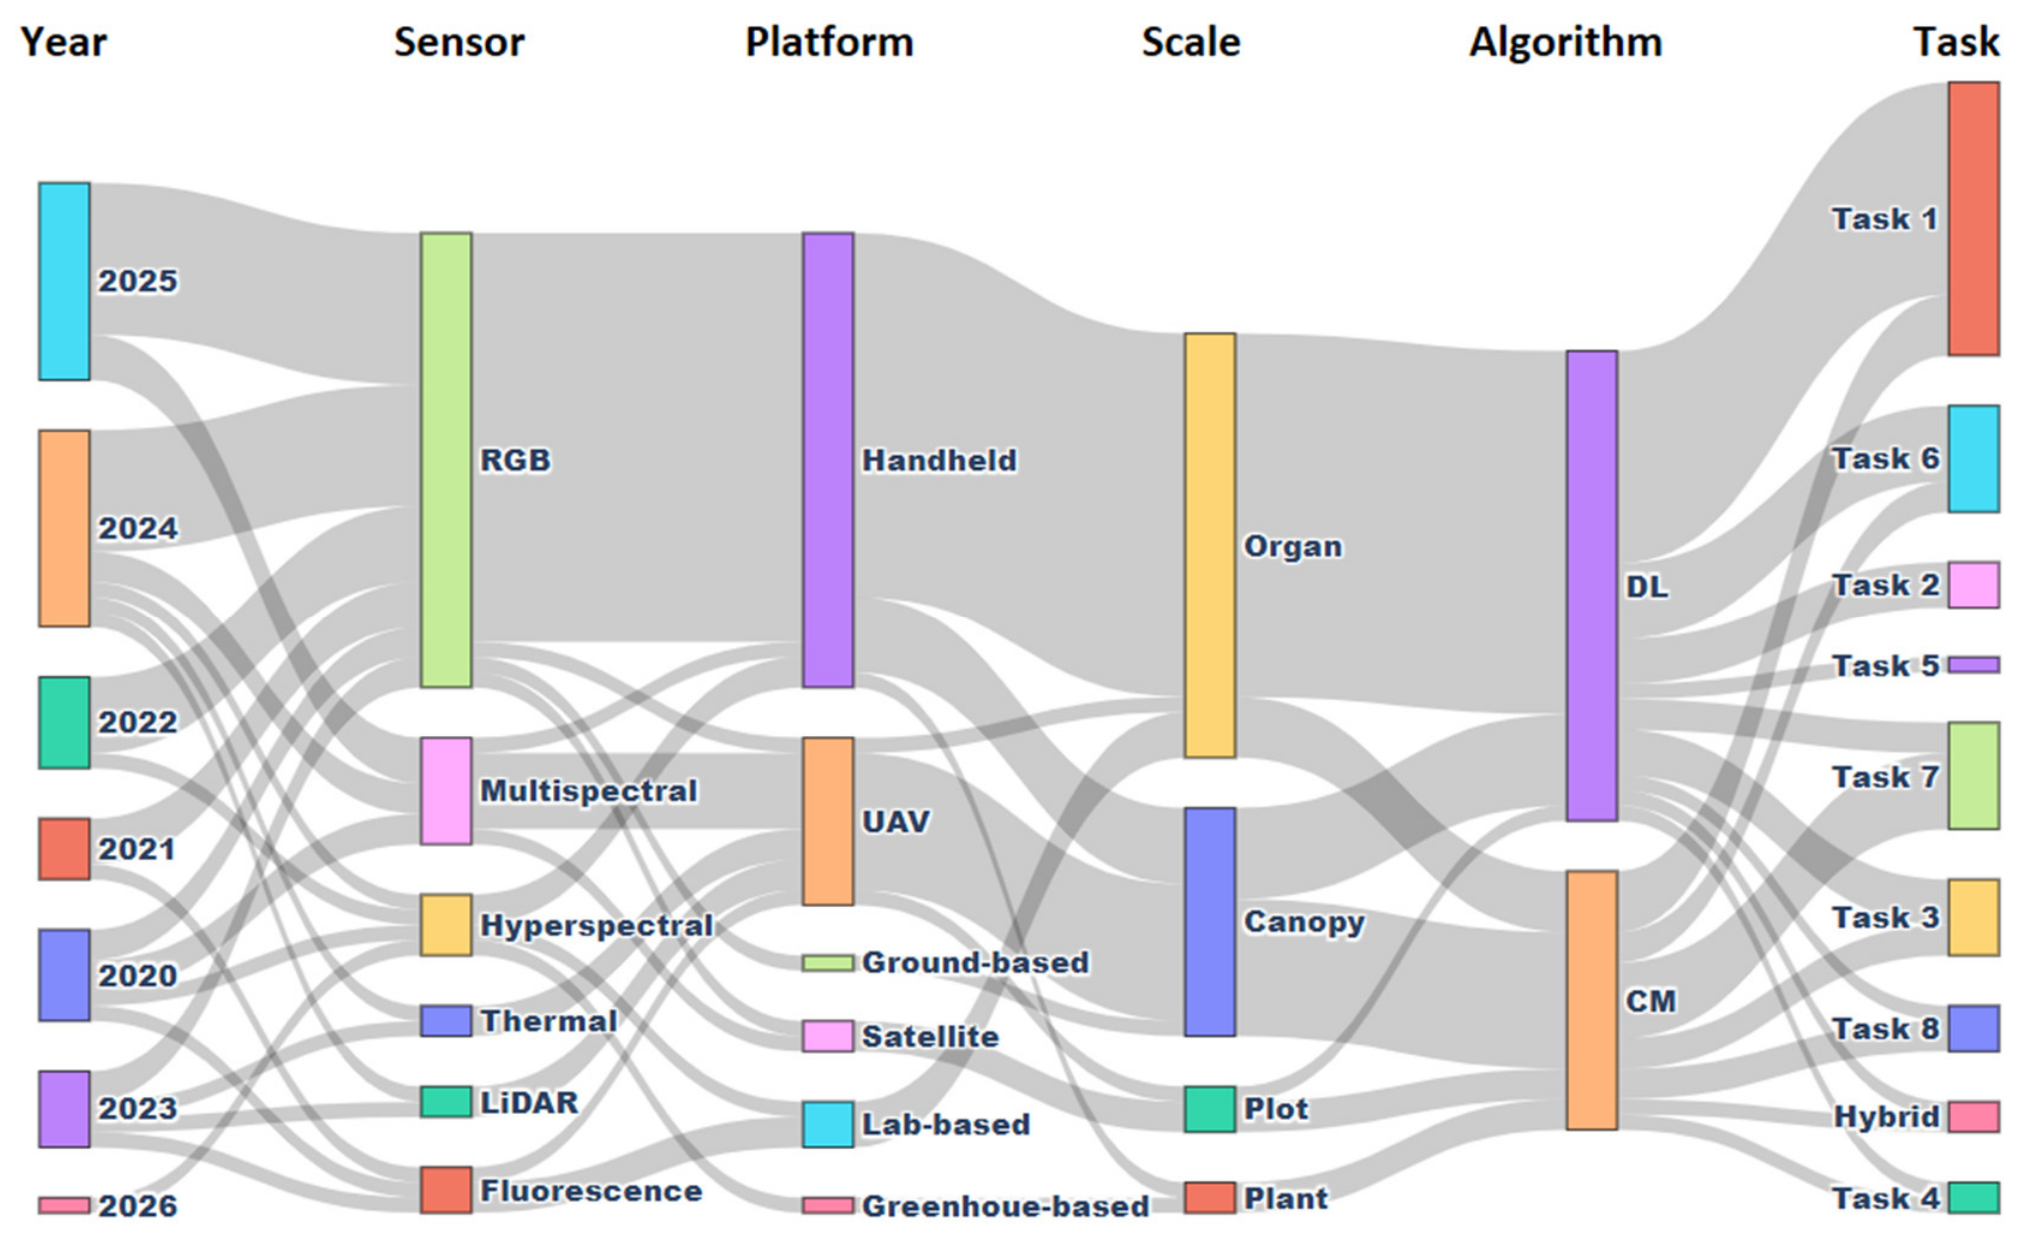
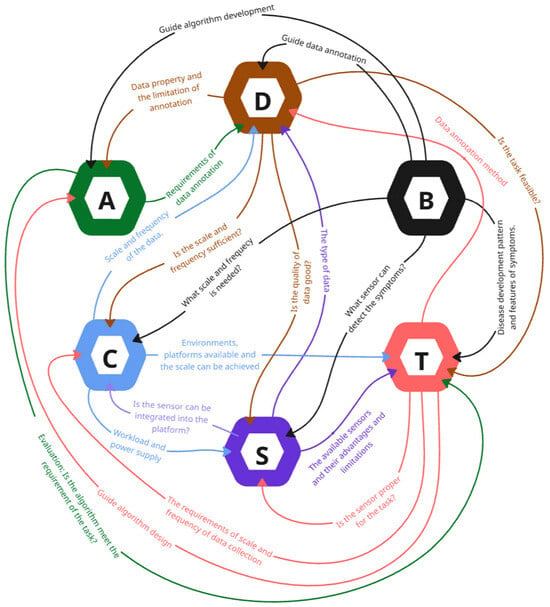
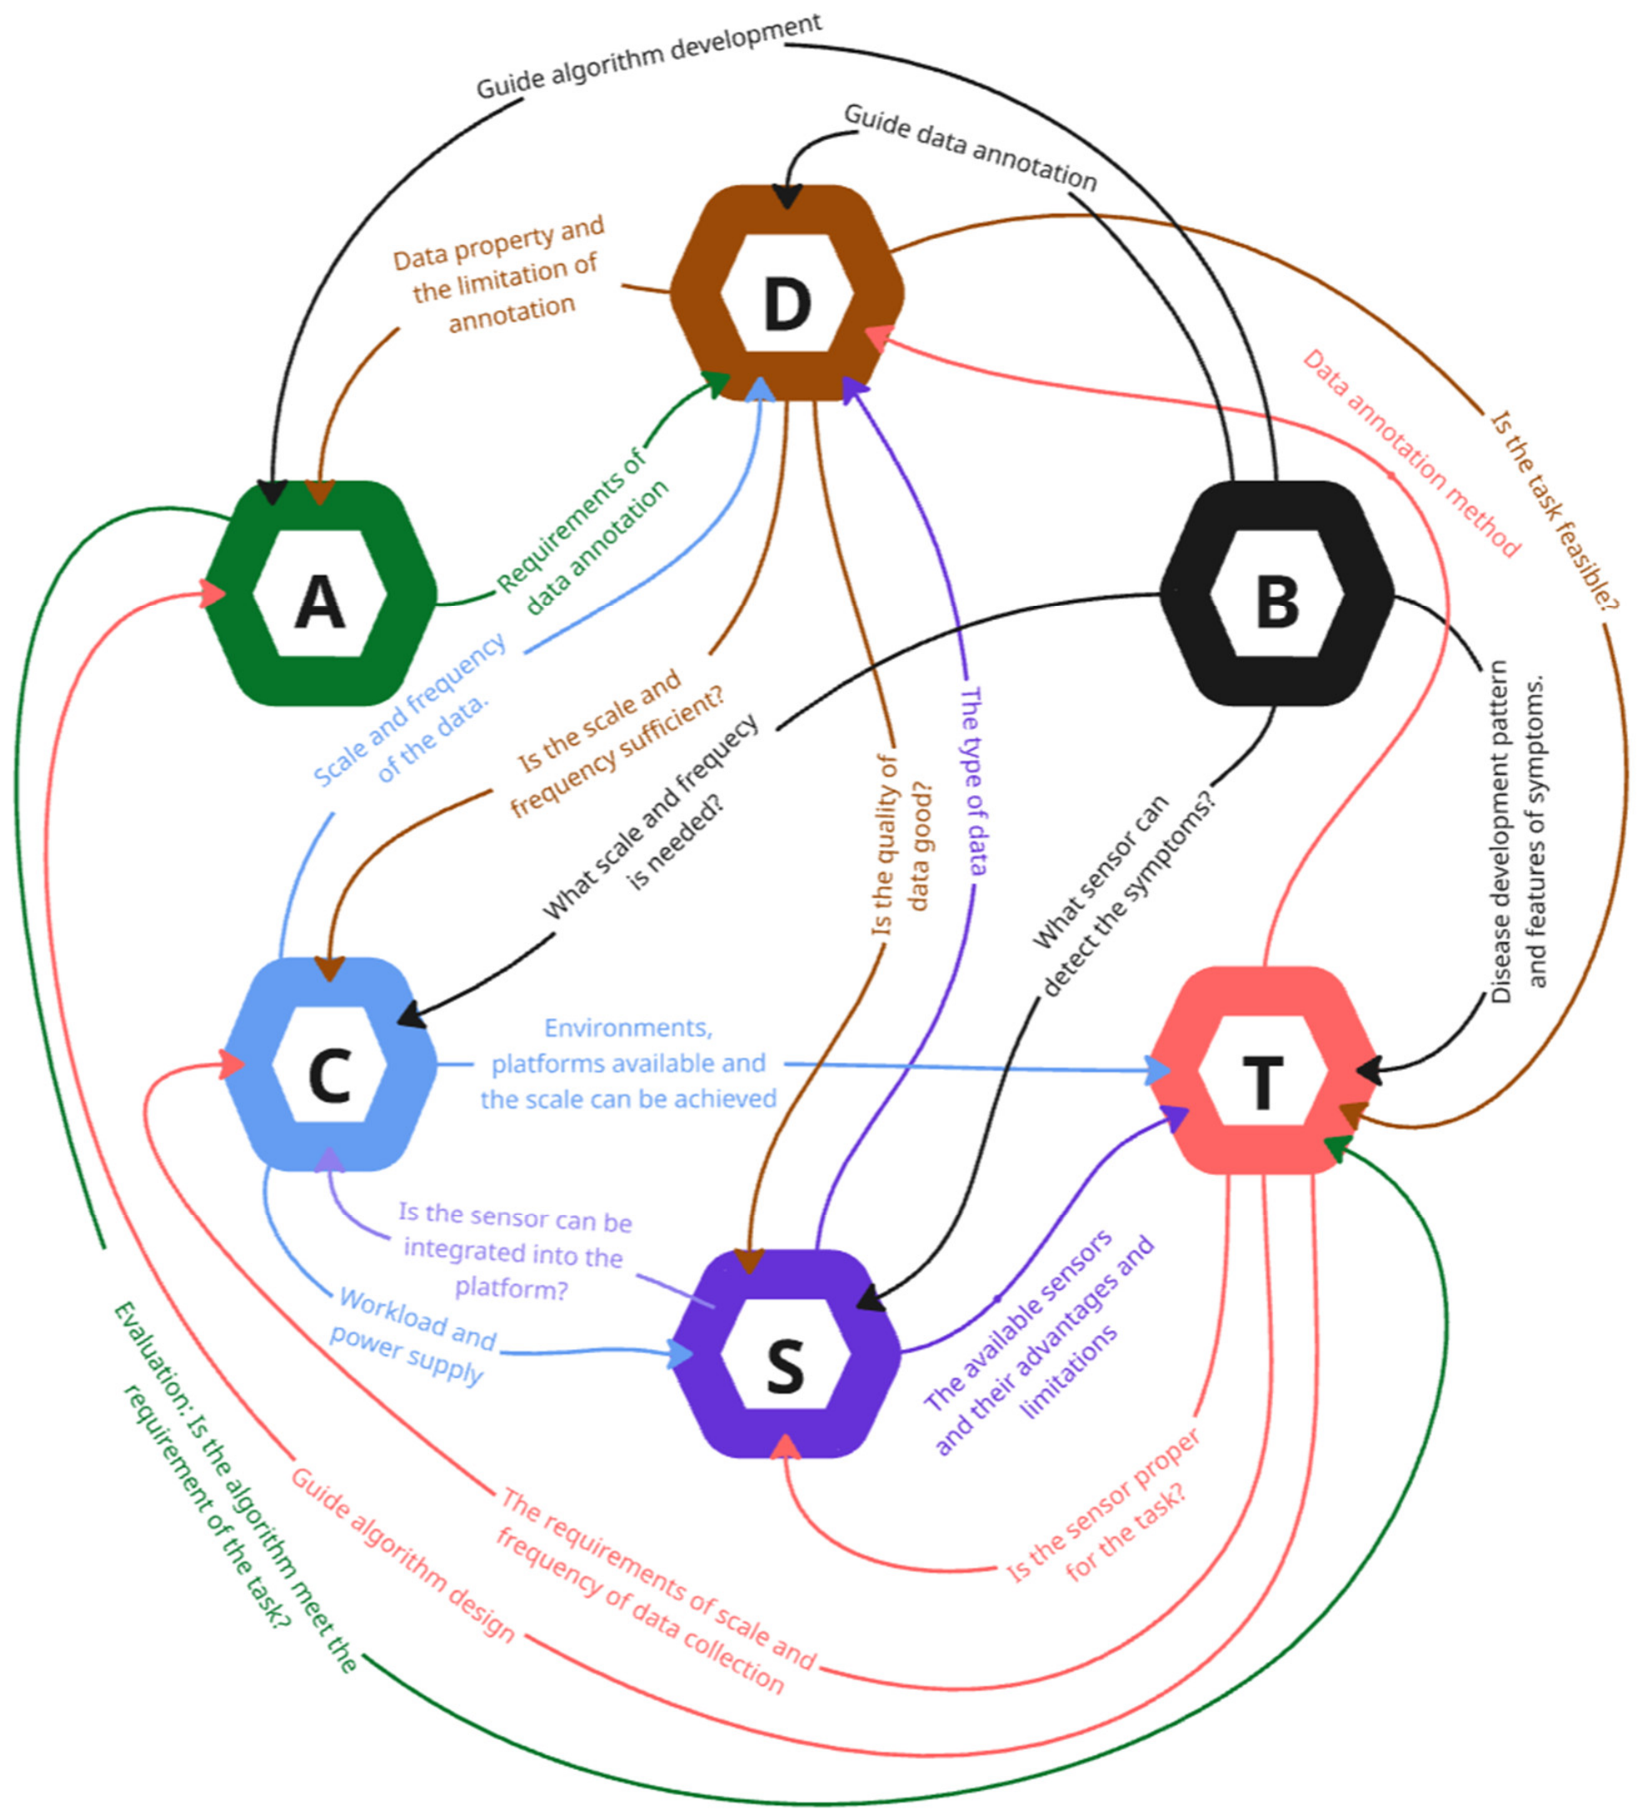

Disclaimer/Publisher’s Note: The statements, opinions and data contained in all publications are solely those of the individual author(s) and contributor(s) and not of MDPI and/or the editor(s). MDPI and/or the editor(s) disclaim responsibility for any injury to people or property resulting from any ideas, methods, instructions or products referred to in the content. |
© 2026 by the authors. Licensee MDPI, Basel, Switzerland. This article is an open access article distributed under the terms and conditions of the Creative Commons Attribution (CC BY) license.