


Highlights
What are the main findings?
- Spatial clustering of snow disaster risk in Northwestern China is most pronounced across the Altai Mountains, the Ili Valley, and the Tacheng region, with the underlying hazard intensity descending from heavy snowfall to blowing snow and avalanches.
- An integrated multi-source remote sensing and geographic approach delineates compound winter-hazard zones, with an AUC of 0.871 and an overall accuracy of 84.3% when evaluated against disaster records.
What are the implications of the main findings?
- The identified hazard hierarchy and risk hotspots across the Altai Mountains, the Ili Valley, and the Tacheng region allow authorities to prioritize infrastructure reinforcement and strategically allocate rescue resources in high-risk zones.
- The validation results indicate that combining multi-source remote sensing with EWM provides a reproducible regional-scale framework for identifying compound winter-hazard hotspots in cold regions.
Abstract
Snow disasters constitute a major natural hazard in Northwestern China, where heavy snowfall, blowing snow, and avalanches pose significant threats to infrastructure and socioeconomic activities. A scientific assessment of regional snow disaster risk is therefore critical for disaster prevention, spatial planning, and sustainable development. This study integrates multi-source remote sensing and geographic data to develop a comprehensive risk assessment method. By entropy weight method (EWM), we construct an assessment model that quantifies the combined hazard potential of heavy snowfall, blowing snow, and avalanches. The results reveal a significant spatial correlation among the three primary hazard types. The average potential hazard intensity of heavy snowfall is greater than that of blowing snow, which in turn exceeds that of avalanches. Spatially, the comprehensive snow disaster risk is most severe in the Altai Mountains, the Ili River valley, and the Tacheng region. A moderate-to-high risk level is distributed across the southwestern valleys and the foothills of the northeastern mountains. In contrast, the lowest risk areas are concentrated in certain interior valleys and the leeward slopes of the Junggar Basin. The resulting regional risk zoning was evaluated using receiver operating characteristic (ROC) curve analysis and disaster records. The model achieved an area under the receiver operating characteristic curve (AUC) of 0.871 and an overall accuracy of 84.3%, indicating good spatial discrimination between high- and low-risk zones. These metrics support the application of the framework to regional snow disaster risk assessment.
1. Introduction
Snow disaster is a major meteorological hazard caused by heavy snowfall and sustained accumulation, which poses severe threats to human safety, production activities, and socioeconomic stability [1]. Against the backdrop of global climate change and the continuous expansion of human activities into cold, high-altitude regions, the exposure of communities and critical infrastructure to snow disasters is markedly increasing. This elevated risk can lead to extensive infrastructure damage, disruption of essential services, significant economic losses, and hindered sustainable socioeconomic development in affected regions. In severe cases, such disasters may even sever vital socioeconomic linkages between different areas. Research indicates that extreme snow events are strongly associated with the disruption of normal societal functions and operational safety [2]. Therefore, a systematic assessment of regional snow disaster risk is fundamental for proactive disaster risk reduction and resilience building.
Currently, many studies on risk assessment have been conducted both domestically and internationally [3,4,5,6,7,8]. Existing research has used risk matrices and probability distributions to assess the risks posed by national-scale disasters, such as heavy rain, floods, typhoons, heavy snow, and frost, and to compile national risk maps [9]. Other scholars have employed scenario simulation, fuzzy logic, and logistic regression to develop mathematical models to assess the risks of heavy rain, floods, and geological disasters [10,11,12,13,14]. With the gradual improvement of the theoretical framework for risk assessment of major engineering projects and lifeline engineering, scholars have proposed specific methods for quantitative identification, estimation, evaluation, and decision-making [15,16] and have conducted research on risk factors, vulnerability, and risk assessment of lifeline engineering and transportation systems [17,18,19,20], establishing basic assessment models and developing corresponding assessment systems [21,22] particularly in terms of quantitative research on the hazard potential of natural disasters in key regions, agricultural and pastoral meteorological disasters, and snow disasters along roadways, as well as the vulnerability of risk-bearing entities. This provides an important theoretical basis for establishing a snow disaster evaluation system in Northwestern China.
Many scholars have explored the spatiotemporal distribution and impact assessment of snow disasters in Northwestern China. In a study of 95 snow disaster events over the past 30 years, the entropy weight method was used to calculate the snow disaster damage index for the region. It was concluded that the frequency of snow disasters has significantly decreased, but there is a significant increase in inter-county differences, with a trend toward overall concentration of snow disaster areas [23]. However, in the analysis of spatial patterns and interannual variability of snow disasters in Northwestern China, the northern Xinjiang river valleys are classified as the most severe category, with the snow disaster loss index increasing by 0.25 every 10 years, showing a clear upward trend [24]. Additionally, using statistical data, it was found that the northern Xinjiang river valleys, along with the Bayinbuluke, Altay, and Tacheng regions, are the areas with the highest snow disaster severity, and both the frequency and intensity of snow disasters are showing a sharp increase [25]. Clearly, these research findings are inconsistent. Xu Jianhui et al. explored the spatiotemporal evolution of snow disasters in Northwestern China using spatiotemporal autocorrelation. Their research found that high-frequency snow disaster areas have shifted from the northern part of the northern Xinjiang region to the southern part, forming three significant areas: the Altay region, the Tacheng region, and the northern Xinjiang region. Among these, snow disasters in Northwestern China are primarily concentrated in Yining, Nilka, Gongliu, and Xinyuan counties, with disaster frequencies exhibiting significant spatial clustering [26]. Currently, these studies either explore the spatial distribution characteristics and interannual trends of snow disasters in the Northern Northwestern China region or assess a single type of snow disaster, lacking a comprehensive assessment of snow disaster risks for major engineering projects and lifeline engineering [27]. Therefore, conducting a snow disaster risk assessment for this region is both urgent and practically significant. However, the scarcity of snow disaster risk factor data has remained a bottleneck in research, leading to insufficient consideration of risk factor differences and the neglect of the multi-source nature of snow disaster risks in risk assessments [28,29,30,31]. Some scholars have employed probabilistic and deterministic methods [14,32,33,34] for assessment, highlighting discrepancies in model performance across different assessment factors leading to significant deviations between model outcomes and actual conditions. Therefore, exploring the multi-source differences in snow disaster risk factors is crucial for snow disaster risk assessment.
This study focuses on the quantitative assessment of snow disasters in Northwestern China using a multi-risk assessment method [35] to identify key snow disaster areas. By integrating multi-source data, including remote sensing snow-cover data, topographic data, and auxiliary data, this study constructs assessment models for heavy snowfall, blowing snow, and avalanche hazards in the Northwestern China region. It conducts a comprehensive assessment of snow disasters in the Northwestern China region, explores pathways and methods for assessing snow disaster risks, and provides a basis for snow disaster prevention in the region.
2. Study Area and Data
2.1. Study Area
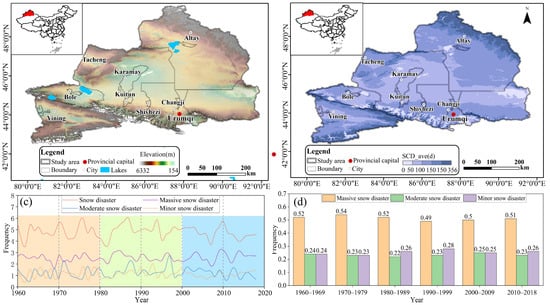
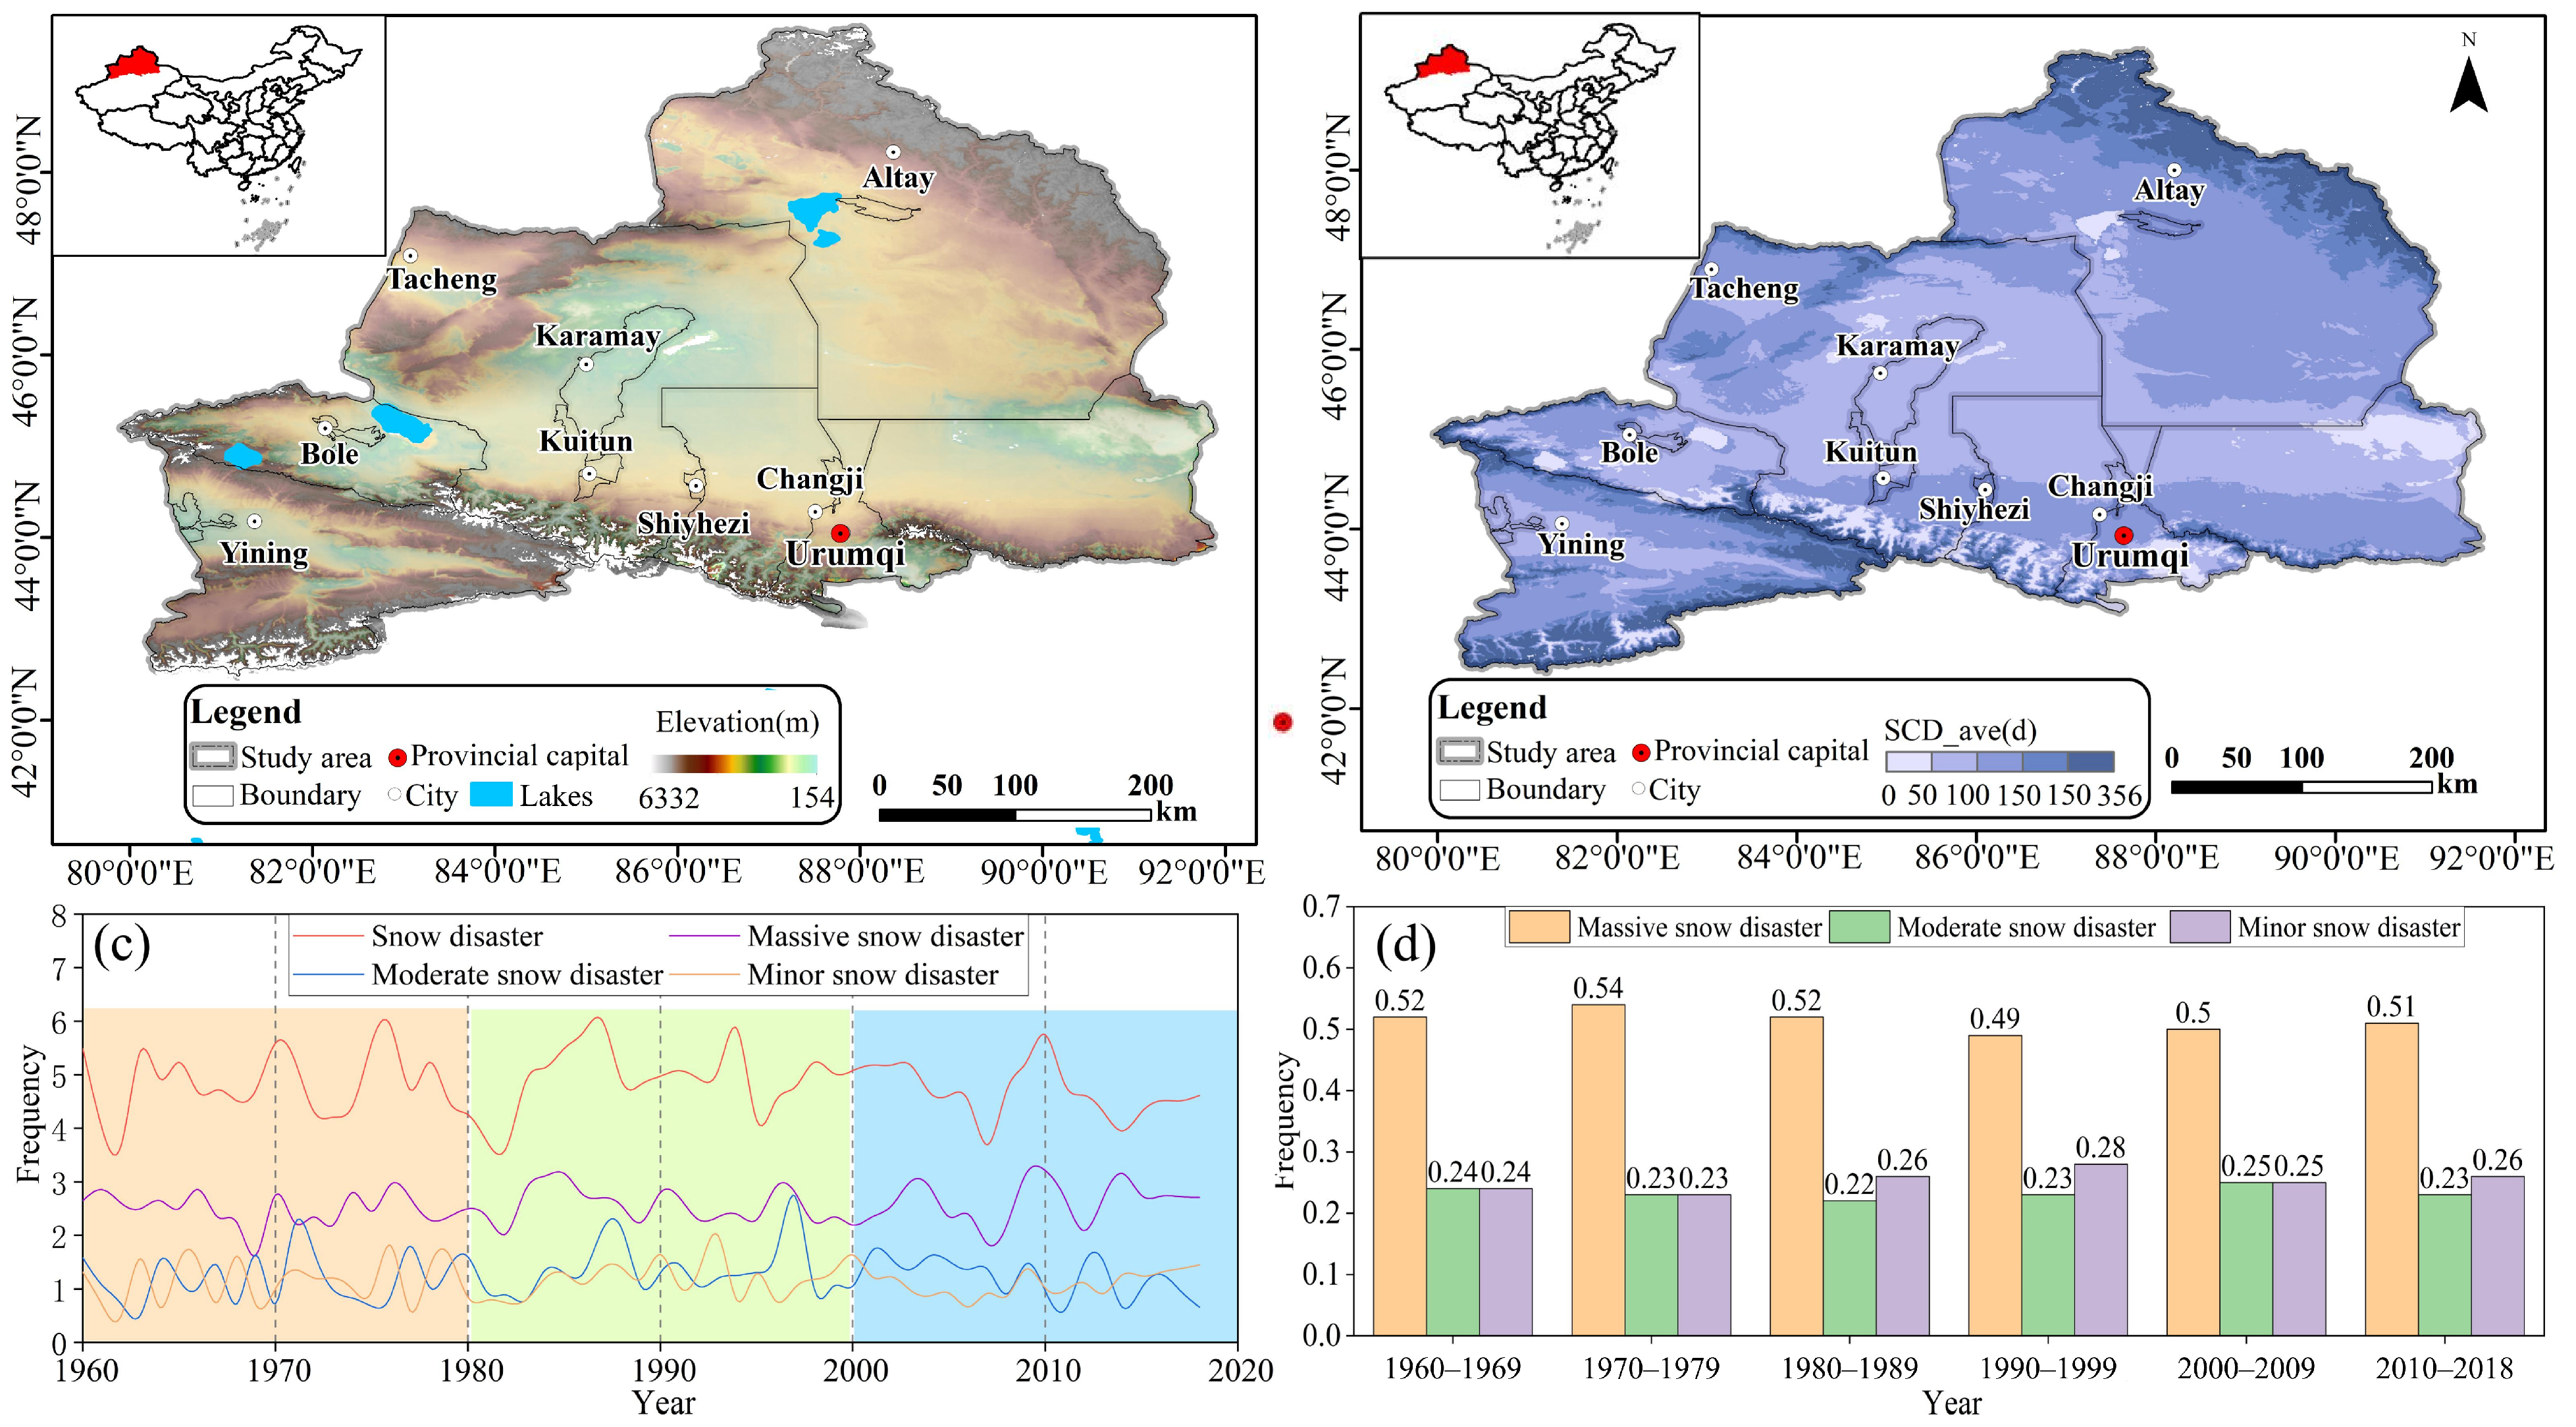
The Northwestern China region, located in the northern part of the Xinjiang Uygur Autonomous Region of China, is a vast geographical region situated in the core of the Eurasian continent. It is precisely defined as the area north of the Tianshan Mountains within China’s Xinjiang Uygur Autonomous Region (Figure 1). Geographically, it spans approximately from 42°N to 49°N in latitude and 80°E to 96°E in longitude. The region is tectonically anchored by the majestic Altay Mountains to the northeast, which form a natural border, and is topographically dominated by the Junggar Basin in its central part. It shares borders with several countries, including Mongolia, Russia, and Kazakhstan, positioning it as a critical zone in Central Asia. Characterized by a typical temperate continental climate with pronounced arid and semi-arid conditions, Northwestern China’s complex terrain—encompassing high mountains, intermountain basins, and valleys—fundamentally shapes its unique hydro-meteorological patterns and ecological vulnerabilities, making it a classic and significant area for studying cold-region environmental processes and disaster dynamics.
Figure 1.
Location of the study area. (a) Topographic map of Northwest China with distribution of prefecture-level cities. (b) Annual mean snow-cover days (SCD) in Northwest China. (c,d) Derived from the Meteorological Disaster Yearbook. (c) Frequency of snow disasters in Northwest China from 1960 to 2020, including snow disaster, massive snow disaster, moderate snow disaster, and minor snow disaster. (d) Percentage composition of massive, moderate, and minor snow disasters.
Due to its unique topographical and climatic conditions, it experiences a high number of snowfall days annually, with prolonged snow accumulation and deep snow depths, making it prone to snow-related disasters along the roadways. Historical data show that road snow disasters in Northwestern China primarily occur during the winter, especially from November to March of the following year [36]. Road snow disasters are more frequent and severe in the Tianshan foothills and the Altay region, leading to issues such as road snow accumulation, blowing snow, and avalanches that obstruct road traffic, pose significant challenges to local personnel and material transportation, and disrupt connectivity between Southern and Northern Xinjiang. During winter, influenced by westerly winds, the Atlantic westerly wind belt carries warm, humid air to this region, which, due to topographical uplift, results in abundant snowfall, making it a natural laboratory for studying snow-related characteristics.
2.2. Data and Pretreatment
2.2.1. Snow-Related Remote Sensing Parameters
This study used snow-cover and snow-depth products from the national glacier, permafrost, and desert scientific data center (http://www.ncdc.ac.cn, accessed on 13 August 2025) to characterize the long-term regional snow-climatological background of Northwestern China for snow disaster risk assessment. The datasets included the 2000–2020 MODIS China snow-cover days (SCD) dataset, the China MODIS daily cloud-free 500 m fractional snow cover (FSC) product dataset, the Northwestern China 500 m daily snow depth (SD) dataset (2010–2020), and snow stability classification data (SSCD) (Table 1).
Table 1.
The indicator system of the potential risk assessment of a snow disaster.
The temporal coverage differs because the source products have different availability periods: SCD is available for 2000–2020, whereas the regional 500 m SD product covers 2010–2020. These datasets were used as separate long-term spatial indicators rather than synchronized annual series; therefore, the analysis does not infer interannual relationships between them. Their shared 2010–2020 interval provides temporal overlap, while the longer SCD record supports a more stable estimate of snow-cover persistence.
2.2.2. Terrain Data
Geospatial data cloud platform data (https://www.gscloud.cn/, accessed on 11 October 2025) SRTM 90 m resolution digital elevation data products were used as terrain indicator input data for snow disaster assessment in Northwestern China, primarily to obtain terrain type, slope, and curvature data.
2.2.3. Auxiliary Data
Land use, vegetation coverage data and building data were derived from the resource and environmental science data platform (https://www.resdc.cn/ accessed on 23 September 2025). Meteorological data, encompassing winter temperature, precipitation, and wind speed, were acquired from the national meteorological science data center (http://data.cma.cn/, accessed on 6 September 2025). Historical snow disaster records were curated from the Xinjiang statistical yearbook, local chronicles, and credible media reports, all of which were verified and proofread at the township level.
All raster datasets were projected to a common coordinate system and harmonized to a 500 m analysis grid. Continuous variables were resampled using bilinear interpolation, whereas categorical variables were resampled using nearest-neighbor assignment to preserve class labels. Landform type, land use, and snow-stability classes were reclassified into ordered assessment scores before range normalization. The common grid provides consistent spatial support for regional analysis; however, resampling the 5 km snow-stability and 6.25 km meteorological products does not create spatial information beyond their original resolutions.
3. Methods
3.1. Development of a Risk Assessment Framework for Snow Disasters
The development of a snow disaster risk model framework primarily involves five key components: selecting risk indicators, data preprocessing, constructing a risk assessment model, classifying risk levels and model evaluation.
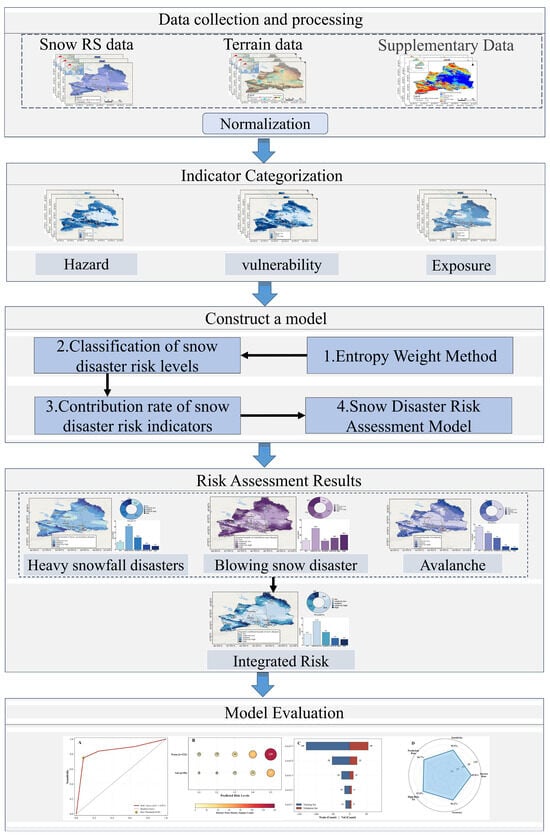
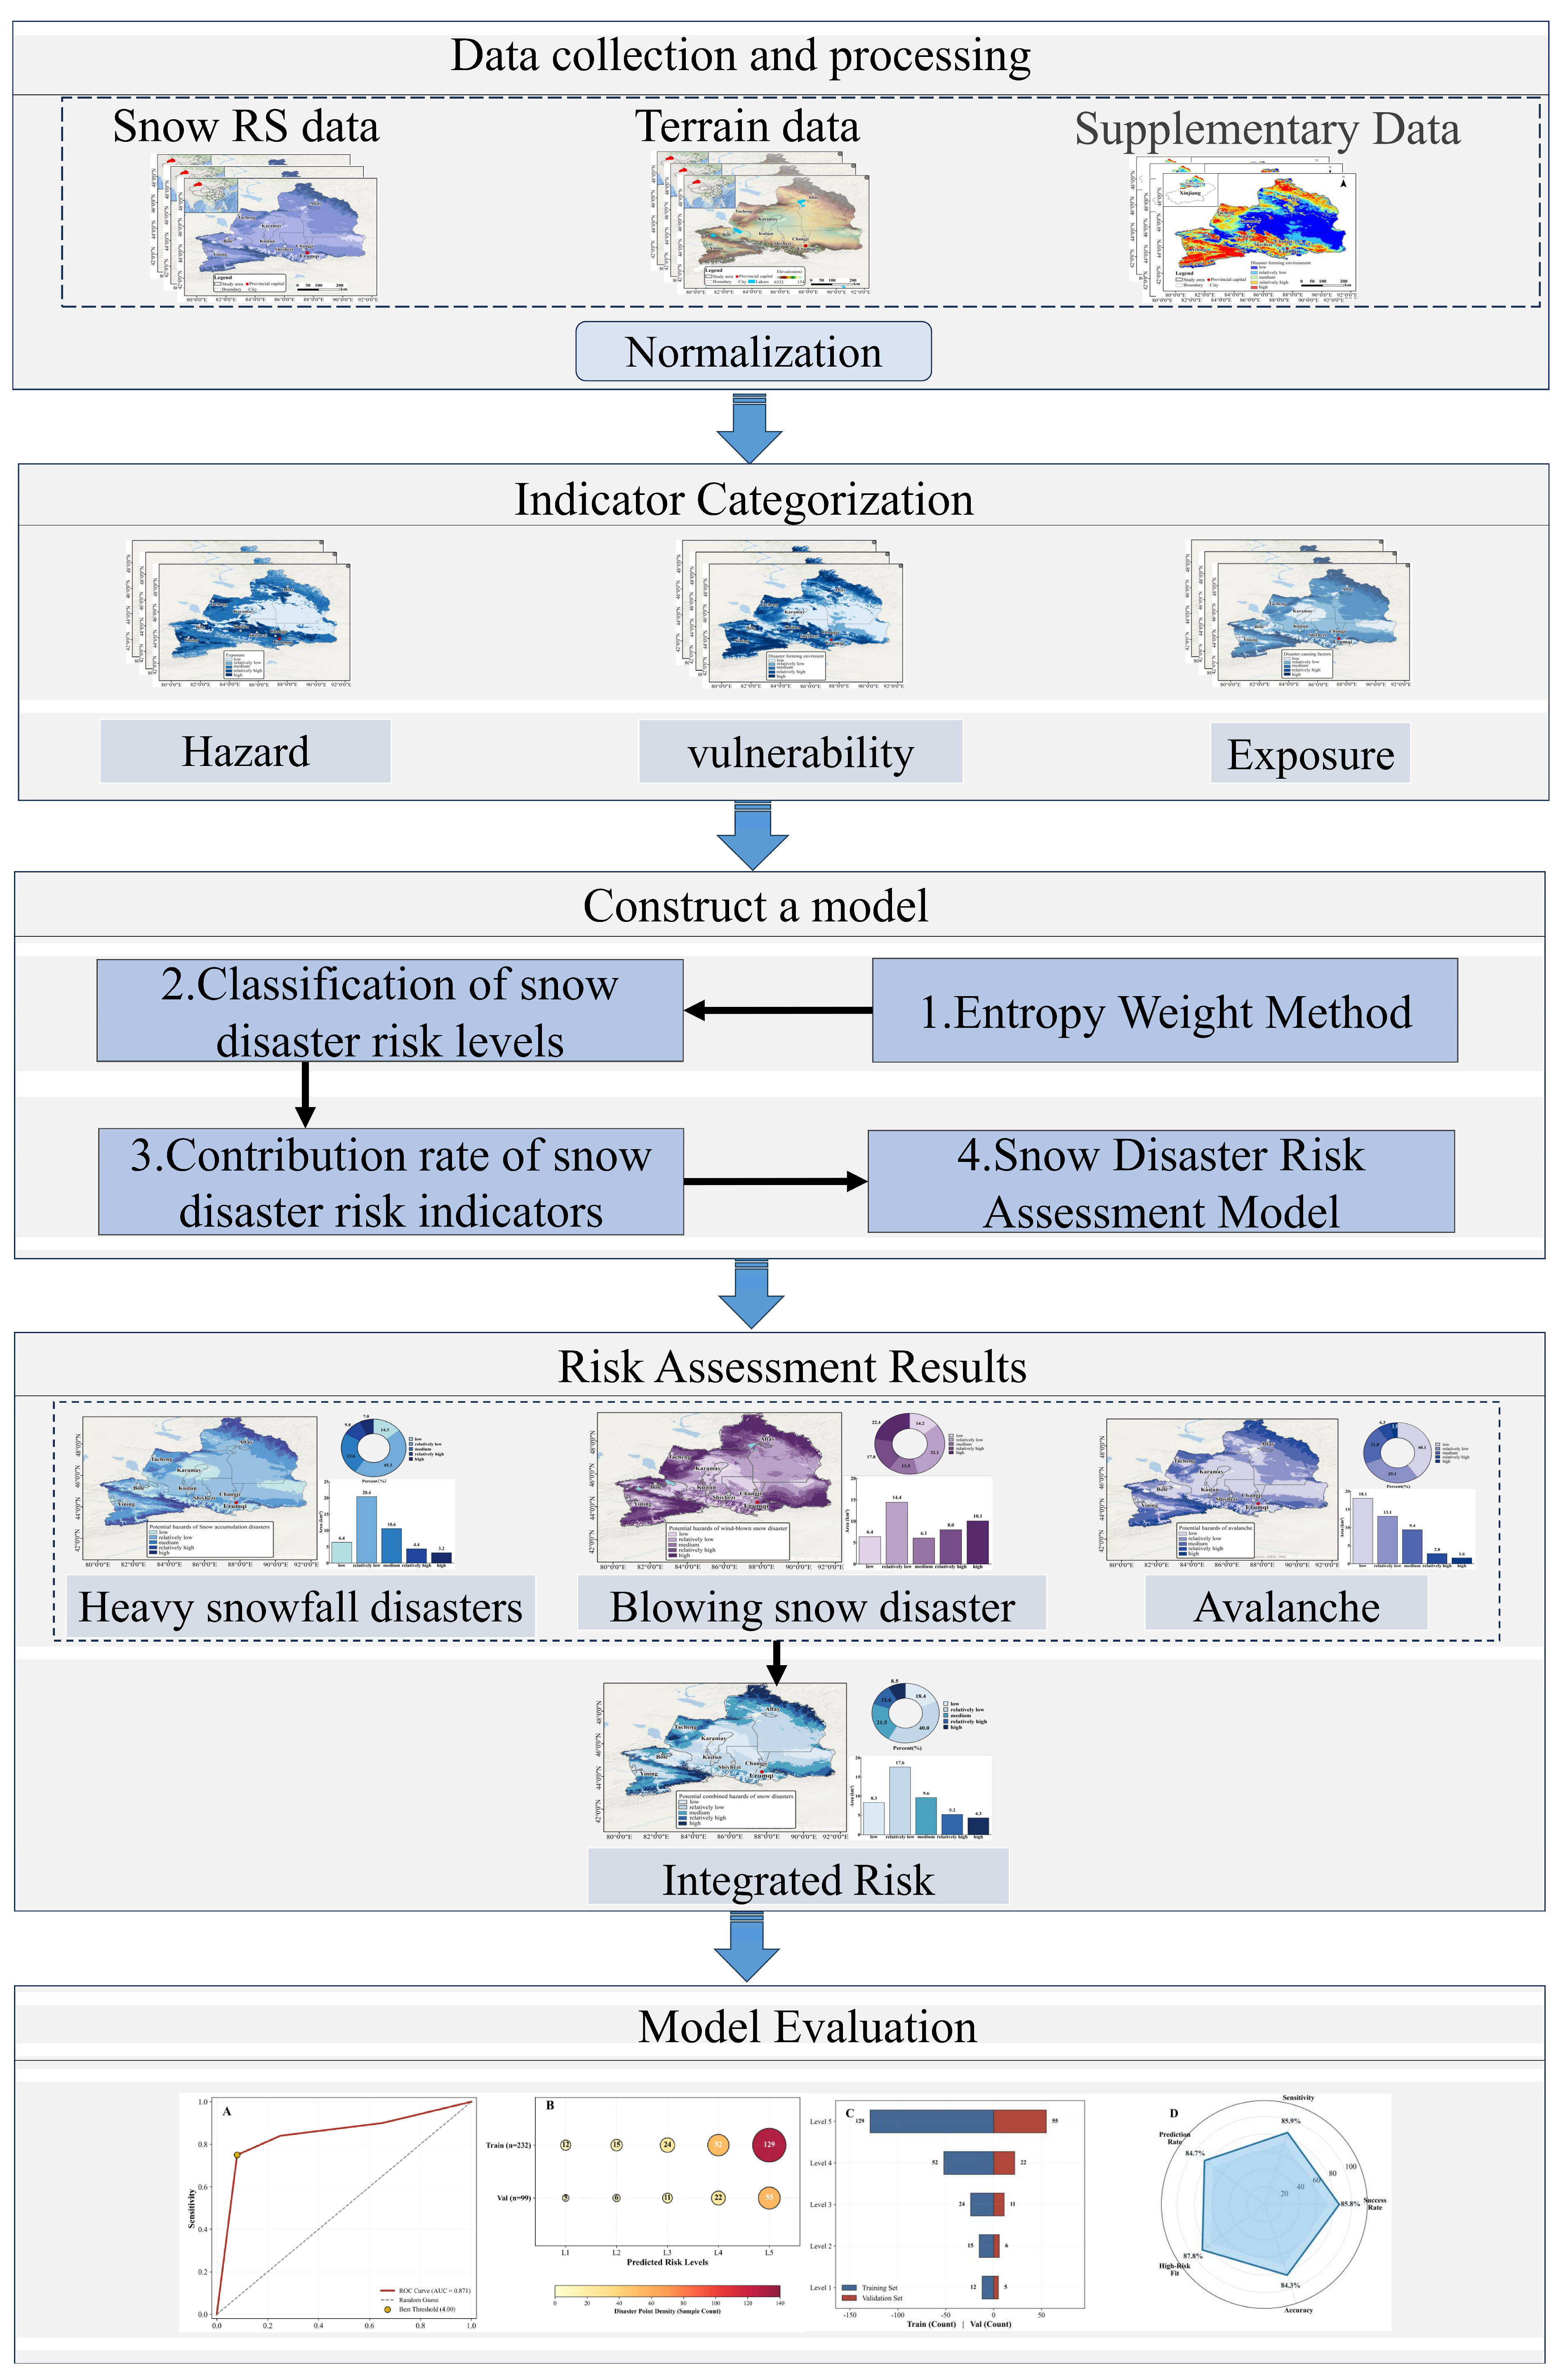
The selection of indicators for assessing snow disaster risk encompasses 16 categories of data, including snow data, terrain data, meteorological data, and auxiliary data. Various types of snow disasters possess risk assessment indicators that exhibit unique dimensions. Employing various units of measurement in quantitative calculations can result in discrepancies in assessment outcomes, attributable to variations in the physical dimensions of individual indicators. In this study, following the preprocessing of the selected assessment indicators, a data normalization method was utilized to rectify differences in measurement units across the indicators. To enhance the characterization of the mechanisms underlying various types of snow disasters, risk indicators that influence their occurrence and progression were categorized into three components: hazard, environmental sensitivity, and exposure. The entropy weight method was employed to ascertain the weight coefficients for each indicator within the snow disaster risk assessment model. Subsequently, a snow disaster risk assessment model was developed based on the findings of the disaster risk assessment research. The percentile method was utilized to establish the threshold for classifying snow disaster risk levels, and critical segments were identified for the snow disaster risk assessment. Figure 2 illustrates the methodology and model construction process utilized in this study.
Figure 2.
Technical flowchart. The framework includes five components: data collection and processing, indicator categorization, construction of a model, risk assessment results and model evaluation. (A) Receiver operating characteristic (ROC) curve and area under the curve (AUC) for the validation set; (B) two-dimensional bubble matrix representing the density distribution of training (70%) and validation disaster points across predicted risk levels (L1–L5); (C) bi-directional pyramid plot comparing the spatial frequency of training and validation sets within each comprehensive risk level; (D) radar chart illustrating the comprehensive model performance evaluated by multi-dimensional geospatial metrics.
3.2. Selecting and Calculating Snow Disaster Risk Indicators
The indicator system was developed according to physical relevance, regional spatial continuity, scale compatibility, and data availability. SCD, FSC, and SD characterize snow persistence, spatial extent, and accumulated load; SSCD represents snow stability; temperature and precipitation regulate snow phase and accumulation; and wind speed controls snow transport and drift formation. Elevation, landform, slope, and curvature influence orographic accumulation and gravitational release, whereas land use and vegetation modify surface roughness and snow retention. Historical records provide empirical evidence of recurring events, and road and building indicators describe infrastructure exposure.
3.2.1. Preprocessing of Snow Disaster Risk Indicators
To address the dimensional discrepancies in indicator weights, the preprocessing step entails calculating the average, maximum, and minimum values of the chosen potential risk indicator factors—including hazard, exposure, and environmental sensitivity parameters derived from the SCD, FSC, SD, SSCD, and DEM; landform type; slope; curvature; meteorological data; land use; vegetation cover; historical records; roads; and buildings. This enhances data accuracy, minimizes analytical errors, and establishes a dependable foundation for subsequent modeling or analysis. Equations (1) to (3) apply. For non-parametric indicator change rates, the Theil-Sen median method is employed. This method demonstrates remarkable robustness to outliers and can yield relatively stable estimates of parameter change rates, even in the presence of outliers or when the data distribution deviates from normality, as illustrated in Equation (4).
Before normalization, all variables were aligned to the common 500 m analysis grid; categorical variables were reclassified into ordered assessment scores, whereas continuous variables retained their numerical form.
Among these, T represents the average values of parameters related to hazard, exposure, and environmental sensitivity; and represents the values of each relevant parameter at the ()th point, with denoting the number of parameter indicators. The symbols , , and correspond to the maximum, average, and median values of parameters associated with disaster-causing factors, disaster-prone environments, and disaster-affected entities, respectively.
Snow disaster assessment indicators serve as a comprehensive evaluation method that incorporates multiple objects and metrics. To reduce the impact of differing dimensions, it is crucial to quantify these indicators, as they cannot be directly compared due to variations in units of measurement. This study employs range transformation to normalize all sequence values to a specified range, as illustrated in Equation (5):
In this context, denotes the normalized value of the indicator, which ranges from 0 to 1. The variable signifies the value of each relevant parameter at the ()th point, while the maximum and minimum values of the relevant parameters are derived using Equations (2) and (3).
3.2.2. Quantifying Snow Disaster Risk Indicators
In quantifying snow disaster risk indicators, information entropy serves as a tool to assess both the significance and uncertainty associated with each indicator. By calculating the information entropy for each risk indicator, one can evaluate its contribution to the overall risk assessment. A higher entropy value indicates greater uncertainty and a richer information content regarding the description of snow disaster risk, as demonstrated in Equations (6) and (7):
denotes the information entropy of the indicator, where represents the value of the indicator for the sample, and is the proportion of in the total value of the indicator across all samples. The calculation formulas for and are defined as follows:
Among them, wj is the entropy weight of each indicator, and dj represents the information-variation coefficient of the jth indicator (j = 1, 2, 3, …, m). In this study, the entropy-derived weights therefore describe the relative spatial information content of the normalized indicators rather than a direct ranking of physical causality.
To objectively and systematically quantify the spatial patterns of snow disasters across Northwestern China, this study established a comprehensive indicator framework anchored in the classic IPCC conceptual paradigm, which mathematically defines disaster risk as a multi-dimensional function of hazard, environmental sensitivity, and exposure. Within this structured framework, the hazard dimension accounts for the atmospheric driving forces and physical triggers that initiate winter disasters. The environmental sensitivity dimension governs the landscape’s baseline susceptibility and its inherent buffering capacity against severe snow impacts. The exposure dimension represents infrastructure assets, mainly roads and buildings, that directly intersect potential disaster zones. To operationalize this conceptual risk paradigm, these three primary dimensions were systematically decomposed into sixteen distinct factors. The finalized taxonomic architecture and numerical weight configurations derived from this unified risk framework are comprehensively structured and detailed in Table 2.
Table 2.
Classification of key indicators for assessing snow disasters in Northwestern China.
In this study, hazard denotes the process-specific potential associated with heavy snowfall, blowing snow, or avalanches; exposure denotes the spatial distribution of roads and buildings; environmental sensitivity denotes the terrain and land-cover conditions that may amplify snow-related impacts; and comprehensive risk denotes the integrated regional index derived from the standardized hazard indices within the assessment framework.
3.3. Classification of Snow Disaster Risk Levels
In this study, the percentile method was used to classify and establish thresholds for snow disaster risk levels. This method is applicable to various types of data, including continuous and discrete data, and is not restricted by data distribution patterns. It can be applied to the assessment of disaster events in different regions and at different times and has a high degree of generalizability. Formula (10) is as follows:
In the formula, Pm denotes the mth percentile, L denotes the lower bound of the mth percentile group, N denotes the total number of groups, Fb denotes the cumulative frequency of groups with frequencies less than Fb, f denotes the frequency of the mth percentile group, and i denotes the class width of the mth percentile group. Because R is a normalized relative index rather than an absolute occurrence probability, the 20th, 40th, 60th, and 80th percentiles were used to divide the regional distribution into five classes: low, moderately low, moderate, moderately high, and high (Table 3).
Table 3.
Classification of snow disaster risk.
3.4. Snow Disaster Risk Assessment Model
This study classifies snow disasters into three categories: heavy snowfall, blowing snow, and avalanches. Using the entropy weight method, we derive the weights of the contributing factors for each category. The hazard index for each type is then computed by applying these weights to the selected causal factors as follows:
In the equation, all indicators were standardized and directionally aligned prior to weighting. Using the entropy weight method, we derived the weights for each indicator and computed the potential hazard indices as follows. Heavy snowfall () denotes the potential hazard of heavy snowfall. The indicators – are the average annual number of snow days, snow-covered area, snow depth, slope, curvature, and snow stability. Their corresponding entropy weights are –, derived via the entropy weight method. Blowing snow () denotes the potential hazard of blowing snow. The indicators – are the average annual number of snow days, mean winter wind speed, surface roughness, average annual snow-covered area, terrain, slope, and vegetation cover. Their corresponding entropy weights are –. Avalanche hazard () denotes the potential hazard of avalanches. The indicators – are the average annual number of snow days, average annual snow depth, terrain, slope, land-cover type, vegetation cover, and historical avalanche records. Their corresponding entropy weights are –.
The comprehensive snow disaster risk was calculated by integrating the potential hazard levels of the three major disaster types. These hazard levels were treated as input factors and synthesized into a composite index using the EWM at a second aggregation level. The calculation formula is as follows.
At the first level, the EWM was applied within each hazard type to aggregate normalized process-specific indicators into Sj, Sf, and Sa. At the second level, the three standardized composite indices were used as higher-level inputs to derive the comprehensive index. The two stages therefore represent different levels of aggregation rather than repeated weighting of the same variables.
In the formula, S represents the comprehensive risk of snow disasters; , , and represent the hazard indices for heavy snowfall, blowing snow, and avalanches, respectively; and , , and represent the weighting coefficients corresponding to the three process-specific hazard indices.
4. Results
4.1. Spatial Distribution of Snow Disaster Risk Indicators
4.1.1. Spatial Distribution of Hazard
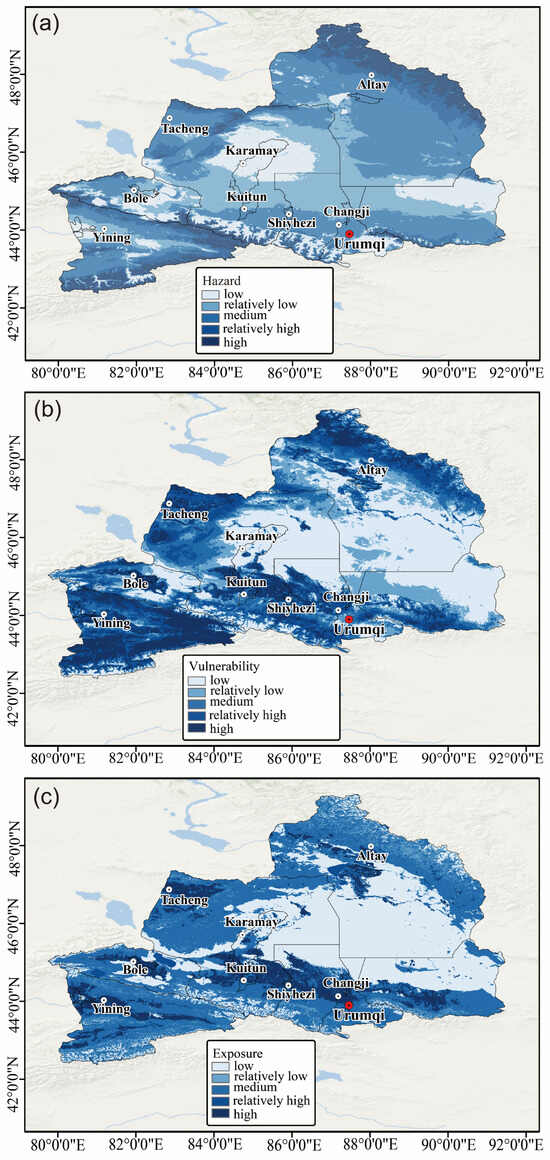
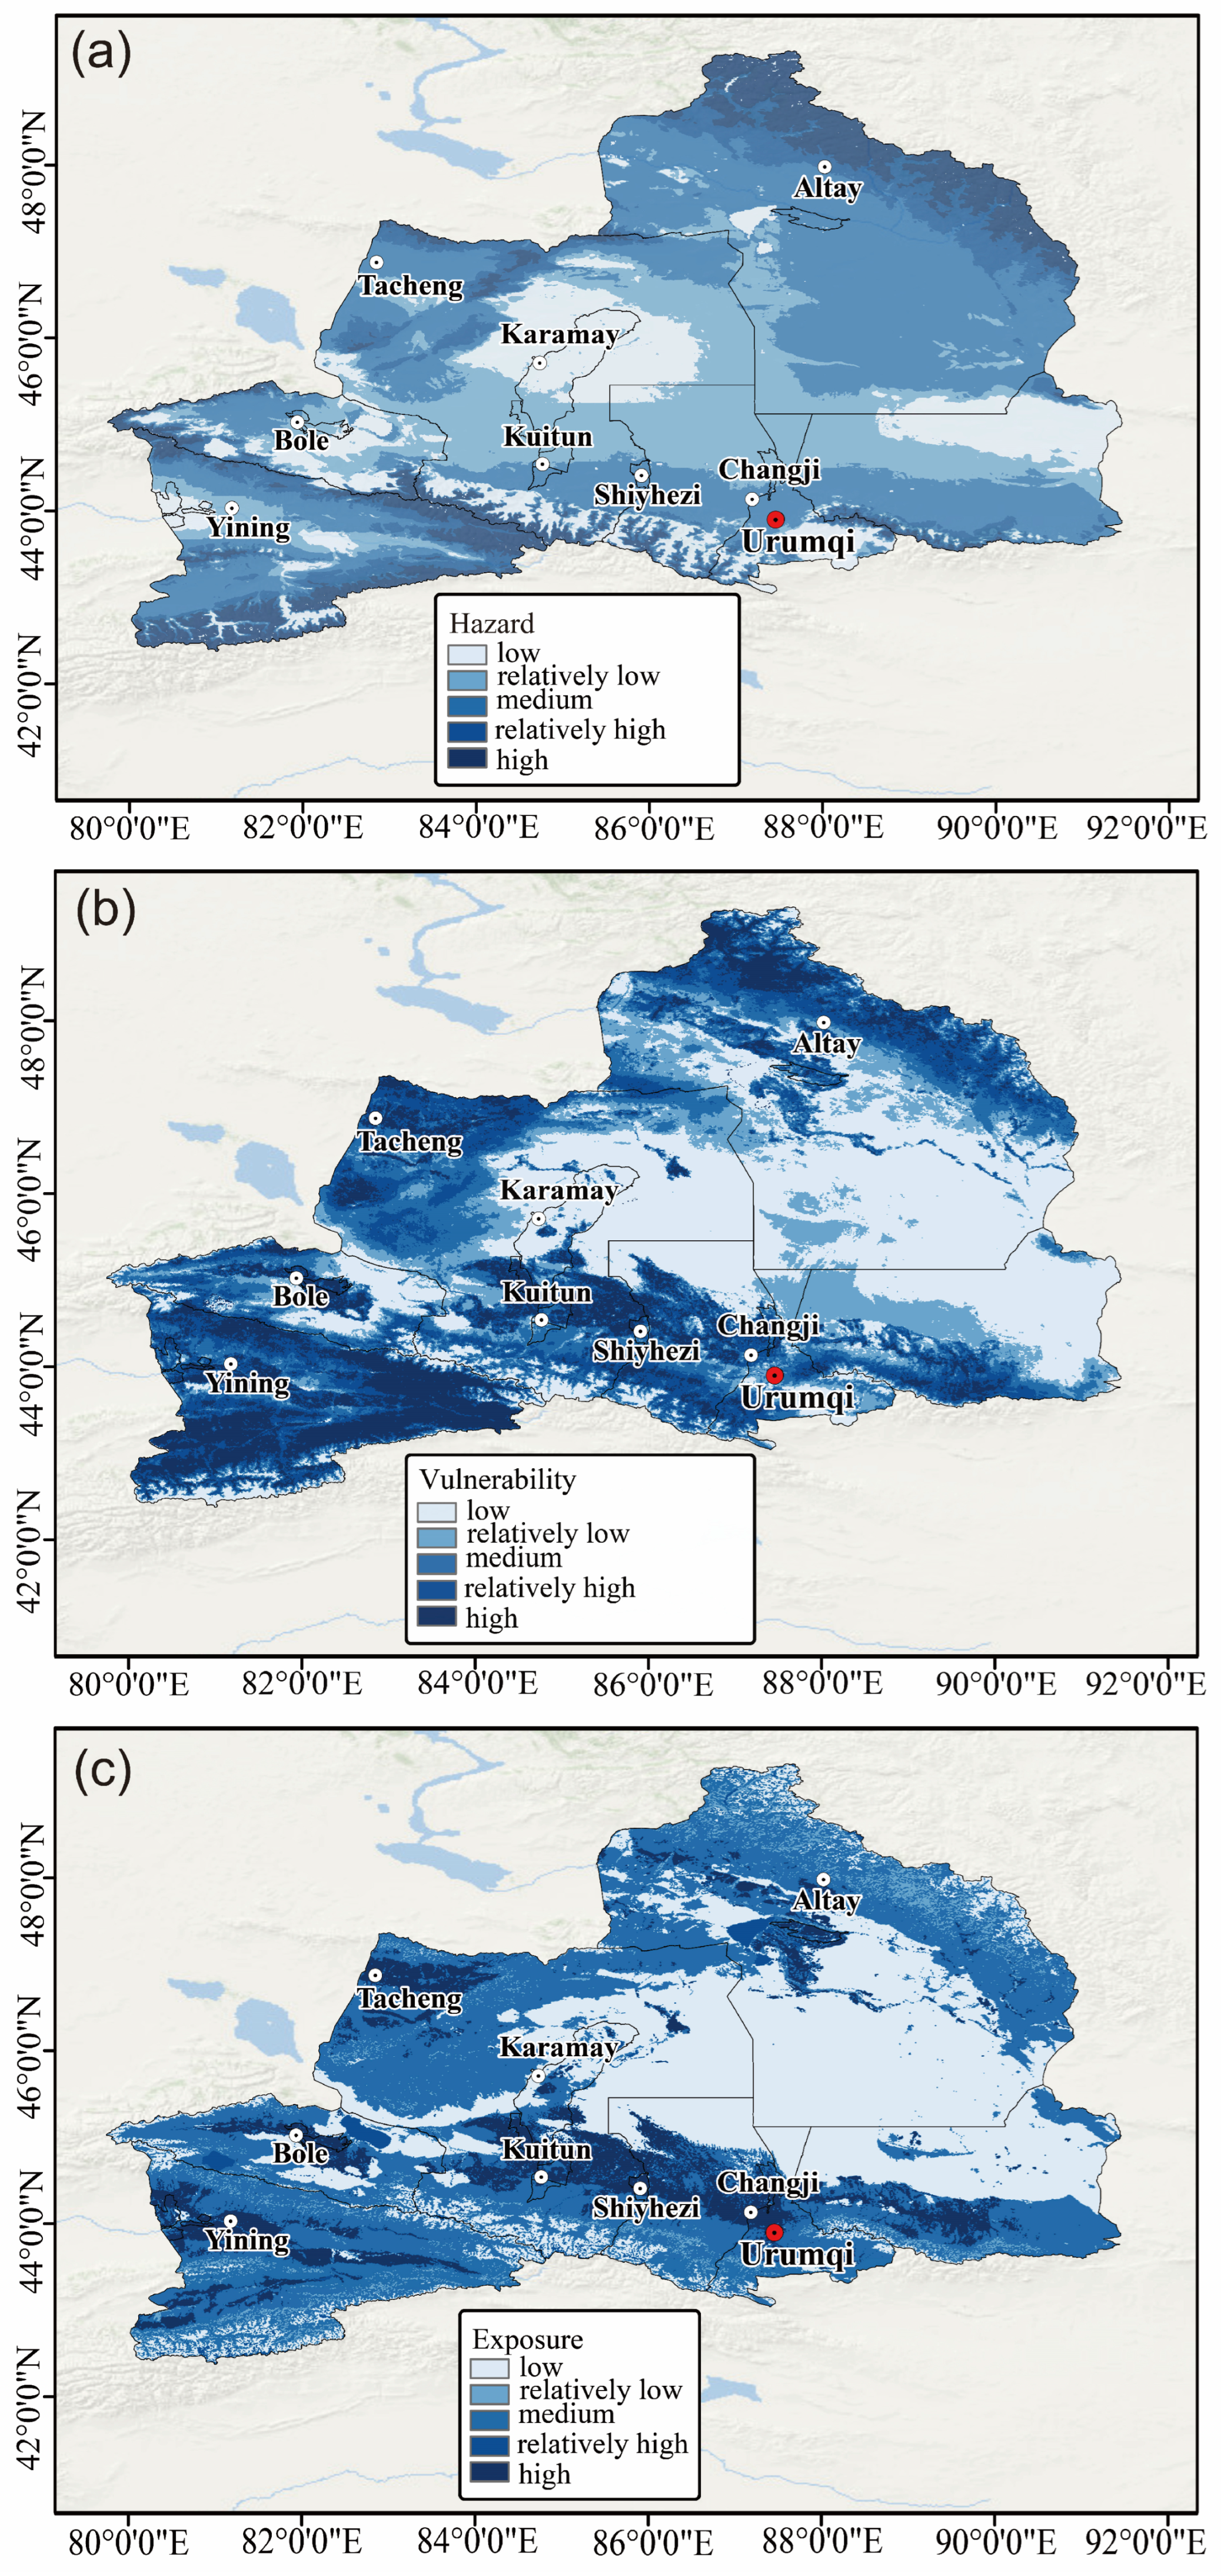
The snow disaster hazard layer was assessed by integrating seven indicators: SCD, FSC, SD, SSCD, temperature, wind speed, and precipitation, using the entropy weight method, as shown in Figure 3a. The percentile method was then applied to delineate five distinct risk categories: high, moderately high, medium, moderately low, and low. The resulting spatial distribution exhibits a clear orographic gradient, characterized by elevated risk levels in mountainous terrain and reduced risk across basins and river valleys. Moderately high-risk areas are notably concentrated in the Altay Mountains, including Altay City and Fuyun County, as well as in the central Northern Tianshan and Southern Tianshan Mountains. Conversely, low-risk zones are primarily located within the Junggar Basin, especially in the vicinity of Karamay and across northern to northeastern Changji. This spatial pattern aligns closely with the region’s characteristic snow accumulation regime.
Figure 3.
Spatial patterns of (a) hazard, (b) environmental sensitivity, and (c) exposure in Northwest China.
4.1.2. Spatial Distribution of Environmental Sensitivity
The spatial heterogeneity of the environmental sensitivity index across Northwestern China is comprehensively determined by seven traits: DEM, landform type, slope, curvature, land use, vegetation cover and historical records. The areas characterized by elevated sensitivity levels are predominantly clustered within the Ili River Valley, the eastern Tianshan Mountains, and the Altay Mountains. Specifically, this high-risk pattern encompasses most counties in the Ili region, Kuitun, Shihezi, southwestern Changji and northern Fuyun County (Figure 3b). In these mountainous corridors, the high sensitivity is intrinsically driven by the complex topography and high elevation isolation (DEM), coupled with sparse winter vegetation cover, which collectively diminish the regional baseline landscape resistance against severe snow disasters.
4.1.3. Spatial Distribution of Exposure
The infrastructure exposure index was quantified by integrating three structural components, building density, road functional classification, and road line density, with its spatial heterogeneity mapped in Figure 3c. The results indicate that high-exposure clusters are predominantly concentrated within the economic core corridors of Northwestern China—most notably along the northern slope of the Tianshan Mountains, including Urumqi, Changji, Shihezi, and Kuitun, as well as key regional hubs, such as Tacheng, Bole, and the Ili River Valley. This spatial alignment indicates that roads and built-up areas are concentrated along the main economic corridors, where severe snow events may disrupt transportation and settlement functions. The exposure map therefore describes road-building exposure rather than a complete socioeconomic exposure surface.
4.2. Hazard Assessment of Snow Disasters
4.2.1. Potential Hazardousness of Heavy Snowfall Disasters
The hazard of heavy snowfall, representing its inherent potential to cause damage, was assessed using six key indicators: the annual average number of snow days, snow-covered area, snow depth, slope, curvature, and snow stability. These indicators were first normalized to eliminate scale differences. Subsequently, the normalized data were processed using the entropy weight method (Equations (6) and (7)) to calculate the information entropy and corresponding weights for each indicator, as presented in Table 4.
Table 4.
Entropy weights of indicators for heavy snowfall hazard assessment.
As presented in Table 4, the information entropy values for the six indicators range from 0.9186 to 0.9615. Among them, the annual average snow depth has the lowest entropy (0.9186) and consequently the highest weight, indicating that it is the most critical factor contributing to the snow disaster hazard. The calculated weights are 0.26, 0.22, and 0.13 for the annual average number of SCD(avg), FSC(avg), and snow stability, respectively, while slope and curvature have the smallest weights. Based on these entropy-derived weights and Equation (11), the heavy snowfall hazard index was calculated as follows:
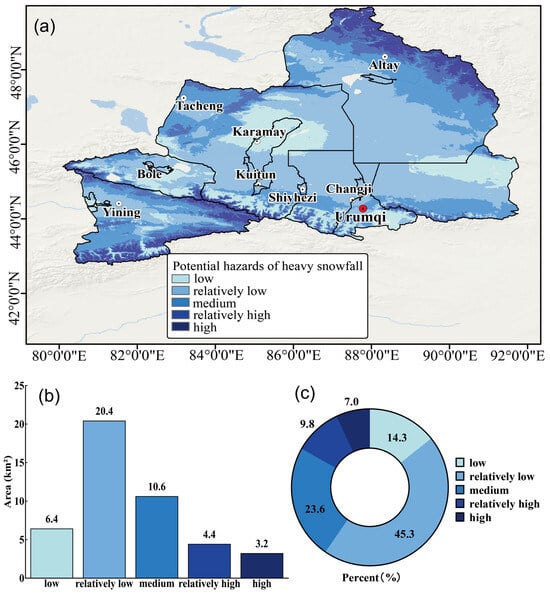
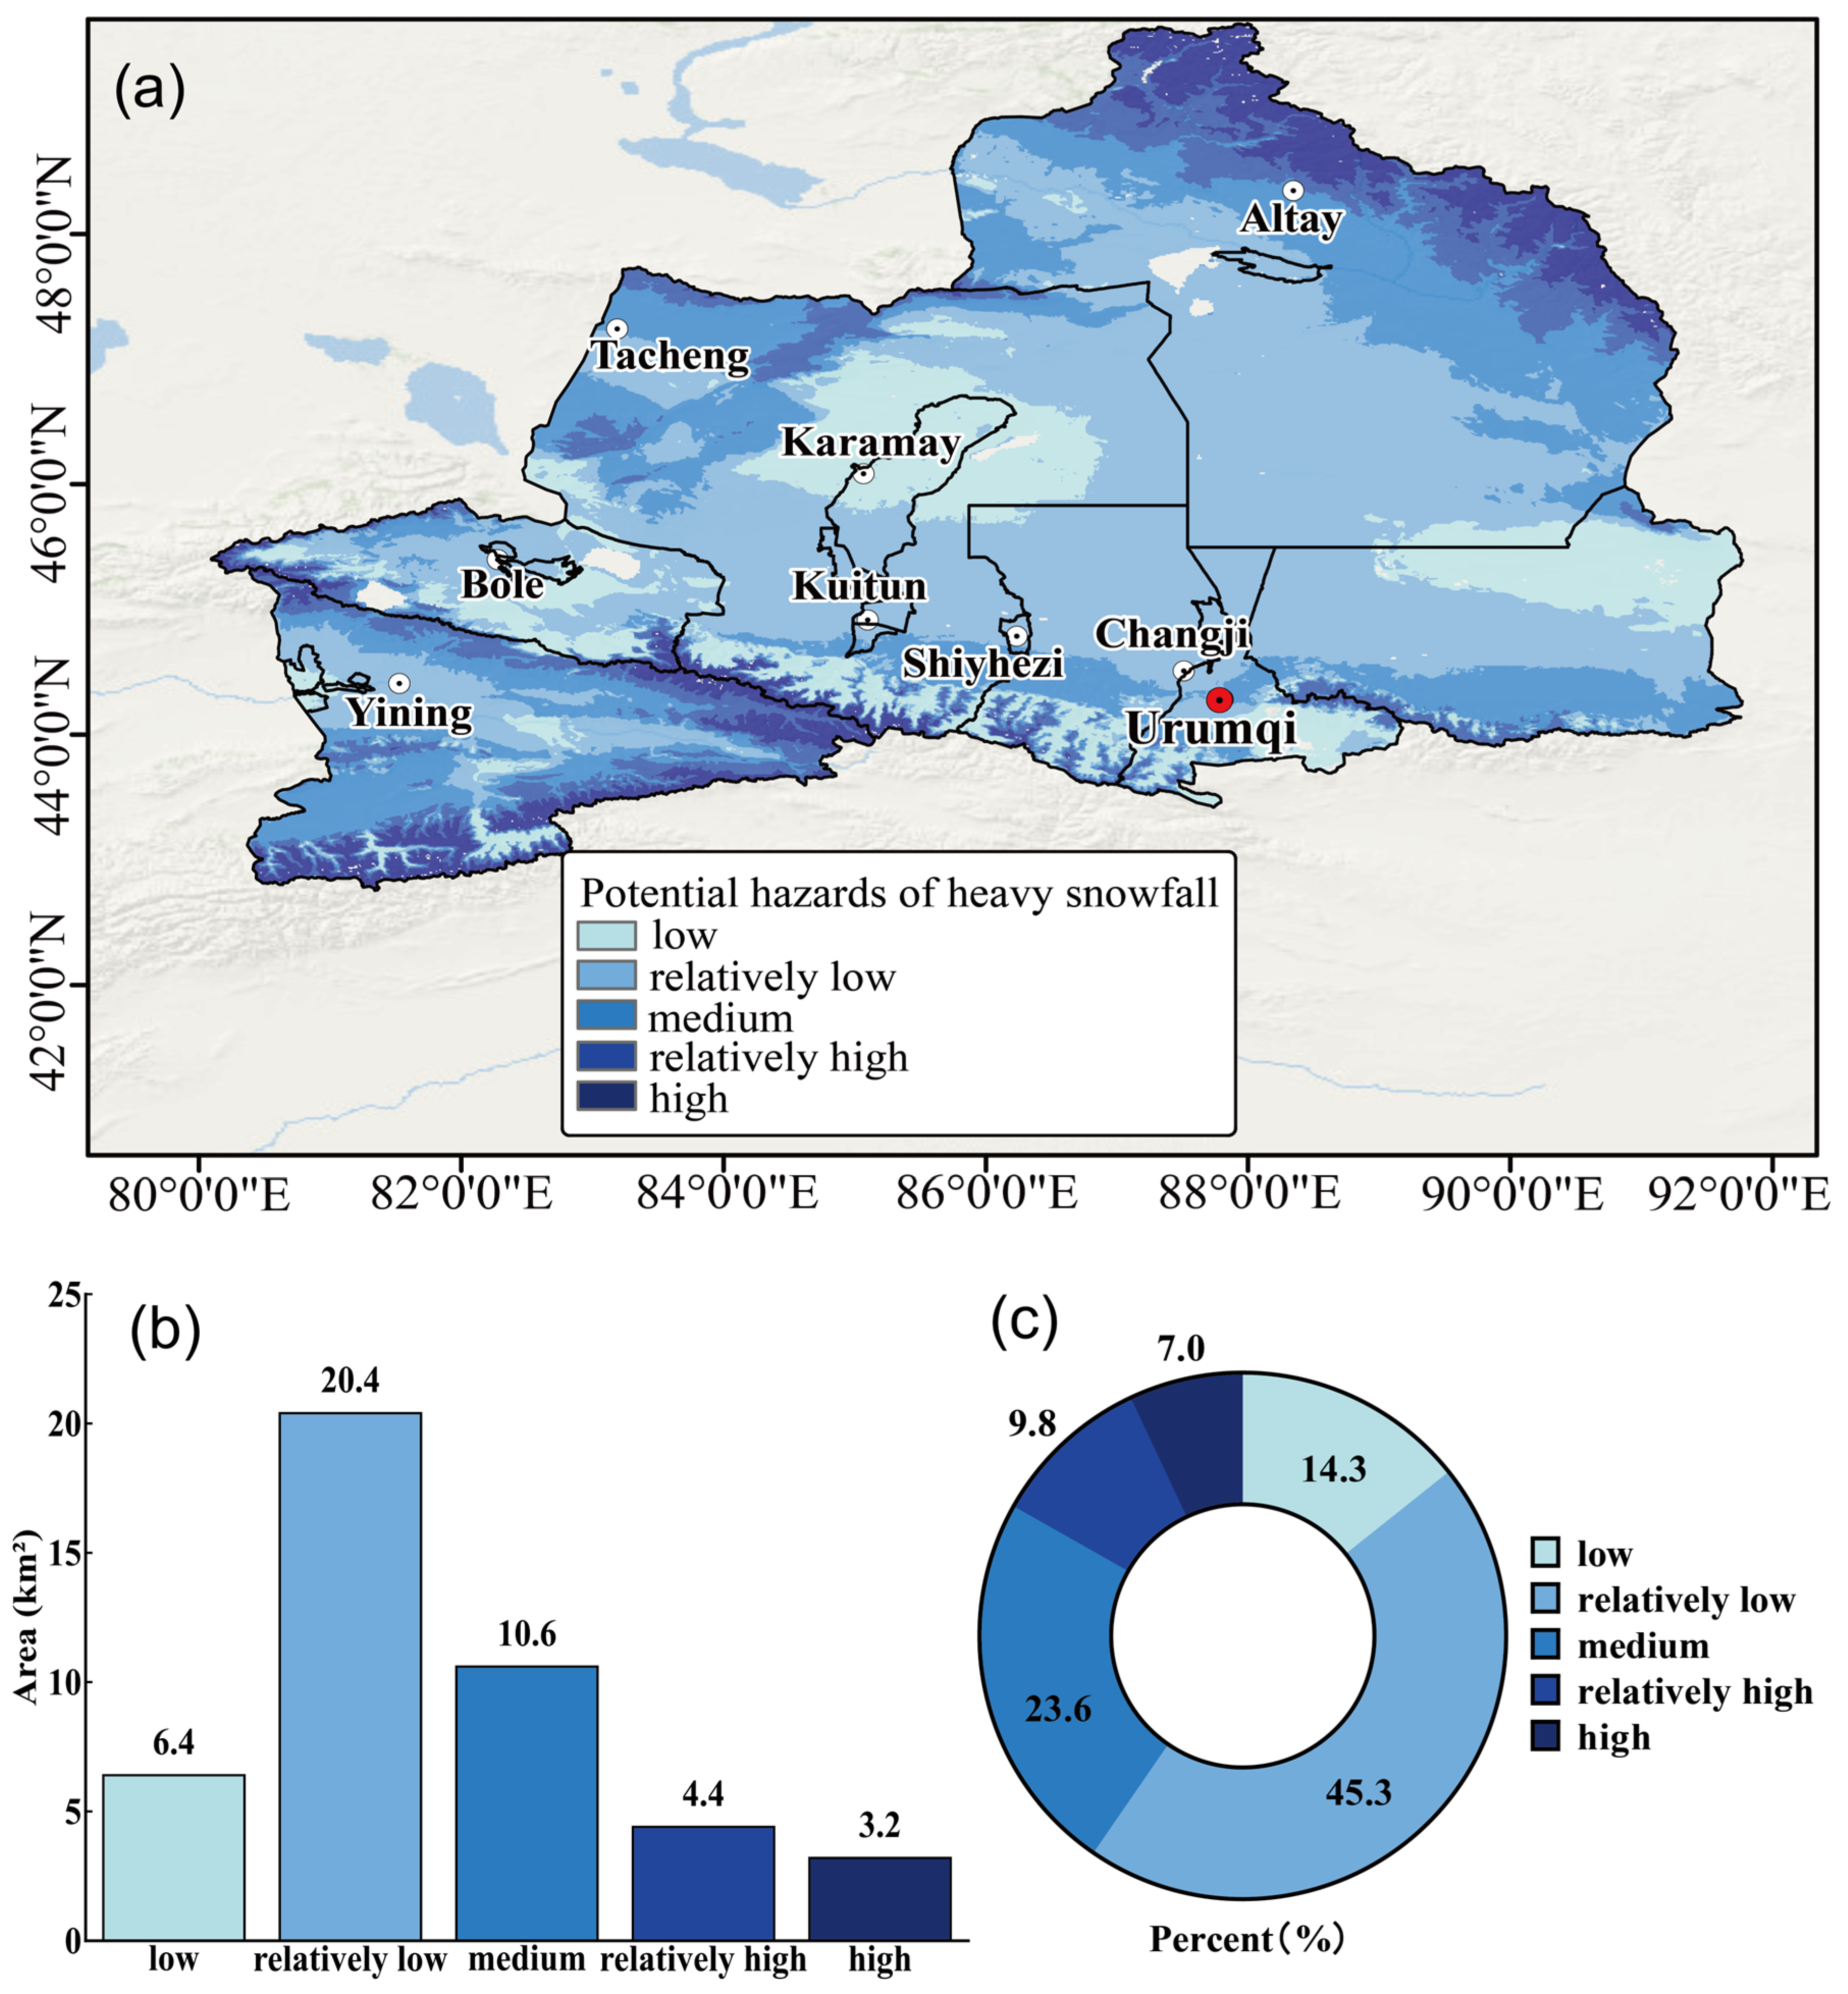
The variables to represent the long-term averages of SCD(avg), FSC(avg), SD(avg), slope, curvature, and snow stability, respectively. The spatial distribution of snow disaster hazard in Northwestern China, derived from Equation (15), is shown in Figure 4a. The hazard level is generally high, with the most severe areas concentrated in the Altay region and the northern and southern Tianshan Mountains. These include Habahe, Fuyun, and Qinghe counties in Altay; Horgos, Yining, Nileke, and Xinyuan counties in Ili; and Zhaosu and Tekes counties in the Tianshan foothills. Parts of Yumin and Emin counties in Tacheng also exhibit high hazard. Moderate hazard levels are found in the Ili River Valley and the northern foothills of the Eastern Tianshan Mountains, encompassing areas such as Yining City, western Nileke County, the valley region of Gongliu County, Kuitun City, Shihezi City, Urumqi City, and western Changji. The lowest hazard levels are associated with the Gurbantunggut Desert, spanning Karamay City, most of Toli County, eastern Changji, and the southern parts of Qinghe, Fuyun, and Fuhai counties.
Figure 4.
Spatial distribution of heavy snowfall hazard. (a) Spatial distribution of the classified heavy snowfall hazard index, with five levels: low, relatively low, medium, relatively high, and high. (b,c) The area and percentage of each level.
The quantitative distribution corresponding to the above spatial pattern is shown in Figure 4b,c. The bar chart indicates that the area of relatively low-risk zones is the largest, covering 204,000 km2 and accounting for 45.3% of the total region. Low-risk zones occupy approximately 64,000 km2, representing 14.3% of the area. In comparison, high-risk and relatively high-risk zones are more spatially concentrated, with areas of 32,000 km2 and 44,000 km2, respectively, and relatively small proportional extents. The pie chart further confirms that medium- to low-risk zones dominate the study area, collectively constituting approximately 83% of the total. In contrast, the high-risk and relatively high-risk zones account for a limited proportion of the total area but define the main mountainous hotspots requiring priority attention.
4.2.2. Potential Hazardousness of Blowing Snow Disasters
The hazard of wind-blown snow disasters was assessed using seven indicators: SCD(avg), average winter wind speed (WWS(avg)), surface roughness, snow density, terrain, slope, and vegetation coverage. These indicators were first normalized, and the processed data were then analyzed using the entropy weight method (Equations (6)–(9)) to calculate the information entropy and weight for each, as presented in Table 5.
Table 5.
Entropy weights of indicators for blowing snow disaster assessment.
As presented in Table 5, the information entropy values for the seven indicators range from 0.9028 to 0.9671. The SCD(avg) has the lowest entropy (0.9028) and consequently the highest weight, identifying it as the primary factor governing blowing snow disasters. WWS(avg), terrain, vegetation cover, and surface roughness also show considerable influence as important contributing factors. Based on the entropy-derived weights and Equation (12), the wind-blown snow hazard index was calculated as follows:
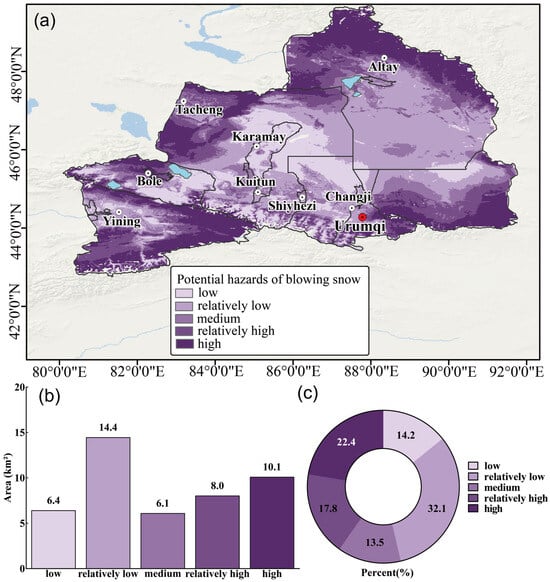
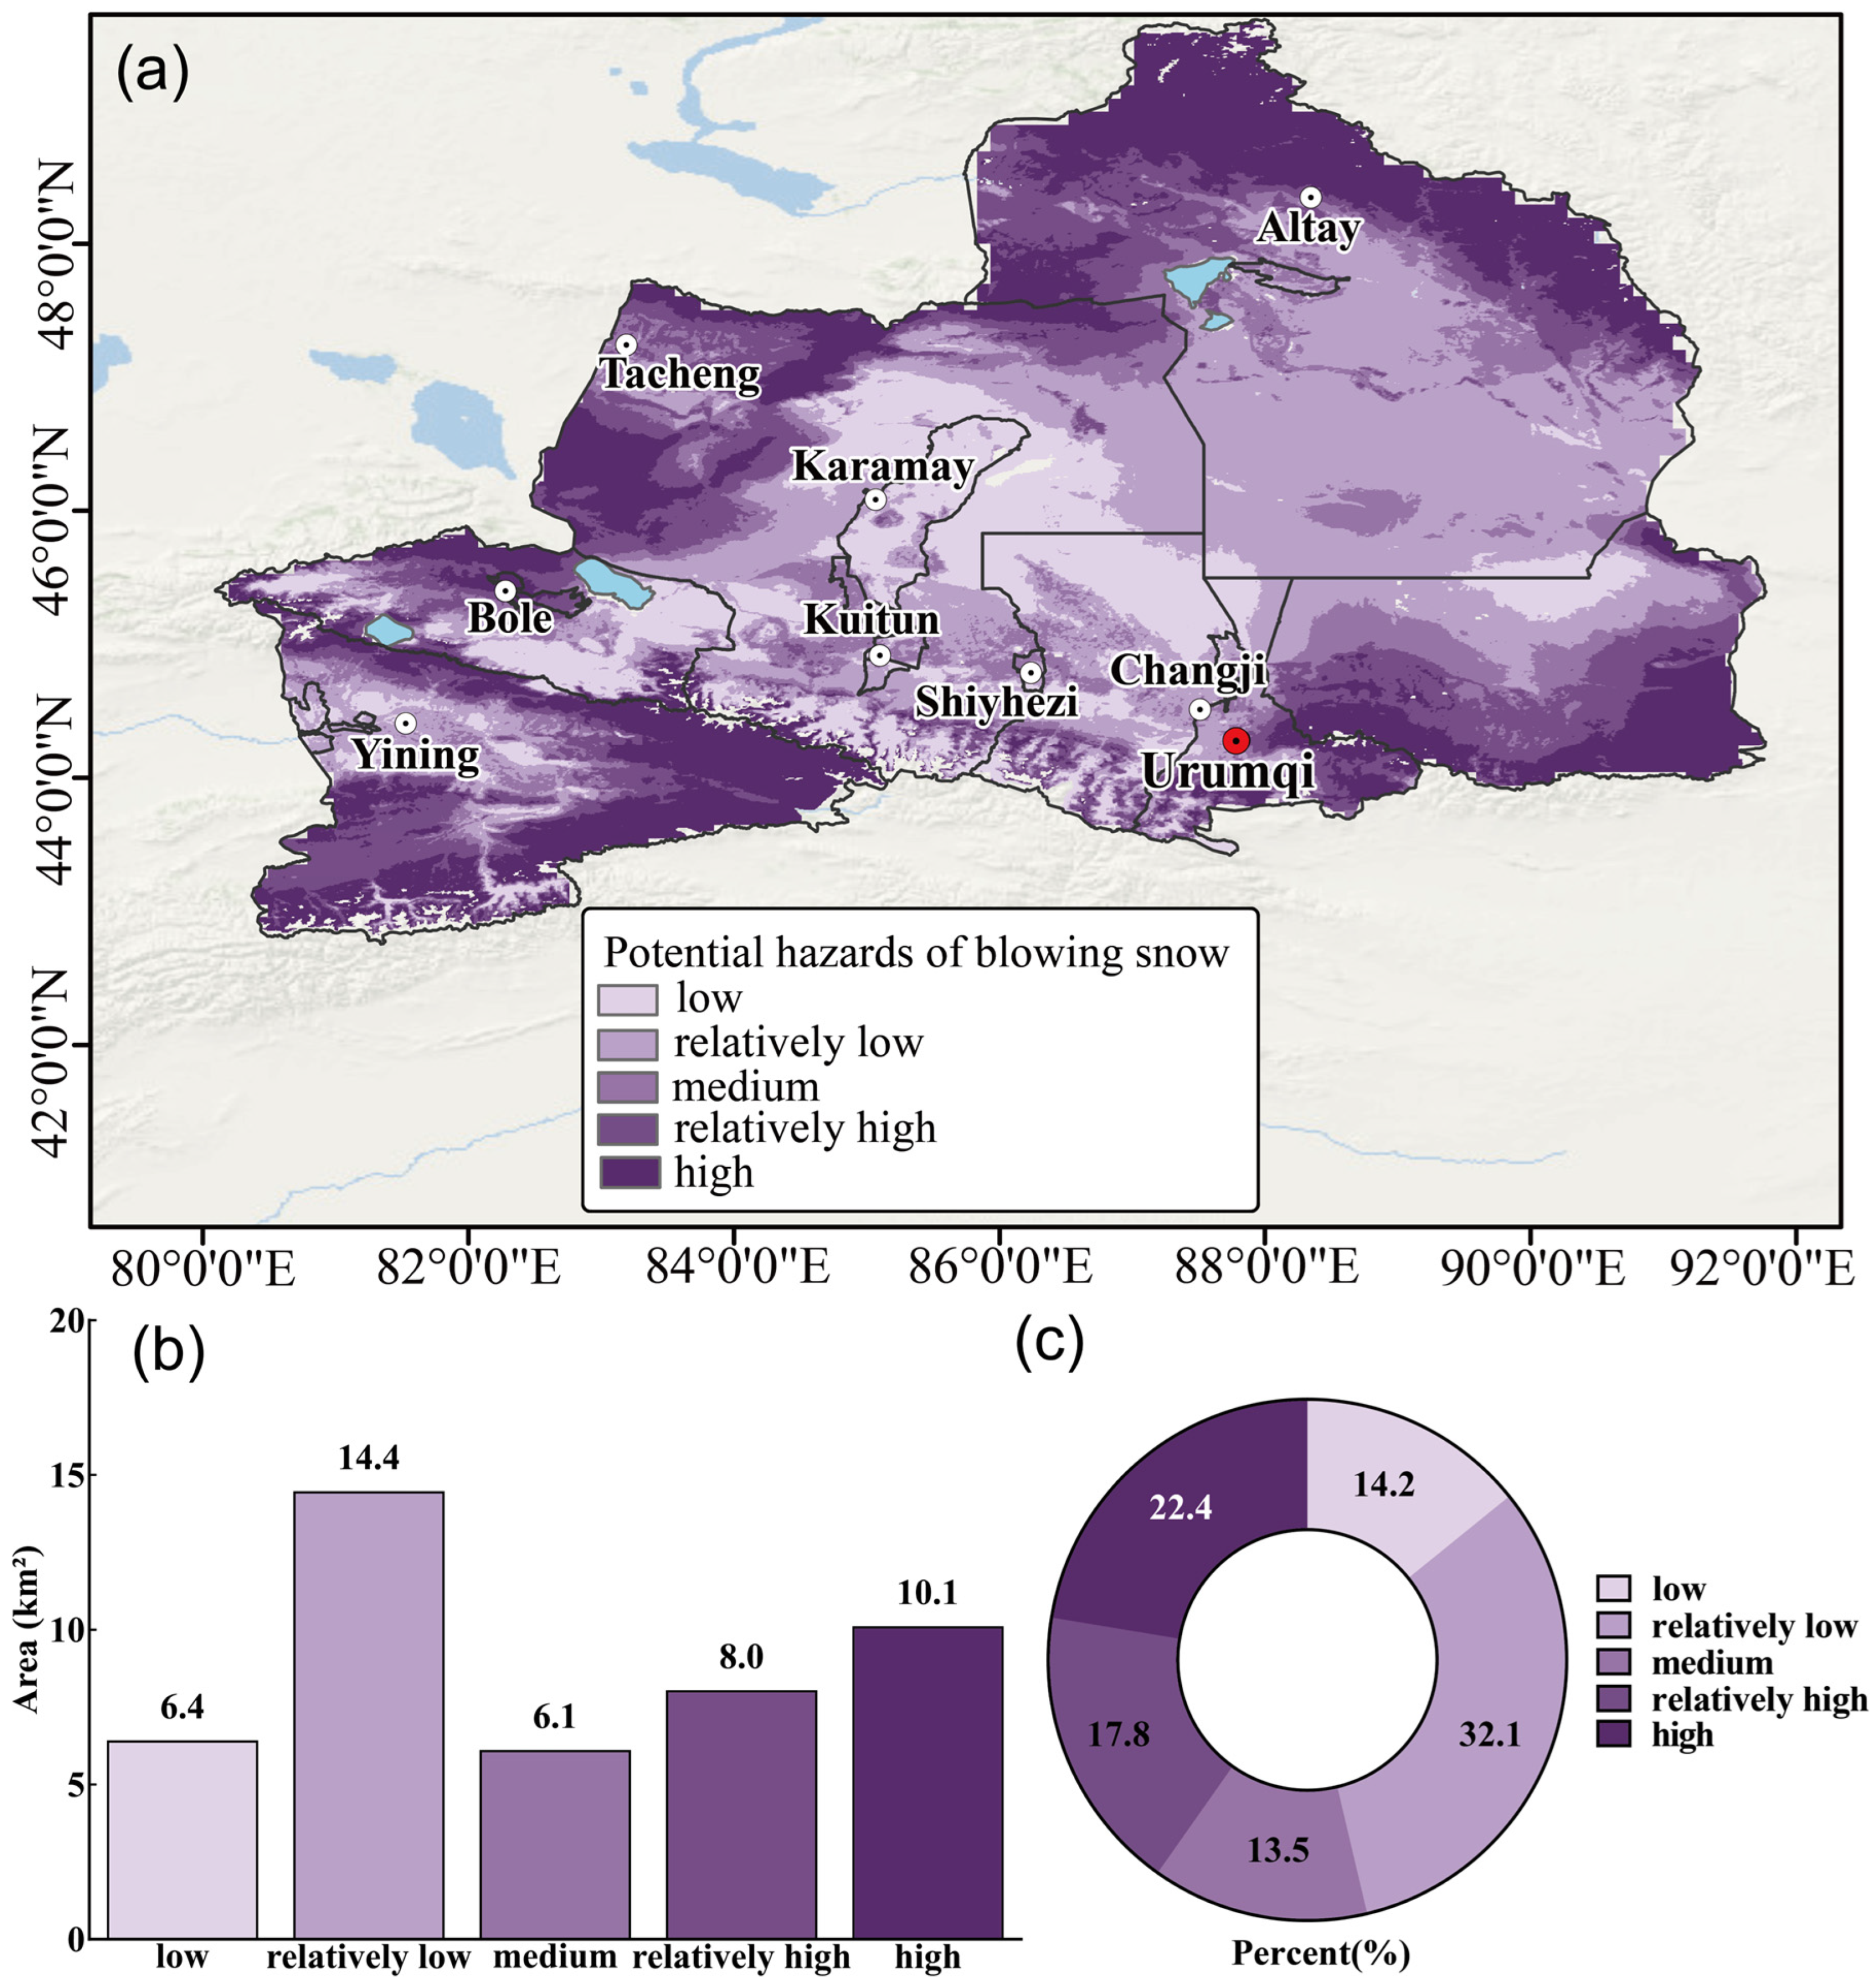
The variables to represent the SCD(avg), WWS(avg), surface roughness, snow density, terrain, slope, and vegetation coverage, respectively. Figure 5a displays the resulting wind-blown snow hazard map for Northwestern China, generated using Equation (16). The spatial pattern reveals that high-hazard areas are predominantly located in mountainous regions, including the Altay Mountains, the Tacheng region, Bortala Prefecture, and the Ili region. Specifically, these encompass Burqin, Jimunai, Fuyun, and Qinghe counties in Altay; Tacheng City, Emin, Yumin, and Toli counties in Tacheng; as well as Zhaosu County, southern Tekes, Nileke, and western Xinyuan in Ili. Additionally, the eastern parts of Changji and Urumqi exhibit the highest hazard levels. In contrast, hazard levels are relatively low in the Junggar Basin, home to the Gurbantunggut Desert, which spans areas including Karamay City, Hoboksar County, and eastern Toli County.
Figure 5.
Spatial distribution of blowing snow hazard. (a) Spatial distribution of the classified blowing snow hazard index, with five levels: low, relatively low, medium, relatively high, and high. (b,c) The area and percentage of each level.
The quantitative breakdown of hazard levels further elucidates this spatial structure (Figure 5b,c). The bar chart reveals that high-hazard and relatively high-hazard zones collectively occupy a substantial portion of the study area, accounting for 22.4% and 17.8% of the total region, which corresponds to approximately 101,000 km2 and 80,000 km2, respectively. In contrast, low-hazard and relatively low-hazard zones form the most extensive areal category, encompassing a combined 46.3% of Northwestern China or about 210,000 km2. The corresponding pie chart reinforces that elevated threat levels are concentrated in specific critical regions, and the larger high to relatively high proportion compared with heavy snowfall reflects the additional influence of wind corridors and exposed terrain. The most severe blowing snow hazards are therefore located mainly in the Altay and Tianshan mountainous systems, encompassing the Ili and Tacheng prefectures, the Altay region, and eastern Changji. In contrast, the vast, flat expanse of the Junggar Basin constitutes the dominant low-hazard baseline.
4.2.3. Potential Hazardousness of Avalanche
The avalanche hazard was characterized using seven indicators: SCD(avg), SD(avg), terrain, slope, land cover, vegetation cover, and historical records. These indicators were normalized and then processed using the entropy weight method to calculate their information entropy and weights, as presented in Table 6.
Table 6.
Entropy weights of indicators for avalanche assessment.
As presented in Table 6, the information entropy values for the seven indicators range from 0.9121 to 0.9671. The SD(avg) exhibits the lowest entropy (0.9121) and consequently carries the highest weight, establishing it as the primary factor governing avalanche hazard. Slope and the SCD(avg) are also identified as significant contributing factors. Integrating these entropy-derived weights with Equation (13) yields the following expression for the avalanche hazard index:
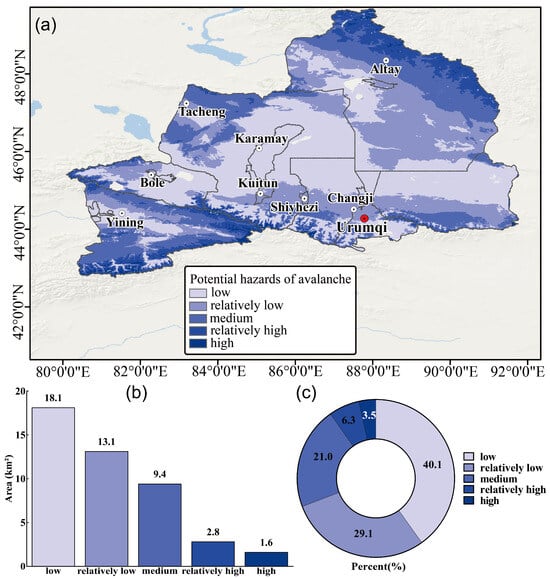
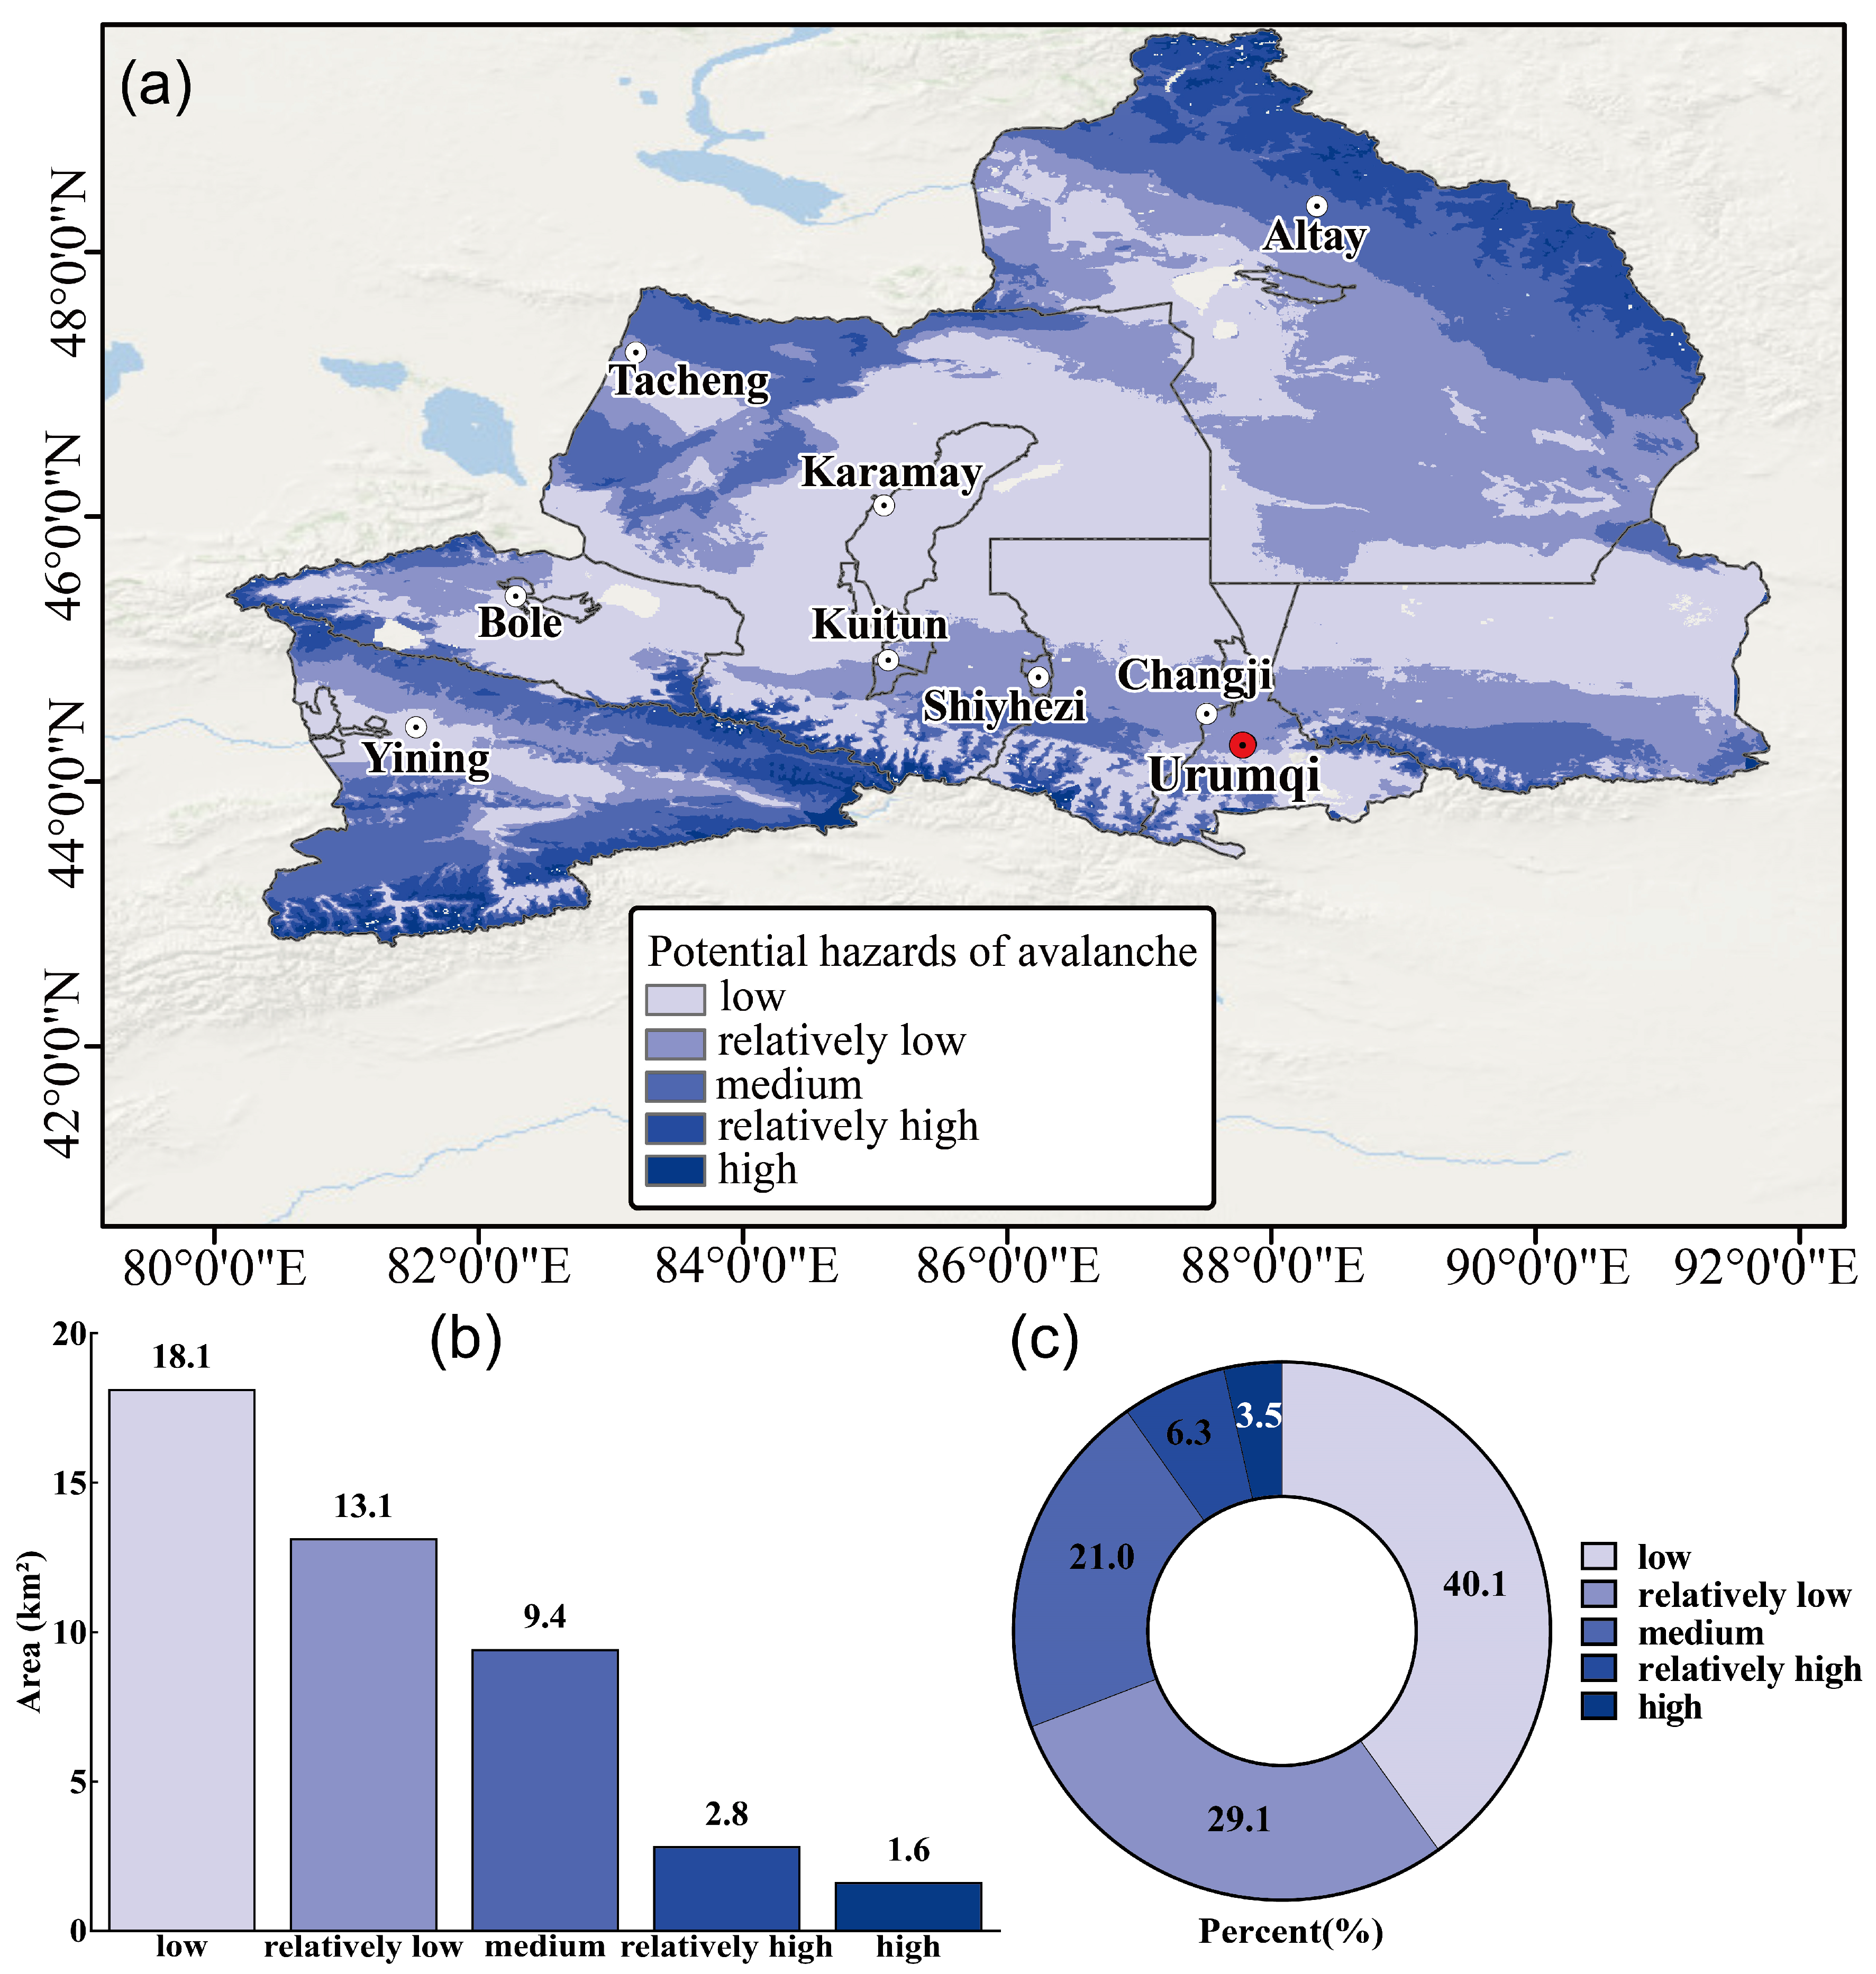
The variables Sa1 to Sa7 represent SCD(avg), SD(avg), terrain, slope, land cover, vegetation cover, and historical records, respectively. Application of equation (17) yields the avalanche hazard distribution map for Northwestern China (Figure 6a). The map reveals that the most severe avalanche hazard is concentrated within several extensive mountain belts. These include the southern foothills of the Altai Mountains, the northern and southern ranges of the Tianshan Mountains—which encompass the Ili River Valley—and parts of the Tacheng region. Within these broad zones, local hazard intensity peaks in specific high-relief terrain. For instance, exceptionally high probabilities are associated with the high-altitude zones, steep slopes, and gorges of Zhaosu County in the southern Tianshan, as well as with similar landscapes along the southern foothills of the Borokonu Mountains and the high-mountain valleys of the northern Tianshan foothills. Key administrative areas within these high-hazard belts include the northern parts of Altay City, Burqin, Habahe, Fuyun, and Qinghe counties in the Altay region; Xinyuan, Nileke, and Gongliu counties in the Ili River Valley; and parts of the Tacheng region. A secondary zone of high hazard extends along the Eastern Tianshan Mountains, affecting urban areas such as Kuitun City and Changji City, as well as the southern mountainous areas of Urumqi.
Figure 6.
Spatial distribution of avalanche hazard. (a) Spatial distribution of the classified avalanche hazard index, with five levels: low, relatively low, medium, relatively high, and high. (b,c) The area and percentage of each level.
The spatial structure described above is further clarified through a quantitative breakdown of hazard levels (Figure 6b,c). The bar chart reveals that areas classified as high and relatively high avalanche hazard are spatially concentrated yet limited in extent, collectively accounting for only 9.8% of the total study area, which corresponds to approximately 44,000 km2. In stark contrast, zones of low and relatively low hazard dominate the landscape, encompassing nearly 70% of Northwestern China, with an area of about 312,000 km2. The accompanying pie chart visually underscores this disparity, highlighting that the severe hazard is heavily concentrated within a small fraction of the region, primarily corresponding to the steep, high-altitude terrain of the Altay and Tianshan mountainous systems, including parts of the Ili and the Altay region. Although the absolute area of high avalanche threat is limited, the concentration of steep terrain and exposed road or settlement corridors makes these mountain zones important targets for local mitigation.
4.3. Comprehensive Risk Level Classification for Snow Disasters
When constructing a road snow disaster risk assessment model for the Northern Frontier region, the potential hazards of snow accumulation, wind-blown snow, and avalanches were comprehensively considered. According to Equations (6)–(9), the information entropy and indicator weights shown in Table 7 can be calculated. According to Equation (14), the weights for the potential hazards of snow accumulation disasters, wind-blown snow disasters, and avalanche disasters are assigned as 0.41, 0.37, and 0.22, respectively. The risk level of snow disasters in the Northern Frontier is the highest, the risk level of wind-blown snow disasters is relatively the lowest, and the risk level of avalanche disasters is intermediate between the two, which is consistent with the results of the proportion of potential risk levels for the three major snow disasters mentioned above and thereby construct a comprehensive risk assessment model for snow disasters, which can be expressed as Equation (18).
Table 7.
Entropy weights of indicators for comprehensive risk evaluation of snow disasters.
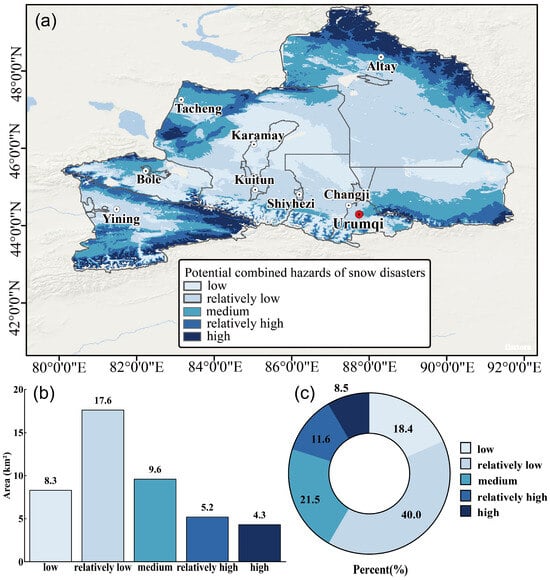
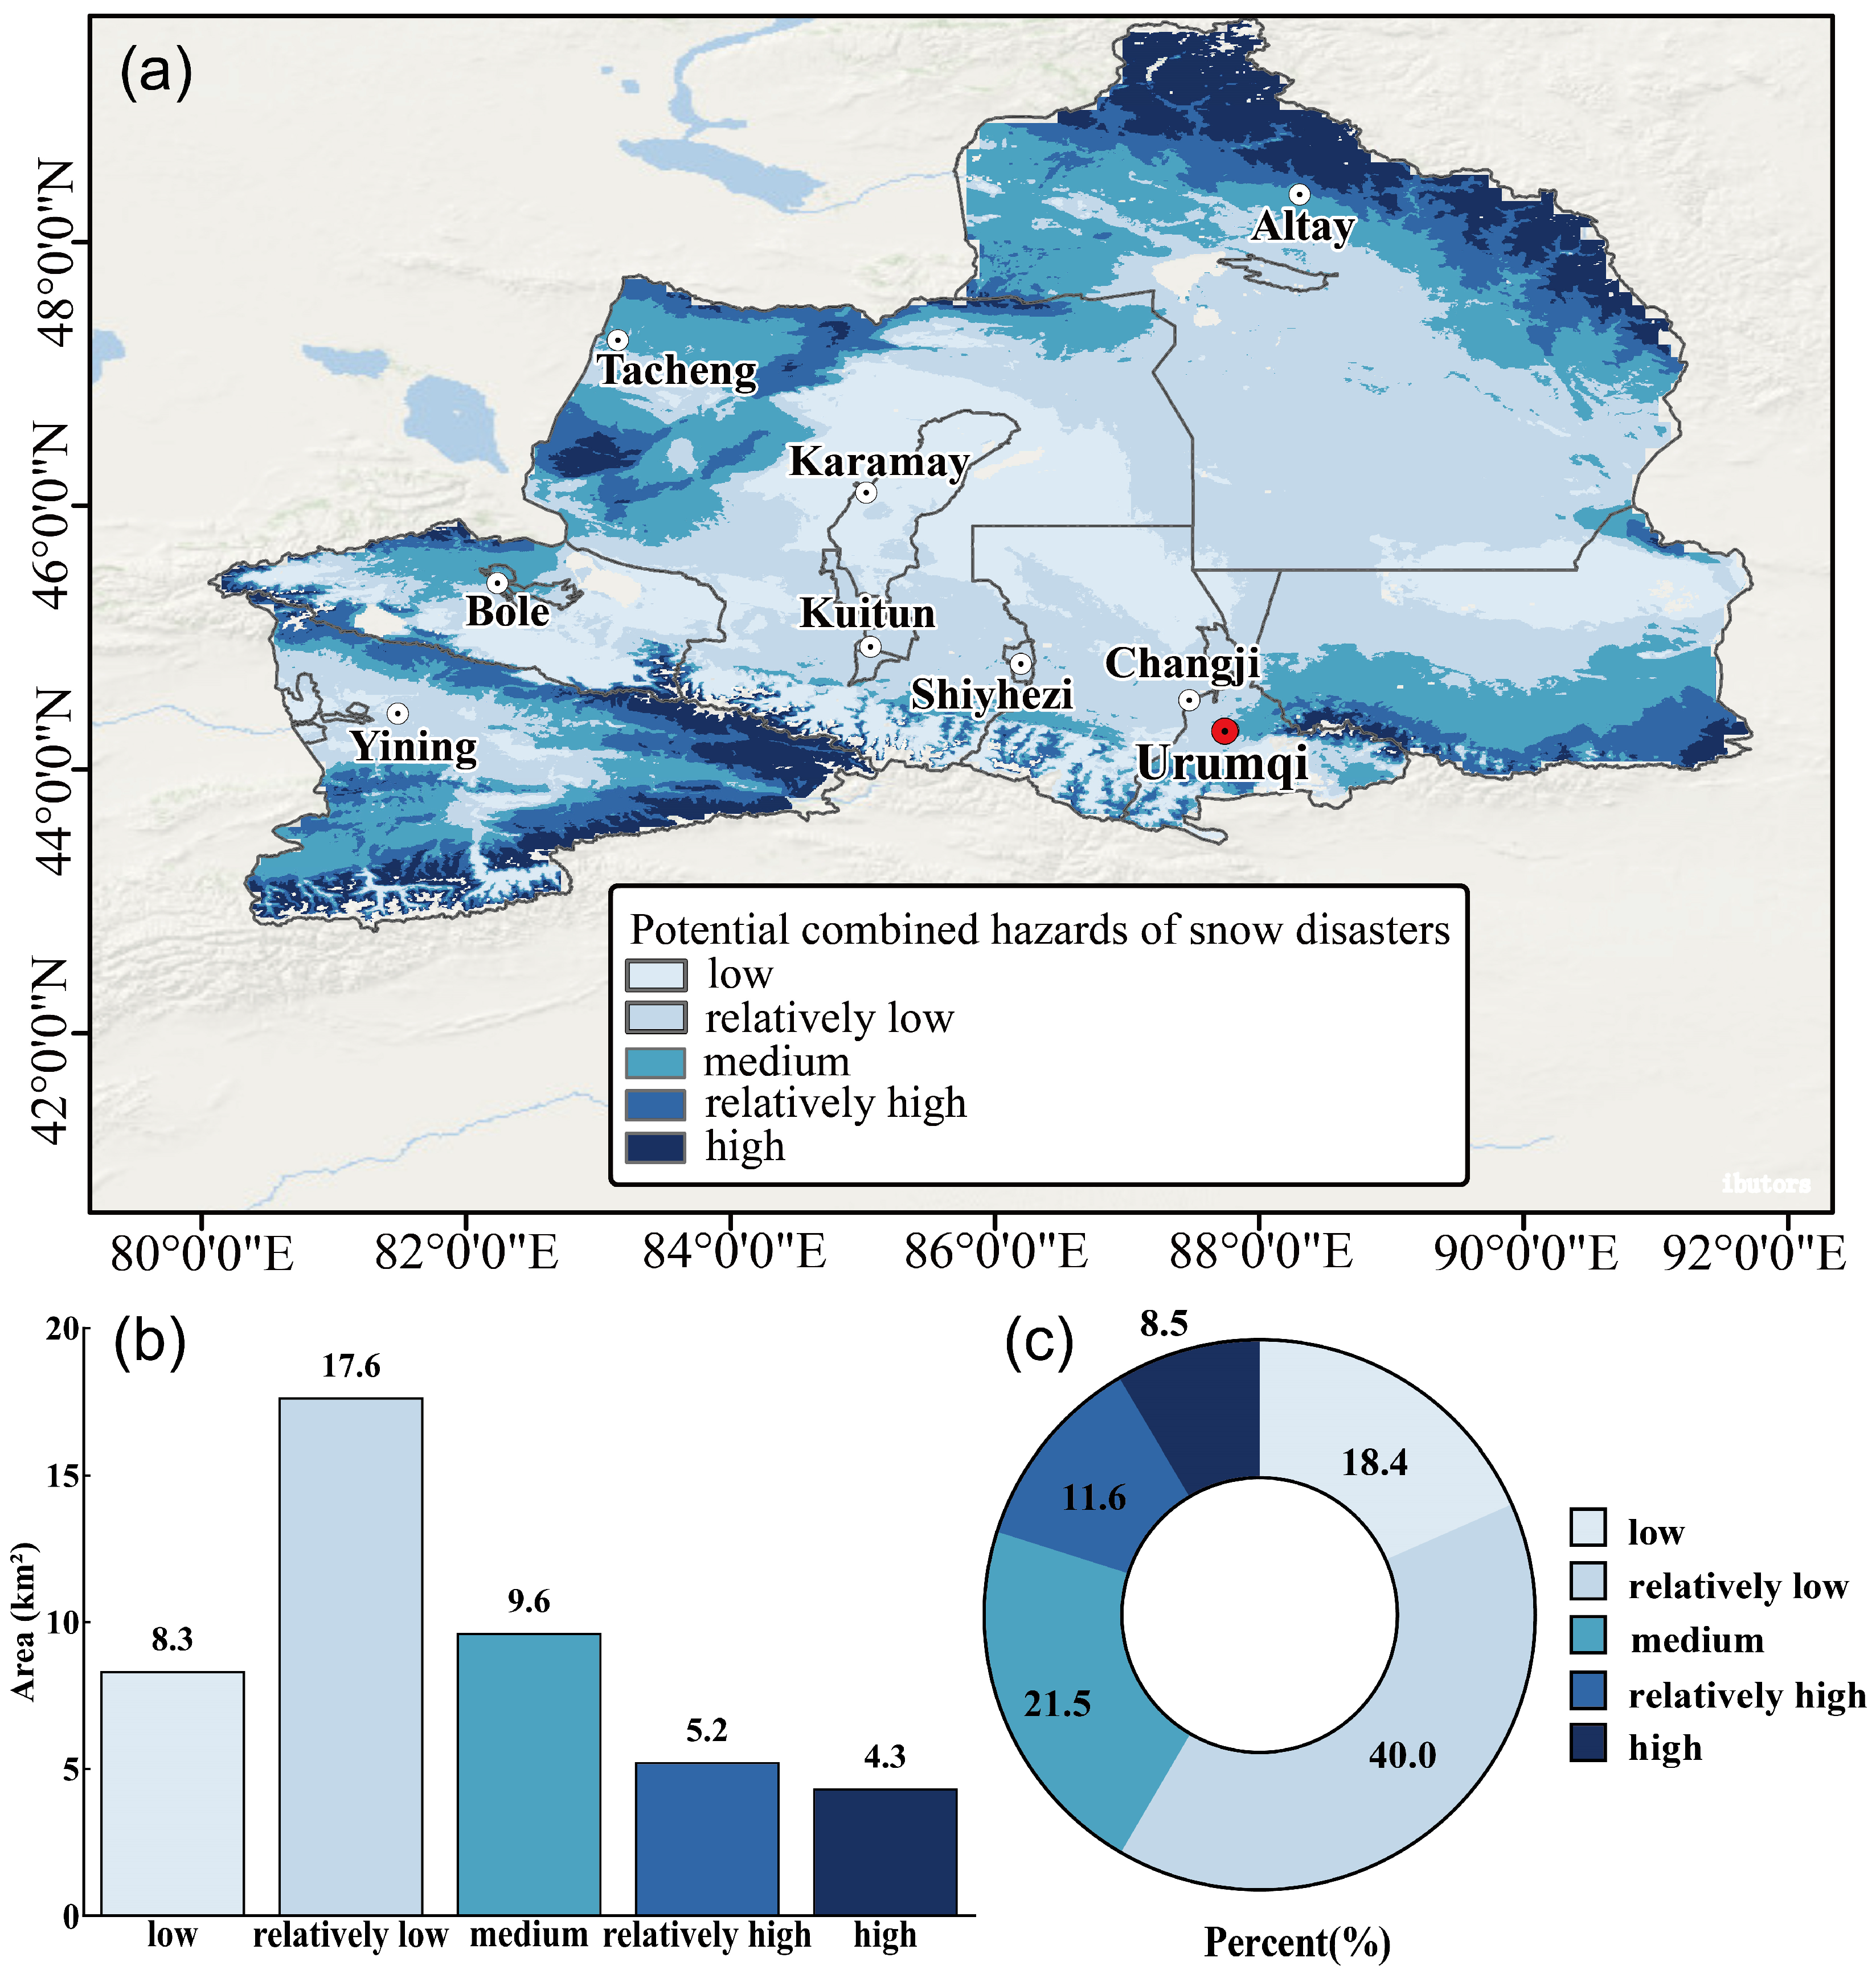
In the Equation (18), , , and represent the normalized heavy snowfall, blowing snow, and avalanche hazard indices, respectively. The spatial distribution of the comprehensive risk assessment for snow disasters in the Northwestern China region can be calculated using this formula. The percentile method is employed to establish thresholds for classifying snow disaster risk levels, dividing the comprehensive risk of snow disasters into five intervals, as shown in Figure 7a. The regions with the highest comprehensive risk of snow disasters in the Northwestern China region are primarily distributed across three major areas: the Altay Mountains, the Ili River Valley, and the Tacheng region, concentrated in Altay City, Habahe County, Fuyun County, Qinghe County, Tacheng City, Yumin County, Toli County, Nierke County, and Xinyuan County; the counties and cities in the funnel-shaped region of the Ili River Valley, such as Horgos City, Horgos County, and the Chabuqiaer Xibo Autonomous County, as well as Toli County in the Tacheng Region and the southern mountainous areas of Changji in the eastern section of the Tianshan Mountains, have the next highest snow disaster risk. The risk is relatively low in the Junggar Basin region, including Hebuqixi County, Karamay City, Shihezi City, the western part of Changji City, and Urumqi.
Figure 7.
Comprehensive snow disaster risk. (a) Spatial distribution of the classified comprehensive risk index, with five levels: low, relatively low, medium, relatively high, and high. (b,c) The area and percentage of each level.
The quantitative distribution of the combined snow disaster risk levels further substantiates this spatial pattern (Figure 7b,c). The bar chart indicates that high-risk zones constitute 8.5% of the total study area, covering approximately 43,000 km2, while relatively high-risk zones account for 11.6% or about 52,000 km2. Medium-risk areas represent 21.5%, with an extent of 96,000 km2. The accompanying pie chart confirms this hierarchical structure: the expansive low-risk background centered in the Junggar Basin forms the areal majority, whereas the high-risk and relatively high-risk zones are concentrated in the Altai Mountains, the Ili River Valley, and the Tacheng region, indicating that monitoring and mitigation can be spatially prioritized rather than applied uniformly across the whole region.
5. Discussion
5.1. Model Evaluation
This paper selects multi-source remote sensing data, topographic data, and auxiliary data as risk factors for road snow disasters and conducts a macro-level assessment and analysis of snow disaster risks in Northwestern China. Of course, some common machine learning models also assess road disaster risks, such as landslides and mudslides, which are based on large-scale field disaster data for accuracy assessment and validation. These models typically use metrics like accuracy and error rates, requiring significant computational resources and time for training and optimization; considering the spatial generalization of snow disasters, they cannot be quantified spatially like geological disasters, which may affect the interpretability and accuracy of the assessment. Therefore, this study employed the entropy weight method to determine the weights of 16 factors across four dimensions, assessing the potential risks of snow disaster types in the study area. Subsequently, the entropy weight method was used to measure the contribution of each snow disaster type to the comprehensive snow disaster risk, effectively addressing multiple linearity issues, enhancing model stability and predictive performance, and thereby constructing a comprehensive snow disaster risk assessment model. Comparison with related studies indicates that the assessment results are generally consistent with earlier published work [17,37,38,39], while the present framework differs by integrating multiple snow-hazard types, infrastructure exposure, spatially explicit risk zoning, and field-based validation in one regional assessment (Table 8).
Table 8.
Main differences between existing snow disaster assessments and the present study.
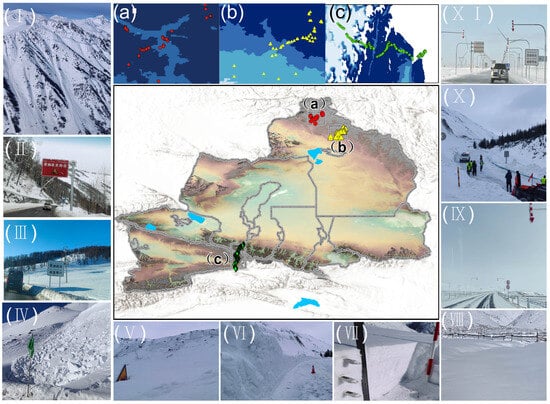
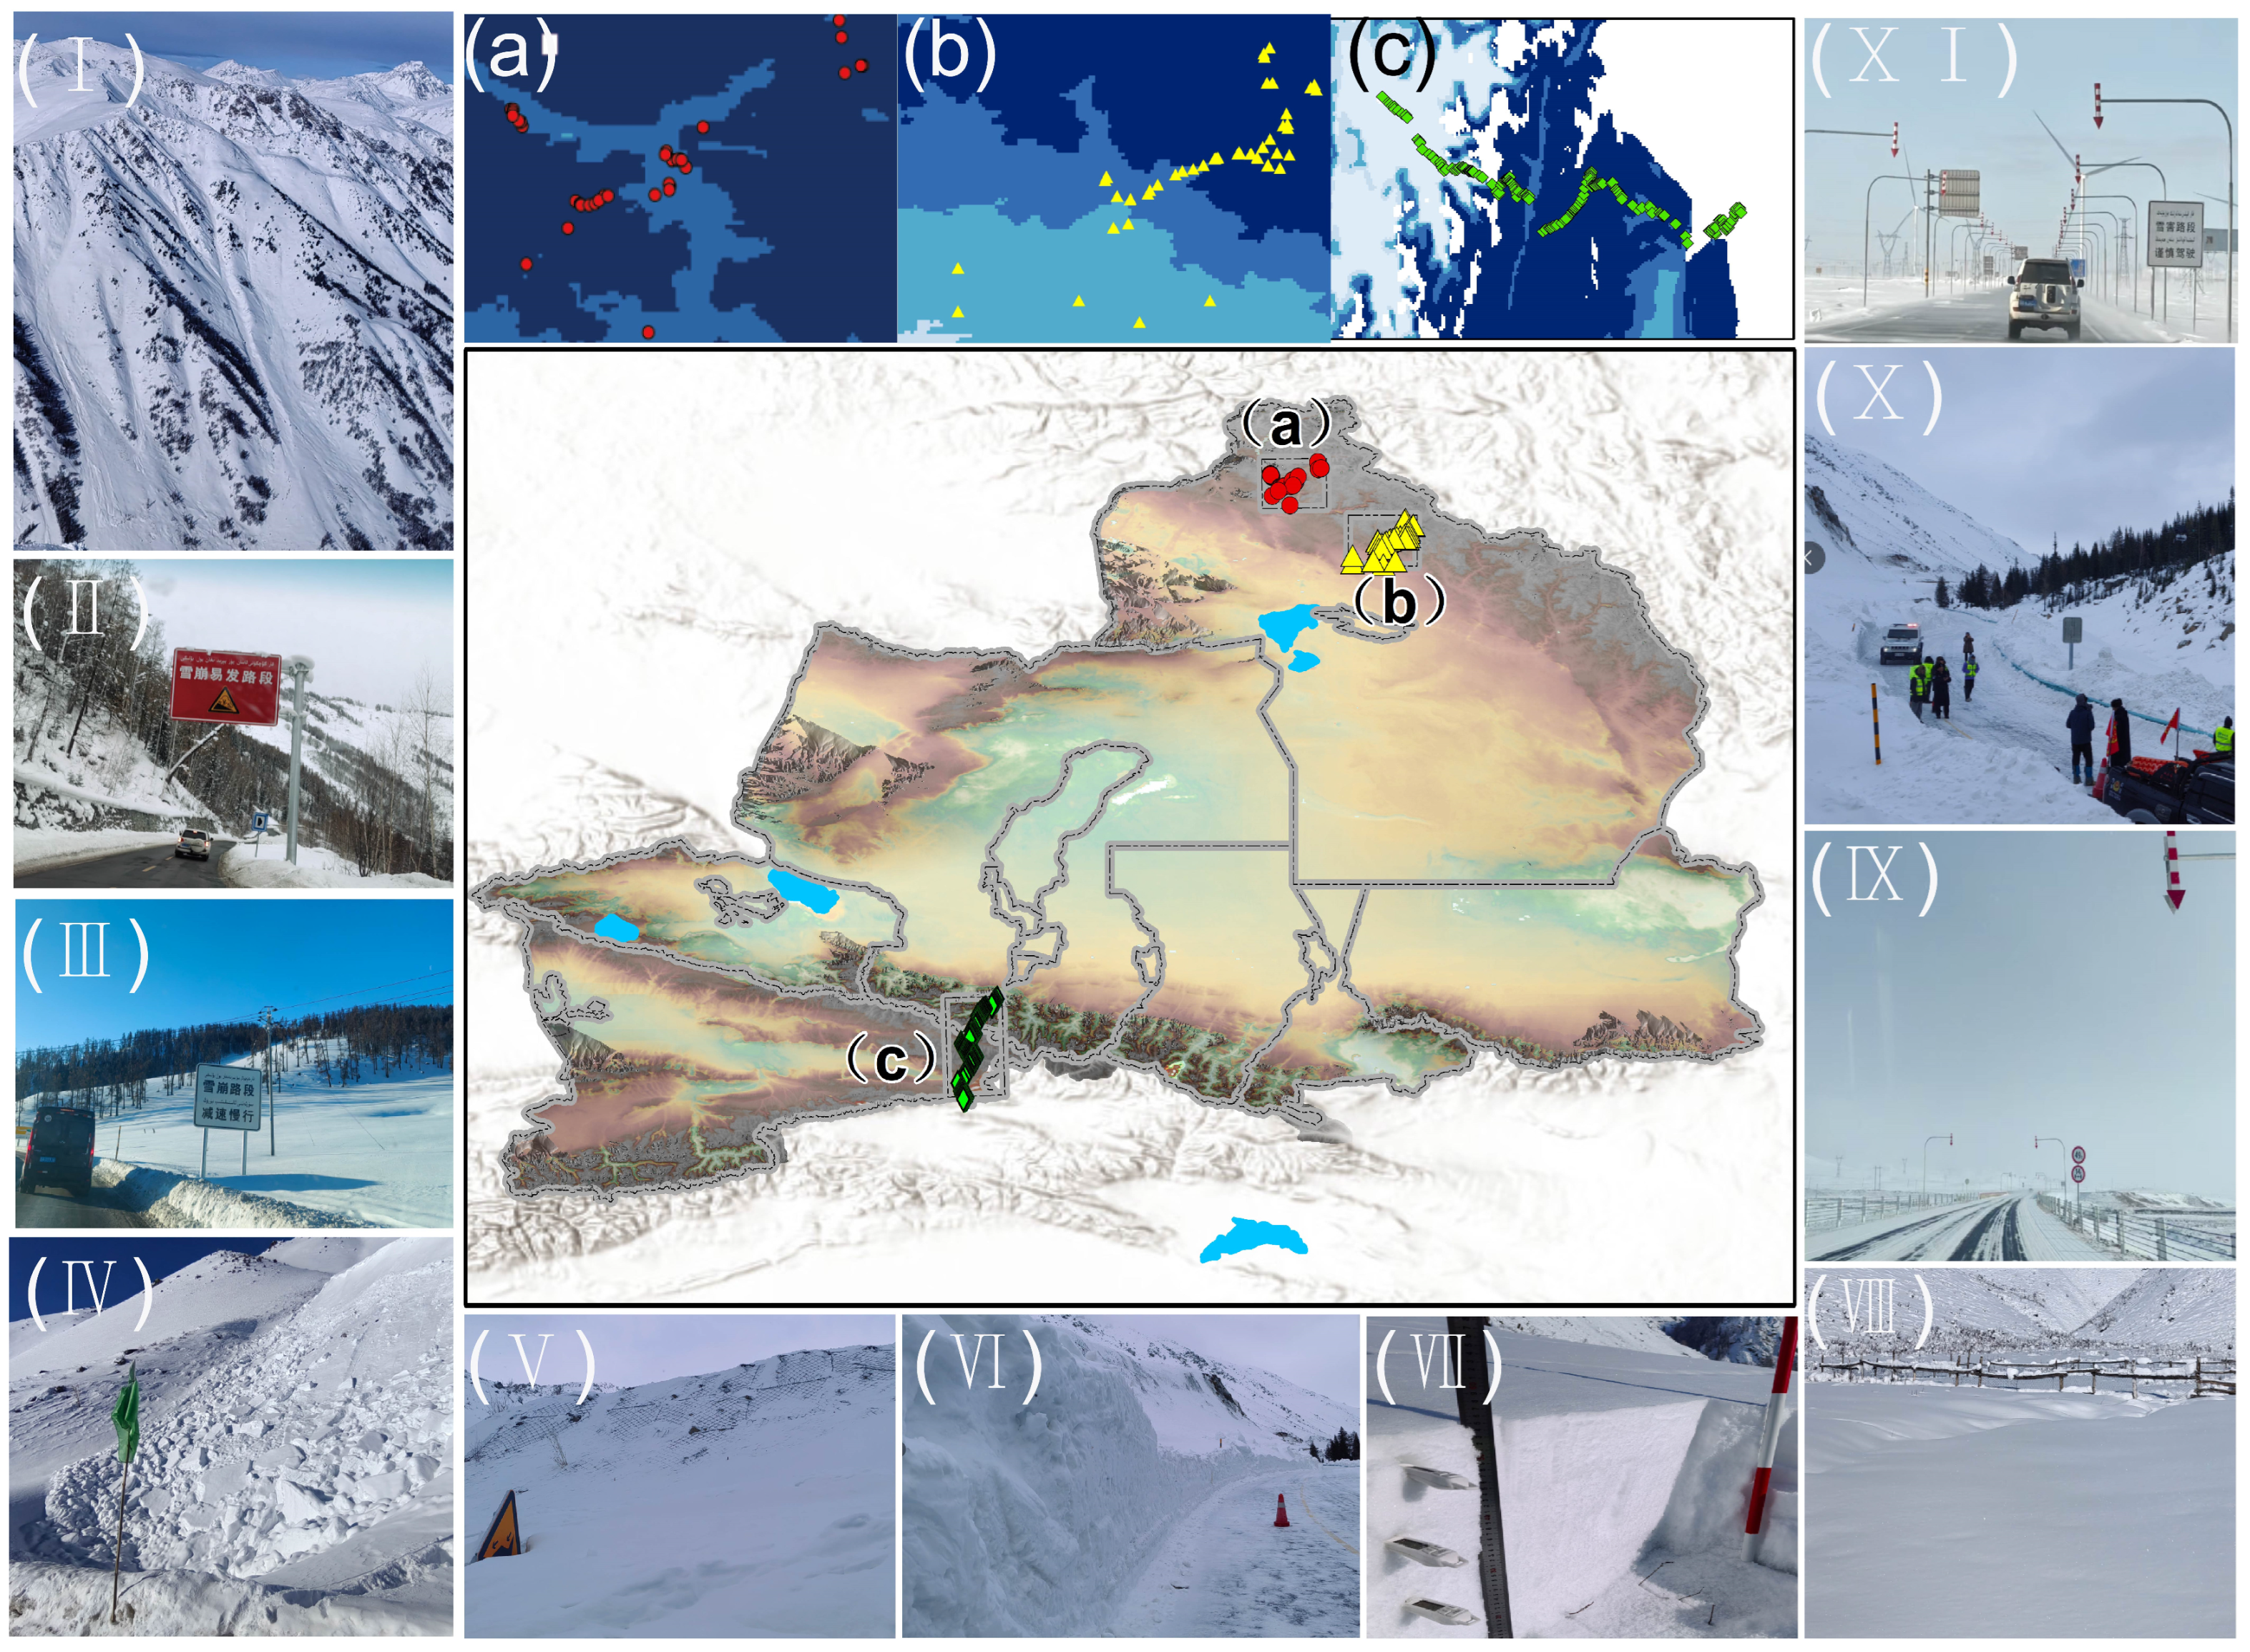
During November 2025 and January 2026, the research team conducted winter field surveys along three critical transects in Northwestern China X852 and G681 within the Altay Prefecture and G217 traversing the Tianshan corridor (Figure 8). A total of 331 snow disaster sites were geolocated and classified. Along X852, 42 sites were identified, 95.0% of which fell within high-hazard or relatively high-hazard zones. Along G681, 107 of the 110 documented sites were classified as high or relatively high hazard, yielding a proportion of 96.4%. Along G217, 179 sites were documented: 59.7% in high-hazard or relatively high-hazard zones, 13.4% in medium-hazard zones, and 26.9% in relatively low or low-hazard zones (Table 9). The large proportion of surveyed sites falling within high or relatively high classes indicates strong spatial agreement between recent disaster observations and the mapped regional risk pattern. Because the snow-cover and snow-depth products are used here as long-term background indicators, this comparison evaluates the spatial consistency of the risk zoning rather than the reconstruction of snow conditions during the 2025–2026 winter.
Figure 8.
Surveyed snow disaster sites. (a) Survey of 42 snow disaster sites along the X852 road in the Hemu direction of the Altay region. (b) Survey of 110 snow disaster sites along the G681 road in the XiaoDonggou direction of the Altay region. (c) Survey of 179 snow disaster sites along the G217 road in the Ili Tianshan region. The field investigations were conducted by the research group over a total of 19 days in November 2025 and January 2026. Panels (I–IV) show survey photographs of avalanche sites, (V–VIII) show survey photographs of heavy snowfall sites, and (IX–XI) show survey photographs of blowing snow sites.
Table 9.
Quantity and proportion of snow disaster sites by surveyed route.
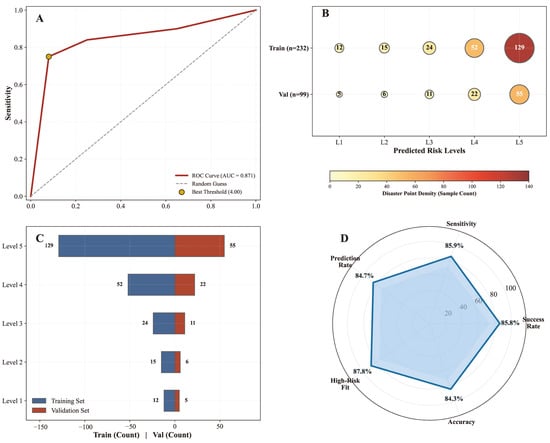
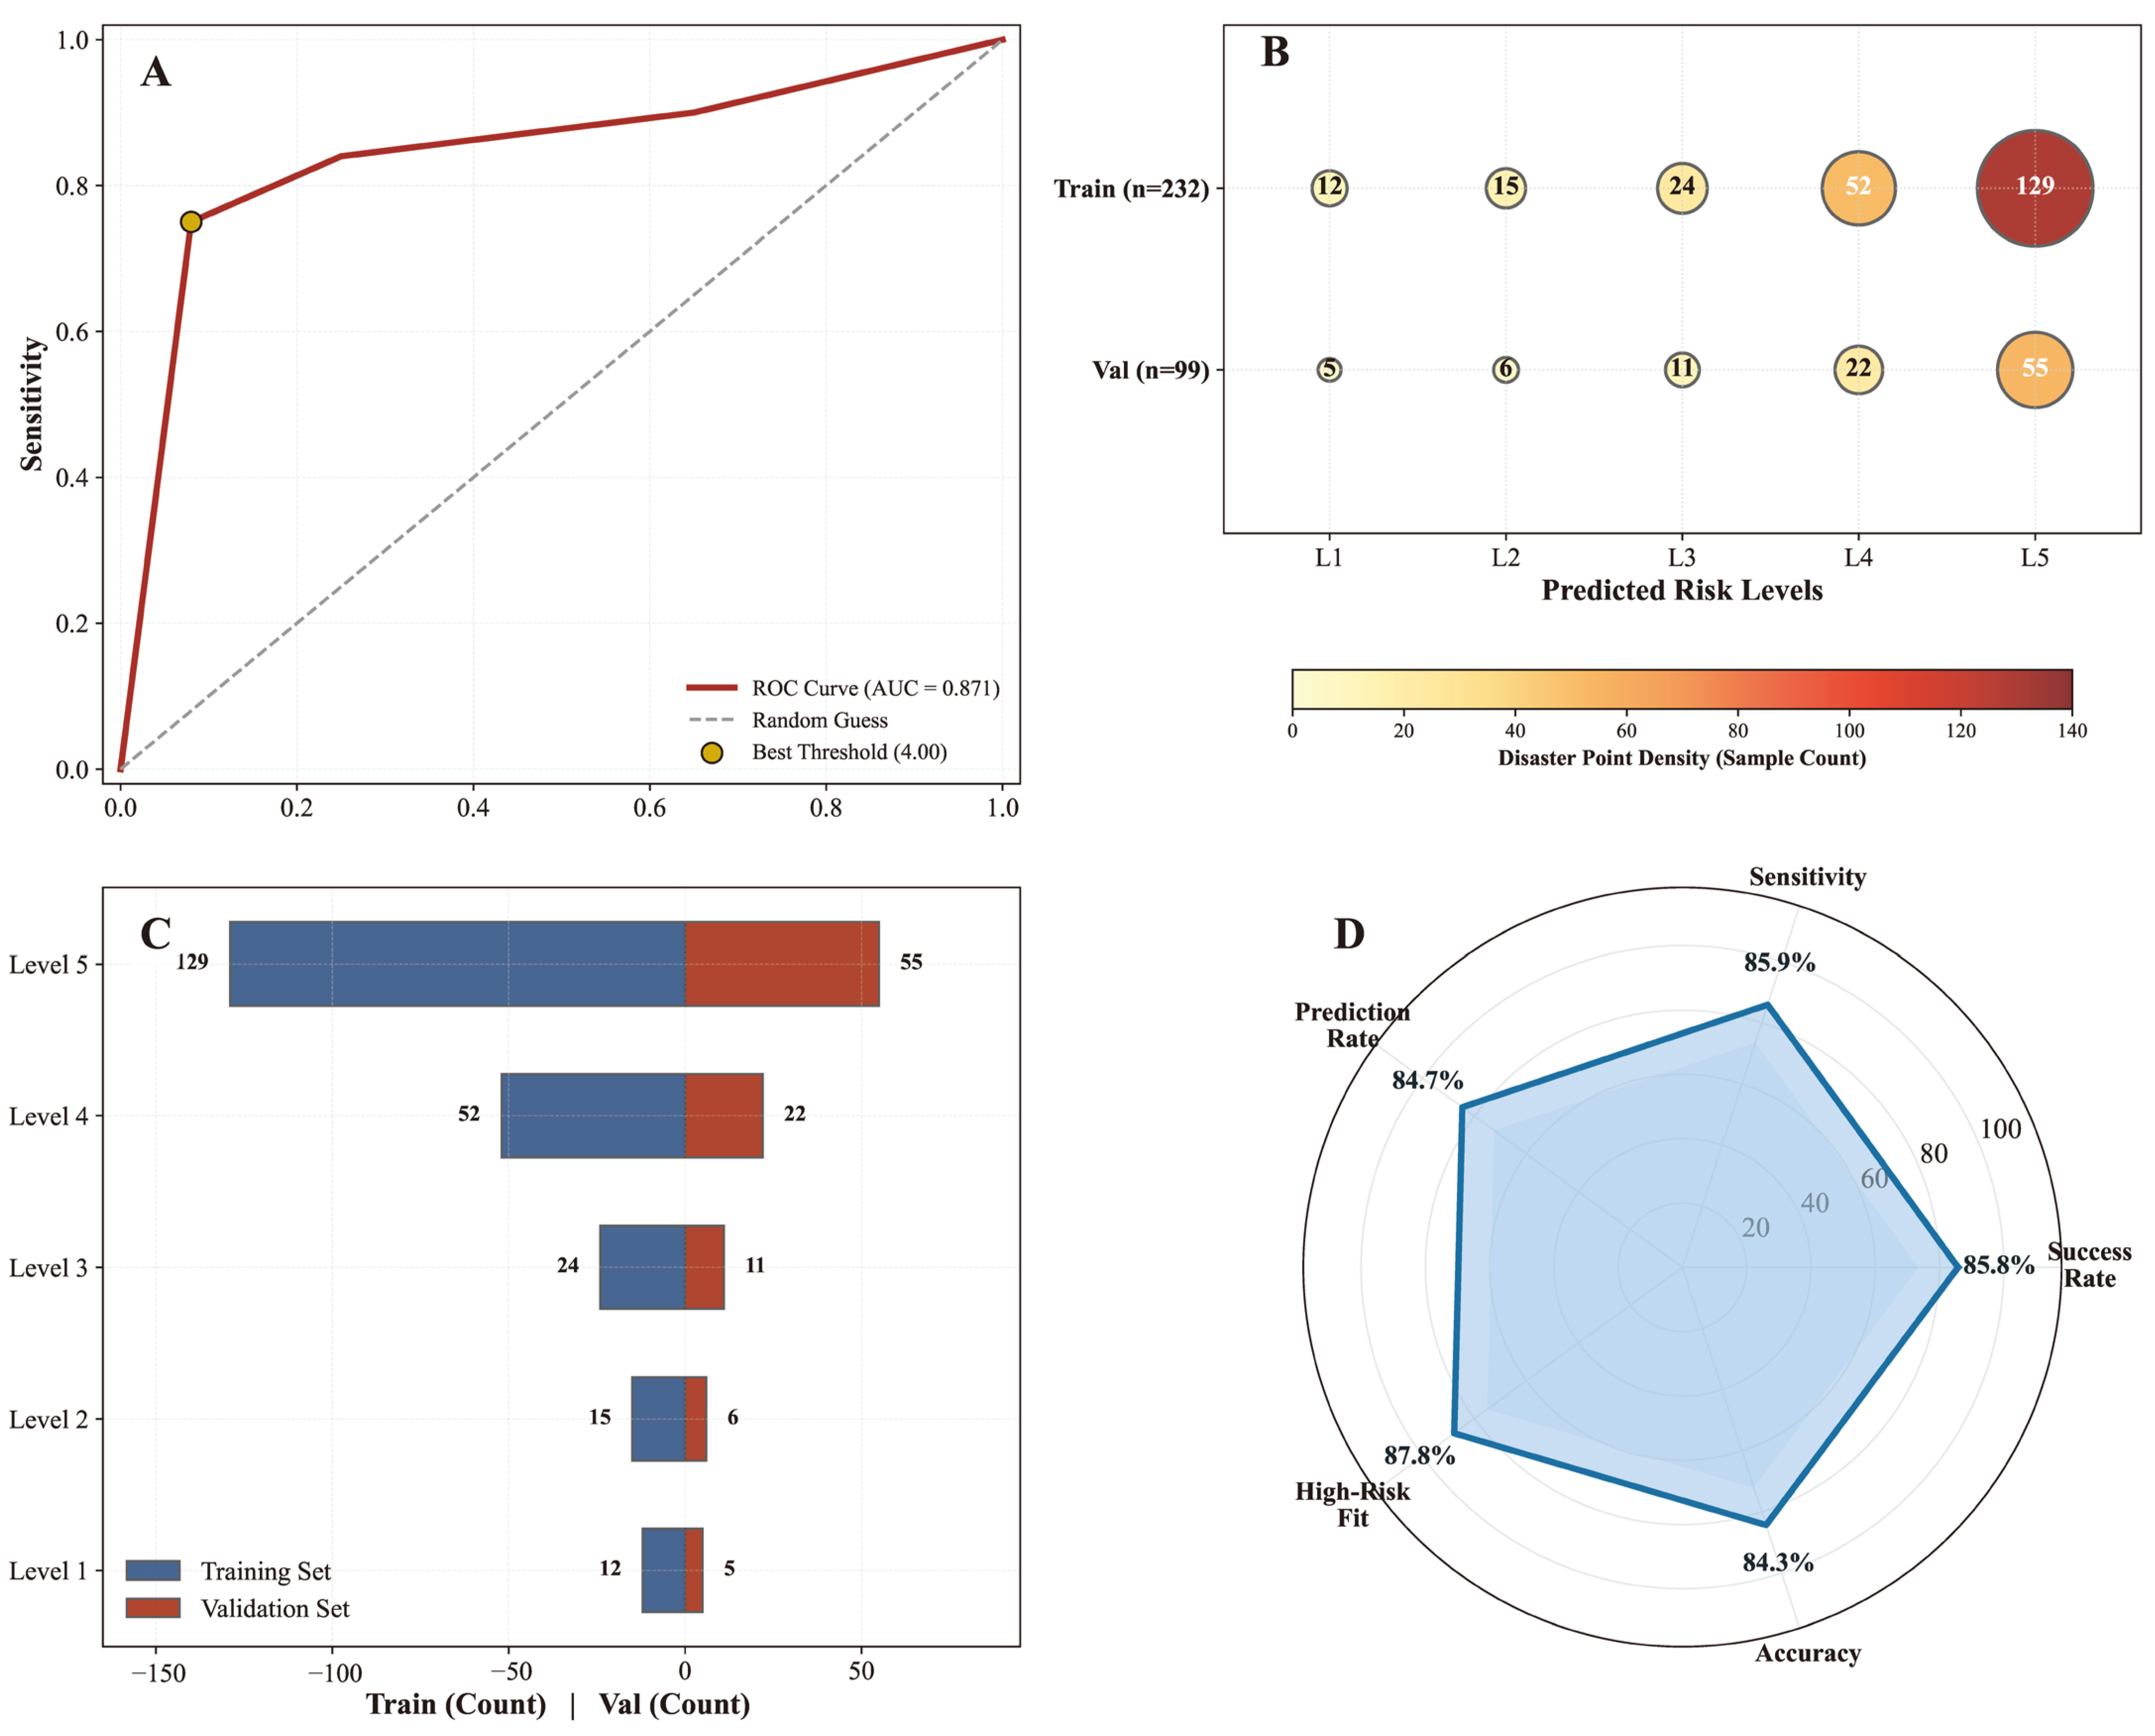
In this study, the 331 field-surveyed snow disaster sites, including observations associated with heavy snowfall, blowing snow, and avalanches, were randomly split into a training set (70%, n = 232) and an independent validation set (30%, n = 99) to evaluate the spatial discrimination of the comprehensive snow disaster risk model in Northwestern China (Figure 9).
Figure 9.
Validation and performance of the comprehensive snow disaster risk model in Northwestern China. (A) Receiver operating characteristic (ROC) curve and area under the curve (AUC) for the validation set; (B) two-dimensional bubble matrix representing the density distribution of training (70%) and validation disaster points across predicted risk levels (L1–L5); (C) bi-directional pyramid plot comparing the spatial frequency of training and validation sets within each comprehensive risk level; (D) radar chart illustrating the comprehensive model performance evaluated by multi-dimensional geospatial metrics.
To assess whether this discriminative capacity is threshold independent and reflects the model’s intrinsic diagnostic ability, we further employed receiver operating characteristic analysis (ROC). The analysis yields an AUC of 0.871 (Figure 9A), indicating strong spatial discrimination that substantially exceeds the noninformative baseline. The optimal threshold, corresponding to a risk score of 4.00, is determined by maximizing Youden’s index and achieves an effective compromise between sensitivity and specificity.
To further investigate the sample capture efficiency of the model across different risk levels, a two-dimensional bubble density matrix (Figure 9B) and a bi-directional pyramid spatial frequency distribution (Figure 9C) were introduced. The bubble matrix distribution (Figure 9B) visually reflects a strong spatial clustering of disaster points toward higher risk categories (Level 4 and Level 5) for both training and validation datasets. Specifically, within the independent validation set (n = 99), as high as 55.6% (n = 55) of the known disaster points precisely fell into the highest risk zone (Level 5), whereas only 5.1% (n = 5) were found in the lowest risk zone (Level 1). The multi-dimensional structure of the bi-directional pyramid plot (Figure 9C) further confirms that the frequency trends of the validation and training sets exhibit a high degree of symmetry and spatial homogeneity across all comprehensive risk levels. This strongly verifies the unbiased nature of the random sampling process and the robust feature extraction capacity of the model. Furthermore, a multi-dimensional quantitative evaluation of model performance was conducted via a radar chart (Figure 9D). The metrics indicated that the model achieved a success rate of 85.8%, a sensitivity of 85.9%, a prediction rate of 84.7%, and a high-risk fit of 87.8% while maintaining a high overall accuracy of 84.3%. Collectively, these complementary validation metrics demonstrate robust performance and generalizability, supporting the proposed approach as a credible tool for regional snow disaster risk zoning across Northwestern China [40,41].
5.2. Limitations and Challenges
Although the combination of indicator models and GIS for road risk assessment has certain feasibility, to make the assessment results more reasonable, the indicator system and assessment model for road snow disaster risk assessment require further calibration and improvement: for example, how to better quantify the indicators of snow disaster causative factors and susceptible entities and how to better classify the elements, indicators, and comprehensive influence degrees.
Due to the unique natural geographical environment of Northwestern China, the distinctive location of the Tianshan Mountains in central Xinjiang facilitates significant cold-season snowfall under westerly circulation, and the commonly described pattern of “ten miles, ten different landscapes” creates strong spatial heterogeneity in snow disaster risk. The long-term 500 m snow products used in this study are therefore more suitable for identifying regional snow-property gradients than for resolving micro-topographic controls on local blowing snow deposition or avalanche release. In addition, the exposure indicators focus on roads and buildings; the absence of detailed population density, critical-facility, and road-asset-importance data may lead to conservative risk estimates in locally important socioeconomic nodes. Finally, although EWM provides objective and reproducible weights, the linear weighted-sum structure cannot fully represent nonlinear coupling among snow depth, wind, terrain, and exposure. Future work should integrate finer socioeconomic indicators, land-use dynamics, climate projection scenarios, and AHP-EWM or machine learning weighting schemes when documented expert scores, higher-resolution data, and denser event samples are available.
Because the comprehensive map depends on the relative weights assigned to , , and , alternative weighting assumptions may change local class boundaries. The result should therefore be interpreted as relative regional zoning under the selected EWM scheme, and a systematic spatial sensitivity assessment should be considered in future work.
The field validation is based on sites observed along X852, G681, and G217 and is therefore especially relevant to transportation-oriented snow disaster assessment. Because these road transects do not constitute spatially random coverage of the entire study area, remote mountain terrain and locations without accessible roads may be underrepresented. Future validation should incorporate additional off-road and high-mountain observations where feasible.
6. Conclusions
This study developed an integrated multi-hazard assessment framework to evaluate snow disaster risk in Northwestern China, a region highly susceptible to heavy snowfall, blowing snow, and avalanches. By combining multi-source remote sensing data, geographic factors, and EWM, the proposed model shows good regional spatial discrimination and agreement with surveyed disaster sites, with an AUC of 0.871 and an overall accuracy of 84.3%. The model is therefore suited to regional risk zoning and hotspot identification rather than event-scale prediction for a particular winter. Three principal conclusions emerge.
- (1)
- The three hazard types exhibit distinct yet spatially convergent risk patterns. Heavy snowfall hazard dominates the Altay and Ili regions, with the highest intensity concentrated in Habahe, Fuyun, and the Ili River Valley. Blowing snow hazard is most severe in the mountain passes and wind-corridor zones of Zhaosu, Tekes, Tacheng, and the eastern Tianshan foothills. Avalanche hazard, though really limited, is exceptionally concentrated in the steep, high-relief terrain of the southern Tianshan valleys and the Altay mountain front.
- (2)
- Comprehensive snow disaster risk exhibits a core–periphery structure. The highest integrated risk is persistently concentrated in three interconnected mountain systems—the Altay Mountains, the Ili River Valley, and the Tacheng Highlands—where abundant snow accumulation, complex topography, and synoptic-scale forcing converge. The winter ventilation effect and topographic channeling of the Central Asian cold air mass, combined with orographic uplift, create a persistent environment for heavy snowfall and snow drift redistribution. These physical mechanisms, rather than any single factor, drive the elevated baseline risk across these source regions.
- (3)
- The risk gradient is spatially polarized: high-hazard and relatively high-hazard zones occupy only 8.5% and 11.6% of the study area, respectively, yet they contain over 95% of field-surveyed disaster sites. In contrast, the Junggar Basin and its peripheral lowlands constitute a vast, low-risk matrix covering nearly 60% of the region. This pronounced polarization implies that targeted, high-density countermeasures in the identified hotspot clusters can achieve disproportionate risk reduction, whereas extensive low-risk areas require only routine monitoring.
Author Contributions
Conceptualization, W.H., X.H., F.L., J.W. and T.C.; methodology, W.H. and X.H.; software, W.H.; validation, W.H. and X.H.; formal analysis, W.H., X.H. and D.S.; investigation, W.H., X.H. and J.Z.; resources, W.H., X.H., D.S., Y.L., Q.Y., W.W.,. and Y.L.; data curation, W.H. and X.H.; writing—original draft preparation, W.H.; writing—review and editing, X.H., D.S. and W.W.; visualization, W.H. and X.H.; supervision, W.W.; funding acquisition, X.H. All authors have read and agreed to the published version of the manuscript.
Funding
This research was funded by the following projects: the Key R&D project of Xinjiang Autonomous Region under Grant 2023B03004-1, in part by the National Natural Science Foundation of China under Grant 42571456, in part by the National Natural Science Foundation of China under Grant 42571176, in part by the program of the Key Laboratory of Cryospheric Science and Frozen Soil Engineering, Chinese Academy of Sciences (CAS), under Grant CSFSE-ZZ-2402, and in part by the Technology R&D Project of Xinjiang Transportation Investment (Group) Co., Ltd. under Grant XJJTZKX-FWCG-202312-0504.
Data Availability Statement
The data utilized in this study are detailed in the data section of the article. Further inquiries can be directed to the corresponding author.
Acknowledgments
The authors appreciate all the data provided by each open database. The authors would like to thank the editor and anonymous reviewers for their valuable comments and suggestions on this article.
Conflicts of Interest
Author Jing Zhao is employed by the company Xinjiang Transportation Science Research Institute Co., Ltd. The remaining authors declare that the research was conducted in the absence of any commercial or financial relationships that could be construed as a potential conflict of interest. The authors declare that this study received funding from the Technology R&D Project of Xinjiang Transportation Investment (Group) Co., Ltd. under Grant No. XJJTZKX-FWCG-202312-0504. The funder participated in the field investigation of winter snow disasters in northern Xinjiang and provided support for the conducting of field experiments. These preliminary efforts provided strong support for the writing of this paper.
References
- Wang, J.A.; Yue, Y.J.; Zhao, J.T.; Bai, Y.; Lv, L.L.; Shi, P.J.; Dong, W.J. Snow, Frost, and Hail Disasters in China. In Natural Disasters in China; Springer: Berlin/Heidelberg, Germany, 2016; pp. 187–237. [Google Scholar] [CrossRef] [Scilit]
- Qiang, X.; Huang, J.; Guo, Q.; Yang, Z.; Wang, B.; Liu, J. Dynamic Evolution and Triggering Mechanisms of the Simutasi Peak Avalanche in the Chinese Tianshan Mountains: A Multi-Source Data Fusion Approach. Remote Sens. 2025, 17, 2755. [Google Scholar] [CrossRef] [Scilit]
- Sun, X.; Miao, L.; Feng, X.; Zhan, X. Snow Disaster Risk Assessment Based on Long-Term Remote Sensing Data: A Case Study of the Qinghai–Tibet Plateau Region in Xizang. Remote Sens. 2024, 16, 1661. [Google Scholar] [CrossRef] [Scilit]
- Rafique, A.; Dasti, M.Y.S.; Ullah, B.; Awwad, F.A.; Ismail, E.A.A.; Saqib, Z.A. Snow Avalanche Hazard Mapping Using a GIS-Based AHP Approach: A Case of Glaciers in Northern Pakistan from 2012 to 2022. Remote Sens. 2023, 15, 5375. [Google Scholar] [CrossRef] [Scilit]
- Li, J.; Zou, Y.; Zhang, Y.; Sun, S.; Dong, X. Risk Assessment of Snow Disasters for Animal Husbandry on the Qinghai–Tibetan Plateau and Influences of Snow Disasters on the Well-Being of Farmers and Pastoralists. Remote Sens. 2022, 14, 3358. [Google Scholar] [CrossRef] [Scilit]
- Ge, Q.; Zou, M.; Zheng, J. Integrated Assessment of Natural Disaster Risks in China; Science Press: Beijing, China, 2008; Volume 151–169, pp. 176–193. (In Chinese) [Google Scholar]
- Liu, F.G.; Mao, X.F.; Zhang, Y.L.; Chen, Q.; Liu, P.; Zhao, Z.L. Risk analysis of snow disaster in the pastoral areas of the Qinghai-Tibet Plateau. J. Geogr. Sci. 2014, 24, 672–684. [Google Scholar] [CrossRef] [Scilit]
- Shi, P.J.; Xu, W.; Wang, J.A. Natural Disaster System in China. In Natural Disasters in China; Springer: Berlin/Heidelberg, Germany, 2016; pp. 1–36. [Google Scholar] [CrossRef] [Scilit]
- Chen, X.J.; Xu, Y.F.; Li, T.; Wei, J.; Wu, J.D. Regional rainfall damage functions to estimate direct economic losses in rainstorms: A case study of the 2016 extreme rainfall event in Hebei province of China. Int. J. Disaster Risk Sci. 2024, 15, 508–520. [Google Scholar] [CrossRef] [Scilit]
- Jose, M.; Enner, A.; Cunha, A.P.; Seluchi, M.; Carlos, N.; Dolif, G.; Demerval, G.; Dias, M.; Luz, C.; Fabiani, B.; et al. Flash floods and landslides in the city of Recife, Northeast Brazil after heavy rain on May 25–28, 2022: Causes, impacts, and disaster preparedness. Weather Clim. Extrem. 2023, 39, 100545. [Google Scholar] [CrossRef] [Scilit]
- Maria, K.; Stephan, G.; Markus, D. Spatiotemporal analysis of heavy rain-induced flood occurrences in Germany using a novel event database approach. J. Hydrol. 2021, 595, 124–139. [Google Scholar] [CrossRef] [Scilit]
- Zhang, Q.; Yao, Y.B.; Li, Y.H.; Huang, J.P.; Ma, Z.G.; Wang, Z.L.; Wang, S.P.; Wang, Y.; Zhang, Y. Causes and Changes of Drought in China: Research Progress and Prospects. J. Meteorol. Res. 2020, 34, 460–481. [Google Scholar] [CrossRef] [Scilit]
- Hassan, A.N.; Brahim, I.; Mustapha, N.; Lassiane, Y.; Hoda, B.; Javed, M.; Hoang, H.; Hazem, A. Integrating geospatial data and hybrid machine learning models for landslide susceptibility assessment in semi-arid environments. Geomat. Nat. Hazards Risk 2026, 17, 2625403. [Google Scholar] [CrossRef] [Scilit]
- Eckert, N.; Corona, C.; Giacona, F. Climate change impacts on snow avalanche activity and related risks. Nat. Rev. Earth Environ. 2024, 5, 369–389. [Google Scholar] [CrossRef] [Scilit]
- Luana, S.; Floris, G.; Ronald, P. Trends and gaps in the literature of road network repair and restoration in the context of disaster response operations. Socio-Econ. Plan. Sci. 2022, 8, 78–89. [Google Scholar] [CrossRef] [Scilit]
- Wang, X.C.; Fei, Y.; Xing, G. Evaluation of Forest Damaged Area and Severity Caused by Ice-snow Frozen Disasters over Southern China with Remote Sensing. Chin. Geogr. Sci. 2019, 29, 405–416. [Google Scholar] [CrossRef] [Scilit]
- Hao, J.S.; Wang, Y.; Li, L.H. Snowpack variations and their hazardous effects under climate warming in the central Tianshan Mountains. Adv. Clim. Change Res. 2024, 15, 442–451. [Google Scholar] [CrossRef] [Scilit]
- Cao, S.C.; Ma, L.H.; Zhou, Y.; Ren, X.X.; Zeng, Y.P.; Yang, X.X.; Wang, P. Flood hazard assessment and emergency evacuation under rainstorm disasters: A case study of Luhe District in Nanjing. Travel Behav. Soc. 2026, 10, 248–253. [Google Scholar] [CrossRef] [Scilit]
- Tommaso, L.; Daniele, V.; Daniela, M.; Francesco, B.; Andrea, D. A new framework for flood damage assessment considering the within-event time evolution of hazard, exposure, and vulnerability. J. Hydrol. 2022, 615A, 128687. [Google Scholar] [CrossRef] [Scilit]
- Cui, P.; Peng, J.B.; Shi, P.J. Scientific challenges of research on natural hazards and disaster risk. Geogr. Sustain. 2021, 2, 216–223. [Google Scholar] [CrossRef] [Scilit]
- Lahsen, M.; Ribot, J. Politics of attributing extreme events and disasters to climate change. Wiley Interdiscip. Rev. Clim. Change 2021, 13, e750. [Google Scholar] [CrossRef] [Scilit]
- Feng, B.; Zhang, Y.; Bourke, R. Urbanization impacts on flood risks based on urban growth data and coupled flood models. J. Nat. Hazards 2021, 106, 613–627. [Google Scholar] [CrossRef] [Scilit]
- Huo, H.; Liu, Y. Spatiotemporal distribution characteristics and impact assessment of snow disasters in the Ili region of Xinjiang from 1990 to 2020. Arid Land Geogr. 2024, 47, 1828–1840. [Google Scholar]
- Lu, X.Y.; Chen, R.S.; Liu, Y. Spatiotemporal variation of rain-on-snow days in northern Xinjiang. J. Glaciol. Geocryol. 2021, 43, 1446–1457. [Google Scholar] [CrossRef]
- Hao, J.S.; Cui, P.; Zhang, X.Q.; Li, L.H. The triggering mechanisms for different types of snow avalanches in the continental snow climate of the central Tianshan Mountains. Sci. China Earth Sci. 2022, 65, 2308–2321. [Google Scholar] [CrossRef] [Scilit]
- Liu, J.; Zhang, T.Y.; Wang, B.; Yang, Z.; Sun, X.; Yao, S. A Study on Avalanche-Triggering Factors and Activity Characteristics in Aerxiangou, West Tianshan Mountains, China. Atmosphere 2023, 14, 1439. [Google Scholar] [CrossRef] [Scilit]
- Chen, G.Q.; Hao, J.S.; Cui, P.; Wang, Y. Application of dendrogeomorphology in snow avalanche hazard assessment: Progress and prospects. J. Mt. Sci. 2025, 44, 762–770. [Google Scholar] [CrossRef] [Scilit]
- Kim, S.Y.; Kim, D.Y.; Lee, J.W.; Sayed, B.; Waqas, A.; Jeongha, P. A novel approach of mapping snow disaster-prone areas based on areal disaster density optimization: A case study of South Korea. Nat. Hazards 2026, 122, 458–466. [Google Scholar] [CrossRef] [Scilit]
- Shao, D.H.; Li, H.Y.; Wang, J.; Pan, X.D.; Hao, X.H. Distinguishing the Role of Wind in Snow Distribution by Utilizing Remote Sensing and Modeling Data: Case Study in the Northeastern Tibetan Plateau. IEEE J. Sel. Top. Appl. Earth Obs. Remote Sens. 2017, 10, 4445–4456. [Google Scholar] [CrossRef] [Scilit]
- Jack, R.; Amina, M.; Prakash, T.; Karen, C.T.; Sara, S.; Mark, T.; Kare, S. Multi-hazard susceptibility and exposure assessment of the Hindu Kush Himalaya. Sci. Total Environ. 2021, 804, 150039. [Google Scholar] [CrossRef] [Scilit] [PubMed]
- Mosavi, A.; Shirzadi, A.; Choubin, B. Towards an Ensemble Machine Learning Model of Random Subspace Based Functional Tree Classifier for Snow Avalanche Susceptibility Mapping. IEEE Access 2020, 8, 145968–145983. [Google Scholar] [CrossRef] [Scilit]
- Karas, A.; Karbou, F.; Giffard-Roisin, S.; Durand, P.; Eckert, N. Automatic Color Detection-Based Method Applied to Sentinel-1 SAR Images for Snow Avalanche Debris Monitoring. IEEE Trans. Geosci. Remote Sens. 2021, 60, 5219117. [Google Scholar] [CrossRef] [Scilit]
- Bai, L.; Shi, C.; Shi, Q.D.; Li, L.H. Change in the spatiotemporal pattern of snowfall during the cold season under climate change in a snow-dominated region of China. Int. J. Climatol. 2019, 39, 5702–5719. [Google Scholar] [CrossRef] [Scilit]
- Yang, T.; Li, Q.; Liu, W.J.; Liu, X.; Li, L.H.; Maeyer, D. Spatiotemporal variability of snowfall and its concentration in northern Xinjiang, Northwest China. Theor. Appl. Climatol. 2020, 45, 1247–1259. [Google Scholar] [CrossRef] [Scilit]
- Dai, Y.F.; Chen, D.L.; Yao, T.D.; Wang, L. Large lakes over the Tibetan Plateau may boost snow downwind: Implications for snow disaster. Sci. Bull. 2020, 65, 1713–1717. [Google Scholar] [CrossRef] [Scilit] [PubMed]
- Wang, S.J.; Zhou, L.Y.; Wei, Y.Q. Integrated risk assessment of snow disaster over the Qinghai-Tibet Plateau. Geomat. Nat. Hazards Risk 2019, 10, 740–757. [Google Scholar] [CrossRef] [Scilit]
- Yao, J.Q.; Chen, Y.N.; Guan, X.F.; Zhao, Y.; Chen, J.; Mao, W.Y. Recent climate and hydrological changes in a mountain–basin system in Xinjiang, China. Earth-Sci. Rev. 2022, 226, 103957. [Google Scholar] [CrossRef] [Scilit]
- Guan, J.Y.; Yao, J.Q.; Li, M.Y.; Li, D.; Zheng, J.H. Historical changes and projected trends of extreme climate events in Xinjiang, China. Clim. Dyn. 2022, 59, 1753–1774. [Google Scholar] [CrossRef] [Scilit]
- Peng, L.Y.; Sun, F.; Chen, Y.N.; Fang, G.H. Unraveling the complexities of rain-on-snow events in High Mountain Asia. npj Clim. Atmos. Sci. 2025, 8, 118. [Google Scholar] [CrossRef] [Scilit]
- Schweizer, J.; Mitterer, C.; Techel, F.; Stoffel, A.; Reuter, B. On the relation between avalanche occurrence and avalanche danger level. Cryosphere 2020, 14, 737–750. [Google Scholar] [CrossRef] [Scilit]
- Wang, Q.; Zhai, P.M.; Qin, D.H. New perspectives on ‘warming–wetting’ trend in Xinjiang, China. Adv. Clim. Change Res. 2020, 11, 252–260. [Google Scholar] [CrossRef] [Scilit]

Disclaimer/Publisher’s Note: The statements, opinions and data contained in all publications are solely those of the individual author(s) and contributor(s) and not of MDPI and/or the editor(s). MDPI and/or the editor(s) disclaim responsibility for any injury to people or property resulting from any ideas, methods, instructions or products referred to in the content. |
© 2026 by the authors. Licensee MDPI, Basel, Switzerland. This article is an open access article distributed under the terms and conditions of the Creative Commons Attribution (CC BY) license.