


Highlights
What are the main findings?
- The response of an imaging system to point sources at different positions within the instantaneous field of view of a single pixel is nonuniformly distributed; a point source array can effectively suppress this response fluctuation through subpixel sampling and spatial averaging.
- A 2 × 2 to 3 × 3 point source array reduces imaging system response fluctuation by a factor of 6 to 10, striking a balance between calibration accuracy and engineering feasibility.
What are the implications of the main findings?
- Stable and accurate point source responses lay the foundation for improving the accuracy of point-source-based absolute radiometric calibration.
- The multilevel point source array method does not rely on complex calibration of detector physical parameters or on large volumes of point source data and can be rapidly deployed in the on-orbit calibration of conventional Earth-observing satellites, offering strong engineering applicability.
Abstract
Factors such as the optical point spread function (PSF), intrapixel sensitivity (IPS), and interpixel crosstalk of an imaging system can cause the response to point sources to vary with position, directly affecting the absolute radiometric calibration accuracy of the remote sensor. This paper investigates an absolute radiometric calibration method based on a multilevel point source array and quantitatively evaluates the differences in response stability between a single point source and a point source array as a function of position. The method improves the stability and accuracy of point source response acquisition through subpixel sampling and averaging, and obtains the calibration coefficients of the imaging system by linear regression on multilevel data, thereby achieving wide-dynamic-range calibration based on the point source array. The test results indicate that the stability of the point source response using a 6 × 6 array is better than 0.21%, while the stability of the calibration coefficient is better than 0.3%. The relative difference between the point source calibration coefficient and the results calculated using conventional extended source calibration methods is within 1.5%, thereby validating the effectiveness of the point source array calibration method. Further optimization based on on-orbit application requirements indicates that a point source array ranging from 2 × 2 to 3 × 3 can reduce response fluctuations in the imaging system by a factor of 6 to 10; point source arrays within this range offer high engineering feasibility while maintaining calibration accuracy. Following an uncertainty analysis, the laboratory measurement uncertainty of the calibration method using a multilevel point source array was found to be 3.2%; when the method was applied to on-orbit absolute radiometric calibration, the estimated uncertainty was approximately 3.9%. The multilevel point source array effectively enhances calibration accuracy while ensuring response stability and accuracy, thereby providing technical support for point-source-based on-orbit absolute radiometric calibration.
1. Introduction
Since the advent of remote sensing satellites, they have played a vital role in numerous fields, including national defense and security, military reconnaissance, urban environmental monitoring, and mineral resource exploration [1]. With the continuous evolution of remote sensing technology and the expanding scope of its applications, the use of remote sensing data has shifted from traditional qualitative analysis to high-precision quantitative applications; absolute radiometric calibration is the core technical component that ensures the accuracy and reliability of quantitative remote sensing information.
On-orbit absolute radiometric calibration using large-area uniform fields as observation targets is currently the mainstream method; however, the selection of such sites is stringent, suitable locations are scarce, and the radiation from the target sites is monotonous. For instance, the Dunhuang radiometric calibration site has low reflectance; when remote sensors observe high-reflectance targets, they must extrapolate radiance, thereby introducing errors [2]. The Radiometric Calibration Network (RadCalNet) can obtain multiple radiance levels across multiple sites, but it is difficult to achieve on-orbit radiometric calibration with a wide-dynamic-range under the same atmospheric conditions [3,4]. Alternative calibration methods using multi-grayscale targets as a reference can achieve wide-dynamic-range radiometric calibration for multilevel targets observed under the same atmospheric conditions [5]; however, the deployment of multi-grayscale targets is costly, their coverage is limited, and their implementation is complex and relatively inefficient. For reflectance-based vicarious calibration, the absolute radiometric calibration uncertainty typically falls within the 5–7% range. Further improvement in accuracy is constrained primarily by the measurement uncertainty of surface reflectance and the inherent limitations of atmospheric radiative transfer models [6]. In response to the above issues, absolute radiometric calibration methods have been developed that use point targets as observation objects [7,8]. In stellar calibration, stars with known spectral irradiance serve as reference point sources. The satellite performs an attitude maneuver to image these stars. The on-orbit absolute radiometric calibration coefficients are then determined from the stellar spectral information and the imaging system response. This approach has been validated on highly maneuverable satellites such as IKONOS and PLEIADES, where the derived calibration coefficients agree with the official values to better than 3% [7,9,10]. Achieving stellar imaging by rotating a satellite platform places high demands on the satellite’s maneuverability, whereas conventional Earth-observing satellites have limited maneuverability. Ground-based reflective point source calibration methods, such as SPARC, use convex mirrors to reflect sunlight into reference point sources of known intensity. The radiometric quantities are traced directly to the exo-atmospheric solar spectral irradiance, enabling on-orbit absolute radiometric calibration during routine Earth-observation operations. The SPARC method has been validated on IKONOS and Landsat, achieving a calibration repeatability of better than 2.5% for multispectral bands; with the exception of the red band, the absolute gain coefficients deviate from the official values by less than 5% [8,11]. This method requires only atmospheric transmittance measurements to complete the calibration, substantially simplifying the workflow compared with large-area uniform field approaches. The FLARE network, developed on this basis, deploys automated mirror arrays to provide on-demand, unattended vicarious calibration. In two independent calibrations of KOMPSAT-3/3A, the visible-band calibration coefficients agreed to better than 1% [12,13,14].
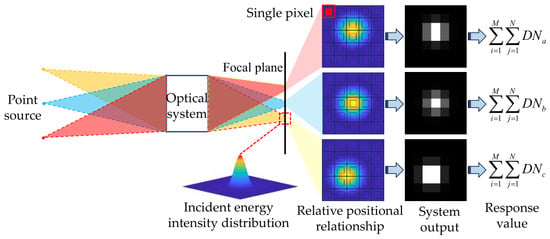
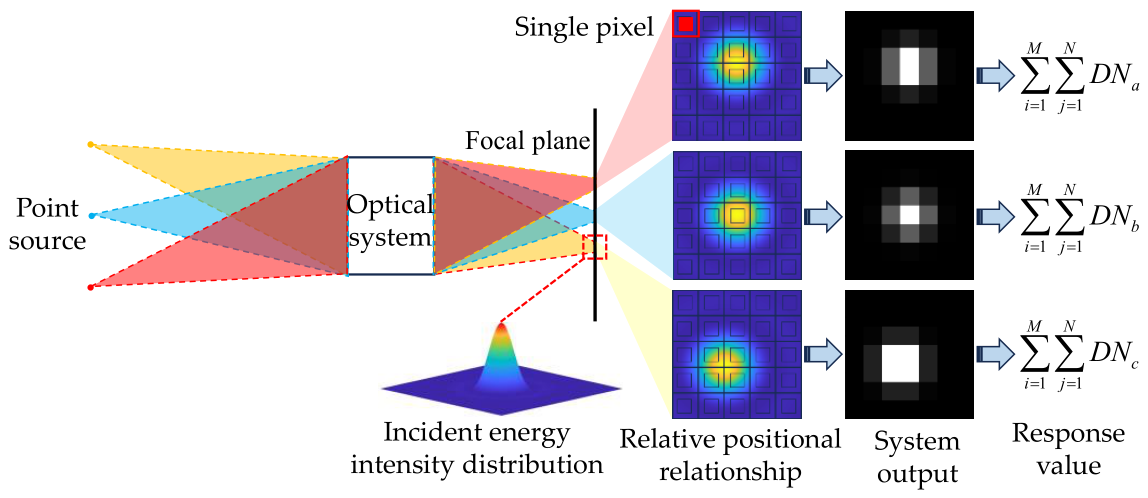
In absolute radiometric calibration studies, establishing a quantitative relationship between the equivalent radiance of the light source at the camera’s entrance pupil and the system’s response is necessary. When the observed object is a point source, the imaging system’s response to incident radiation energy exhibits significant positional dependence; that is, the response fluctuates as the subpixel position of the point source’s center of mass varies within the instantaneous field of view (IFOV). As shown in Figure 1, for the same incident energy, the integrated value of the imaging system’s response to a point source (, , ) varies depending on the subpixel position of the point source centroid within the pixel. This phenomenon is caused primarily by two factors: the first is a nonuniform response within a single pixel, where factors such as the fill factor and pixel structure lead to variations in the response to incident energy at different locations within a single pixel [15,16,17], known as IPS; the second is crosstalk between pixels, which is attributed mainly to carrier diffusion and capacitive coupling, both of which redistribute the response energy among pixels [18]. Under the combined influence of the above factors, the energy response of the imaging system to a point source exhibits positional dependence. Furthermore, when the optical system has a low energy concentration, the spatial broadening of its optical point spread function is more pronounced; under the influence of spatial averaging effects, the impact of the aforementioned factors is significantly attenuated [19]. Consequently, for imaging systems with high energy concentrations, reducing response fluctuations caused by variations in the position of point sources and improving the accuracy of point source response measurements are critical for on-orbit absolute radiometric calibration based on point sources.
Figure 1.
Energy response of an imaging system to a point source.
To address the above issues, researchers have pursued two approaches within the point source absolute radiometric calibration chain: correction of detector physical characteristics and characterization of the comprehensive response characteristics of the imaging system. Correction of detector physical characteristics aims to accurately measure and compensate for IPS and interpixel crosstalk, thereby improving the accuracy of point source response measurements used in absolute radiometric calibration. Zhong et al. proposed a diffusion and coupling physical (DCP) model that incorporates the physical mechanisms of charge carrier diffusion and interpixel capacitive coupling. Under a 3 μm beam spot, the DCP model achieves an IPS characterization error of only 0.63%, providing a foundation for the accurate extraction of point source responses [20]. Taking a practical approach, Chen et al. developed an exponential IPS model and applied it to response correction in stellar observations, thereby reducing detector response fluctuations from 9% to less than 3% [21]. The team further proposed a method for point source response compensation that integrates capacitive coupling correction, PSF reconstruction and the IPS model, while establishing a response conversion model between stars and internal black bodies. Following compensation of the point source response, the deviation between the stellar calibration coefficient and the internal blackbody calibration coefficient was reduced to just 0.18% [22]. Such methods, which rely on corrections based on the physical characteristics of the detector, improve the stability and accuracy of point source response extraction and can effectively support the absolute radiometric calibration of point sources. However, they require complex parameter calibration of the detector in a laboratory, making them difficult to apply directly to satellites already on orbit without prior characterization. Research into the comprehensive response characteristics of imaging systems aims to precisely characterize the coupling effects between the optical PSF and IPS through variations in the response of point sources at the subpixel scale, and to apply the resulting model to improve the accuracy of detector response measurements. Anderson and King proposed the concept of the effective point spread function (ePSF). The ePSF describes the nonuniform response characteristics of an imaging system and can correct for systematic biases in response measurements caused by subpixel position variations in the detector [23]. Bryson S.T. et al. utilized subpixel scanning information generated by the Kepler payload’s pointing jitter, combined with on-orbit stellar data, to construct a high-precision pixel response function (PRF) model. This model was designed to correct the on-orbit deviation of the laboratory PRF. It couples system effects such as the optical PSF, spacecraft pointing jitter, and IPS to establish a continuous characterization of the response within each pixel, enabling aperture photometry with ppm-level accuracy [24]. Constructing a PRF from the ePSF and subpixel jitter relies on a large quantity of point source response data; however, as the number of point sources is limited during Earth observation, it is difficult to apply this method directly.
To address the limitations of the two methods described above, we employed an array of point sources to reduce response fluctuations and improve the accuracy and stability of response measurements. We utilized the array of point sources to sample the nonuniform distribution of pixel responses in the imaging system, and employed statistical analysis and linear regression to enhance the accuracy of the absolute radiometric calibration of the point sources. This method can be rapidly applied to on-orbit testing, and there is no need for laboratory-measured detector parameters or extensive point source data. This approach is intended to minimize the influence of the relative position between the point source and the sensor element on the radiometric response, thereby improving the accuracy of point source response measurements. Consequently, this approach enhances the accuracy of absolute radiometric calibration using the point source method for optical sensors.
The structure of this paper is as follows: Section 2 analyzes methods for the absolute radiometric calibration of point sources. Section 3 presents experiments on the absolute radiometric calibration of point sources, analyzing the nonuniform distribution of the response within the imaging system’s pixels and the effectiveness of using an array of point sources. In Section 4, we verify the accuracy of the absolute radiometric calibration coefficients for point sources using an extended source, conduct an optimization analysis of the point source array, and then perform an uncertainty analysis. Section 5 presents the conclusions.
2. Principle of Absolute Radiometric Calibration
Absolute radiometric calibration requires the establishment of a quantitative relationship between the equivalent radiance at the target’s entrance pupil and the response of the imaging system, as shown in Equation (1). On the basis of the relationship between target size and the ground sample distance (GSD) of the imaging system, targets can be classified as extended sources or point sources [25]. An extended source refers to a radiation source whose spatial dimensions are significantly larger than the GSD and whose radiant energy can be approximated as uniformly distributed across the IFOVs of multiple pixels. Conversely, a point source is a radiation source whose spatial dimensions are significantly smaller than the GSD.
where is the target response value output by the system, is the calibration coefficient, is the imaging background response value, and is the equivalent radiance at the entrance pupil.
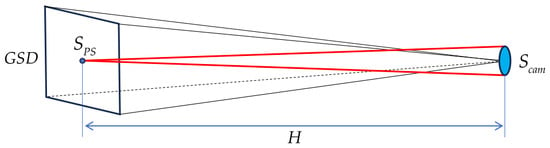
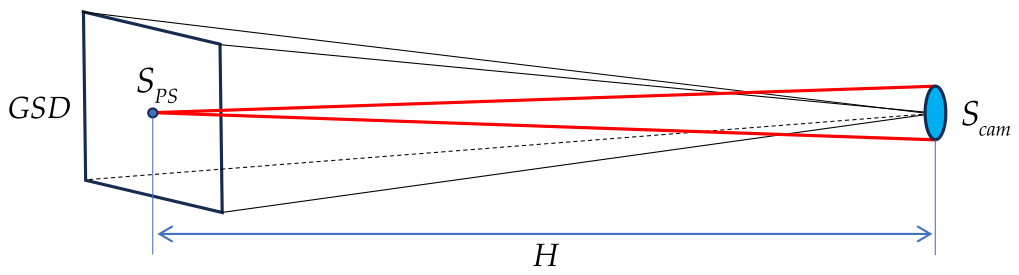
Figure 2 illustrates the radiative transfer process in the case where the observation target is a point source. Here, is the area of the point source, is the area of the entrance pupil of the imaging system, and is the distance between the imaging system and the point source. According to the principle of flux conservation, the radiant flux emitted by the point source toward the camera is equal to the radiant flux received by the camera. When atmospheric effects are neglected, this can be expressed as follows:
where is the spectral radiance of the point source and is the equivalent spectral radiance of the point source at the imaging system’s entrance pupil.
Figure 2.
Schematic diagram of point source radiative transfer.
Thus, the equivalent spectral radiance of the point source at the imaging system’s entrance pupil is as follows:
The equivalent spectral radiance of a point source is obtained by normalizing the radiant energy by the IFOV area of a single pixel under the premise of flux conservation, making it equivalent to the radiance of a uniform extended source that fills the IFOV of a single pixel. This treatment establishes a quantitative mapping between point sources and extended sources and serves as the foundation for unifying the absolute radiometric calibration of point sources with the extended-source calibration system.
Considering the spectral response function of the imaging system, the equivalent radiance at the entrance pupil is as follows:
For a linear shift-invariant system, when a point source with radiance is observed at position , the energy distribution after passing through the optical system should be expressed as follows:
Equation (6) shows that the energy of a point source entering the optical system spreads over a certain range under the action of , approximately exhibiting a Gaussian distribution. The diffused energy is then received and responded to by multiple pixels of the detector, ultimately forming a spread spot in the output. On the basis of the above analysis, the energy response of the imaging system to a point source is the integral of the response over the spread spot. When performing absolute radiometric calibration using a point source, it is necessary to establish a quantitative relationship between the equivalent radiance of the target at the entrance pupil and the digital count of the system response, which can be expressed as follows:
where M and N denote the number of rows and columns of pixels in the point source image, is the response value of the imaging system to the incident energy of the point source, is the calibration coefficient of the point source, and is the imaging background of the point source (including the site environment and dark current).
As shown in Equation (8), the key to absolute radiometric calibration lies in accurately determining the imaging system’s energy response to a point source. However, owing to the influence of the detector’s response characteristics, the integral of the imaging system’s response to a point source varies at different positions within the single-pixel IFOV, resulting in a nonuniform distribution. A single point source can provide only a local sample of this nonuniform distribution, exhibiting significant position dependence. Furthermore, during actual on-orbit testing, the relative positional relationship between the point sources and the pixels is random. In contrast, an extended source can be regarded as a continuously distributed collection of point sources; the countless point sources within a single pixel’s IFOV can densely sample and spatially integrate the system’s nonuniform response characteristics, with the resulting output response value characterizing the system’s average response per pixel. Therefore, in this study, multilevel point sources are arranged in an array to approximate the response of an extended source through subpixel spatial averaging. This approach improves the accuracy of the point source response values and, in turn, enhances the precision of absolute radiometric calibration using the point source method.
3. Absolute Radiometric Calibration Experiment
On-orbit absolute radiometric calibration based on point sources is subject to factors such as the site background, atmosphere, aerosols, and observational geometry; as imaging conditions cannot be reproduced, independently assessing the imaging system’s influence on the response characteristics of point sources at different locations is difficult. To eliminate environmental interference from the external field, in this study, the response characteristics of a point source directly facing the imaging system were investigated under controlled laboratory conditions. Using subpixel step scanning and a multilevel integrating sphere source, the nonuniform distribution of the system’s response within each pixel was analyzed, and the effectiveness of the arrayed sampling method for absolute radiometric calibration was verified.
3.1. Experimental Setup
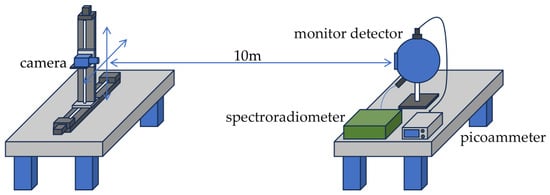
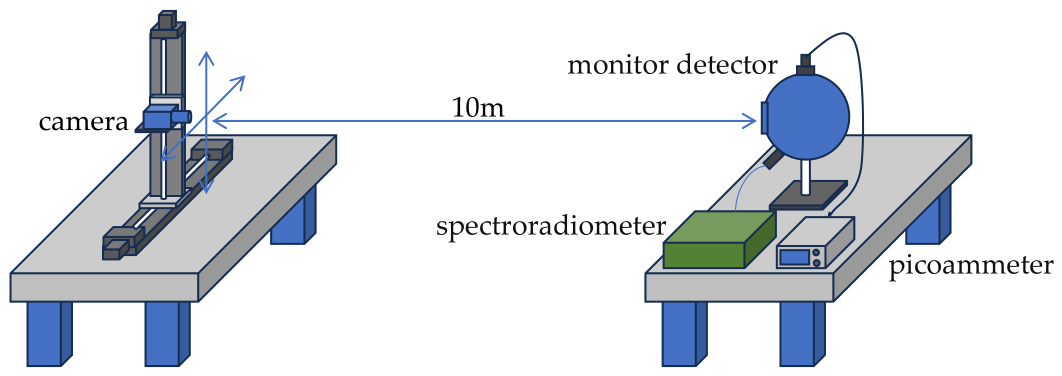
The absolute radiometric calibration test based on a point source was carried out in an optical anechoic chamber. The chamber was light-tight, stray light was effectively suppressed, and the temperature was maintained at 25 °C. The test setup is shown in Figure 3. The setup consisted of three main components: a back-illuminated camera, a high-precision two-dimensional translation stage, and an integrating sphere source. The camera was mounted on the translation stage and positioned on the optical axis at a distance of 10 m from the exit port of the integrating sphere source, corresponding to a GSD of 3.00 mm. The translation stage had a minimum incremental displacement of 0.625 μm and a repeat positioning accuracy of 5 μm, allowing the camera to image the point source at different positions within the IFOV of a single pixel via adjustment of stage displacement. The internal radiant flux of the integrating sphere source was continuously adjusted using an external tungsten halogen lamp source and an electrically controlled aperture, thereby enabling the generation of multilevel radiant sources. A pinhole aperture with a diameter of 0.1 mm was installed at the exit port of the integrating sphere source to restrict the output aperture such that the exit port served as a point source relative to the IFOV of a single pixel of the camera. The radiance of the point source was measured using a spectroradiometer, while a monitoring detector was employed to track the stability of the radiant energy inside the integrating sphere source in real time. Some of the equipment parameters are shown in Table 1.
Figure 3.
Schematic diagram of the test platform.
Table 1.
Experimental setup parameters.
The optical axis of the camera and the integrating sphere source was aligned using a laser and a flat mirror. First, a well-calibrated spirit level was used to level both the camera and the integrating sphere. A flat mirror was then placed at the exit port of the integrating sphere source, and a laser beam was directed from the camera’s position toward the mirror. The two-dimensional translation stage was used to adjust the camera’s position, while the orientation of the integrating sphere source was adjusted until the reflected laser beam coincided with the outgoing beam. Next, the flat mirror was placed in front of the camera, and the laser beam was directed from the exit port of the integrating sphere source toward the mirror; the camera position and mounting angle were fine-tuned to bring the outgoing and reflected beams into coincidence. This procedure was repeated several times until the optical axis was aligned. To verify the alignment, the camera was displaced stepwise to image the point source, and the centroid of the point source spot was extracted at each position. The row and column trajectories of the centroid were checked for systematic drift (the row and column centroid deviation was required to remain below 0.05 pixels). During the experiment, the total camera displacement was less than 30 mm (see Section 3.2). At an imaging distance of 10 m, the energy variation caused by this displacement was less than 0.1‰ and therefore negligible.
3.2. Experimental Analysis
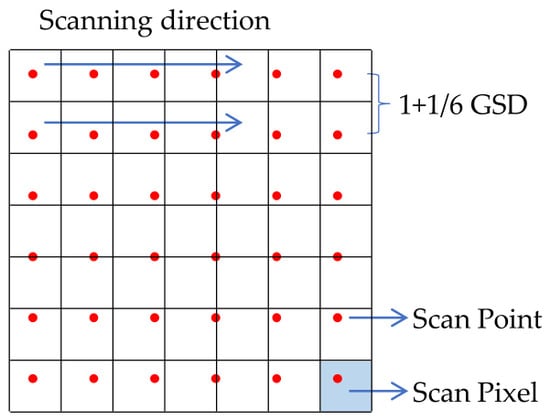
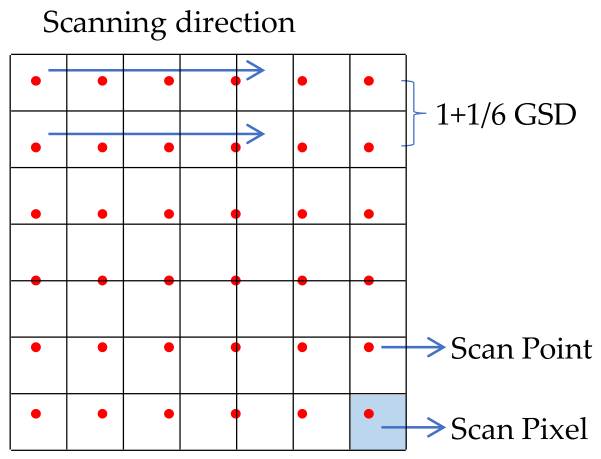
Absolute radiometric calibration methods based on point sources rely on the stable and accurate acquisition of point source responses. To analyze the spatial distribution of the integrated response values of the imaging system with respect to point sources and evaluate the effectiveness of point source arrays in improving response stability and accuracy, we employed a 6 × 6 point source array as the test target. Furthermore, this experiment provides experimental data that can support research into optimizing the number of point sources, as discussed in Section 4.2. The 6 × 6 point source array was arranged in a uniform grid, with an interval of 1 + 1/6 GSD between adjacent points (simulating the on-orbit arrangement of point sources through whole-pixel spacing and subpixel offsets), as shown in Figure 4. By utilizing subpixel offsets, one can perform comprehensive, uniform sampling of the nonuniform response distribution of the imaging system within a single pixel’s IFOV.
Figure 4.
Schematic diagram of a 6 × 6 point source array.
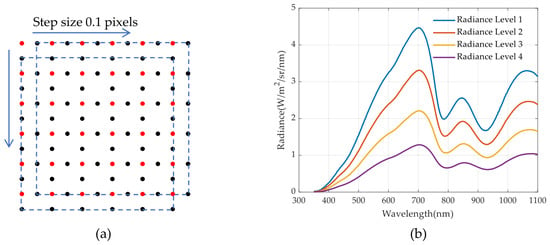
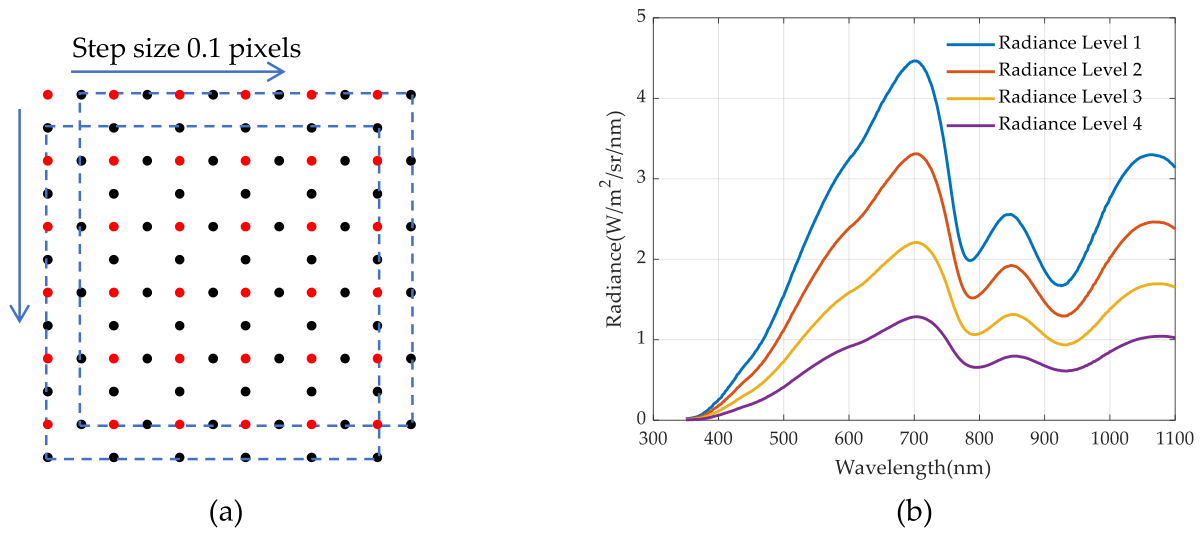
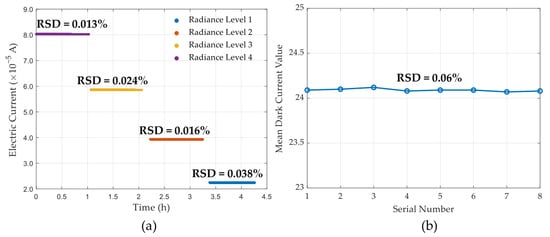
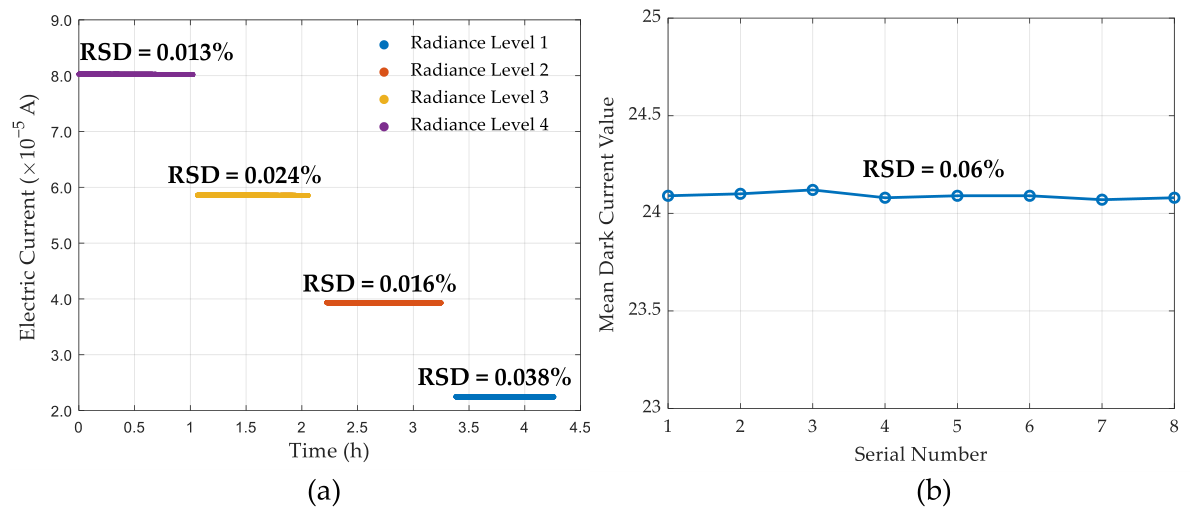
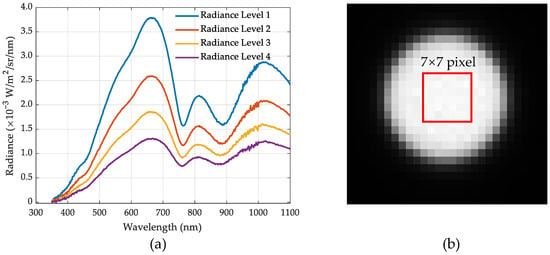
This study involved controlling a two-dimensional translation stage to perform an equidistant scan with a step size of 3.50 mm (i.e., 1 + 1/6 GSD) while also controlling the camera to image point sources at 6 × 6 different positions in sequence. Under on-orbit conditions, the relative position of a satellite with respect to ground-based point sources is typically random. To simulate on-orbit imaging conditions, a 6 × 6 array of point sources is treated as a single unit: after the initial position is set, the array is translated in both the row and column directions in increments of 0.1 pixels, moving a total of 0.5 pixels, as shown in Figure 5a. A total of 36 sets of 6 × 6 array images were acquired. The output energy of the integrating sphere source was adjusted, and the above-mentioned procedure was repeated, yielding point source response measurements at four energy levels (with peak point source responses of approximately 60%, 40%, 20%, and 5% of the maximum value, respectively). The radiance of the point source corresponding to each energy level was measured ten times with a spectroradiometer; the resulting mean radiance values are shown in Figure 5b. The array sampling of each energy level of the point source lasted approximately one hour, totaling 4.2 h; the energy stability of the integrating sphere source during the sampling process is shown in Figure 6a. During the measurement of the point source response at each energy level, the camera’s dark current level was measured at the start and end of the measurement (with the lens covered). The average dark current response over a 50 × 50-pixel area within the point source response range is taken as a reference, as shown in Figure 6b. The relative standard deviation (RSD) was used to evaluate the stability of the data:
where is the standard deviation and is the arithmetic mean.
Figure 5.
Point source test: (a) data acquisition method for the point source response, and (b) radiance curves for the four energy levels of the point source.
Figure 6.
Stability monitoring: (a) stability of the energy output from the integrating sphere source during sampling; (b) variation in the mean dark current of the camera during testing.
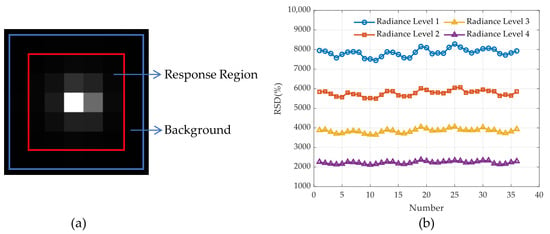
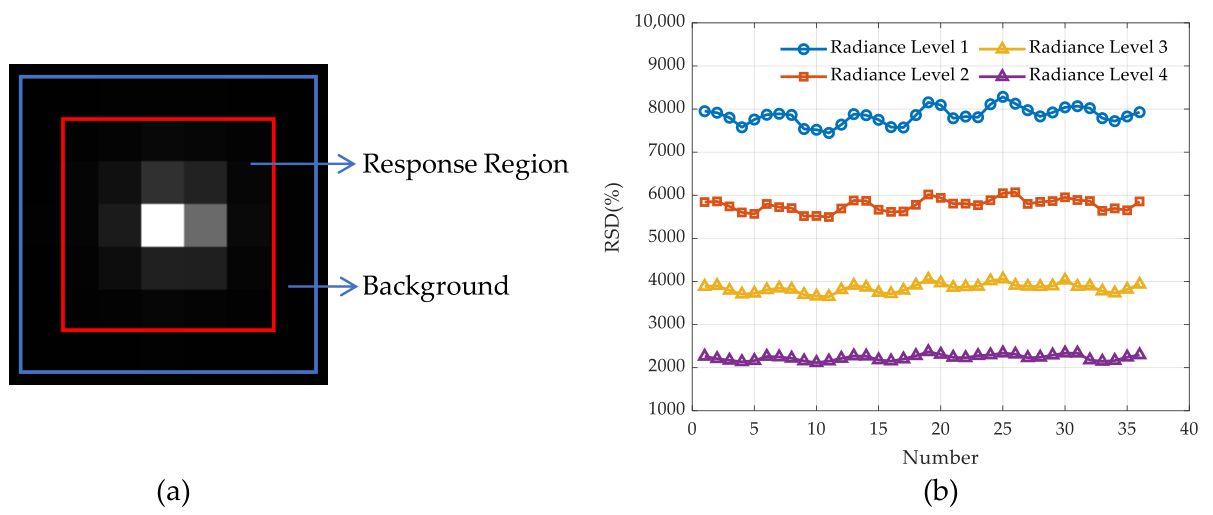
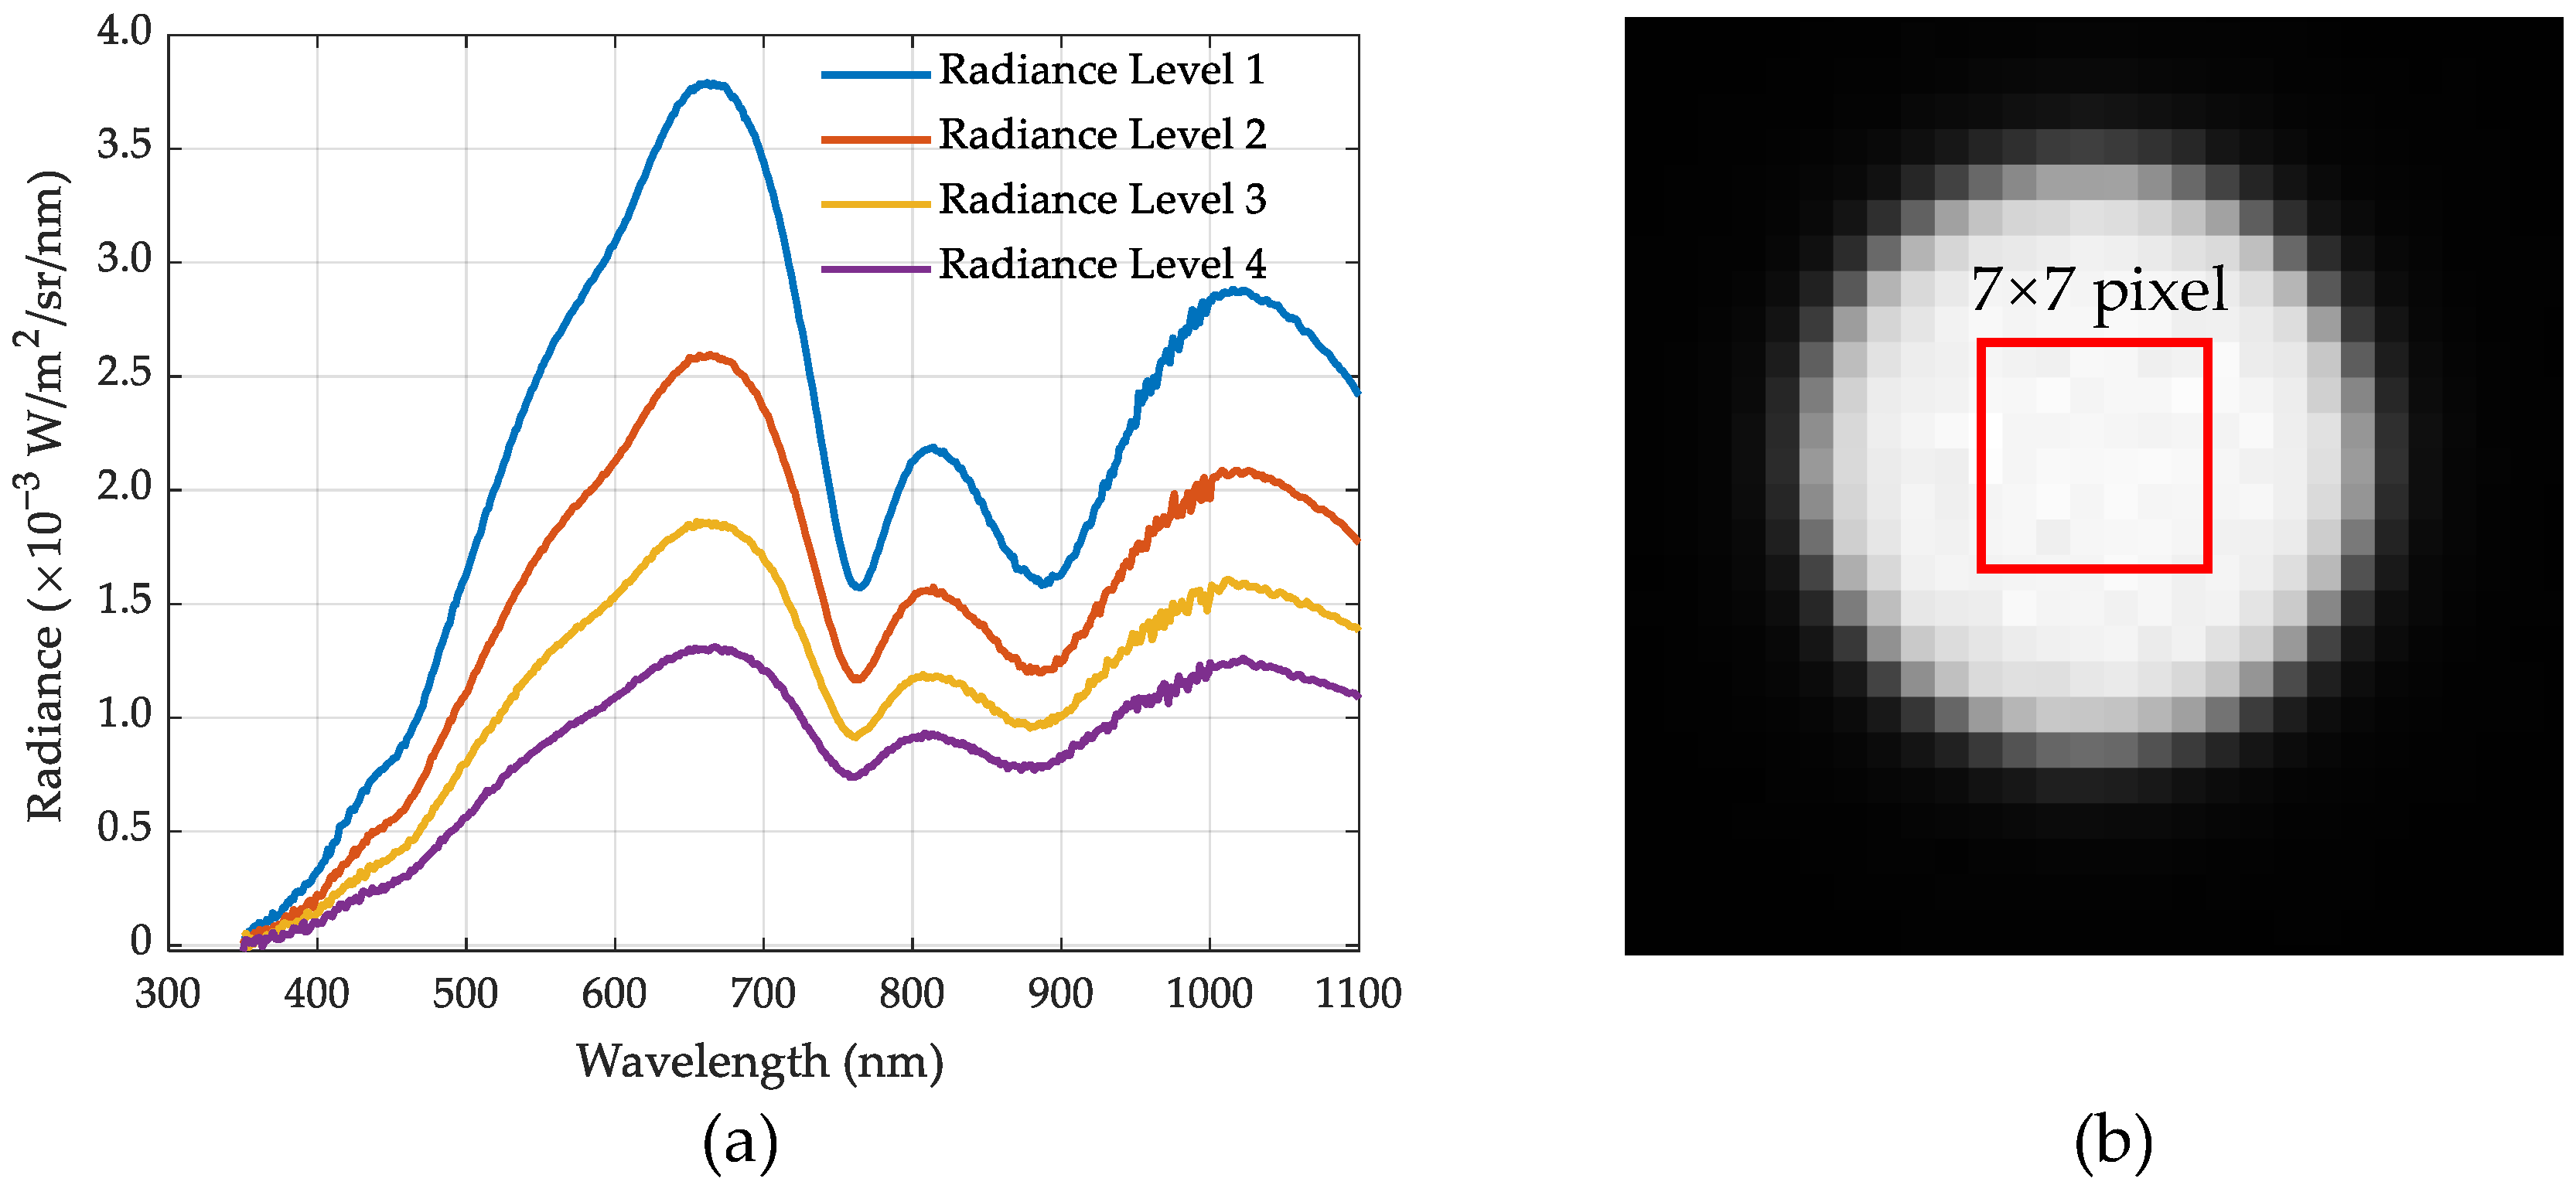
As shown in Figure 6, both the output energy of the integrating sphere source and the camera’s dark current level exhibited excellent temporal stability throughout the experiment. The fluctuation in the integrating sphere source over one hour was better than 0.05%, and the variation in the mean dark current of the camera over four hours remained below 0.06%, confirming the reliability of the point source data acquisition method. Aperture photometry was used to extract the imaging system’s response to the point source. The procedure, illustrated in Figure 7a, is as follows. The region enclosed by the red box defines the primary extraction area for the point source response (i.e., the signal region); it must fully encompass the spatial extent of the point source energy distribution. The annular region between the blue and red boxes is defined as the background reference region; it characterizes the background response of the imaging system in the absence of a target signal. The system’s response to a point source can be obtained by subtracting the background response (the mean value of the background area multiplied by the number of pixels within the red box) from the total response value of all pixels within the red box. The size of the red box region was determined using the curve of growth method [1]. In this experiment, the red box region measured 7 × 7 pixels. For each point source energy level, a 6 × 6 array of point source responses was randomly selected, and the resulting response fluctuations are shown in Figure 7b.
Figure 7.
Extraction of point source responses: (a) acquisition of point source responses, and (b) fluctuations in the integral of the energy response of a randomly arranged 6 × 6 array of point sources with four energy levels.
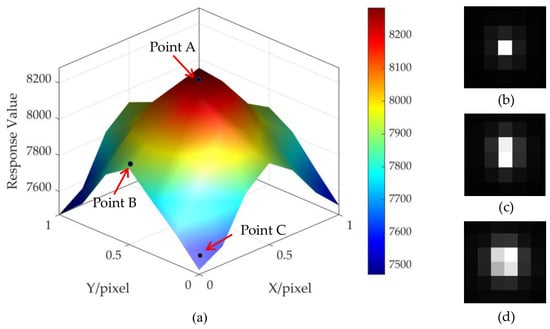
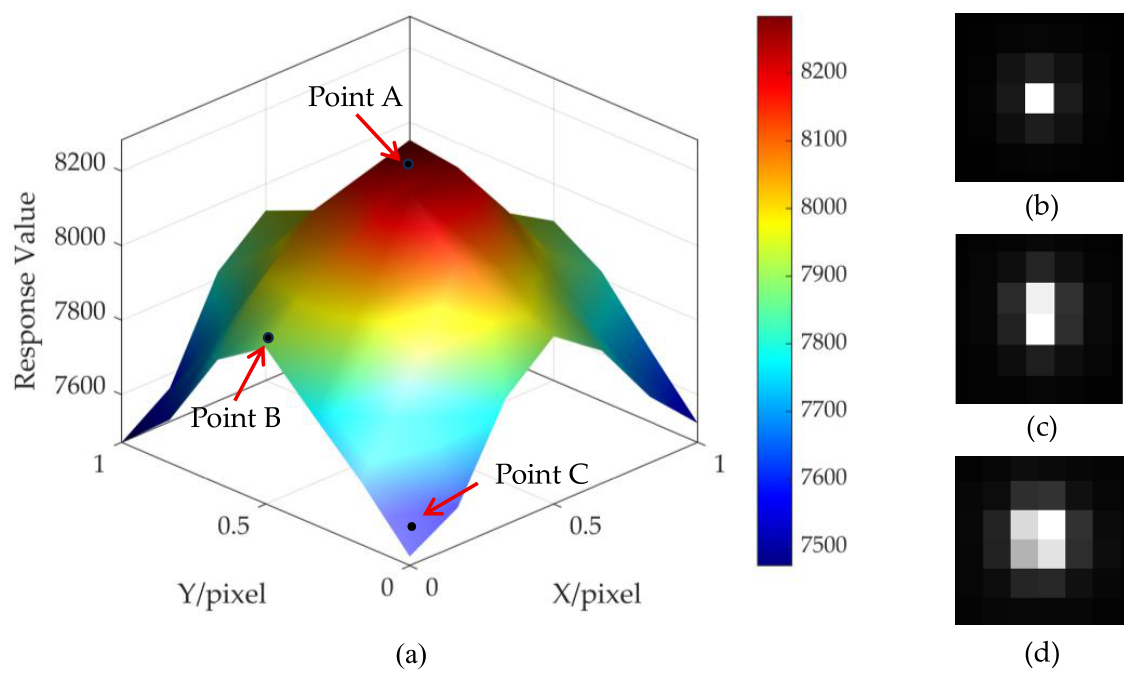
Dense sampling of a point source across the IFOV of a single pixel using a 6 × 6 array was carried out to capture the nonuniform response distribution. The resulting integrated response varied significantly with both position and energy level, with point source energy response fluctuations reaching 3.0%. Moreover, 36 sets of 6 × 6 measurement data indicated that the energy response peaks when the point source’s center of mass falls at the pixel center, is lower when it lies at the boundary between two pixels, and reaches a minimum when it lies at the boundary between four pixels. The nonuniform response distribution of the imaging system to point sources at different positions within the IFOV of a single pixel is shown in Figure 8. Furthermore, this response distribution pattern is repeated periodically across pixels. The results indicate that when the relative position of the point source’s center of mass with respect to the pixel changes, the mean values of both single-point and randomly distributed multipoint responses exhibit considerable variability; the magnitude of this fluctuation cannot be ignored for absolute radiometric calibration.
Figure 8.
Energy response of the imaging system to a point source: (a) trend graph showing the integrated response of the imaging system to a point source at different positions; (b) response image at position A, at the center of a pixel; (c) response image at position B, at the junction of two pixels; and (d) response image at position C, at the junction of four pixels.
The energy response integral of the imaging system with respect to a point source clearly depends on the position. This trend indicates that if the sampling theorem is satisfied, an accurate response can be obtained only by arranging the point sources in an equidistant two-dimensional array and reconstructing the response through subpixel sampling. In this study, the mean response of a 6 × 6 array of point sources is used to represent the overall response of a pixel; the fluctuations in the 36 sets of mean responses for each energy level as a function of position are shown in Figure 9. As shown in the figure, dense sampling of the nonuniform response distribution within the pixels of the imaging system using a 6 × 6 point source array reduced the response fluctuation from 3.0% to less than 0.21%. This result demonstrates the effectiveness of the arrayed configuration in suppressing detector response fluctuations. Notably, the response to a single point source was obtained by integrating over multiple pixels; in this case, the response includes variations between pixels (which relative calibration cannot completely eliminate). The mean response of a 6 × 6 array averages out both the variations between pixels in the imaging system and the nonuniform distribution of the response within each pixel; enhancing the stability of the response further improves the SNR of the point source response.
Figure 9.
Response fluctuation of the point source array mean as a function of position.
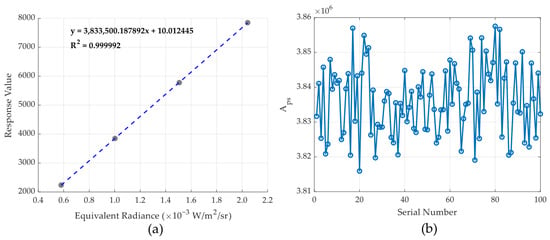
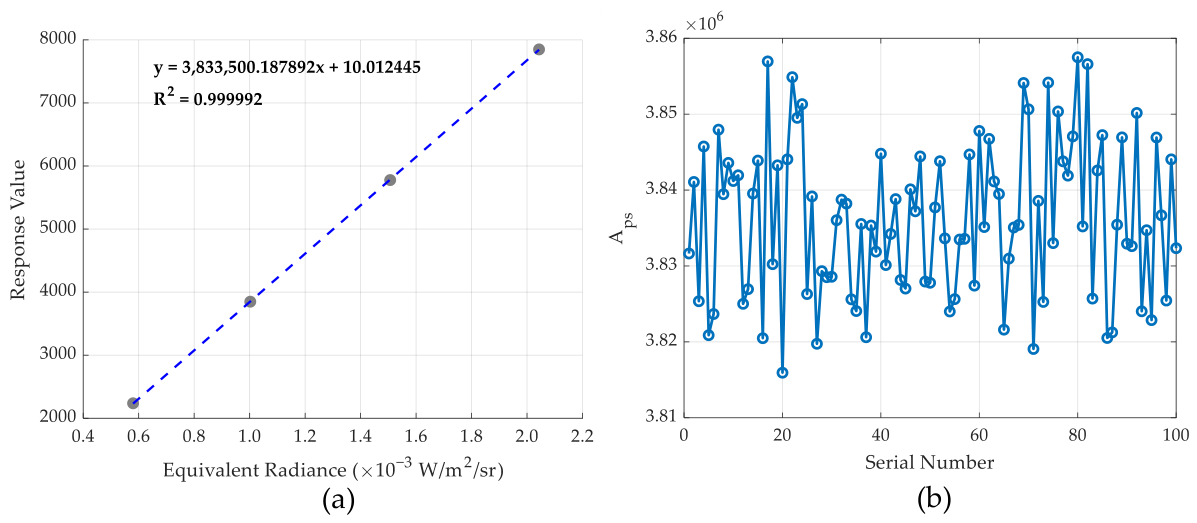
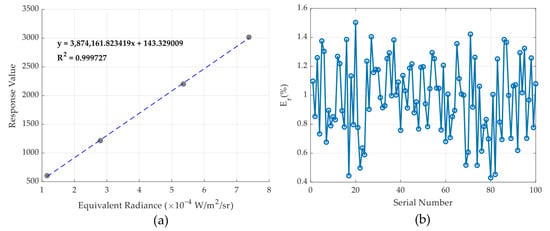
After the point source responses and corresponding radiance values for the four energy levels were obtained, one value was randomly selected from the mean of the 36 6 × 6 array responses for each energy level, and a linear fit was performed using this value in conjunction with the equivalent radiance of that energy level to calculate the camera calibration coefficients, as shown in Figure 10a. This process was repeated 100 times, with response values selected independently and at random for each energy level to simulate the randomness in the positioning of multilevel point sources. The variation in the calibration coefficients over the 100 iterations is shown in Figure 10b. When point sources are arranged in a 6 × 6 array, the linear fit achieves an accuracy better than 0.9999, and the variation in the camera calibration coefficients is less than 0.3%. The results indicate that the point source array, by utilizing subpixel offsets to uniformly sample the pixel response distribution of the imaging system, reduces variations in the point source response as a function of position and improves the stability of the calibration coefficients. This approach thereby provides a reproducible experimental basis for high-precision radiometric calibration.
Figure 10.
Absolute radiometric calibration of a point source: (a) the linear fit of the absolute radiometric calibration curve for a point source, and (b) a plot of the calibration coefficients as a function of response.
In practical on-orbit calibration applications, the dense deployment of a large number of point sources is difficult to achieve from an engineering perspective. Therefore, considering engineering feasibility, optimizing the spatial positions of a small number of point sources to achieve a balance between the number of point sources and the calibration accuracy is highly feasible; this aspect will be analyzed in detail in Section 4.2.
4. Discussion and Analysis
With a 6 × 6 point source array, subpixel offsets enable dense, equally spaced sampling of the pixel response nonuniformity distribution. The array mean response varies by less than 0.21% as a function of position. When the point source response is stable, the absolute radiometric calibration coefficients exhibit high stability. Even with a stable point source response, the calibration performance of a multilevel point source array requires further verification. The number of point sources must also be optimized and the optimization validated against actual on-orbit application requirements.
4.1. Validation of Point Source Calibration Results
An extended source, which is typically used for absolute radiometric calibration, can be viewed as the superposition of infinitely many point sources. To verify the calibration performance of the multilevel point source array, this study compares the point source calibration results from Section 3.2 against those obtained with an extended source. The angular subtense of an extended source at the imaging system end is much larger than the IFOV of a single pixel, and its radiant energy is uniformly distributed across the IFOVs of many pixels. Under these conditions, the optical PSF becomes negligible, and the mean pixel response over an appropriate region directly represents the radiance response of the target at the entrance pupil. An extended source absolute radiometric calibration can be performed given the target equivalent radiance and the imaging system response. Under the same absolute radiometric calibration principle, the coefficients obtained from an extended source and a point source should agree in the ideal case. A comparative experiment between extended source and point source absolute radiometric calibrations was conducted under identical conditions. A uniform extended source that filled the IFOV of a single pixel was produced using the output port of a laboratory-standard integrating sphere. The integrating sphere output was adjusted to four energy levels, and the corresponding radiance was measured using a spectroradiometer. The response of the imaging system to the extended source and the radiance measurement are shown in Figure 11. The mean of the central 7 × 7-pixel region of the extended source response was taken to be the imaging system response value. The spatial uniformity and mean response of the camera to the extended source are listed in Table 2. The spatial uniformity is better than 1%, indicating a high degree of interpixel response consistency across the detector.
Figure 11.
Extended source test: (a) extended source radiance, and (b) the camera’s response to the extended source.
Table 2.
Extended source response.
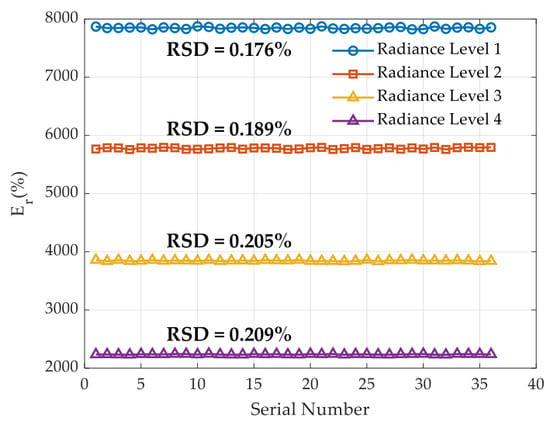
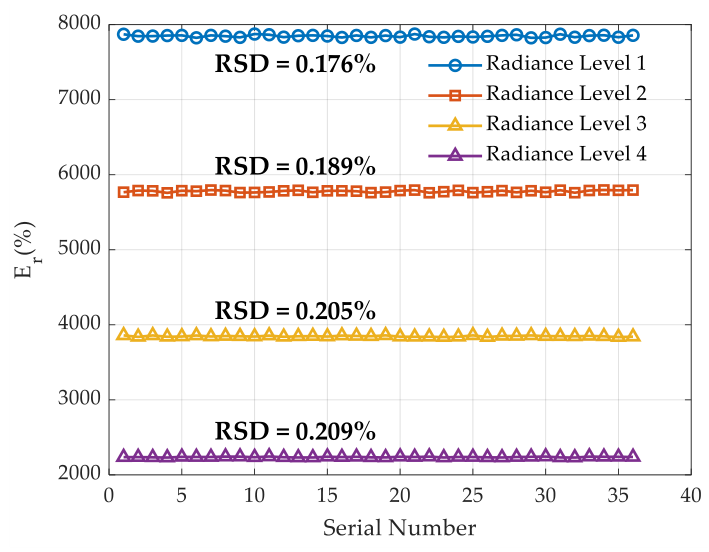
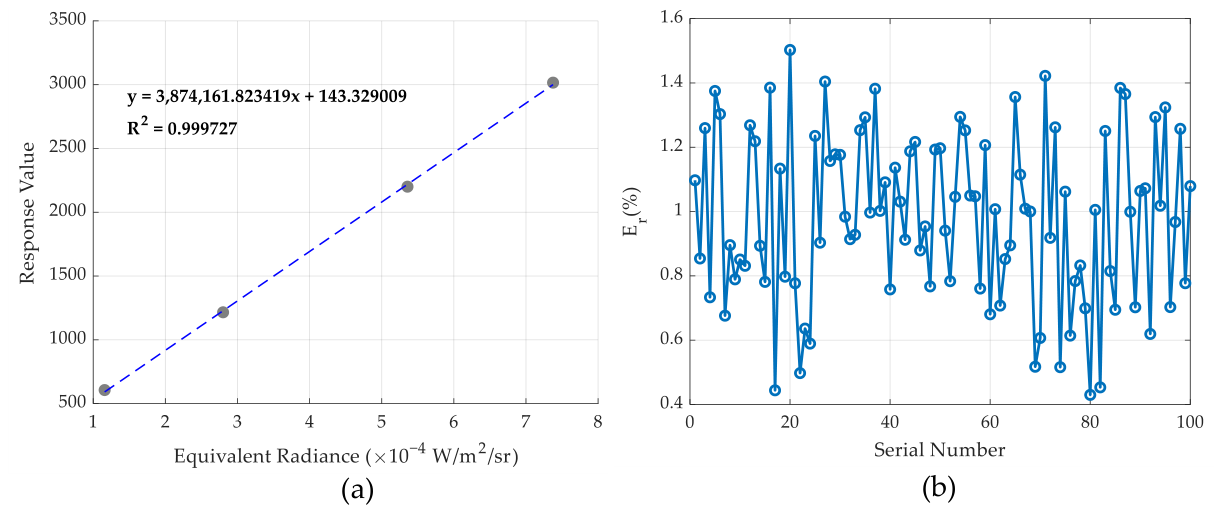
A linear fit between the imaging system response and the entrance pupil equivalent radiance was performed, and the resulting calibration coefficients were taken to be the reference truth against which the point source calibration results were evaluated, as shown in Figure 12a. The consistency between the point source and extended source calibration coefficients was assessed using the relative error Er, defined in Equation (10). The absolute radiometric calibration coefficients derived from the mean response of the 6 × 6 point source array differ from those obtained with the extended source by less than 1.5%, as shown in Figure 12b. The agreement is good, confirming the validity of the point-source-array-based approach to absolute radiometric calibration. In addition, as the number of point sources within the IFOV of a single pixel of the imaging system increases, the intrapixel nonuniformity is sampled more thoroughly, and the mean detector response approaches that of the extended source.
where is the extended source calibration coefficient.
Figure 12.
Comparison of calibration coefficient consistency: (a) extended source absolute radiometric calibration, and (b) differences between point source and extended-source calibration coefficients.
4.2. Point Source Array Optimization
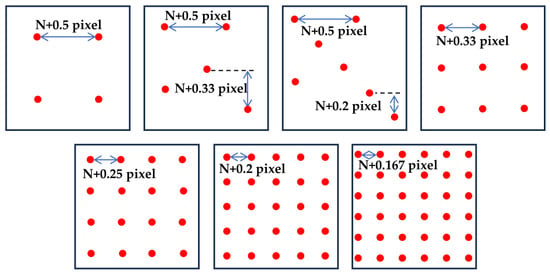
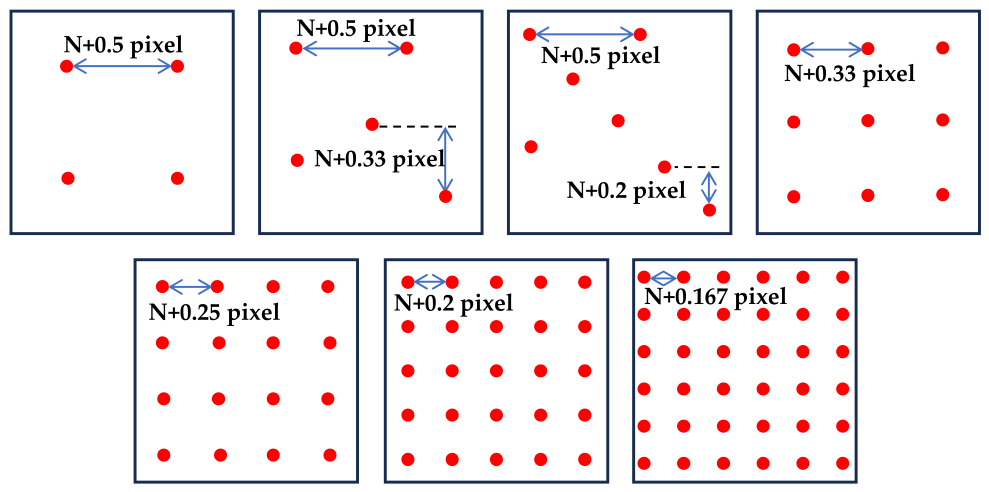
Densely deploying a large number of point sources in an array yields a more accurate detector response, but this practice is difficult to implement in actual on-orbit experiments. Optimizing the layout of the array to reduce the point source count is therefore a practical alternative. The intrapixel nonuniform response distribution of the imaging system can be treated as a continuous two-dimensional function that varies across the pixel, peaking at the center, falling at the boundaries between two pixels, and reaching its minimum at the corners where four pixels meet (Figure 8). This intrapixel response pattern is repeated periodically from pixel to pixel, corresponding to a spatial frequency of . According to the sampling theorem, to avoid aliasing and accurately reconstruct the original signal, the sampling frequency must be at least twice the highest frequency component of the signal (i.e., ). The subpixel spacing of the point source layout is therefore pixel. Under this constraint, a minimum of 2 × 2 point sources (spaced at pixel and uniformly sampled) is required to faithfully recover the two-dimensional pixel response function. Moreover, detector fabrication processes, pixel structure, and related factors introduce device-to-device variations in the symmetry of the intrapixel response distribution. When the response distribution lacks symmetry and the point source count is low, a 2 × 2 orthogonal sampling grid cannot accurately capture the asymmetric response characteristics of the pixel. Adding point sources in the 45° diagonal direction compensates for the spatial information missing from the orthogonal layout (2 × 2) through incremental sampling along the diagonal axis. The point source layout schemes are shown in Figure 13, corresponding to 2 × 2, 5-point (orthogonal plus 45° diagonal), 7-point (orthogonal plus 45° diagonal), 3 × 3, 4 × 4, 5 × 5, and 6 × 6 configurations.
Figure 13.
Point source layout schemes.
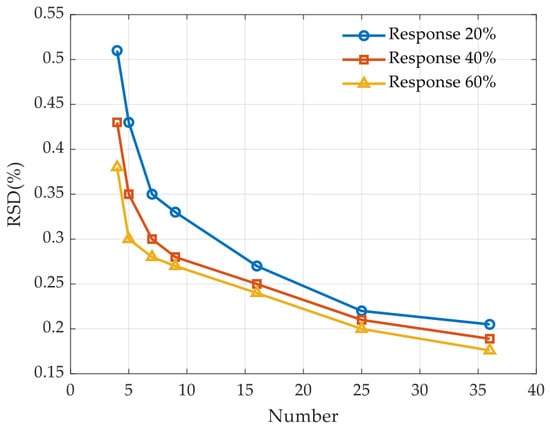
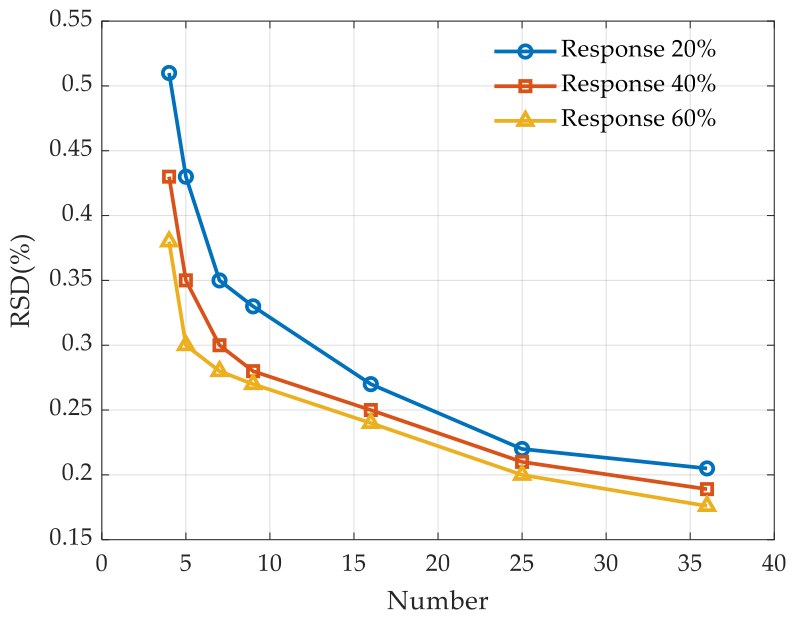
Sampling the two-dimensional response distribution function involves recovering the original distribution from a sparse set of sampling points. The mean of the responses across all sampling points then represents the average response of the pixel response distribution function over the entire pixel. In the experiment, a two-dimensional translation stage controlled the camera position so that the point source was imaged at different locations within the IFOV of a single pixel, with a spacing of pixels between adjacent points. During on-orbit absolute radiometric calibration, the relative position between the detector and the point source is inherently random. Following the same procedure as in Section 3.2, each point source array layout was treated as a single unit. After the initial position was set, the array was translated by 0.5 pixels in both the row and column directions, with a step size of 0.1 pixels. A total of 36 array images were acquired, and the mean response of each set of point sources was calculated. The relative deviation of the mean energy response across the multiple translation positions was then evaluated to quantify how effectively a given layout suppresses response fluctuations. To address the need for multilevel targets in on-orbit absolute radiometric calibration, three representative response levels were selected for laboratory assessment, with single-pixel response peaks at approximately 20%, 40%, and 60% of the maximum. These levels strike a balance between the SNR and dynamic range, preventing noise-dominated evaluation distortion at low signal levels. The results are shown in Figure 14.
Figure 14.
Point source count and response variation trend.
With the 2 × 2 layout, the deviation of the camera energy response to the point source as a function of relative position decreased from 3.0% to less than 0.51%, an approximately sixfold reduction. The 3 × 3 layout reduced the energy response deviation to less than 0.33%, which is close to an order of magnitude reduction. As the point source count increases, the intrapixel response distribution of the imaging system is sampled more completely, and the mean camera energy response shows an overall downward trend in position-dependent deviation.
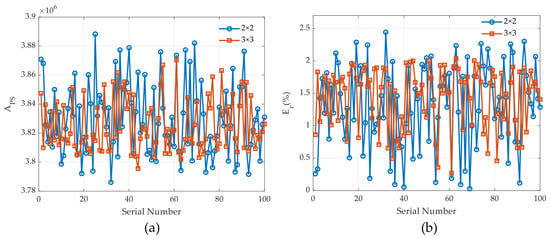
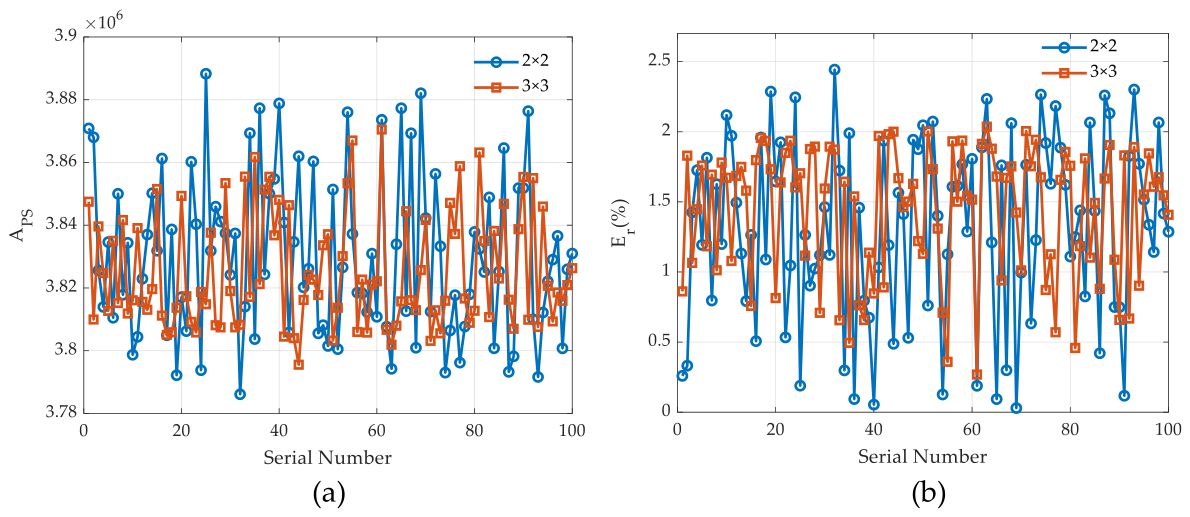
From the 6 × 6 point source responses at 36 positions for each energy level tested in Section 3.2, a total of 36 × 9 sets of 2 × 2 array configurations and 36 × 4 sets of 3 × 3 array configurations were constructed. For each energy level, the mean response was calculated for each configuration, followed by random selection and calibration coefficient fitting. This process was repeated to yield calibration coefficient variation curves from 100 realizations, as shown in Figure 15 and Table 3. With the 2 × 2 and 3 × 3 array layouts, the calibration coefficients varied by less than 0.7% and 0.5%, respectively, as a function of point source response variation. The relative errors between the point source and extended source calibration coefficients were less than 2.5% and 2.0%, respectively.
Figure 15.
Results for the 2 × 2 and 3 × 3 array layouts: (a) stability and (b) accuracy of the calibration coefficient.
Table 3.
Calibration coefficient stability.
The experimental results show that 2 × 2 to 3 × 3 point source arrays (four to nine points) substantially suppress the position dependence of the detector pixel response and improve the stability of the absolute radiometric calibration coefficients. Within this range, fluctuations in both detector response and the calibration coefficient fluctuation remain below 1%, and detector response nonuniformity ceases to be a dominant factor. Adding more point sources yields diminishing returns in stability while steeply increasing layout complexity and cost. Taking both on-orbit implementation complexity and calibration accuracy into account, the 2 × 2 baseline layout can be augmented with additional point sources along the 45° diagonal, up to a maximum of the 3 × 3 configuration. Notably, the point source array recovers the mean pixel response through subpixel sampling and averaging; the discrete sampling of a continuous response distribution sets the fundamental limit of this approach.
4.3. Uncertainty Budget
From the point source absolute radiometric calibration principle, the dominant uncertainty sources in laboratory calibration include integrating sphere radiance measurements, pixel resolution calculations, point source area measurements, and detector response. During the experiment, the uncertainty components are mutually independent. The relative uncertainty of the laboratory test is calculated by combining the individual uncertainty components according to Equation (11) [26].
The spectral radiance of the integrating sphere source was measured by a spectroradiometer. The spectroradiometer’s responsivity was calibrated against a standard lamp–diffuser system, establishing traceability for the radiance measurements to the National Institute of Metrology of China (NIM). The measurement uncertainty arises from four sources: the standard lamp–diffuser system, spectroradiometer nonlinearity, spectroradiometer SNR, and integrating sphere source energy stability. The spectral irradiance standard lamp and the diffuser reflectance are both traceable to NIM, with uncertainties of 1.1% and 1.0% over 350–1100 nm. The lamp-to-diffuser distance and stray light in the laboratory contribute an additional 0.5%. Taken together, the standard lamp–diffuser system has a relative uncertainty of 1.6%. Spectroradiometer nonlinearity contributes 1.0%, and SNR contributes less than 0.5%. The integrating sphere source, after a thorough warm-up, maintained its output stable to within 0.1% over one hour; the contribution of drift was negligible. The relative uncertainty of the integrating sphere source radiance measurement is 2.0%.
Camera pixel resolution was determined from the lens focal length, pixel size, and imaging distance. This was cross-validated by computing the pixel resolution from the object-space and image-space displacements of the point source. Taken together, the pixel resolution accounts for less than 1.0% of the overall radiometric calibration uncertainty. The point source area was derived from the pinhole aperture diameter, which was measured by the National Institute of Metrology of China with an accuracy better than 1 μm, yielding a relative uncertainty of approximately 2.0% for this term. As established in Section 4.2, detector response accounts for less than 1.0% of the uncertainty when the minimum sampling requirement (2 × 2 layout) is met. In summary, the relative uncertainty of the laboratory point source absolute radiometric calibration is 3.2%, with the uncertainty budget given in Table 4.
Table 4.
Laboratory uncertainty of point source absolute radiometric calibration.
The absolute radiometric calibration method based on a point source array is ultimately intended for on-orbit calibration applications. After the laboratory uncertainty analysis and considering typical error sources, we estimated the on-orbit uncertainty level of the method, providing a reference for its practical deployment. The on-orbit absolute radiometric calibration uncertainty for a point source includes contributions from four main categories: the source, instrument, atmosphere, and imaging system response.
During daytime Earth observation, optical remote sensing satellites receive solar radiation reflected from the surface and form images. According to SI-traceable calibration techniques, the uncertainty of the exo-atmospheric solar spectral irradiance in the visible-to-near-infrared band is better than 1.0% [27]. In the SPARC method, convex mirrors reflect solar radiation to form reference point sources. The uncertainty originates primarily from the specular reflectance and radius of curvature of the mirrors. The uncertainty of the radius of curvature is better than 0.5% [28]. The reflectance measurement uncertainty of a convex mirror has two primary sources: instrumental measurement uncertainty and coating nonuniformity. Mirror reflectance is measured under laboratory conditions, and the measurement uncertainty in the visible to near-infrared wavelength range is less than 0.5% [29], which is nearly an order of magnitude better than that of diffuse surfaces, typically around 2% [11]. However, owing to limitations in the coating process, the reflectance across the convex mirror surface exhibits a certain degree of nonuniformity. Furthermore, the mirror reflectance may additionally degrade due to contamination during on-orbit testing. Taking the above factors into account, this study considers that the reflectance uncertainty of a convex mirror is less than 2.0%.
The radiative transfer of point source energy through the atmosphere is a critical factor affecting absolute radiometric calibration accuracy. Convex mirrors receive and reflect only direct solar radiation (the diffuse component contributes negligibly within the effective solid angle of the point source), while background contributions such as path radiance can be removed through image-based subtraction. Consequently, only atmospheric transmittance needs to be considered. The direct atmospheric transmittance can be calculated from the atmospheric optical depth measured by a sun photometer. For a well-calibrated instrument, the measurement error in atmospheric optical depth is 0.01–0.02 [30], corresponding to a relative error in direct transmittance of less than 2.0%. The gaseous absorption transmittance is primarily affected by oxygen, water vapor, and other absorbing species; an appropriate atmospheric profile and aerosol model must be selected based on the elevation and meteorological conditions at the calibration site. In the visible to near-infrared spectral region, the uncertainty in gaseous absorption transmittance from radiative transfer calculations is approximately 1% [6].
The GSD can be calculated from system parameters, with an uncertainty generally considered to be less than 1.0%. For sensors equipped with back-illuminated detectors, with site background uniformity and point source layout taken into account based on laboratory test results, the imaging system response uncertainty for point sources was assessed to be less than 2.0%. Apart from the major factors listed above, the contributions from all other sources are less than 0.5%. Combining all components, we estimated the relative uncertainty of the point source on-orbit absolute radiometric calibration to be 3.9%, as shown in Table 5.
Table 5.
Estimated on-orbit absolute radiometric calibration uncertainty for point sources.
5. Conclusions
The energy response of an imaging system to a point source exhibits a pronounced positional dependence as the relative position between the point source and the pixel varies, constituting one of the factors limiting the accuracy of point-source-based on-orbit absolute radiometric calibration. To address this issue, this paper investigates an absolute radiometric calibration method based on a multilevel point source array and thoroughly analyzes the differences in response stability between a single point source and a point source array as a function of position. The point source array suppresses the intrapixel nonuniform response distribution of the imaging system through subpixel sampling and averaging, thereby reducing the position dependence of the detector response. The calibration coefficients obtained from the point source and from an extended source were compared and validated in the laboratory.
The laboratory results show that with a dense 6 × 6 array layout, the imaging system response fluctuation decreased from 3.0% to 0.21%, and the stability of the calibration coefficient was better than 0.3%, confirming the effectiveness of the point source array in suppressing response fluctuations. The point source calibration coefficients differed from those of the extended source by less than 1.5%, further demonstrating the accuracy of the point source response measurement. With the complexity of the layout in on-orbit calibration accounted for and the point source count optimized, the experimental results indicate that a 2 × 2 to 3 × 3 point source array suppresses the imaging system response fluctuation by a factor of 6 to 10. Under the 2 × 2 to 3 × 3 array layouts, both the detector response stability and the calibration coefficient stability are better than 1%, and the relative error between the point source and extended source calibration coefficients is better than 2.5%. Taken together, the experimental results show that point source layouts in the 2 × 2 to 3 × 3 range offer strong engineering practicality while maintaining calibration accuracy and can serve as a reference for point source on-orbit absolute radiometric calibration.
According to an uncertainty assessment, the relative uncertainty of the laboratory absolute radiometric calibration is 3.2%. After further accounting for the influence of site background uniformity, atmospheric transmission, and ground-based radiometric measurements in the on-orbit environment, we found that the estimated uncertainty of the point-source-based on-orbit absolute radiometric calibration is less than 3.9%. The multilevel point source array calibration method proposed in this study provides a straightforward and practical technical pathway for improving the accuracy of point source on-orbit absolute radiometric calibration and has considerable engineering value.
This study was conducted in a laboratory, where the space environment, site background, and atmospheric conditions differ substantially from those encountered in orbit. Future work will involve carrying out satellite–ground synchronous experiments with point source arrays aboard high-resolution optical remote sensing satellites to further examine the influence of the complex on-orbit environment and the response differences among detector types.
Author Contributions
Q.W. was responsible for the data analysis and writing the manuscript. W.X. led the experiment and participated in data processing. L.Z. contributed to the main research ideas. X.S., S.B. and J.L. reviewed the manuscript and provided valuable suggestions. All authors have read and agreed to the published version of the manuscript.
Funding
This research received no external funding.
Data Availability Statement
All relevant data can be requested by contacting the corresponding authors due to privacy considerations.
Conflicts of Interest
The authors declare no conflicts of interest.
References
- Li, D.; Wang, M.; Guo, H.; Jin, W. On China’s Earth Observation System: Mission, Vision and Application. Geo-Spat. Inf. Sci. 2025, 28, 303–321. [Google Scholar]
- Sun, L.; Hu, X.; Guo, M.; Xu, N. Multisite Calibration Tracking for FY-3A MERSI Solar Bands. IEEE Trans. Geosci. Remote Sens. 2012, 50, 4929–4942. [Google Scholar] [CrossRef]
- Zhao, Y.; Ma, L.; Li, W.; He, H.; Long, X.; Wang, N.; Liu, Z.; Qian, Y.; Qiu, S.; Liu, Y.; et al. Vicarious Radiometric Calibration of Superview-1 Sensor Using RadCalNet TOA Reflectance Product. In Proceedings of the 2021 IEEE International Geoscience and Remote Sensing Symposium (IGARSS), Brussels, Belgium, 11–16 July 2021; IEEE: Piscataway, NJ, USA, 2021; pp. 8130–8133. [Google Scholar]
- Hu, X.; Wang, L.; Wang, J.; He, L.; Chen, L.; Xu, N.; Tao, B.; Zhang, L.; Zhang, P.; Lu, N. Preliminary Selection and Characterization of Pseudo-Invariant Calibration Sites in Northwest China. Remote Sens. 2020, 12, 2517. [Google Scholar] [CrossRef] [Scilit]
- Bao, S.; Chen, H.; Li, Y.; Zhang, L.; Huang, W.; Si, X.; Wang, X.; Fang, Z.; Chen, Y.; Wang, X.; et al. An Improved Vicarious Calibration Method Based on Multi-Grayscale Targets. Remote Sens. 2022, 14, 3779. [Google Scholar] [CrossRef] [Scilit]
- Biggar, S.F.; Slater, P.N.; Gellman, D.I. Uncertainties in the In-Flight Calibration of Sensors with Reference to Measured Ground Sites in the 0.4–1.1 μm Range. Remote Sens. Environ. 1994, 48, 245–252. [Google Scholar] [CrossRef] [Scilit]
- Bowen, H.S. Absolute Radiometric Calibration of the IKONOS Sensor Using Radiometrically Characterized Stellar Sources. Int. Arch. Photogramm. Remote Sens. Spat. Inf. Sci. 2002, 34, 7–13. [Google Scholar] [CrossRef] [Scilit]
- Schiller, S.J.; Silny, J. The Specular Array Radiometric Calibration (SPARC) Method: A New Approach for Absolute Vicarious Calibration in the Solar Reflective Spectrum. In Proceedings of the SPIE Remote Sensing System Engineering III, San Diego, CA, USA, 2 August 2010; Volume 7813, p. 78130E. [Google Scholar]
- Meygret, A.; Blanchet, G.; Mounier, F.; Buil, C. The Stars: An Absolute Radiometric Reference for the On-Orbit Calibration of PLEIADES-HR Satellites. In Proceedings of the SPIE Earth Observing Systems XXII, San Diego, CA, USA, 6–10 August 2017; Volume 10402, p. 1040228. [Google Scholar]
- Meygret, A.; Latry, C.; Kelbert, A.; Blanchet, G. PLEIADES High Resolution Optical Sensors Radiometric and Spatial Calibration Based on Stars. In Proceedings of the SPIE Earth Observing Systems XXIV, San Diego, CA, USA, 11–13 August 2019; Volume 11127, p. 111270X. [Google Scholar]
- Schiller, S.J.; Silny, J.; Teter, M. Comprehensive Vicarious Calibration and Characterization of a Small Satellite Constellation Using the Specular Array Radiometric Calibration (SPARC) Method. In Proceedings of the 31st Annual AIAA/USU Conference on Small Satellites, Logan, UT, USA, 5–10 August 2017. [Google Scholar]
- Durell, C. Top-of-Atmosphere Reflectance Calibration of Satellite and Airborne Sensor Systems Using FLARE Vicarious Calibration Network; Labsphere: North Sutton, NH, USA, 2019. [Google Scholar]
- Holt, J.; Durell, C.; Arnold, W.; Conran, D.; Russell, B.; Valle de Carvalho e Oliveira, P. FLARE Network Performance: Automated On-Demand Calibration for Space, Airborne and UAV Assets. In Proceedings of the SPIE Autonomous Systems: Sensors, Processing, and Security for Vehicles and Infrastructure 2021, Online, 12–17 April 2021; Volume 11748, p. 117480K. [Google Scholar]
- Jin, K.; Park, D.-S. Experiment of KOMPSAT-3/3A Absolute Radiometric Calibration Coefficients Estimation Using FLARE Target. Korean J. Remote Sens. 2023, 39, 1389–1399. [Google Scholar]
- Irwin, A.M. Sub-Pixel Sensitivity Variations and Their Effects on Precision Aperture Photometry. Master’s Thesis, Rochester Institute of Technology, Rochester, NY, USA, 2021. [Google Scholar]
- Donlon, K.; Ninkov, Z.; Baum, S. Astrometric Errors Introduced by Interpixel Capacitive Coupling in Hybridized Arrays. J. Astron. Telesc. Instrum. Syst. 2020, 6, 011006. [Google Scholar] [CrossRef] [Scilit]
- Ivory, J.; Stefanov, K.D.; Turner, P.; Holland, A.D. PSF and Non-Uniformity in a Monolithic, Fully Depleted, 4T CMOS Image Sensor. In Proceedings of the SPIE High Energy, Optical, and Infrared Detectors for Astronomy VIII, Austin, TX, USA, 10–14 June 2018; Volume 10709, p. 1070928. [Google Scholar]
- Cheng, L. Interpixel Capacitive Coupling. Master’s Thesis, Rochester Institute of Technology, Rochester, NY, USA, 2009. [Google Scholar]
- Piterman, A.; Ninkov, Z. Effect of Nonuniform CCD Pixel Sensitivity Variations on Measurement Accuracy. In Proceedings of the SPIE Sensors and Camera Systems for Scientific, Industrial, and Digital Photography Applications II, San Jose, CA, USA, 21–26 January 2001; pp. 280–290. [Google Scholar]
- Zhong, Y.; Li, X.; Zhu, Y.; Hu, Z.; Chen, F. Improved Intra-Pixel Sensitivity Characterization Based on Diffusion and Coupling Model for Infrared Focal Plane Array Photodetector. Sensors 2021, 21, 8195. [Google Scholar] [CrossRef] [Scilit] [PubMed]
- Chen, Z.; Li, X.; Hu, Z.; Liu, X.; Qi, L.; Jiang, L.; Chen, F. A Stellar Energy Extraction Method Based on Exponential Intra-Pixel Sensitivity Model. Infrared Phys. Technol. 2022, 119, 104009. [Google Scholar] [CrossRef] [Scilit]
- Chen, Z.; Hu, Z.; Su, X.; Hu, T.; Chen, F. A Large-Aperture Remote Sensing Camera Calibration Method Based on Stellar and Inner Blackbody. IEEE Trans. Geosci. Remote Sens. 2022, 60, 5005909. [Google Scholar] [CrossRef] [Scilit]
- Anderson, J.; King, I.R. Toward High-Precision Astrometry with WFPC2. I. Deriving an Accurate Point-Spread Function. Publ. Astron. Soc. Pac. 2000, 112, 1360–1382. [Google Scholar] [CrossRef] [Scilit] [PubMed]
- Bryson, S.T.; Tenenbaum, P.; Jenkins, J.M.; Chandrasekaran, H.; Klaus, T.; Caldwell, D.A.; Gilliland, R.L.; Haas, M.R.; Dotson, J.L.; Koch, D.G.; et al. The Kepler Pixel Response Function. Astrophys. J. Lett. 2010, 713, L97–L102. [Google Scholar] [CrossRef] [Scilit]
- Yan, L.; Hu, Y.; Dou, C.; Li, X.-M. Radiometric Calibration of SDGSAT-1 Nighttime Light Payload. IEEE Trans. Geosci. Remote Sens. 2024, 62, 5005715. [Google Scholar] [CrossRef] [Scilit]
- JCGM 100:2008; Evaluation of Measurement Data—Guide to the Expression of Uncertainty in Measurement. Joint Committee for Guides in Metrology: Sèvres, France, 2008.
- Richard, E.; Coddington, O.; Harber, D.; Chambliss, M.; Penton, S.; Brooks, K.; Charbonneau, L.; Peck, C.; Béland, S.; Pilewskie, P.; et al. Advancements in Solar Spectral Irradiance Measurements by the TSIS-1 Spectral Irradiance Monitor and Its Role for Long-Term Data Continuity. J. Space Weather Space Clim. 2024, 14, 10. [Google Scholar] [CrossRef] [Scilit]
- Russell, B.J.; Scharpf, D.; Valle de Carvalho e Oliveira, P.; Elgas, J.; Murgai, V.; Arnold, W.; Holt, J.; Conran, D.N. Initial Results of the FLARE Vicarious Calibration Network. In Proceedings of SPIE 11501, Earth Observing Systems XXV; SPIE: Bellingham, WA, USA, 2020; p. 115010F. [Google Scholar]
- Schiller, S.J. Vicarious Calibration of the IKONOS Earth Observing Sensor Using the Specular Array Radiometric Calibration (SPARC) Method. In Proceedings of the NEWRAD 2011 Conference (New Developments and Applications in Optical Radiometry), Maui, HI, USA, 19–23 September 2011. [Google Scholar]
- Estellés, V.; Campanelli, M.; Utrillas, M.P.; Expósito, F.; Martínez-Lozano, J.A. Evaluation of the new ESR network software for the retrieval of direct sun products from CIMEL CE318 and PREDE POM01 sun-sky radiometers. Atmos. Chem. Phys. 2012, 12, 11619–11630. [Google Scholar] [CrossRef] [Scilit]

Disclaimer/Publisher’s Note: The statements, opinions and data contained in all publications are solely those of the individual author(s) and contributor(s) and not of MDPI and/or the editor(s). MDPI and/or the editor(s) disclaim responsibility for any injury to people or property resulting from any ideas, methods, instructions or products referred to in the content. |
© 2026 by the authors. Licensee MDPI, Basel, Switzerland. This article is an open access article distributed under the terms and conditions of the Creative Commons Attribution (CC BY) license.