


Highlights
What are the main findings?
- A ULS–HLS fused LiDAR workflow combined with stem denoising, treeX segmentation, and the proposed RSQ-Tree framework achieved the best overall performance in estimating individual tree parameters in the complex cold–temperate secondary forest of the study area.
- The optimal scheme obtained high estimation accuracy for DBH, tree height, and crown width, with mean R2 values of 0.96, 0.84, and 0.75 and RMSE values of 1.66 cm, 1.37 m, and 0.74 m, respectively.
What are the implications of the main findings?
- The proposed RSQ-Tree framework highlights the importance of robust estimation strategies tailored to specific parameters, demonstrating that customized modeling for different structural attributes is crucial under the complex forest conditions of the study area.
- The results reveal that different tree parameters are controlled by distinct error sources, with DBH mainly affected by extraction methods, tree height jointly influenced by segmentation and extraction, and crown width highly dependent on segmentation accuracy.
Abstract
Accurate quantification of individual-tree parameters is essential for improving the quality of natural secondary forests; however, conventional measurements remain challenging because of canopy overlap and interference from tall shrubs. Despite the broad use of Light Detection and Ranging (LiDAR) in forest inventory, achieving precise tree segmentation and parameter estimation in complex forest stands remains difficult. This study utilized unmanned aerial vehicle laser scanning (ULS) and handheld laser scanning (HLS) data to systematically evaluate the impact of single-source point clouds versus fused point clouds, different segmentation methods (CHM, treeX, and CSP), and different estimation approaches on the estimation of individual tree parameters, and proposed the RSQ-Tree framework for robust parameter extraction. Comparative analysis of seven experimental schemes across 473 sample trees in six plots showed that the “stem denoising + fused data + treeX + RSQ-Tree” scheme performed best, with R2 values of 0.96, 0.84, and 0.75 for estimates of diameter at breast height, tree height, and crown width, respectively, and substantially reduced RMSE. These results indicate that multi-source LiDAR fusion, combined with robust segmentation and parameter modelling, can effectively improve the accuracy and stability of individual-tree parameter estimation in complex secondary forests.
1. Introduction
Natural secondary forests are forest types that gradually recover after primary forests have been disturbed by fire, excessive logging, or other disturbances, and they are of strategic importance for maintaining regional ecological security and regulating climate [1]. Secondary forests account for 46.2% of China’s total forest area and constitute a fundamental component of its forest resources, particularly in Northeast China [2]. As the basic units of forest structure analysis and resource inventory, individual-tree parameters, such as diameter at breast height (DBH), tree height, and crown width, must be accurately measured for forest resource surveys and carbon stock assessment. Conventional ground-based surveys rely on destructive sampling or manual measurements, and their limited viewing perspectives make measurements difficult in stands with complex understory structures, resulting in substantial subjective observational errors [3,4]. Therefore, developing reliable methods for extracting individual-tree parameters in complex forest environments is a key issue in precision forest management and resource monitoring.
Light Detection and Ranging (LiDAR) data can be acquired using different sensors and platforms, generating three-dimensional point clouds with varying point densities, accuracies, and viewing perspectives [5,6]. In recent years, close range LiDAR platforms, such as ULS, HLS, and BLS, have shown substantial advantages in acquiring individual-tree information [7,8]. However, different sensors still have distinct limitations under different application scenarios. HLS uses a bottom-up scanning approach and is suitable for extracting tree DBH and lower-canopy structural parameters; however, in complex stands, it is difficult to capture upper-canopy information, leading to large errors in estimating upper-canopy structural indices [9,10]. Although ULS can rapidly acquire canopy structural information over large areas [11], it is affected by terrain and flight altitude and cannot accurately characterize lower-stem information, posing substantial challenges for estimating parameters such as DBH and stem volume [12,13]. Therefore, researchers have integrated the two data sources to obtain more complete individual-tree point cloud structures [14,15,16]. However, in complex secondary forests, interference from tall shrubs and canopy overlap still limit the effective use of fused point clouds at the individual-tree scale.
Individual-tree segmentation is also a critical step affecting the accuracy of parameter extraction in complex natural secondary forests. Existing individual-tree segmentation methods can generally be classified into top-down approaches based on canopy height models (CHMs) and bottom-up approaches based on stem clustering and identification. CHM-based methods can rapidly identify treetops using ULS data; however, canopy overlap and irregular crown shapes in natural secondary forests make top-down segmentation prone to omissions and misclassification [17,18,19,20]. Similarly, the performance of bottom-up segmentation methods based on TLS data in natural secondary forests remains to be further investigated. Tao et al. [21] proposed the comparative shortest-path (CSP) method. This method begins with stem identification and then assigns canopy points, making it more suitable for exploiting stem structural information from HLS or fused point clouds; however, the applicability of this segmentation method in secondary forests remains to be studied [22]. Therefore, the applicability of different segmentation strategies in complex natural secondary forests in the cool-temperate zone requires further comparison to select an appropriate method for individual tree segmentation in secondary forests.
Traditional parameter extraction methods are highly sensitive to missing local points, outliers, and ambiguous canopy boundaries, leading to different error mechanisms in the estimation of diameter at breast height, tree height, and canopy width [23]. Point clouds of individual trees may contain missing data due to occlusion, incomplete scanning, and other factors, thereby affecting parameter estimates; consequently, many studies have focused on refining tree modeling information—such as quantitative structural models (QSM)—to estimate structural attributes like individual tree height, crown volume, and branch structure. However, these methods are typically time-consuming and require a high level of operational expertise [24,25]. DBH estimation relies on a complete trunk point cloud at 1.3 m above ground level; when point cloud incompleteness cannot be fully resolved, researchers have improved estimation accuracy by enhancing the robustness of DBH estimation methods [26], but the effectiveness of this approach in secondary forests with complex understory structures remains unknown. Therefore, it is necessary to develop differentiated and robust parameter-extraction methods tailored to the error sources of different individual-tree parameters.
To address the challenges of reliably estimating individual tree parameters in complex cold–temperate natural secondary forests, this study developed a robust framework based on fused ULS and HLS point clouds. This framework integrates trunk denoising, individual tree segmentation, and robust estimation of specific parameters to improve the accuracy of extracting diameter at breast height (DBH), tree height, and crown width in the presence of shrub interference, canopy overlap, and incomplete point clouds. Through experiments conducted across six plots, this study investigated the impact of different processing steps on parameter estimation accuracy, as well as the primary sources of error and their propagation mechanisms in complex forest environments.
2. Materials and Methods
2.1. Study Area
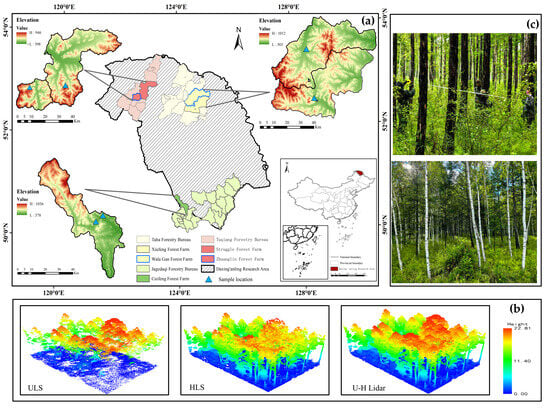
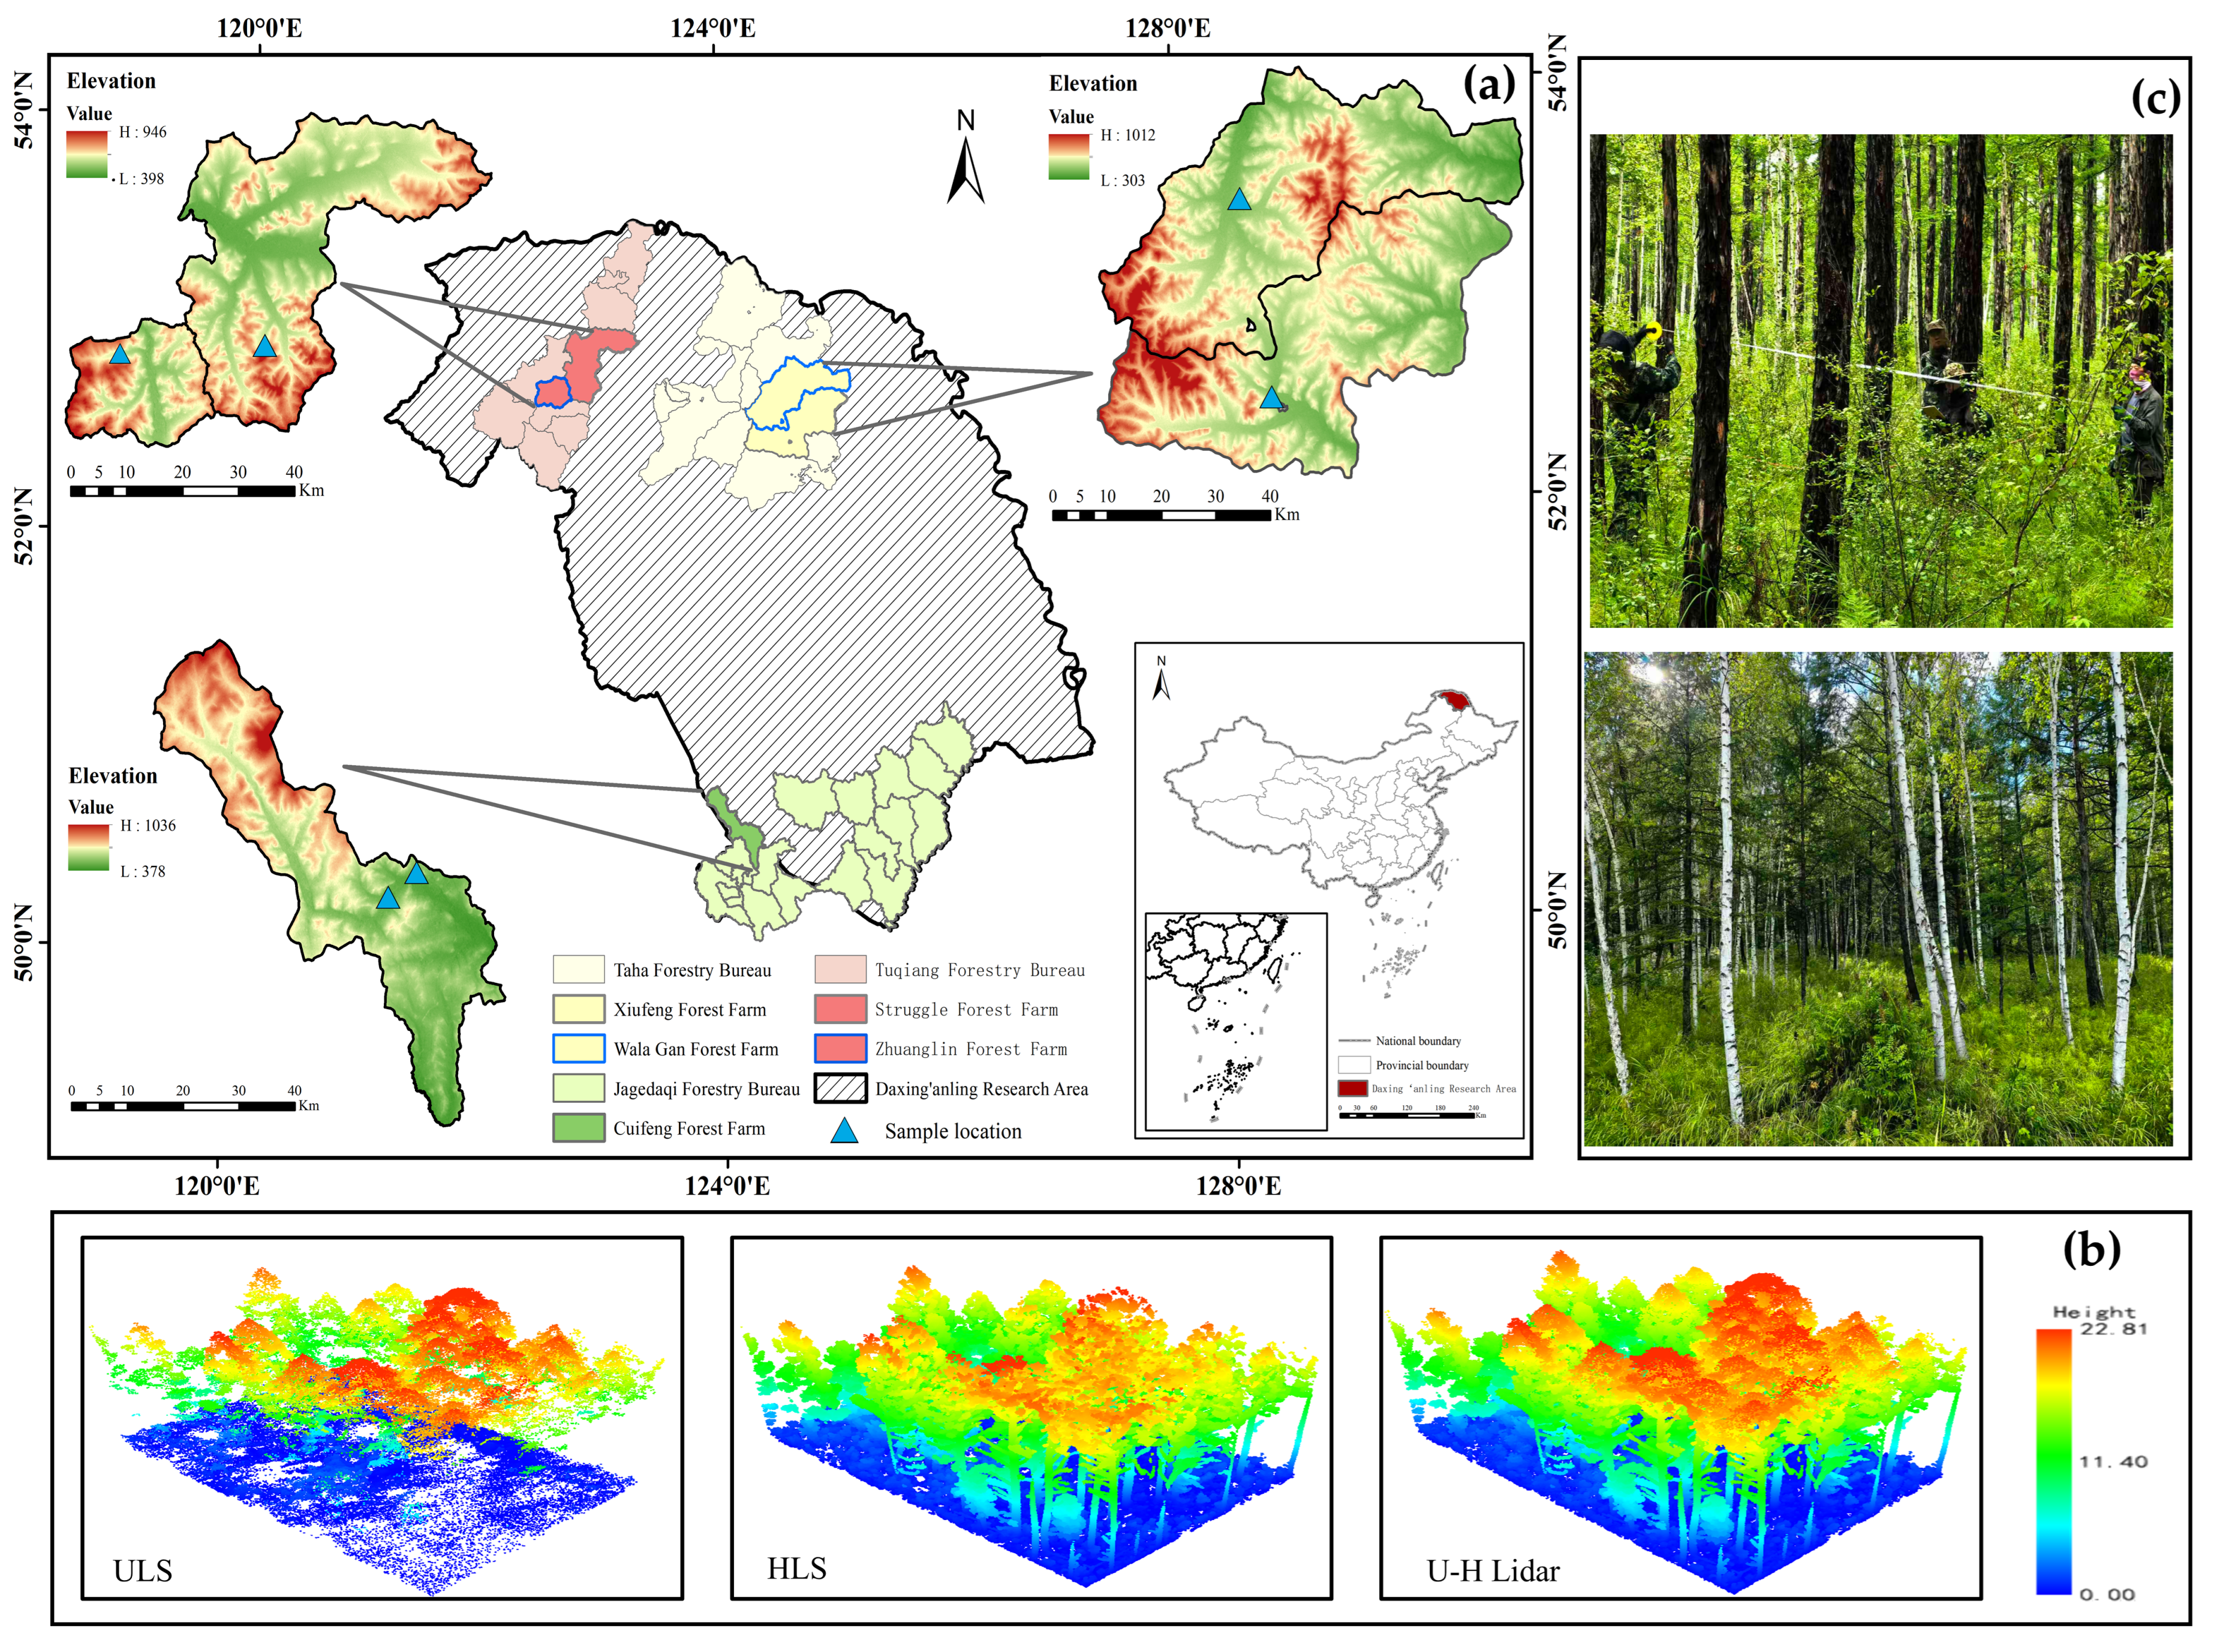
The study area is located in the Greater Khingan Mountains region of Heilongjiang Province, China (Figure 1). This region is an important state-owned forest area in China, where Larix gmelinii (Rupr.) Kuzen. forest is the dominant vegetation type by area; its complex understory shrub structure and terrain make it a typical representative of cold–temperate natural secondary coniferous forest ecosystems.
Figure 1.
Overview of the study area. (a) Location of the Xiufeng, Walagan, Cuifeng, Struggle, and Zhuanglin forest farms and the distribution of the sample plots in the Greater Khingan Mountains, Heilongjiang Province, China; (b) Example of a LiDAR point cloud within a sample plot; (c) Photographs showing forest stand conditions in two representative plots.
2.2. Data Acquisition
2.2.1. LiDAR Data
Two types of LiDAR data were used in this study: ULS and HLS. In August 2024, all ULS data across the study area were acquired sequentially using a D-lidar2200 sensor (Feima Robotics Co., Ltd., Shenzhen, China) mounted on a Pegasus D2000s (Feima Robotics Co., Ltd., Shenzhen, China) multirotor platform in terrain-following flight mode, with a flight altitude of approximately 100–120 m above ground level and a flight speed of approximately 7 m/s. The laser scanner operated in triple-echo mode, with a 60° field of view, a swath width of 110–138 m, a flight-line spacing of 28–34 m, and an overall point-cloud density of approximately 109 points m−2. HLS data were collected simultaneously within the coverage area of the ULS data using a LiGrip O1 Lite laser scanning system (GreenValley International Inc., Berkeley, CA, USA). The positioning accuracy was ≤2 cm, and the scanning rate was 200,000 points per second (Table 1).
Table 1.
Main specifications of the UAV-borne LiDAR (ULS) and handheld mobile LiDAR (HLS) systems used in this study.
2.2.2. Field Data
In August 2024, an individual-tree inventory survey was conducted in six 20 m × 30 m plots dominated by the main tree species, Larix gmelinii (Rupr.) Kuzen. and Betula platyphylla Suk, within the study area. In total, 473 trees were surveyed. Recorded attributes included tree height (m), diameter at breast height (cm), crown width (m), tree species, and spatial location; diameter at breast height was measured using a diameter tape, tree height was measured using a height meter (measuring pole), and crown width was represented by the average of measurements taken in two perpendicular directions using a tape measure. The spatial location of each tree was recorded using a Real-Time Kinematic (RTK) GPS receiver, with positioning accuracy within 5 cm. The principal descriptive statistics for the six plots are presented in (Table 2).
Table 2.
Descriptive statistics of measured individual-tree attributes in the six sample plots.
2.3. Methods
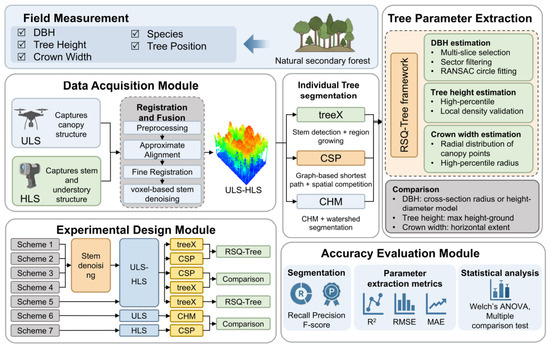
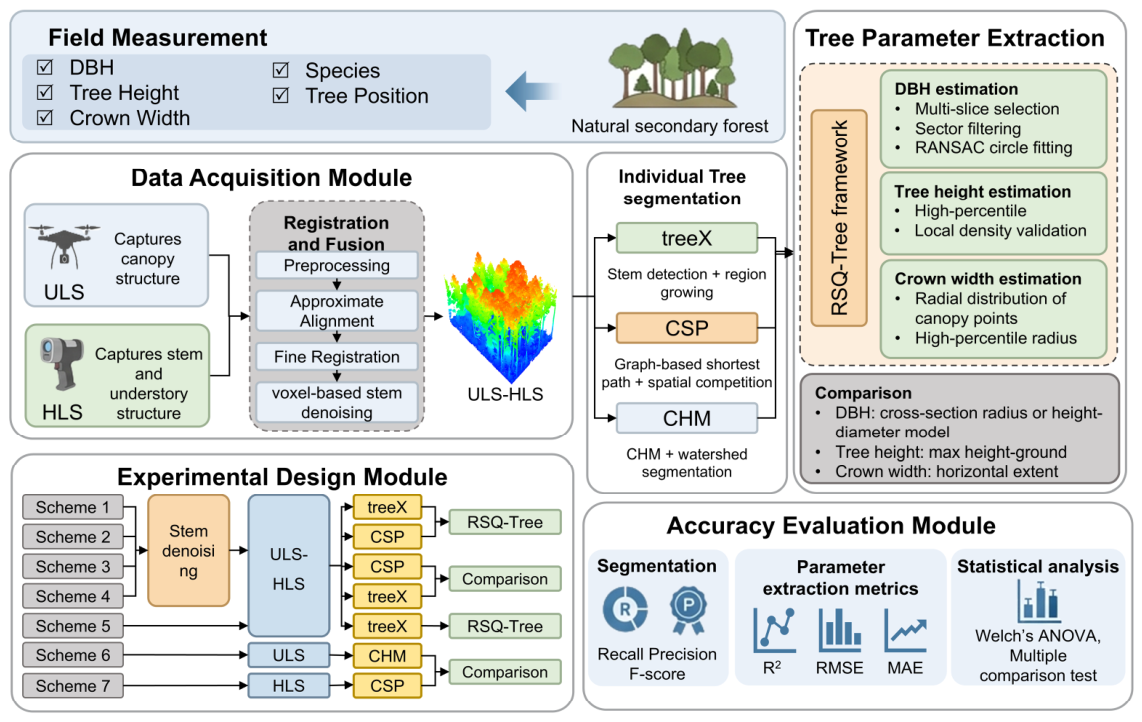
This study designed seven experimental schemes (Table 3). to compare the performance of different combinations of data types, segmentation methods, and parameter estimation methods in extracting individual tree parameters in natural secondary forests. The process primarily consists of four steps (Figure 2): (1) Preprocessing of ULS and HLS point clouds, including point cloud denoising, ground normalization, and fusion registration; (2) Trunk denoising and individual tree segmentation, including the removal of shrub points based on trunk point cloud density and vertical connectivity, and individual tree segmentation of different combinations of LiDAR data using three algorithms (treeX, CSP, and CHM); (3) Estimation of individual tree parameters, using both an optimized individual tree attribute estimation framework and traditional estimation methods to estimate DBH, tree height, and crown spread from individual tree point clouds; (4) Accuracy assessment and analysis of variance.
Table 3.
Description of the experimental schemes used in this study.
Figure 2.
Workflow for extracting individual tree parameters from natural secondary forests using ULS–HLS fused data.
2.3.1. LiDAR Data Preprocessing and Registration
To improve the accuracy and efficiency of the analysis, this study performed a three-step preprocessing of the ULS and HLS point clouds: (1) denoising to remove outliers generated during data acquisition; (2) ground point classification using an improved TIN algorithm; (3) normalization of the point cloud based on ground points to eliminate the effects of terrain variations.
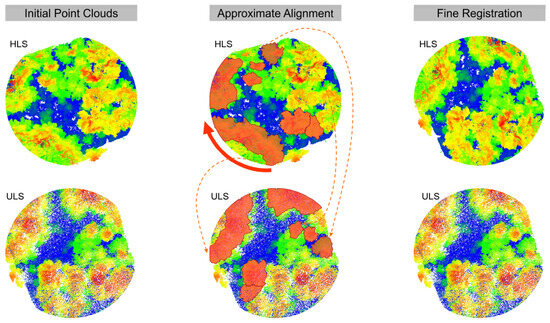
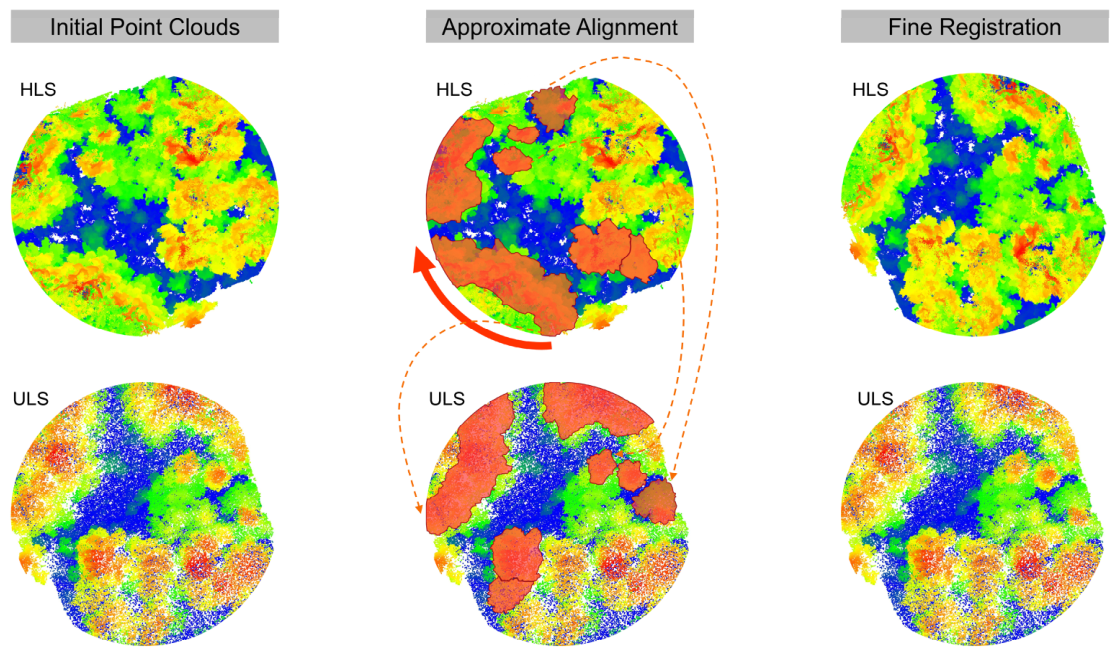
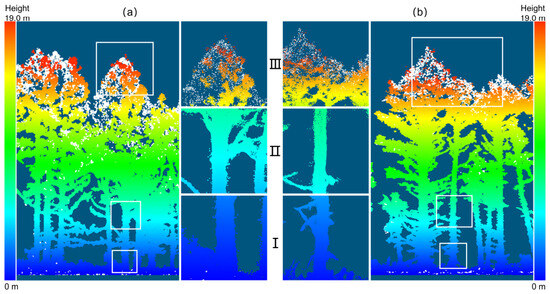
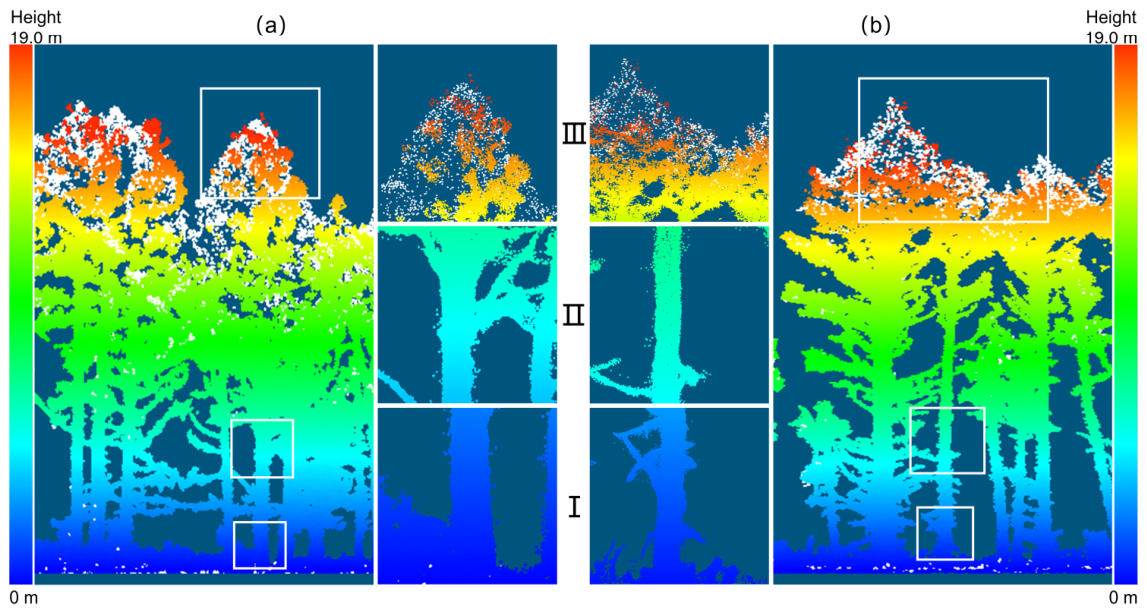
Next, based on horizontal canopy features, the HLS point cloud was manually rotated and translated to achieve rough overlap with the ULS point cloud, thereby completing the registration of the ULS and HLS data (Figure 3). Significant differences in point density between the two datasets can cause biases in local geometric descriptors and reduce the stability of the registration. To improve the consistency of feature matching, the HLS point cloud was downsampled prior to feature extraction to match the spatial density of the ULS data. In this study, the final fused point cloud used for individual tree parameter estimation retained the HLS data at its original resolution, thereby ensuring that information regarding trunk structure was not lost. Subsequently, the FPFH method was employed for coarse registration: For each query point p, geometric features between p and its neighboring points pi were calculated to construct the SPFH, which was then combined using weighted aggregation to obtain the FPFH descriptor [27,28], as shown in Equation (1):
Figure 3.
Approximate alignment and fine registration of the HLS point cloud to the ULS point cloud. The solid-line arrows indicate the direction of point cloud rotation, while the dashed-line arrows point to similar canopy structures between the two point cloud datasets.
Here, represents the SPFH of the query point, and represents the SPFH of the neighboring points within the query point’s neighborhood. Finally, fine registration of the two datasets was achieved using the iterative closest point (ICP) method, which constructs a rigid transformation by matching each query point pi with its corresponding point qⱼ and iterates until convergence.
2.3.2. Individual-Tree Segmentation Based on Multi-Source LiDAR Data
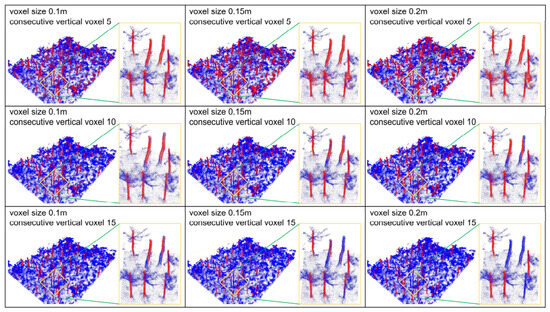
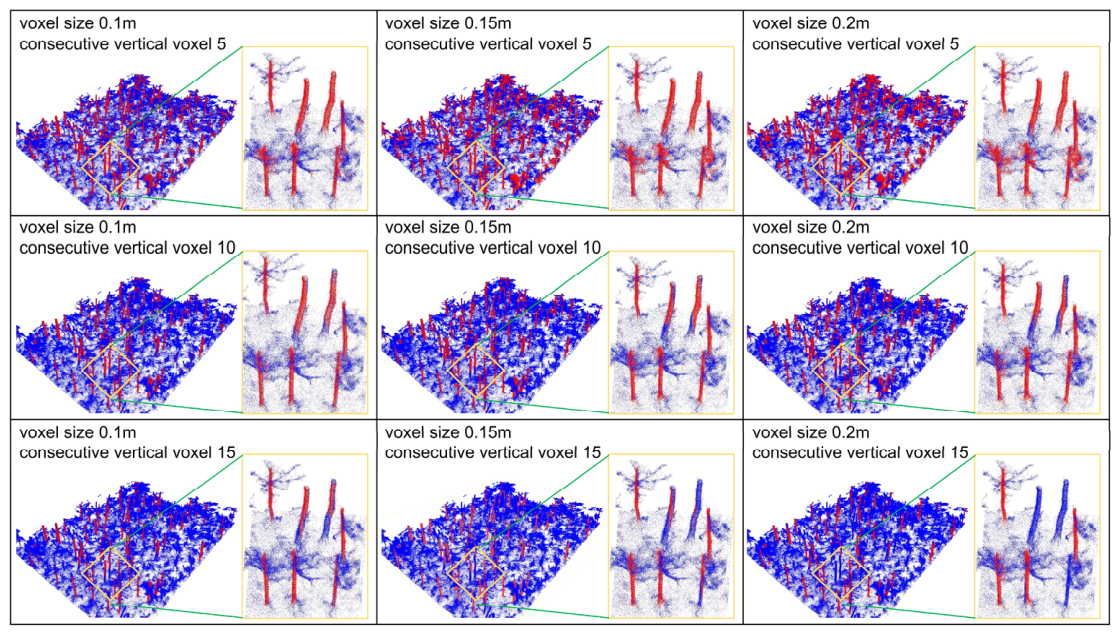
In natural secondary forests, shrubbery and low-hanging side branches can significantly affect the quality of tree trunk point clouds. To address this issue, this study introduces a voxel-based tree trunk denoising method prior to single-tree segmentation. Designed as a structural filtering method, this approach leverages the strong vertical continuity and high-density characteristics of tree trunk point clouds to distinguish between shrub points and tree trunk points, and uses these structural features to guide parameter selection. Specifically, the tree trunk point cloud is first extracted and densely segmented into several three-dimensional voxel blocks; subsequently, valid voxels are selected based on point density and vertical connectivity within the voxels. As Figure 4, when the point-density threshold was set to ≥10, a voxel resolution greater than 0.15 m resulted in incomplete stem retention; when the connected-voxel threshold was 5, shrubs could not be completely removed, whereas a threshold of 10 caused some curved stems to be incorrectly removed. The comprehensive analysis indicated that the best performance was achieved with a voxel size of 0.1–0.15 m and a connectivity threshold of 5–10. Although visual comparison was used to validate this process, the adopted parameter combination reflects the geometric properties of the data rather than empirical tuning toward optimal results. When applying the proposed method to forests with different stand structures or point cloud acquisition conditions, the selected voxel size and connectivity threshold may need to be recalibrated. In addition, a non-denoising control scheme (Scheme 5) was established to quantify the effects of denoising on segmentation and parameter-extraction accuracy.
Figure 4.
Performance of the voxel-based denoising algorithm under different parameter settings. Red represents the point cloud of the retained stem, while blue represents the point cloud of interference such as side branches or shrubs. The vertical panels show comparisons under the same voxel size, while the horizontal panels show comparisons under the same connectivity threshold.
Considering the complementary observation perspectives of ULS and HLS data, individual-tree segmentation experiments were conducted on the fused point-cloud data using two representative bottom-up algorithms, treeX [29] and CSP, and their results were comparatively evaluated.
Both methods used DBSCAN to identify tree stems, but they differed substantially in their crown-assignment mechanisms. treeX selects seed points based on the height-to-diameter ratio and vertical continuity, and then performs unsupervised crown segmentation by iteratively growing neighboring points from the seed regions according to local connectivity. In this study, to avoid biases caused by manual adjustments, treeX was implemented using its recommended default parameter settings, which were uniformly applied to the single-tree segmentation experiments across all plots. Specifically, for 2D DBSCAN, the radius was set to 0.025 m and the minimum cluster size to 90; for 3D DBSCAN, the radius was set to 0.1 m and the minimum cluster size to 15; the region-growing step used a voxel resolution of 0.05 m, and the maximum search radius was 0.5 m.
The CSP algorithm treats the point cloud as a weighted undirected graph and uses Dijkstra’s algorithm to calculate the shortest-path distance from each point to all potential stem sources; each point is then assigned to the stem with the minimum shortest-path distance. In this study, CSP segmentation was conducted within the LiDAR360 V5.2 software environment using its standard parameter configuration (cluster tolerance of 0.2 m and minimum cluster size of 500) [30]. Additional constraints on DBH range and minimum tree height were defined according to field observations (Table 2) to exclude implausible detections, rather than to optimize segmentation accuracy.
At the same time, this study also conducted single-tree segmentation experiments in the study area using the CHM method to investigate its applicability in secondary forests. ULS data were rasterized to generate a two-dimensional CHM with a resolution of 0.2 m; the canopy boundaries were delineated using a watershed segmentation algorithm; and the CHM was divided into individual canopy regions using a 5 × 5 local maximum detection window. To compare the differences among various data sources and segmentation strategies, this study uses the CHM method based on ULS data and the CSP method based on HLS data as controls to quantify the impact of segmentation methods and data types on the accuracy of individual tree parameter estimates.
2.3.3. Individual Tree Parameter Extraction
To ensure robust individual tree parameter estimation under complex, noisy, and occluded forest conditions, we developed the “Robust Sector–Quantile Tree” (RSQ-Tree) framework. Instead of relying on conventional extreme-value or simplistic geometric fits, RSQ-Tree incorporates sector-based spatial constraints and statistical quantile filtering tailored to the specific error sources of each structural attribute.
- DBH Estimation: To mitigate the impacts of incomplete stem scanning and understory brush noise, a multi-slice RANSAC circle-fitting strategy was implemented around breast height (1.3 m). For each horizontal slice, stem points were partitioned into angular sectors. To ensure sufficient stem representation, candidate slices were accepted only when both the circumferential coverage and the inlier ratio satisfied predefined thresholds. Circumferential coverage was calculated as (Equation (2)):where denotes the maximum angular gap between adjacent stem points. A slice was considered a valid candidate only when its coverage exceeded 150° and its inlier ratio was greater than 30%. The DBH estimate was obtained from the valid slices that met the quality criteria, thereby reducing the influence of local occlusion and incomplete stem observations.
- Tree Height Estimation: To prevent overestimation caused by isolated canopy outliers (e.g., flying points or misclassified foliage), an adaptive high-quantile strategy was used instead of the absolute maximum elevation. Top-point candidates were filtered within a high percentile range (0.995–0.9995) under a minimum point-count constraint, followed by a local density check to eliminate isolated noise. The final tree height is defined as the median elevation of the remaining top points (Equation (3)):where denotes the elevation of the i-th point, and represents the optimal high-quantile threshold that satisfies the minimum top-point requirement. This method avoids significant underestimation of tree height while effectively reducing the influence of extreme high points on the results.
- Crown Width Estimation: To minimize sensitivity to irregular canopy boundaries and sparse edge outliers, a radial quantile-based approach was applied. After removing isolated noise using a k-nearest-neighbor (kNN) density filter, the planimetric canopy center was defined by median coordinates. The effective crown extent was then determined using a high quantile (the 95th percentile) of the radial-distance distribution from the center, rather than the absolute maximum radius, providing a stable estimate resistant to protruding branches.
At the same time, to compare different parameter extraction strategies, this study calculated individual tree attributes using conventional methods: DBH was estimated based on the relationship between tree height and diameter at breast height (DBH), using a standard single-slice circular fit; tree height was determined based on the absolute maximum elevation; and crown width was determined based on the maximum horizontal bounding box [31]. All parameters used in the RSQ-Tree framework were determined based on the geometric characteristics of the tree point cloud and preliminary tests, and were kept constant throughout all experiments without being adjusted using reference measurement data.
2.3.4. Accuracy Assessment
- Accuracy Verification of ULS and HLS Point Cloud Registration: In this study, registration accuracy was assessed by computing the distances from the ULS point cloud to the HLS point cloud. Because the reference point cloud (ULS) has a lower point density than the target point cloud (HLS), a local modeling strategy (least-squares plane method) was employed in the point-to-point distance computation to create local models based on the nearest points from the reference cloud [32].
- Accuracy assessment of individual tree segmentation: In this study, the accuracy of individual-tree segmentation was evaluated using one-to-one matched individual trees. The accuracy of individual tree segmentation was evaluated using three metrics: detection rate (), precision (), and F-score (F) (Equations (4)–(6)) [33].where TP (true positive) represents trees being detected correctly, i.e., 1:1 matched trees; FN (false negative) represents that trees were not detected, and FP (false positive) represents that trees were detected incorrectly.
- Accuracy Assessment of Single-Tree Parameter Estimation: To evaluate the accuracy of single-tree parameter estimation based on 1:1 paired trees, this study assessed the algorithm’s performance by analyzing the coefficient of determination (R2) from regression analysis between the estimated parameters and the measured parameters, as well as the root mean square error (RMSE) and mean absolute error (MAE) of the estimated parameters [34,35].
- To evaluate the estimation accuracies of DBH, tree height, and crown width among different schemes, the absolute errors of individual trees successfully matched by geographic coordinates were used for statistical analysis [35]. Due to differences in preprocessing and segmentation workflows among the seven schemes, the detected trees are not fully consistent across schemes, making a strictly paired or repeated-measures analysis infeasible on the complete dataset. Therefore, a conventional one-way ANOVA (or Welch ANOVA) was adopted to provide a general comparison of performance trends among schemes. First, Levene’s test was conducted to assess variance homogeneity. One-way ANOVA or Welch’s ANOVA was then applied based on the homogeneity results (p < 0.001), followed by Tukey’s HSD or Games–Howell post hoc tests for pairwise scheme comparisons. Effect sizes η2 (Eta squared) or ω2 (Omega squared) were calculated to quantify the practical magnitude of differences among schemes [36]. Crucially, because the same individual trees were evaluated repeatedly across multiple schemes and nested within six plots, these tree-level observations are not fully independent. Therefore, rather than relying on traditional significance testing thresholds (p-values), this study primarily utilizes the effect size (η2 or ω2) and post hoc distributional ranges as descriptive and robust indicators to evaluate scheme-level performance differences.
3. Results
3.1. Results of ULS–HLS Point Cloud Registration and Individual Tree Segmentation
As shown in Table 4, after registration, the mean cloud-to-cloud distance between the ULS and HLS point clouds across the six plots ranged from 0.0812 to 0.1057 m, with standard deviations ranging from 0.0844 to 0.1426 m. Figure 5 further visually confirms the reliability of the ULS–HLS registration by showing consistent alignment of corresponding structural features across different forest layers.
Table 4.
The comparison between registered ULS point clouds and HLS point clouds in meters.
Figure 5.
Visual verification results of ULS and HLS registration, using Plot 1 (a) and Plot 3 (b) as examples. Sections (I–III) correspond to the trunk, the lower-middle section of the trunk, and the canopy, respectively, at a height of 1.3 m above the ground.
The average F-scores for these seven methods across the six plots were 0.95, 0.90, 0.84, 0.86, and 0.83, respectively (Table 5). After shrub removal, treeX successfully identified and segmented 440 of the 473 reference trees, while CSP identified and segmented 421; without shrub removal, treeX and CSP successfully identified and segmented 358 and 331 trees, respectively, while CHM identified and segmented 373 trees. In terms of performance metrics, treeX achieved the highest values for r, p, and F-score—0.96, 0.95, and 0.95, respectively—all of which exceeded the corresponding values for CSP. At the same time, when shrubs were not removed, both the false positive rate and false negative rate of the treeX and CSP segmentation methods increased, with treeX missing the most trees (FN = 75) and CSP misclassifying the most trees (FP = 92). Overall, under complex forest stand conditions, treeX demonstrated stronger detection capabilities and a higher overall segmentation accuracy.
Table 5.
Accuracy of individual-tree detection using the seven schemes.
3.2. Estimation of Individual Tree Parameters
Overall, there were significant differences in the performance of different schemes in estimating individual tree parameters. Among them, Scheme 1 achieved the best overall accuracy in estimating all three parameters, followed by Scheme 2, while schemes without the RSQ-Tree parameter extraction framework or without shrub removal showed relatively lower overall accuracy.
In terms of DBH estimation (Table 6), Scheme 1 performed best, with average R2, MAE, and RMSE values of 0.96, 1.38 cm, and 1.66 cm, respectively, across the six plots. Scheme 2 had average R2 and RMSE values of 0.92 and 1.76 cm, respectively, indicating slightly lower accuracy than Scheme 1. In contrast, Scheme 3′s average R2 dropped to 0.87, while its RMSE rose to 2.50 cm, suggesting that the RSQ-Tree framework can significantly reduce DBH estimation errors when using the same fused point cloud and CSP segmentation results. Scheme 5 exhibited relatively low accuracy, with an RMSE of 2.94 cm, indicating that under the same data conditions and segmentation methods, failure to remove shrubs interferes with the fitting of breast height diameter. Schemes 6 and 7 had the lowest accuracy in breast height diameter estimation, with RMSEs of 4.14 cm and 4.50 cm, respectively. This suggests that relying solely on data from a single platform or failing to remove shrubs can cause non- trunk points at breast height to significantly affect the results of breast height diameter extraction.
Table 6.
Accuracy of DBH estimation across six plots under the seven experimental schemes.
The results of tree height estimation (Table 7) show significant differences among the various methods. Scheme 1 achieved the highest accuracy (R2 = 0.84, RMSE = 1.37 m) and outperformed all other methods. Scheme 2 performed moderately (R2 = 0.67, RMSE = 1.80 m), indicating that CSP is more sensitive to canopy overlap than treeX. Using the same data and segmentation methods, the accuracy of Scheme 5 further declined due to the failure to remove shrubs (RMSE = 1.94 m). Schemes 3 and 4 lacked robustness in the absence of RSQ-Tree, resulting in significant errors with RMSEs of 2.24 m and 2.18 m, respectively. This indicates that while data fusion improves canopy reconstruction, more robust extraction methods are still needed for individual tree attribute extraction. In contrast, Schemes 6 and 7, which employed a single data structure and traditional extraction methods, yielded mediocre performance (RMSE > 2.0 m), confirming that incomplete canopy or trunk information can severely reduce the accuracy of tree height estimates. Overall, RSQ-Tree and multi-source fusion significantly improved the robustness of tree height estimates in complex forest stands compared to using data from a single source.
Table 7.
Accuracy of tree height estimation across six plots under the seven experimental schemes.
Crown width estimation showed the highest sensitivity to segmentation quality and point-cloud completeness among the three tree parameters. As shown in Table 8, clear performance differences were observed across all experimental schemes. Scheme 1 achieved the best performance, with mean values of R2 = 0.75, MAE = 0.62 m, and RMSE = 0.74 m, indicating the highest accuracy and stability across plots. In comparison, Scheme 2 and Scheme 3 showed moderate performance degradation, both with R2 = 0.59, while RMSE increased to 0.82 m and 0.90 m, respectively. This suggests that removing RSQ-Tree or replacing treeX with CSP reduces estimation robustness, even under fused data conditions. When RSQ-Tree or stem denoising was not applied (Schemes 4 and 5), errors increased significantly, with RMSE rising to 1.26 m and 1.41 m, demonstrating that crown boundary estimation is highly affected by understory interference and lack of robust filtering. The single-data-source approaches (Schemes 6 and 7) performed the worst overall, with low R2 values (0.31–0.32) and high root-mean-square errors (0.98–1.15 m), indicating that ULS or HLS alone cannot adequately capture the complete canopy structure in dense secondary forests.
Table 8.
Accuracy of crown width estimation across six plots under the seven experimental schemes.
In terms of stability across different sample plots, Scheme 1 exhibited smaller overall errors in estimating diameter at breast height (DBH), tree height, and crown width, indicating its stable estimation performance. Particularly in DBH estimation, Scheme 1 not only had the lowest root mean square error (RMSE) but also demonstrated good error consistency. According to Table 6, Table 7 and Table 8, the “Trunk Denoising + Fused Data + TreeX + RSQ-Tree” approach performed best and can be considered the optimal method for extracting individual tree parameters in complex cold–temperate natural secondary forests.
For each successfully matched tree in Table 5, the RMSE for DBH, tree height, and crown width was calculated separately. Accordingly, the reported parameter estimation accuracy reflects only successfully detected and matched trees, whereas tree detection performance is evaluated separately. As shown in Table 9, due to the inherent heteroscedasticity among the different schemes (Levene’s test, p < 0.001), Welch’s analysis of variance (ANOVA) was employed for descriptive comparison. The results indicated distinct distributional variations in RMSE for DBH, tree height, and crown width across schemes (Welch’s ANOVA, p < 0.001). Given the non-independent and partially repeated structure of the data, the effect sizes provide a more conservative indication of practical differences than p-values alone: the effect size for DBH was the largest (ω2 = 0.1005), followed by crown width (ω2 = 0.0673), while tree height showed a relatively small effect (ω2 = 0.0291).
Table 9.
Comparison of RMSE distributions and effect sizes across schemes for single-tree parameter estimation.
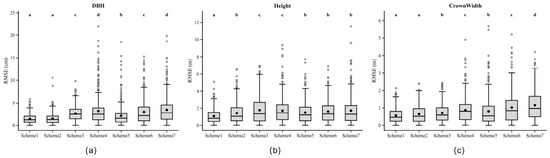
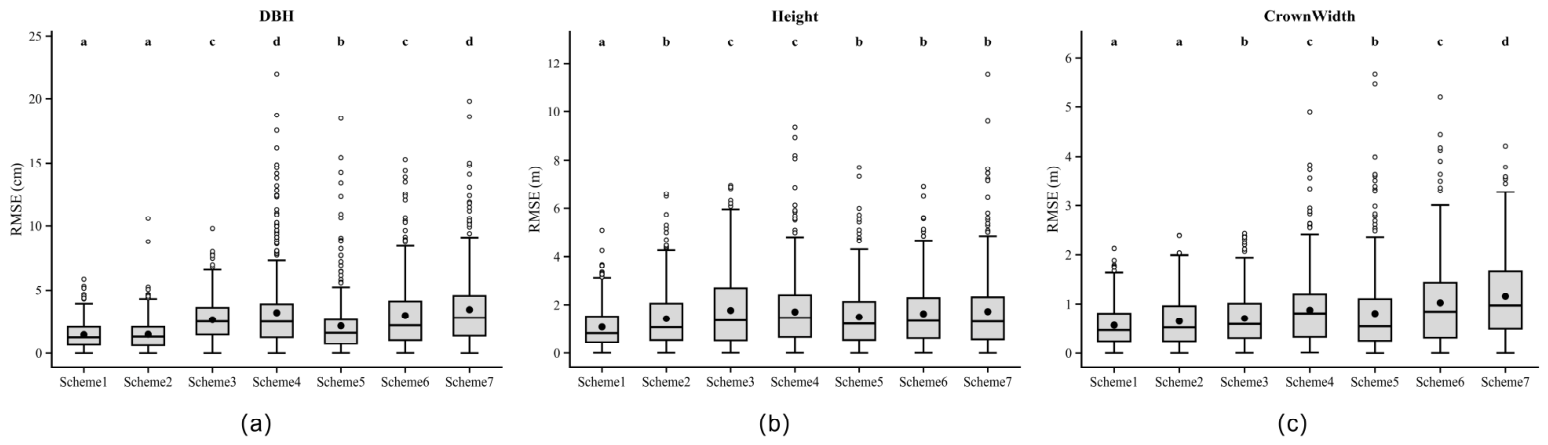
As shown in Figure 6, the distribution of RMSE reveals systematic differences among the various methods, with differing responses observed for DBH, tree height, and crown width. This reflects the sensitivity of each method’s parameter settings to data quality, segmentation, and estimation strategies.
Figure 6.
Distribution of RMSE values for (a) diameter at breast height (DBH), (b) tree height, and (c) crown width under the seven experimental schemes. Each boxplot represents the distribution of RMSE values calculated from individual sample plots. The central line in each box indicates the median value, the black dot represents the mean value, the box boundaries represent the interquartile range (IQR), and the whiskers denote the data range excluding outliers. Hollow circles indicate outliers beyond the whiskers. Different letters above the boxes indicate statistically significant differences among schemes based on Welch’s ANOVA followed by post-hoc multiple comparison tests (p < 0.05).
By comparing Scheme 1 and Scheme 2 under identical conditions (trunk denoising + data fusion + RSQ-Tree), the impact of segmentation methods can be analyzed in isolation. Scheme 1 (treeX) consistently exhibits a lower root-mean-square error (RMSE) and a more compact distribution, with the most significant improvement observed in crown width. This indicates that crown boundary delineation depends largely on segmentation quality, whereas DBH exhibits relatively lower sensitivity. Comparisons between Scheme 2 and Scheme 3, as well as between Scheme 1 and Scheme 4, highlight the contribution of RSQ-Tree. Under the same data type, segmentation method, and trunk denoising conditions, Schemes 3 and 4 exhibit increased RMSE, particularly for tree height and crown width, suggesting that these parameters are more susceptible to the effects of crown outliers and point cloud missing values. The comparison between Schemes 3 and 4 reflects the impact of segmentation under conventional estimation methods. Replacing CSP with treeX primarily improved the accuracy of crown width, while only limited improvements were observed for DBH and tree height, further confirming that segmentation errors are primarily propagated to crown-related attributes.
The comparison between Schemes 1 and 5 clearly demonstrates the role of trunk denoising. Without shrub removal, errors in all parameters increase, with the most significant impact observed on DBH, indicating that noise at the stem level directly interferes with stem fitting. Finally, Schemes 6 and 7 reveal the limitations of a single data source, as their root-mean-square error (RMSE) remains consistently high—particularly for tree height and crown width—suggesting that canopy integrity in the fused data is crucial for these parameters.
Overall, breast height diameter is primarily constrained by trunk mass, tree height is influenced by crown integrity and outliers, and crown width depends on segmentation accuracy; this explains why Scheme 1 performs better and is more stable.
3.3. Regression Analysis of Parameter Estimation
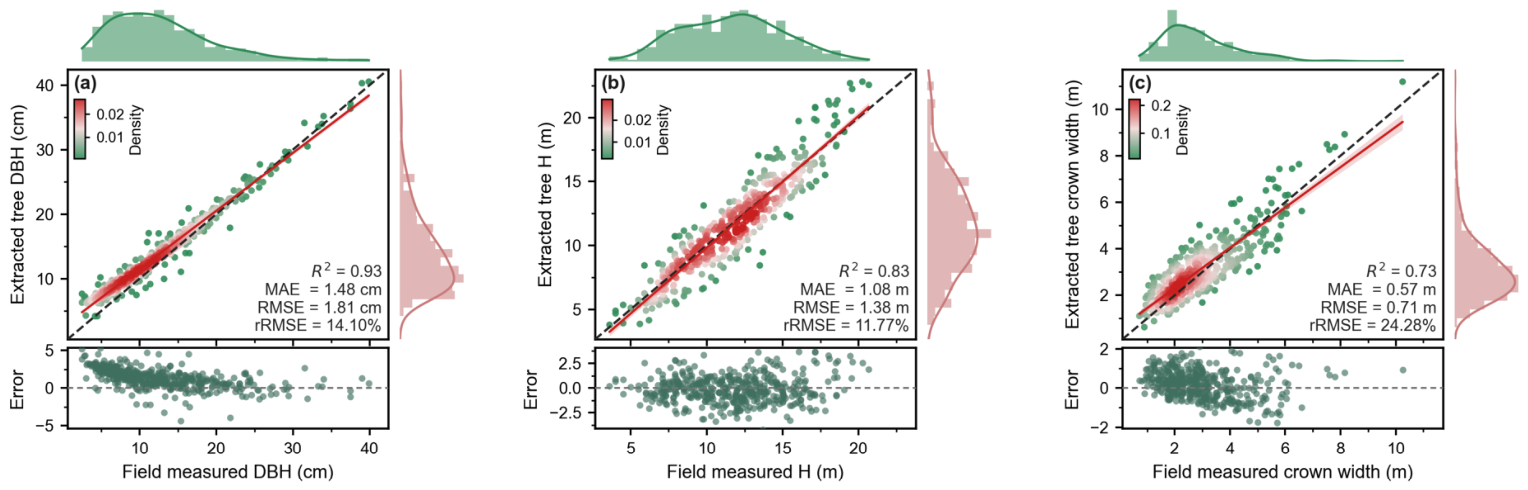
Figure 7 shows the regression relationship between the sample trees estimated by Method 1 (treeX + RSQ-Tree) and the measured values. Regarding DBH estimation, the error distribution is primarily concentrated within a 3-cm range, with no obvious systematic bias; there is only a slight tendency toward underestimation in the larger DBH range, indicating high estimation accuracy. Compared to DBH, the correlation for tree height is slightly lower, but the relative error is smaller. The error scatter plot shows that errors are symmetrically distributed around zero, with no obvious systematic overestimation or underestimation; only in the region of tall trees is there a certain degree of dispersion. This indicates that the high-percentile statistical strategy adopted effectively suppresses the influence of outliers. Compared to DBH and tree height, crown width showed the lowest correlation and the largest relative error, indicating that extracting crown structure is more challenging. The error scatter plot shows a slight tendency toward underestimation within the larger crown width range, and the degree of error dispersion is relatively high.
Figure 7.
Regression relationships between estimated and measured tree parameters under Scheme 1 (treeX + RSQ-Tree). Scatterplots show the relationships between estimated and measured values for (a) DBH, (b) tree height, and (c) crown width, with each point representing an individual tree. The solid line indicates the regression line and the dashed line represents the 1:1 reference line. Histograms show the distributions of estimation errors, and residual plots display residuals (estimated − measured) against measured values. R2 and RMSE are reported to evaluate model performance.
4. Discussion
4.1. Advantages of ULS–HLS Fused Data for Extracting Individual-Tree Parameters in Complex Forest Stands
ULS provides high-density upper canopy information, while HLS, although capable of providing detailed trunk observations, is limited by canopy obstruction [37,38]. In complex secondary forests with severe shrub interference, neither platform can independently capture the complete three-dimensional tree structure. Therefore, ULS–HLS fusion provides complementary vertical structural information, thereby better representing the characteristics of both trunks and canopies.
The registration error between point clouds ranges from 0.08 to 0.11 m (Table 4), indicating a high degree of spatial consistency [39,40]. Although this uncertainty cannot be ignored, its impact on parameter estimation depends on the specific attribute. For DBH, which is derived from local cylindrical fits at a height of approximately 1.3 m, the impact of minor horizontal misalignments is limited. This stability is also attributable to the RSQ-Tree framework—which employs multi-slice sampling and robust RANSAC fitting—thereby reducing sensitivity to spatial offsets and achieving a low RMSE (Scheme 1, 1.66 cm; Table 6). Furthermore, the point cloud density of HLS is significantly higher than that of ULS (Table 1), which to some extent dominates the DBH fitting results.
Compared with DBH, crown width is more sensitive to registration uncertainty due to its dependence on the global horizontal extent of canopy points. Small spatial misalignments may slightly affect crown boundary delineation, particularly at the outer percentile used for crown width estimation. However, this effect is partially mitigated by quantile-based filtering and kNN-based outlier removal in RSQ-Tree. Moreover, the improved performance of data fusion schemes suggests that the gain in complete crown structure outweighs minor registration-induced boundary shifts.
Tree height and crown width are more sensitive to crown structure and are therefore more susceptible to registration uncertainties. However, the data fusion schemes (Table 7 and Table 8) still outperformed single-source methods, indicating that the improvement in structural integrity offset the minor registration offsets. Error analysis (Figure 6) further shows that the uncertainty in crown-related parameters stems primarily from segmentation quality and crown outliers, rather than registration errors.
Compared to the data fusion approach, methods using only ULS or HLS (Schemes 6 and 7) exhibited significantly higher errors (up to 4.50 cm for DBH, up to 2.22 m for tree height, and up to 1.41 m for crown width), confirming that the lack of structural information is the primary limiting factor. The fusion approach addresses these shortcomings by combining the trunk integrity information provided by HLS with the canopy coverage information provided by ULS [41].
Overall, sub-decimeter-level registration errors are not the primary source of error in the error budget. Instead, DBH is primarily affected by trunk quality, tree height is influenced by canopy integrity and outliers, and crown width is affected by segmentation accuracy. Therefore, ULS–HLS fusion provides a solid foundation for subsequent segmentation and robust parameter estimation.
4.2. Error Propagation from Stem Denoising and Segmentation in Individual-Tree Attribute Estimation
Stem denoising and segmentation are two key preprocessing steps that jointly determine the accuracy of individual-tree parameter estimation in complex secondary forests. Based on the experimental schemes (Table 3) and RMSE distributions (Figure 6), both processes show distinct but coupled effects on DBH, tree height, and crown width.
The effectiveness of stem denoising is demonstrated by comparing Scheme 1 and Scheme 5 under the same segmentation and estimation settings. Without shrub removal, the F-score of the treeX method decreases from 0.95 to 0.84 (Table 5), and the RMSE of all parameters increases (Table 6, Table 7 and Table 8), particularly for DBH. This indicates that understory vegetation introduces noise into the trunk region, leading to biases in trunk identification and cylinder fitting, and reducing the stability of diameter at breast height. Due to error propagation resulting from the reduced quality of the lower structure characterization, tree height and crown width also become unstable. Stem denoising effectively restores the structural continuity of stem point clouds by leveraging vertical connectivity and point density features, thereby reducing segmentation errors at the source.
Segmentation effects are isolated by comparing treeX- and CSP-based schemes. Under fused data and RSQ-Tree conditions (Scheme 1 vs Scheme 2), treeX achieves lower RMSE, particularly for crown width, indicating more reliable crown delineation in complex stands [42,43]. Analysis of error patterns suggests that large crown-width errors are primarily associated with under-segmentation, where multiple neighboring trees are merged into a single crown, resulting in overestimated crown extents. In contrast, over-segmentation leads to fragmented crowns and underestimation of crown width, although its impact is generally smaller than that of under-segmentation [17,44].
Tree height shows intermediate sensitivity to segmentation outcomes. Under-segmentation can lead to overestimated height due to inclusion of adjacent taller crowns, while over-segmentation may result in height underestimation by isolating incomplete canopy portions. These effects are more pronounced in schemes without RSQ-Tree (Scheme 3 and Scheme 4), where segmentation errors are amplified due to the lack of robust outlier suppression. Meanwhile, replacing CSP with treeX improved crown width and moderately increased tree height, while DBH remained relatively stable. This confirms that DBH is primarily governed by trunk integrity [45], crown width depends mainly on segmentation accuracy, and tree height is influenced by both canopy integrity and segmentation consistency [46].
Single-source schemes (Schemes 6 and 7) further demonstrate that segmentation errors are exacerbated under incomplete structural observations [47]. In such cases, suppressed trees and partial crowns are more likely to be mis-segmented, contributing to large errors in crown width and tree height. Overall, the results reveal a hierarchical error propagation pattern: stem denoising mainly affects DBH, segmentation outcomes (particularly under-segmentation) dominate crown-width errors, and tree height is influenced by both segmentation and canopy completeness. This highlights the importance of integrated preprocessing and robust estimation for reliable individual-tree parameter extraction.
4.3. Role of RSQ-Tree in Mitigating Error Propagation
In terms of diameter-at-breast-height (DBH) estimation, the RMSE of Scheme 1 was consistently lower than that of Scheme 4 (Table 6), indicating that RSQ-Tree improves robustness against trunk noise and irregular point distribution. Although both methods employ trunk denoising and the same segmentation method (treeX), the traditional fitting method used in Scheme 4 remains susceptible to residual noise and local point cloud gaps. Figure 7 further illustrates systematic patterns in DBH estimation: small-diameter trees are typically overestimated, while large-diameter trees are slightly underestimated. This phenomenon may be related to insufficient point density, point cloud thickness, non-circular cross-sections, or occlusion [26]; in large-diameter trees, trunk occlusion or non-circular cross-sectional structures may result in slightly lower fitted values [48,49]. RSQ-Tree mitigates these effects through multi-slice sampling and angle-constrained fitting, reducing sensitivity to incomplete tree trunk point cloud data and thereby stabilizing DBH estimates across different diameter classes.
For tree height, the advantages of RSQ-Tree are reflected in reduced RMSE (comparing Scheme 1 and Scheme 4, Table 7) and a more concentrated residual distribution in Figure 6. Tree height errors are mostly within ±2 m, indicating that RSQ-Tree effectively mitigates the influence of extreme crown points. Traditional methods rely more heavily on maximum values and are therefore more sensitive to crown outliers or interference from neighboring trees. In contrast, RSQ-Tree employs quantile-based filtering and density constraints to reduce sensitivity to extreme height values and stabilize tree height estimates under various crown conditions, thereby enhancing robustness.
For crown width, the advantages of RSQ-Tree are even more pronounced. Scheme 4 exhibits larger errors (Table 8), reflecting the strong influence of segmentation boundaries on traditional estimation methods [50]. RSQ-Tree reduces this sensitivity by applying a boundary definition based on radial quantiles, which limits the impact of extreme points or misclassified points and stabilizes crown delineation under both under-segmented and over-segmented conditions.
A comparison between Scheme 2 and Scheme 3 further corroborates these findings under CSP segmentation. Similar trends were observed: when RSQ-Tree was removed, errors in DBH, tree height, and crown width all increased, confirming that its effectiveness does not depend on a specific segmentation method. It is worth noting that the high estimation accuracy achieved by Scheme 1 is conditional accuracy, which is strictly valid only for individual trees that were successfully detected and matched. From the perspective of actual forest resource surveys, overall survey accuracy depends not only on these conditional geometric parameters but also on the detection rate (missed detections and false detections). In this study, Approach 1 omitted 33 trees, primarily understory trees that were suppressed. Although Approach 1 performed significantly better than the other approaches, these omitted trees can lead to systematic underestimation when individual tree parameters are aggregated into overall forest indicators (such as standing timber volume).
4.4. Limitations
This study has several limitations. First, the study was conducted using plot data from Northeast China, and its applicability to forests with different structures, species compositions, or canopy closure has not yet been verified. Second, the parameters for individual tree segmentation and trunk denoising (such as voxel size and clustering threshold) were set based on experience or preliminary testing, and no systematic sensitivity analysis was conducted. Future research should evaluate the stability of these parameters under different settings. Third, the tree-level errors used in the analysis of variance in this study are not entirely independent. Because the number of test trees varies across different experimental designs, and the identities of the trees are not consistent, it is not possible to construct a fully paired dataset that covers all designs. Therefore, the p-values presented in this paper are intended primarily as relative benchmarks to illustrate performance trends among different treatments, rather than as strict, independent statistical proof of differences at the treatment level. Finally, canopy estimation remains challenging in cases of canopy overlap and sparse point clouds, suggesting that additional structural prior information or data sources may be needed to improve accuracy.
5. Conclusions
To address the challenge of measuring individual tree parameters in cold–temperate secondary forests, this study developed a framework that integrates multi-source ULS and HLS LiDAR data and systematically evaluated the effects of different data sources, segmentation methods, and parameter extraction strategies. The results indicate that multi-source point cloud fusion, under high registration accuracy (approximately 0.08–0.11 m), effectively integrates canopy and stem information, significantly improving structural representation and estimation stability. Stem denoising effectively reduces shrub-induced noise and improves segmentation performance, while treeX shows stronger adaptability in structurally complex stands. The RSQ-Tree framework provides parameter-specific robustness by addressing distinct error sources in DBH, tree height, and crown width estimation, leading to a notable reduction in tree height errors. Further analysis reveals that DBH is primarily influenced by stem representation and fitting strategy, tree height is jointly affected by segmentation quality and outlier suppression, and crown width is most sensitive to segmentation accuracy. Overall, the “denoising + data fusion + treeX + RSQ-Tree” approach performed best across the study area, suggesting that multi-stage collaborative optimization is key to improving the accuracy of individual tree parameters in complex stands.
Author Contributions
Y.L. conceived the study, developed the methodology, performed the software implementation, conducted data curation and formal analysis, and wrote the original draft of the manuscript. C.L. contributed to conceptualization, supervised the research, managed the project administration, and revised the manuscript. H.L. contributed to field investigation, acquired funding, assisted in data curation, and performed validation of the experimental results. G.L. contributed to resource provision, data acquisition, and validation. X.L. contributed to software development, methodology design, and visualization. F.Z. contributed to investigation and data curation. S.Z. contributed to validation and manuscript revision. All authors have read and agreed to the published version of the manuscript.
Funding
This research was supported by the National Key Research and Development Program of China (CAFYBB2023ZA006) and Essential Scientific Research of Chinese National Nonprofit Institute (Grant No. 2023YFD2201705).
Data Availability Statement
The data are available from the corresponding author upon reasonable request.
Acknowledgments
The authors would like to thank all participants involved in the field data collection and LiDAR data acquisition for their valuable assistance.
Conflicts of Interest
The authors declare no conflict of interest.
References
- Liu, X.L.; Liu, S. Research Progress and Trends of Natural Secondary Forests in China. J. Sichuan For. Sci. Technol. 2021, 43, 1–11. [Google Scholar]
- Zhang, H.R.; Yang, C.P.; Liu, Z.G. Tending and Regeneration Research of Natural Secondary Forest in Northeastern China; Science Press: Beijing, China, 2022; p. 480. [Google Scholar]
- Madec, S.; Baret, F.; de Solan, B.; Thomas, S.; Dutartre, D.; Jezequel, S.; Hemmerlé, M.; Colombeau, G.; Comar, A. High-Throughput Phenotyping of Plant Height: Comparing Unmanned Aerial Vehicles and Ground LiDAR Estimates. Front. Plant Sci. 2017, 8, 2002. [Google Scholar] [CrossRef] [Scilit] [PubMed]
- Liang, X.L.; Hyyppä, J. Automatic Stem Mapping by Merging Several Terrestrial Laser Scans at the Feature and Decision Levels. Sensors 2013, 13, 1614–1634. [Google Scholar] [CrossRef] [Scilit] [PubMed]
- Calders, K.; Adams, J.; Armston, J.; Bartholomeus, H.; Bauwens, S.; Bentley, L.P.; Chave, J.; Danson, F.M.; Demol, M.; Disney, M.; et al. Terrestrial laser scanning in forest ecology: Expanding the horizon. Remote Sens. Environ. 2020, 251, 102–112. [Google Scholar] [CrossRef] [Scilit]
- Yun, T.; Li, J.; Ma, L.F.; Zhou, J.; Wang, R.S.; Eichhorn, M.P.; Zhang, H.Q. Status, advancements and prospects of deep learning methods applied in forest studies. Int. J. Appl. Earth Obs. Geoinf. 2024, 131, 103938. [Google Scholar] [CrossRef] [Scilit]
- Kellner, J.R.; Armston, J.; Birrer, M.; Cushman, K.C.; Duncanson, L.; Eck, C.; Falleger, C.; Imbach, B.; Král, K.; Krucek, M.; et al. New Opportunities for Forest Remote Sensing Through Ultra-High-Density Drone Lidar. Surv. Geophys. 2019, 40, 959–977. [Google Scholar] [CrossRef] [Scilit] [PubMed]
- Nunes, M.H.; Camargo, J.L.C.; Vincent, G.; Calders, K.; Oliveira, R.S.; Huete, A.; de Moura, Y.M.; Nelson, B.; Smith, M.N.; Stark, S.C.; et al. Forest fragmentation impacts the seasonality of Amazonian evergreen canopies. Nat. Commun. 2022, 13, 917. [Google Scholar] [CrossRef] [Scilit] [PubMed]
- Oveland, I.; Hauglin, M.; Giannetti, F.; Kjorsvik, N.S.; Gobakken, T. Comparing Three Different Ground Based Laser Scanning Methods for Tree Stem Detection. Remote Sens. 2018, 10, 538. [Google Scholar] [CrossRef] [Scilit]
- Su, Y.J.; Guo, Q.H.; Jin, S.C.; Guan, H.C.; Sun, X.L.; Ma, Q.; Hu, T.Y.; Wang, R.; Li, Y.M. The Development and Evaluation of a Backpack LiDAR System for Accurate and Efficient Forest Inventory. IEEE Geosci. Remote Sens. Lett. 2021, 18, 1660–1664. [Google Scholar] [CrossRef] [Scilit]
- Hao, Y.S.; Widagdo, F.R.A.; Liu, X.; Quan, Y.; Dong, L.H.; Li, F.R. Individual Tree Diameter Estimation in Small-Scale Forest Inventory Using UAV Laser Scanning. Remote Sens. 2021, 13, 24. [Google Scholar] [CrossRef] [Scilit]
- Xu, D.D.; Wang, H.B.; Xu, W.X.; Luan, Z.Q.; Xu, X. LiDAR Applications to Estimate Forest Biomass at Individual Tree Scale: Opportunities, Challenges and Future Perspectives. Forests 2021, 12, 550. [Google Scholar] [CrossRef] [Scilit]
- Zhang, J.P.; Wang, J.L.; Cheng, F.; Ma, W.F.; Liu, Q.W.; Liu, G.J. Natural forest ALS-TLS point cloud data registration without control points. J. For. Res. 2023, 34, 809–820. [Google Scholar] [CrossRef] [Scilit]
- Huo, Z.H.; Fang, L.; Chu, Y.K.; Dang, S.; Yang, J.; Li, L.; Li, X.; Ren, S.L.; Chen, J.Y.; Peng, Y.B.; et al. Precise urban tree species identification and biomass estimation using UAV-Handheld LiDAR Synergy and YOLOv11 deep learning. Int. J. Appl. Earth Obs. Geoinf. 2026, 146, 105049. [Google Scholar] [CrossRef] [Scilit]
- Zhang, T.W.; Shen, X.; Cao, L. Terrain and individual tree vertical structure-based approach for point clouds co-registration by UAV and Backpack LiDAR. Int. J. Appl. Earth Obs. Geoinf. 2025, 139, 104544. [Google Scholar] [CrossRef] [Scilit]
- Tupinambá-Simoes, F.; Pascual, A.; Guerra-Hernández, J.; Ordóñez, C.; Barreiro, S.; Bravo, F. Combining hand-held and drone-based lidar for forest carbon monitoring: Insights from a Mediterranean mixed forest in central Portugal. Eur. J. For. Res. 2025, 144, 925–940. [Google Scholar] [CrossRef] [Scilit]
- Yun, T.; Jiang, K.; Li, C.; Eichhorn, M.P.; Fan, J.C.; Liu, F.Z.; Chen, B.Q.; An, F.; Cao, L. Individual tree crown segmentation from airborne LiDAR data using a novel Gaussian filter and energy function minimization-based approach. Remote Sens. Environ. 2021, 256, 112307. [Google Scholar] [CrossRef] [Scilit]
- Hu, B.X.; Li, J.L.; Jing, L.H.; Judah, A. Improving the efficiency and accuracy of individual tree crown delineation from high-density LiDAR data. Int. J. Appl. Earth Obs. Geoinf. 2014, 26, 145–155. [Google Scholar] [CrossRef] [Scilit]
- Deng, S.S.; Xu, Q.; Yue, Y.Z.; Jing, S.S.; Wang, Y.X. Individual tree detection and segmentation from unmanned aerial vehicle-LiDAR data based on a trunk point distribution indicator. Comput. Electron. Agric. 2024, 218, 108717. [Google Scholar] [CrossRef] [Scilit]
- Luo, J.C.; Chen, Q.D.; Su, Y.J.; Gao, T.; Zhou, L.; Deng, J.J.; Zhang, Y.S.; Yu, D.P. Assessing the ability of terrestrial and UAV laser scanning to measure forest structural parameters in complex stands. J. For. Res. 2026, 37, 56. [Google Scholar] [CrossRef] [Scilit]
- Tao, S.L.; Wu, F.F.; Guo, Q.H.; Wang, Y.C.; Li, W.K.; Xue, B.L.; Hu, X.Y.; Li, P.; Tian, D.; Li, C.; et al. Segmenting tree crowns from terrestrial and mobile LiDAR data by exploring ecological theories. Isprs J. Photogramm. Remote Sens. 2015, 110, 66–76. [Google Scholar] [CrossRef] [Scilit]
- Liu, Q.W.; Ma, W.F.; Zhang, J.P.; Liu, Y.C.; Xu, D.F.; Wang, J.L. Point-cloud segmentation of individual trees in complex natural forest scenes based on a trunk-growth method. J. For. Res. 2021, 32, 2403–2414. [Google Scholar] [CrossRef] [Scilit]
- Tsuchiya, B.; Mochizuki, H.; Hoshikawa, T.; Suzuki, S. Error estimation of trunk diameter and tree height measured with a backpack LiDAR system in Japanese plantation forests. Landsc. Ecol. Eng. 2023, 19, 169–177. [Google Scholar] [CrossRef] [Scilit]
- Yang, J.; Zhang, H.Q.; Li, J.Y.; Yang, H.Y.; Gao, T.; Yang, T.D.; Wang, J.X.; Zhang, X.L.; Yun, T.; Duanmu, Y.; et al. SmartQSM: A novel quantitative structure model using sparse-convolution-based point cloud contraction for reconstruction and analysis of individual tree architecture. ISPRS J. Photogramm. Remote Sens. 2026, 232, 712–739, Correction in ISPRS J. Photogramm. Remote Sens. 2026, 234, 167–169. https://doi.org/10.1016/j.isprsjprs.2026.01.033. [Google Scholar] [CrossRef] [Scilit]
- Bornand, A.; Abegg, M.; Morsdorf, F.; Rehush, N. Completing 3D point clouds of individual trees using deep learning. Methods Ecol. Evol. 2024, 15, 2010–2023. [Google Scholar] [CrossRef] [Scilit]
- Hui, Z.Y.; Lin, L.; Jin, S.G.; Xia, Y.P.; Ziggah, Y.Y. A Reliable DBH Estimation Method Using Terrestrial LiDAR Points through Polar Coordinate Transformation and Progressive Outlier Removal. Forests 2024, 15, 1031. [Google Scholar] [CrossRef] [Scilit]
- Dong, Z.; Liang, F.X.; Yang, B.S.; Xu, Y.S.; Zang, Y.F.; Li, J.P.; Wang, Y.; Dai, W.X.; Fan, H.C.; Hyyppä, J. Registration of large-scale terrestrial laser scanner point clouds: A review and benchmark. ISPRS J. Photogramm. Remote Sens. 2020, 163, 327–342. [Google Scholar] [CrossRef] [Scilit]
- Wang, Y.J.; Yan, C.G.; Feng, Y.T.; Du, S.Y.; Dai, Q.H.; Gao, Y. STORM: Structure-based overlap matching for partial point cloud registration. IEEE Trans. Pattern Anal. Mach. Intell. 2022, 45, 1135–1149. [Google Scholar] [CrossRef] [Scilit] [PubMed]
- Burmeister, J.; Tockner, A.; Reder, S.; Engel, M.; Richter, R.; Adams, J.; Döllner, J. treeX: Unsupervised Tree Instance Segmentation in Dense Forest Point Clouds. arXiv 2025, arXiv:2509.03633. [Google Scholar]
- Henrich, J.; van Delden, J.; Seidel, D.; Kneib, T.; Ecker, A.S. TreeLearn: A deep learning method for segmenting individual trees from ground-based LiDAR forest point clouds. Ecol. Inform. 2024, 84, 102888. [Google Scholar] [CrossRef] [Scilit]
- Mak, N.P.L.; Siu, T.Y.; Law, Y.K.; Zhang, H.; Sui, S.T.; Yip, F.T.; Ng, Y.S.; Ye, Y.H.; Cheung, T.C.; Wa, K.C.; et al. Mapping Individual Tree- and Plot-Level Biomass Using Handheld Mobile Laser Scanning in Complex Subtropical Secondary and Old-Growth Forests. Remote Sens. 2025, 17, 1354. [Google Scholar] [CrossRef] [Scilit]
- Ahmad Fuad, N.; Yusoff, A.; Ismail, Z.; Majid, Z. Comparing the performance of point cloud registration methods for landslide monitoring using mobile laser scanning data. Int. Arch. Photogramm. Remote Sens. Spat. Inf. Sci. 2018, 42, 11–21. [Google Scholar] [CrossRef] [Scilit]
- Yang, J.T.; Kang, Z.Z.; Cheng, S.; Yang, Z.; Akwensi, P.H. An individual tree segmentation method based on watershed algorithm and three-dimensional spatial distribution analysis from airborne LiDAR point clouds. IEEE J. Sel. Top. Appl. Earth Obs. Remote Sens. 2020, 13, 1055–1067. [Google Scholar] [CrossRef] [Scilit]
- Zhang, Z.R.; Zhao, Y.T.; Zhen, Z.; Zhao, Y.H.; Li, J.; Zhou, Y. Nondestructive individual tree aboveground biomass estimation using a hierarchical Bayesian approach in combination with individual tree competition indices. Plant Phenomics 2025, 7, 100120. [Google Scholar] [CrossRef] [Scilit] [PubMed]
- Zhao, Y.T.; Im, J.; Zhen, Z.; Zhao, Y.H. Towards accurate individual tree parameters estimation in dense forest: Optimized coarse-to-fine algorithms for registering UAV and terrestrial LiDAR data. GISci. Remote Sens. 2023, 60, 2197281. [Google Scholar] [CrossRef] [Scilit]
- Agbangba, C.E.; Aide, E.S.; Honfo, H.; Kakai, R.G. On the use of post-hoc tests in environmental and biological sciences: A critical review. Heliyon 2024, 10, e25131. [Google Scholar] [CrossRef] [Scilit] [PubMed]
- Carpenter, J.; Jung, M.Y.; Goel, A.; Fei, S.L.; Jung, J.H. Modality-specific feature design for species classification in forest inventories using TLS and UAS LiDAR. Front. For. Glob. Change 2025, 8, 1500178. [Google Scholar] [CrossRef] [Scilit]
- Balestra, M.; Marselis, S.; Sankey, T.T.; Cabo, C.; Liang, X.L.; Mokros, M.; Peng, X.; Singh, A.; Sterenczak, K.; Vega, C.; et al. LiDAR Data Fusion to Improve Forest Attribute Estimates: A Review. Curr. For. Rep. 2024, 10, 281–297. [Google Scholar] [CrossRef] [Scilit]
- Mao, P.; Kan, X.; Pang, Y.; Ni, R.; Cao, B.; Wang, K.; Zhang, J.; Tan, C.; Geng, Y.; Cao, X.; et al. Effects of Forest Gap and Seed Size on Germination and Early Seedling Growth in Quercus acutissima Plantation in Mount Tai, China. Forests 2022, 13, 1025. [Google Scholar] [CrossRef] [Scilit]
- Lu, J.; Wang, H.; Qin, S.; Cao, L.; Pu, R.; Li, G.; Sun, J. Estimation of aboveground biomass of Robinia pseudoacacia forest in the Yellow River Delta based on UAV and Backpack LiDAR point clouds. Int. J. Appl. Earth Obs. Geoinf. 2020, 86, 102014. [Google Scholar] [CrossRef] [Scilit]
- Fekry, R.; Yao, W.; Cao, L.; Shen, X. Ground-based/UAV-LiDAR data fusion for quantitative structure modeling and tree parameter retrieval in subtropical planted forest. For. Ecosyst. 2022, 9, 100065. [Google Scholar] [CrossRef] [Scilit]
- Fu, Y.W.; Niu, Y.F.; Wang, L.; Li, W. Individual-Tree Segmentation from UAV-LiDAR Data Using a Region-Growing Segmentation and Supervoxel-Weighted Fuzzy Clustering Approach. Remote Sens. 2024, 16, 608. [Google Scholar] [CrossRef] [Scilit]
- Zhu, D.W.; Liu, X.L.; Zheng, Y.L.; Xu, L.H.; Huang, Q.Q. Improved Tree Segmentation Algorithm Based on Backpack-LiDAR Point Cloud. Forests 2024, 15, 136. [Google Scholar] [CrossRef] [Scilit]
- Chen, Q.D.; Gao, T.; Zhu, J.J.; Wu, F.Y.; Li, X.F.; Lu, D.L.; Yu, F.Y. Individual Tree Segmentation and Tree Height Estimation Using Leaf-Off and Leaf-On UAV-LiDAR Data in Dense Deciduous Forests. Remote Sens. 2022, 14, 2787. [Google Scholar] [CrossRef] [Scilit]
- Muhojoki, J.; Tavi, D.; Hyyppä, E.; Lehtomäki, M.; Faitli, T.; Kaartinen, H.; Kukko, A.; Hakala, T.; Hyyppä, J. Benchmarking Under- and Above-Canopy Laser Scanning Solutions for Deriving Stem Curve and Volume in Easy and Difficult Boreal Forest Conditions. Remote Sens. 2024, 16, 1721. [Google Scholar] [CrossRef] [Scilit]
- Brodic, N.; Cvijetinovic, Z.; Milenkovic, M.; Kovacevic, J.; Stancic, N.; Mitrovic, M.; Mihajlovic, D. Refinement of Individual Tree Detection Results Obtained from Airborne Laser Scanning Data for a Mixed Natural Forest. Remote Sens. 2022, 14, 5345. [Google Scholar] [CrossRef] [Scilit]
- Jarron, L.R.; Coops, N.C.; MacKenzie, W.H.; Tompalski, P.; Dykstra, P. Detection of sub-canopy forest structure using airborne LiDAR. Remote Sens. Environ. 2020, 244, 111770. [Google Scholar] [CrossRef] [Scilit]
- Boucher, P.B.; Paynter, I.; Orwig, D.A.; Valencius, I.; Schaaf, C. Sampling forests with terrestrial laser scanning. Ann. Bot. 2021, 128, 689–707. [Google Scholar] [CrossRef] [Scilit] [PubMed]
- Kim, W.; Son, H.-S.; An, S.-Y. Sector-Based Perimeter Reconstruction for Tree Diameter Estimation Using 3D LiDAR Point Clouds. Remote Sens. 2025, 17, 2880. [Google Scholar] [CrossRef] [Scilit]
- Tong, F.; Zhang, Y. Individual tree crown delineation in high resolution aerial RGB imagery using StarDist-based model. Remote Sens. Environ. 2025, 319, 114618. [Google Scholar] [CrossRef] [Scilit]

Disclaimer/Publisher’s Note: The statements, opinions and data contained in all publications are solely those of the individual author(s) and contributor(s) and not of MDPI and/or the editor(s). MDPI and/or the editor(s) disclaim responsibility for any injury to people or property resulting from any ideas, methods, instructions or products referred to in the content. |
© 2026 by the authors. Licensee MDPI, Basel, Switzerland. This article is an open access article distributed under the terms and conditions of the Creative Commons Attribution (CC BY) license.