Article

Pseudo 3-D GPR and 2-D ERT Study to Reveal Subtle Tectonic Deformations of a Strike-Slip Raša Fault (Dinaric Fault System, W Slovenia) in Fluvial and Karstic Environments

1
Geological Survey of Slovenia, Dimičeva ul. 14, 1000 Ljubljana, Slovenia
2
Faculty of Natural Sciences and Engineering, University of Ljubljana, Aškerčeva c. 12, 1000 Ljubljana, Slovenia
3
Slovenian Environment Agency, Vojkova 1b, 1000 Ljubljana, Slovenia
*
Author to whom correspondence should be addressed.
Remote Sens. 2026, 18(15), 2561; https://doi.org/10.3390/rs18152561
Submission received: 21 May 2026 / Revised: 23 July 2026 / Accepted: 27 July 2026 / Published: 4 August 2026

Highlights

What are the main findings?
  • Pseudo 3-D GPR, high-resolution ERT and high-resolution DEM analyses enable clear imaging of the complex fault deformation patterns in highly heterogeneous fluvial sediments and low-resistivity karstic deposits, providing quantitative information about the subsurface.
What are the implications of the main findings?
  • The study demonstrates the imaging potential of the pseudo 3-D GPR surveys combined with ERT profiles for investigating shallow faults in complex geological environments.
  • The Raša Fault zone cannot be reduced to a simple vertical discontinuity within the sedimentary deposits and bedrock, but is instead interpreted as a multitude of undulating fault strands, supporting future paleoseismological studies.

Abstract

The Raša Fault is a prominent seismically active strike-slip fault within the Dinaric Fault System in SW Slovenia, seismotectonically estimated to be capable of producing earthquakes up to Mw = 7.4. Since the surface exposure of fault-related markers is discontinuous, and the near-surface expression of deformation is poorly constrained, there is a need to improve the detection of fault-related features in complex sedimentary environments. In such settings, signal attenuation, complex stratigraphy, and irregular fault-zone geometries often obscure subtle deformation features, limiting the interpretability of standard 2-D geophysical profiles. A pseudo 3-D Ground-Penetrating Radar (GPR) survey, along with complementary Electrical Resistivity Tomography (ERT) surveys and reprocessing of LiDAR (light detection and ranging) data to obtain high-resolution Digital Elevation Models (DEMs), was conducted in selected environments dominated by low-resistivity karstic deposits and highly heterogeneous fluvial sediments to assess and improve the capability to detect and characterize subtle shallow deformations associated with the Raša Fault. Tectonic geomorphological mapping facilitated the recognition of potentially active fault traces and the identification of Quaternary sedimentary and erosional features, where recent deformations are usually preserved and can be dated in further paleoseismological investigations. The analysis of dense GPR data and complementary ERT profiles enabled us to clearly image the fault deformation pattern and obtain quantitative information about the subsurface, showing details of faulting and related deformation structures not evident at the surface. Furthermore, it enabled the detection of fault zone complexity, revealing it as an irregular and laterally changing area with sediment infillings, rather than a single vertical discontinuity. The complexity of faulting in the near surface depends on many factors, including the competence and age of the faulted material, as well as the local geomorphology. This study has demonstrated the applicability of pseudo 3-D GPR surveying, combined with ERT profiles, for subsurface mapping of active strike-slip faults in karstic and fluvial sedimentary environments. The methodology can be recommended in particular for rapid and cost-effective investigation of sites with subtle surface evidence of active faulting in order to determine near-surface fault splaying.

1. Introduction

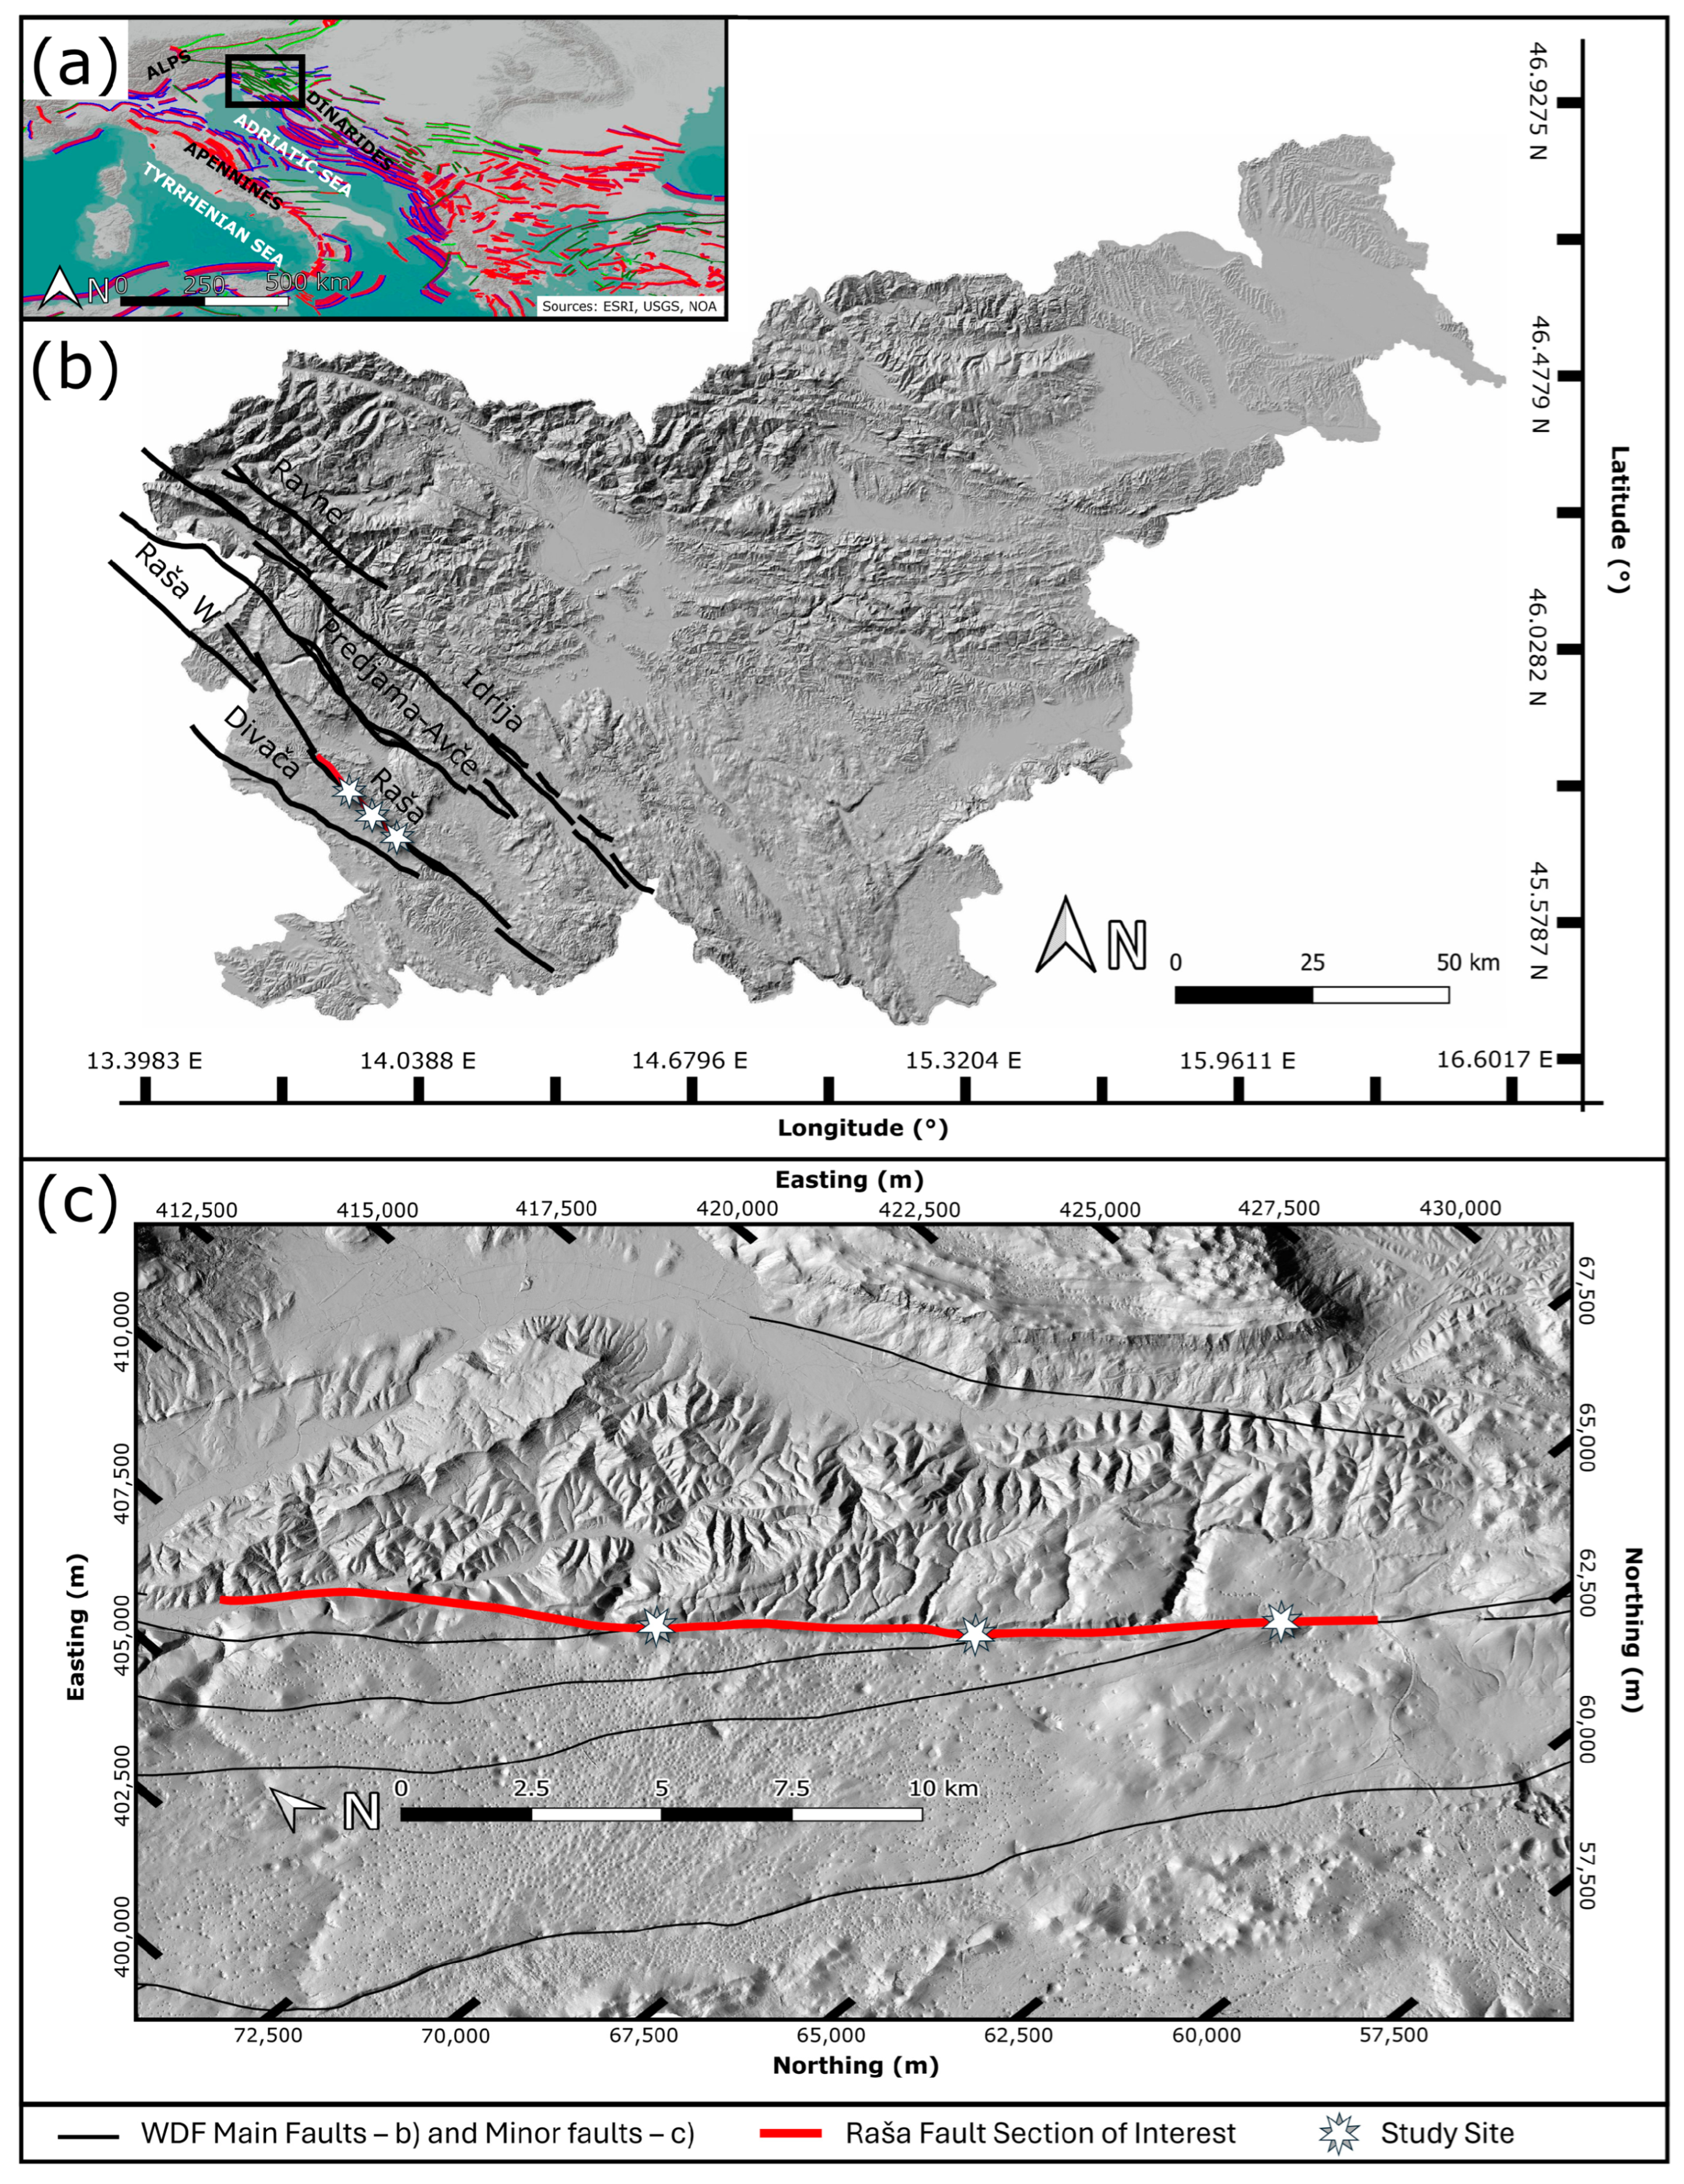
In tectonically active regions like the Mediterranean and the Alps–Dinarides transition zone (Figure 1a), the identification and characterization of active fault deformations in the near subsurface is crucial for determining the regional seismic hazard [1,2]. Such investigations require reliable information on the locations and geometries of all active fault strands, including those covered by young sediments, suitable for further paleoseismological investigations. Since subtle evidence of past earthquakes (e.g., surface faulting, distributed faulting at fault bends and stepovers, tension fractures, and folding) caused by such faults is buried within the first few meters below the surface, we need a time- and cost-effective approach for their recognition and characterization [3].
In this context, a pseudo 3-D Ground-Penetrating Radar (GPR) survey and complementary Electrical Resistivity Tomography (ERT) profiles represent a powerful tool for imaging shallow stratigraphic and tectonic features [4]. Although pseudo 3-D GPR and 2-D ERT do not provide direct evidence of past earthquake parameters, they can be used to identify peculiar characteristics in high-resolution GPR (diffractions, truncations, offset of reflectors, reflector attenuation) and ERT profiles (lateral heterogeneity and sharp boundaries in resistivity distribution) to delineate the characteristics of a Quaternary fault zone at a fine-scale [5,6].
Despite the proven potential of GPR and ERT to detect near-surface deformation, their application in environments dominated by highly heterogeneous fluvial sediments and low-resistivity karstic deposits remains challenging. In such settings, signal attenuation, complex stratigraphy, and irregular fault-zone geometries often obscure subtle deformation features, limiting the interpretability of standard 2-D profiles [7,8]. This is particularly relevant for the dextral strike-slip Raša Fault (RF) in W Slovenia (Figure 1b), where surface exposure of fault-related markers is discontinuous, and the near-surface expression of deformation is poorly constrained. Consequently, there is a need to evaluate whether more advanced acquisition geometries and processing strategies, particularly those that enhance spatial continuity and emphasize fine-scale structural anomalies, can improve the detection of fault-related features in these complex sedimentary environments.
The aim of this study is to assess the capability of the pseudo 3-D GPR in combination with 2-D ERT profiling and reprocessing of available LiDAR (light detection and ranging) data for the high-resolution Digital Elevation Model (DEM) to improve the detection and characterization of subtle shallow deformations associated with the RF in both fluvial and karstic environments. By focusing on areas where the fault trace is relatively well constrained (Figure 1c), we explore how integrated imaging approaches can enhance the visibility of subtle stratigraphic disruptions and near-surface structural variations. This work provides a framework for applying high-resolution geophysical methods to active faults in a slowly deforming karst landscape of W Slovenia, which is particularly challenging [9], and contributes to a more comprehensive understanding of their shallow expression. In doing so, it establishes a foundation for more accurate mapping of fault zones where traditional surface-based structural–geological and geomorphological methods are limited.
Figure 1. (a) European Fault Source Model 2020 [10,11], basemap is from ESRI World Terrain Base; (b) main faults of the Western Dinaric Fault (WDF) system [12], basemap is hillshaded relief from lidar-derived DEM [13]; (c) Raša Fault study area, basemap is hillshaded relief from lidar-derived DEM [13]. Coordinate reference system—(b) EPSG: 4326 (WGS84), (c) EPSG: 3794 (D96/TM).
Remotesensing 18 02561 g001

2. Geological Framework

The Raša Fault (RF) is the second largest fault (by length) in the dextral strike-slip Dinaric Fault System (Figure 1b) in Slovenia (e.g., refs. [12,14,15,16]). This system absorbs the deformation related to the rotation and northward movement of the Adriatic microplate and encompasses a large part of Western and Central Slovenia (e.g., refs. [15,17]). The Dinaric Fault System is divided into two sets of faults: Western and Eastern [12]. The Western set is composed of the Divača, Raša, Predjama, Idrija and Ravne faults (Figure 1b). Both sets are related to two corridors of increased deformation velocities: ~1–2 mm/year in the Eastern and ~2.5 mm/year in the Western set [12]. Consequently, this region represents one of the areas with the highest seismic hazard in Slovenia [18].
Instrumental seismicity shows that the RF is seismically active (e.g., refs. [12,19,20]). Hypocenters of weak to moderate earthquakes are concentrated at larger depths (6–17 km), with a noticeable increase in activity along the SE part [19]. Due to its length, relatively large earthquake magnitudes are expected (Mw > 6.0), with a maximum magnitude estimated at 7.4 in the case of a less probable full-length fault rupture [12,21]. Although no historical earthquake has been unequivocally attributed to the RF, the 1956 Ilirska Bistrica earthquake with ML = 5.1 [22] occurred most probably on this fault as suggested by macroseismic data [23]. Strong earthquakes have been documented with paleoseismological methods on the adjacent Idrija and Predjama faults [16,24,25], while the Ravne fault hosted recent destructive events in 1998 and 2004 with Mw 5.6 and 5.2, respectively (refs. [26,27] and references therein).
Stratigraphic and structural setting of dextral strike-slip RF [28,29,30], combined with seismicity, points to a region of significant active tectonic deformation, where near-surface geophysical methods such as pseudo 3-D GPR and high-resolution ERT can provide new insights into subsurface expression of fault activity related to the seismogenic structure (Figure 1c).

Selection of Locations for Detailed Investigations

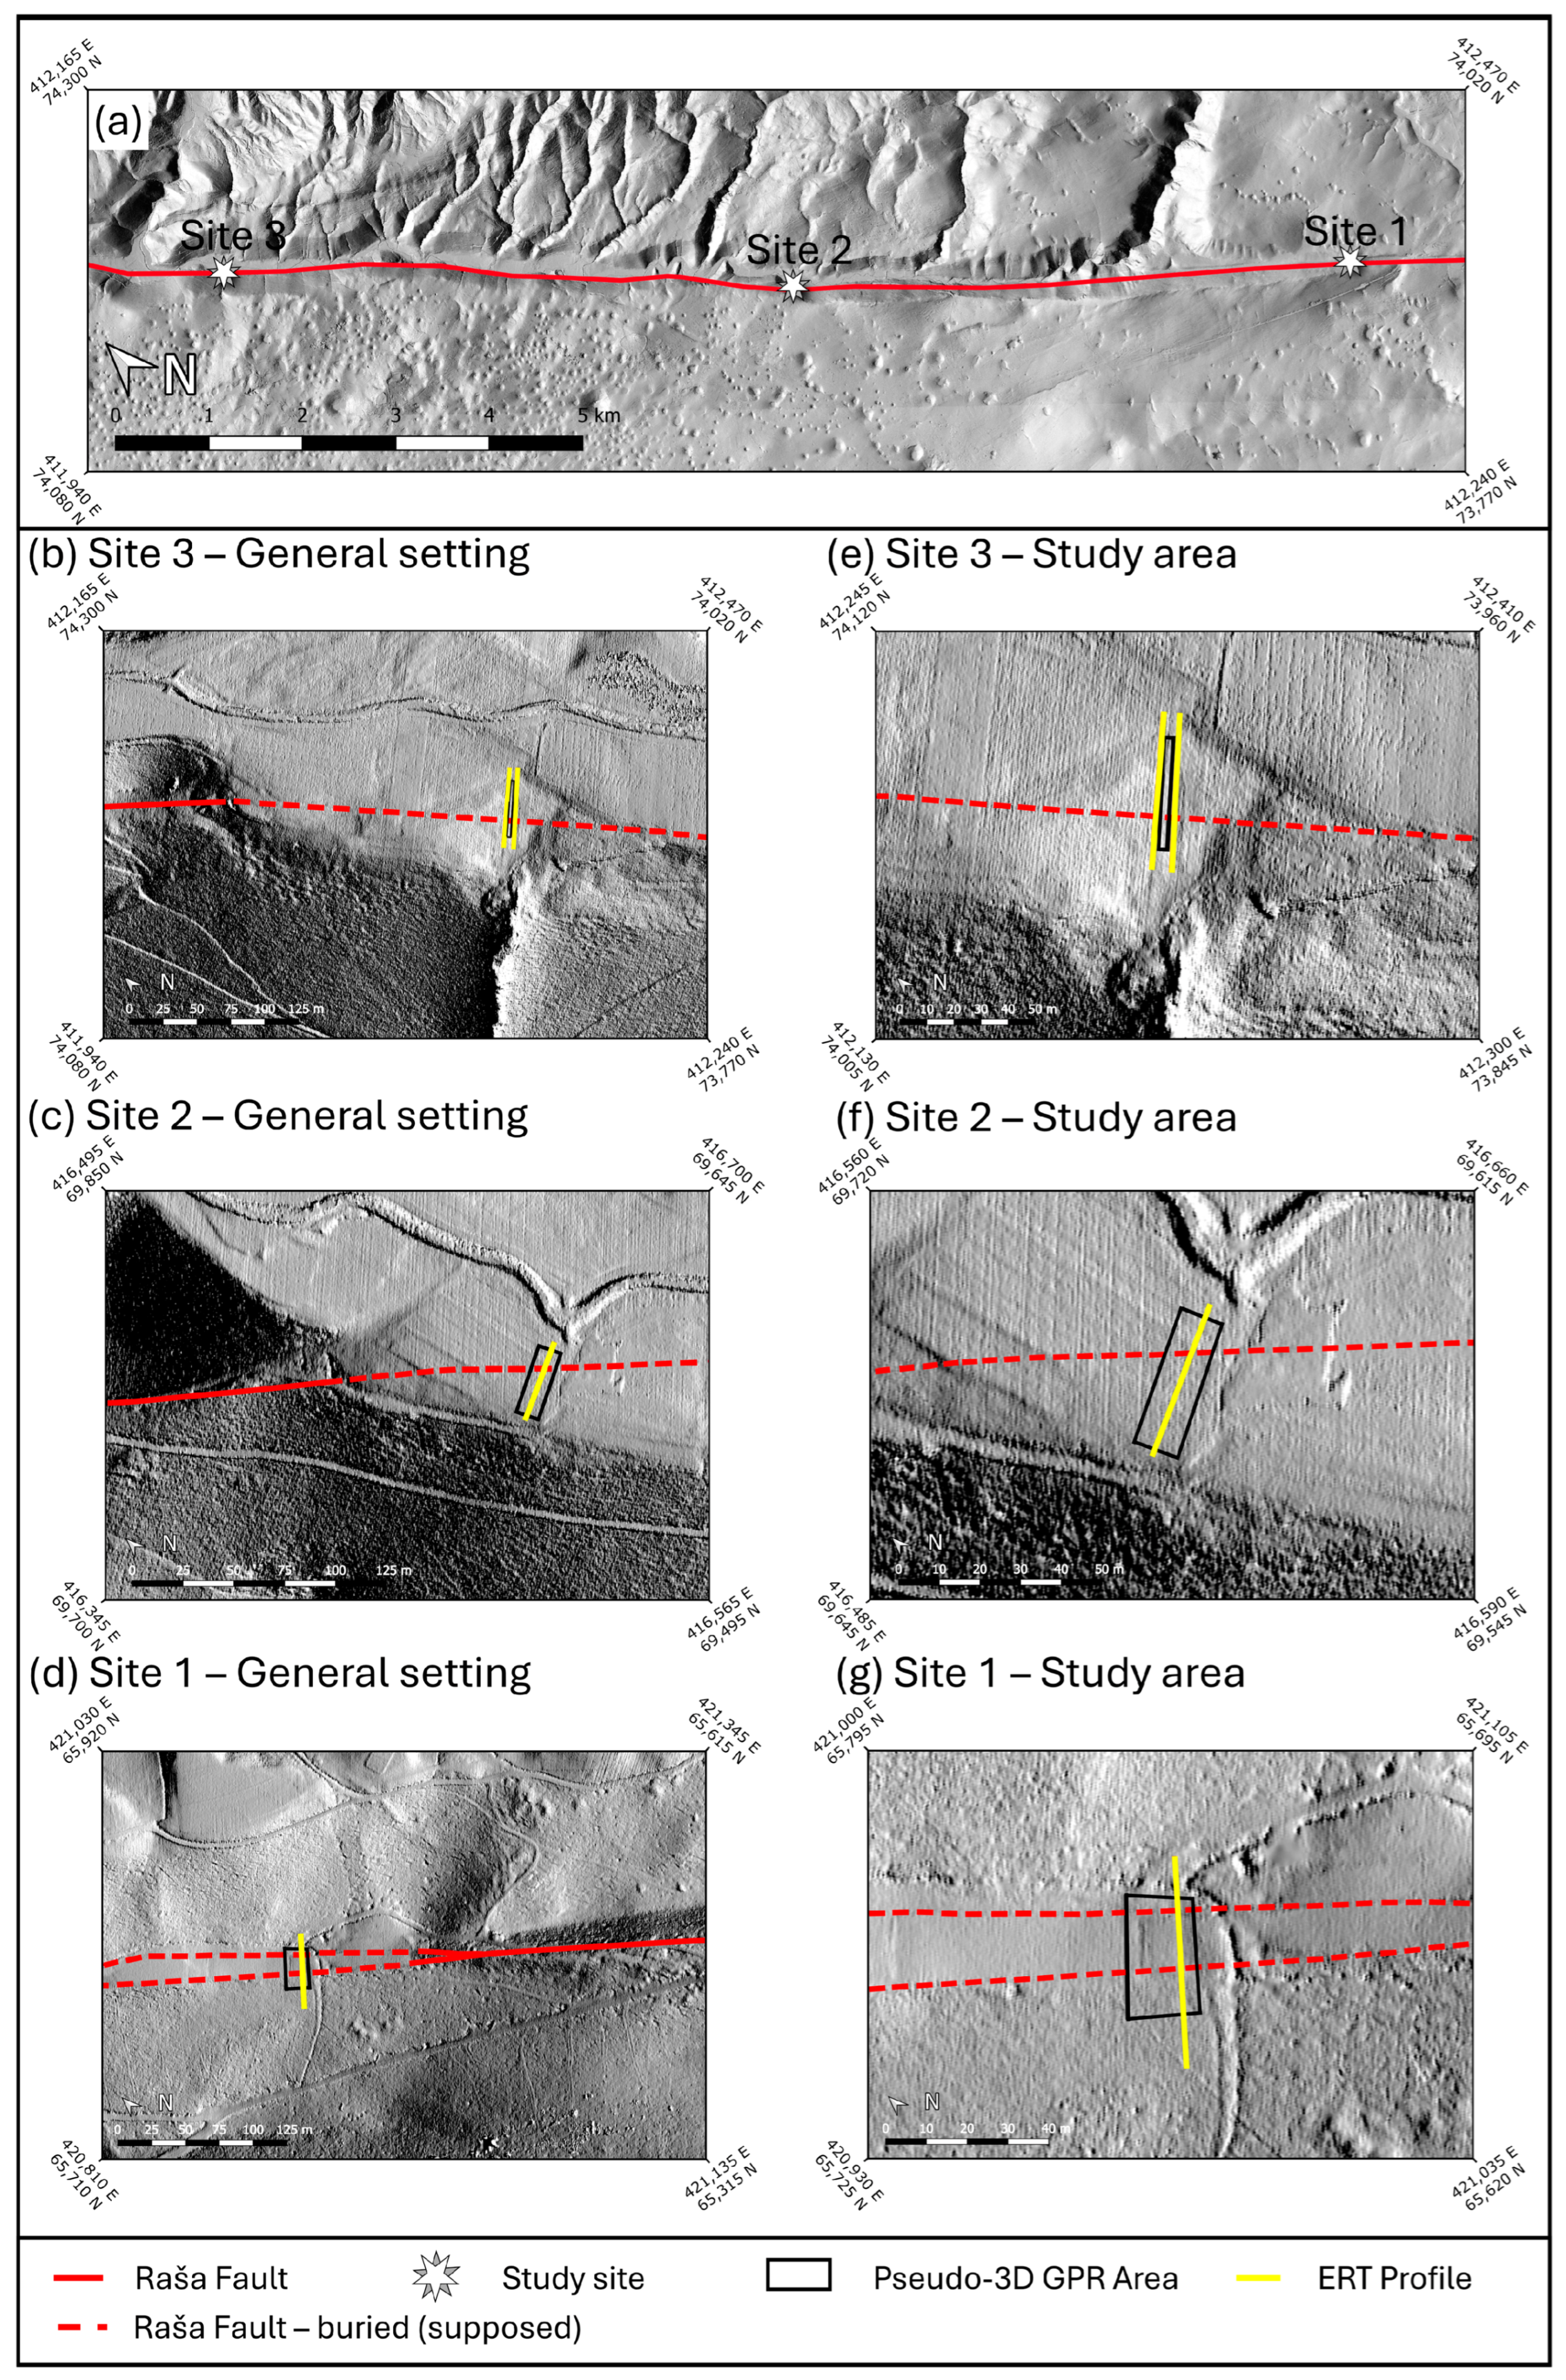
The Raša Fault (RF) was previously studied as part of regional investigations of the Dinaric Fault System, based on geomorphological analysis of a 5 m Digital Elevation Model (DEM) [15], available at that time, and within the scopes of creating the Database of Active Faults in Slovenia [12]. Average slip-rates were estimated to be 1.30 mm/year [15] and 0.7 mm/year [12]; consequently, relatively good constraints were available for large scale fault slip-rate and fault related deformations. We focused our efforts on the relatively narrow Raša valley, where fault deformation is highly localized (Figure 1c and Figure 2a). The geology of the Raša valley consists of karstified carbonate bedrock overlain by a relatively thin succession of alluvial sediments (<10 m) originating either from the Raša creek (fluvial sediments) or the surrounding hills (alluvial fan sediments and colluvium). A multi-method geophysical campaign conducted by Grützner et al. [8] and Zajc [31] further confirmed the feasibility of GPR surveys in the Raša valley.
Tectonic geomorphic mapping focused on recognizing lineaments that could potentially represent active fault traces, and on identifying Quaternary sedimentary and erosional features, where recent deformations are usually preserved and can be dated in further paleoseismological investigations. Recognized lineaments and geomorphological markers were ground-truthed.
To assess the applicability of pseudo 3-D GPR in environments dominated by highly heterogeneous alluvial sediments and low-resistivity karstic deposits, we selected three representative geomorphic landforms along the Raša valley for our study (Figure 2a). The NW-most study area (Site 3) is situated on an alluvial fan (Figure 2b,e), while the central study area (Site 2) is located on the Raša floodplain (Figure 2c,f). The SE-most location (Site 1) (Figure 2d,g) is characterized by the presence of highly conductive fine-grained sediments originating from the nearby hillslopes (karstic environment). Recognized lineaments associated with RF activity are presented on the high-resolution hillshaded (HS) DEM (Figure 2b–g).

3. Materials and Methods

High-resolution shallow subsurface geophysical imaging can significantly contribute to the study of active faults by providing subsurface information about the geologic structure and deformational patterns present. In this work, we propose the use of a pseudo 3-D GPR study and complimentary 2-D ERT profiling, together with a high-resolution LiDAR DEM dataset, to investigate near-surface deformation related to active faults in seismogenic regions [3].

3.1. Ground-Penetrating Radar (GPR)

Ground-Penetrating Radar (GPR) is a high-resolution geophysical method used to study the shallow subsurface. It utilizes the reflection or scattering of electromagnetic (EM) waves from strata with different dielectric properties in the subsurface [32]. The depth of penetration and resolution power of GPR data depend on the electrical properties of the sediment and on the frequency of the signal. In general, the application of lower frequencies results in a greater depth of investigation, whereas more electrical-conductive sediments (e.g., fine-grained sediments with higher water content) result in greater attenuation, thus limiting the depth of investigation. Variations in the amount and type of fluid in pore spaces, minor changes in porosity, changes in the sediment grain type and changes in grain shape, orientation and packing, can all provide significant reflections [33]. Consequently, features such as sedimentary structures and lithological boundaries are clearly visible with GPR. Faults and fractures also generate reflections and diffractions, as they usually represent major EM discontinuities that disrupt bedding continuity [34,35].
In the past 30 years, 2-D GPR profiling has been used extensively to image active faults [36,37], to detect shallow fault zones [6,38,39,40] and document off-fault deformations in varying geologic settings [41,42]. However, most earlier studies consisted of single, 2-D GPR survey lines across faults. Two-dimensional profiling has also been applied to study some faults in Slovenia, such as on the (most likely) causative Idrija Fault for the historic 1511 Mw 6.8 Idrija earthquake [25,31]. Grützner et al. [8] and Zajc [31] reported the results of 2-D GPR across the RF with varying success. Jamšek Rupnik et al. [43] used 2-D GPR to distinguish vertical disruptions within the profiles, associated with lithological and/or tectonic contacts across the Sava fault. Zajc [31] also conducted an isolated 2-D survey across the Cerklje, Vodice, Skaručna, Utik and Libna Faults in central and Eastern Slovenia.
Unfortunately, single 2-D profiles may be contaminated by out-of-plane reflections and may not be sufficient for imaging highly heterogeneous structures, including faults characterized by complex geometries. In contrast, the 3-D GPR technique provides continuous geometrical information on the investigated geological structures and allows the interpreter to observe high-resolution images of active fault structures, elucidating variations in geometry, offsets of small fault strands, deformation along the strike of the fault and significantly reduces the interpretation subjectivity of 2-D profiles [44,45,46]. This was demonstrated by extensive studies of the Wellington Fault [5,34,47,48], the Roer Graben and Geelen Fault [4,49], Monte Vettore Fault system [46], Ikeida Fault [50], Emeelt Fault [51] and several other faults across the globe.
However, a full 3-D acquisition requires at least a quarter-wavelength grid spacing in all directions on the surveying surface [52], which is extremely time-consuming and hence restricts applications to small areas. Conversely, when subsurface features are expected to be fairly linear and of homogeneous orientation (2-D media), acquiring spatially aliased datasets that require some degree of interpolation between parallel profiles may be an appropriate approach, especially for large areas. This approach, with different interval distances between inline and crossline profiles, has been adopted in this study and is hereafter referred to as a pseudo 3-D GPR survey (e.g., ref. [35]). The criteria used to identify the main strands of the Raša Fault (RF) and associated structures based on geophysical properties were as follows: GPR reflector discontinuities, GPR reflector dip changes, GPR facies transitions and variations in attenuation characteristics and sharp lateral electrical resistivity contrasts in the ERT data (e.g., ref. [6]).

GPR Data Acquisition and Processing

A high-resolution pseudo 3-D GPR dataset was collected with a Malå ProEx GPR System [53] (GuidelineGeo, Stockholm, Sweden) equipped with a 100 MHz antenna in common offset (CO) configuration. During fieldwork, particular attention was paid to surface conditions to prevent the introduction of artifacts into the interpretation. Acquisition parameters are summarized in Table 1.
GPR data were processed and analyzed using the ReflexW (version 10.1) [54] and GPR-Slice (v7.MT) [55] processing software. Applied parameters are shown in Table 2. ReflexW was used for the processing of raw radargrams and a detailed interpretation of 2-D profiles. Multiple processing workflows were tested to improve the data quality. Processed radargrams were then imported into GPR-Slice, which provided the tools for the construction of time-slices and isosurfaces [56] by applying a threshold value to the data. Processing parameters are provided in Table 2. To mitigate the potential influence of processing artifacts on our geological interpretation, we carefully cross-checked the individual 2D profiles against the interpolated 3D data volume to identify and isolate any data irregularities or processing anomalies. RGB shading was applied to illuminate the isosurfaces and provide a realistic 3-D perspective of the subsurface features (as indicated by the color bar in the accompanying figures).
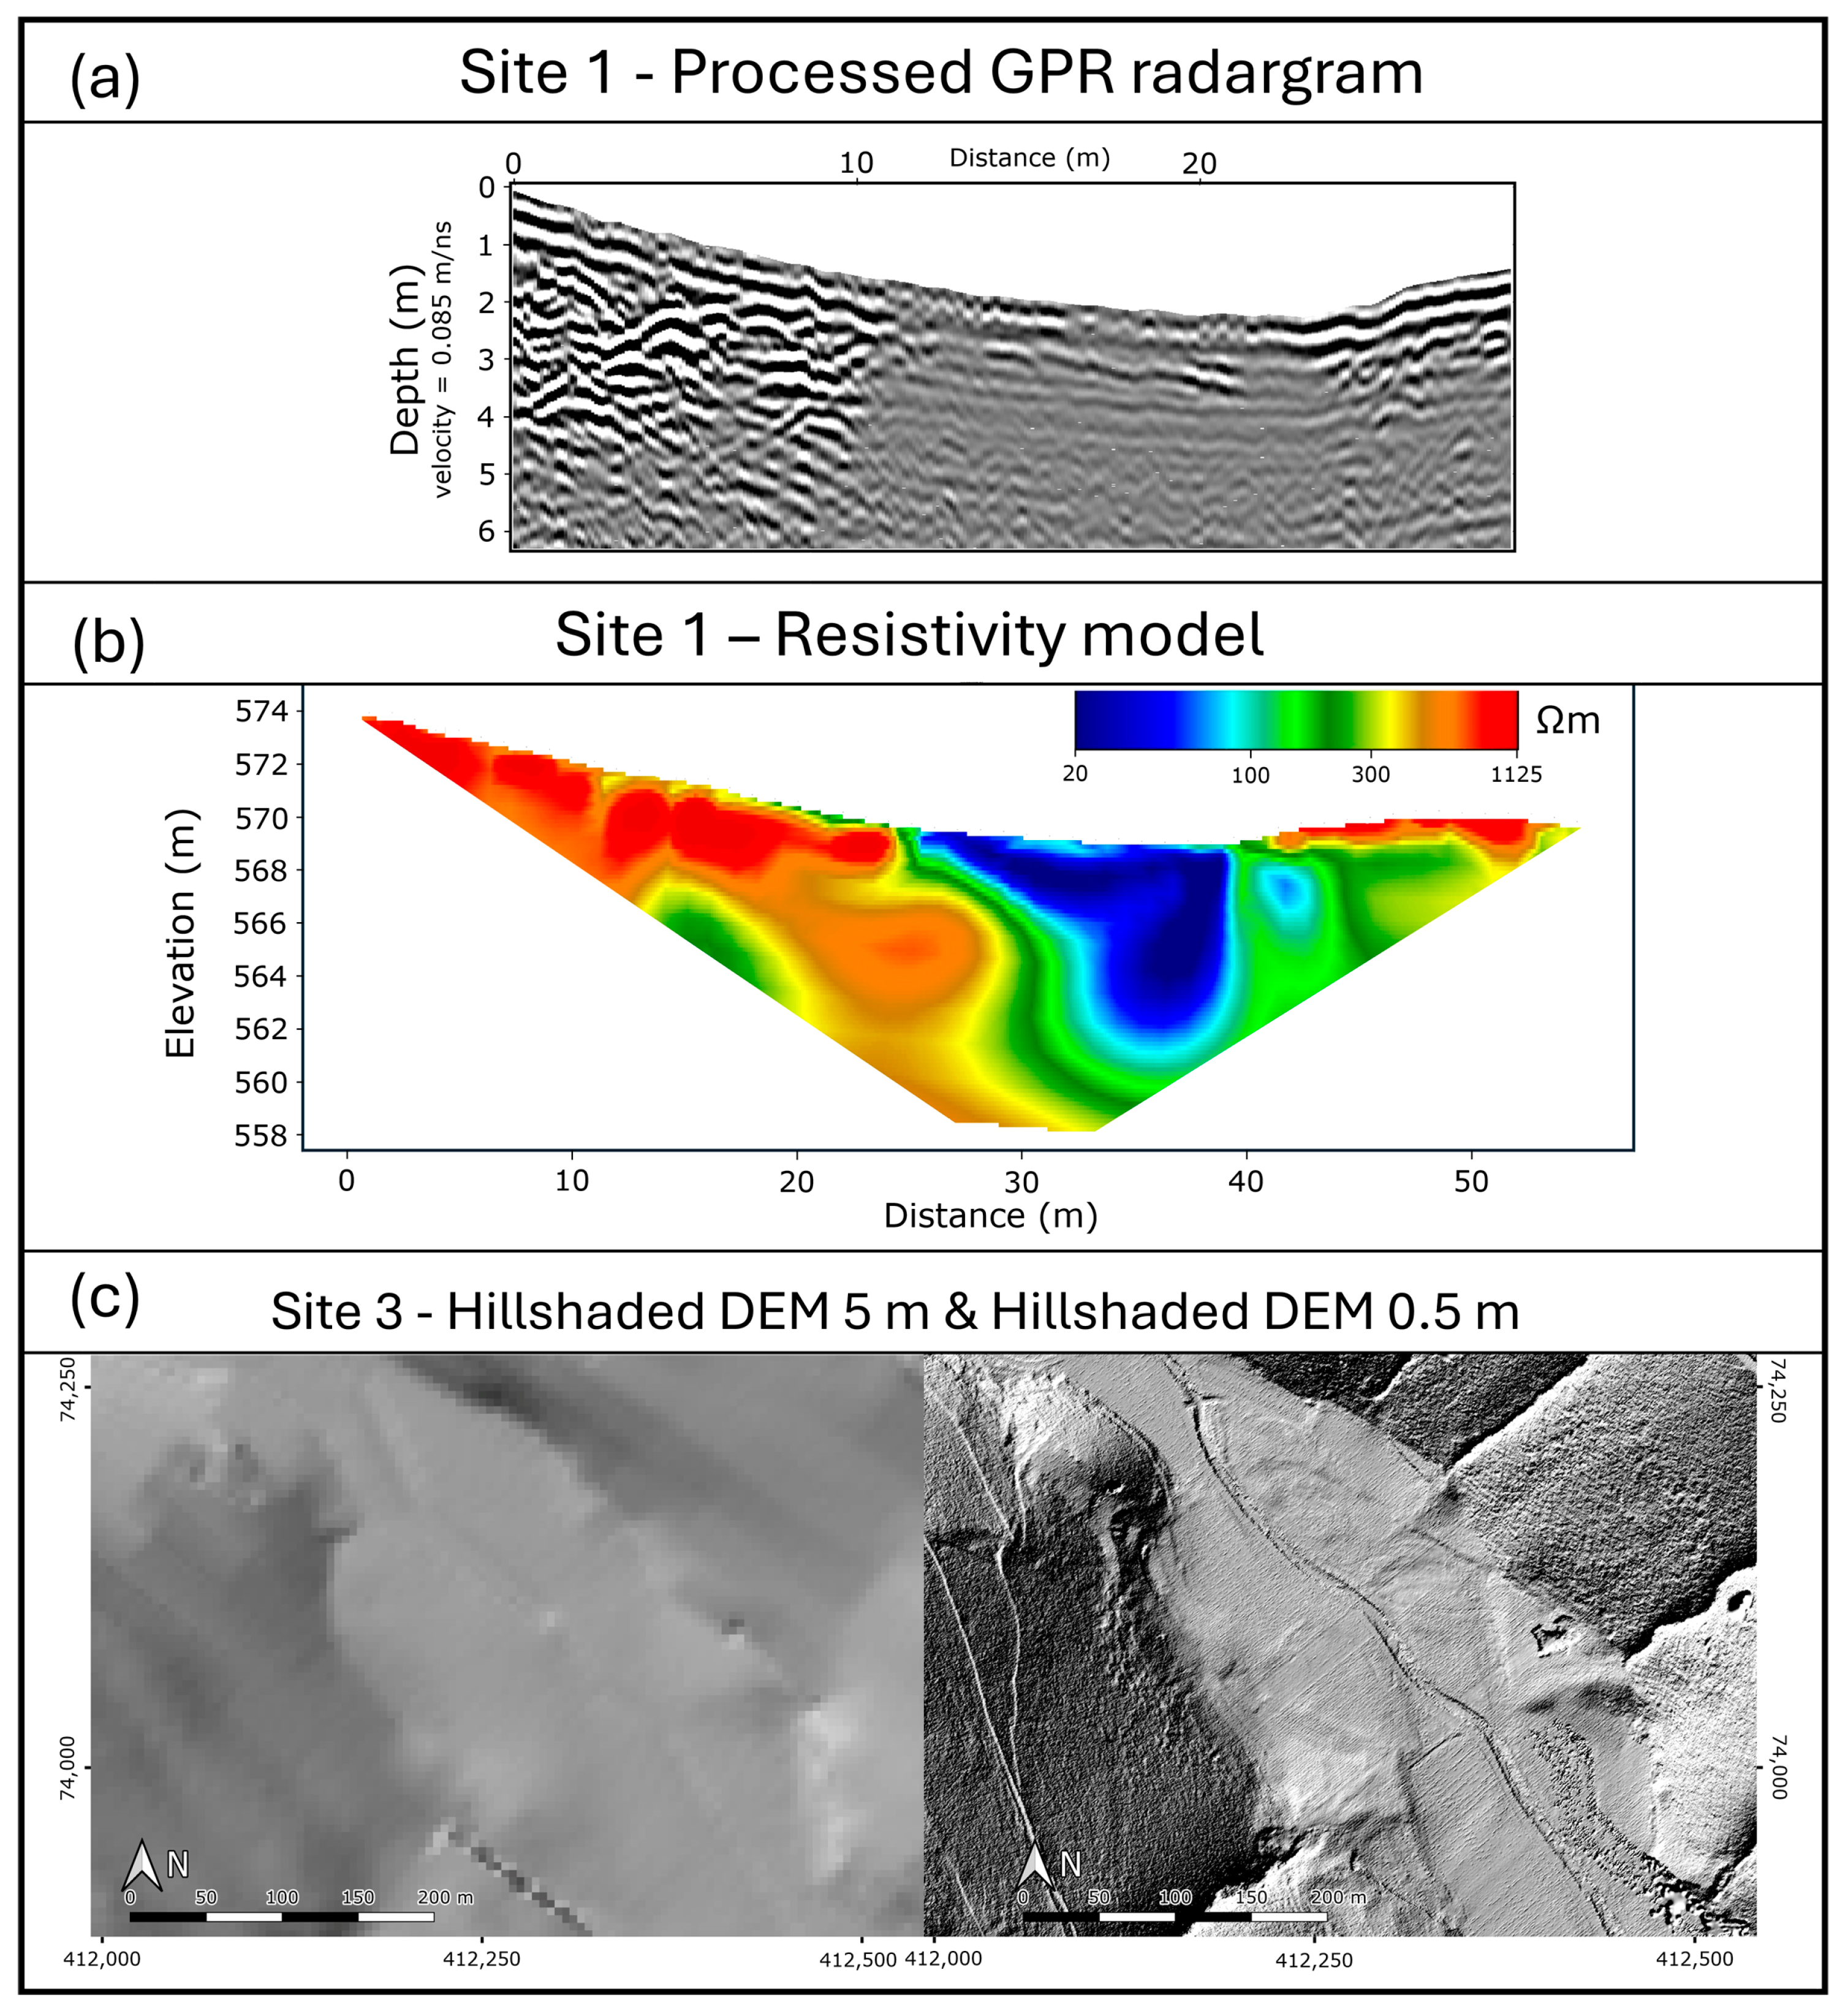
Velocity, although not of crucial importance for fault strand identification based on the selected geophysical indicators, was estimated from a few diffraction hyperbola fittings and previous experience in similar environments as 0.085 m/ns. Migration was not applied, as the main goal was to preserve the true travel-time geometry and reflector continuity. Alongside qualitative amplitude and continuity analyses, we also adopted an isosurface (3-D volumetric rendering) approach to GPR visualization in conjunction with GPR time slices [57]. The final processed GPR radargram for Site 1 is shown in Figure 3a.

3.2. Electrical Resistivity Tomography (ERT)

Since active faults are typically characterized by complex near-surface structures that vary with faulting styles and the types of ruptured rocks, GPR data alone can be difficult to interpret [59]. To address this, a separate high-resolution 2-D ERT survey was carried out to provide additional constraints on both individual 2-D GPR profiles and the pseudo 3-D GPR cube.
ERT is a near-surface geophysical technique that measures the subsurface resistivity by injecting electrical current through electrodes and measuring the resulting potential difference [60]. The spacing between the transmitting and receiving electrodes determines the spatial resolution and volume of interrogation over which each measurement is collected.
ERT has been widely applied to obtain 2-D high-resolution images of resistivity subsurface distribution patterns in areas with complex geology. It has been shown to be a useful and reliable method in a wide spectrum of active fault studies: in determining the location of active faults at surface and inferring shallow subsurface structures and Quaternary deformations [16,43,61,62,63], identifying displacements inside the fault zones [64,65,66] and estimating the width of fault zones with different levels of fracturing [67,68,69].

ERT Data Acquisition and Processing

Two levels of investigation were conducted for the ERT survey: a general reconnaissance to establish the geological framework and a targeted high-resolution survey to delineate fault zone characteristics. As our study focused on constraining the location of the fault strands, delineating the internal structure of the fault zone, and possibly estimating the cumulative displacement in the uppermost couple of meters, we applied a high-resolution dipole–dipole survey to complement the GPR results. ERT surveys at Site 1 (karstic sediments) and Site 2 (Raša floodplain) were carried out with the AGIUSA SuperSting R8 (AGIUSA, Austin, TX, USA) instrument [70] (n = 8) and at Site 3 (alluvial fan) by a multichannel ABEM Terrameter LS2 (GuidelineGeo, Stockholm, Sweden) instrument [71] (n = 9). The only reason that different instruments were used is that the Terrameter was acquired later. Comparison tests have shown that the choice of the instrument has no influence on the data quality. Acquisition parameters are shown in Table 3.
Apparent resistivity data were inverted using the RES2DINV software (version 2026.1) [72] to obtain high-resolution resistivity images of the subsurface. The 2-D inversion routine applies a Gauss–Newton least squares method [73], based on the finite-difference model of the subsurface, which is automatically adjusted in an iterative process. This adjustment is achieved by comparing the measured apparent resistivities with the calculated apparent resistivities from the inverted resistivity model. The Root Mean Squared (RMS) error provides a measure of this difference as an indicator of the goodness of fit. The L2 norm inversion was used and later evaluated against individual 2-D GPR profiles and pseudo 3-D GPR isosurfaces. The final resistivity model for Site 1 is shown in Figure 3b.

3.3. LiDAR Digital Elevation Models (DEM)

LiDAR (light detection and ranging) technology enables the acquisition of high-spatial-resolution data by penetrating vegetation and directly capturing real 3-D surface topography. High-resolution digital elevation models (DEMs) derived from LiDAR provide a better constraint on fault geometry complexity and the geomorphic indicators of fault related deformations [74,75,76,77].
The recognition of subtle tectonic geomorphic features, such as small fault scarps of less than a few meters high and small offset gullies of a similar scale, are also important because those small features record the most recent episodes of repeated faulting and have a clear impact on estimating the size of potential future earthquake [78,79]. More importantly, if small tectonic features are discovered between adjacent faults (or fault segments), the rupture on one fault is more likely to propagate onto the other, resulting in a much larger “multifault” earthquake [80]. Small tectonic geomorphic features hold the key to interpreting or evaluating a whole fault system and are much more important than their size implies. In recent decades, airborne LiDAR surveying has been deployed to detect fine-scale tectonic–geomorphic features [80,81,82,83,84] and has successfully delineated earthquake surface ruptures under vegetation using 1 m or 2 m LiDAR DEMs [82,85]. However, recent LiDAR studies also reported that some small tectonic breaks could not be identified with this resolution [80]. This necessitates the use of much higher resolution LiDAR DEMs.

LiDAR Data Reprocessing

LiDAR data reprocessing was performed on the relief point cloud dataset (only ground points) of the Slovenian national airborne survey [13] and derived from the georeferenced and classified point cloud in which 93% of the general LiDAR surveyed area exhibits more than 5 ground points/m2 [13]. The relief point cloud was imported into CloudCompare (v2.12.4) [86] and QGIS (version 3.28.1) [87] to verify sufficient surface point density for the construction of high-resolution DEM [80,88]. All our areas of interest were located in low-vegetation and gentle topography, resulting in high surface point density (pts/m2 > 8). We therefore constructed a DEM with a resolution of 0.5 m in QGIS. The importance of using high-resolution DEMs (1 m standard Slovenian DEM or site-specific better resolution reprocessed DEM) for the detection of subtle geomorphic landforms and geomorphic markers of the RF activity is demonstrated for Site 3 (Figure 3c), which compares a “low-resolution” hillshaded DEM 5 m [58] with the reprocessed 0.5 m hillshaded DEM.

4. Results and Interpretations

Given the highly heterogeneous nature of the alluvial deposits, the high conductivity of the karstic sediments, and the complex geometry of the fault zone, identifying and correlating fault strands across multiple parallel survey lines enabled a more rigorous structural interpretation and an assessment of along-strike variations in fault geometry. Diverse visualization techniques (depth slices and isosurfaces) were applied to the GPR data to isolate key features within the shallow sedimentary units and reveal potential subsurface deformations.

4.1. Site 1—Karstic Environment

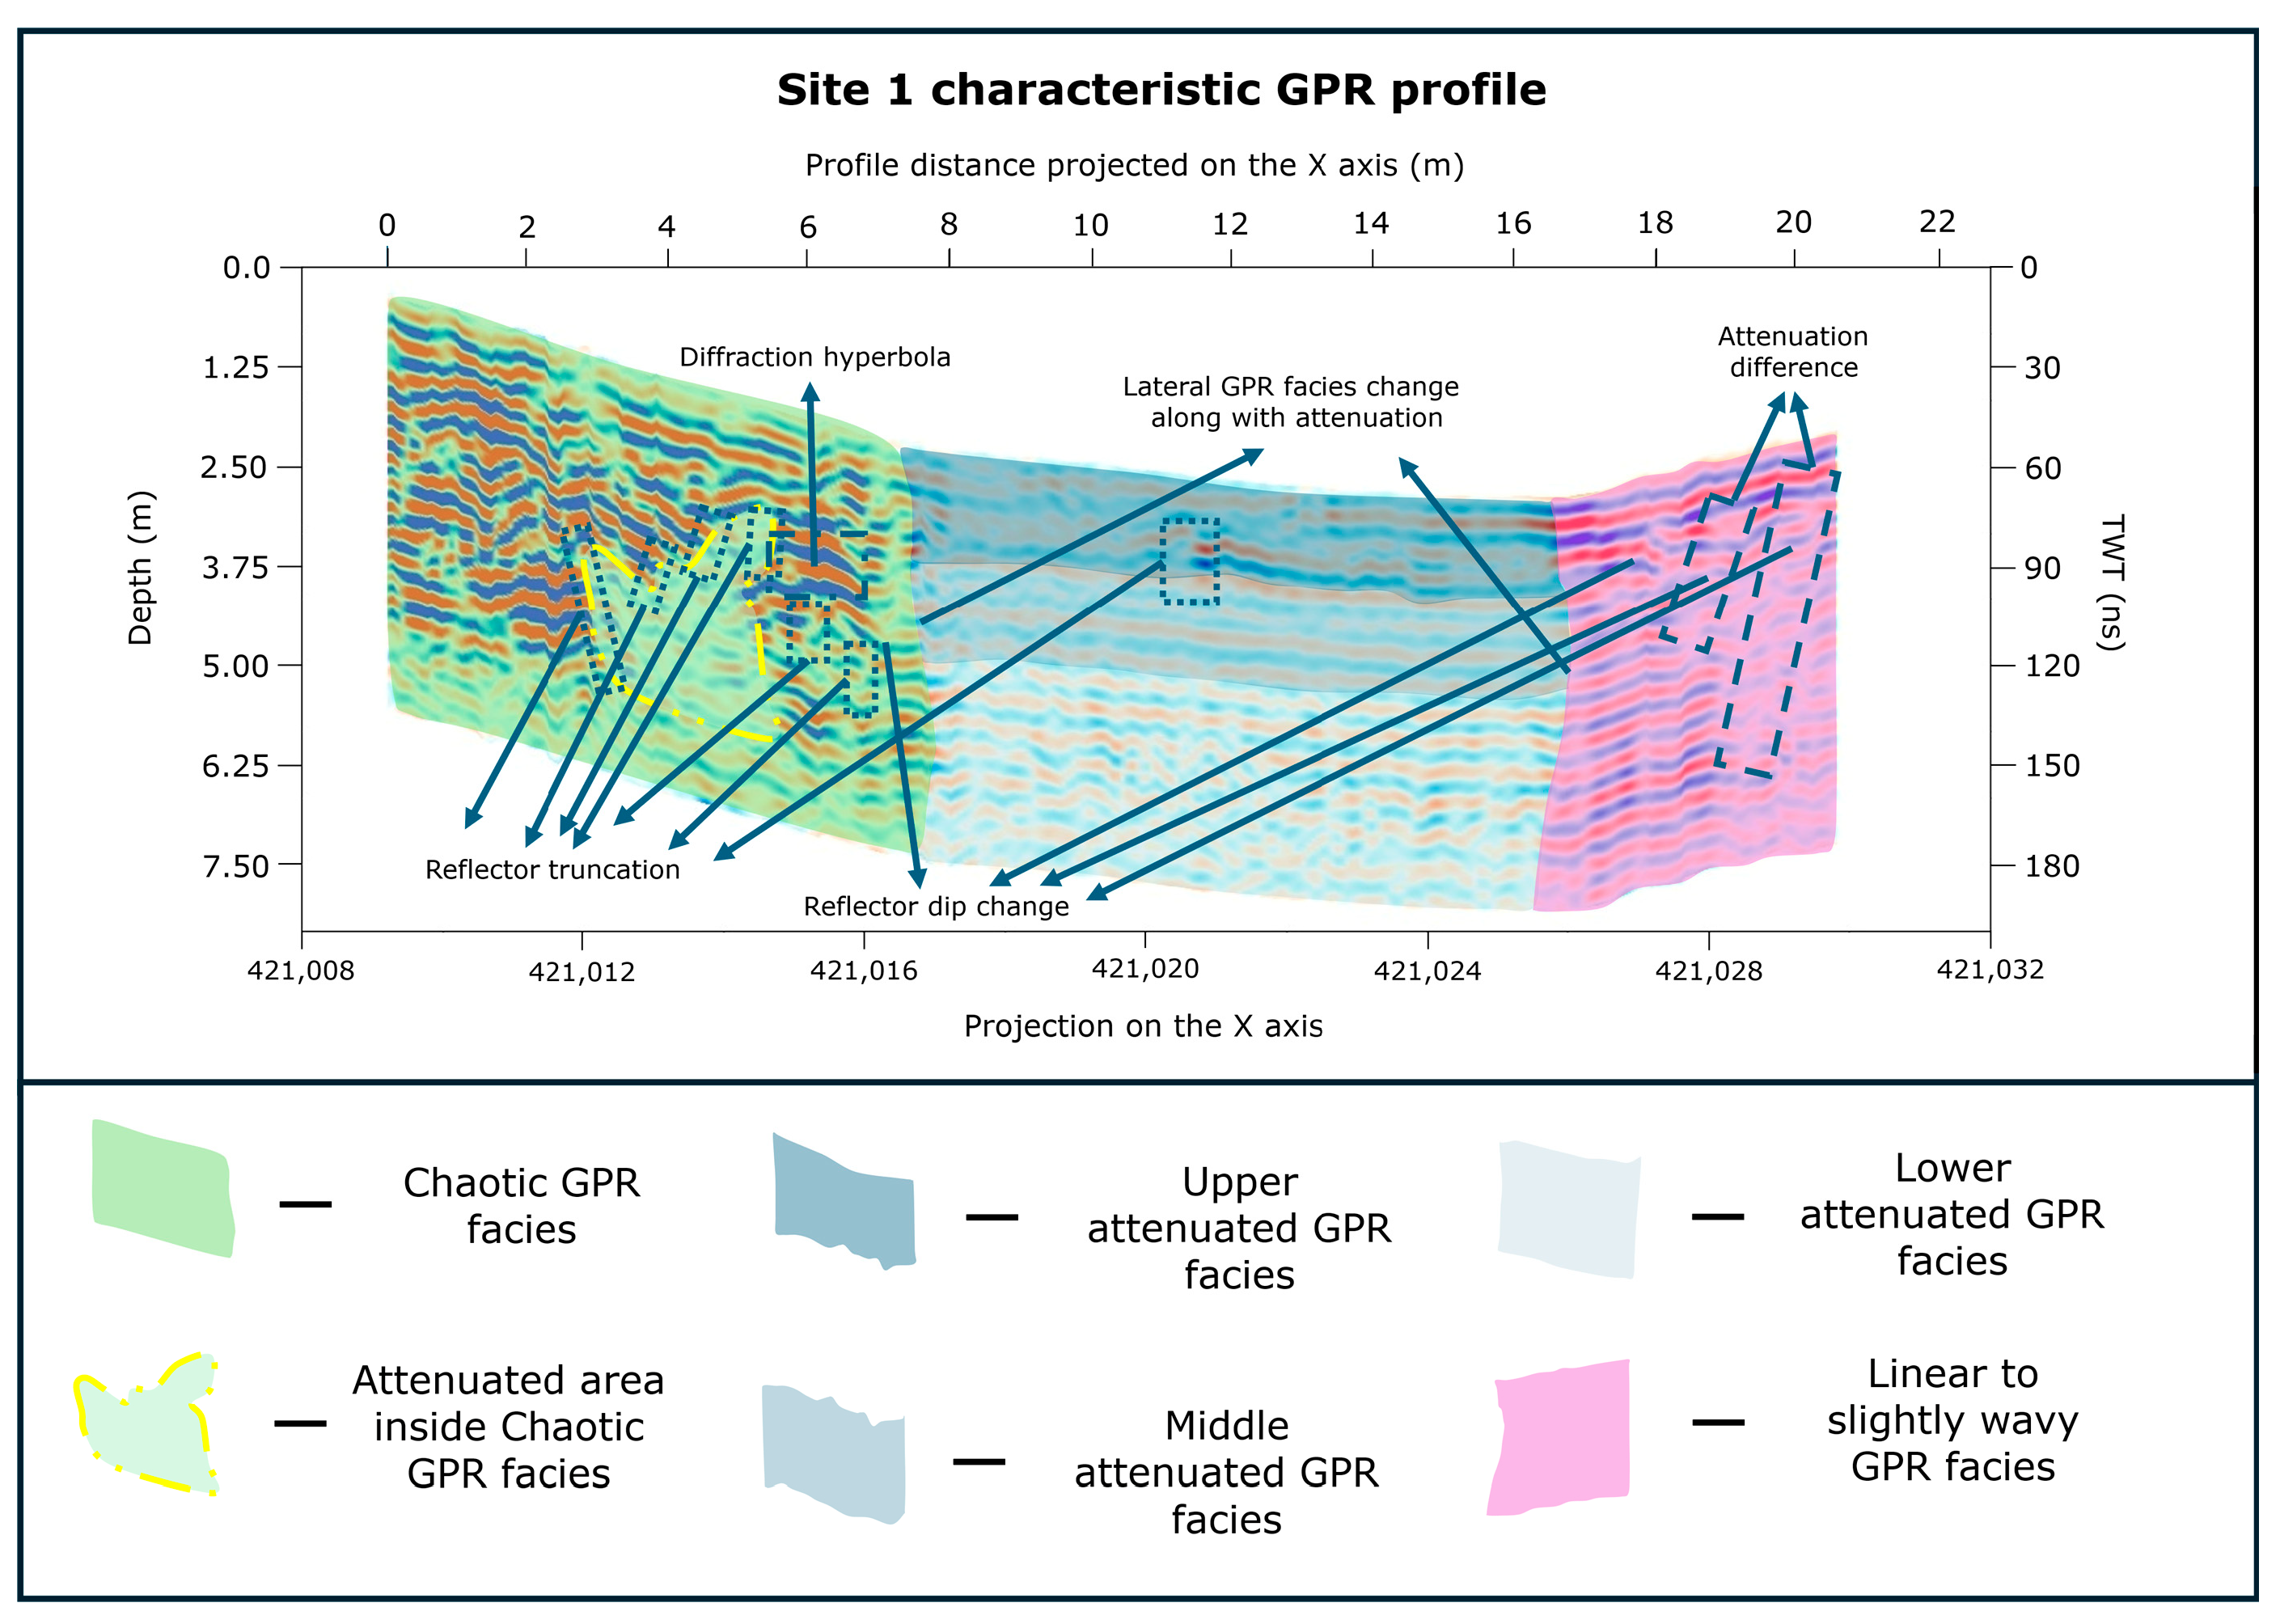
Site 1 is an exception to the typical Quaternary fluvial sedimentation found in the Raša valley. It is located in an area where the lower hillslopes exhibit upward displacement relative to the upper parts, indicating a relative uplift of the NE fault block. The selected microlocation allows both GPR and ERT surveys to cross two distinct lineaments, separated by a narrow corridor of sediment infill. All the processed inline data were projected onto the X (Easting) axis, clearly revealing two areas characterized by higher amplitudes of the GPR signal, with a high attenuation area in between (as exhibited in Figure 4). Given the depositional dynamics in such small accumulation basins, we hypothesized that the sediments were at least partially stratified and would therefore effectively record potential deformations (Figure 5a).
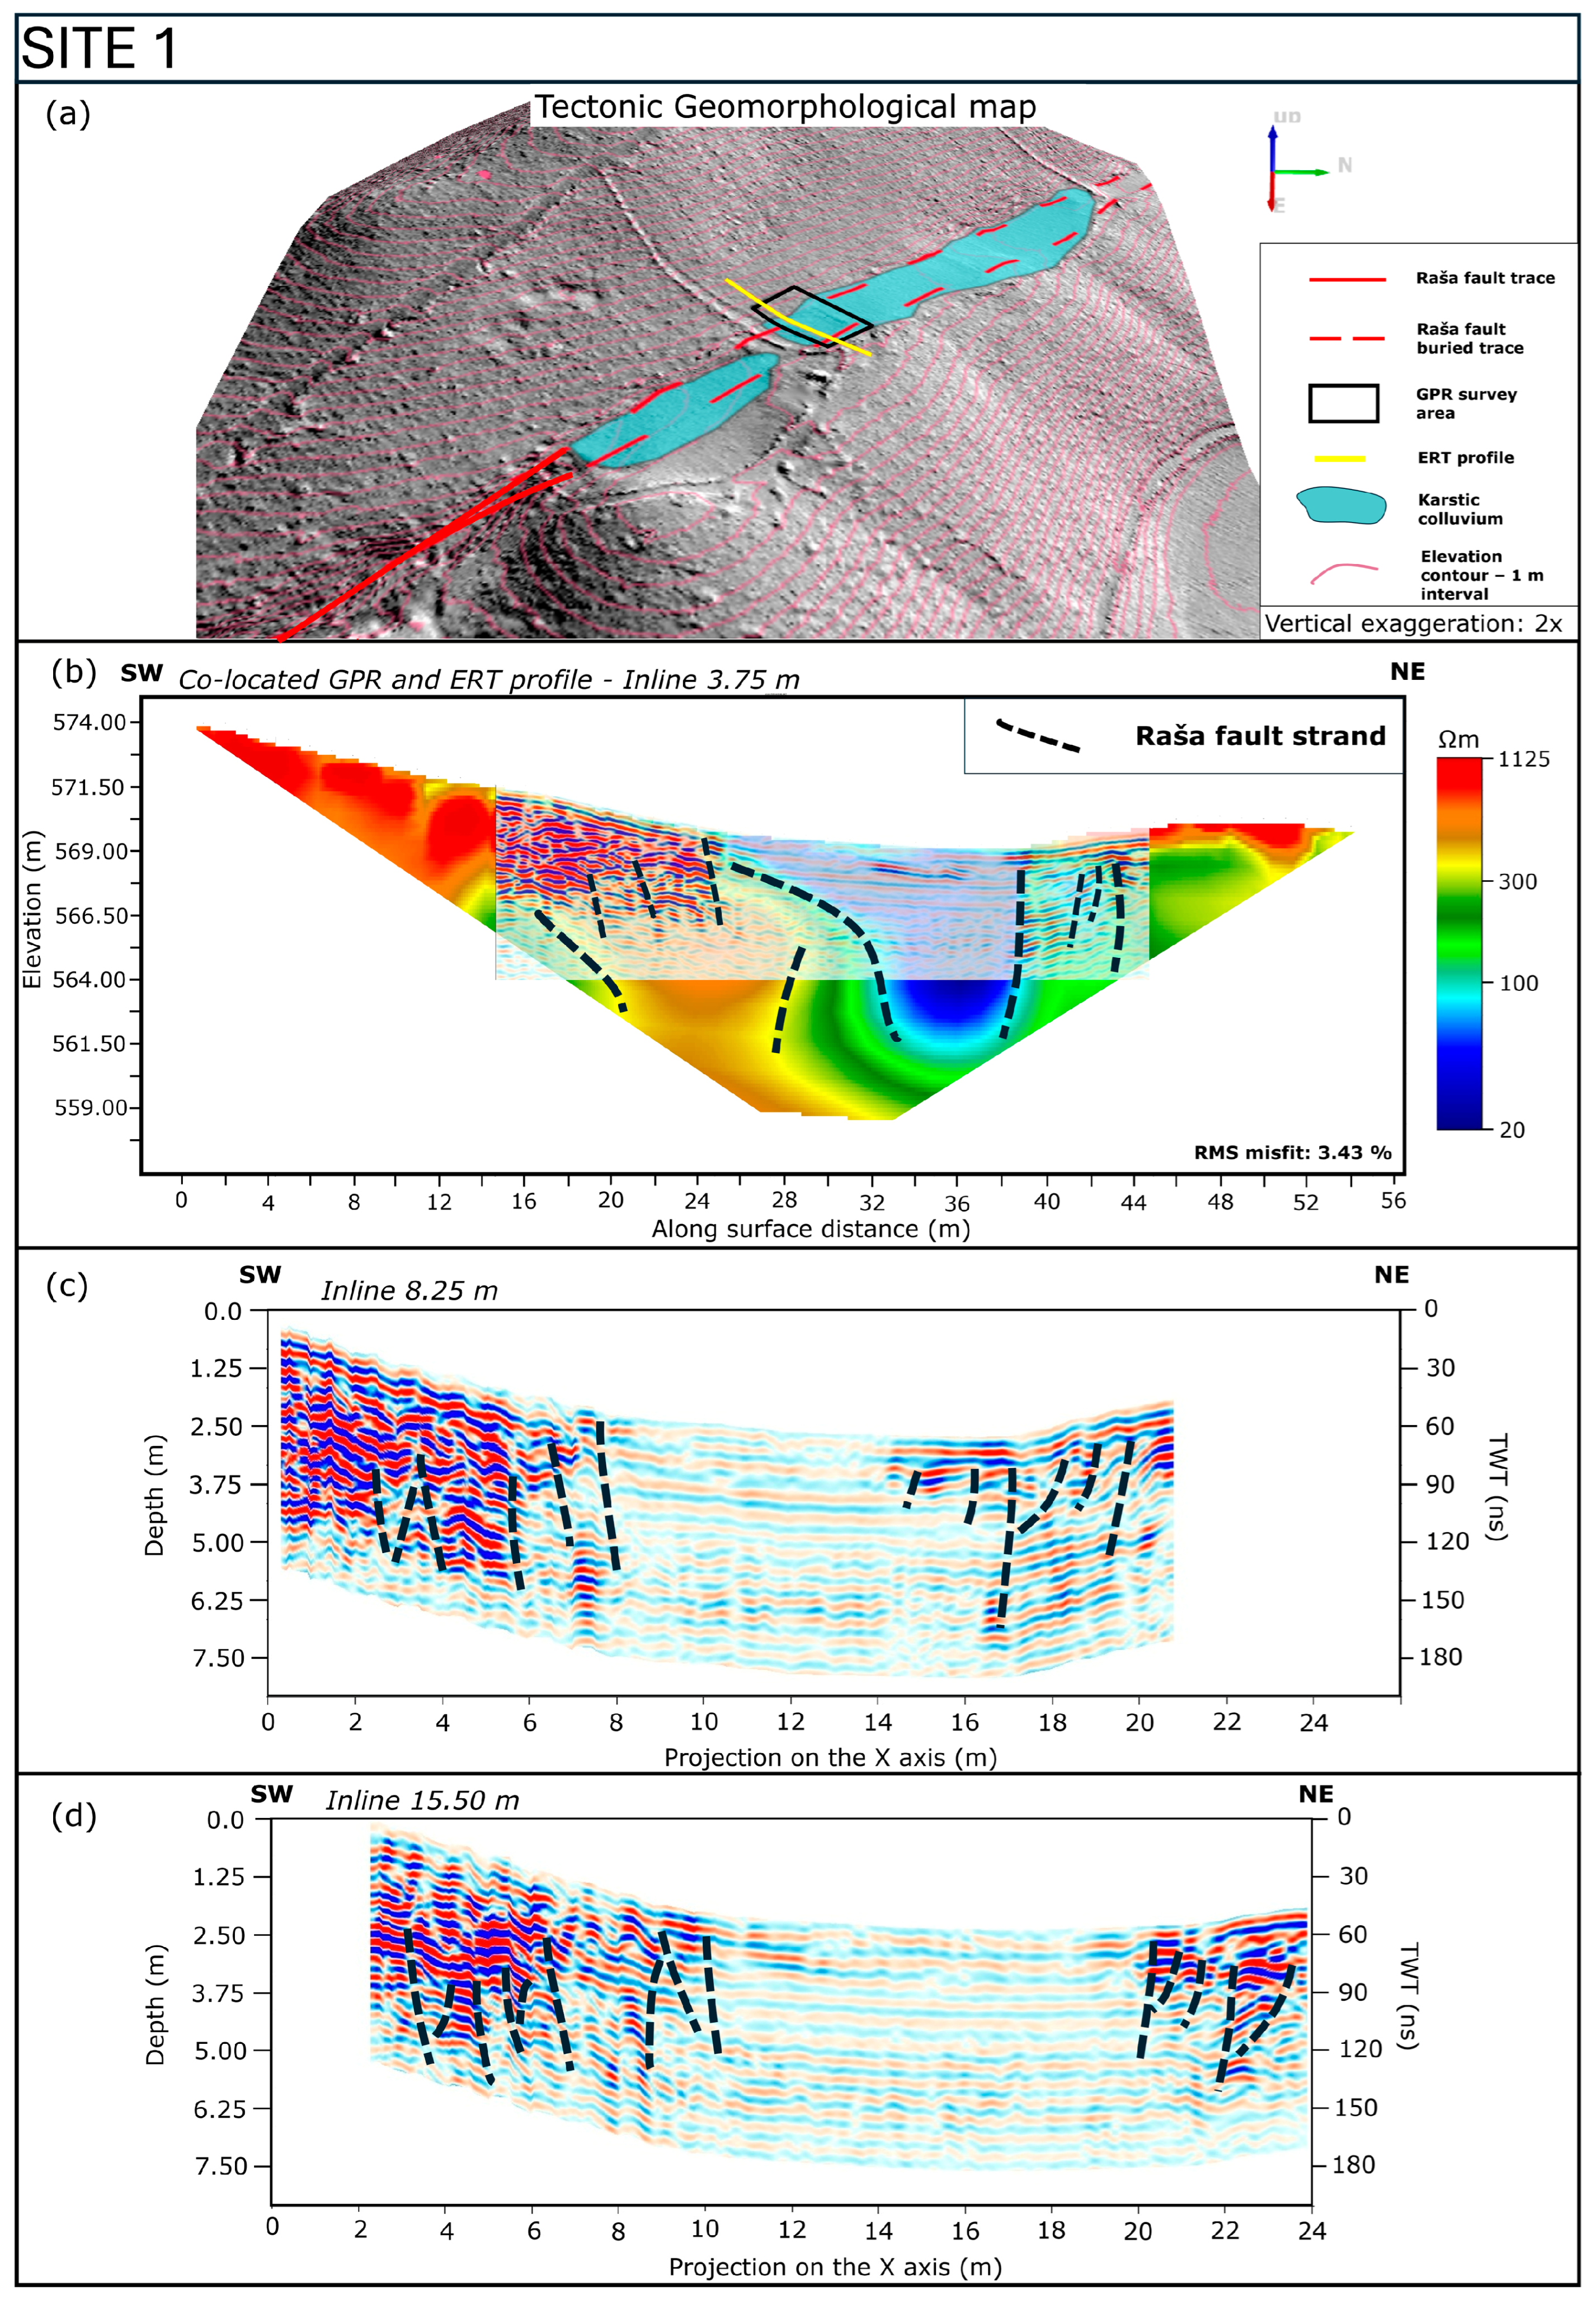
The first section at the beginning of the profile (0–7 m) is characterized by a chaotic GPR facies, consisting of low- to high-amplitude reflections, interference of diffraction hyperbolas, and discontinuity of individual reflectors (Figure 4). Laterally, at around 7 m, this GPR facies transitions into an attenuated GPR facies with linear to slightly wavy reflectors. Based on reflection configuration (shape, dip, relationship between reflections and reflection continuity; e.g., ref. [33]) and level of attenuation, we delineated this GPR facies into a vertical succession of three distinguishable facies. The upper attenuated facies (Figure 4) is represented by modest amplitude and subhorizontal to slightly wavy reflectors. It transitions into the middle attenuated GPR facies with low-amplitude linear reflectors and is the succeeded by a lower attenuated facies with low-amplitude, slightly wavy to chaotic reflectors. This vertical transition reflects a stratigraphic succession of different sediment types: from top-soil, fine-grained sediments to coarser-grained colluvium and possibly individual blocks of crushed bedrock at the bottom. Laterally, this attenuated facies transitions into a slightly wavy facies (Figure 4), which characterizes the final 3 m of the inline GPR profiles. This final unit is defined by slightly wavy reflectors with sporadic diffraction hyperbolas, narrow bands of varying attenuation, and changes in reflector dip. The lateral boundaries between the GPR facies correspond to two lineaments visible on the high resolution hillshaded DEM (Figure 2d and Figure 5a). Some gently dipping reflections are clearly visible along the profile within the first 6 m, with sparse diffraction hyperbolas also concentrated in this area. Another area exhibiting partial or complete diffraction hyperbolas is visible in the last 3 m of the inline profiles. Abrupt reflector truncations coincide with the transition from chaotic to attenuated facies and then from attenuated to slightly wavy facies. Individual reflector truncations that appear to produce small offsets are also present in the slightly wavy GPR facies. All of these features provide geophysical evidence of strong lateral contrasts in subsurface dielectric permittivity.
The observed geophysical features have been clearly identified across all profiles (Figure 5b–d), highlighting similar characteristics of the subsurface along the strike of the fault in the karstic environment (Figure 5a).
The co-located GPR and ERT profile (Figure 5b) showcases the existence of a low- resistivity unit (below 80 Ωm) on the ERT and a corresponding zone of high attenuation on the GPR profile, both aligning with the proposed RF inner fault zone (Figure 5a). The boundary between this unit and its surrounding, which exhibit higher resistivity values (between 80 and 300 Ωm towards the NE and over 300 towards the SW), confirms the existence of RF fault strands separating the innermost deformed zone from the outer, less tectonically deformed fault zone. Several other potential fault strands corresponding to lateral resistivity contrasts and a lower resistivity anomaly (200 Ωm) within an otherwise high-resistivity layer (over 550 Ωm) are evident. This coincides with a higher attenuation zone inside the chaotic GPR facies and with abrupt layer truncations both in the chaotic GPR facies and in the linear to slightly wavy facies.
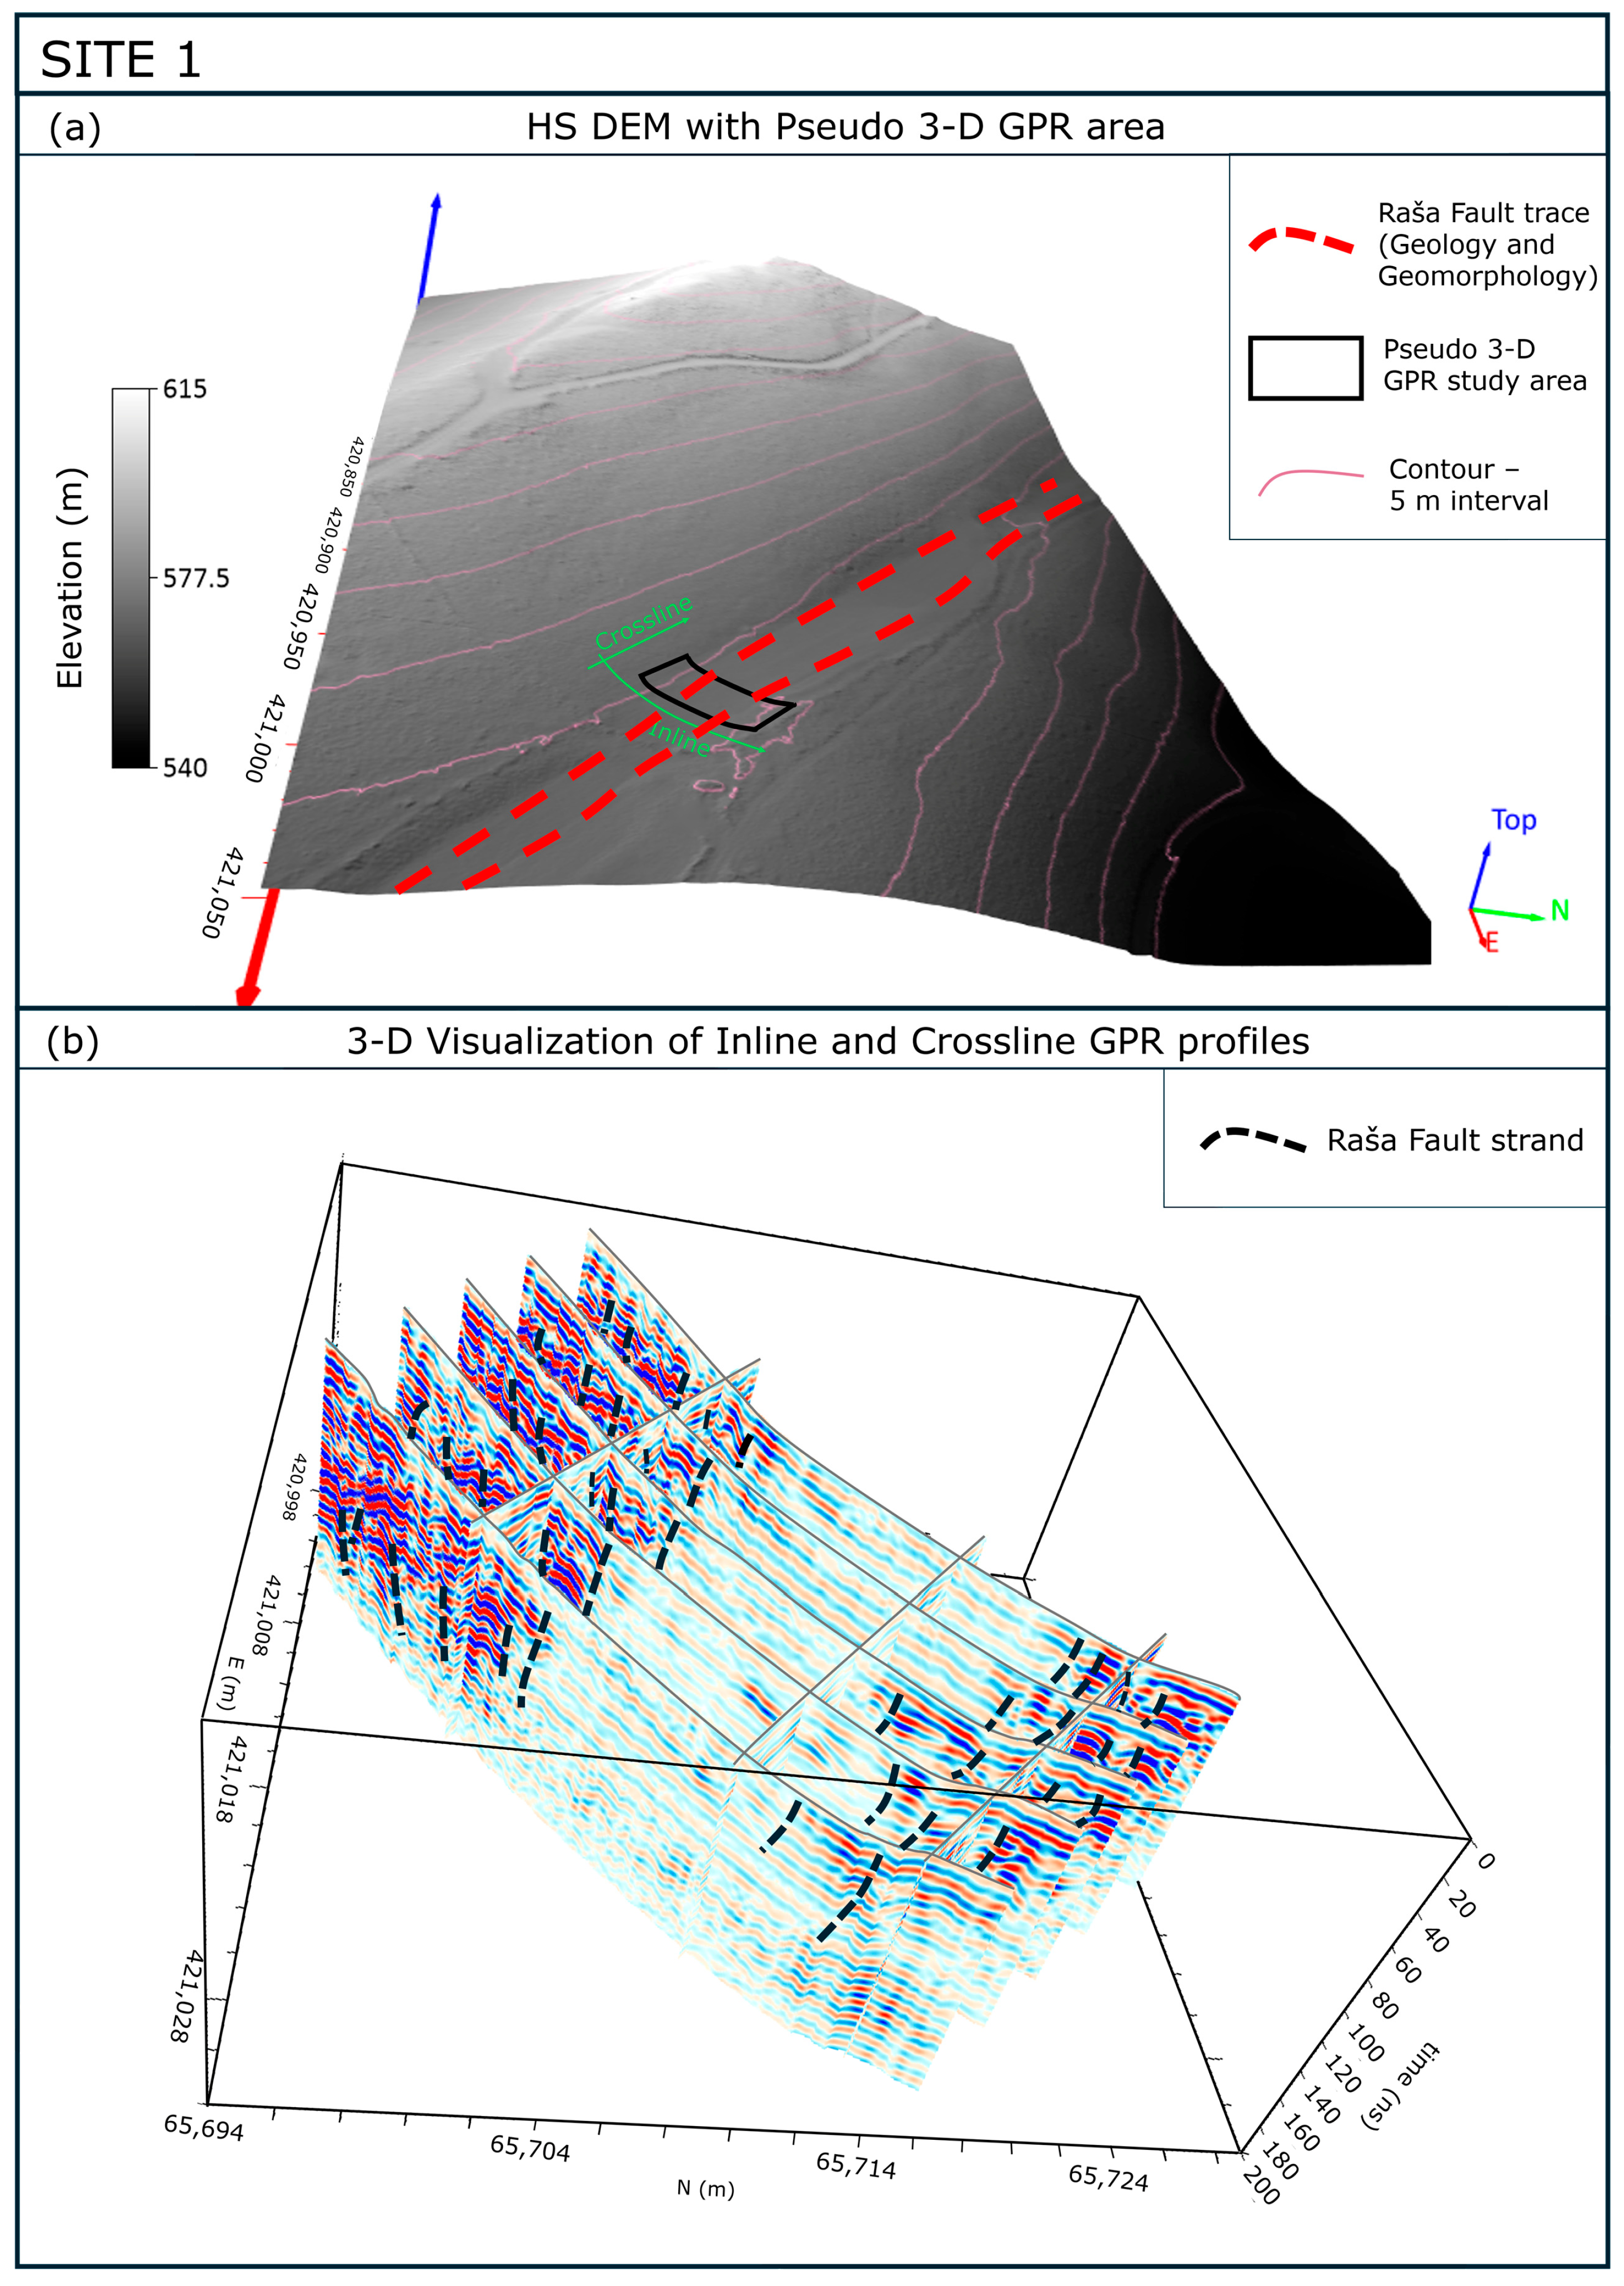
The 3-D visualization of both inline and crossline GPR profiles (Figure 6b) showcases good spatial agreement between the recognized fault strands. Although crossline profiles offer less information about the fault zone, a joint visualization provides additional context on the complexity of subsurface deformations. The transition from more attenuated to less attenuated reflectors, together with coincident reflector truncations, indicates that the fault cannot be described as a single subvertical plane but is instead an undulating surface with numerous fault strands (Figure 6b).
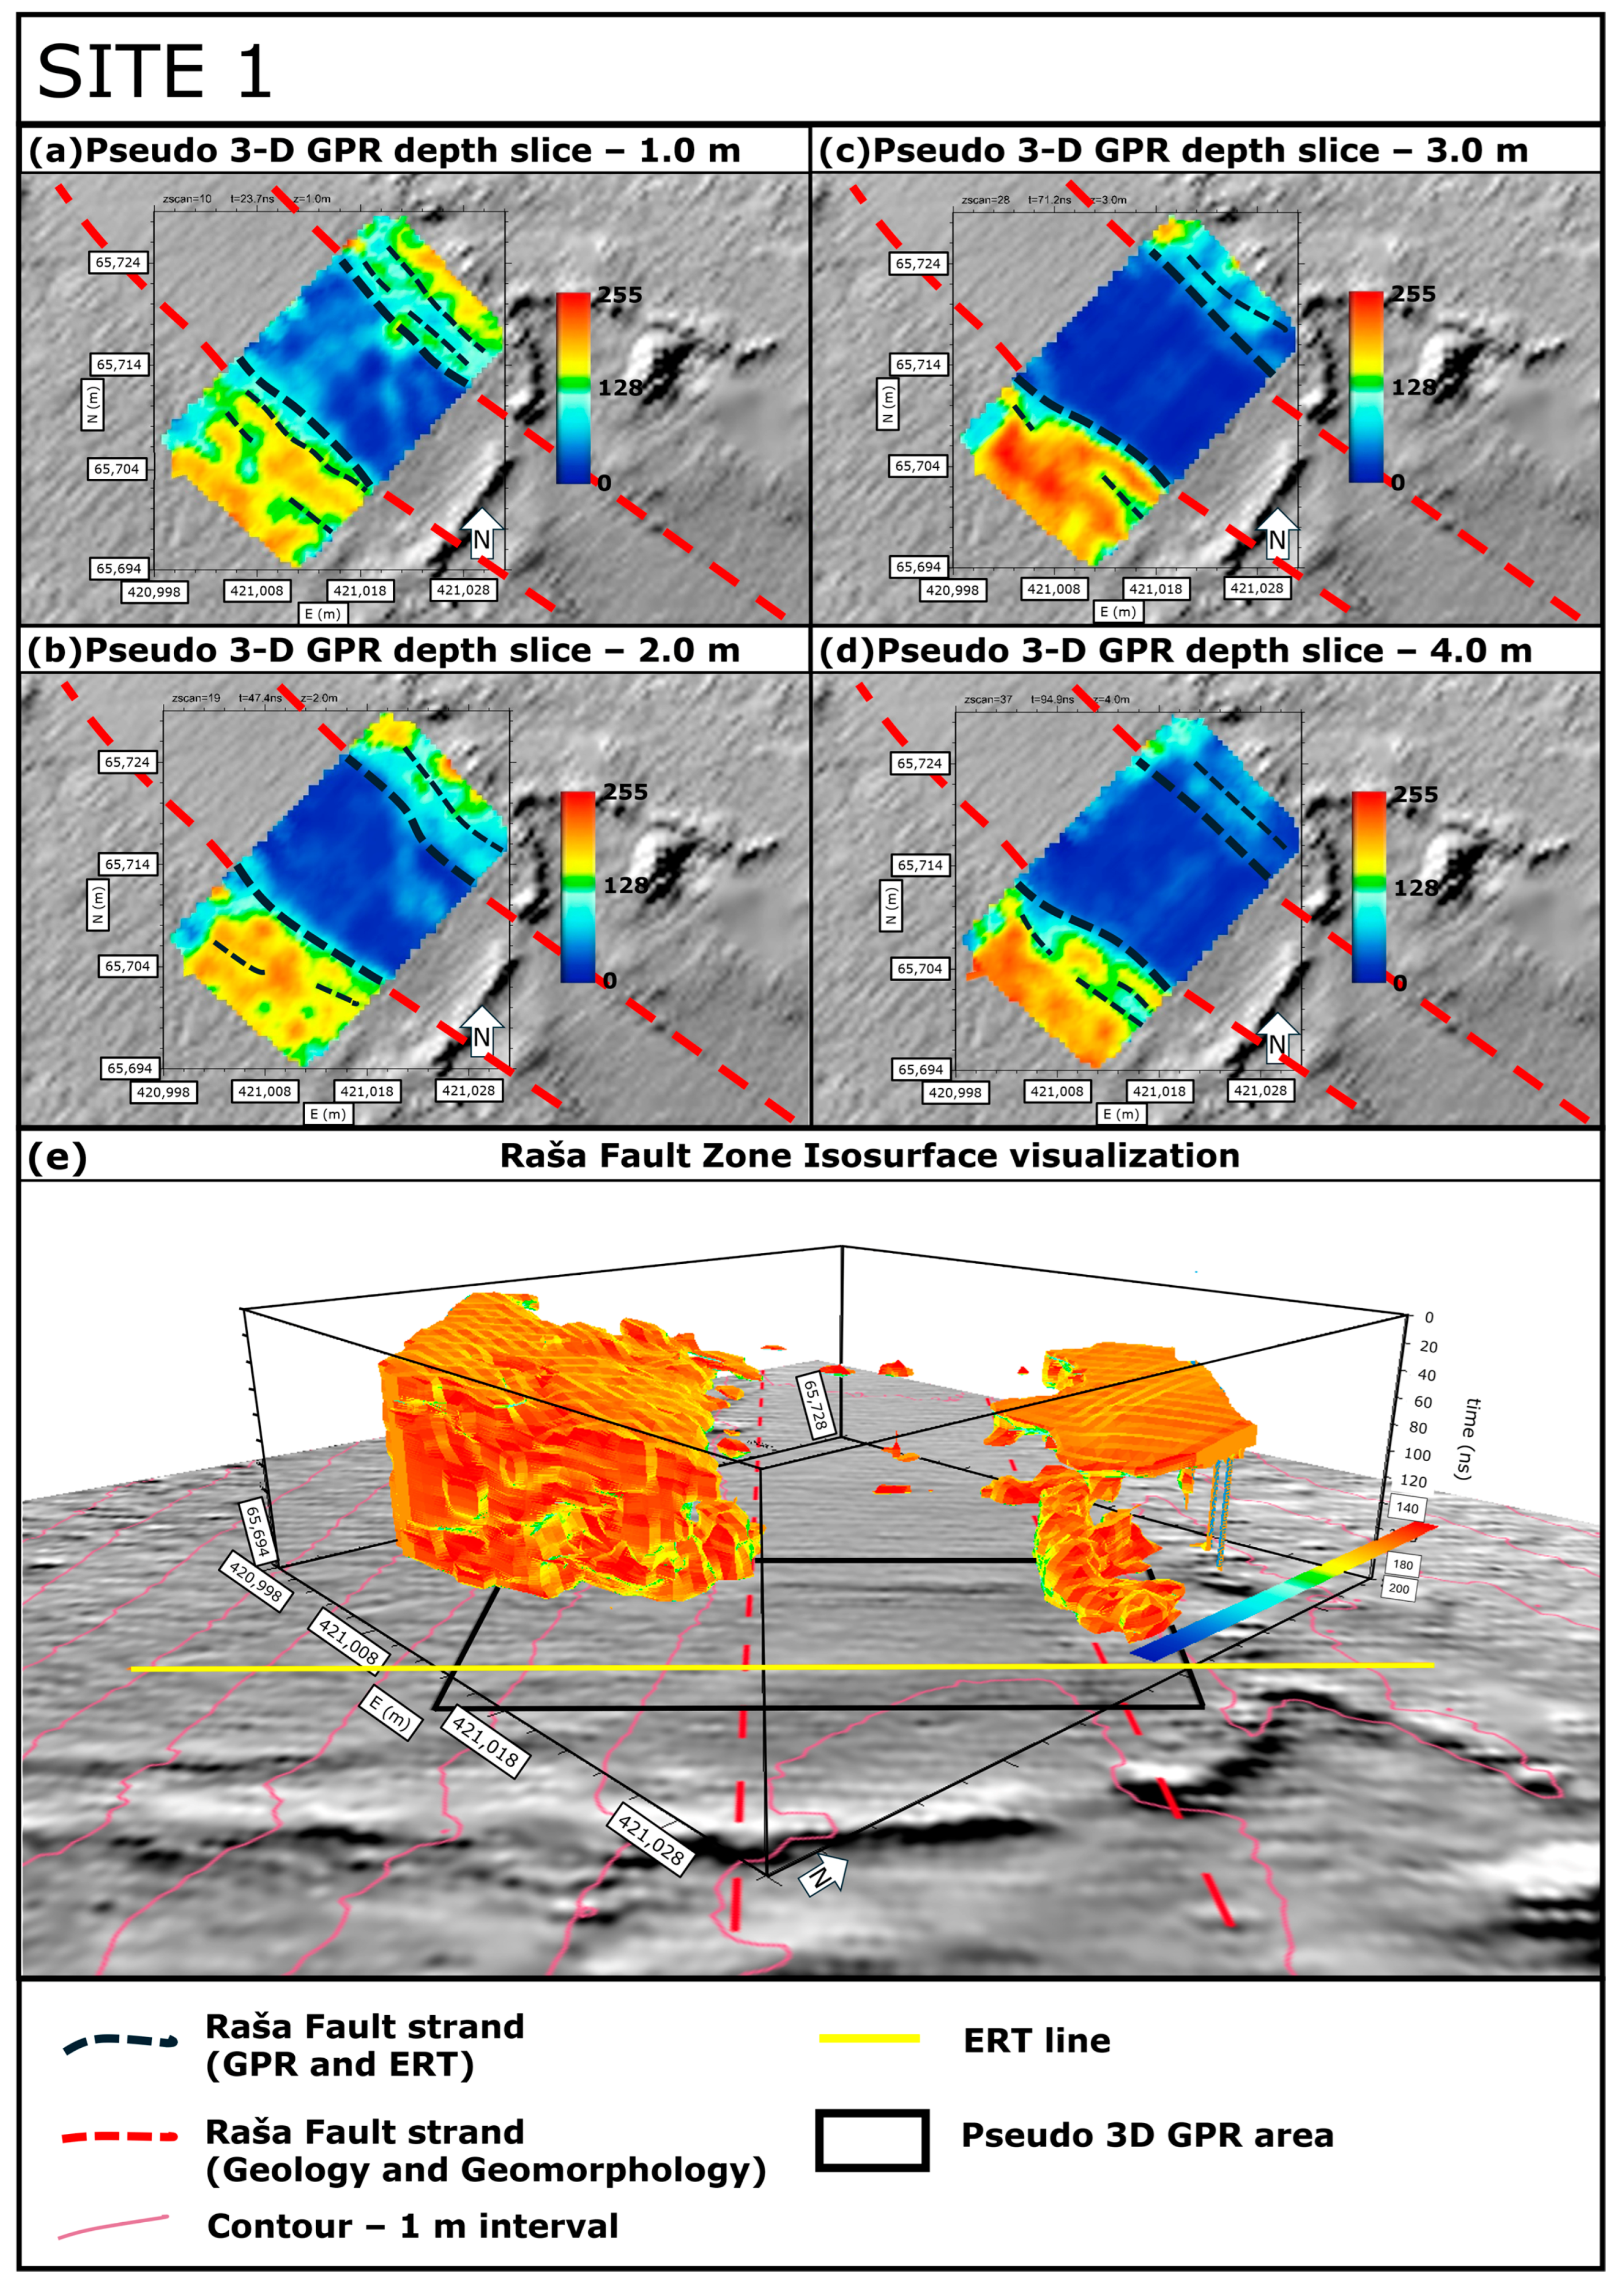
Although individual inline 2-D GPR profiles provided valuable information about the RF, we examined the pseudo 3-D GPR data cube and its various visualizations (Figure 7) to gain a better insight into the complexity of near-surface tectonic deformations.
Pseudo 3-D GPR depth slices at four different depths in 1 m increments reveal two areas of higher reflector amplitudes at the SW and NE part of the depth slices, which are related to the carbonate bedrock (Figure 7a–d). The variability of amplitudes in these two areas reflects a multitude of fractures and variability in the degree of tectonic deformation in this unit. The NE area on the 3 m and 4 m depth slices (Figure 7c,d) exhibits lower amplitudes than upper depth slices (1 m and 2 m; Figure 7a,b), most likely representing a higher degree of fault related deformations at depth. Meanwhile, the SW part of the depth slices at 3 m and 4 m (Figure 7c,d) showcase an appearance of a lower amplitude anomaly that causes the otherwise high-amplitude area to gradually disintegrate into two zones, separated by a low-amplitude lineament.
Between the two most prominent fault plane expressions that spatially confine the aforementioned SW and NE high-amplitude areas lies a low-amplitude zone (Figure 7a–d). In comparison with the ERT data, this area represents either an infill of colluvium or highly deformed bedrock. The surface expression of the RF, visible on the hillshaded DEM as two distinct lineaments coincides, with the two transitions from high- to low-amplitude areas, as seen on the depth slices (Figure 7a–d).
Pseudo 3-D GPR isosurfaces (Figure 7e), along with complementary information from the ERT profile, showcase the complexity of near-surface deformation patterns. Together with depth slices, they reveal that the near surface expression of the fault cannot be reduced into a single vertical or subvertical discontinuity, but should rather be viewed as a multitude of undulating and interfering fault planes. The orientation of the recognized RF Fault strands from depth slices and isosurfaces (315°) coincides with the orientation of the RF obtained by tectonic geomorphological mapping.

4.2. Site 2—Raša Floodplain

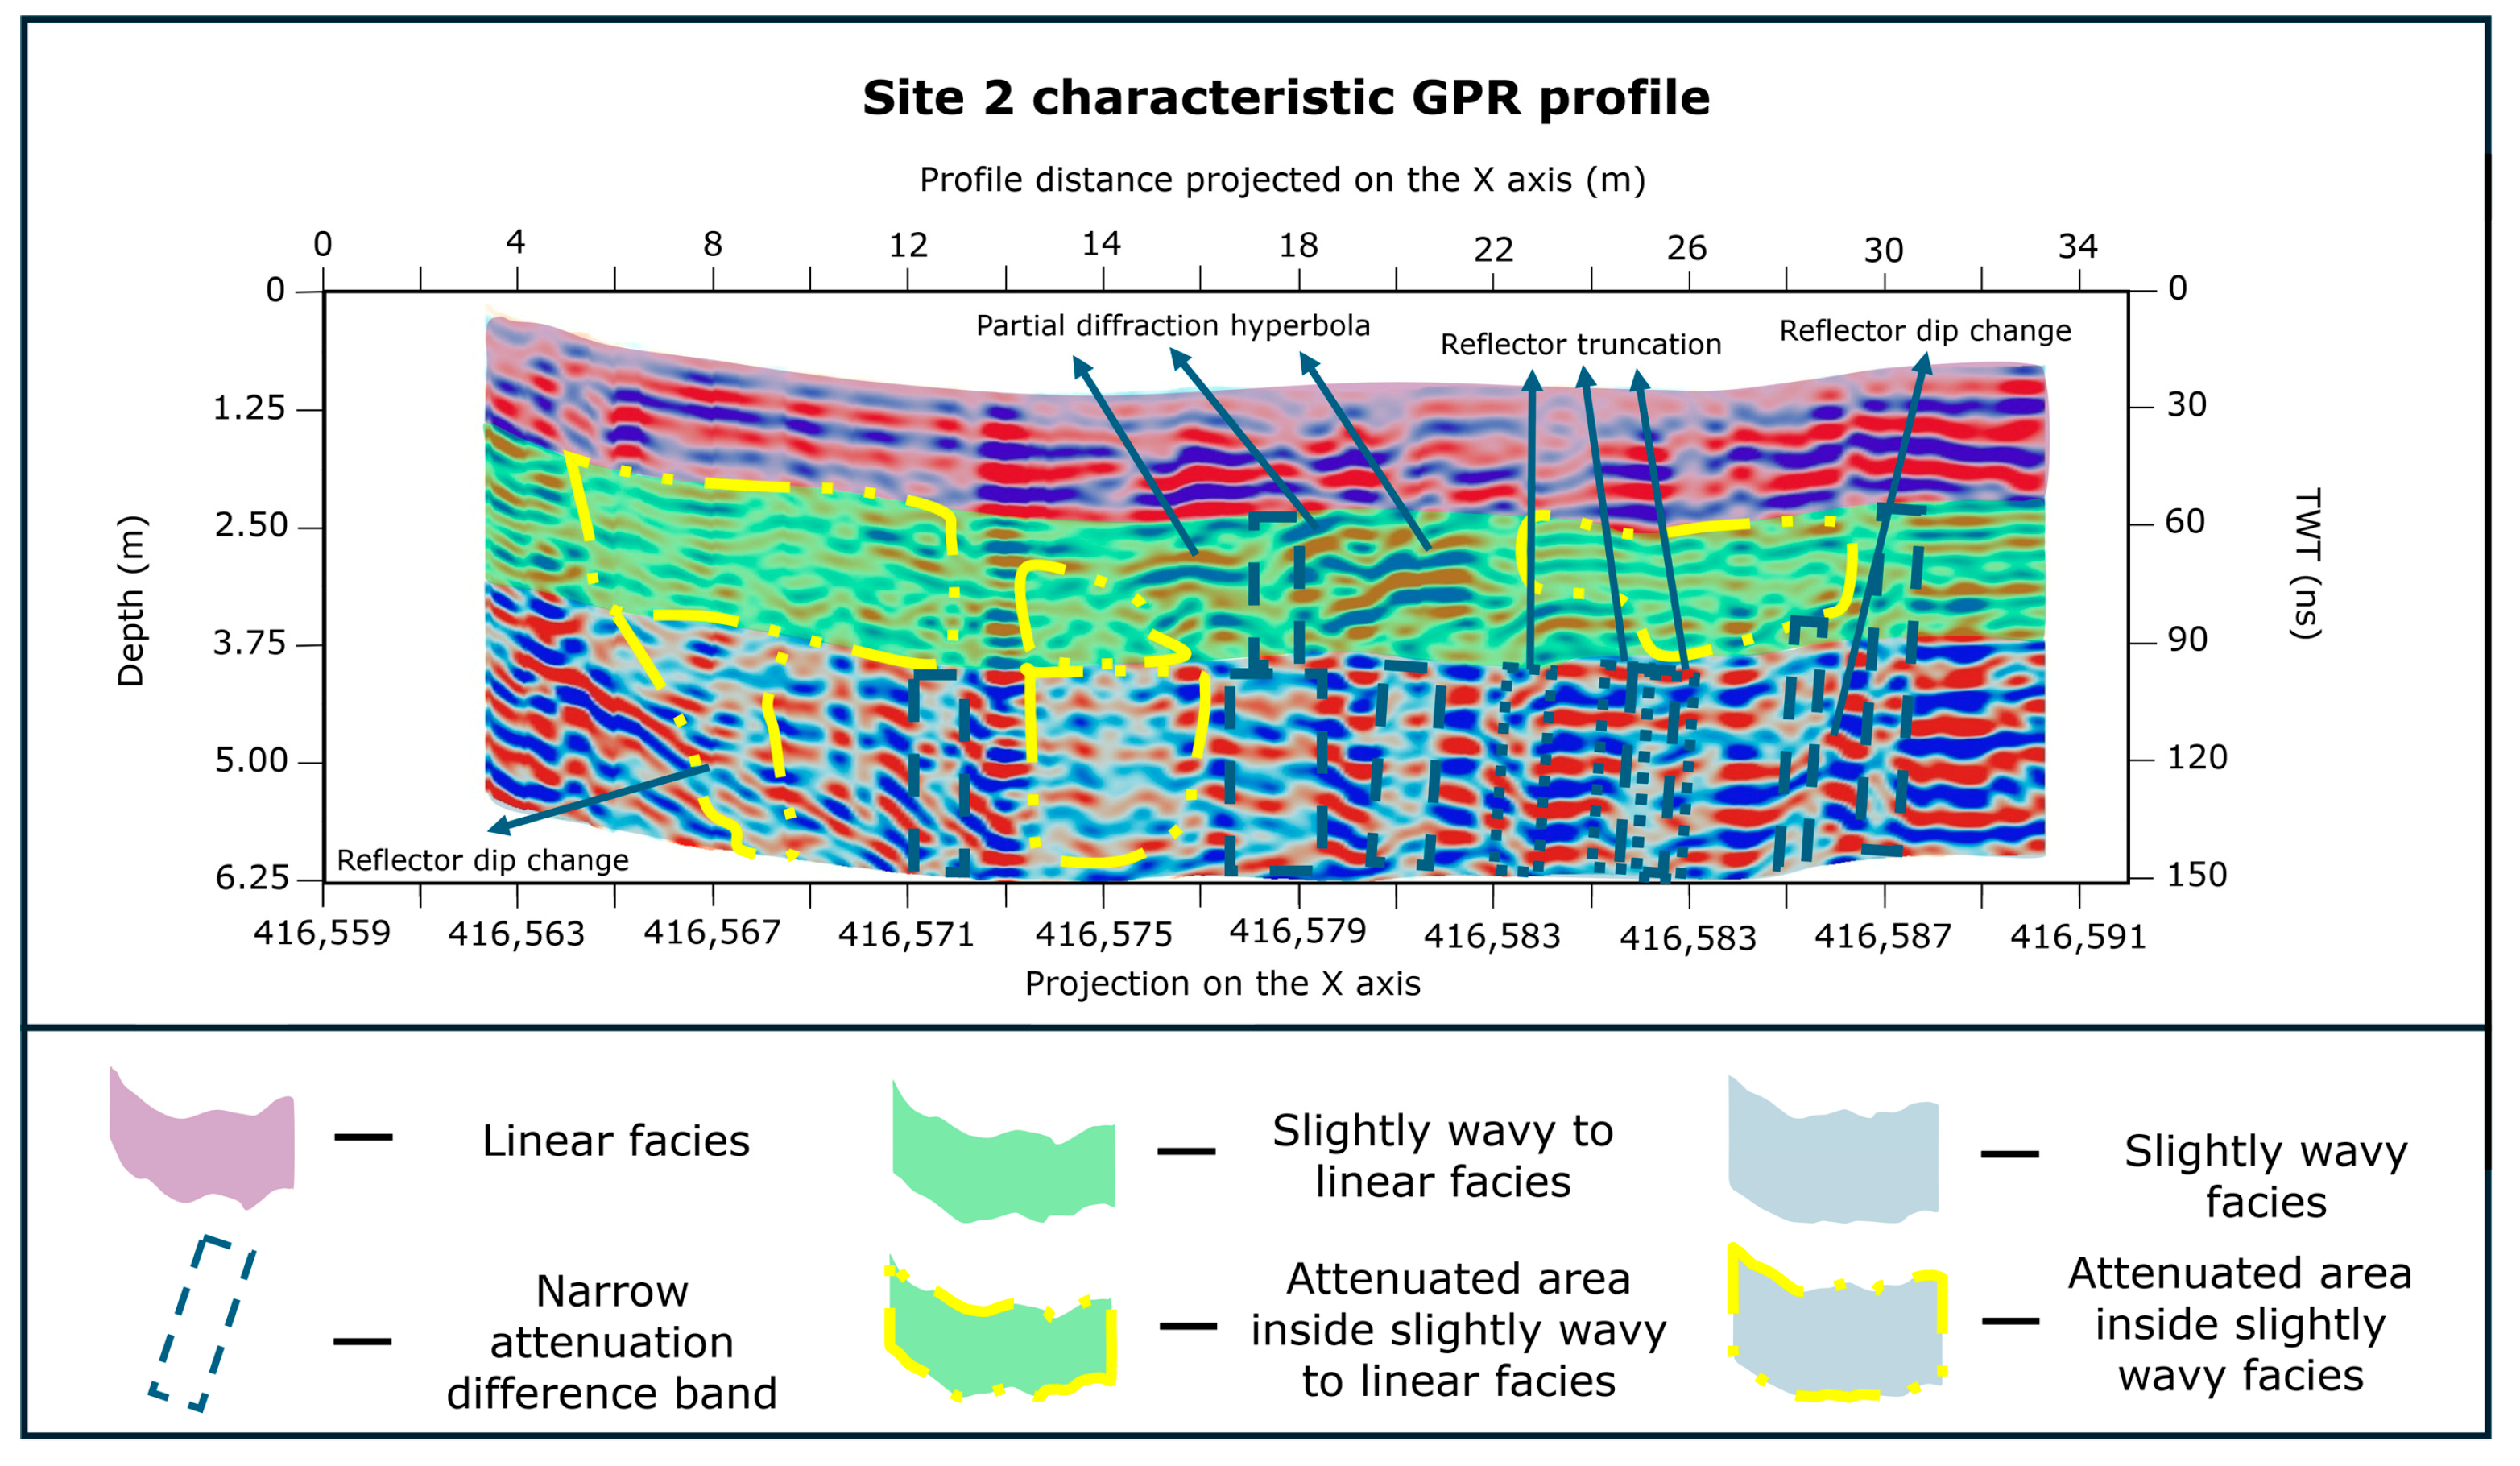
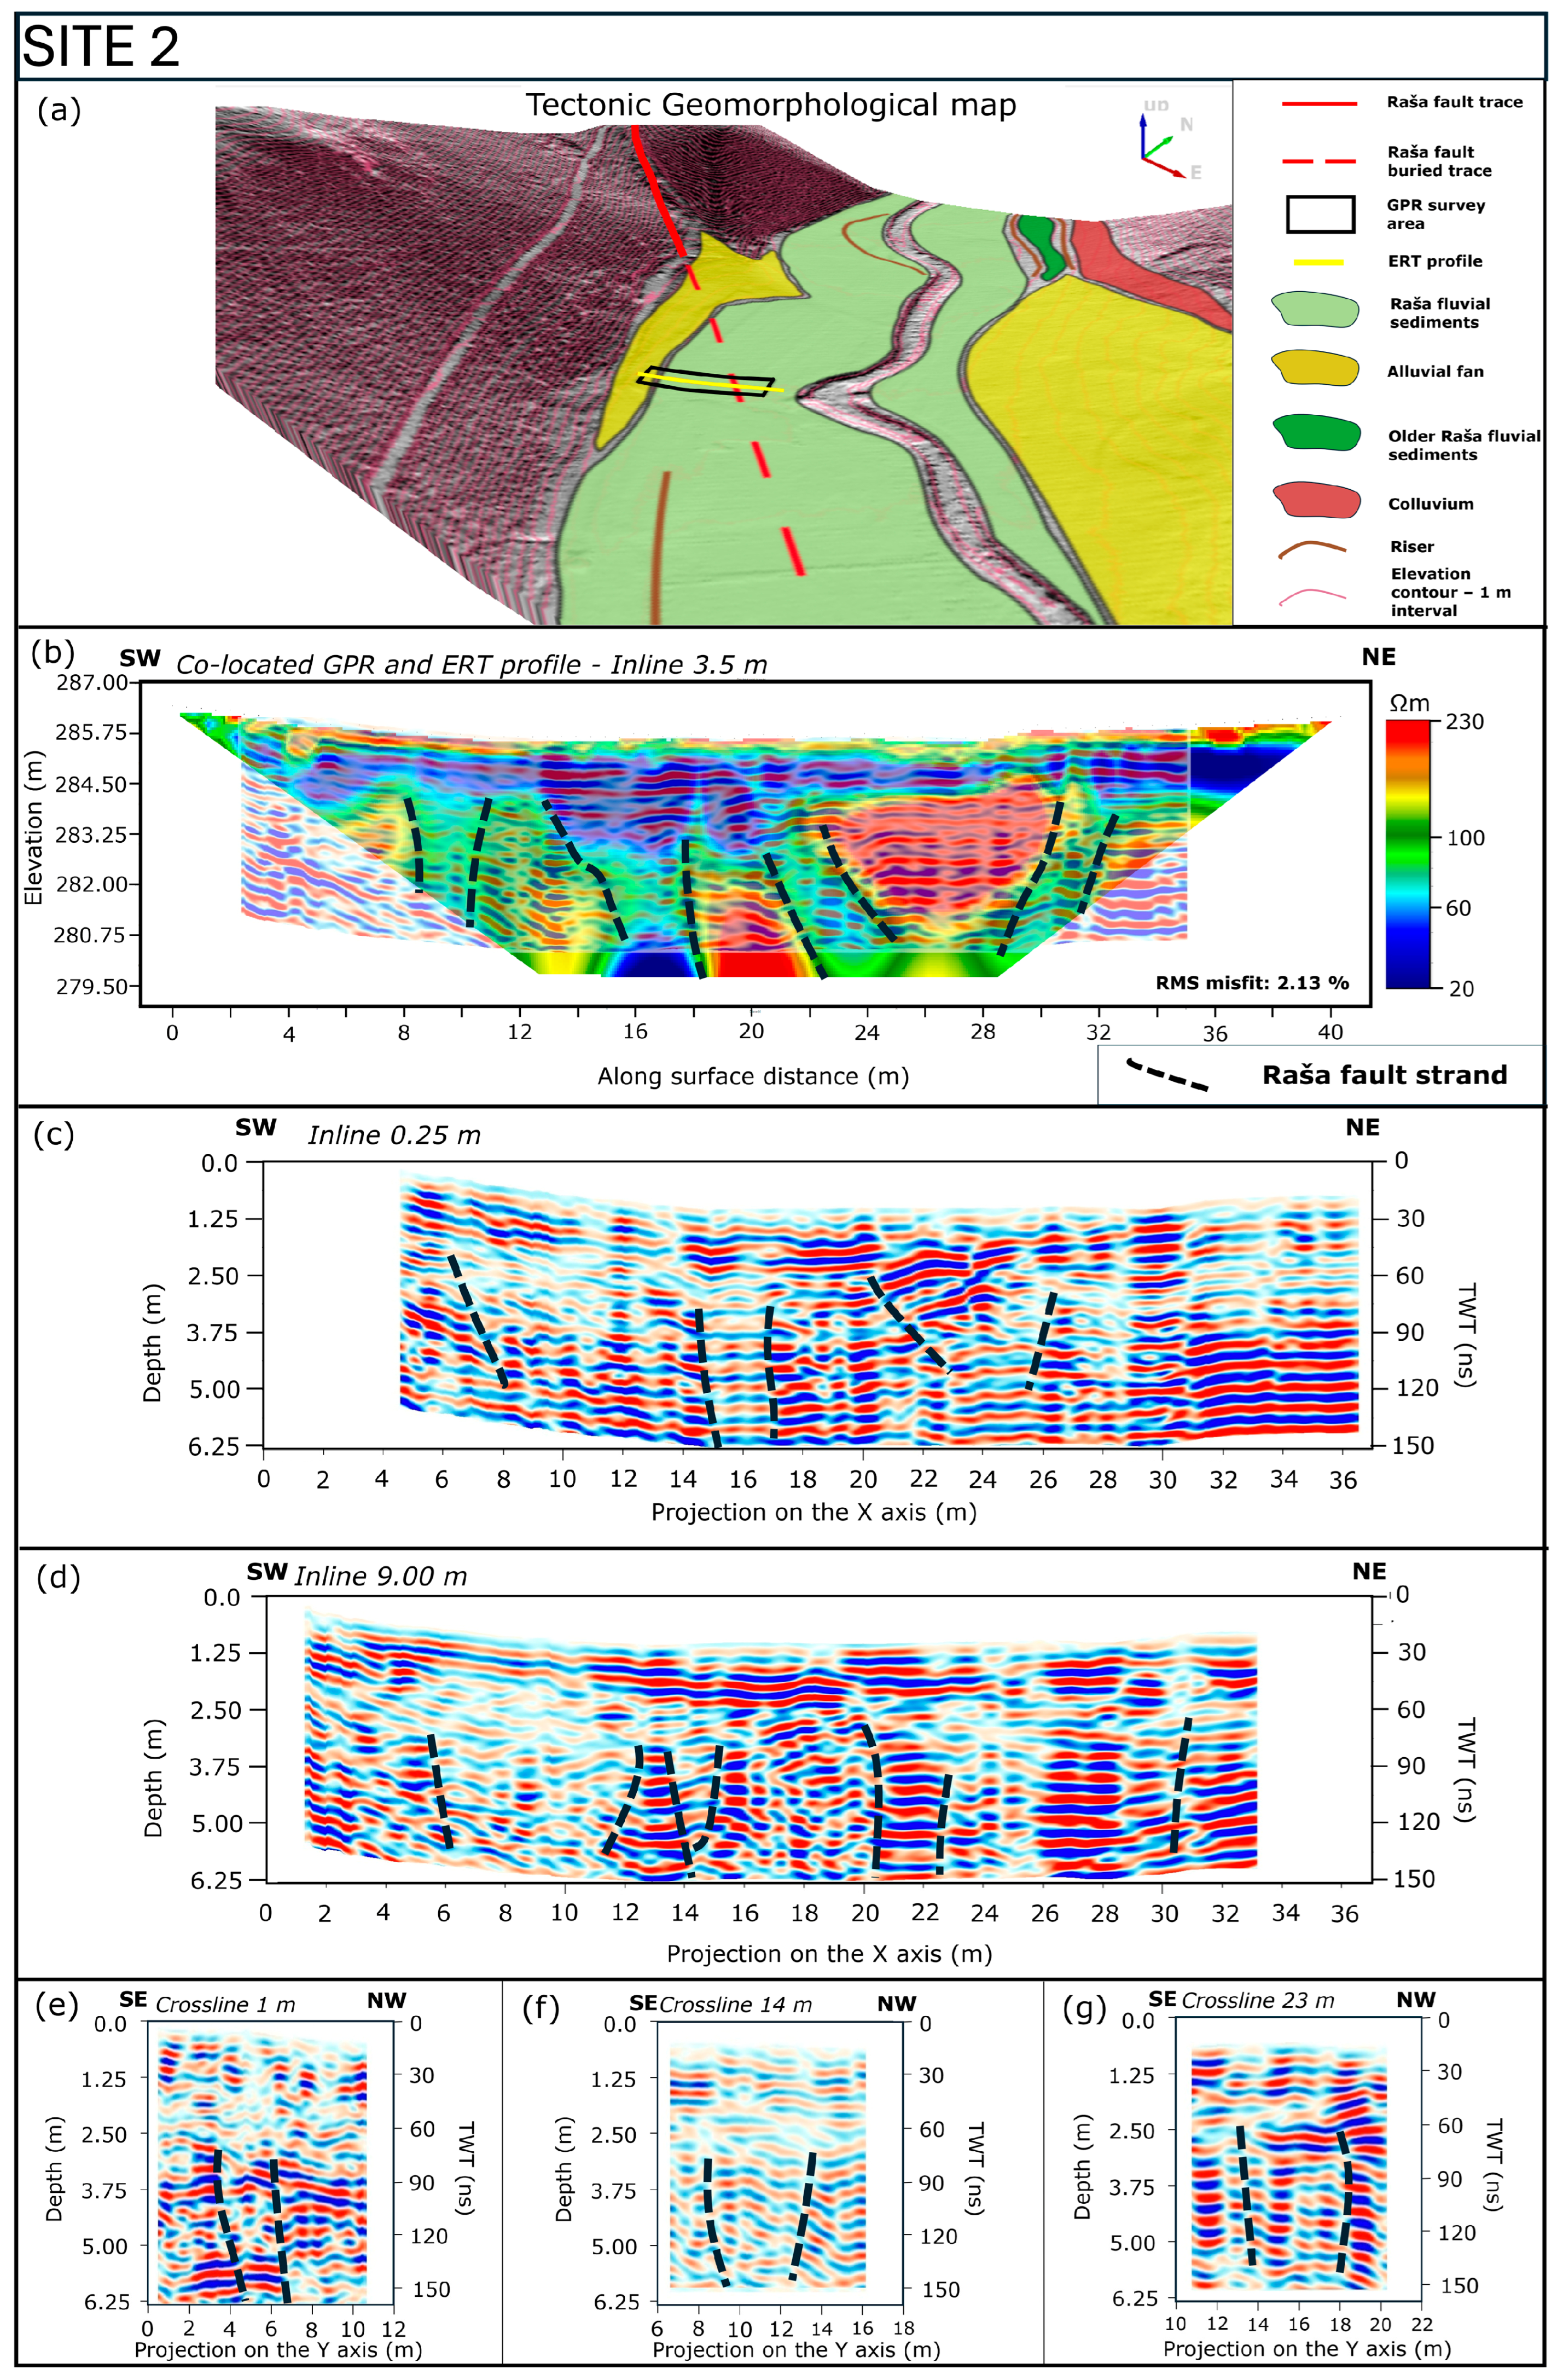
A reliable constraint on the fault trace was obtained by mapping a lineament on the adjacent hillslope. Based on this clear feature, we positioned the profile line SW of the Raša Creek, which is the primary source of sediments in this area. A visual assessment of the inline data projected onto the X (Easting) axis generally reveals varying degrees of attenuation of subparallel to slightly wavy reflectors (Figure 8). Consequently, the Raša alluvial sediments are expected to dominate the sequence, with only a minor contribution of alluvial fan sediments and colluvium from the slopes in the far south-western section of the profile. To minimize the influence of these slope deposits, the profiles were terminated on the grassland before reaching the slope (Figure 9a).
We can distinguish two distinct vertical transitions in the shape and amplitude of GPR reflectors. The first GPR facies is represented by rather subparallel reflectors, which show varying degrees of attenuation. Individual reflector truncations are present within this uppermost facies; most extend subvertically to vertically downwards from the surface, terminating at the GPR facies boundary. Consequently, they were attributed to minor variations in surface conditions (mainly surface roughness) rather than to a tectonic origin. This facies is succeeded by a more attenuated slightly wavy to linear facies in which diffraction hyperbolas and partial (incomplete) diffraction hyperbolas are visible in the first couple of southernmost inline profiles (Figure 8 and Figure 9b,c). Based on the correlation with ERT data (Figure 9b), this could indicate a downward motion of the inner fault block and the infill of fine-grained alluvium or a sharp transition in the level of bedrock deformation in this area. The lowermost GPR facies is characterized by variably attenuated, slightly wavy, moderately continuous reflectors with occurrences of reflector concavity. Lateral transitions of reflector amplitude strength, changes in reflector dip, reflector truncations and partial diffraction hyperbolas in the lower two GPR facies could indicate the existence of several fault strands both in the bedrock and the overlying unconsolidated sediments.
There is an observable spatial variability of geophysical features that can be clearly identified on the inline GPR profiles and on the ERT profile (Figure 9b–d). This highlights the characteristics of dynamic sedimentary processes in a floodplain environment, making it challenging to recognize deformational features solely on the basis of individual 2-D GPR profiles.
The measured inline ERT profile showcases the existence of several lateral resistivity transitions at depth between resistivity units characterized by resistivities over 100 Ωm (Figure 9b). These narrow low-resistivity anomalies (below 100 Ωm) most likely correspond to a higher degree of tectonic deformation, resulting in crushed bedrock or fault related sediment infill. A high degree of signal attenuation, abrupt layer truncations and changes in reflector dip correspond to these areas. The uppermost layer (top 1 m), with higher resistivity values (over 100 Ωm), represents coarser alluvial sediments (gravel, silt, sand with lower clay content), while the lower-resistivity unit (resistivities from 30 to 60 Ωm) beneath represents fine-grained alluvial sediments (silt and clay).
Crossline profiles (Figure 9e–g) reveal a similar pattern to that observed in the inline profiles with two zones of higher-amplitude reflectors separated by an intervening zone of higher attenuation. The westernmost profiles (e.g., Figure 9e) are characterized by two prominent layers of higher-amplitude subparallel reflectors, most likely representing coarser colluvial deposits from the nearby hillslopes.
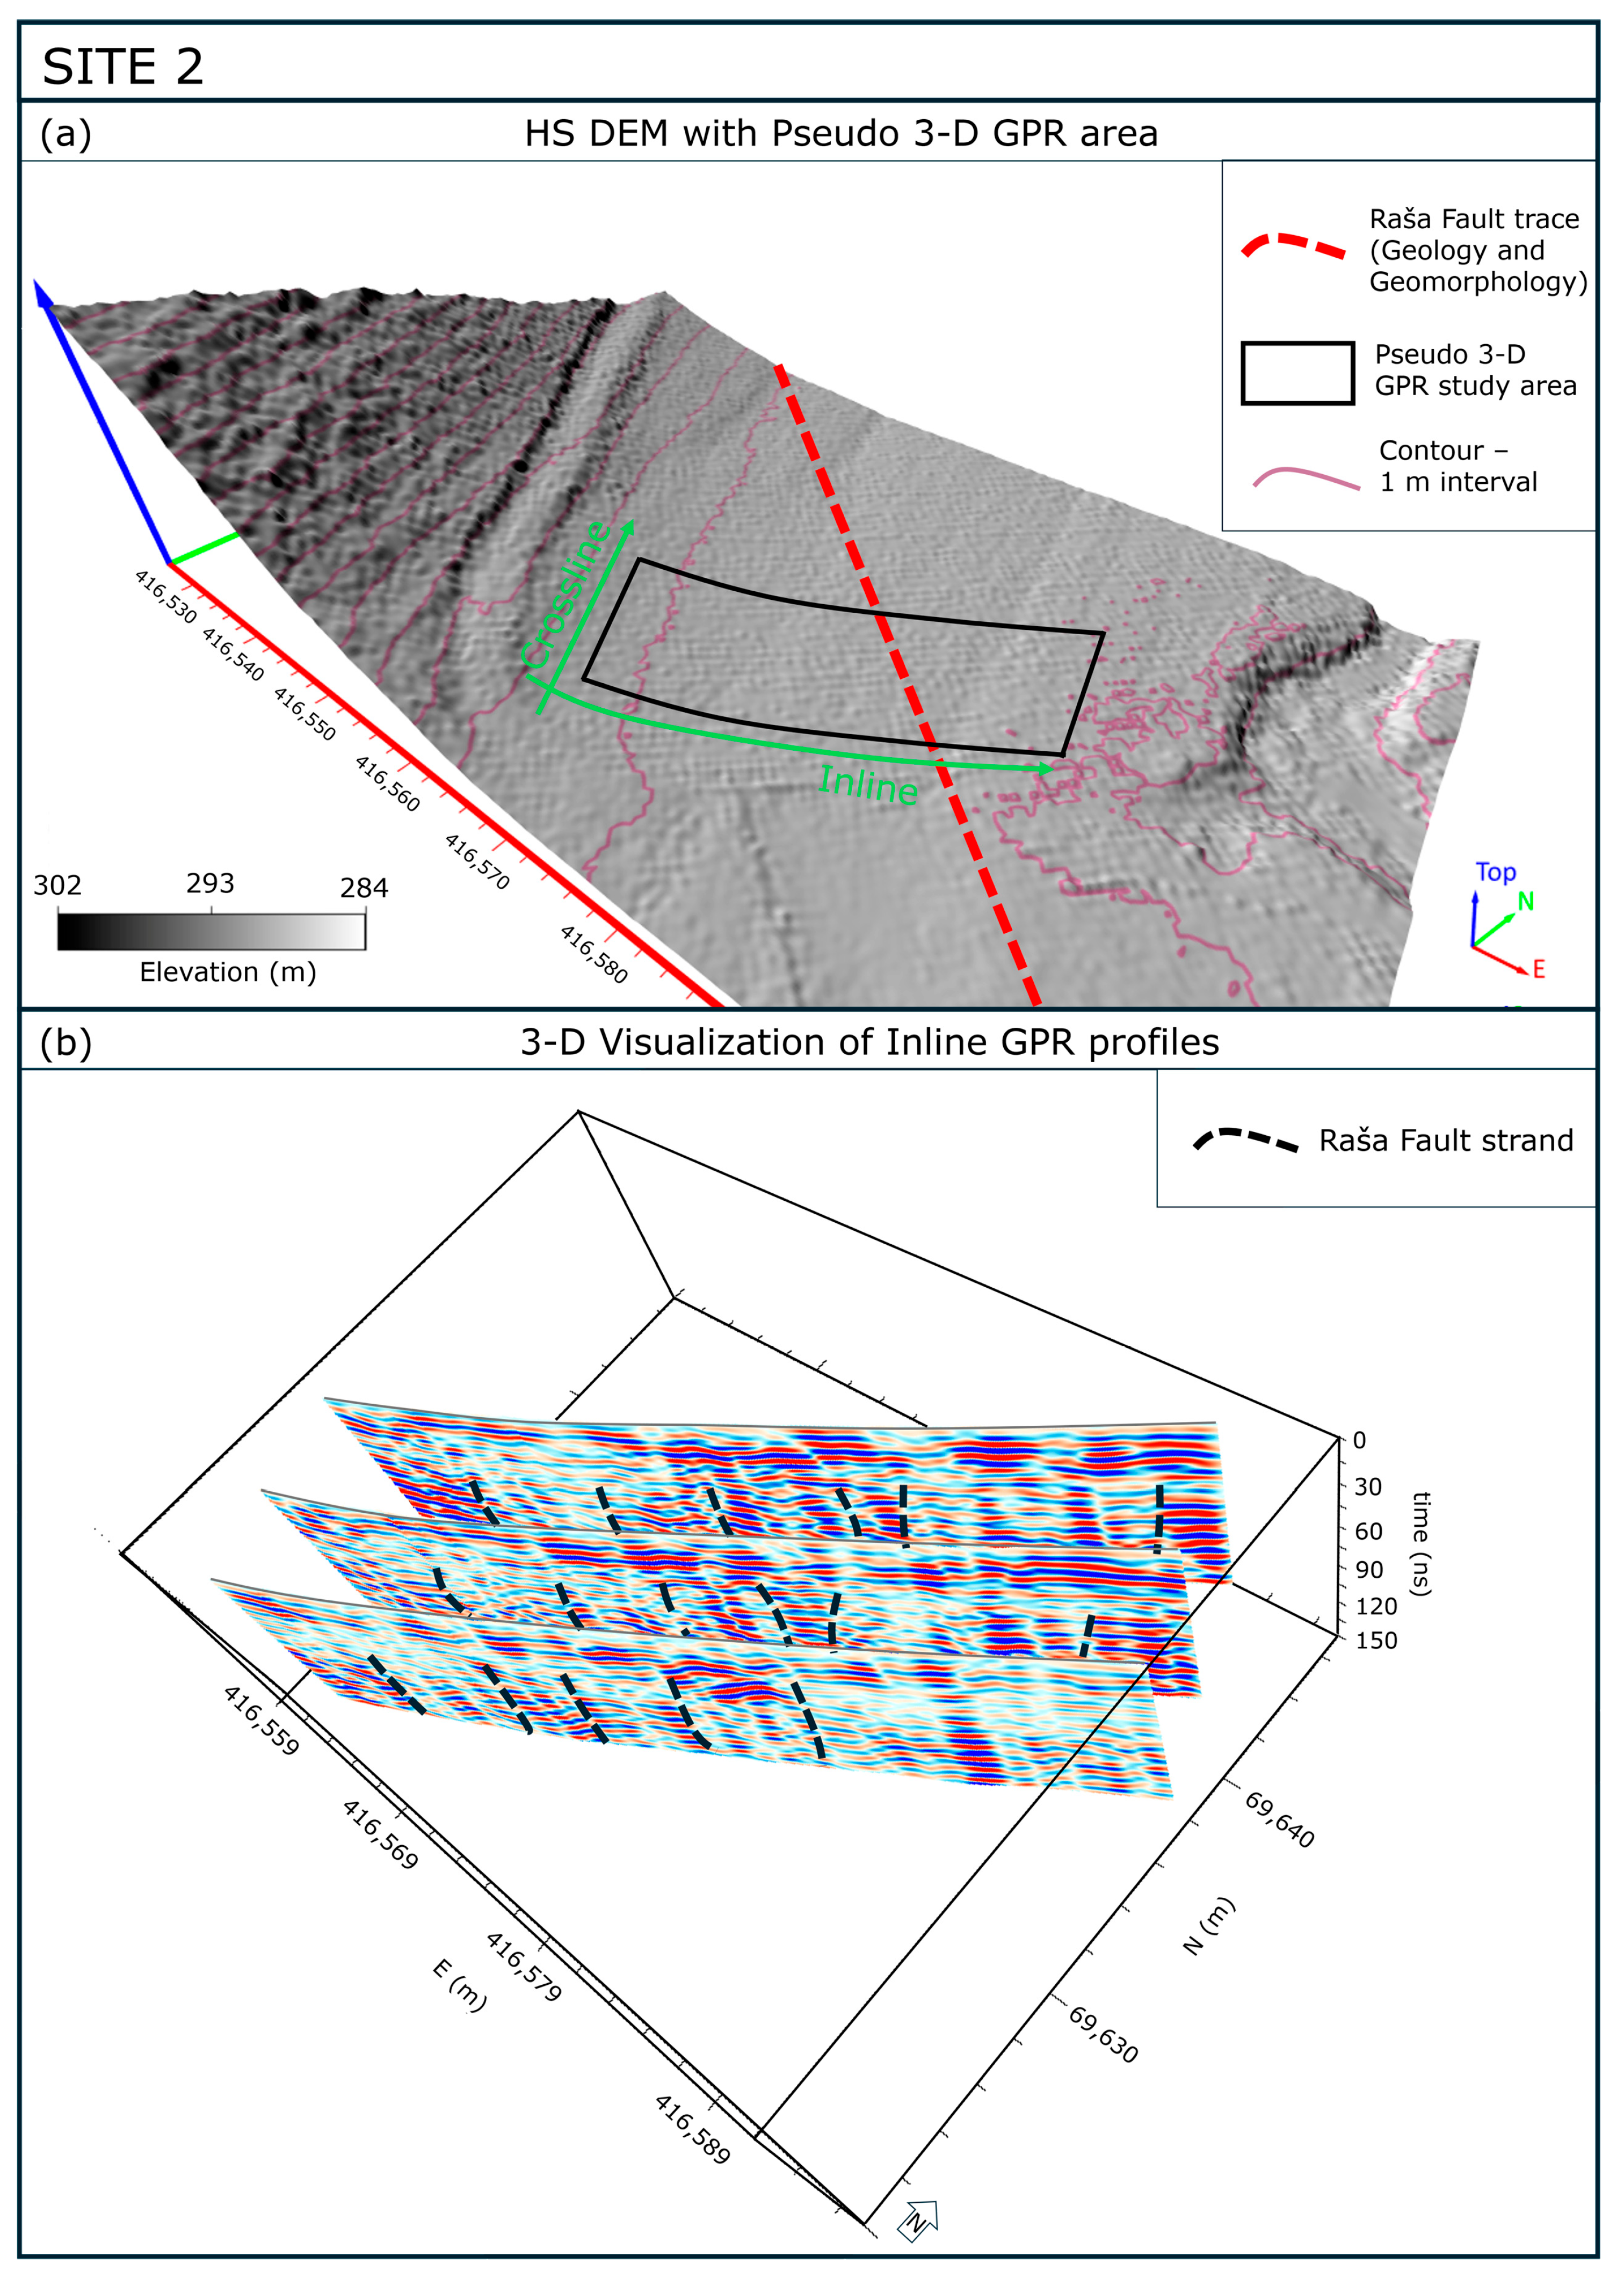
The lateral transition of individual 2-D profiles (Figure 10b) from west to east reveals several areas of higher-amplitude reflectors and zones of high attenuation; however, no definitive conclusion regarding the cause of these transitions (whether sedimentary or tectonic) can be drawn solely from individual 2-D profiles.
Comparing the GPR and ERT results at Site 2 with Site 1 reveals that the deformation at Site 2 is more diffuse, with several fault strands spread across a larger area and no clear inner fault zone, as was the case at Site 1.
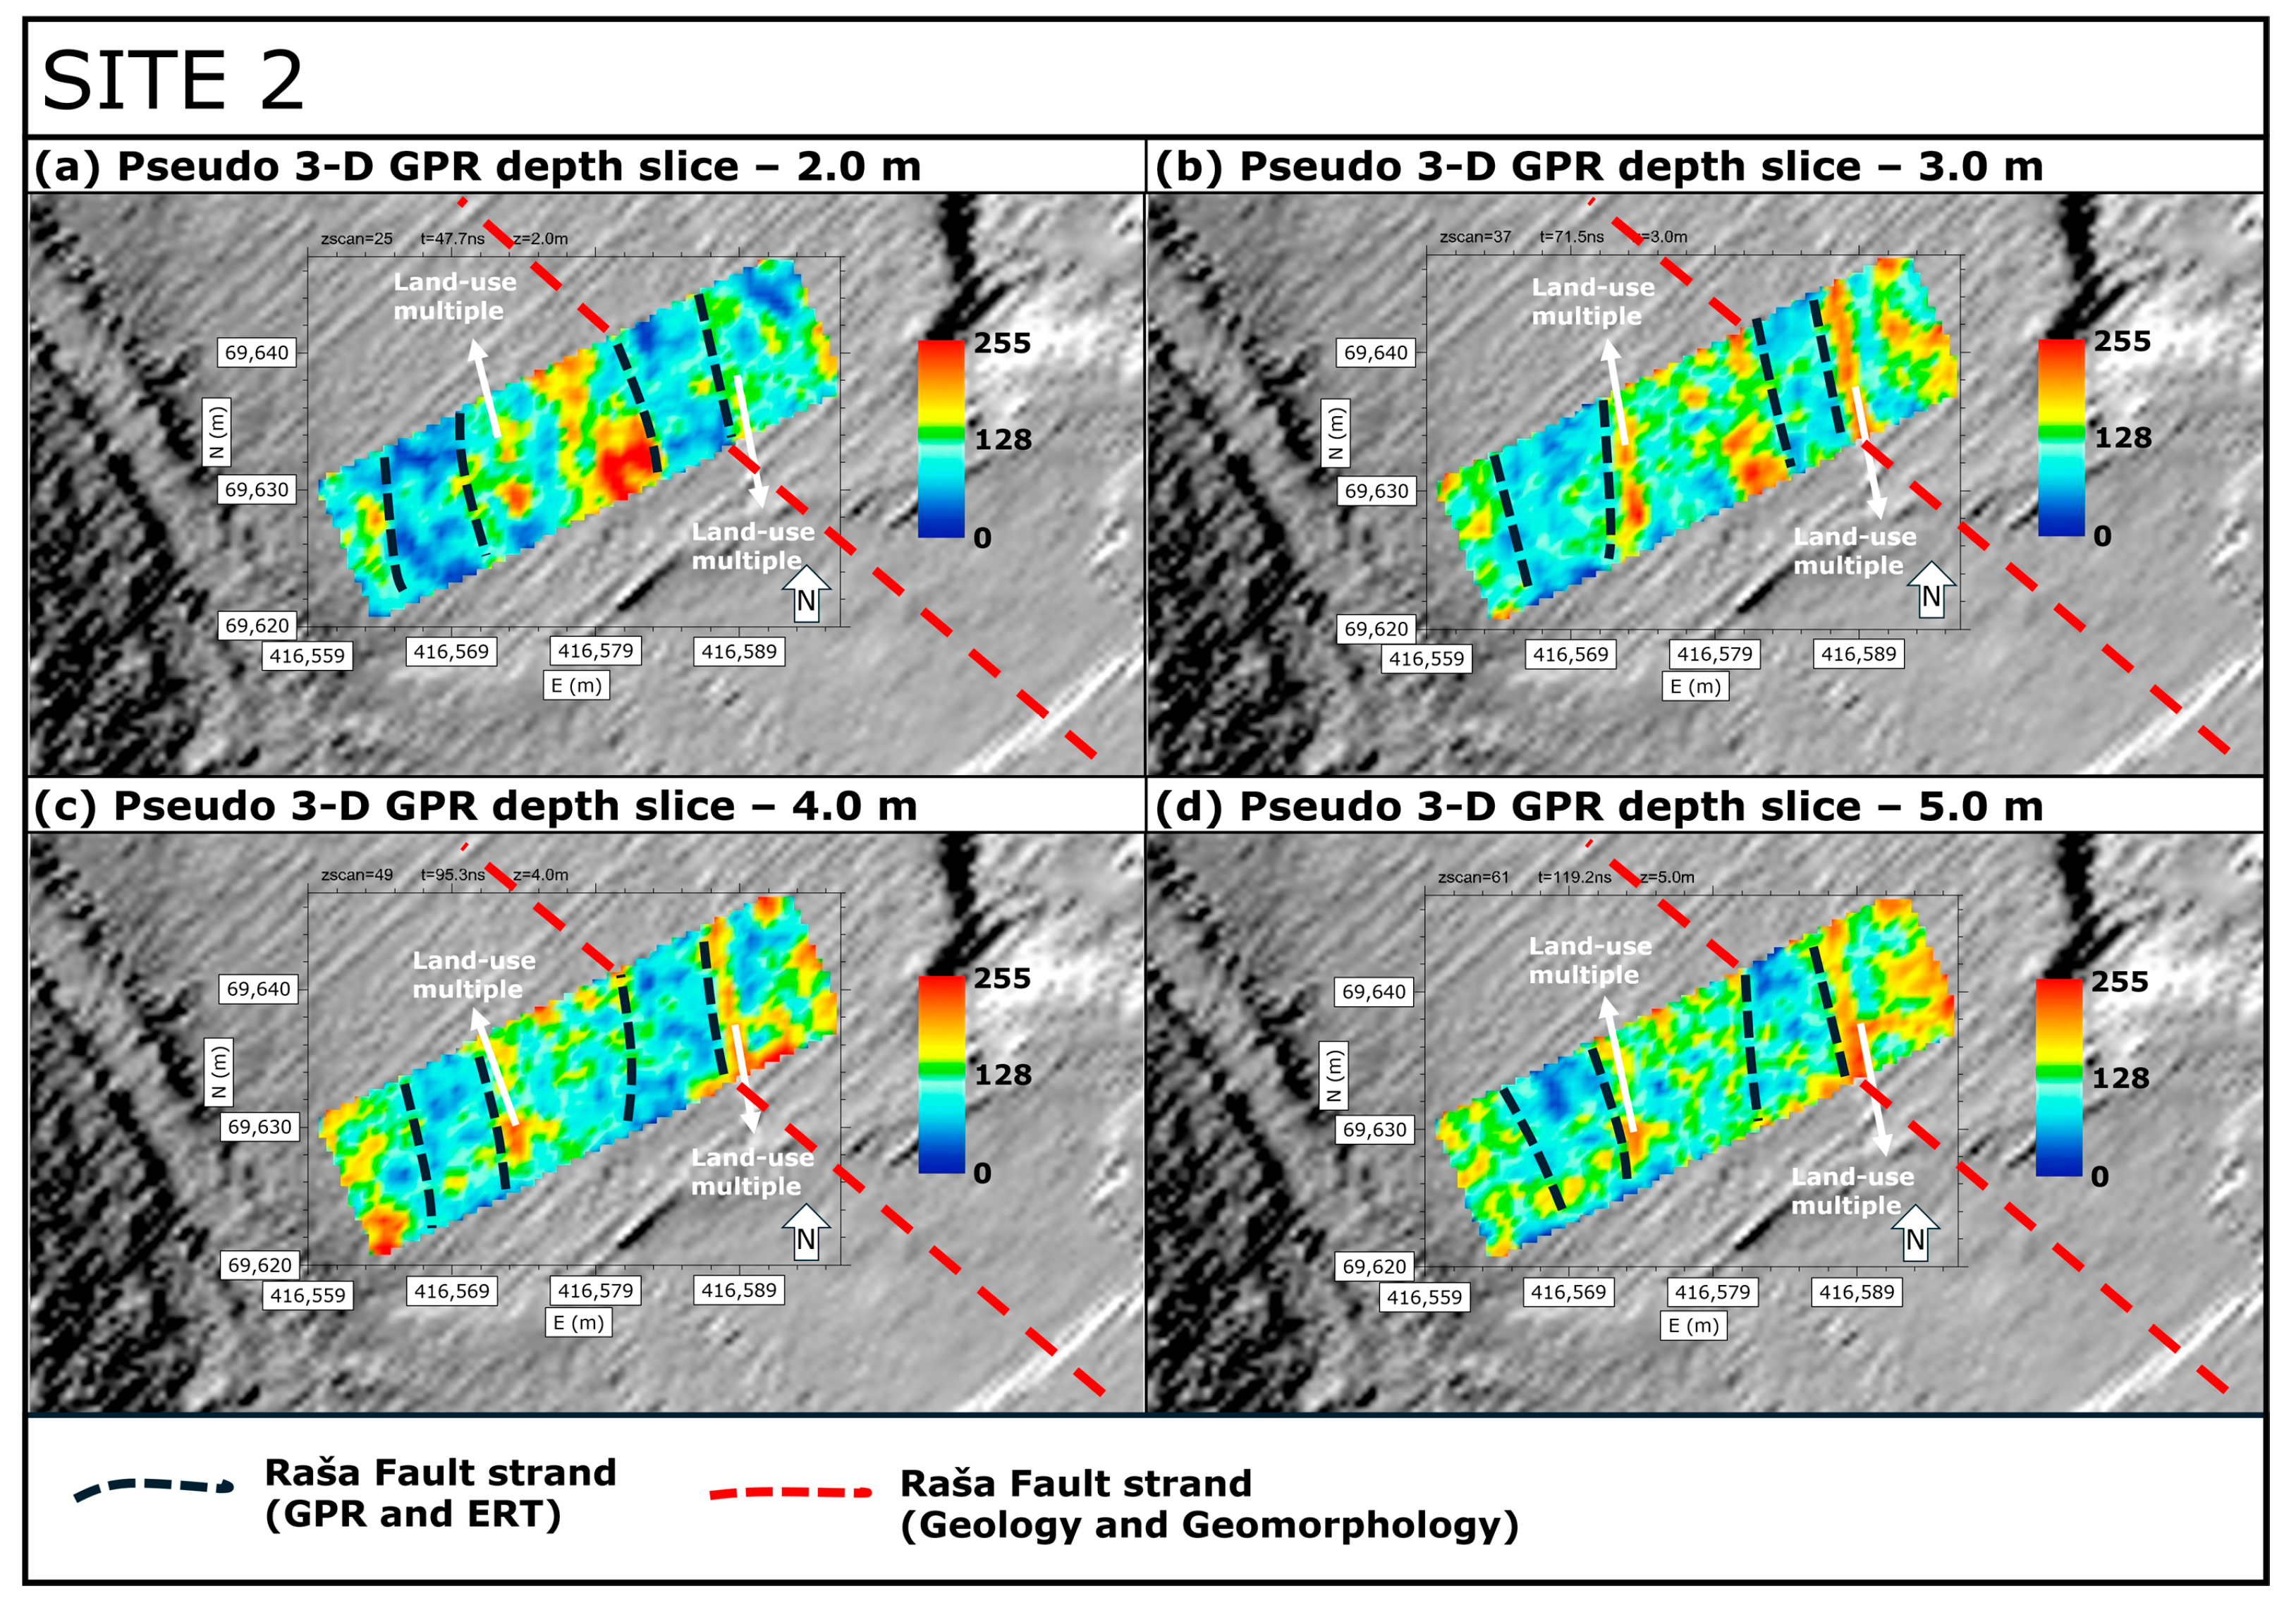
Pseudo 3-D GPR depth slices are shown at four different depths (2–5 m) in Figure 11a–d. Two prominent high-amplitude areas persist throughout the selected depth range (2–5 m), which coincide with the crossing of two distinct furrows related to agricultural activity (visible on the high-resolution hillshaded DEM) that have caused ringing artifacts in the GPR data. Two lower-amplitude areas are visible on all depth slices (Figure 11a–d). Since these areas do not correlate to any visible lineaments, nor were there any surface condition changes, they represent a potential zone for the subsurface expression of RF strands. The orientation of the fault strands (350°) obtained from the depth slices in the Quaternary fluvial sediments differs slightly from the orientation of the tectonic lineament associated with the RF in the nearby hillslopes (~315°). This could indicate secondary faulting within the RF zone (Riedel faults).
A synthesis of results obtained at Site 2 reveals a good agreement between the proposed RF strands (including their upward continuation towards the surface interpreted on the ERT profile) and the areas of low signal amplitude on the selected depth slices from the pseudo 3-D GPR data.

4.3. Site 3—Alluvial Fan

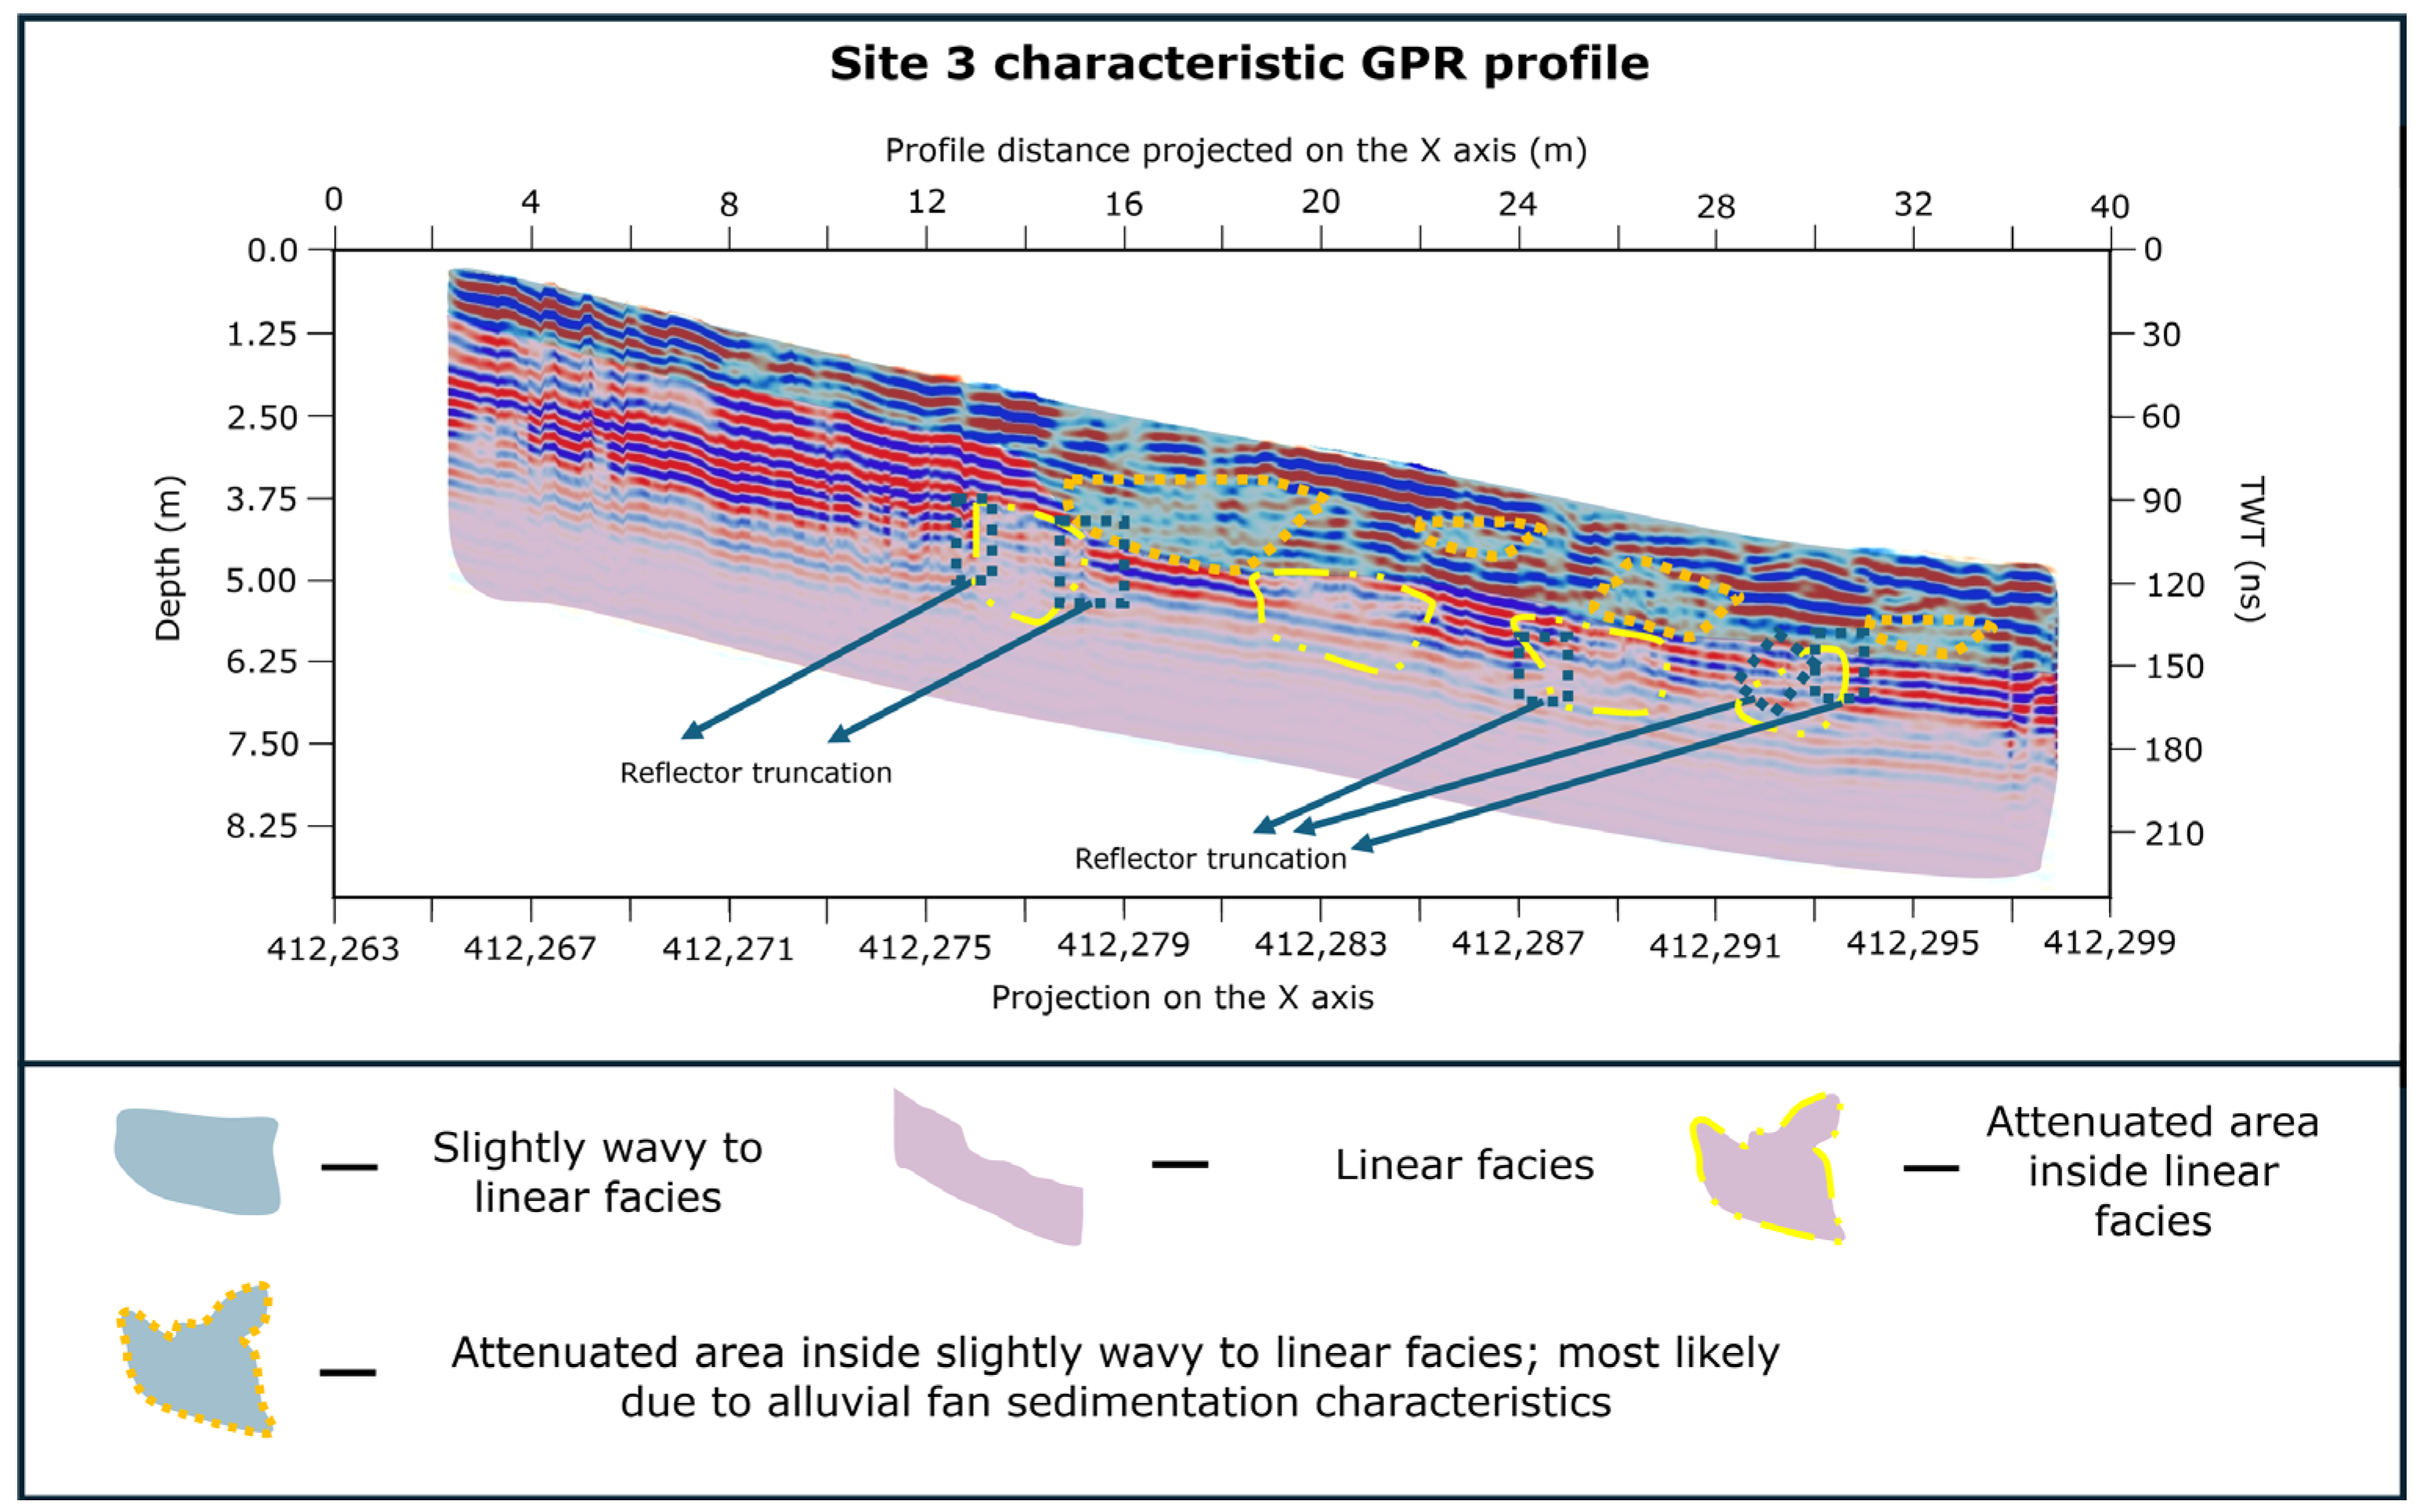
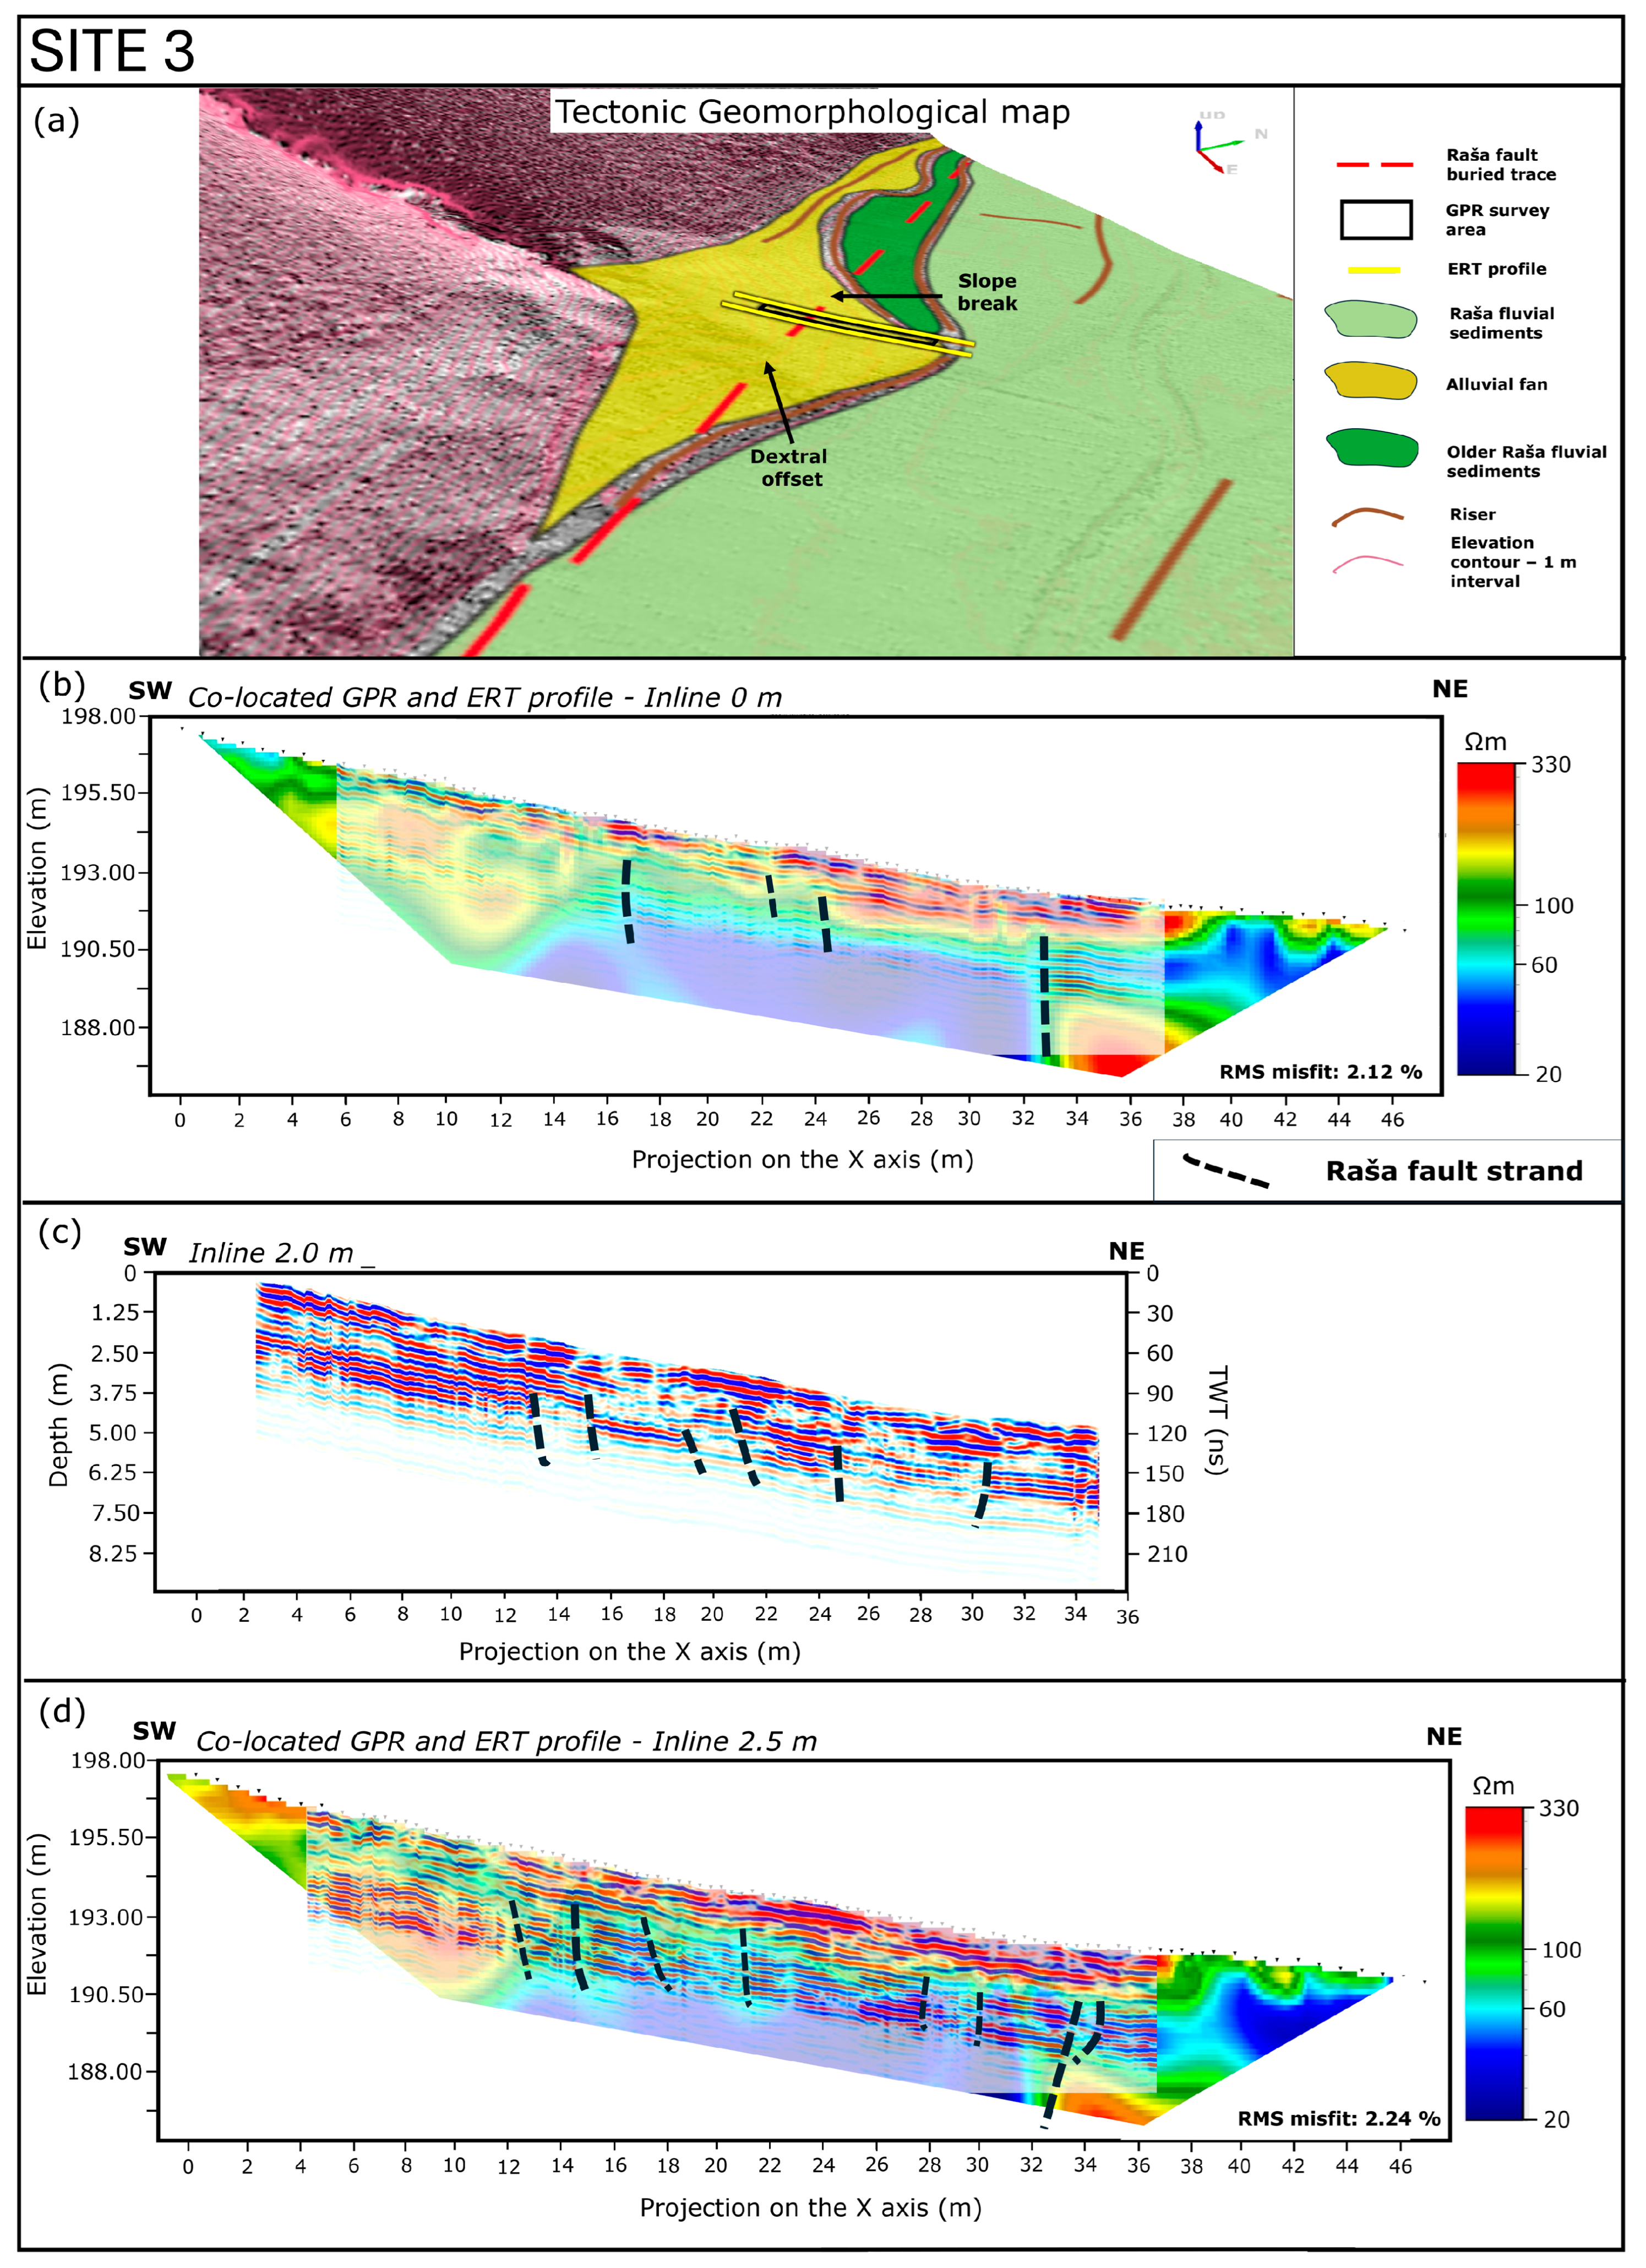
The ERT and GPR profiles were positioned across the tributary fan to capture any near-surface deformation. Figure 12 displays a selected GPR profile from this area, which exhibits geophysical features consistent across all profiles at this site that are crucial for fault strand recognition. Robust control over the buried fault trace beneath the Quaternary sediments was achieved due to a distinct saddle visible on the adjacent hillslope. Additionally, we identified geomorphological features indicating a possible slope break and a potential dextral offset of the alluvial fan (Figure 13a).
We can, in general, distinguish two different GPR facies. The upper GPR facies is represented by low- to medium-amplitude, moderately continuous, slightly wavy to subparallel reflectors that are locally truncated (Figure 12). Individual reflector truncations followed by areas of higher attenuation are present in this GPR facies, but are most likely the consequence of a highly dynamic alluvial fan sedimentation, as confirmed by the ERT profile (Figure 13b,d). This facies is succeeded by a more linear GPR facies with horizontal to subhorizontal reflectors (Figure 12).
Processed inline profiles (crosslines were omitted due to limited available space in the field) across the alluvial fan landform exhibit high variability of reflector characteristics (Figure 13b–d). This variability reflects a high-energy sedimentary environment with significant variability in sediment grain size.
Both the NW ERT (Figure 13b) and SE ERT (Figure 13d) profiles can be divided into three distinct resistivity units. The uppermost unit, characterized by resistivities over 70 Ωm, can be attributed to high-energy sedimentation related to the deposition of an alluvial fan (or several generations of alluvial fans). This unit shows the widest range of resistivities (70 Ωm to 340 Ωm), highlighting the variable grain size of transported and deposited sediments. Comparing this unit in both profiles reveals that, despite them being separated by only 3 m, they exhibit some variability of resistivity distribution, which can be attributed to lateral differences in the sedimentation across the alluvial fan. This corroborates the high variability of the geophysical features recognized on individual 2-D GPR profiles. Another resistivity unit with resistivities between 70 Ωm and 340 Ωm is present at the ends of both ERT profiles, characterized by a sharp lateral transition to a low-resistivity unit (resistivities below 60 Ωm). This sharp transition most likely represents one of the RF strands. Similar to Site 1, where faulting led to the formation of a small accumulation basin filled with colluvial deposits, a similar basin accommodating fine-grained fluvial sediments occurs at Site 3.
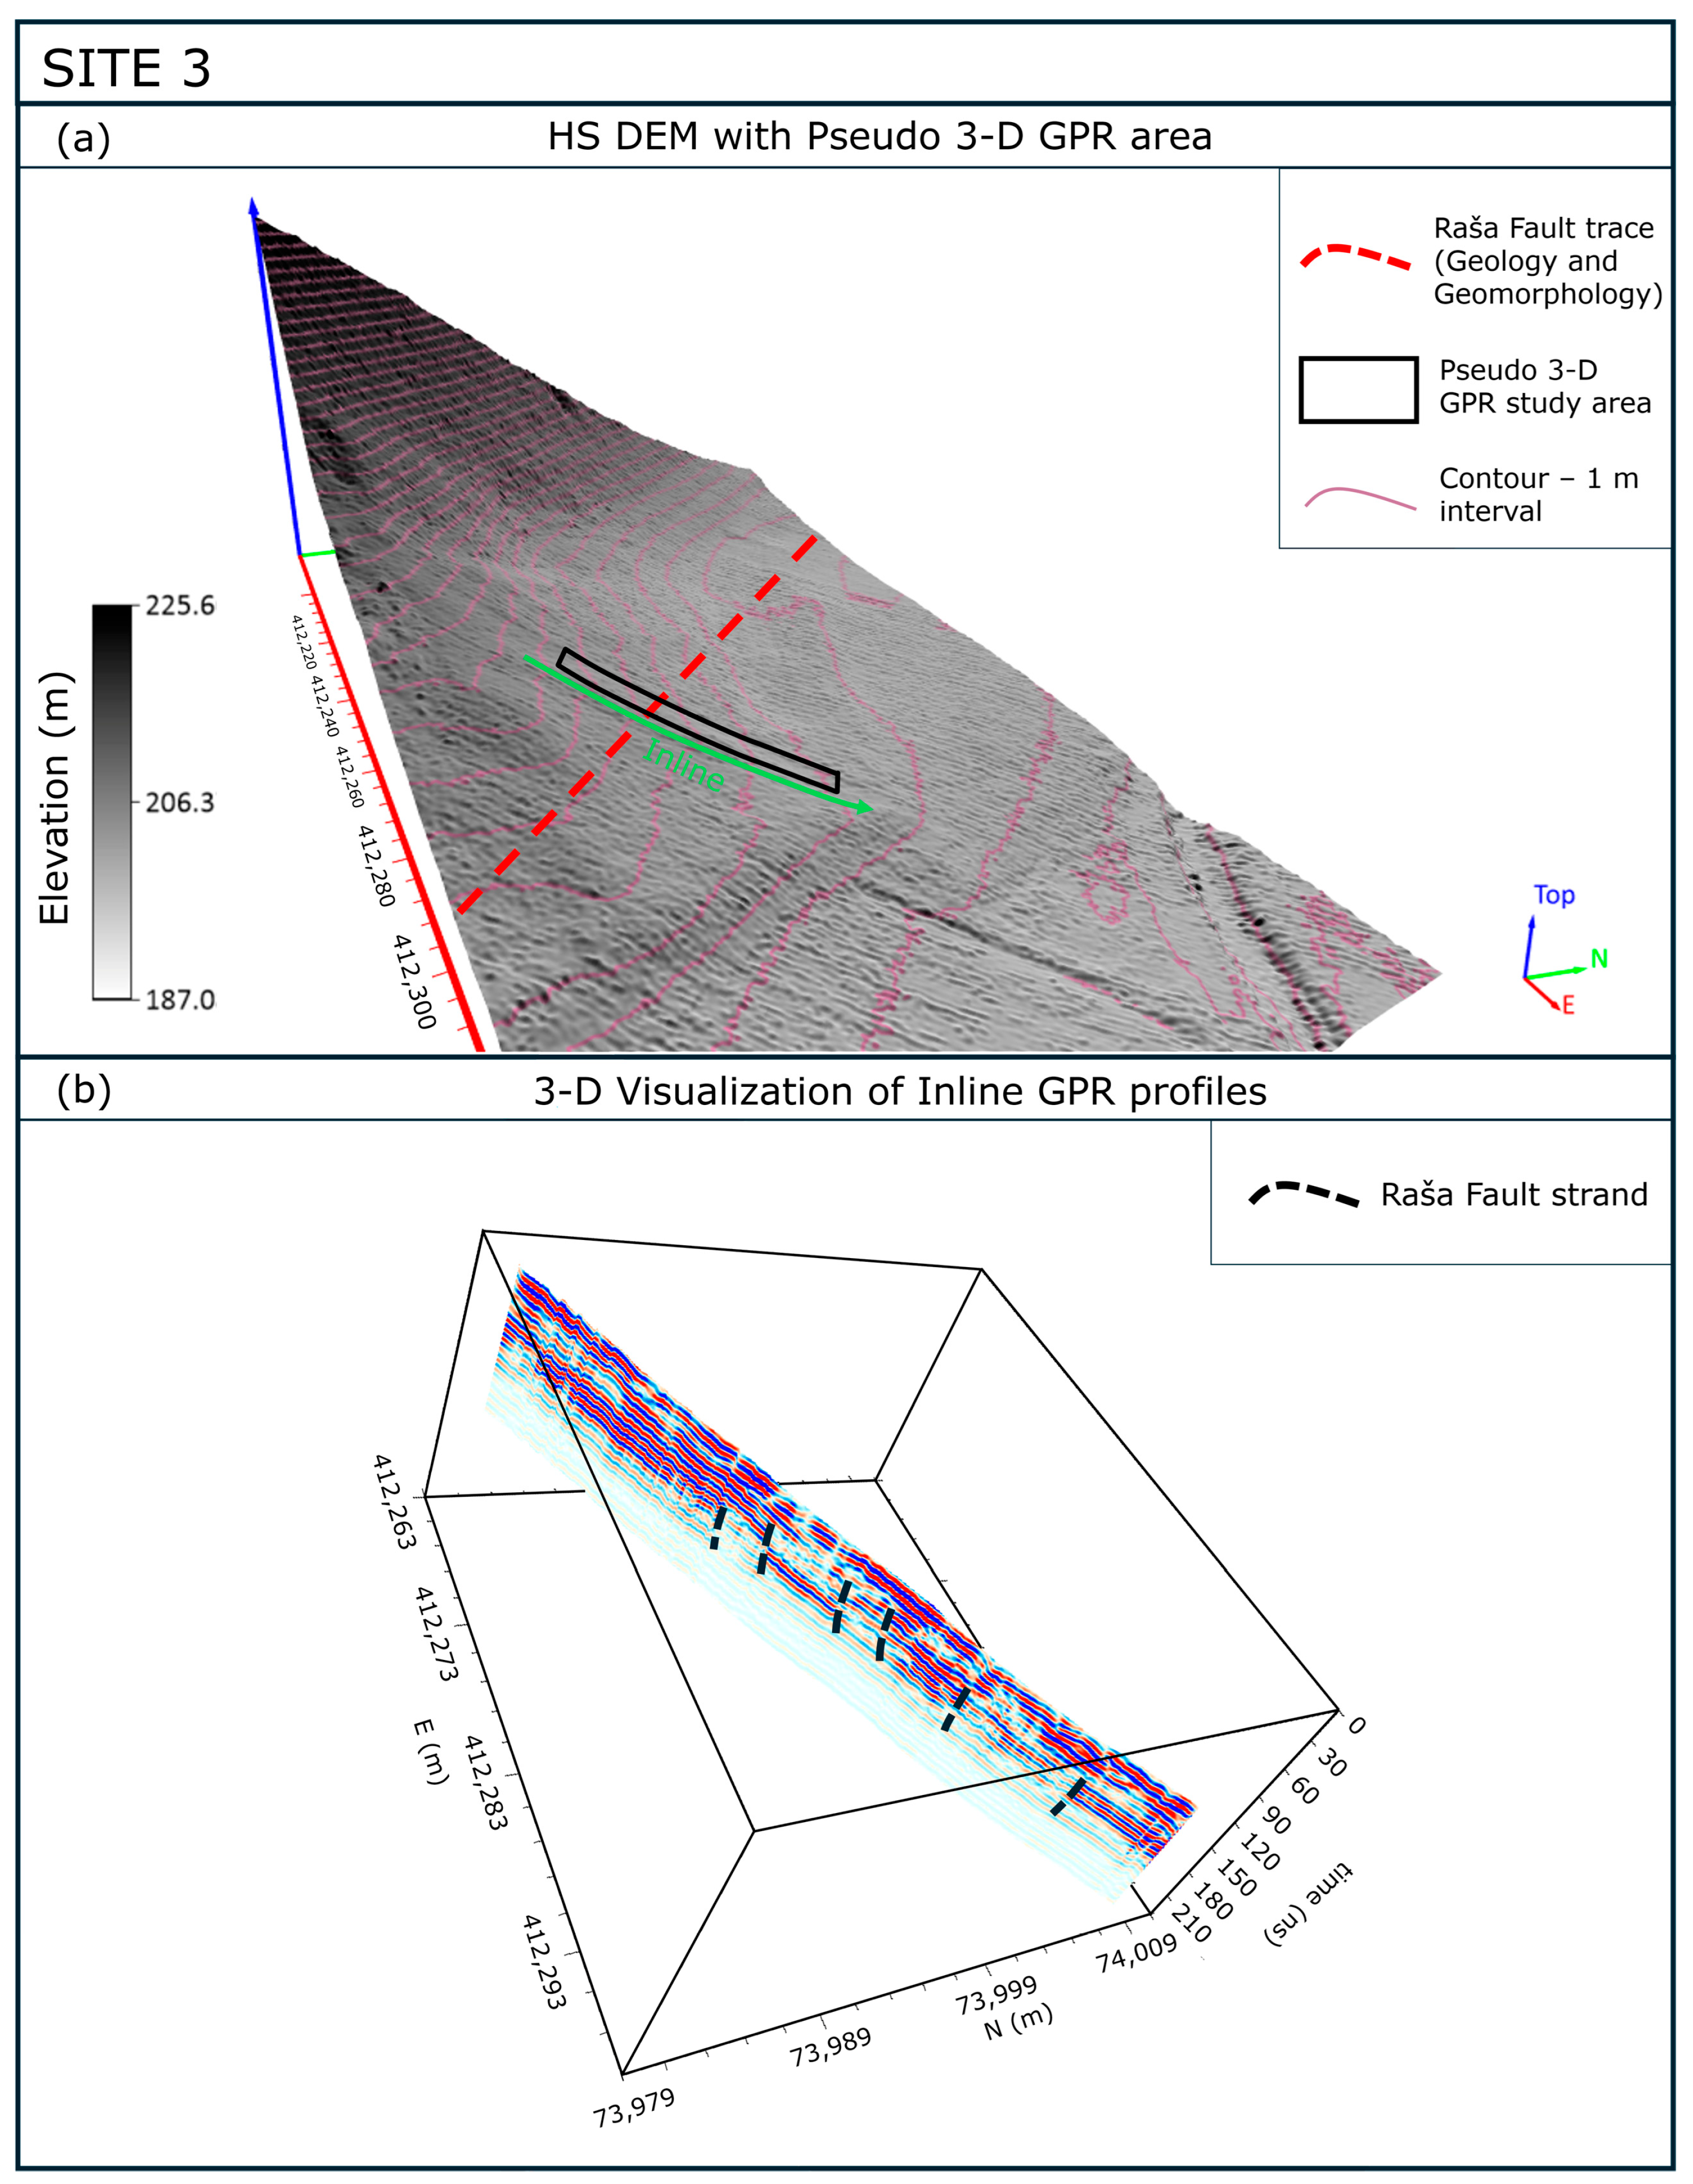
Due to spatial constraints, only the characteristic inline GPR profile is displayed in 3-D (Figure 14), showcasing several potential fault strands that align with the Raša Fault trace derived from tectonic geomorphological mapping.
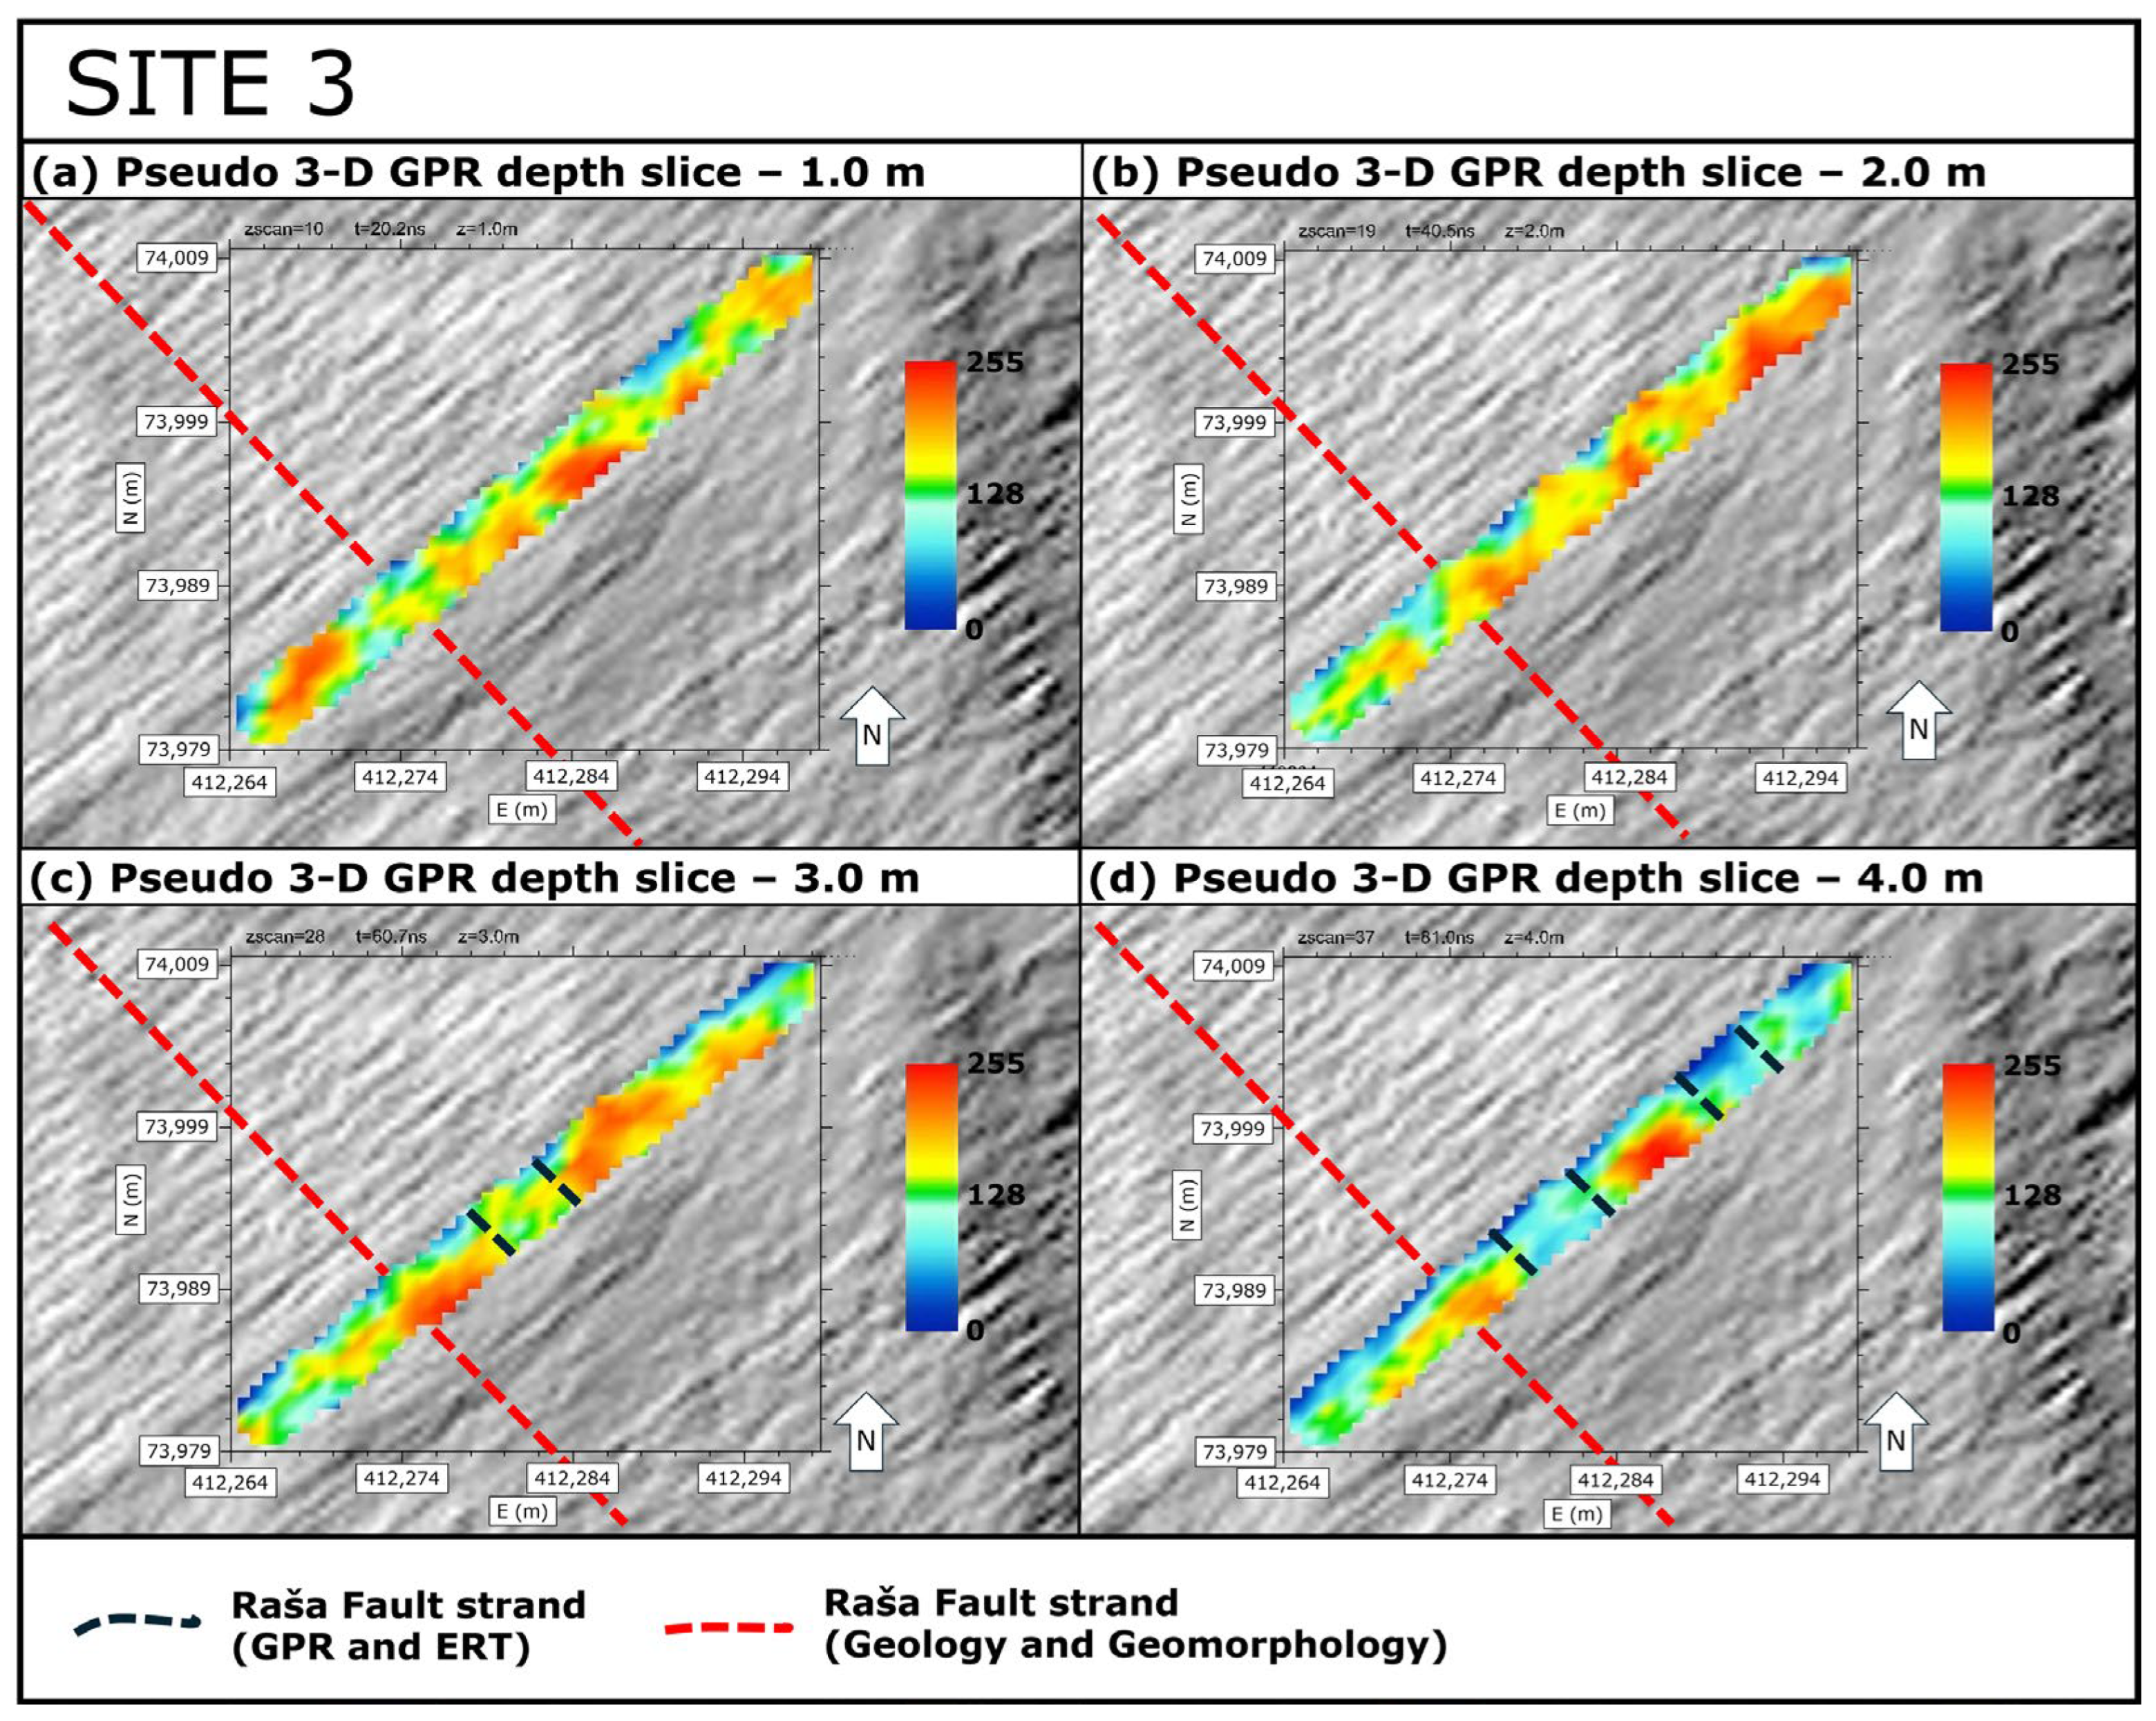
Due to the limited information provided by individual inline 2-D GPR profiles, depth-slice visualizations of the pseudo 3-D GPR data (Figure 15a–d) facilitated a deeper understanding of the subsurface and alluvial fan sedimentation. This allowed us to delineate the potential upward continuation of the RF inner zone into the uppermost 4 m, matching the deeper structure evident on the ERT profile.
Pseudo 3-D GPR depth slices are shown at four different depths (1–4 m) in Figure 15a–d. The amplitude strength distribution on the 1 m and 2 m depth slices is rather chaotic without a clear coherent pattern. This most likely reflects the interplay of finer- and coarser-grained sediments within the alluvial fan, as corroborated by the variations in electrical resistivity distribution within the upper 2 m (Figure 13b,d). However, at 3 m depth (Figure 15c), two distinct zones of higher amplitudes and an in-between zone of lower-amplitude reflections are clearly discernible. Additionally, the transition from high to low amplitudes of reflectors, which could indicate the RF zone, is also visible on the 4 m depth slice (Figure 15d). Both transitions could signify the presence of an RF strand at 3 m and 4 m depth. The orientation of the RF strands (310°) based on the GPR and ERT results coincides with the orientation of the RF identified through tectonic geomorphological mapping.
A synthesis of the results from Site 3 reveals a strong spatial agreement between the upward projection of the RF strand from the ERT data and the low-amplitude areas observed on the GPR depth slices.

5. Discussion

Based on the analysis of all the profiles, some final considerations can be summarized regarding the specific geophysical expressions of near-surface faulting. The most prominent geophysical features considered to be representative of the Raša fault (RF) zone are distinct lateral reflectivity discontinuities corresponding to the GPR facies changes (from chaotic or slightly wavy to attenuated), reflector truncations, and a strong attenuation zone (separating two areas with a large difference in reflectivity). These features were resolved across the entire GPR dataset, regardless of the depositional environment (Site 1—karstic sediments; Site 2—Raša creek flood plain and fluvial sedimentation; Site 3—tributary alluvial fan overlying Raša creek fluvial sediments). Clear diffraction hyperbolas and “partial” hyperbolas on unmigrated data were also present in all inline GPR profiles at Site 1, indicating a high level of fracturing in the carbonate bedrock and possible off-fault deformations. They were also present in the first few inline profiles at Site 2 and are most likely correlated with a fault related step in the bedrock, either due to the downward motion of the inner fault block and the subsequent infill of fine-grained alluvium, or due to a sharp transition in the level of bedrock deformation. Although the existence of diffraction hyperbolas related to active faulting has already been highlighted by various authors (e.g., refs. [6,40]), this is the first study to recognize them in an immediate vicinity of an active fault surface trace in Slovenia. Ground-wave arrival characteristics, which usually change near the fault location ([89]) and can be used as a rough indicator of faulting, were not consistently unambiguous in detecting the fault at any of the selected locations.
All observations agree with the ERT and DEM results, which lends further validation to the pseudo 3-D GPR data and provides additional geological constraint of the RF (Figure 16). The good correlation between GPR features associated with tectonic deformations (reflector truncations, reflector attenuation, GPR facies transitions and diffraction hyperbolas, reflector dip changes) and upward continuation of sharp lateral transitions between high- and low-resistivity units on ERT results (Figure 5b, Figure 9b and Figure 13b,d) combined with surface-based (DEM) observations (Figure 2) improves the interpretation accuracy of GPR results in complex environments. Ultimately, this approach potentially enables the extension of stratigraphic and tectonic information within a wider area in a non-invasive manner.
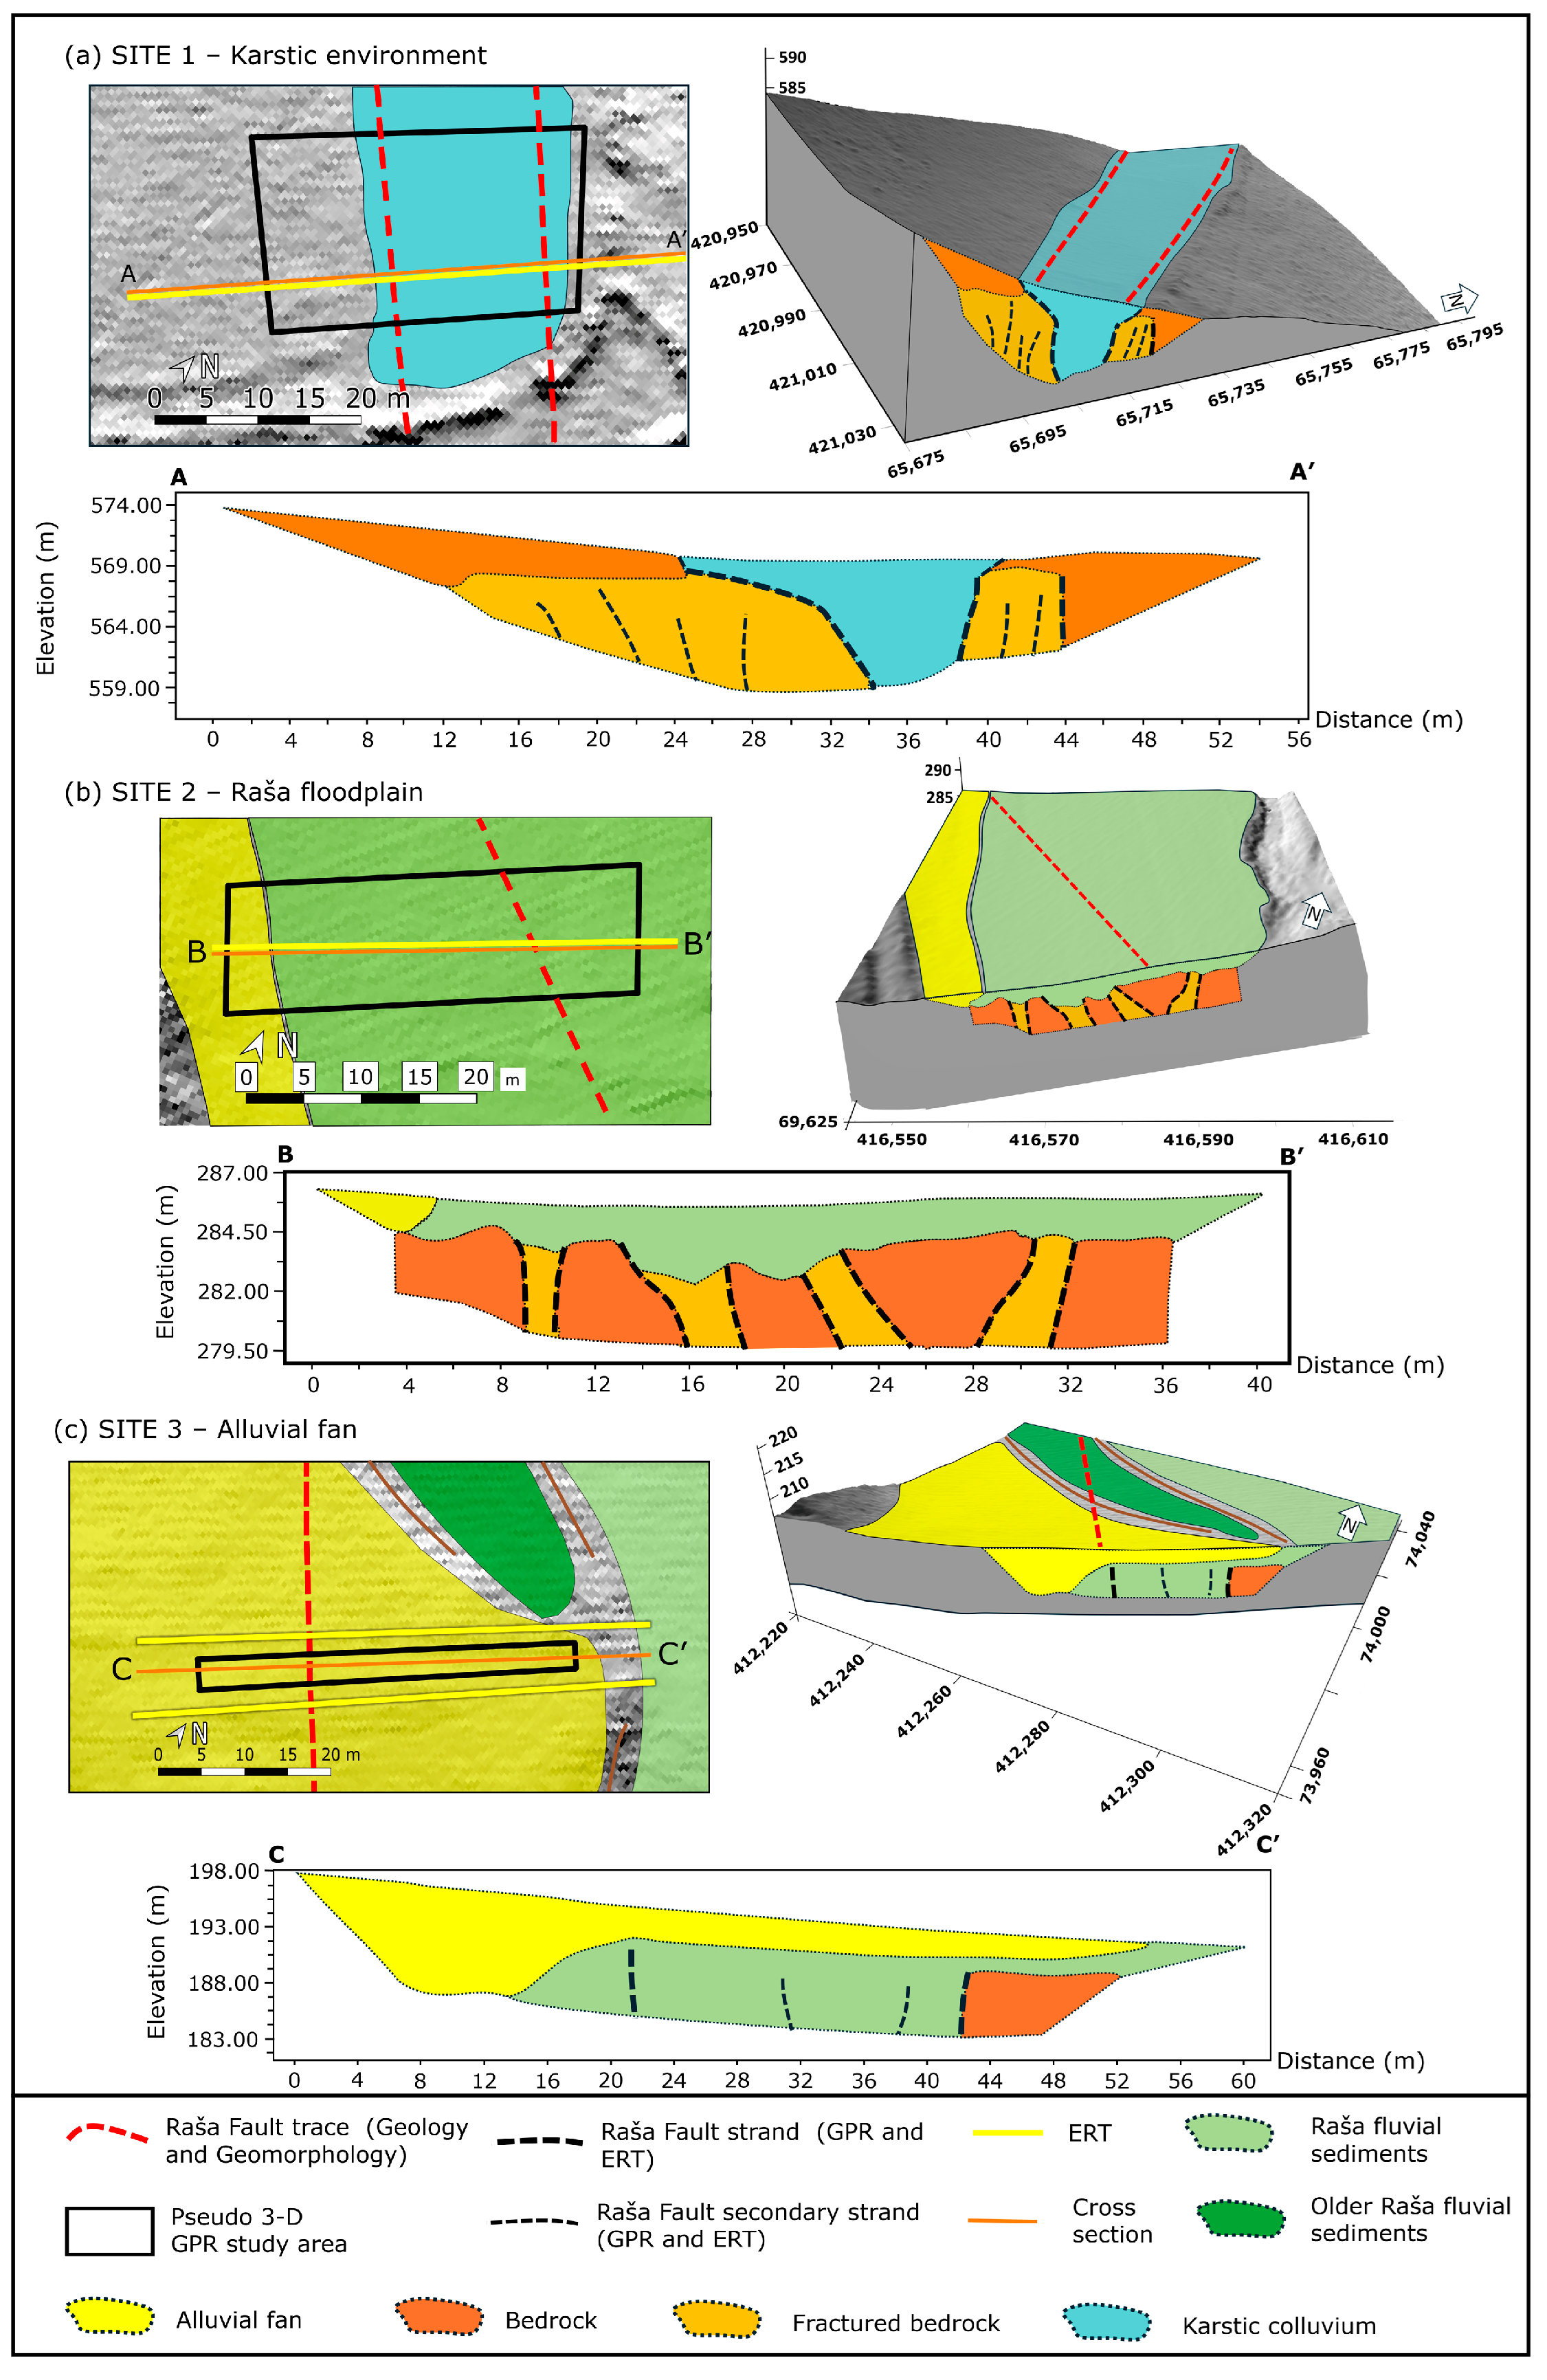
The analysis of dense pseudo 3-D GPR data and complementary ERT profiles enabled us to clearly image the fault and obtain some quantitative information about the subsurface. The fault zone cannot be reduced to a simple vertical discontinuity within the sedimentary deposits and bedrock, as it varies both laterally and vertically; instead, it manifests as a multitude of buried fault strands that have no surface expression (Figure 16). These buried strands appear to slightly offset individual GPR reflectors. Such offsets could be quantified by extending the survey with the CMP methodology and performing migration on the processed GPR dataset [34]. Although the complex deformational pattern identified in both the GPR and ERT results could indicate distributed deformation across several splays, drag folding and block rotations may also occur in the immediate vicinity of the RF zone, which would make displacement measurements even more difficult.
The 3-D GPR data visualization, presented as a succession of 2-D profiles, depth-slices and isosurfaces, along with 2-D ERT, reduced uncertainties in the interpretation of structural features within the surveyed geological environments. We were able to determine the variability of fault strike across the survey sites. At Site 1, the orientation of the main RF strand equals 315°, which is similar to the 310° orientation at Site 3, but differs slightly from the 350° strike at Site 2. The dip of the main fault strand is vertical to subvertical at all study sites. The width of the fault zone across the study areas reveals the greatest localization of tectonic deformations at Site 1, whereas it increases at Site 2 and Site 3. The geometry of the fault strands at Sites 1 and 3 is consistent with the general RF geometry derived from the geological [12,30] and tectonic geomorphological mapping. By contrast, the geometry of the strands at Site 2 is consistent with secondary faulting within the RF zone (Riedel faults). A comparison of the interpreted main fault parameters is in Table 4.
The complexity of faulting in the near-subsurface is therefore largely dependent on the competency and age of the faulted material. We observe a narrow region of relatively concentrated deformation at Site 1, where the near-surface fault geometry appears to be controlled by the carbonate bedrock in the shallow subsurface (Figure 16a). Conversely, fault zones within a more dynamic sedimentary environment with greater depth of sedimentary infill, such as is the case at Site 2 and Site 3, are more widely distributed, offsetting unconsolidated alluvial sediments (Figure 16b,c).

6. Conclusions

A pseudo 3-D GPR and complementary 2-D ERT survey were performed at the seismogenic Raša Fault—RF (W Slovenia), since previously, only very sparse 2-D geophysical data were available [8,31]. Sites were selected through geomorphological analysis based on detailed, high-resolution, hill-shaded DEM derived from the reprocessing of LiDAR data. We studied the RF using a dense pseudo 3-D GPR volume supplemented by 2-D ERT profiles, which provided us with geophysical information about the complexity and near-surface development of faulting with spatial continuity. The geophysical data successfully imaged the investigated target. Some typical fault indications are clearly recognizable, such as changes in GPR signal attenuation, layer truncations, GPR facies transitions and diffraction hyperbolas. These features provided a distinctive geophysical characterization of a faulted area, highlighting the trade-off between depth of investigation and the resolving power of the 100 MHz antenna in these geological environments. As a result, this study provides high-resolution 3-D imaging of the fault zone, revealing lateral variations, improving the interpretation, and allowing the extrapolation of fault parameters.
This study demonstrates the imaging potential of the pseudo 3-D GPR survey for shallow fault investigations in complex geological environments. It also demonstrates the potential of pseudo 3-D depth-slice and isosurface visualization as complementary techniques for detecting the complexity of a fault zone, revealing that, at least within the shallow subsurface, the fault zone is not a simple planar feature but an irregular, laterally varying area with sediment infill.
This study has demonstrated the applicability of pseudo 3-D GPR surveying for the subsurface mapping of active strike-slip faults in karstic and fluvial sedimentary environments. The methodology can be recommended in particular for rapid and cost-effective investigations of sites with subtle surface evidence of active faulting in order to determine near-surface fault splaying. The processed GPR profiles revealed details of faulting and associated deformation structures that were not evident at the surface. This enabled us to gain new insights into the complex geometric relationship between tectonic and sedimentary structures.
We thus show that part of the record of past large earthquakes indeed resides in the first few meters below the surface, where it remains to be explored, complementing surface observations. The results of the combined GPR and ERT survey provide a robust foundation for appropriate site selection in future geophysical investigations and paleoseismological trenching efforts (e.g., refs. [3,78] and references therein).

Author Contributions

Conceptualization, L.R.; methodology, L.R., P.J.R., M.Z. and A.G.; formal analysis, L.R., P.J.R., M.Z. and A.G.; investigation, L.R., P.J.R., M.Z. and A.G.; resources, P.J.R., M.Z. and A.G.; data curation, L.R.; writing—original draft preparation, L.R.; writing—review and editing, L.R., P.J.R., M.Z. and A.G.; visualization, L.R.; supervision, P.J.R., M.Z. and A.G.; project administration, L.R. and P.J.R.; funding acquisition, P.J.R., M.Z. and A.G. All authors have read and agreed to the published version of the manuscript.

Funding

The research was funded by Slovenian Research and Innovation Agency program groups Dynamic Earth (P1-0419), Regional Geology (P1-0011), and Geoenvironment & Geomaterials (P1-0195), and funds as part of the Slovenian Research and Innovation Agency Young Researcher program (number 56911), and by Slovenian Environment Agency (Project Elaboration of Seismotectonic Maps).

Data Availability Statement

Publicly available lidar datasets were analyzed in this study. This data can be found here: http://gis.arso.gov.si/evode/profile.aspx?id=atlas_voda_Lidar@Arso (accessed on 19 May 2026). The original contributions presented in this study are included in the article. Further inquiries can be directed to the corresponding author.

Acknowledgments

This research utilized GPR and ERT equipment co-funded by the Slovenian research and Innovation Agency and in part ERT equipment co-funded by the EU Research Infrastructure projects eLTER ERIC and LifeWatch ERIC, as part of the national RI-SI-LifeWatch initiative. We also thank Petra Gostinčar for her assistance with field ERT measurements.

Conflicts of Interest

The authors declare no conflicts of interest.

References

  1. Thenhaus, P.C.; Campbell, K.W. Seismic Hazard Analysis. In Earthquake Engineering Handbook; Scawthorn, C., Chen, W.F., Eds.; CRC Press: Boca Raton, FL, USA, 2003; pp. 8.1–8.50. [Google Scholar]
  2. Bonini, S.; Asti, R.; Tartaglia, V.G.; Rodani, S.; Benedetti, G.; Comedini, M.; Vignaroli, G. The Impact of Active and Capable Faults Structural Complexity on Seismic Hazard Assessment for the Design of Linear Infrastructures. Nat. Hazards Earth Syst. Sci. 2025, 25, 2981–2998. [Google Scholar] [CrossRef]
  3. McCalpin, J.; Ferrario, F.; Figueiredo, P.; Livio, F.; Grützner, C.; Pisarska-Jamroży, M.; Quigley, M.; Reicherter, K.; Rockwell, T.; Štepančíková, P.; et al. New Developments in Onshore Paleoseismic Methods, and Their Impact on Quaternary Tectonic Studies. Quat. Int. 2023, 664, 59–76. [Google Scholar] [CrossRef]
  4. Vanneste, K.; Verbeeck, K.; Petermans, T. Pseudo-3D Imaging of a Low-Slip-Rate, Active Normal Fault Using Shallow Geophysical Methods: The Geleen Fault in the Belgian Maas River Valley. Geophysics 2008, 73, B1–B9. [Google Scholar] [CrossRef]
  5. McClymont, A.F.; Green, A.G.; Villamor, P.; Horstmeyer, H.; Grass, C.; Nobes, D. C Characterization of the Shallow Structures of Active Fault Zones Using 3-D Ground-Penetrating Radar Data. J. Geophys. Res. 2008, 113, B10315. [Google Scholar] [CrossRef]
  6. Ercoli, M.; Pauselli, C.; Frigeri, A.; Forte, E.; Federico, C. “Geophysical Paleoseismology” through High Resolution GPR Data: A Case of Shallow Faulting Imaging in Central Italy. J. Appl. Geophys. 2013, 90, 27–40. [Google Scholar] [CrossRef]
  7. Čeru, T.; Dolenec, M.; Gosar, A. Application of Ground Penetrating Radar Supported by Mineralogical-Geochemical Methods for Mapping Unroofed Cave Sediments. Remote Sens. 2018, 10, 639. [Google Scholar] [CrossRef]
  8. Grützner, C.; Aschenbrenner, S.; Krämer, A.; Reicherter, K.; Saifelislam, N.; Ustaszewski, K.; Viscolani, A.; Welte, J. Geophysical Survey (GPR, ERT, Magnetic) on Active Faults in Slovenia and Italy; Pangaea: Bremerhaven, Germany, 2020. [Google Scholar]
  9. Diercks, M.L.; Grützner, C.; Welte, J.; Ustaszewski, K. Challenges of Geomorphologic Analysis of Active Tectonics in a Slowly Deforming Karst Landscape (W Slovenia and NE Italy). Geomorphology 2023, 440, 108894. [Google Scholar] [CrossRef]
  10. Basili, R.; Danciu, L.; Beauval, C.; Sesetyan, K.; Vilanova, S.; Adamia, S.; Arroucau, P.; Atanackov, J.; Baize, S.; Canora, C.; et al. European Fault-Source Model 2020 (EFSM20): Online Data on Fault Geometry and Activity Parameters [Dataset] 2022. Available online: https://www.seismofaults.eu/efsm20 (accessed on 20 May 2026).
  11. Basili, R.; Danciu, L.; Beauval, C.; Sesetyan, K.; Vilanova, S.; Adamia, S.; Arroucau, P.; Atanackov, J.; Baize, S.; Canora, C.; et al. The European Fault-Source Model 2020 (EFSM20): Geologic Input Data for the European Seismic Hazard Model 2020. Nat. Hazards Earth Syst. Sci. 2024, 24, 3945–3976. [Google Scholar] [CrossRef]
  12. Atanackov, J.; Jamšek Rupnik, P.; Jež, J.; Celarc, B.; Novak, M.; Milanič, B.; Markelj, A.; Bavec, M.; Kastelic, V. Database of Active Faults in Slovenia: Compiling a New Active Fault Database at the Junction between the Alps, the Dinarides and the Pannonian Basin Tectonic Domains. Front. Earth Sci. 2021, 9, 604388. [Google Scholar] [CrossRef]
  13. Slovenian Environment Agency LIDAR. Available online: http://gis.arso.gov.si/evode/profile.aspx?id=atlas_voda_Lidar@Arso (accessed on 20 May 2026).
  14. Placer, L. Principles of the Tectonic Subdivision of Slovenia. Geologija 2008, 51, 205–217. [Google Scholar] [CrossRef]
  15. Moulin, A.; Benedetti, L.; Rizza, M.; Jamšek Rupnik, P.; Gosar, A.; Bourlès, D.; Kaddadouche, K.; Aumaître, G.; Arnold, M.; Guillou, V.; et al. The Dinaric Fault System: Large-Scale Structure, Rates of Slip, and Plio-Pleistocene Evolution of the Transpressive Northeastern Boundary of the Adria Microplate. Tectonics 2016, 35, 2258–2292. [Google Scholar] [CrossRef]
  16. Grützner, C.; Aschenbrenner, S.; Jamšek Rupnik, P.; Reicherter, K.; Saifelislam, N.; Vičič, B.; Vrabec, M.; Welte, J.; Ustaszewski, K. Holocene Surface-Rupturing Earthquakes on the Dinaric Fault System, Western Slovenia. Solid Earth 2021, 12, 2211–2234. [Google Scholar] [CrossRef]
  17. Vrabec, M.; Fodor, L. Late Cenozoic Tectonics of Slovenia: Structural Styles at the Northeastern Corner of the Adriatic Microplate. In Proceedings of the The Adria Microplate: GPS Geodesy, Tectonics and Hazards: NATO Science Series: IV; Pinter, N., Gyula, G., Weber, J., Stein, S., Medak, D., Eds.; Springer: Dordrecht, The Netherlands, 2006; pp. 151–169. [Google Scholar]
  18. Šket Motnikar, B.; Zupančič, P.; Živčić, M.; Atanackov, J.; Čarman, M.; Danciu, L.; Gosar, A. The 2021 Seismic Hazard Model for Slovenia (SHMS21): Overview and Results. Bull. Earthq. Eng. 2022, 20, 4865–4894. [Google Scholar] [CrossRef]
  19. Vičič, B.; Aoudia, A.; Javed, F.; Foroutan, M. Geometry and Mechanics of the Active Fault System in Western Slovenia. Geophys. J. Int. 2019, 217, 1755–1766. [Google Scholar] [CrossRef]
  20. Zupančič, P.; Šket Motnikar, B.; Carafa, M.; Jamšek Rupnik, P.; Živčić, M.; Kastelic, V.; Rajh, G.; Čarman, M.; Atanackov, J.; Gosar, A. Seismogenic Depth and Seismic Coupling Estimation in the Transition Zone between Alps, Dinarides and Pannonian Basin for the New Slovenian Seismic Hazard Model. Nat. Hazards Earth Syst. Sci. 2024, 24, 651–672. [Google Scholar] [CrossRef]
  21. Atanackov, J.; Jamšek Rupnik, P.; Zupančič, P.; Šket Motnikar, B.; Živčić, M.; Čarman, M.; Milanič, B.; Kastelic, V.; Rajh, G.; Gosar, A. Seismogenic Fault and Area Sources for Probabilistic Seismic Hazard Model in Slovenia; Pangaea: Bremerhaven, Germany, 2022. [Google Scholar]
  22. Grünthal, G.; Whlastrom, R.; Stromeyer, D. The SHARE European Earthquake Catalogue (SHEEC) for the Time Period 1900–2006 and Its Comparison to the European-Mediterranean Earthquake Catalogue (EMEC). J. Seismol. 2013, 17, 1339–1344. [Google Scholar] [CrossRef]
  23. Vidrih, R.; Godec, M. Potresi Na Ilirskobitrisškem = Earthquakes in the Ilirska Bistrica Region. Ujma 2006, 20, 73–85. (In Slovenian) [Google Scholar]
  24. Bavec, M.; Atanackov, J.; Celarc, B.; Hajdas, I.; Jamšek Rupnik, P.; Jež, J.; Kastelic, V.; Milanič, B.; Novak, M.; Skaberne, D.; et al. Evidence of Idrija Fault Seismogenic Activity during the Late Holocene Including the 1511 Mm 6.8 Earthquake. In Proceedings of the 4th International INQUA Meeting on Paleoseismology, Active Tectonics and Archeoseismology (PATA Days), Aachen, Germany, 9–15 October 2013; Grützner, C., Rudersdorf, A., Pérez-López, R., Reicherter, K., Eds.; Grützner & Reicherter Geosolutions: Aachen, Germany, 2013; pp. 23–26. [Google Scholar]
  25. Jamšek Rupnik, P.; Žebre, M.; Jež, J.; Zajc, M.; Preusser, F.; Monegato, G. Deciphering the Deformation Mechanism in Quaternary Deposits along the Idrija Fault in the Formerly Glaciated Soča Valley, Southeast European Alps. Eng. Geol. 2022, 297, 106515. [Google Scholar] [CrossRef]
  26. Gosar, A. Review of Geological and Seismotectonic Investigations Related to 1998 Mw5.6 and 2004 Mw5.2 Earthquakes in Krn Mountains. Geologija 2019, 62, 61–73. [Google Scholar] [CrossRef]
  27. Gosar, A. Review of Seismological Investigations Related to 1998 Mw5.6 and 2004 Mw5.2 Earthquakes in Krn Mountains. Geologija 2019, 62, 75–88. [Google Scholar] [CrossRef]
  28. Jurkovšek, B. Geološka Karta Severnega Dela Tržaško-Komenske Planote 1:25.000 = Geological Map of the Northern Part of the Trieste-Komen Plateau 1:25.000; Geological Survey of Slovenia: Ljubljana, Slovenia, 2008. [Google Scholar]
  29. Jurkovšek, B. Geološka Karta Severnega Dela Tržaško-Komenske Planote 1:25.000, Tolmač = Geological Map of the Northern Part of the Trieste-Komen Plateau 1:25.000, Explanatory Book; Geological Survey of Slovenia: Ljubljana, Slovenia, 2010. [Google Scholar]
  30. Jurkovšek, B. Geološka Karta Krasa 1: 100.000 [Elektronski Vir] = Geological Map of Kras (Slovenia) 1: 100.000 2013. Available online: https://www.geo-zs.si/wp-content/uploads/2025/03/Kras_new.pdf (accessed on 26 July 2026).
  31. Zajc, M. Optimizacija Nizkofrekvenčnih Georadarskih Raziskav Za Karakterizacijo Plitvih Geoloških Struktur = Optimisation of Low-Frequency Ground Penetrating Radar Surveys for the Characterisation of Shallow Geological Structures; University of Ljubljana: Ljubljana, Slovenia, 2015. [Google Scholar]
  32. Jol, H.M. (Ed.) Ground Penetrating Radar: Theory and Applications; Elsevier Science: Amsterdam, The Netherlands, 2009. [Google Scholar]
  33. Neal, A. Ground-Penetrating Radar and Its Use in Sedimentology: Principles, Problems and Progress. Earth Sci. Rev. 2004, 66, 261–330. [Google Scholar] [CrossRef]
  34. McClymont, A.F.; Villamor, P.; Green, A.G. Fault Displacement Accumulation and Slip Rate Variability within the Taupo Rift (New Zealand) Based on Trench and 3-D Ground-Penetrating Radar Data. Tectonics 2009, 28, TC4005. [Google Scholar] [CrossRef]
  35. Beauprêtre, S.; Garambois, S.; Manighetti, I.; Malavielle, J.; Sénéchal, G.; Chatton, M.; Davies, T.; Larrouqe, C.; Rousset, D.; Cotte, N.; et al. Finding the Buried Record of Past Earthquakes with GPR-Based Palaeoseismology: A Case Study on the Hope Fault, New Zealand. Geophys. J. Int. 2012, 189, 73–100. [Google Scholar] [CrossRef]
  36. Smith, D.G.; Jol, H.M. Wasatch Fault (Utah), Detected and Displacement Characterized by Ground Penetrating Radar. Environ. Eng. Geosci. 1995, 1, 489–496. [Google Scholar] [CrossRef]
  37. Salvi, S.; Cinti, F.R.; Colini, L.; D’Addezio, G.; Doumaz, F.; Pettinelli, E. Investigation of the Active Celano-L’Aquila Fault System, Abruzzi (Central Apennines, Italy) with Combined Ground-Penetrating Radar and Palaeoseismic Trenching. Geophys. J. Int. 2003, 155, 805–818. [Google Scholar] [CrossRef]
  38. Bano, M.; Edel, J.B.; Herquel, G. Geophysical Investigation of a Recent Shallow Fault. Lead. Edge 2002, 21, 648–650. [Google Scholar] [CrossRef]
  39. Jewell, C.J.; Bristow, C.S. GPR Studies in the Piano Di Pezza Area of the Ovindoli-Pezza Fault, Central Apennines, Italy: Extending Paleoseismic Trench Investigations with High Resolution GPR Profiling. Surf. Geophys. 2006, 4, 147–153. [Google Scholar] [CrossRef]
  40. Pausseli, C.; Federico, C.; Frigeri, A.; Orosei, R.; Barchi, M.R.; Basile, G. Ground Penetrating Radar Investigations to Study Active Faults in the Norcia Basin (Central Italy). J. Appl. Geophys. 2010, 72, 39–45. [Google Scholar] [CrossRef]
  41. Chow, J.; Angelier, J.; Hua, J.J.; Lee, J.C.; Sun, R. Paleoseismic Event and Active Faulting: From Ground Penetrating Radar and High-Resolution Seismic Reflection Profiles across the Chihshang Fault, Eastern Taiwan. Tectonophysics 2001, 333, 241–259. [Google Scholar] [CrossRef]
  42. Rashed, M.; Nakagawa, K. High-Resolution Shallow Seismic and Ground Penetrating Radar Investigations Revealing the Evolution of the Uemachi Fault System, Osaka, Japan. Isl. Arc 2004, 13, 144–156. [Google Scholar] [CrossRef]
  43. Jamšek Rupnik, P.; Atanackov, J.; Horn, B.; Mušič, B.; Zajc, M.; Grützner, C.; Ustaszewski, K.; Tsukamoto, S.; Novak, M.; Milanič, B.; et al. Revealing Subtle Active Tectonic Deformation: Integrating Lidar, Photogrammetry, Field Mapping, and Geophysical Surveys to Assess the Late Quaternary Activity of the Sava Fault (Southern Alps, Slovenia). Remote Sens. 2024, 16, 1490. [Google Scholar] [CrossRef]
  44. Grasmueck, M.; Green, A.G. 3-D Georadar Mapping; Looking into the Subsurface. Environ. Eng. Geosci. 1996, 2, 195–200. [Google Scholar] [CrossRef]
  45. Christie, M.; Tsoflias, G.P.; Stockli, D.F.; Black, R. Assessing Fault Displacement and Off-Fault Deformation in an Extensional Tectonic Setting Using 3-D Ground-Penetrating Radar Imaging. J. Appl. Geophys. 2009, 68, 9–16. [Google Scholar] [CrossRef]
  46. Ercoli, M.; Pausseli, C.; Frigeri, A.; Forte, E.; Federico, C. 3-D GPR Data Analysis for High-Resolution Imaging of Shallow Subsurface Faults: The Mt Vettore Case Study (Central Apennines, Italy). Geophys. J. Int. 2014, 198, 609–621. [Google Scholar] [CrossRef]
  47. Gross, R.; Holliger, K.; Green, A.G.; John, B. 3-D Ground Penetrating Radar Applied to Paleoseismology: Examples from the Wellington Fault, New Zealand. In Proceedings of the Eighth International Conference on Ground Penetrating Radar; Noon, D.A., Stickley, G.F., Longsta, D., Eds.; SPIE: Zürich, Switzerland, 2000; Volume 4084, pp. 478–481. [Google Scholar]
  48. Gross, R.; Green, A.G.; Horstmeyer, H.; Begg, J.H. Location and Geometry of the Wellington Fault (New Zealand) Defined by de Tailed Three-Dimensional Georadar Data. J. Geophys. Res. 2004, 109, B05401. [Google Scholar] [CrossRef]
  49. Demanet, F.; Renardy, D.; Vaneste, K.; Jongmans, D.; Camelbeeck, T.; Meghraoui, M. The Use of Geophysical Prospecting for Imag Ing Active Faults in the Roer Graben, Belgium. Geophysics 2001, 66, 78–89. [Google Scholar] [CrossRef]
  50. Patria, A.; Kimura, H.; Kitade, Y.; Tsutsumi, H. Right-Lateral Offset Associated with the Most Recent Earthquake on the Ikeda Fault of the Median Tectonic Line, Southwest Japan, Revealed by Ground-Penetrating Radar Profiling. Prog. Earth Planet. Sci. 2022, 9, 8. [Google Scholar] [CrossRef]
  51. Dujardin, J.R.; Bano, M.; Schlupp, A.; Ferry, M.; Munkhuu, U.; Tsend-Ayush, N.; Enkhee, B. GPR Measurements to Assess the Emeelt Active Fault’s Characteristics in a Highly Smooth Topographic Context, Mongolia. Geophys. J. Int. 2014, 198, 174–186. [Google Scholar] [CrossRef]
  52. Grasmueck, M.; Weger, R.; Horstmeyer, H. Full-Resolution 3D GPR Imaging. Geophysics 2005, 70, K12–K19. [Google Scholar] [CrossRef]
  53. GuidelineGeo MALÅ ProEx Control Unit User Manual. Available online: https://guidelinegeo.com/wp-content/uploads/2022/06/MALA-ProEx-Control-Unit-User-Manual-May-2026.pdf?v=1776928352 (accessed on 20 May 2026).
  54. Sandmeier, K.J. ReflexW, Version 9.5. Software for the Processing of Seismic, Acoustic or Electromagnetic Reflection, Refraction and Transmission Data. Sandmeier Geo: Karlsruhe, Germany, 2025.
  55. GPR-Slice, v7.MT. Ground Penetrating Radar Imaging Software. Geophysical Archaeometry Laboratory Inc.: Woodland Hills, CA, USA, 2024.
  56. Luo, T.X.H.; Lai, W.W.L.; Chang Ray, K.W.; Goodman, D. GPR Imaging Criteria. J. Appl. Geophys. 2019, 165, 37–48. [Google Scholar] [CrossRef]
  57. Goodman, D.; Piro, S. GPR Remote Sensing in Archeology; Springer: Berlin/Heidelberg, Germany, 2013. [Google Scholar]
  58. The Surveying and Mapping Authority of the Republic of Slovenia—Public Geodetic Data. Available online: https://ipi.eprostor.gov.si/jgp/data (accessed on 20 May 2026).
  59. Gross, R.; Green, A.G.; Horstmeyer, H.; Holliger, K.; Baldwin, J. 3-D Georadar Images of an Active Fault: Efficient Data Acquisition, pro Cessing and Interpretation Strategies. Subsurf. Sens. Technol. Appl. 2003, 4, 19–40. [Google Scholar] [CrossRef]
  60. Burger, H.R.; Sheehan, A.F.; Jones, C.H. Introduction to Applied Geophysics: Exploring the Shallow Subsurface; Cambridge University Press: Cambridge, UK, 2023. [Google Scholar]
  61. Daryono, M.R.; Natawidjaja, D.H.; Sapiie, B.; Cummins, P. Earthquake Geology of the Lembang Fault, West Java, Indonesia. Tectonophysics 2019, 751, 180–191. [Google Scholar] [CrossRef]
  62. Peri, V.G.; Rapalini, A.E.; Pérez, P.; Franceschinis, P.; Leiva, M.F.; Fazzito, S.Y.; Cortés, J.M. Subsurface Characterization of Quaternary Scarps and Their Possible Connection to Main Structures of the Western Margin of Precordillera, San Juan, Argentina. Tectonophysics 2020, 790, 228542. [Google Scholar] [CrossRef]
  63. Patria, A.; Hanif, M.; Natawidjaja, D.H.; Daryono, M.R. Shallow Subsurface Structures and Quaternary Deformations on the Easternmost Matano Fault, Indonesia, Revealed by Electrical Resistivity Tomography. Min.-Geol.-Pet. Eng. Bull. 2024, 39, 75–88. [Google Scholar] [CrossRef]
  64. Suzuki, K.; Tosa, S.; Kusunoki, Y.; Fujimitsu, Y.; Mogi, T.; Jomori, A. Case Studies of Electrical and Electromagnetic Methods Applied to Mapping Active Faults beneath the Thick Quaternary. Eng. Geol. 2000, 56, 29–45. [Google Scholar] [CrossRef]
  65. Caputo, R.; Piscitelli, S.; Oliveto, A.; Rizzo, E.; Lapenna, V. High-Resolution Resistivity Tomographies in Active Tectonic Studies. Examples from the Tyrnavos Basin, Greece. J. Geodyn. 2003, 36, 19–35. [Google Scholar] [CrossRef]
  66. Fazzito, S.Y.; Rapalini, A.E.; Cortés, J.M.; Terrizzano, C.M. Characterization of Quaternary Faults by Electric Resistivity Tomography in the Andean Precordillera of Western Argentina. J. S. Am. Earth Sci. 2009, 28, 217–228. [Google Scholar] [CrossRef]
  67. Diaferia, I.; Barchi, M.; Loddo, M.; Schiavone, D.; Siniscalchi, A. Detailed Imaging of Tectonic Structures by Multiscale Earth Resistivity Tomographies: The Colfiorito Normal Faults (Central Italy). Geophys. Res. Lett. 2006, 33, L09305. [Google Scholar] [CrossRef]
  68. Giocoli, A.; Burrato, P.; Galli, P.; Piscitelli, S.; Rizzo, E.; Romano, G.; Lapenna, V.; Siniscalchi, A.; Magrí, C.; Vannoli, P. Using the ERT Method in Tectonically Active Areas: Hints from Southern Apennine (Italy). Adv. Geosci. 2008, 19, 61–65. [Google Scholar] [CrossRef]
  69. Vilani, F.; Sapia, V. The Shallow Structure of a Surface-Rupturing Fault in Unconsolidated Deposits from Multi-Scale Electrical Resistivity Data: The 30 October 2016 Mw 6.5 Central Italy Earthquake Case Study. Tectonophysics 2017, 717, 628–644. [Google Scholar] [CrossRef]
  70. AGIUSA AGIUSA SuperSting R8. Available online: https://www.agiusa.com/high-speed-2d3d-resistivityipsp-imaging-system-package-56-electrodes (accessed on 20 May 2026).
  71. GuidelineGeo ABEM Terrameter LS2. Available online: https://guidelinegeo.com/products/abem/abem-terrameter-ls-2/ (accessed on 20 May 2026).
  72. Res2DINVx64 2026.1; Software for Rapid Resistivity and IP Inversion. Aarhus Geosoftware: Aarhus, Denmark, 2026.
  73. Loke, M.H.; Barker, R.D. Rapid Least-Squares Inversion of Apparent Resistivity Pseudosections by a Quasi-Newton Method. Geophys. Prospect. 1996, 44, 131–152. [Google Scholar] [CrossRef]
  74. Zielke, O.; Arrowsmith, R.; Ludwig, L.G.; Akciz, S.O. Slip in the 1857 and Earlier Large Earthquakes along the Carrizo Plain, San Andreas Fault. Science 2010, 327, 1119–1122. [Google Scholar] [CrossRef] [PubMed]
  75. Oskin, M.E.; Arrowsmith, J.R.; Corona, A.H.; Elliott, A.J.; Fletcher, J.M.; Fielding, E.J.; Gold, P.O.; Gonzalez-Garcia, J.J.; Hudnut, K.W.; Liu-Zeng, J.; et al. Near-Field Deformation from the E1 Mayor–Cucapah Earthquake Revealed by Differential LiDAR. Science 2012, 335, 702–705. [Google Scholar] [CrossRef] [PubMed]
  76. Ren, Z.; Zhang, Z.; Chen, T.; Yan, S.; Yin, J.; Zhang, P.; Zheng, W.; Zhang, H.; Li, C. Clustering of Offsets on the Haiyuan Fault and Their Relationship to Paleoearthquakes. GSA Bull. 2016, 128, 3–18. [Google Scholar] [CrossRef]
  77. Liu, J.; Ren, Z.; Min, W.; Ha, G.; Lei, J. The Advance in Obtaining Fault Slip Rate of Strike Slip Fault-A Review. Earthq. Res. Adv. 2021, 1, 100032, Erratum in Earthq. Res. Adv. 2024, 4, 100293. https://doi.org/10.1016/j.eqrea.2024.100293. [Google Scholar] [CrossRef]
  78. McCalpin, J. (Ed.) Paleoseismology; Elsevier: Burlington, MA, USA, 2009. [Google Scholar]
  79. Ren, Z.; Zielke, O.; Yu, J. Active Tectonics in 4D High-Resolution. J. Struct. Geol. 2018, 117, 264–271. [Google Scholar] [CrossRef]
  80. Lin, Z.; Kaneda, H.; Mukoyama, S.; Asada, N.; Chiba, T. Detection of Subtle Tectonic–Geomorphic Features in Densely Forested Mountains by Very High-Resolution Airborne LiDAR Survey. Geomorphology 2013, 182, 104–115. [Google Scholar] [CrossRef]
  81. Neslon, A.R.; Johnson, S.Y.; Kelsey, H.M.; Wells, R.E.; Sherrod, B.L.; Pezzopane, S.K.; Bradley, L.; Koehler, R.D.; Buchnam, R.C. Late Holocene Earthquakes on the Toe Jam Hill Fault, Seattle Fault Zone, Bainbridge Island, Washington. GSA Bull. 2003, 115, 1388–1403. [Google Scholar] [CrossRef]
  82. Cunningham, D.; Grebby, S.; Tansey, K.; Gosar, A.; Kastelic, V. Application of Airborne LiDAR to Mapping Seismogenic Faults in Forested Mountainous Terrain, Southeastern Alps, Slovenia. Geophys. Res. Lett. 2006, 33, L20308. [Google Scholar] [CrossRef]
  83. Kondo, H.; Toda, S.; Okamura, K.; Takada, K.; Chiba, T. A Fault Scarp in an Urban Area Identified by LiDAR Survey: A Case Study on the Itoigawa–Shizuoka Tectonic Line, Central Japan. Geomorphology 2008, 101, 731–739. [Google Scholar] [CrossRef]
  84. Arrowsmith, J.R.; Zielke, O. Tectonic Geomorphology of the San Andreas Fault Zone from High Resolution Topography: An Example from the Cholame Segment. Geomorphology 2009, 113, 70–81. [Google Scholar] [CrossRef]
  85. Sherrod, B.L.; Brocher, T.M.; Weaver, C.S.; Bucknam, R.C.; Blakely, R.J.; Kelsey, H.M.; Nelson, A.R.; Haugerud, R.A. Holocene Fault Scarps near Tacoma, Washington, USA. Geology 2004, 32, 9–12. [Google Scholar] [CrossRef]
  86. CloudCompare. v2.13.2; Software for 3D Point Cloud and Mesh Processing; Open Source Project, 2024. Available online: http://www.cloudcompare.org/ (accessed on 26 July 2026).
  87. Graser, A.; Sutton, T.; Bernasocchi, M. The QGIS Project: Spatial without Compromise. Patterns 2025, 6, 101265. [Google Scholar] [CrossRef] [PubMed]
  88. Brubaker, K.M.; Myers, L.W.; Drohan, P.J.; Miller, D.A.; Boyer, E.W. The Use of LiDAR Terrain Data in Characterizing Surface Roughness and Microtopography. Appl. Environ. Soil Sci. 2013, 2013, 891534. [Google Scholar] [CrossRef]
  89. Liner, C.L.; Liner, J.L. Application of GPR to a Site Investigation Involving Shallow Faults. Lead. Edge 1997, 16, 1649–1651. [Google Scholar] [CrossRef]
Figure 2. (a) Raša Fault section of interest, basemap is hillshaded relief from lidar-derived DEM [13]. General settings: (b) Site 3—alluvial fan, (c) Site 2—Raša floodplain, (d) Site 1—karstic environment. Study areas with supposed Raša fault lineament: (e) Site 3, (f) Site 2, (g) Site 1. Coordinate reference system: EPSG: 3794 (E—Easting; N—Northing).
Remotesensing 18 02561 g002
Figure 3. (a) Processed Ground-Penetrating Radar (GPR) data for Site 1; (b) resistivity model for Site 1; (c) comparison between hillshadded Digital Elevation Model (DEM) 5 m (left) [58] and reprocessed hillshaded DEM 0.5 m (right); coordinate reference system—EPSG: 3794 (D96/TM).
Remotesensing 18 02561 g003
Figure 4. Characteristic GPR profile for Site 1—Karstic environment.
Remotesensing 18 02561 g004
Figure 5. (a) Site 1 tectonic geomorphological map; (b) co-located ERT and GPR profile; (c,d) selected inline GPR profiles.
Remotesensing 18 02561 g005
Figure 6. (a) Site 1 topography with the fault traces and location of the pseudo 3-D GPR study; (b) 3-D view of inline and two crossline GPR profiles and ERT profile at Site 1.
Remotesensing 18 02561 g006
Figure 7. Site 1 pseudo 3-D depth slices (ad) and isosurface visualization (e).
Remotesensing 18 02561 g007
Figure 8. Characteristic GPR profile for Site 2—floodplain sediments.
Remotesensing 18 02561 g008
Figure 9. (a) Site 2 tectonic geomorphological map; (b) co-located ERT and GPR profile; (c,d) three inline and (eg) two crossline profiles with indication of their position.
Remotesensing 18 02561 g009
Figure 10. (a) Site 2 topography with the fault traces and location of the pseudo 3-D GPR study; (b) three inline GPR profiles.
Remotesensing 18 02561 g010
Figure 11. Site 2 pseudo 3-D depth slices (ad).
Remotesensing 18 02561 g011
Figure 12. Characteristic GPR profile for Site 3—alluvial fan sediments.
Remotesensing 18 02561 g012
Figure 13. (a) Site 3 tectonic geomorphological map; (b) co-located NW ERT profile and GPR profile; (c) inline GPR profile; (d) co-located SE ERT profile.
Remotesensing 18 02561 g013
Figure 14. (a) Site 3 topography with the fault traces and location of the pseudo 3-D GPR study; (b) characteristic GPR profile.
Remotesensing 18 02561 g014
Figure 15. Site 3 pseudo 3-D depth slices.
Remotesensing 18 02561 g015
Figure 16. Synthesis of pseudo 3-D survey results conducted in the karstic environment (a), the Raša floodplain (b) and the alluvial fan (c).
Remotesensing 18 02561 g016
Table 1. Pseudo 3-D GPR acquisition parameters.
SiteAntenna FrequencyNo. of InlinesInline Spacing No. of CrosslinesCrossline SpacingTrace SpacingNo. of Stacks
Site 1100 MHz610.25 m311 m0.1 m8
Site 2100 MHz410.25 m371 m0.1 m8
Site 3100 MHz60.5 m//0.1 m8
Table 2. GPR 2-D and pseudo 3-D processing steps and parameters.
ReflexWSite 1Site 2Site 3
Subtract-mean (dewow) (ns)101010
Move start time (ns)−9.5−7.89−17.97
Background removalWhole lineWhole lineWhole line
GainEnergy decay 0.3Energy decay 0.5Manual Gain
Bandpass frequency (MHz)50/75/150/20050/75/150/20050/75/150/200
Fk filter—line partsIndividualIndividualIndividual
X Flip profileOdd no. profilesOdd no. profilesOdd no. profiles
Correct 3-D topographyAppliedAppliedApplied
GPR-SliceSite 1Site 2Site 3
Slice Thickness0.25 m0.25 m0.25 m
Interpolation0.5 m0.5 m0.75 m
Depth-slice threshold75%75%75%
NormalizationRelative NormalizationRelative NormalizationRelative Normalization
Isosurface threshold (%)456055
Table 3. ERT acquisition parameters.
SiteArrayNo. of ElectrodesElectrode SpacingProfile
Length
Max. No. of Channels Min-Max CurrentMax. VoltageDepth Levels (n)
Site 1Dipole–dipole561 m55 m810–200 mA250 V8
Site 2Dipole–dipole560.5 m44 m810–150 mA100 V8
Site 3Dipole–dipole810.5 m60 m810–150 mA100 V9
Table 4. Interpreted main fault parameters.
LocationFault StrikeFault DipFault Zone Width
Site 1315°80–90° (vertical to subvertical)12–14 m
Site 2350°80–90° (vertical to subvertical)~30 m
Site 3310°80–90° (vertical to subvertical)~30 m
Disclaimer/Publisher’s Note: The statements, opinions and data contained in all publications are solely those of the individual author(s) and contributor(s) and not of MDPI and/or the editor(s). MDPI and/or the editor(s) disclaim responsibility for any injury to people or property resulting from any ideas, methods, instructions or products referred to in the content.