


Highlights
What are the main findings?
- An intensity-aware deep local aggregation framework, RailDLA-Net, is proposed for semantic segmentation of railway point clouds.
- RailDLA-Net achieved 96.89% OA, 91.92% mAcc, and 88.44% mIoU on Rail3D, with strong performance on both major and sparse railway categories.
What are the implications of the main findings?
- Combining geometric structure, hierarchical context, and LiDAR intensity improves fine-grained semantic discrimination in complex railway scenes.
- The proposed framework shows practical potential for intelligent railway inspection and infrastructure management.
Abstract
Accurate semantic segmentation of railway point clouds is essential for intelligent railway inspection and infrastructure management. However, railway scenes contain elongated structures, locally similar objects, and severe class imbalance, while the discriminative value of LiDAR intensity is still insufficiently exploited. To address these issues, this study proposes RailDLA-Net, an intensity-aware deep local aggregation framework for railway point cloud semantic segmentation. The network adopts an encoder–decoder architecture and integrates a railway structure-guided residual local encoding module to capture local geometric variations, a hierarchical structural context aggregation module to model multi-level contextual dependencies, and an intensity-aware adaptive attention mechanism to enhance the discrimination of geometrically similar categories. In addition, a geometry–semantics collaborative objective is introduced to jointly optimize final predictions, intermediate semantic representations, and local spatial structures. Experiments were conducted on Rail3D and WHU-Railway3D datasets to evaluate RailDLA-Net under different railway scene conditions. The proposed method achieved 96.89% OA, 91.92% mAcc, and 88.44% mIoU on Rail3D, and 92.36% OA, 91.84% mAcc, and 83.63% mIoU on WHU-Railway3D. Compared with the baseline methods, RailDLA-Net showed competitive overall performance and improved the balance across categories, especially in more complex and imbalanced railway scenes. Ablation studies further demonstrated the effects of key configuration settings and the loss design. Together with the evaluations on two railway point cloud datasets, these results support the effectiveness of RailDLA-Net as an integrated railway-oriented framework for fine grained point cloud semantic segmentation.
1. Introduction
Railway infrastructure is an essential component of modern transportation systems, and its safety condition is directly related to transport efficiency, operational safety, and regional economic development [1,2,3]. With the development of mobile laser scanning (MLS) systems [4] and LiDAR technology [5], large-scale railway scenes can be rapidly and accurately acquired as 3D point clouds, providing a new data basis for railway asset management and intelligent inspection [6]. However, raw point clouds are usually composed of massive discrete 3D points without explicit semantic information, making them difficult to directly support component recognition, facility inventory, and risk analysis [7,8,9]. Point cloud semantic segmentation (PCSS) aims to assign a semantic category to each 3D point and is a key step in transforming geometric measurements into understandable railway scene information [10]. In railway scenes, this task requires distinguishing different categories such as rails, sleepers, ballast, ground, vegetation, catenary poles, signal facilities, and other auxiliary objects. Accurate semantic segmentation provides structural scene-level information for railway infrastructure management, intelligent inspection and the construction of digital-twin railways [11].
Although several studies have explored railway point cloud segmentation, this task still faces significant challenges [12,13,14,15]. Railway scenes have a typical linear spatial organization, where rails and catenary wires appear as elongated continuous structures, sleepers are periodically arranged, and ballast and ground are locally similar in geometry. Meanwhile, key facilities such as poles and signal devices usually contain fewer points and can be weakened by large-area background categories. In addition, variations in scanning distance, occlusion, point density, and laser intensity further increase the difficulty of semantic understanding in railway point clouds [7]. Early railway point cloud processing methods mainly relied on manual rules, geometric templates, or heuristic thresh-olds. These methods are interpretable and can be effective for specific railway lines, sensors, and target objects [16,17]. However, they are usually sensitive to parameter settings and scene assumptions, and their generalization ability can decrease when point density, acquisition platforms, or railway structures change. In contrast, deep learning methods can automatically learn geometric and semantic features from data and have therefore become an important direction for railway point cloud semantic segmentation [14].
In general point cloud understanding, PointNet [18] first demonstrated the feasibility of directly processing unordered point sets, but its ability to represent local geometric structures is limited. PointNet++ [19] enhanced multi-scale geometric representation through hierarchical sampling and local neighborhood learning, laying the foundation for subsequent point cloud semantic segmentation networks. Subsequently, methods such as KPConv [20] and RandLA-Net [21] improved large-scale point cloud processing from the perspectives of point convolution, local aggregation, and efficient sampling. In recent years, several research tendencies have emerged in point cloud semantic segmentation. One line of studies emphasizes complex local operators and attention mechanisms to improve fine-grained neighborhood representation [22,23]. Meanwhile, Transformer-based methods exploit self-attention to capture long-range dependencies and global contextual relationships in irregular point sets, providing an effective solution for large-scale scene understanding [24,25]. Another line of studies highlights the importance of network depth, training strategies, and lightweight structures for efficient point cloud semantic segmentation [26]. For railway scenes, relying solely on complex local operators may make it difficult to balance long-range linear-structure representation and large-scale point cloud processing efficiency [27]. Therefore, capturing railway micro-structures, hierarchical context, and radiometric intensity differences with low computational cost remains an important problem.
This study develops RailDLA-Net, a railway-oriented deep local aggregation framework for railway point cloud semantic segmentation. RailDLA-Net does not aim to propose a fundamentally new network paradigm. It adapts several effective components to the structural and radiometric characteristics of railway scenes. The residual local encoding module represents the fine-grained local geometry of railway components. The hierarchical structural context aggregation module combines boundary details, component-level relationships, and high-level scene semantics. The intensity-aware adaptive attention mechanism uses LiDAR intensity differences to guide local feature aggregation. A geometry–semantics collaborative objective jointly optimizes final predictions, intermediate semantic representations, and local spatial structures. This task-specific integration provides a practical framework for semantic understanding of complex railway point clouds. It also evaluates the usefulness of structural context and intensity-aware local aggregation in railway scenes.
2. Related Work
2.1. Railway Point Cloud Dataset
In recent years, advances in 3D laser scanning and deep learning have made point cloud data an important basis for 3D scene understanding. High-quality datasets are essential for developing and evaluating point cloud analysis methods [28]. Although many outdoor [29,30,31] and indoor [32,33,34] datasets have been proposed, most of them focus on general scenes and cannot fully satisfy the specific requirements of railway environments.
To address this gap, several railway point cloud datasets have been released. WHU-Railway3D [35] provides large-scale railway scenes covering urban, rural, and plateau environments, but suffers from severe class imbalance. RailPC [36] focuses on urban and mountainous railways and adopts a semi-automatic weak annotation pipeline, where a small subset is manually annotated first, and then a segmentation network is trained to annotate the remaining data, followed by manual review and correction. Rail3D [37] covers railway scenes from Hungary, France, and Belgium, supporting generalization evaluation, although its color and intensity attributes are not fully calibrated. RailPoints [38] targets sparse long-distance perception for trains, while ExpressRail [39] provides high-quality annotations for high-speed railway scenes. These datasets have promoted railway point cloud segmentation, but class imbalance, cross-scene generalization, and annotation cost remain major challenges. Detailed information is summarized in Table 1.
Table 1.
Comparison of Point Cloud Datasets for Different Railway Scenarios. “w/o I” indicates whether the intensity attribute is included in the dataset.
2.2. Point Cloud Semantic Segmentation
Point cloud semantic segmentation is a fundamental task in computer vision and has achieved significant progress with the development of deep learning [40]. PointNet [18] first enabled direct learning on unordered point clouds and laid the foundation for subsequent point-based methods. Existing deep learning methods can be broadly divided into several categories [41]. (1) MLP-based methods, such as PointNeXt [23] and PointVector [42], extract point-wise features using shared MLPs and aggregate local information through symmetric functions or vector representations. (2) Point convolution-based methods extend convolution to irregular point sets by designing local kernels or aggregation operators, with representative methods including RandLA-Net [21] and DeLA [43]. (3) Graph convolution-based methods represent point clouds as graphs and use GNNs to learn neighborhood context, such as SPH3D-GCN [44]. (4) Transformer-based methods exploit self-attention to capture long-range dependencies and global context, as seen in LitePT [24] and Point Transformer V3 [25]. (5) Mamba-based methods, including CamPoint [45] and PointSSM [46], have introduced state-space sequence modeling with linear complexity for efficient large-scale point cloud analysis.
In addition, weakly supervised methods [47,48,49,50,51] reduce annotation costs by using sparse or low-granularity labels together with label propagation and pseudo-label optimization strategies.
2.3. Existing Deep Local Aggregation Methods in 3D Point Clouds
Deep local aggregation has become an important strategy for 3D point cloud semantic segmentation. RandLA-Net [21] combines random sampling with local feature aggregation to improve the efficiency of large-scale point cloud processing. DeLA [43] designs local aggregation operators for irregular point sets and strengthens neighborhood feature representation. DeepLA-Net [26] explores very deep local aggregation networks and shows that lightweight local operators can be stacked to improve feature learning in 3D point clouds. These methods provide useful references for efficient local representation learning. The proposed RailDLA-Net follows the general idea of deep local aggregation, but adapts it to railway point cloud semantic segmentation. In RailDLA-Net, residual local encoding is used to represent fine-grained railway components. Hierarchical structural context aggregation is used to combine local details, component-level relationships, and scene-level semantics. Intensity-aware adaptive attention introduces relative LiDAR intensity differences into local aggregation. These adaptations are intended to better match the structural regularity and radiometric characteristics of railway scenes.
2.4. Point Cloud Semantic Segmentation in Railway Scenes
Railway scenes differ significantly from general urban or indoor scenes due to their long strip-like track layout, diverse line-side facilities, and severe class imbalance. These characteristics limit the direct applicability of general point cloud segmentation methods. Therefore, several studies have developed railway-specific semantic segmentation methods by incorporating railway prior knowledge and structural features. RailSeg [12] improves railway point cloud segmentation through local–global feature aggregation and contextual semantic regularization. SALAProNe [13] combines self-attention local aggregation with prototype-guided regularization for fine-grained high-speed railway segmentation and cross-scene generalization. Grandio et al. [14] improved PointNet++ with preprocessing strategies such as grid sampling, block partitioning, and data augmentation, and later introduced an image-rasterization-based filtering strategy for efficient fine-grained segmentation [38]. 3DGraphSeg [15] compresses large-scale railway point clouds into superpoint graphs and applies graph convolution for contextual segmentation. Despite these advances, existing methods still struggle to simultaneously handle the long and narrow railway layout, multi-scale railway objects, and severe class imbalance.
3. Method
3.1. Overview
Railway point clouds are characterized by a regular spatial layout. In such scenes, rails and overhead lines usually form long continuous structures, while sleepers and track-bed components appear as repeated patterns along the corridor. At the same time, many railway facilities are small and sparsely distributed, and some categories share similar local geometry. These properties make accurate segmentation dependent on both fine local representation and broader structural context. Based on this observation, RailDLA-Net is proposed as an intensity-aware deep local aggregation network for railway point cloud semantic segmentation, incorporating a railway structure-guided residual local encoding module, a hierarchical structural context aggregation module, an intensity-aware adaptive attention mechanism, and a geometry–semantics collaborative objective.
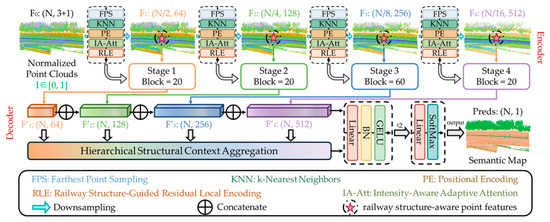
The proposed network is illustrated in Figure 1. Given an input point cloud , where is the number of points, each point is represented by its 3D coordinates and a Lidar intensity value that is normalized to using min-max normalization. Starting from , the point cloud is progressively encoded through four downsampling stages. In each stage, farthest point sampling (FPS) first reduces the point resolution, and k-Nearest Neighbors (KNN) is then used to construct local neighborhoods around the sampled points. Positional encoding (PE) describes the relative spatial layout within each neighborhood, while intensity-aware adaptive attention (IA-Att) introduces local intensity differences into feature aggregation. The railway structure-guided residual local encoding module (RLE) further aggregates and updates the neighborhood features. Through these operations, the encoder produces four multi-scale feature maps, , , , and . These feature maps serve as railway structure-aware point features, as they encode both local geometric patterns and intensity-guided neighborhood relationships. The four stages contain 20, 20, 60, and 20 RLE blocks, respectively. This design helps preserve fine railway structures while gradually expanding the receptive field for broader scene context. During the decoder stage, the four feature maps are upsampled to the original point resolution using nearest-neighbor interpolation and transformed into the restored features , , , and , respectively. These restored features are then fed into the hierarchical structural context aggregation module to integrate features from different encoding stages. The aggregated feature is then processed by the classification head to produce the final semantic label for each point.
Figure 1.
Overall architecture of the proposed RailDLA-Net for railway point cloud semantic segmentation.
3.2. Railway Structure-Guided Residual Local Encoding
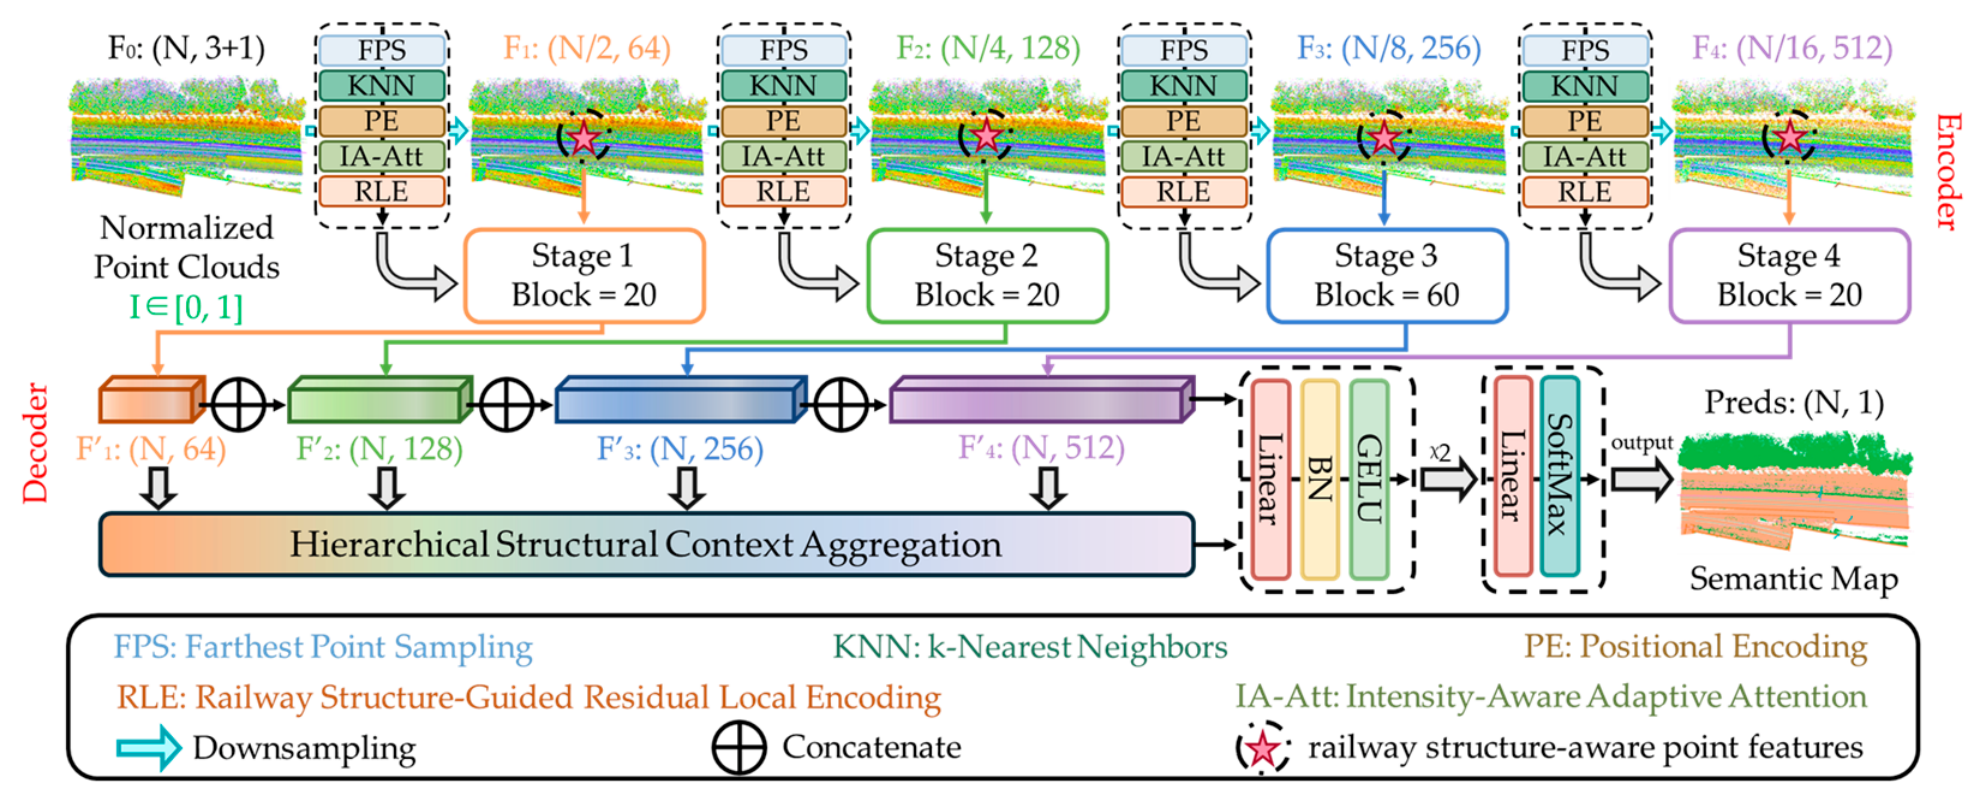
Many railway objects show clear local structural patterns. Rails usually appear as continuous linear elements, sleepers are arranged repeatedly along the track, ballast has rough local surfaces, and catenary poles form slender vertical structures. These differences are often subtle within a small neighborhood, but they are important for distinguishing railway components. Therefore, a railway structure-guided residual local encoding module is designed to enhance local geometric representation and neighborhood-relative feature learning, as shown in Figure 2.
Figure 2.
Detailed structure of the Railway Structure-Guided Residual Local Encoding module.
For the -th encoding stage, the input point feature, coordinate, and intensity are denoted as , , and , respectively. Here, denotes the number of points and denotes the feature dimension at the -th stage. As shown in Figure 2, the module first constructs local neighborhoods using coordinate-based KNN to obtain the neighborhood index . Then, the same index is shared by the feature, coordinate, and intensity branches. Based on this index, the neighboring point features, coordinates, and intensity values are gathered as grouped features , grouped coordinates , and grouped intensity , where K is the number of neighboring points. This shared grouping strategy ensures that the geometric, feature, and intensity relations are constructed over the same local neighborhood.
After neighborhood grouping, three local relation branches are built. In the feature branch, the vector feature difference is computed between the grouped neighboring features and the expanded center features :
This difference describes the local feature variation between each center point and its neighbor points .
In the coordinate branch, the relative coordinate offset is computed in the same way:
The offset tensor represents the relative spatial layout within each local neighborhood. It is then transformed into the structural positional embedding:
where denotes the positional encoding function, implemented by a linear transformation followed by batch normalization and GELU activation. It maps the 3D coordinate offset from to the stage-wise .
In the intensity branch, the relative intensity difference is calculated as:
where , denote the corresponding intensity of the center point and neighbor points . The relative intensity difference is then fed into the intensity-aware adaptive attention to generate the intensity attention embedding:
where denotes the intensity embedding function and denotes the sigmoid activation and GELU activation. This branch allows local radiometric differences to adjust the contribution of neighbor points during feature aggregation. When neighbor points have similar geometry but different intensity responses, the attention embedding can adaptively modulate their influence.
After the three branches are obtained, the vector feature difference and the structural positional embedding are first combined by element-wise summation. The intensity attention embedding is then used to modulate the combined local representation. Weighted max pooling is applied over the K neighboring points:
where denote denotes element-wise multiplication. The max-pooling operation then selects the most discriminative response from each local neighborhood, producing the local structural response .
Finally, the local structural response is used to update the center-point feature through a residual connection, followed by a feed-forward refinement network:
The FFN consists of batch normalization, linear projection, GELU activation, and another linear layer, as shown in Figure 2. This residual refinement keeps the input and output feature dimensions unchanged. The resulting is the railway structure-aware point feature of the s-th encoding stage. Through this process, local feature differences, structural positional embeddings, and intensity-guided neighborhood relationships are integrated into a unified point-wise representation. This improves the discrimination of fine railway components with similar geometry.
3.3. Hierarchical Structural Context Aggregation
Railway point clouds have a strong hierarchical structure. At the local scale, rails, sleepers, ballast, poles, and other facilities are distinguished by fine geometric details and neighborhood relationships. At a larger scale, these objects are not randomly distributed. Rails extend continuously along the corridor, sleepers appear repeatedly along the track, and poles, wires, and auxiliary facilities follow clear spatial arrangements. Therefore, reliable railway point cloud segmentation requires both local structural details and broader scene context.
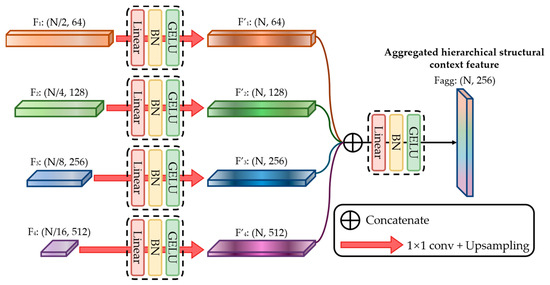
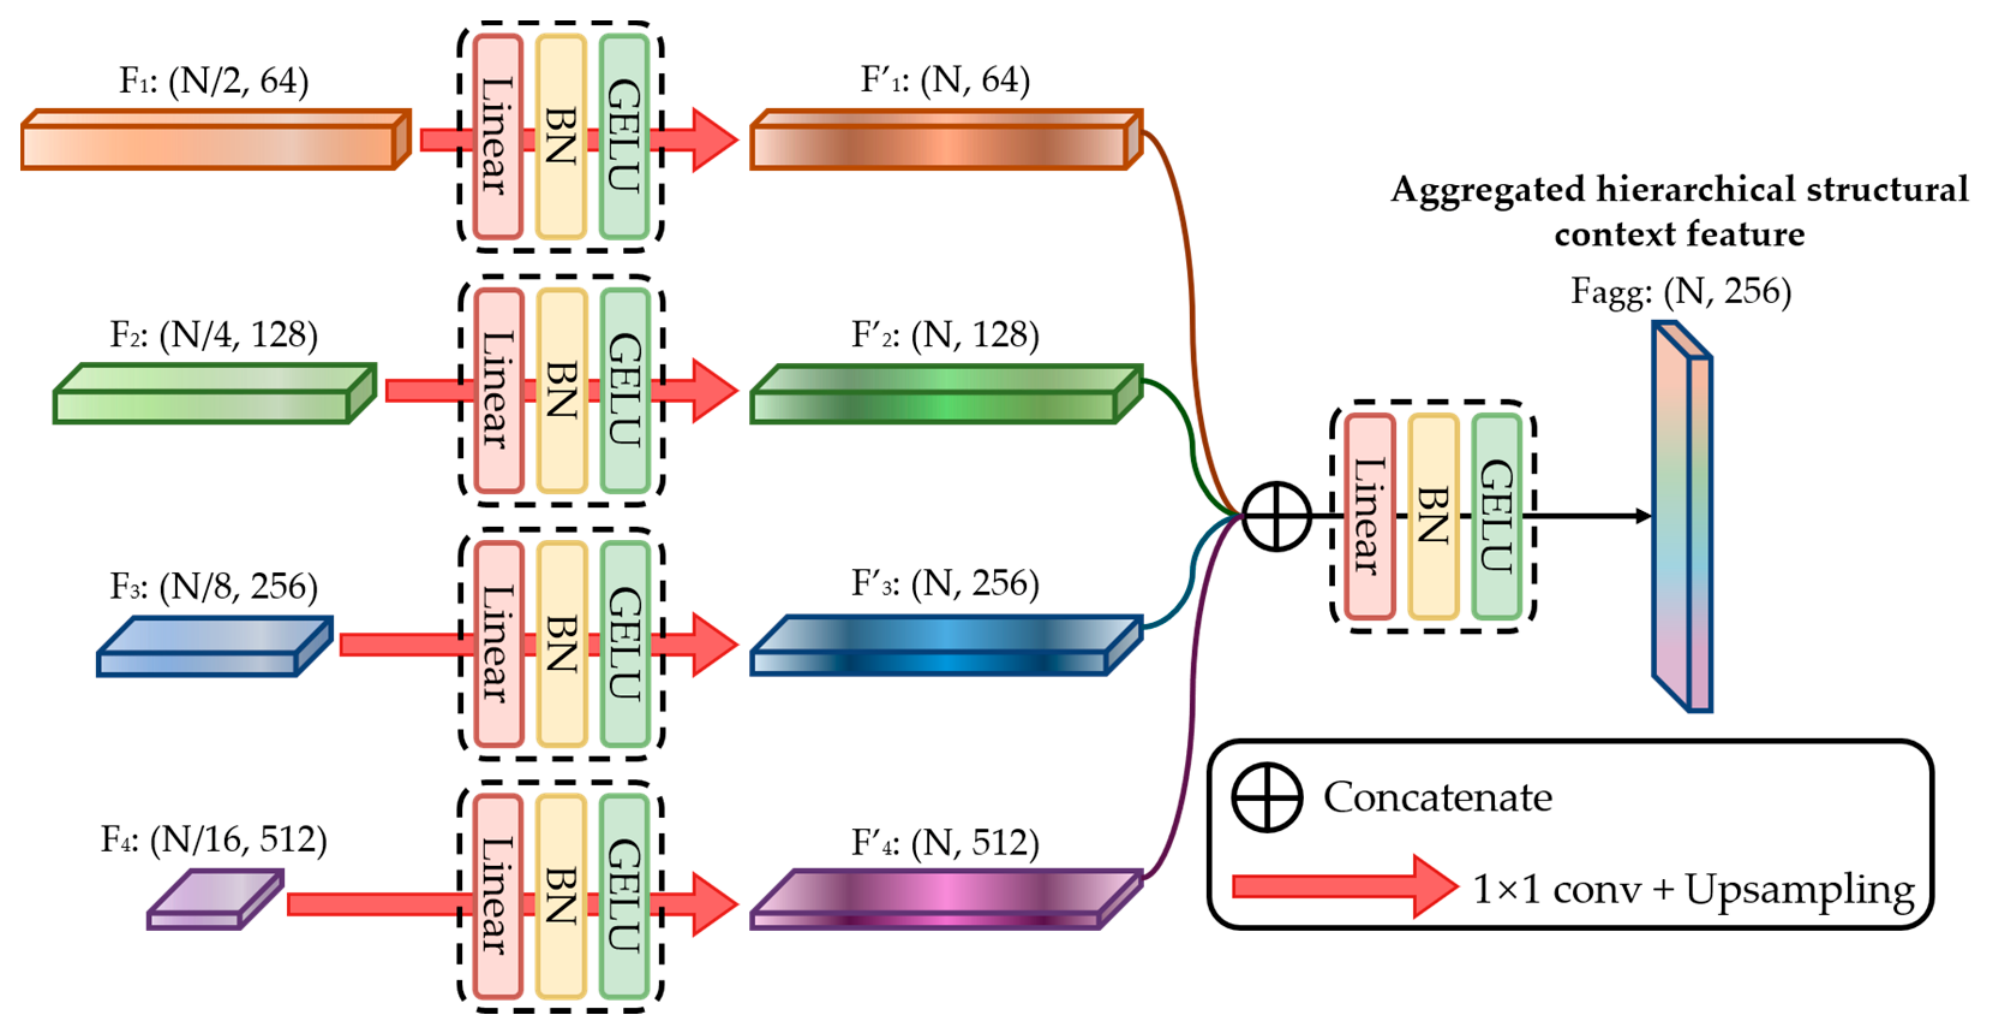
Multi-level encoder features provide complementary representations for railway scene understanding. Features from shallow stages retain higher point resolution and are effective for preserving local geometric details, such as rail edges, sleeper boundaries, and small facility contours. In contrast, features from deeper stages have larger receptive fields, which helps represent the continuity of the railway corridor and the spatial relationships among trackside objects. Relying only on shallow features limits the representation of high-level semantic context, while using only deep features may weaken fine-grained railway structures due to progressive resolution reduction. Therefore, the hierarchical structural context aggregation (HSCA) module is introduced to integrate features from different encoding stages, as shown in Figure 3.
Figure 3.
Structure of the Hierarchical Structural Context Aggregation module. GELU denotes the Gaussian Error Linear Unit activation function.
The encoder produces four railway structure-aware feature maps: , , , and . These features have different point resolutions and channel dimensions. In HSCA, each feature map is first processed by a convolutional projection implemented by a Linear-BN-GELU block. This operation adjusts the channel representation of each scale before resolution recovery. The projected features are then upsampled to the original point resolution :
where denotes the Linear-BN-GELU projection, and denotes the upsampling operation implemented by nearest-neighbor interpolation, which restores each projected feature map from the downsampled point set to the original point set by assigning each original point the feature of its nearest point in the corresponding downsampled set. After projection and upsampling, the restored multi-scale features are denoted as , , , and . Because all four features have been restored to the same point number , they can be aligned point by point. The four restored features are then concatenated along the channel dimension:
This concatenated feature contains structural information from all encoding levels. The shallow part provides detailed geometric boundaries, while the deeper part provides larger-scale semantic context. To fuse these heterogeneous features, is further processed by another Linear-BN-GELU block:
This operation transforms the concatenated feature into the aggregated hierarchical structural context , which serves as a unified point-wise representation of multi-level structural context. This output provides the decoder with integrated features that combine fine geometric details from shallow stages and broader railway-scene context from deeper stages.
3.4. Intensity-Aware Adaptive Attention
LiDAR intensity provides radiometric information that complements the geometric representation of railway point clouds. In railway scenes, several categories are close to each other in space and may also show similar local geometry. For example, rails, sleepers, ballast, metallic facilities, vegetation, and ground can appear in adjacent neighborhoods, but their surface materials and reflectance responses are different. If local aggregation relies only on geometric offsets and feature differences, such radiometric distinctions may not be fully used. Therefore, intensity-aware adaptive attention (IA-Att) is introduced to guide the neighborhood aggregation process.
The IA-Att module follows the shared-neighborhood design described in Section 3.2. The same KNN index is used for the feature, coordinate, and intensity branches, so the intensity relationship is computed over exactly the same local neighborhood as the geometric and feature relationships. For each center point and its neighboring points, the relative intensity difference has been defined in Equation (4), and the corresponding intensity attention embedding has been obtained in Equation (5).
During local aggregation, is used as a neighborhood-level modulation weight. Since its channel dimension is 1, it is broadcast along the feature dimension to match the combined local representation . The modulated local response is then obtained through the weighted max-pooling operation in Equation (6). In this way, the intensity branch does not replace geometric encoding. Instead, it adjusts the contribution of each neighboring point before pooling, while the local structure is still described by the vector feature difference and the structural positional embedding.
This design has two advantages for railway point cloud segmentation. First, relative intensity differences describe local radiometric contrast within a neighborhood, which is more suitable than using absolute intensity alone because LiDAR intensity can be affected by scanning distance, incidence angle, and local acquisition conditions. Second, the attention embedding provides an adaptive weighting mechanism for neighboring points. When neighboring points have similar geometric layout but different intensity responses, their influence can be adjusted during aggregation. This is useful for distinguishing categories such as rail and ballast, sleeper and track bed, or metallic facilities and vegetation.
The output of IA-Att is therefore a set of intensity-guided neighborhood weights, rather than an independent semantic feature. These weights are integrated into the RLE module through Equation (6), and the resulting local structural response is further refined by the residual update in Equation (7). By embedding intensity information into local aggregation, RailDLA-Net can use both structural and radiometric cues while keeping the feature dimensions consistent with the encoder stage.
3.5. Loss Function
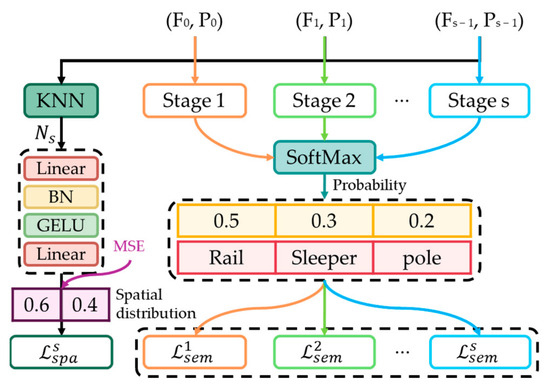
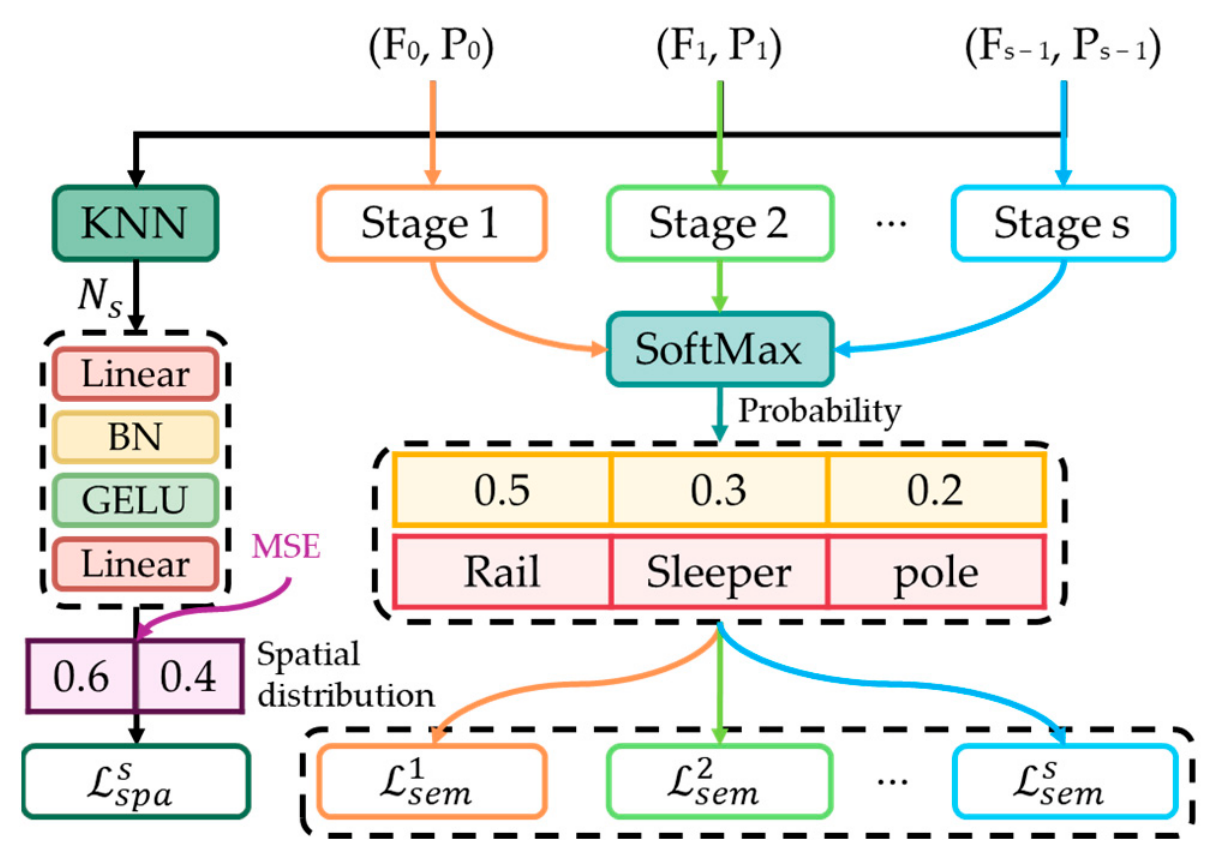
The category distribution of railway point clouds is usually highly imbalanced, where large background categories dominate the point number, while key facility categories are sparse and elongated. If only the final classification loss is used for supervision, the model tends to favor majority classes such as ground, vegetation, and ballast, weakening its ability to recognize rails, sleepers, and poles. To this end, this study constructs a geometry–semantics collaborative optimization objective to jointly constrain final predictions, intermediate semantic representations, and local spatial structures, as illustrated in Figure 4.
Figure 4.
Geometry–semantics collaborative optimization strategy for RailDLA-Net.
First, class-weighted cross-entropy is adopted as the main segmentation loss.
where denotes the number of classes, denotes the class weight of class , and , denote the ground-truth label and predicted probability, respectively. The class weights are determined according to class frequencies in the training set to increase the optimization contribution of minority railway facility classes.
Second, to improve the trainability of the deep network, auxiliary semantic supervision is introduced at multiple encoding stages. The output feature of each stage is mapped into the category probability space and supervised by cross-entropy loss with the ground-truth labels at the corresponding scale.
where denotes the number of encoding stages involved in auxiliary supervision, and denotes the semantic supervision loss at the -th stage. This design encourages intermediate features to acquire category-discriminative ability earlier and reduces the attenuation of small-object semantic information during deep propagation.
Third, to preserve railway linear structures and local geometric relationships, this study introduces a spatial distribution constraint. This constraint requires relative relationships in the feature space to be consistent with neighborhood displacements in the real 3D space:
where and denote the features of the center point and its neighboring point at the s-th stage, respectively; denote their 3D coordinates; denotes the number of points at the s-th stage; and K denotes the number of neighboring points. The function is constructed by two linear layers with Batch Normalization and GELU activation, following the mapping:
Therefore, and have the same dimension as the coordinate displacement , which makes the two relation terms compatible in Equation (13). The coefficient is a stage-specific scale normalization factor used to normalize coordinate displacements at different resolutions. In the four-stage encoder, it is set to , corresponding to stages 1 to 4, respectively.
The spatial distribution constraint guides the network to learn feature distributions consistent with real railway geometric structures, which is particularly beneficial for preserving the structural continuity of rails, sleepers, and catenary facilities.
Finally, the overall loss function is defined as:
In the early training stage, larger auxiliary-supervision weights provide stable optimization directions for the deep network. As training proceeds, the auxiliary-supervision weights gradually decrease, allowing the model to focus more on the final point-wise semantic prediction.
Through the collaboration of main segmentation supervision, hierarchical semantic supervision, and spatial distribution supervision, RailDLA-Net achieves more stable and fine-grained semantic segmentation in complex railway point cloud scenes.
4. Results and Analysis
4.1. Implementation Details
In this section, we evaluate the performance of RailDLA-Net on the Rail3D [37] and WHU-Railway3D [35] datasets. For the Rail3D dataset, the training, validation, and testing sets were divided at a ratio of 13:6:6. For the WHU-Railway3D dataset, the corresponding ratio was 3:1:1. The datasets were first partitioned at the scene level, and the raw LiDAR intensity values of each scene were then normalized to [0, 1] using min-max normalization.
All experiments were conducted on an NVIDIA® GeForce RTX™ 5090 D GPU (NVIDIA Corporation, Santa Clara, CA, USA) machine using PyTorch (version 2.7.0) framework and CUDA acceleration (version 12.9). For the network configuration, RailDLA-Net contains four encoding stages. The feature dimensions of the four stages were set to 64, 128, 256, and 512, respectively. The corresponding numbers of residual local encoding blocks were set to 20, 20, 60, and 20. In each stage, KNN was used to construct local neighborhoods, and the number of neighboring points was set to K = 24. The grid sizes of the four stages were set to 0.08, 0.16, 0.32, and 0.64, respectively, and the maximum number of input points was set to 60,000. In the feature projection, positional embedding, intensity-aware attention, and feed-forward layers, Batch Normalization was used as the normalization layer, and GELU was used as the activation function. The model was optimized using the AdamW optimizer with an initial learning rate of . A cosine learning rate decay strategy was adopted during training after 10 warm-up epochs, and the learning rate was gradually reduced until convergence. The batch size was set to 8, and the network was trained for 100 epochs.
To quantitatively analyze the performance of the proposed architecture, overall accuracy (OA), mean Accuracy (mAcc), per-class intersection over union (IoUs), and mean IoU (mIoU) are used as evaluation metrics as follows:
where denotes the number of true positive samples, denotes the number of false positive samples, denotes the number of false negative samples, denotes the -th semantic class, denotes the number of total semantic classes and denotes the number of total points.
4.2. Experiment Results
Table 2 presents the quantitative results on the Rail3D dataset. RailDLA-Net achieves the competitive performance, with 96.89% OA, 91.92% mAcc, and 88.44% mIoU. Compared with Point Transformer V3, RailDLA-Net improves mAcc and mIoU by 1.77 and 0.90 percentage points, respectively. The relatively small mIoU margin may be related to the competitive performance of Point Transformer V3 and the relatively regular scene structure of Rail3D. Under this setting, RailDLA-Net obtains a slightly higher mAcc and comparable overall segmentation performance. Compared with DeepLA-Net, RailDLA-Net improves mIoU from 70.89% to 88.44%, indicating that the railway-oriented design contributes to the overall segmentation performance. However, Table 2 also shows that RailDLA-Net does not achieve the best IoU for every semantic category. This may be related to the different feature preferences of different methods and the large variations among railway-scene categories in geometric scale, point density, spatial continuity, and contextual dependency. For example, Point Transformer V3 obtains higher IoU values for poles, wires, signaling, fence, and building, while CamPoint performs better on ground and vegetation. In contrast, RailDLA-Net achieves the highest mAcc and mIoU among the compared methods and obtains the best IoU for installation, a sparse and challenging railway-related category. Therefore, these results support the conclusion mainly from the perspective of overall segmentation performance and category-level balance, rather than absolute superiority in each individual category.
Table 2.
Quantitative results on the Rail3D dataset. Bold values indicate the best results achieved by RailDLA-Net.
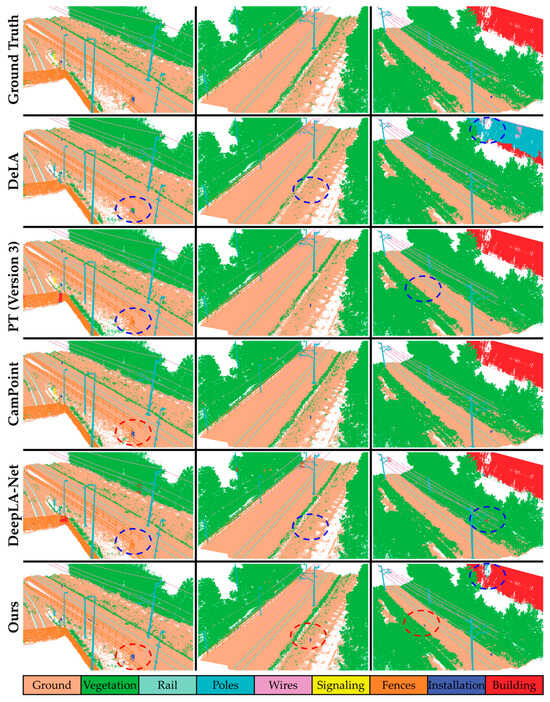
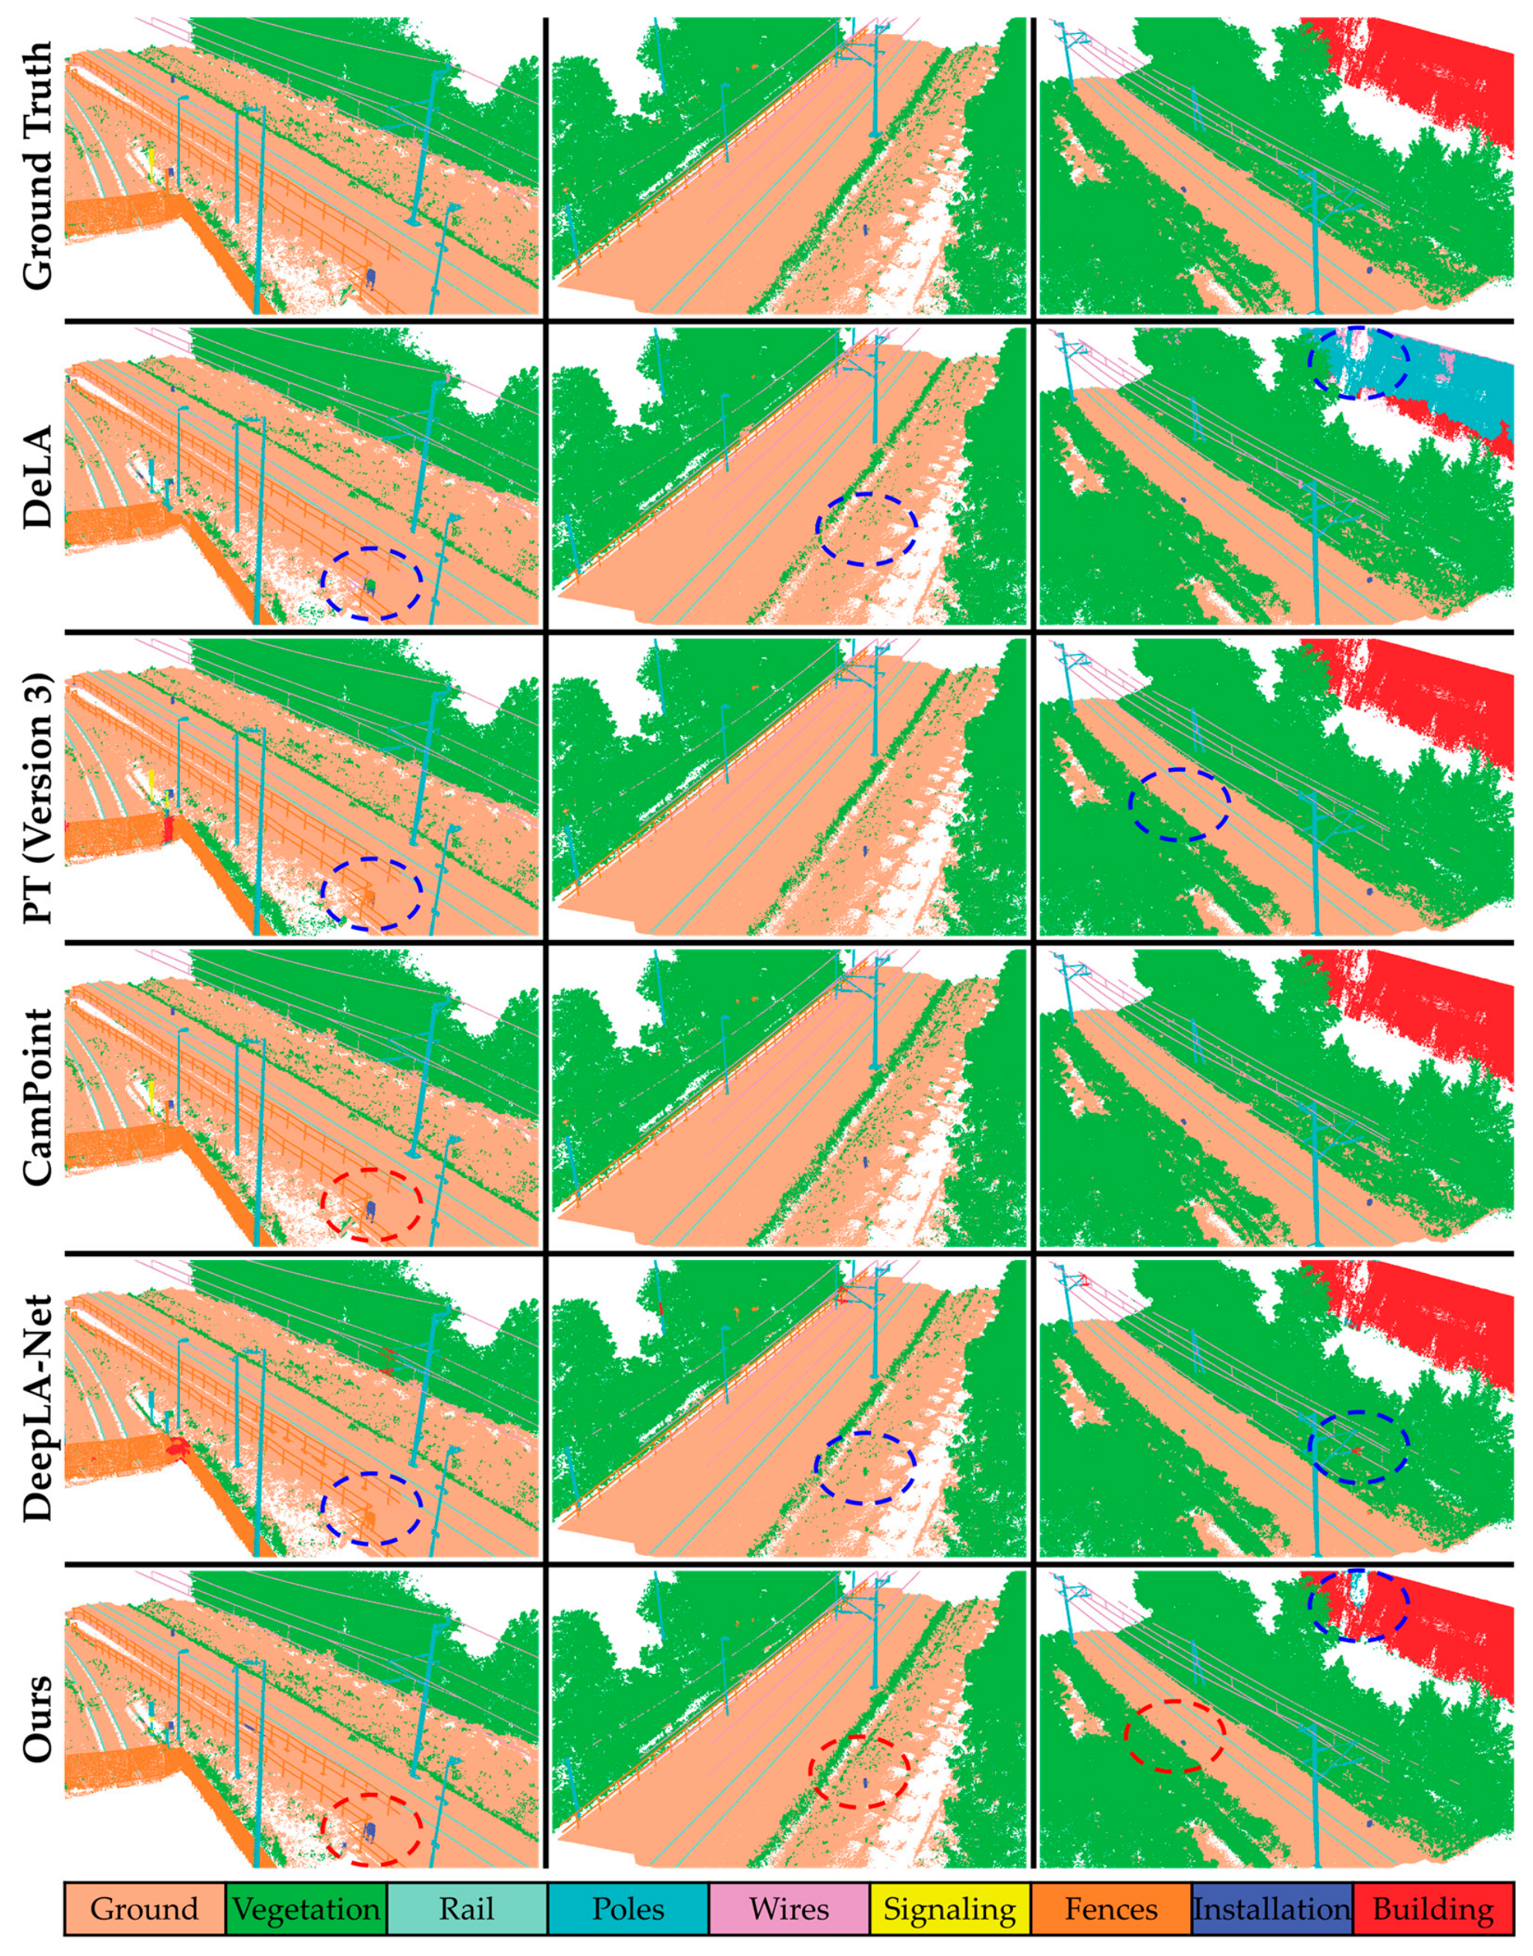
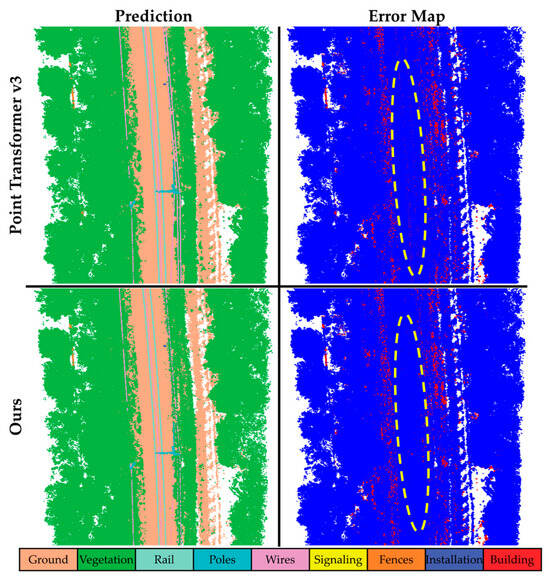
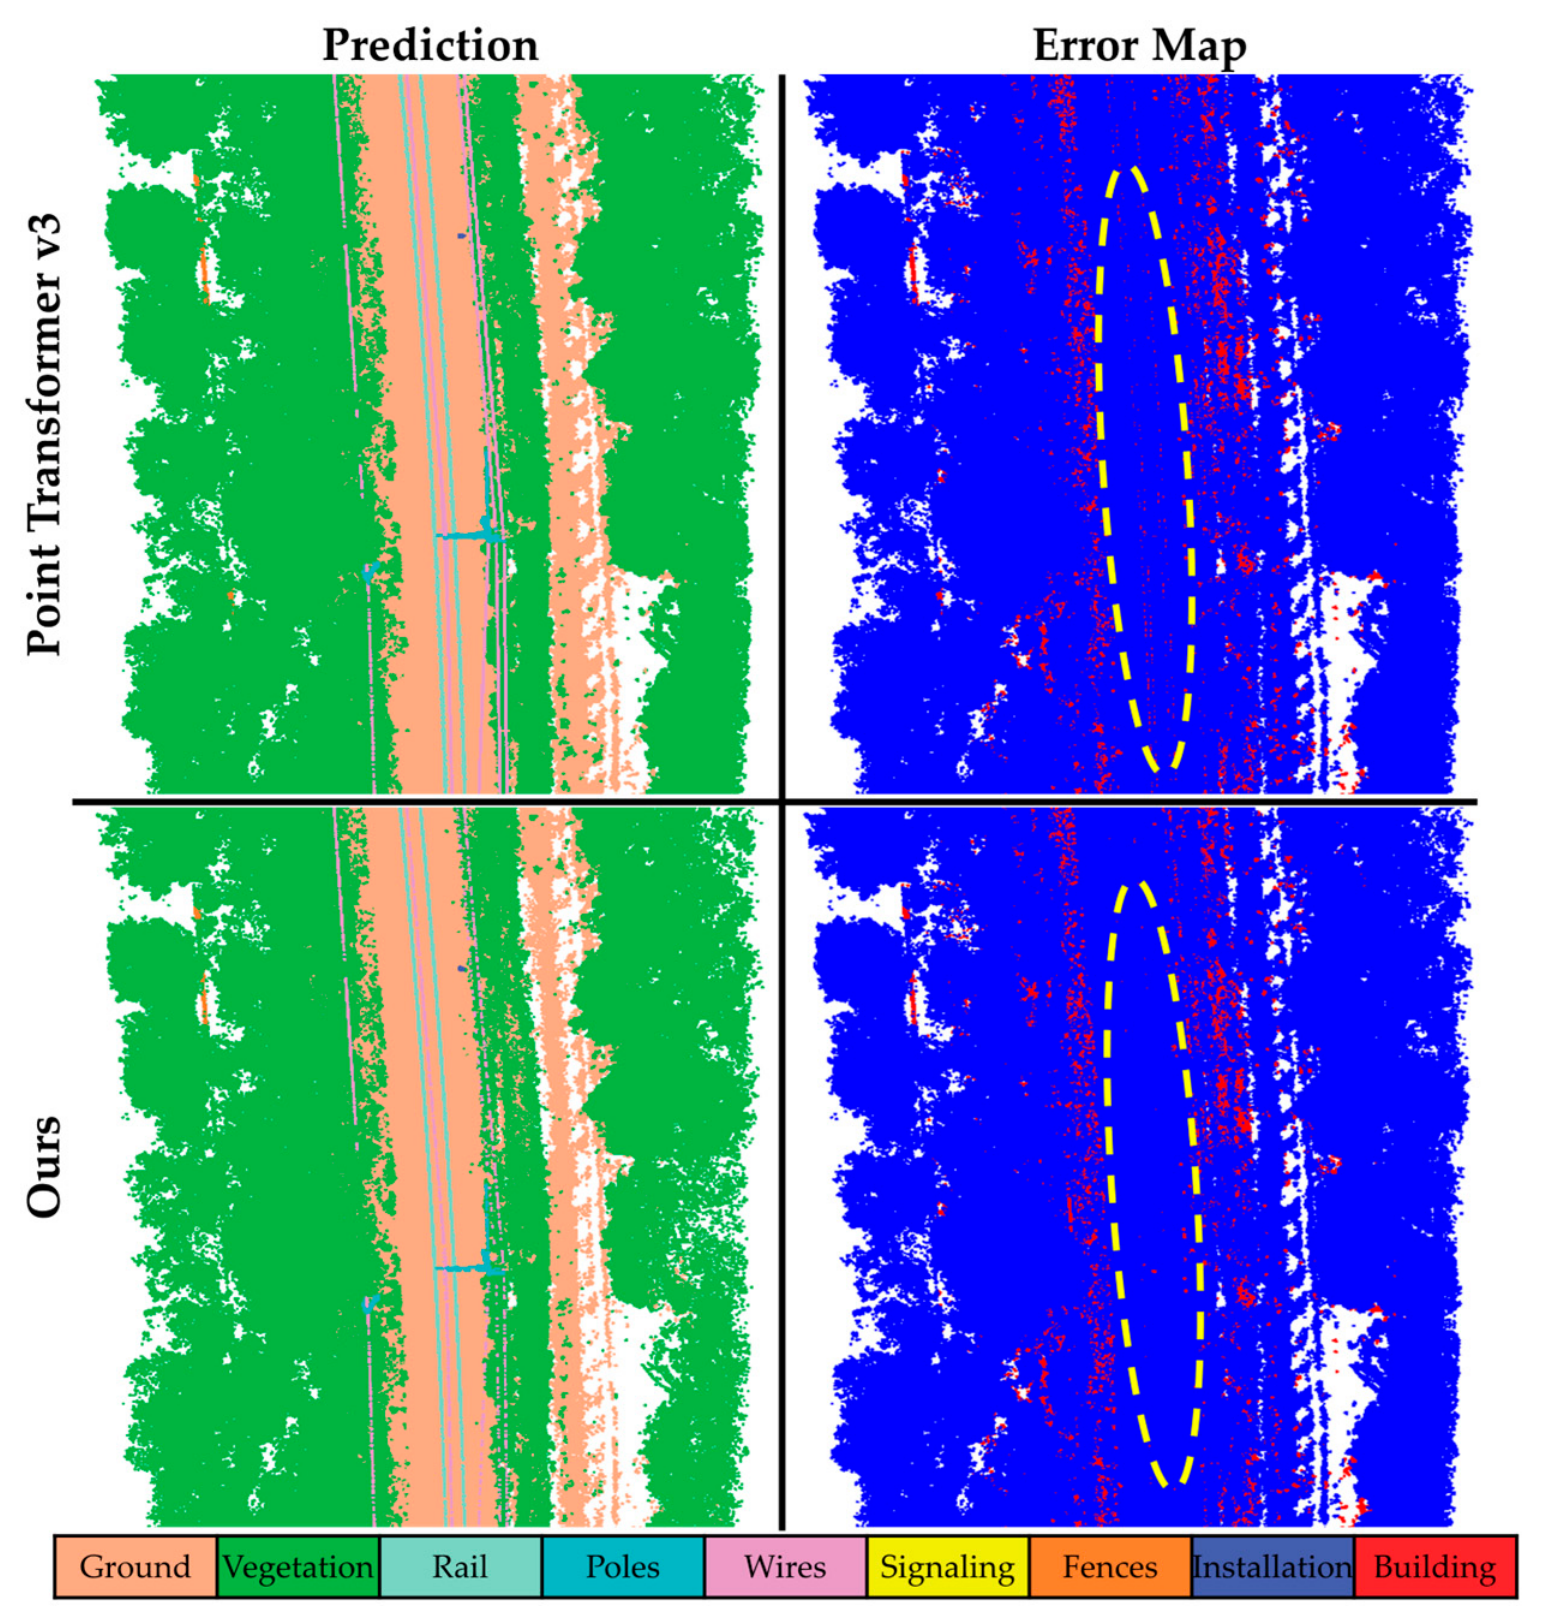
To further evaluate the visual performance, Figure 5 presents qualitative comparisons between RailDLA-Net and the compared methods on representative Rail3D scenes. The results show that all methods can identify the main components in railway scenes, including ground, vegetation, rails, poles, and wires. In the highlighted regions, several compared methods produce fragmented predictions or local confusion near the boundaries between vegetation and ground, as well as around railway facilities. RailDLA-Net gives more continuous predictions for rails, poles, and installation objects, and reduces local misclassification in these areas. Figure 6 compares the error maps of RailDLA-Net and Point Transformer V3, which achieves the best mIoU among the compared methods in Table 2. The highlighted regions show fewer misclassified points along the railway corridor and adjacent background areas in the result of RailDLA-Net. However, errors remain near object boundaries and sparse facilities, indicating that detailed segmentation in railway scenes still requires further improvement.
Figure 5.
Qualitative results on the Rail3D dataset. The blue circles indicate misclassified regions of RailDLA-Net, while the red circles indicate correctly classified regions. “PT” indicates the abbreviation of “Point Transformer”.
Figure 6.
Visual comparison of segmentation error maps on the Rail3D dataset. Red points indicate misclassified regions, while blue points indicate correctly classified regions. The yellow dashed circles highlight regions near the railway tracks, where our method produces fewer misclassified points than the Point Transformer V3 method.
Table 3 reports the quantitative results on the WHU-Railway3D dataset. RailDLA-Net achieves the highest mAcc and mIoU, reaching 91.84% and 83.63%, respectively. Compared with Point Transformer V3, RailDLA-Net improves mAcc and mIoU by 5.26 and 3.47 percentage points, while its OA is 1.38 percentage points lower. This indicates that RailDLA-Net performs better in terms of average category accuracy, whereas Point Transformer V3 has higher overall point-wise accuracy. For class-wise IoU, RailDLA-Net obtains the best results on masts, support devices, building, and others, while Point Transformer V3 performs better on several linear structures and large background classes. These results show that RailDLA-Net improves average category performance on WHU-Railway3D, but further improvement is still needed for some individual categories.
Table 3.
Quantitative results on the WHU-Railway3D dataset. Bold values indicate the best results achieved by RailDLA-Net.
The difference in improvement margins between Rail3D and WHU-Railway3D can be mainly explained by dataset characteristics and baseline performance. On Rail3D, Point Transformer V3 already performs well on several categories, so the improvement space for RailDLA-Net is relatively limited. The gain in Table 2 is therefore mainly reflected in overall category balance. In contrast, WHU-Railway3D contains more categories, denser railway facilities, and stronger similarity between adjacent components, which makes category discrimination more difficult. As shown in Table 3, RailDLA-Net brings clearer improvements for structure-dependent and context-related classes, such as masts, support devices, building, and others, which contributes to the larger gains in mAcc and mIoU.
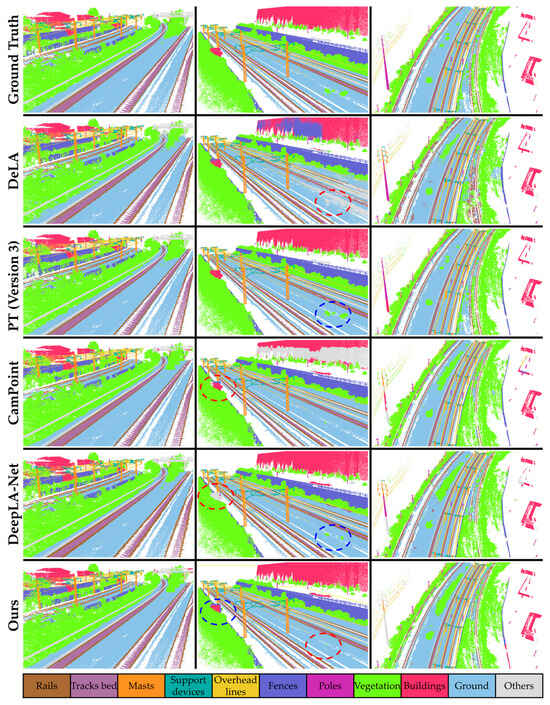
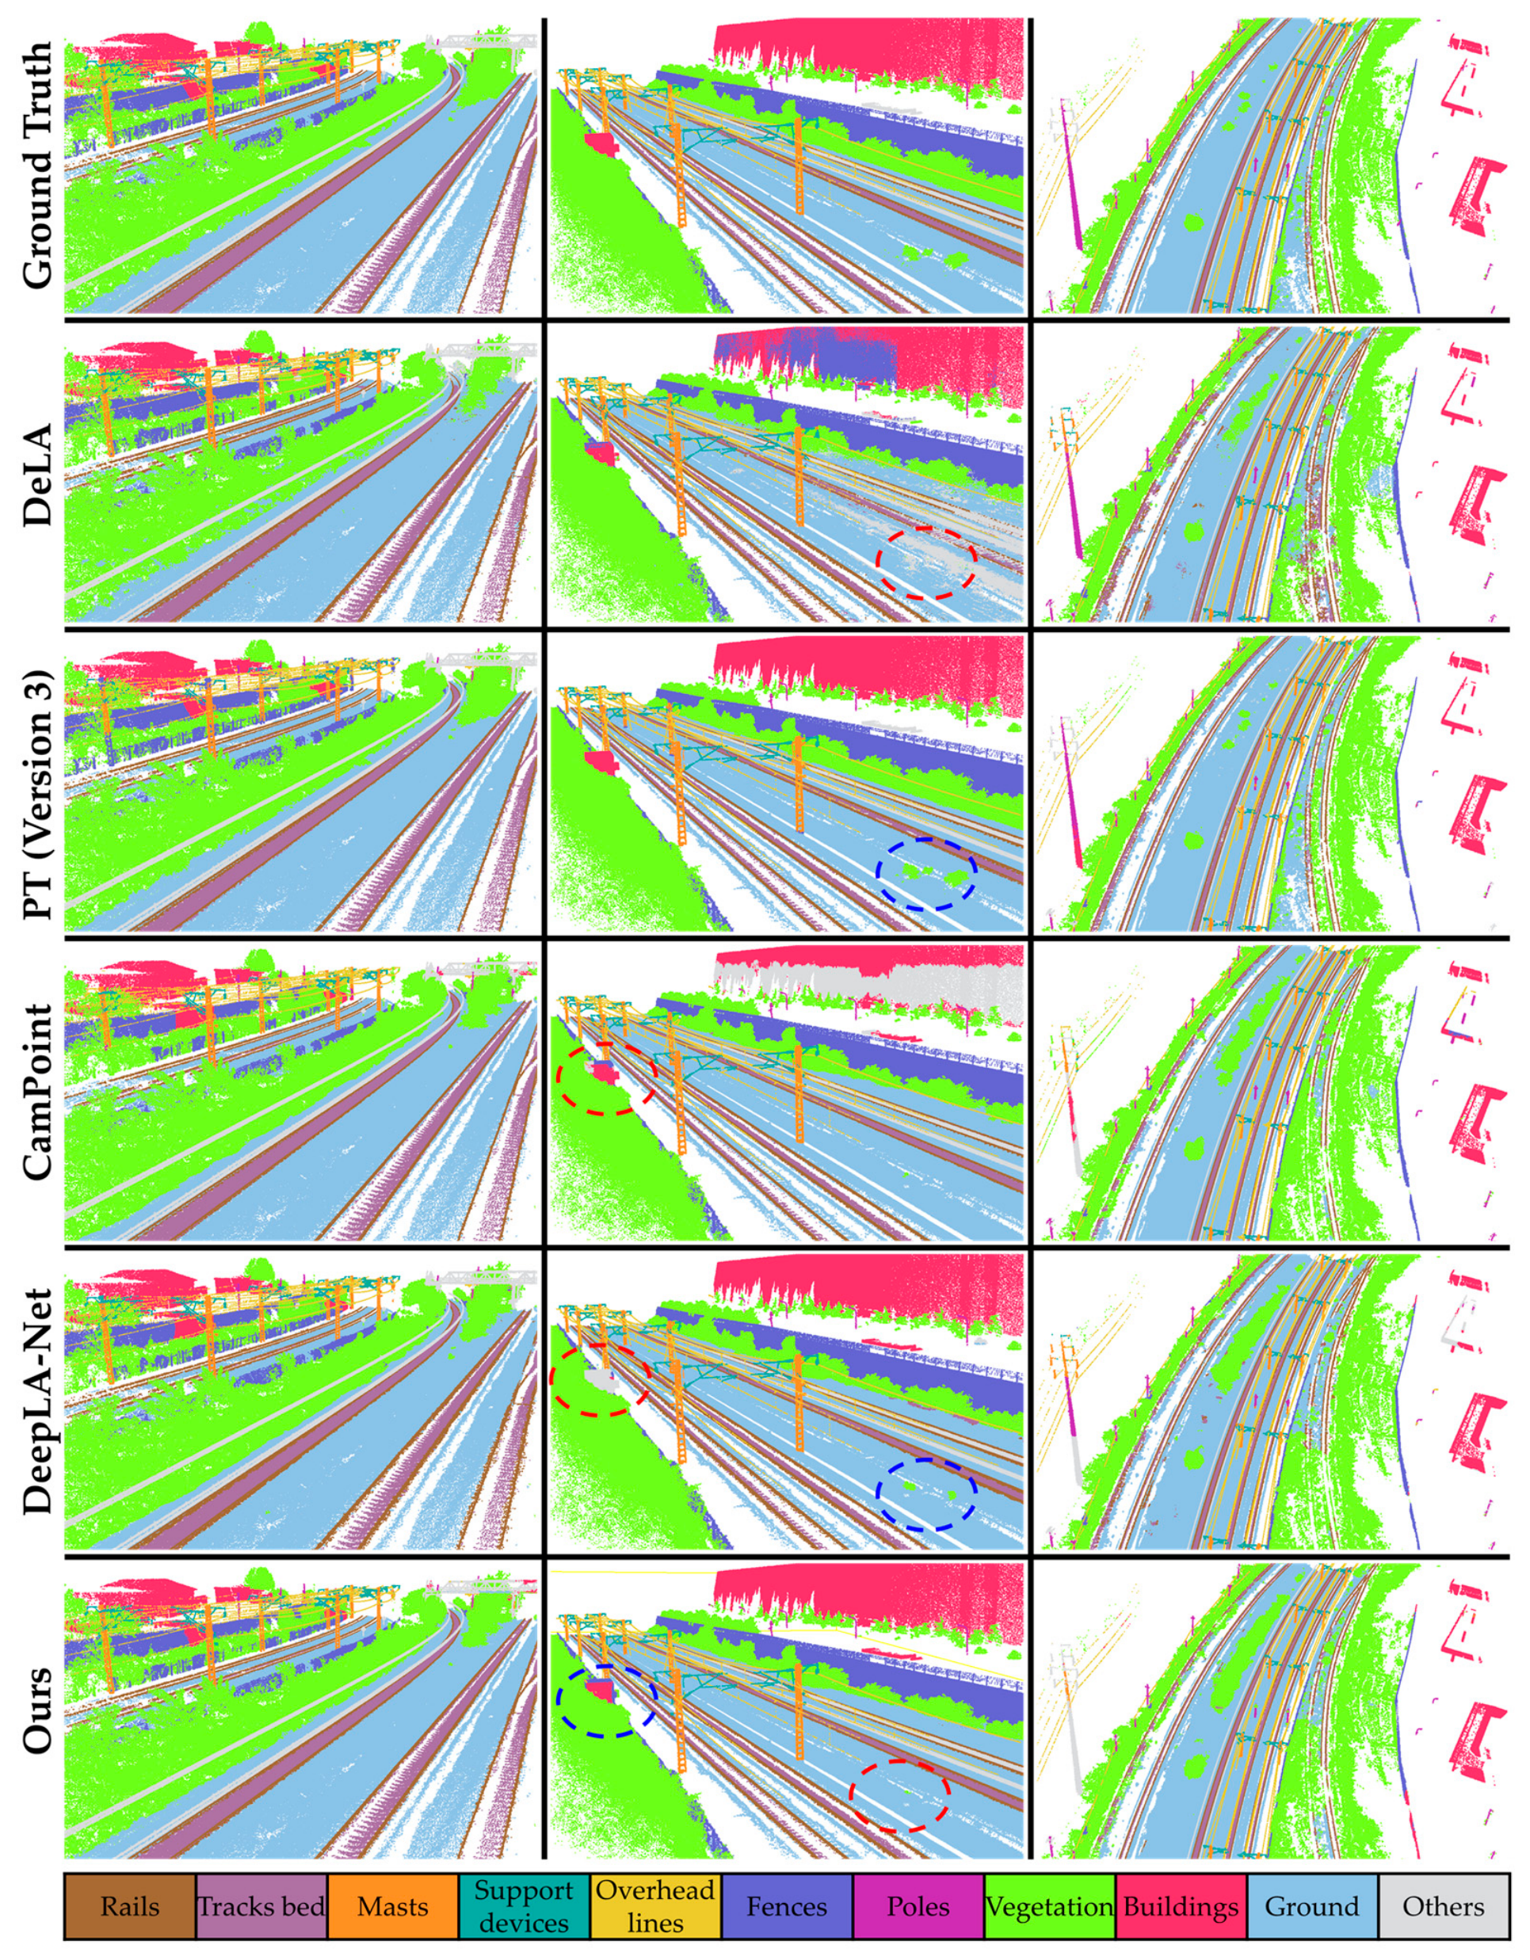
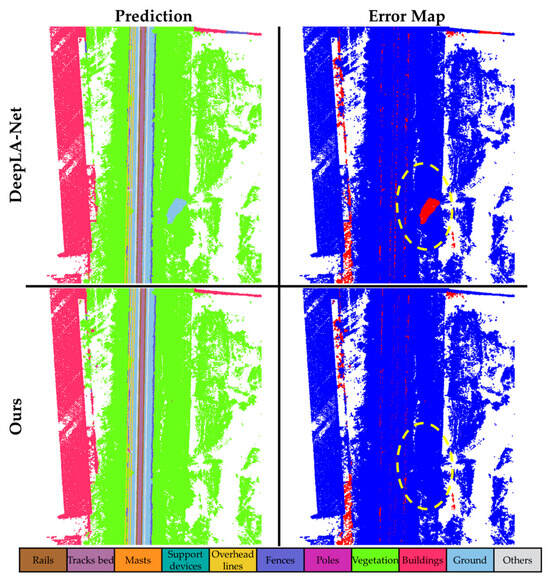
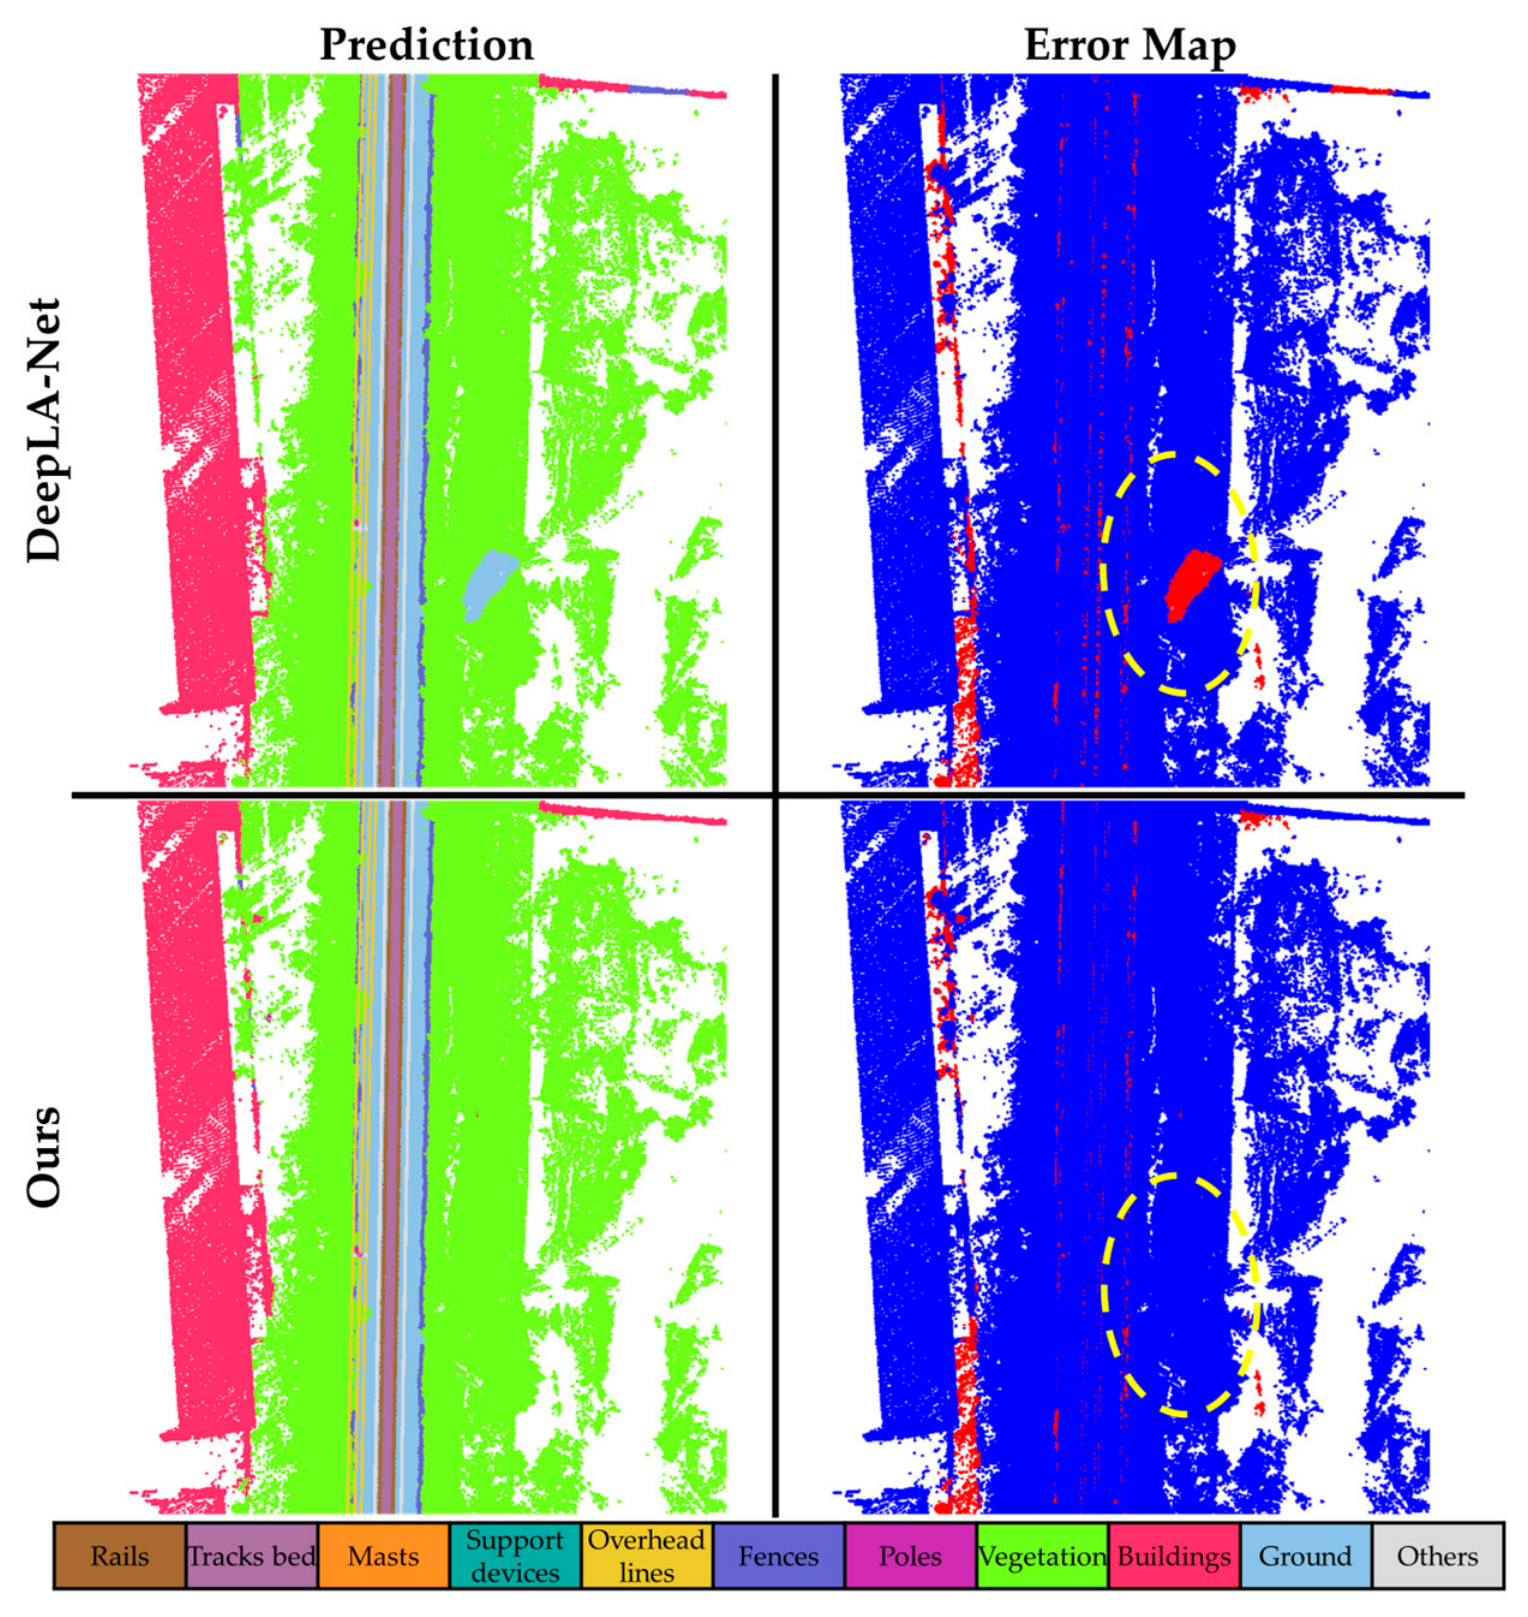
Figure 7 presents qualitative results on the WHU-Railway3D dataset. Compared with Rail3D, WHU-Railway3D contains more semantic categories and denser railway facilities, including track bed, masts, support devices, overhead lines, fences, and poles. In these complex scenes, several compared methods show confusion among adjacent railway facilities or miss small structures around the track area. RailDLA-Net gives clearer predictions for masts, support devices, and surrounding background objects, which is consistent with its higher IoU values for these categories in Table 3. Figure 8 further compares the error maps of RailDLA-Net and Point Transformer V3. The result of RailDLA-Net contains fewer errors in the highlighted facility region, while Point Transformer V3 still shows lower error density in some large background areas. This visual comparison indicates that RailDLA-Net performs better on several facility categories in WHU-Railway3D, but its predictions for long linear objects and large background regions still require further improvement.
Figure 7.
Qualitative results on the WHU-Railway3D dataset. The blue circles indicate misclassified regions of RailDLA-Net, while the red circles indicate correctly classified regions. “PT” indicates the abbreviation of “Point Transformer”.
Figure 8.
Visual comparison of segmentation error maps on the WHU-Railway3D dataset. Red points indicate misclassified regions, while blue points indicate correctly classified regions. The yellow dashed circles highlight building points that are correctly classified by our method.
4.3. Ablation Studies
In this subsection, a series of ablation experiments were conducted to evaluate the effects of key parameter settings and loss components on the performance of RailDLA-Net.
Table 4 investigates the effect of grid size. The grid size of 0.08 achieves the best mIoU of 88.44%, indicating a better balance between preserving railway geometric details and reducing redundant local noise. A smaller grid size retains more points but may introduce redundancy, while a larger grid size may lose fine structural information.
Table 4.
Effect of grid size on the performance of RailDLA-Net.
As shown in Table 5, the neighborhood size K has a clear influence on segmentation performance. When K = 16, the neighborhood range is relatively limited, and the model achieves 70.02% mIoU. Increasing K to 20 improves the mIoU to 79.33%, indicating that a larger neighborhood helps capture more stable local geometric patterns. The best performance is obtained when K = 24, with 96.89% OA, 91.92% mAcc, and 88.44% mIoU. When K is further increased to 28, the mIoU decreases to 73.45%. This may be because an overly large neighborhood introduces points from adjacent semantic categories, especially around boundaries between rails, sleepers, ballast, and ground. Therefore, K = 24 is used as the default neighborhood size in this study.
Table 5.
Sensitivity analysis of neighborhood size K on Rail3D.
Table 6 compares different architecture scales. The Large architecture obtains the best performance, with 91.92% mAcc and 88.44% mIoU. This result shows that sufficient network capacity is important for capturing complex railway structures and high-level semantic context.
Table 6.
Effect of architecture scale on the performance of RailDLA-Net, where the Small, Middle, and Large architectures are defined by the numbers of blocks as 0, [10, 10, 30, 10], and [20, 20, 60, 20], respectively.
Table 7 evaluates the influence of the maximum number of input points. The performance improves as the number increases from 30,000 to 60,000, while further increasing it to 75,000 reduces mAcc and mIoU. This suggests that 60,000 points provide a suitable trade-off between structural information preservation and redundant background interference.
Table 7.
Effect of the maximum number of input points on the performance of RailDLA-Net.
Table 8 analyzes the contribution of different loss terms in the proposed optimization design. Using only the main segmentation loss provides a baseline mIoU of 85.68%. After adding , the mIoU increases to 87.84%, suggesting that hierarchical semantic supervision is helpful for learning multi-level semantic representations. When is used without , the mIoU decreases to 72.96%, indicating that spatial distribution supervision may be less effective when it is not supported by sufficient semantic guidance. By combining the main segmentation loss, , and , the model achieves the highest mIoU of 88.44%. These results suggest that semantic auxiliary supervision and spatial distribution supervision can work complementarily in the proposed optimization design.
Table 8.
Ablation study of different loss components in RailDLA-Net.
4.4. Cross-Scene Generalization
To evaluate the cross-scene transferability of different methods, we conduct generalization experiments on the Rail3D dataset. Specifically, all methods are trained on the Hungary scene and directly tested on the France scene, without using any France data during training. The quantitative results are reported in Table 9.
Table 9.
Quantitative results of cross-scene generalization from the Hungary scene to the France scene on the Rail3D dataset.
As shown in Table 9, the proposed method achieves the highest mIoU of 46.60% in this setting. Compared with DeLA, DeepLA-Net, CamPoint, and Point Transformer V3, the mIoU is improved by 4.74%, 5.73%, 12.23%, and 23.64%, respectively. Although DeLA obtains a slightly higher OA, its lower mIoU suggests that the result may be influenced by dominant classes with large spatial coverage. In contrast, RailDLA-Net shows relatively balanced performance across categories, especially on railway objects such as poles, wires, and signaling. For the signaling class, RailDLA-Net obtains an IoU of 35.86%, while the compared methods achieve lower or zero IoU. These results suggest that RailDLA-Net can retain useful semantic discrimination when transferred to another scene. Since this experiment is also conducted on Rail3D, it provides supplementary evidence for the effectiveness of RailDLA-Net on Rail3D beyond the standard fixed split evaluation in Table 2. However, all methods still obtain zero IoU on several categories, including fence, installation, and building, indicating that generalization for sparse or scene specific categories remains difficult.
5. Discussion
The experiments on the Rail3D dataset show that RailDLA-Net achieves competitive segmentation accuracy for railway point clouds, especially in terms of mAcc and mIoU. However, accuracy alone is not enough for practical railway applications. The network has a deep architecture, which creates challenges for industrial deployment and large-scale processing of MLS data along long railway corridors. Therefore, besides segmentation accuracy, we also evaluated the efficiency of RailDLA-Net on Rail3D dataset, including parameter size, FLOPs, inference speed, and memory usage. The results are listed in Table 10.
Table 10.
Comparison of model complexity and inference efficiency. “M” indicates Million.
As shown in Table 10, RailDLA-Net has 33.36 M parameters, requires 45.20 G FLOPs, processes 0.42 M points per second, and uses 15 G memory. Combined with the segmentation results in Table 2, these results show that RailDLA-Net achieves a reasonable balance between segmentation accuracy and model complexity on Rail3D. Compared with lightweight methods such as DeLA and CamPoint, RailDLA-Net requires more computation but obtains higher mAcc and mIoU, indicating that the deeper local aggregation design is beneficial for railway point cloud representation. Compared with Point Transformer V3, RailDLA-Net uses fewer parameters and achieves a slightly higher inference speed, while maintaining competitive segmentation performance. This suggests that the proposed framework does not simply increase model size, but uses a deep local aggregation structure to strengthen the representation of railway geometric details, component relationships, and scene context.
From the perspective of practical applications, RailDLA-Net is more suitable for offline railway point cloud analysis, high precision semantic mapping, infrastructure inventory, and inspection tasks, where segmentation quality is often more important than strict real-time inference. The method may be less suitable for onboard or real-time perception systems because its deep architecture still introduces relatively high FLOPs and memory consumption. For large-scale MLS data along railway corridors, partition-based inference can be used to reduce memory pressure during processing. Future work will focus on reducing computational cost through lightweight aggregation, efficient neighborhood search, dynamic point sampling, sparse computation, and model compression, while preserving the ability to model railway structures and contextual relationships.
6. Conclusions
This study proposed RailDLA-Net, an intensity-aware deep local aggregation framework for railway point cloud semantic segmentation. The framework combines railway structure-guided residual local encoding, hierarchical structural context aggregation, intensity-aware adaptive attention, and a geometry–semantics collaborative objective. These components are used to improve the representation of railway structures, local context, category imbalance, and use of LiDAR intensity. Experiments on Rail3D and WHU-Railway3D showed that RailDLA-Net achieved competitive segmentation results under different railway scene conditions, with 96.89% OA, 91.92% mAcc, and 88.44% mIoU on Rail3D, and 92.36% OA, 91.84% mAcc, and 83.63% mIoU on WHU-Railway3D. The ablation studies confirmed the contribution of the main parameter settings and loss components to the final performance. The cross-scene experiment further showed that RailDLA-Net retained useful segmentation ability under scene transfer, indicating its potential for broader railway scene analysis. Considering its computational and memory costs, the method is better suited to offline high-precision point cloud analysis, infrastructure inventory, and intelligent inspection than strict real-time deployment. In future work, more effective strategies for sparse object representation and boundary refinement will be explored to further improve fine-grained semantic understanding in complex railway scenes. Lightweight model design and broader cross-scene validation will also be considered to enhance the efficiency and robustness of the proposed framework.
Author Contributions
Conceptualization, J.F., S.L., J.P., X.J., G.W., W.D. and T.J.; Methodology, J.F., S.L. and T.J.; Software, J.F. and T.J.; Validation, J.F., S.L., J.P., Y.Z., G.W. and T.J.; Formal analysis, J.F., S.L., Y.Z., W.D. and T.J.; Investigation, J.F., S.L., J.P., X.J., G.W., W.D. and T.J.; Resources, S.L., J.P., X.J., G.W. and T.J.; Data curation, J.F., S.L., G.W. and T.J.; Writing—original draft, J.F., S.L. and T.J.; Writing—review & editing, J.F., S.L. and T.J.; Visualization, J.F., X.J., Y.Z., W.D. and T.J.; Supervision, T.J.; Project administration, G.W., W.D. and T.J.; Funding acquisition, J.P., X.J., G.W., W.D. and T.J. All authors have read and agreed to the published version of the manuscript.
Funding
This work was supported in part by the Open Fund of Tianjin Key Laboratory of Rail Transit Navigation Positioning and Spatio-Temporal Big Data Technology under Grant TKL2025A04, in part by the Natural Science Foundation of the Higher Education Institutions of Jiangsu Province under Grant 24KJB420005, in part by the National Natural Science Foundation of China under Grant 42401552, in part by the Natural Science Foundation of Jiangsu Province under Grant BK20240598, in part by the Open Research Fund of Ningbo Key Laboratory of Spatial Intelligence and Digital Derivative under Grant 2026-NKLSIDD-02, and the grant from State Key Laboratory of Resources and Environmental Information System.
Data Availability Statement
Data underlying the results presented in this paper are not publicly available at this time but may be obtained from the authors upon reasonable request.
Conflicts of Interest
Jiming Pang was employed by the Nanjing Water Planning and Designing Institute Co., Ltd. Xin Jing was employed by the Jiangsu Digitaland Technology Co., Ltd. The remaining authors declare that the research was conducted in the absence of any commercial or financial relationships that could be construed as a potential conflict of interest.
References
- Ji, Z.; Song, M.X.; Guan, H.Y.; Yu, Y.T. Accurate and Robust Registration of High-Speed Railway Viaduct Point Clouds Using Closing Conditions and External Geometric Constraints. ISPRS J. Photogramm. Remote Sens. 2015, 106, 55–67. [Google Scholar] [CrossRef] [Scilit]
- Ning, B.; Tang, T.; Gao, Z.Y.; Yan, F.; Wang, F.Y.; Zeng, D. Intelligent Railway Systems in China. IEEE Intell. Syst. 2006, 21, 80–83. [Google Scholar] [CrossRef]
- Huang, M.; Cao, S.; Zhu, D.; Liu, X.; Luo, J.; Chen, Y.; Niu, J.; Zhang, L.; Huang, X.; Lin, H. CBRNet: Corner-Guided Boundary Refinement Network for High-Precision Building Extraction from Remote Sensing Imagery. IEEE Trans. Geosci. Remote Sens. 2026, 64, 4406216. [Google Scholar] [CrossRef] [Scilit]
- Wang, Y.; Jiang, T.; Yu, M.; Tao, S.; Sun, J.; Liu, S. Semantic-Based Building Extraction from LiDAR Point Clouds Using Contexts and Optimization in Complex Environment. Sensors 2020, 20, 3386. [Google Scholar] [CrossRef] [Scilit] [PubMed]
- Jiang, T.; Wang, Y.; Zhang, Z.; Liu, S.; Dai, L.; Yang, Y.; Jin, X.; Zeng, W. Extracting 3-D Structural Lines of Building From ALS Point Clouds Using Graph Neural Network Embedded with Corner Information. IEEE Trans. Geosci. Remote Sens. 2023, 61, 5702528. [Google Scholar] [CrossRef] [Scilit]
- Kapoor, R.; Goel, R.; Sharma, A. An Intelligent Railway Surveillance Framework Based on Recognition of Object and Railway Track Using Deep Learning. Multimed. Tools Appl. 2022, 81, 21083–21109. [Google Scholar] [CrossRef] [Scilit] [PubMed]
- Wang, Q.; Kim, M.-K. Applications of 3D Point Cloud Data in the Construction Industry: A Fifteen-Year Review from 2004 to 2018. Adv. Eng. Inf. 2019, 39, 306–319. [Google Scholar] [CrossRef] [Scilit]
- Di Mucci, V.M.; Cardellicchio, A.; Ruggieri, S.; Nettis, A.; Renò, V.; Uva, G. Artificial Intelligence in Structural Health Management of Existing Bridges. Autom. Constr. 2024, 167, 105719. [Google Scholar] [CrossRef] [Scilit]
- Liu, J.H.; Yang, W.H.; He, J.; Wang, Z.M.; Jia, L.; Zhang, C.F.; Yang, W.W. Intelligent prediction of rail corrugation evolution trend based on self-attention bidirectional TCN and GRU. Intell. Robot. 2024, 4, 318–338. [Google Scholar] [CrossRef] [Scilit]
- Yang, N.; Wang, Y.; Zhang, L.; Jiang, B. Point Cloud Semantic Segmentation Network Based on Graph Convolution and Attention Mechanism. Eng. Appl. Artif. Intell. 2025, 141, 109790. [Google Scholar] [CrossRef] [Scilit]
- Karunathilake, A.; Honma, R.; Niina, Y. Self-Organized Model Fitting Method for Railway Structures Monitoring Using LiDAR Point Cloud. Remote Sens. 2020, 12, 3702. [Google Scholar] [CrossRef] [Scilit]
- Jiang, T.; Yang, B.; Wang, Y.; Dai, L.; Qiu, B.; Liu, S.; Li, S.; Zhang, Q.; Jin, X.; Zeng, W. RailSeg: Learning Local–Global Feature Aggregation with Contextual Information for Railway Point Cloud Semantic Segmentation. IEEE Trans. Geosci. Remote Sens. 2023, 61, 5704929. [Google Scholar] [CrossRef] [Scilit]
- Wang, Z.; Geng, Y.; Jia, L.; Qin, Y.; Chai, Y.; Tong, L.; Liu, K. Self-Attentive Local Aggregation Learning with Prototype Guided Regularization for Point Cloud Semantic Segmentation of High-Speed Railways. IEEE Trans. Intell. Transp. Syst. 2023, 24, 11157–11170. [Google Scholar] [CrossRef] [Scilit]
- Grandio, J.; Riveiro, B.; Soilán, M.; Arias, P. Point cloud semantic segmentation of complex railway environments using deep learning. Autom. Constr. 2022, 141, 104425. [Google Scholar] [CrossRef] [Scilit]
- Geng, Y.; Wang, Z.; Jia, L.; Qin, Y.; Chai, Y.; Liu, K.; Tong, L. 3DGraphSeg: A unified graph representation-based point cloud segmentation framework for full-range high-speed railway environments. IEEE Trans. Ind. Inform. 2023, 19, 11430–11443. [Google Scholar] [CrossRef] [Scilit]
- Lou, Y.; Zhang, T.; Tang, J.; Song, W.; Zhang, Y.; Chen, L. A Fast Algorithm for Rail Extraction Using Mobile Laser Scanning Data. Remote Sens. 2018, 10, 1998. [Google Scholar] [CrossRef] [Scilit]
- Lamas, D.; Soilán, M.; Grandío, J.; Riveiro, B. Automatic Point Cloud Semantic Segmentation of Complex Railway Environments. Remote Sens. 2021, 13, 2332. [Google Scholar] [CrossRef] [Scilit]
- Charles, R.Q.; Su, H.; Kaichun, M.; Guibas, L.J. PointNet: Deep Learning on Point Sets for 3D Classification and Segmentation. In Proceedings of the IEEE/CVF Conference on Computer Vision and Pattern Recognition (CVPR), Honolulu, HI, USA, 21–26 July 2017. [Google Scholar]
- Qi, C.R.; Yi, L.; Su, H.; Guibas, L.J. PointNet++: Deep hierarchical feature learning on point sets in a metric space. In Proceedings of the 31st International Conference on Neural Information Processing Systems, Long Beach, CA, USA, 4–9 December 2017. [Google Scholar]
- Thomas, H.; Qi, C.R.; Deschaud, J.E.; Marcotegui, B.; Goulette, F.; Guibas, L.J. Kpconv: Flexible and deformable convolution for point clouds. In Proceedings of the IEEE/CVF Conference on Computer Vision and Pattern Recognition (CVPR), Long Beach, CA, USA, 16–20 June 2019. [Google Scholar]
- Hu, Q.; Yang, B.; Xie, L.; Rosa, S.; Guo, Y.; Wang, Z.; Trigoni, N.; Markham, A. RandLA-Net: Efficient Semantic Segmentation of Large-Scale Point Clouds. In Proceedings of the IEEE/CVF Conference on Computer Vision and Pattern Recognition (CVPR), Virtual, 14–19 June 2020. [Google Scholar]
- Zhang, C.; Wan, H.C.; Shen, X.Y.; Wu, Z.Z. Patchformer: An efficient point transformer with patch attention. In Proceedings of the IEEE/CVF Conference on Computer Vision and Pattern Recognition, New Orleans, LA, USA, 19–24 June 2022. [Google Scholar]
- Qian, G.C.; Li, Y.C.; Peng, H.W.; Mai, J.J.; Hammoud, H.; Elhoseiny, M.; Ghanem, B. Pointnext: Revisiting pointnet++ with improved training and scaling strategies. Adv. Neural Inf. Process. Syst. 2022, 35, 23192–23204. [Google Scholar] [CrossRef] [Scilit]
- Yue, Y.W.; Robert, D.; Wang, J.Y.; Hong, S.; Wegner, J.D.; Rupprecht, C.; Schindler, K. LitePT: Lighter yet stronger point transformer. arXiv 2025, arXiv:2512.13689. [Google Scholar]
- Wu, X.Y.; Jiang, L.; Wang, P.S.; Liu, Z.J.; Liu, X.H.; Qiao, Y.; Ouyang, W.L.; He, T.; Zhao, H.S. Point Transformer V3: Simpler faster stronger. In Proceedings of the IEEE/CVF Conference on Computer Vision and Pattern Recognition, Seattle, WA, USA, 17–21 June 2024. [Google Scholar]
- Zeng, Z.Y.; Dong, M.Y.; Zhou, J.; Qiu, H.; Dong, Z.; Luo, M.; Li, B.J. DeepLA-Net: Very Deep Local Aggregation Networks for Point Cloud Analysis. In Proceedings of the 2025 IEEE/CVF Conference on Computer Vision and Pattern Recognition (CVPR), Nashville, TN, USA, 10–17 June 2025. [Google Scholar]
- Grandio, J.; Riveiro, B.; Lamas, D.; Arias, P. Multimodal deep learning for point cloud panoptic segmentation of railway environments. Autom. Constr. 2023, 150, 104854. [Google Scholar] [CrossRef] [Scilit]
- Rozenberszki, D.; Litany, O.; Dai, A. Language-grounded indoor 3d semantic segmentation in the wild. In Proceedings of the European Conference on Computer Vision (ECCV), Tel Aviv, Israel, 23–27 October 2022. [Google Scholar]
- Behley, J.; Garbade, M.; Milioto, A.; Quenzel, J.; Behnke, S.; Stachniss, C.; Gall, J. SemanticKITTI: A Dataset for Semantic Scene Understanding of LiDAR Sequences. In Proceedings of the IEEE/CVF International Conference on Computer Vision (ICCV), Seoul, Republic of Korea, 27 October–2 November 2019. [Google Scholar]
- González-Collazo, S.M.; Balado, J.; Garrido, I.; Grandío, J.; Rashdi, R.; Tsiranidou, E.; del Río-Barral, P.; Rúa, E.; Puente, I.; Lorenzo, H. Santiago urban dataset SUD: Combination of Handheld and Mobile Laser Scanning point clouds. Expert. Syst. Appl. 2024, 238, 121842. [Google Scholar] [CrossRef] [Scilit]
- Hackel, T.; Savinov, N.; Ladicky, L.; Wegner, J.D.; Schindler, K.; Pollefeys, M. SEMANTIC3D.NET: A new large-scale point cloud classification benchmark. ISPRS Ann. Photogramm. Remote Sens. Spat. Inf. Sci. 2017, IV-1-W1, 91–98. [Google Scholar] [CrossRef] [Scilit]
- Armeni, I.; Sener, O.; Zamir, A.R.; Jiang, H.L.; Brilakis, I.; Fischer, M.; Savarese, S. 3D semantic parsing of large-scale indoor spaces. In Proceedings of the 2016 IEEE Conference on Computer Vision and Pattern Recognition (CVPR), Las Vegas, NV, USA, 27–30 June 2016. [Google Scholar]
- Dai, A.; Chang, A.X.; Savva, M.; Halber, M.; Funkhouser, T.; Nießner, M. Scannet: Richly-annotated 3D reconstructions of indoor scenes. In Proceedings of the 2017 IEEE Conference on Computer Vision and Pattern Recognition (CVPR), Honolulu, HI, USA, 21–26 July 2017. [Google Scholar]
- Yeshwanth, C.; Liu, Y.C.; Nießner, M.; Dai, A. Scannet++: A high-fidelity dataset of 3D in door scenes. In Proceedings of the 2023 IEEE/CVF International Conference on Computer Vision (ICCV), Paris, France, 1–6 October 2023. [Google Scholar]
- Qiu, B.; Zhou, Y.Z.; Dai, L.; Wang, B.; Li, J.P.; Dong, Z.; Wen, C.L.; Ma, Z.L.; Yang, B.S. WHU-Railway3D: A diverse dataset and benchmark for railway point cloud semantic segmentation. IEEE Trans. Intell. Transp. Syst. 2024, 25, 20900–20916. [Google Scholar] [CrossRef] [Scilit]
- Jiang, T.P.; Li, S.W.; Zhang, Q.Y.; Wang, G.S.; Zhang, Z.Q.; Zeng, F.K.; An, P.; Jin, X.; Liu, S.; Wang, Y.J. RailPC: A large-scale railway point cloud semantic segmentation dataset. CAAI Trans. Intell. Technol. 2024, 9, 1548–1560. [Google Scholar] [CrossRef] [Scilit]
- Kharroubi, A.; Ballouch, Z.; Hajji, R.; Yarroudh, A.; Billen, R. Multi-context point cloud dataset and machine learning for railway semantic segmentation. Infrastructures 2024, 9, 71. [Google Scholar] [CrossRef] [Scilit]
- Sun, N.; Li, K.; Liu, J.X.; Chai, L.; Wu, C. Learning and fusing the rasterized and serialized point cloud for 3D semantic segmentation in railway scenes. Expert. Syst. Appl. 2026, 295, 128897. [Google Scholar] [CrossRef] [Scilit]
- Liang, Z.X.; Lai, X.D.; Zhang, L. Active learning-driven semantic segmentation for railway point clouds with limited labels. Autom. Constr. 2025, 171, 106016. [Google Scholar] [CrossRef] [Scilit]
- Ran, H.X.; Liu, J.; Wang, C.J. Surface representation for point clouds. In Proceedings of the 2022 IEEE/CVF Conference on Computer Vision and Pattern Recognition (CVPR), New Orleans, LA, USA, 19–24 June 2022. [Google Scholar]
- Guo, Y.L.; Wang, H.Y.; Hu, Q.Y.; Liu, H.; Liu, L.; Mohammed, B. Deep Learning for 3D Point Clouds: A Survey. IEEE Trans. Pattern Anal. Mach. Intell. 2020, 43, 4338–4364. [Google Scholar] [CrossRef] [Scilit]
- Deng, X.; Zhang, W.Y.; Ding, Q.; Zhang, X.M. Pointvector: A vector representation in point cloud analysis. In Proceedings of the IEEE/CVF Conference on Computer Vision and Pattern Recognition, Vancouver, BC, Canada, 18–22 June 2023. [Google Scholar]
- Yang, W.K.; Lu, X.H.; Chen, B.J.; Lin, C.L.; Bao, X.Y.; Liu, W.Q.; Zang, Y.; Xu, J.Y.; Wang, C. DeLA: An extremely faster network with decoupled local aggregation for large scale point cloud learning. Int. J. Appl. Earth Obs. Geoinf. 2025, 135, 104255. [Google Scholar]
- Lei, H.; Naveed, A.; Ajmal, M. Spherical Kernel for Efficient Graph Convolution on 3D Point Clouds. IEEE Trans. Pattern Anal. Mach. Intell. 2021, 43, 3664–3680. [Google Scholar] [CrossRef] [Scilit] [PubMed]
- Zhang, J.H.; Luo, Y.Z.; Zhang, Z.C.; Nie, X.C.; Li, B.N. CamPoint: Boosting Point Cloud Segmentation with Virtual Camera. In Proceedings of the 2025 IEEE/CVF Conference on Computer Vision and Pattern Recognition (CVPR), Nashville, TN, USA, 10–17 June 2025. [Google Scholar]
- Li, D.L.; Guan, J.L.; Chen, Z.Y.; Liao, J.C.; Du, J.X. PointSSM: State space model for large-scale LiDAR point cloud semantic segmentation. Int. J. Appl. Earth Obs. Geoinf. 2025, 144, 104830. [Google Scholar] [CrossRef] [Scilit]
- Liu, L.Z.; Zhuang, Z.W.; Huang, S.X.; Xiao, X.L.; Xiang, T.H.; Chen, C.; Wang, J.D.; Tan, M.K. CPCM: Contextual point cloud modeling for weakly-supervised point cloud semantic segmentation. In Proceedings of the IEEE/CVF International Conference on Computer Vision, Paris, France, 2–6 October 2023. [Google Scholar]
- Li, M.T.; Xie, Y.; Shen, Y.H.; Ke, B.; Qiao, R.Z.; Ren, B.; Lin, S.H.; Ma, L.Z. HybridCR: Weakly-supervised 3d point cloud semantic segmentation via hybrid contrastive regularization. In Proceedings of the IEEE/CVF Conference on Computer Vision and Pattern Recognition, New Orleans, LA, USA, 19–24 June 2022. [Google Scholar]
- Liu, J.M.; Wu, Y.; Gong, M.G.; Miao, Q.G.; Ma, W.P.; Xu, C. Exploring dual representations in large-scale point clouds: A simple weakly supervised semantic segmentation framework. In Proceedings of the 31st ACM International Conference on Multimedia, Ottawa, ON, Canada, 29 October–3 November 2023. [Google Scholar]
- Pan, Z.Y.; Zhang, N.; Gao, W.; Liu, S.; Li, G. Point cloud semantic segmentation with sparse and inhomogeneous annotations. In Proceedings of the AAAI Conference on Artificial Intelligence, Philadelphia, PA, USA, 14–19 February 2025. [Google Scholar]
- Tran, A.T.; Le, H.S.; Lee, S.H.; Kwon, K.R. PointCT: Point central transformer network for weakly-supervised point cloud semantic segmentation. In Proceedings of the IEEE/CVF Winter Conference on Applications of Computer Vision, Waikoloa, HI, USA, 4–8 January 2024. [Google Scholar]

Disclaimer/Publisher’s Note: The statements, opinions and data contained in all publications are solely those of the individual author(s) and contributor(s) and not of MDPI and/or the editor(s). MDPI and/or the editor(s) disclaim responsibility for any injury to people or property resulting from any ideas, methods, instructions or products referred to in the content. |
© 2026 by the authors. Licensee MDPI, Basel, Switzerland. This article is an open access article distributed under the terms and conditions of the Creative Commons Attribution (CC BY) license.