


Highlights
What are the main findings?
- A Sentinel-2-based coastal vessel detection framework is developed, with YOLO26m achieving robust performance (F1: 0.8461 and mAP50: 0.8979) on atmospherically corrected surface reflectance (L2R) data.
- A high-quality dataset containing 8123 vessels from 14 scenes is constructed, proving that the ACOLITE algorithm nearly doubles target edge sharpness.
What is the implication of the main finding?
- It offers a scalable, cost-effective solution for macro maritime governance, effectively filling traditional AIS data blind spots caused by small or non-cooperative vessels.
- The generated 1 × 1 km traffic heatmaps capture seasonal dynamics from fishing bans and logistics, providing critical data for marine spatial planning and ecological assessments.
Abstract
Accurate, large-scale maritime traffic monitoring supports marine spatial planning, fishery regulation, and ecological conservation. Medium-resolution optical satellite imagery, such as Sentinel-2A/B, provides a cost-effective complement to incomplete Automatic Identification System (AIS) data. Detecting small vessels in coastal waters remains challenging due to target size, complex backgrounds, and class imbalance. This study presents a robust end-to-end framework for small vessel detection and traffic density mapping using optical remote sensing imagery. A high-quality dataset of 8123 manually annotated vessels was constructed from 14 Sentinel-2 scenes across three marine environments in Fujian, China. An overlapping sliding-window cropping strategy, area truncation filtering, and negative sample preservation improved training efficiency and balance. Experiments compared top-of-atmosphere reflectance with surface reflectance (L2R) from the ACOLITE atmospheric correction (AC) algorithm, showing L2R mitigates aerosol scattering and nearly doubles vessel edge sharpness. YOLO-based detectors were evaluated, with YOLO26m achieving the best localization: F1-score 0.8461, mAP50 0.8979, mAP50–95 0.5536. Using this framework, 1 × 1 km traffic heatmaps for the Fujian coast in 2025 captured seasonal variations influenced by logistics and fishery moratoriums. Results demonstrate that integrating atmospherically corrected imagery with optimized deep learning strategies enhances sub-pixel ship detection, offering a scalable solution for intelligent maritime governance.
1. Introduction
Increasing human activities in marine environments have exerted growing pressures on coastal ecosystems and ocean resources [1]. According to recent estimates, global maritime transport accounts for over 80% of international trade by volume, with millions of vessels operating across coastal and open-ocean regions each year [2]. Accurate characterization of the spatiotemporal distribution of maritime vessels is therefore essential for marine spatial planning, fishery regulation, and ecological impact assessment [3]. Although large commercial ships are typically equipped with Automatic Identification Systems (AIS), these data remain inherently incomplete. A considerable proportion of small and medium-sized vessels, including fishing boats and recreational crafts, operate without AIS transponders, and this proportion can exceed 50% in many coastal fishing regions [4,5,6]. This may lead to great observational gaps and limits the effectiveness of traditional monitoring approaches. Therefore, developing complementary techniques to capture comprehensive maritime activity has become an essential challenge.
With the rapid advancement of satellite remote sensing technologies, vessel detection based on optical and Synthetic Aperture Radar (SAR) imagery has emerged as an effective alternative [7]. In the radar domain, spaceborne spotlight and sliding spotlight SAR systems enable reliable all-weather ship detection [8,9], yet they suffer from the absence of multispectral color information and narrow imaging swath coverage. Very high-resolution (VHR) commercial satellites provide submeter to few-meter imagery that enhances the detectability of small maritime targets, yet the high tasking cost and relatively narrow swath widths limit their large-scale and long-term operational applications. In contrast, freely available optical data from Sentinel-2 satellites, with a swath width of approximately 290 km and a revisit time of 5 days, offer consistent and large-sale observations that are well-suited for periodic maritime activity monitoring [10]. Despite this advantage, the moderate spatial resolution of Sentinel-2 imagery, typically 10 m for visible bands, poses inherent challenges for detecting small vessels, especially in complex coastal environments [11]. At 10 m resolution, a typical small fishing boat may occupy merely a few pixels, making it highly susceptible to being obscured by background noise [12]. Nevertheless, the frequent revisit cycle of Sentinel-2 provides a unique opportunity for systematic macroscopic assessments, as long as the challenges in algorithmic detection are effectively addressed.
Recent advances in deep learning (DL) have improved object detection performance in remote sensing imagery [13,14,15]. In particular, single-stage detectors represented by the You Only Look Once (YOLO) model have demonstrated strong capability in efficient and end-to-end target detection [16,17]. However, applying DL–based detectors directly to medium-resolution optical satellite imagery for vessel detection remains challenging, as atmospheric effects such as molecular scattering and aerosol interactions introduce radiometric distortions that reduce image contrast and obscure spectral signatures, thereby degrading detection performance [18,19]. Complex coastal backgrounds, including islands, reefs, and turbid waters with suspended sediments, introduce obvious spectral and structural variability. These features often resemble vessel targets visually or generate strong clutter, which increases false positives and reduces model robustness in nearshore regions, ultimately misleading classification and localization algorithms [20,21]. For instance, sea surface sun glint and breaking waves can create high-reflectance anomalies that closely resemble the appearance of vessel hulls or their wakes. Overcoming these spectral and spatial ambiguities is crucial for operationalizing DL models in real-world coastal monitoring.
Recent studies have demonstrated the effectiveness of remote-sensing imagery and YOLO-family detectors for ship or boat detection [16,17,22,23]. However, existing works have primarily focused on detector architecture design, vessel extraction from relatively clear imagery, or general maritime traffic mapping, while small-vessel detection in complex, nearshore, and turbid waters remain less thoroughly investigated. In contrast, this study emphasizes high-accuracy vessel detection under challenging coastal background conditions and further extends image-level detections to monthly vessel-count statistics and 1 km × 1 km maritime traffic density maps for regional-scale monitoring.
To address these technical and operational challenges, this study focuses on the Fujian coastal region, a vital center for international shipping and domestic fisheries, characterized by complex features such as estuaries, reefs, and turbid waters [24,25]. Despite its immense economic and ecological significance, systematic monitoring of the extensive local fishing fleets remains insufficient, limiting the effectiveness of regional marine governance. To bridge this gap, it is critical to move beyond the detection of individual vessels and translate initial detection outputs into macroscopic spatial intelligence. To address this gap, it is critical to move beyond the detection of individual vessels and transform initial detection outputs into large-scale spatial patterns, thereby supporting the development of comprehensive ship traffic monitoring strategies.
Therefore, this study proposes an end-to-end framework to reliably detect vessels and map maritime traffic density based on Sentinel-2 imagery. A high-quality dataset is constructed from 14 scenes, comprising 8123 manually annotated vessels, to support model training and validation. To improve data efficiency and alleviate class imbalance, a sliding-window cropping strategy with overlapping strides, area truncation filtering, and negative sample retention is employed. In addition, atmospherically corrected surface reflectance products are derived using the ACOLITE algorithm to reduce radiometric distortions caused by aerosol and molecular scattering [26,27]. The performance of ship detection using surface reflectance data is systematically compared with that of top-of-atmosphere (TOA) data across several representative YOLO-based architectures [28]. With the optimized models, high-resolution ship traffic heatmaps are generated for Fujian coastal waters, forming a comprehensive workflow from individual target detection to regional dynamic maritime monitoring.
2. Data and Methods
2.1. Study Area
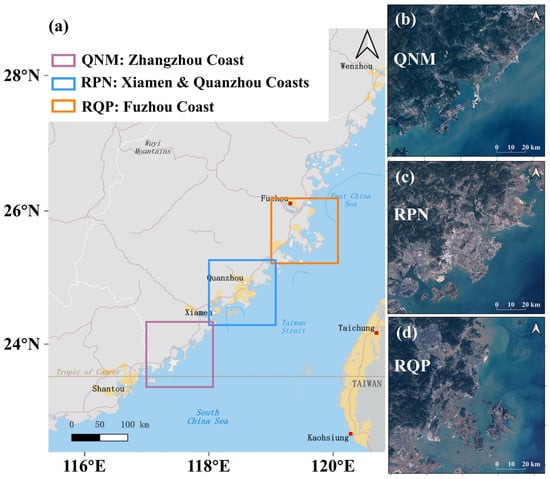
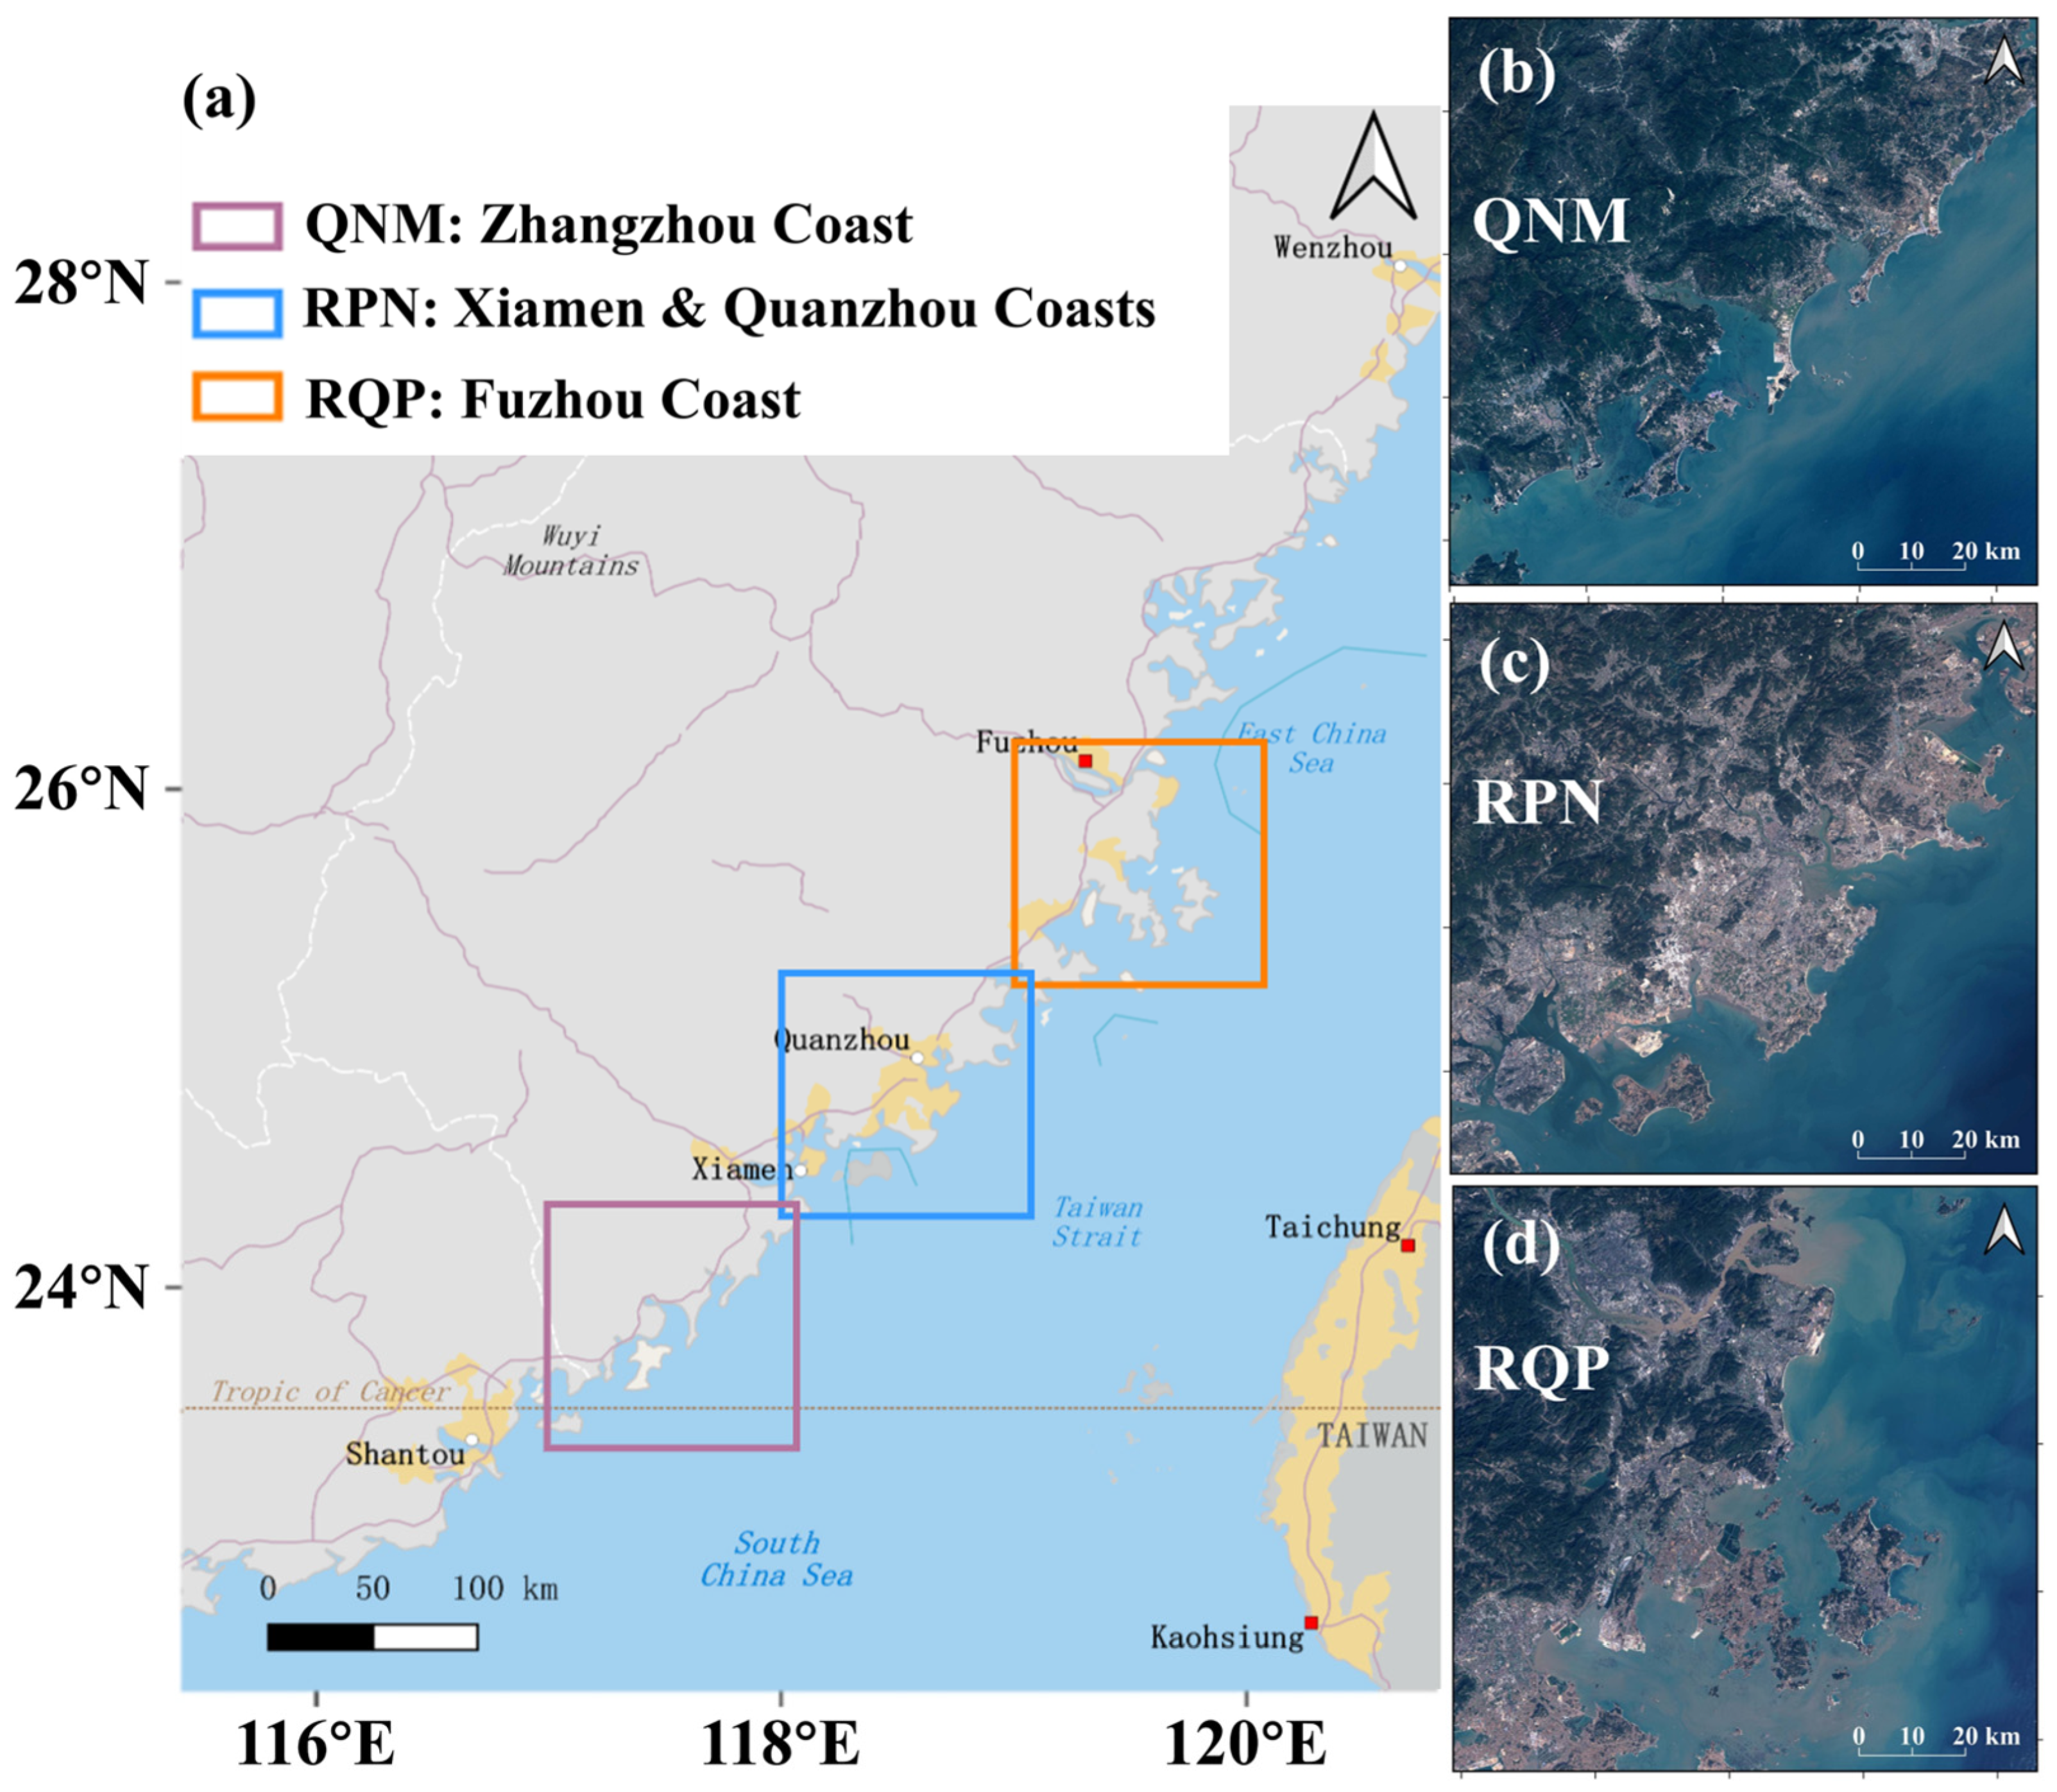
To evaluate the robustness and generalization capability of the proposed ship detection framework, the coastal waters of Fujian Province in southeastern China were selected as the study area. Located along the western Taiwan Strait between the East China Sea and the South China Sea, this region represents one of the most active maritime zones in China, characterized by intensive shipping activities and extensive fishing operations. Following the Sentinel-2A/B tiling system, three contiguous tiles were selected to construct the dataset (Figure 1), namely RQP (Fuzhou coast), RPN (Xiamen and Quanzhou coasts), and QNM (Zhangzhou coast). As illustrated in Figure 1b–d, these tiles capture distinct coastal landscapes: the Fuzhou coast (RQP) features numerous scattered islands and rocky outcrops along a rugged shoreline; the Xiamen and Quanzhou coasts (RPN) exhibit highly urbanized coastal zones with dense port infrastructure and extensive coastal reclamation; and the Zhangzhou coast (QNM) is typified by extensive estuarine bays and turbid waters influenced by high sediment loads from adjacent river inputs. These regions encompass diverse marine environments and traffic conditions, including turbid nearshore waters, relatively clean offshores, high-density commercial shipping lanes, and active coastal fishing grounds. The coexistence of complex coastal morphology, dynamic water properties, and heterogeneous background features such as islands, reefs, turbid waters, and man-made structures introduces great challenges for object detection, leading to increased false detections and reduced model robustness. Therefore, this region provides a representative and realistic testbed for evaluating ship detection performance under complex maritime conditions.
Figure 1.
(a) Study area location and Sentinel-2 tile coverage in the western Taiwan Strait, southeastern China. (b–d) Sentinel-2 optical imageries of the three study tiles, illustrating diverse coastal environments across Fujian’s coastal waters.
2.2. Sentinel-2 Data Preprocessing
The data used in this study were acquired from the Multispectral Instrument (MSI) onboard the Sentinel-2A and Sentinel-2B satellites, which operate as a critical component of the European Space Agency’s (ESA) Copernicus Programme [29]. With its high revisit frequency and extensive spatial coverage, Sentinel-2 is an ideal data source for continuous, large-scale maritime monitoring [30]. To maintain consistent spatial resolution and ensure computational efficiency, three 10 m visible bands including B02 (blue), B03 (green) and B04 (red) were selected to construct three-channel RGB images. These specific bands are highly sensitive to the optical differences between artificial vessel structures and the surrounding water. By exclusively utilizing these 10 m resolution bands, the spatial details of small targets, including vessel hulls and their turbulent wakes, are maximally preserved for subsequent DL model training and inference. Conversely, infrared bands were excluded due to their coarser spatial resolution and high susceptibility to sun-glint anomalies, which degrade sub-pixel target feature extraction.
To comprehensively investigate the influence of atmospheric effects on small vessel detection, an AC procedure was applied to the original Level-1C TOA reflectance (L1C). Because standard correction algorithms often face challenges over dark aquatic environments, the ACOLITE AC processor, developed by the Royal Belgian Institute of Natural Sciences, was employed to generate precise surface reflectance products. Tailored specifically for optically complex coastal and turbid waters, ACOLITE effectively mitigates the adverse influences of aerosol scattering, molecular interactions, and sun glint while strictly preserving true water-leaving reflectance signals [28]. This process effectively improves the radiometric consistency and signal-to-noise ratio of the imagery. To compare different AC schemes, we employed two common processing tools including ESA’s standard Sen2Cor and the physics-based 6S radiative transfer model [31,32]. Subsequently, the original TOA data and the various atmospherically corrected surface reflectance products were normalized and converted from floating-point formats to 8-bit unsigned integer representations. This preprocessing step ensures compatibility with standard convolutional neural network (CNN) architectures while maintaining relative radiometric differences critical for feature extraction.
2.3. Marine Vessel Annotations
To construct a robust and highly representative dataset for training DL models, 14 high-quality Sentinel-2 images were meticulously selected across the three study tiles (50RQP, 50RPN, and 50QNM). As detailed in Table 1, these acquisitions span diverse temporal windows from early 2024 to early 2026. This extended timeframe ensures a comprehensive coverage of various seasonal weather conditions, sea states, and solar illumination angles, thereby enhancing the dataset’s environmental diversity. All visually identifiable maritime vessels within these scenes were manually annotated using horizontal bounding boxes. The spatial coordinates and associated metadata for each bounding box were subsequently exported as GeoPackage vector files, providing precise geographic referencing essential for the DL processing pipeline.
Table 1.
Summary of the Sentinel-2A/B product metadata and the distribution of manual vessel annotations across the three study regions (50RQP, 50RPN, and 50QNM).
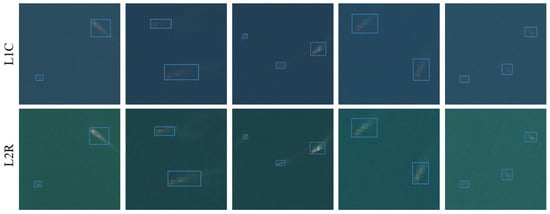
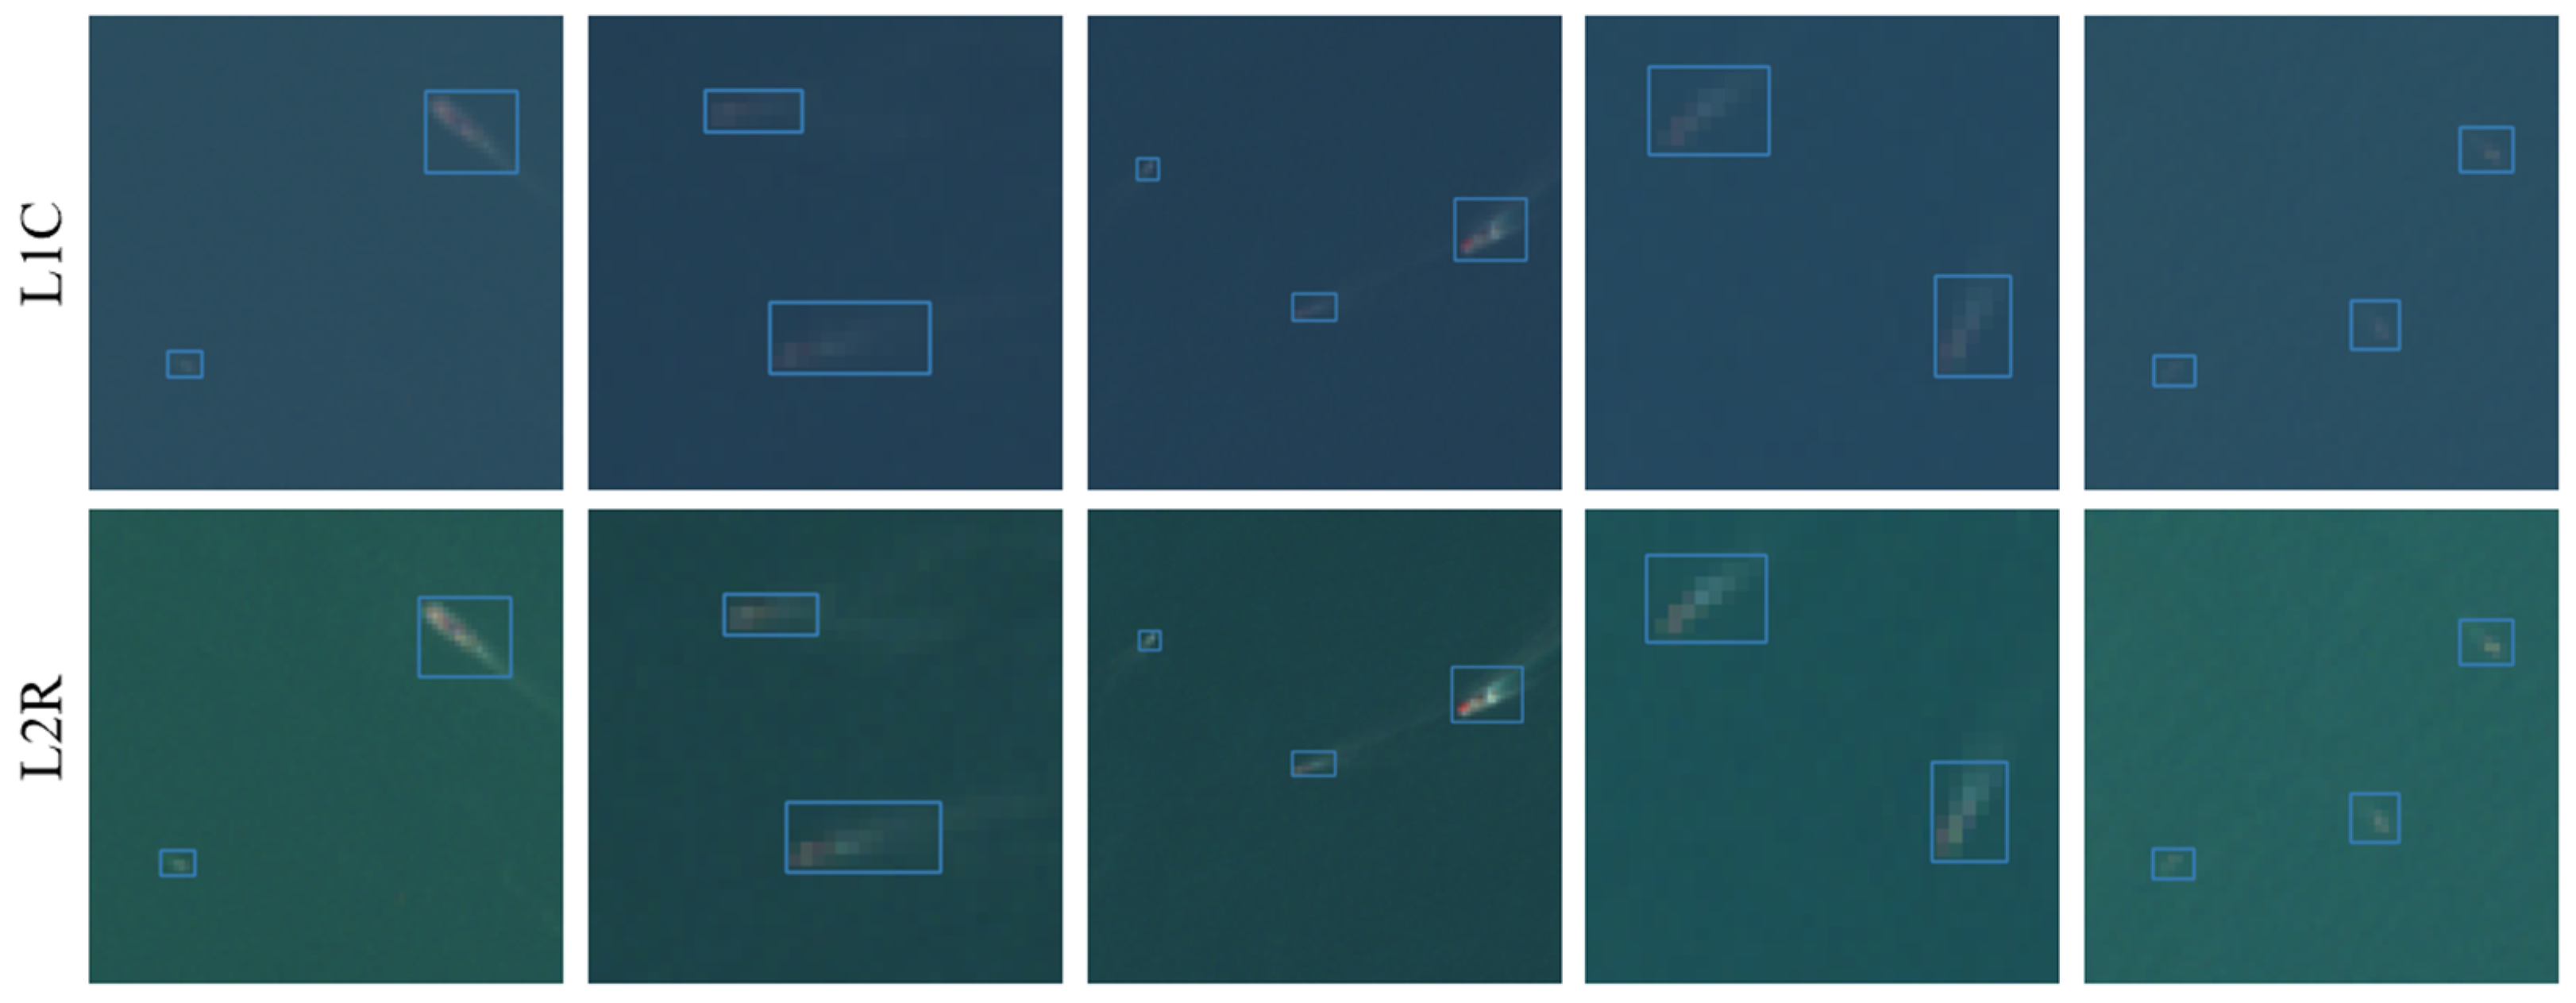
Identifying small targets in medium-resolution optical imagery inherently presents obvious visual challenges. Figure 2 illustrates representative annotation samples, intuitively comparing the original L1C imagery with the atmospherically corrected surface reflectance (L2R) imagery. As demonstrated in the figure, navigating vessels often generate turbulent wakes that appear brighter and more structurally distinct than the vessel hulls themselves. To maximize the extraction of dynamic features and increase the effective pixel area of the tiny targets, these wake structures were deliberately enclosed within the bounding boxes [33,34]. Furthermore, the visual comparison confirms that the L2R imagery exhibits enhanced target-background contrast, which is crucial for reducing manual annotation uncertainty [35].
Figure 2.
Visual comparison of manual vessel annotations between original TOA reflectance (L1C, top row) and ACOLITE-corrected surface reflectance (L2R, bottom row), with blue boxes highlighting the annotated targets.
To guarantee the high quality and reliability of the training dataset, rigorous exclusion criteria were established during the annotation phase. Stationary vessels located in close proximity to complex port infrastructure, narrow inland waterways, or directly adjacent to coastlines were deliberately excluded. These environments typically suffer from severe target-background blending and mixed-pixel effects, which introduce high annotation ambiguity and can degrade model convergence [36]. Following this rigorous screening process, a total of 8123 valid vessel instances were identified and annotated across the 14 scenes (summarized in Table 1). This substantial and diverse collection of annotations provides a solid empirical foundation for training robust, generalized object detection models capable of handling complex coastal maritime scenarios.
2.4. Image Slicing Strategy and Dataset Construction
Given the vast coverage of original Sentinel-2 tiles (typically 10,980 × 10,980 pixels), feeding full-scene images directly into conventional DL architectures is computationally prohibitive [37]. Direct downsampling or resizing would inevitably lead to the irreversible loss of sub-pixel and small ship features, rendering detection impossible. To address this spatial constraint, an overlapping sliding-window strategy was adopted to synchronously crop L1C and L2R images as well as their corresponding GeoPackage annotations. The sliding window size was fixed at 320 × 320 pixels with a stride of 240 pixels. This specific configuration yields an 80-pixel overlap between adjacent patches, a crucial design implemented to ensure that vessels located near patch boundaries are not severely truncated or completely missed during the slicing process.
During the sliding-window operation, ground-truth bounding boxes are occasionally cut by the window edges. To handle this, a truncation retention threshold of 0.5 was established. Let denote the area of the original bounding box and the intersecting area within the cropped patch. A sample was retained as a valid target only if:
Objects falling below this threshold were discarded to prevent the model from learning incomplete or misleading morphological features [38]. Furthermore, maritime remote sensing datasets inherently suffer from severe class imbalance, dominated by vast expanses of empty ocean. To mitigate this issue and improve training efficiency, a random negative sampling strategy was adopted. We selectively retained only 10% of the pure background patches (those containing no vessel targets), reducing redundant computational overhead while preserving enough negative samples to suppress false positives effectively.
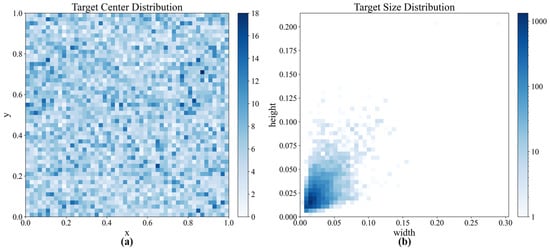
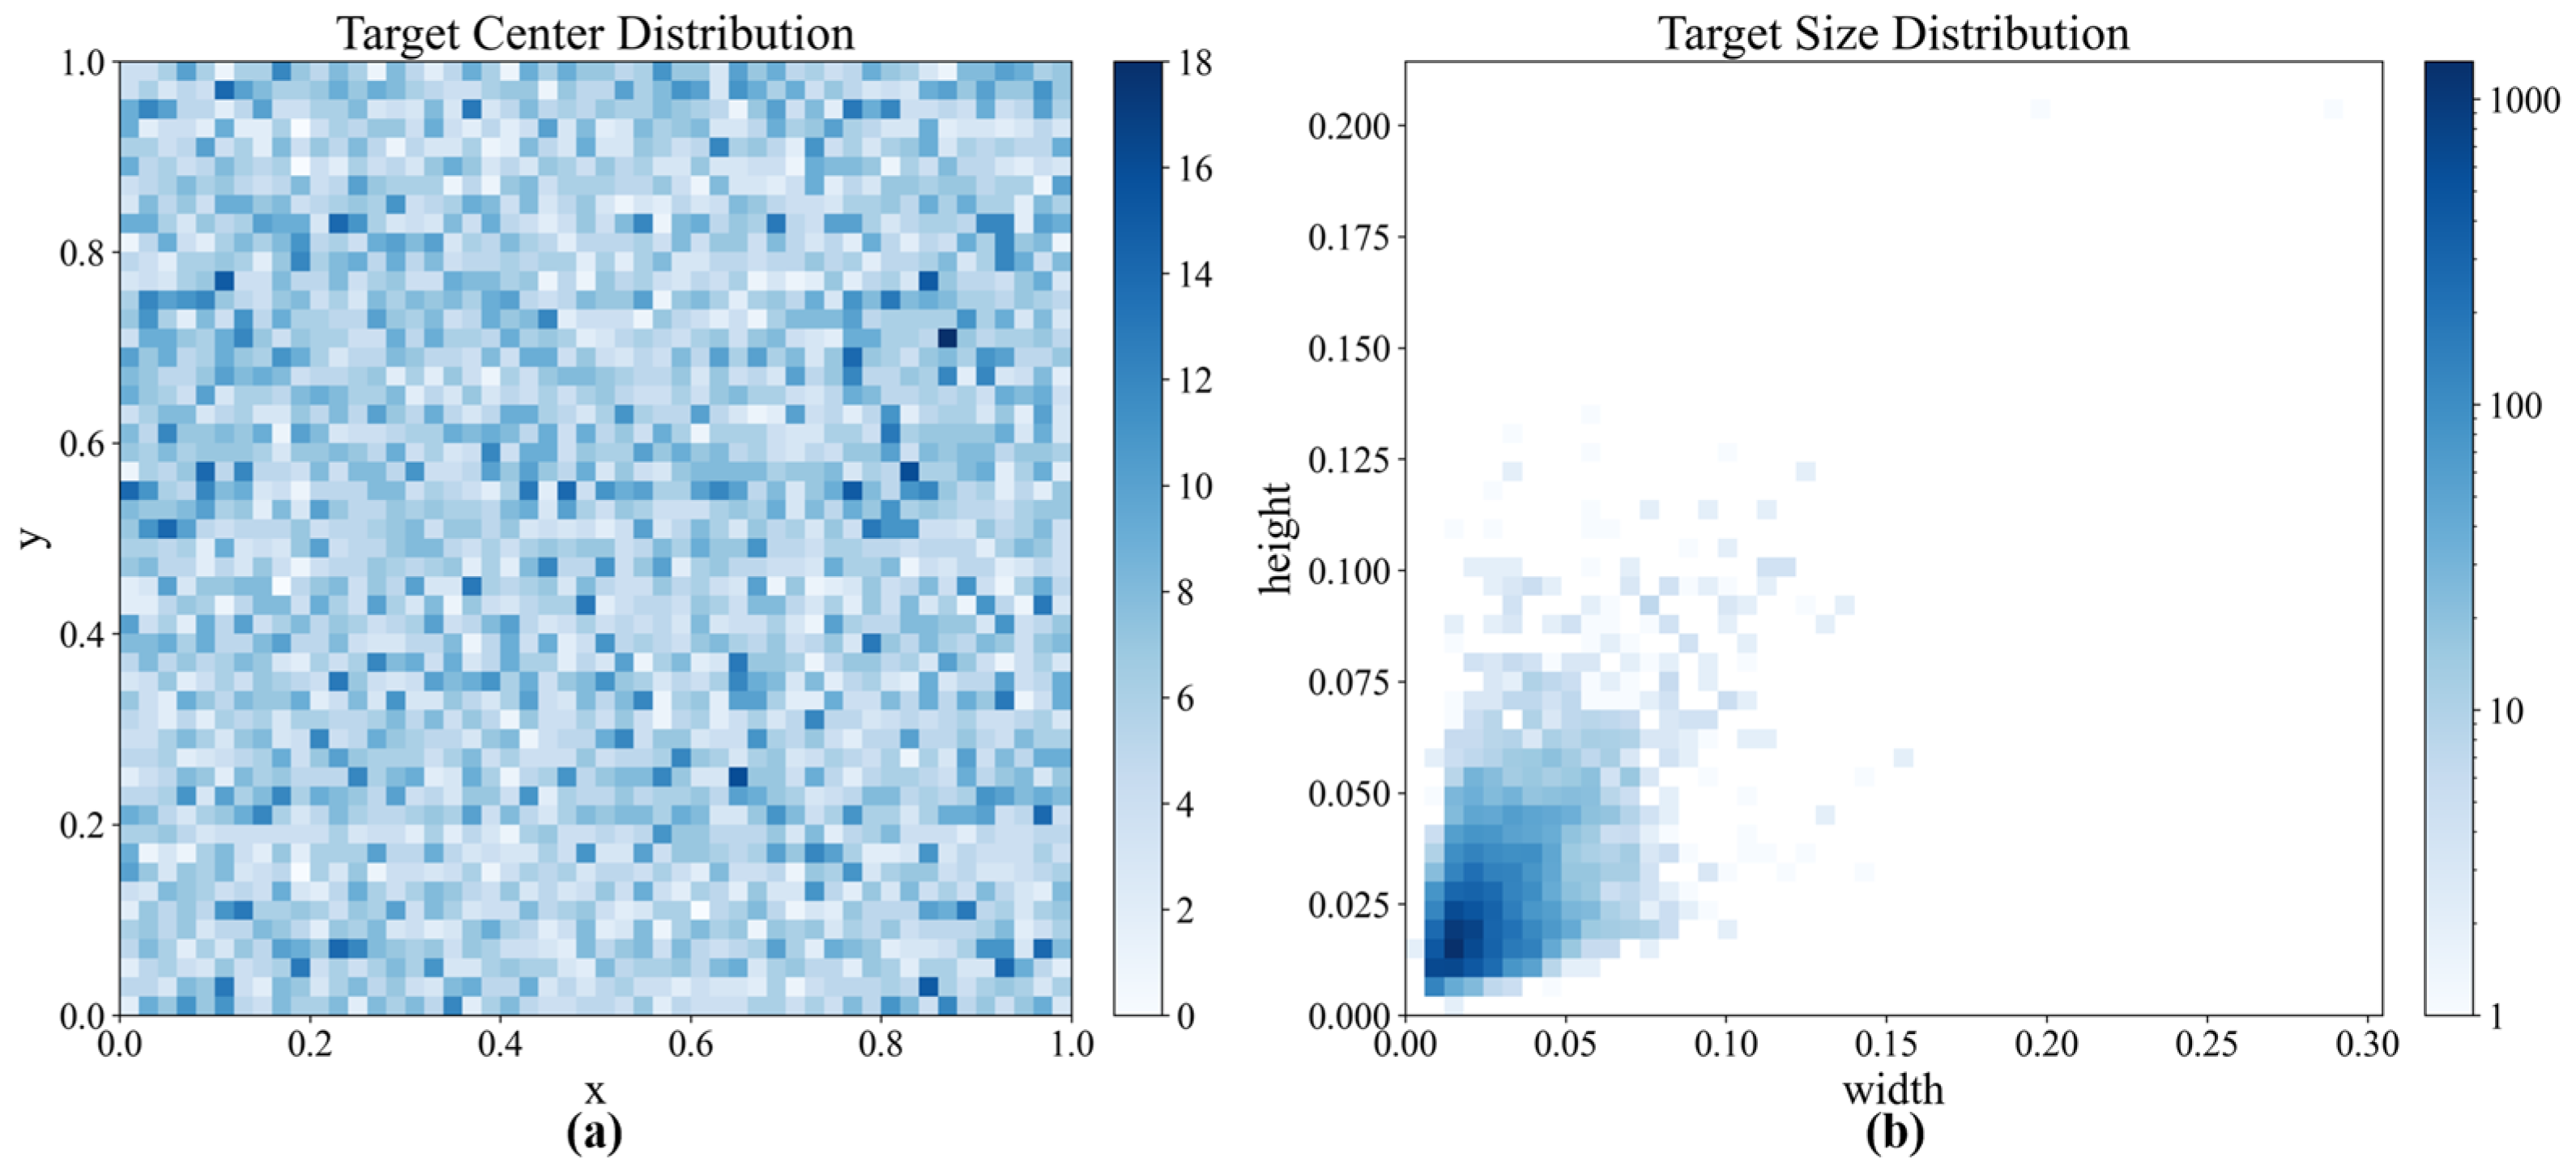
Following this rigorous preprocessing, both L1C and L2R datasets were synchronously cropped, culminating in 7843 valid patches of size 320 × 320 pixels for each data source. To further understand the inherent characteristics of our dataset, we analyzed the spatial and scale distributions of the annotated targets within these valid patches (Figure 3). The Target Center Distribution (Figure 3a) demonstrates that vessel locations are relatively uniformly distributed across the normalized x and y axes of the cropped patches, preventing the network from learning biased spatial priors based on target location. Meanwhile, the Target Size Distribution (Figure 3b) confirms the extreme small-object nature of the dataset. The heatmap indicates that the vast majority of targets possess relative widths and heights of less than 0.05 (i.e., smaller than 16 × 16 pixels within the 320 × 320 patch), heavily clustering near the origin. Finally, to ensure objective and reproducible evaluation, a fixed random seed was used to partition the datasets into training, validation, and test subsets with an approximate ratio of 7:2:1. The L1C and L2R datasets share identical spatial partitions and sample distributions, offering a strictly controlled experimental framework for evaluating AC impacts.
Figure 3.
Statistical analysis of the constructed dataset. (a) Target Center Distribution; (b) Target Size Distribution.
2.5. Object Detection Models and Experimental Settings
The field of object detection in remote sensing has evolved through two primary architectural paradigms: two-stage and single-stage detectors. Two-stage detectors, pioneered by the R-CNN family (including Fast R-CNN and Faster R-CNN), rely on a separate region proposal network to identify potential object locations followed by a secondary refinement and classification stage [39]. While these models often achieve high localization accuracy, their multi-stage nature typically results in obvious computational latency, limiting their applicability for real-time or large-scale processing. In contrast, single-stage detectors such as the Single Shot MultiBox Detector (SSD) and RetinaNet treat object detection as a unified regression problem, directly predicting bounding boxes and class probabilities from the input image [40,41]. These architectures offer a superior trade-off between detection speed and performance, making them highly suitable for processing high-volume satellite imagery over expansive coastal regions.
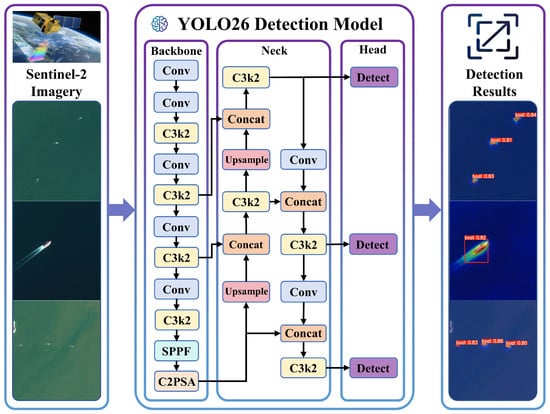
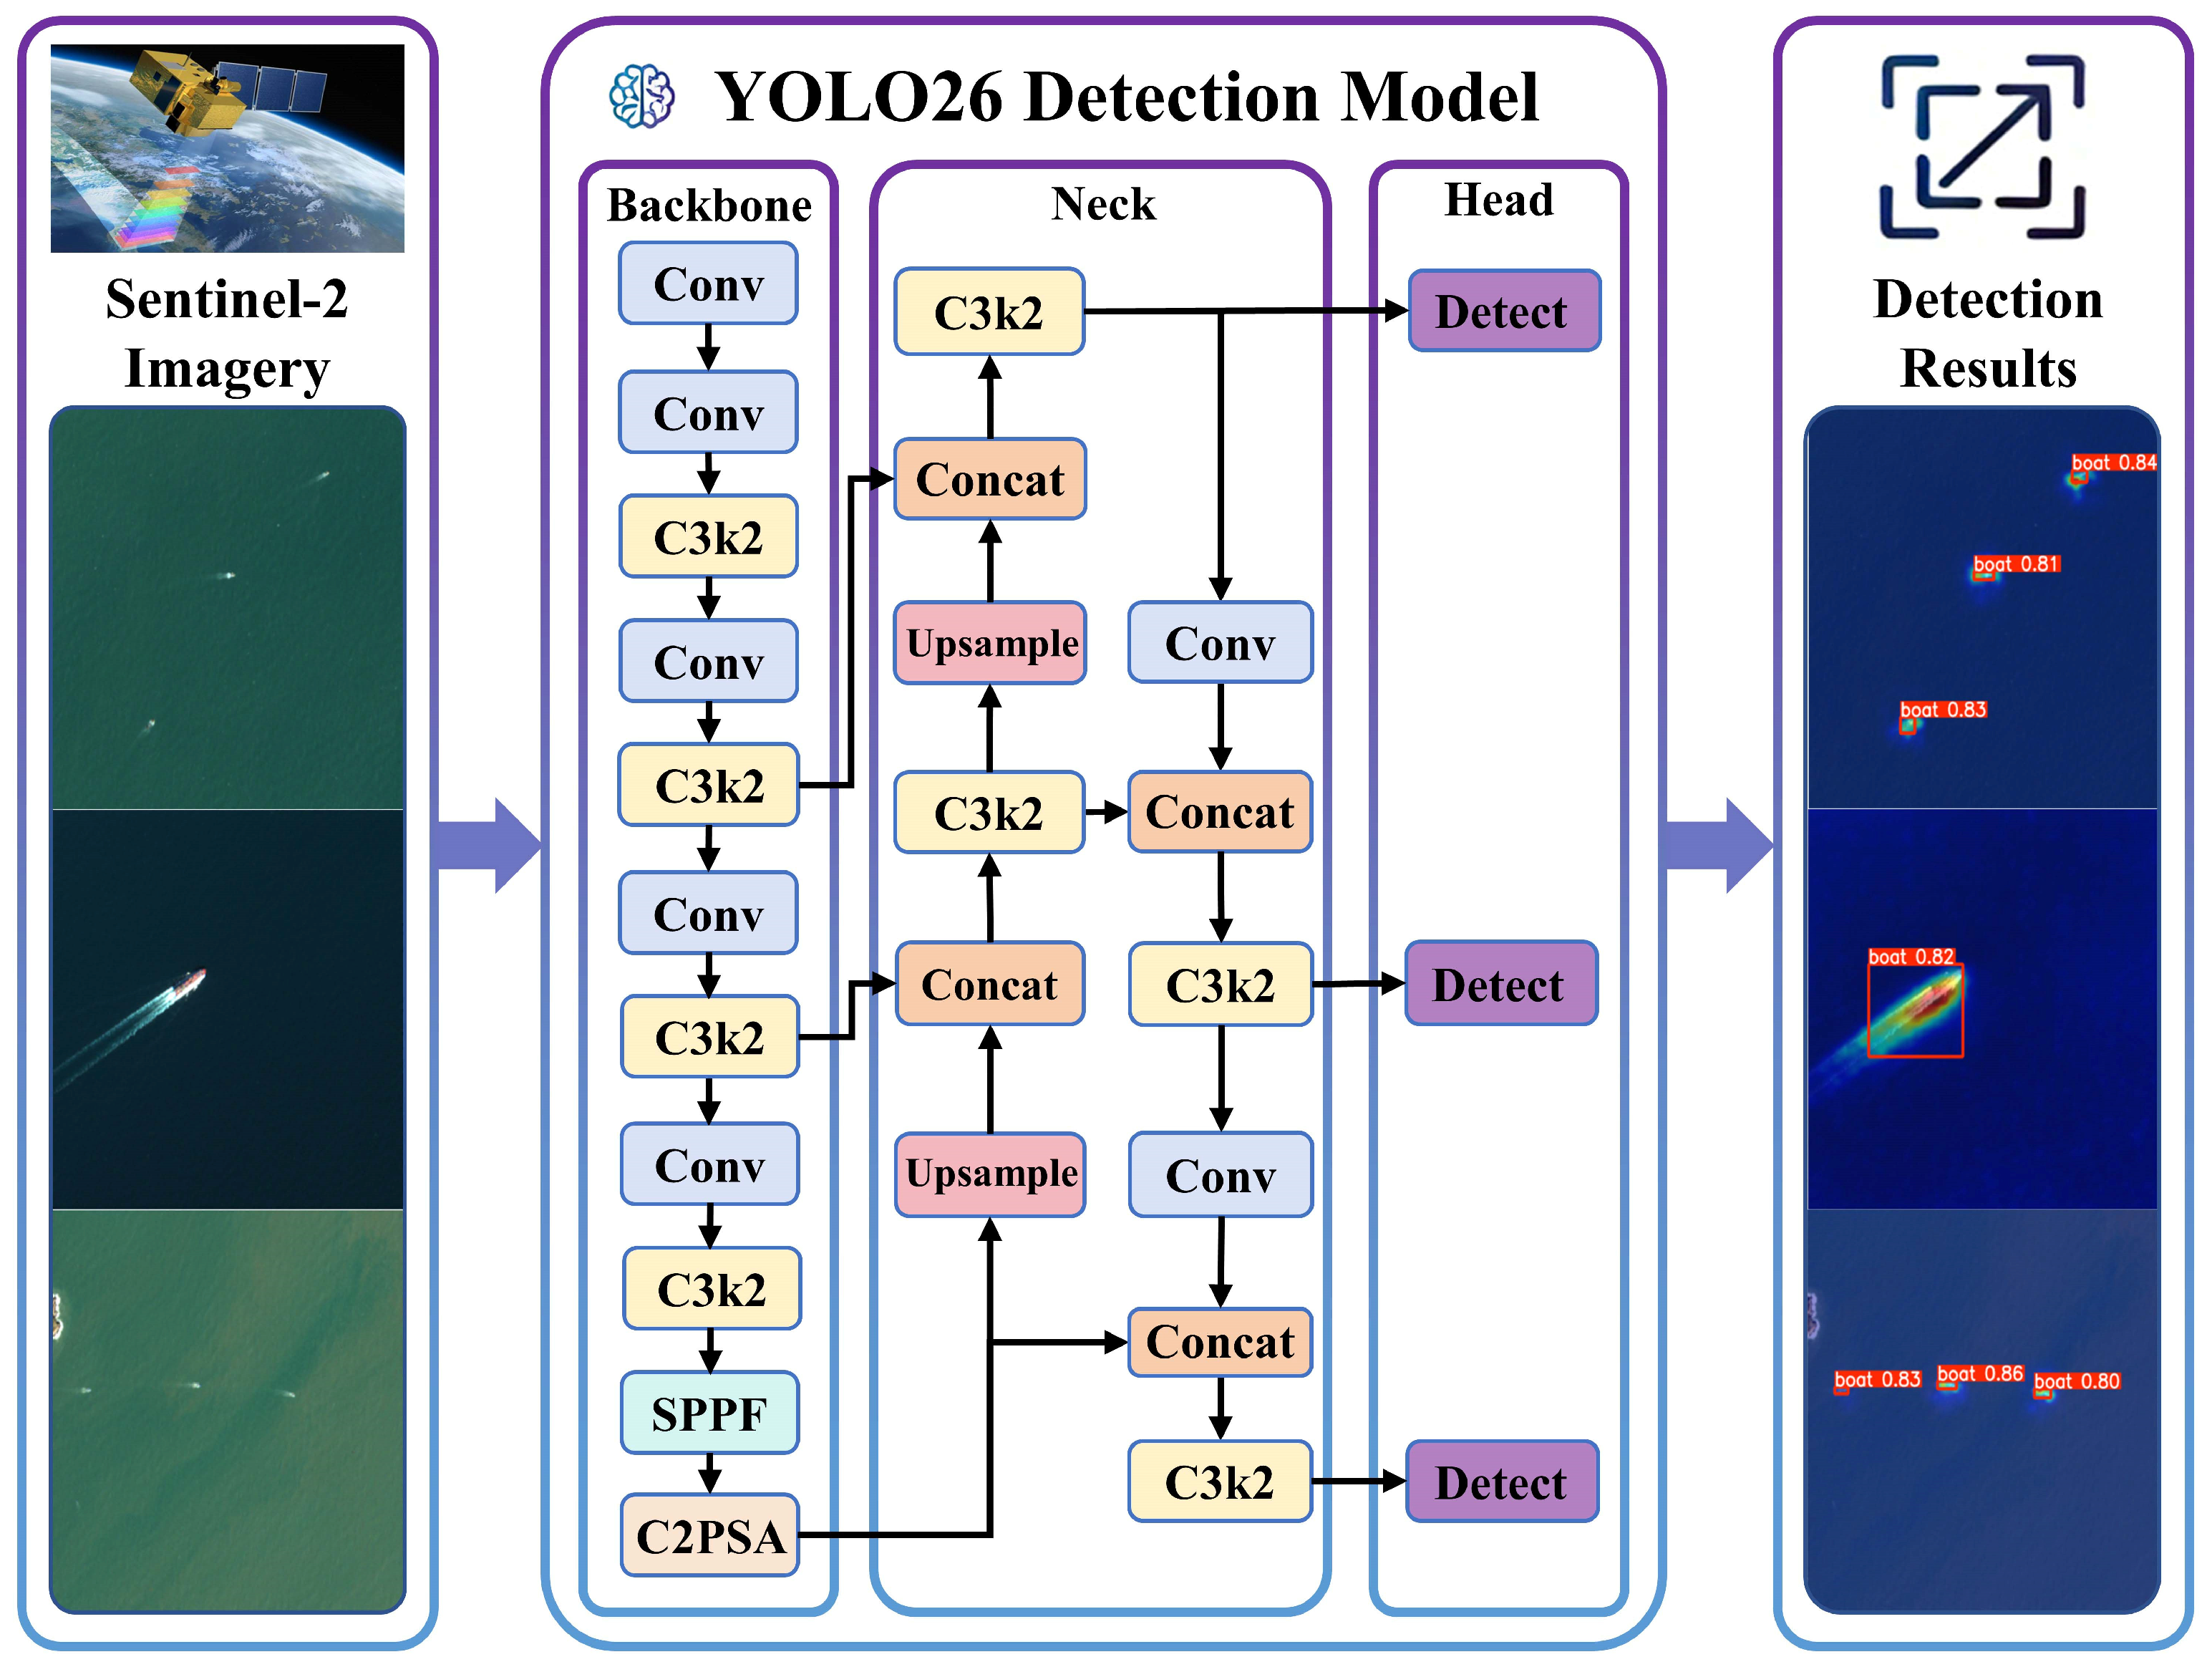
Among single-stage architectures, the YOLO framework has emerged as a state-of-the-art solution due to its exceptional efficiency and robust end-to-end training capability [15]. To identify the optimal architecture for small ship detection in complex coastal environments, this study evaluates several representative variants of the YOLO family, ranging from the widely used YOLOv8 to the most recent iterations, including YOLOv9, YOLOv10, YOLO11, YOLO12, and the state-of-the-art YOLO26 [42,43]. We also incorporate the standard two-stage Faster R-CNN model (ResNet-50 backbone paired with FPN) as a reference to quantify performance differences between single-stage and two-stage detection architectures. To ensure a strictly fair comparison under consistent computational constraints, the medium-scale version (denoted by the suffix “m”) was selected for all evaluated models. These models were trained independently on both the original L1C reflectance dataset and the corrected L2R surface reflectance dataset. Among them, YOLO26m serves as a primary focus due to its advanced architectural enhancements, such as the integration of C2PSA and C3k2 modules, which are specifically designed to strengthen attention mechanisms and contextual feature aggregation for tiny objects, as illustrated in the structural diagram in Figure 4 [16,44].
Figure 4.
Detailed architectural diagram of the YOLO26-based ship detection model.
The experimental training pipeline was meticulously designed to maximize model convergence and generalization. All models were trained for a maximum of 300 epochs, with an early stopping mechanism triggered if the validation metrics failed to improve for 30 consecutive epochs, thereby preventing potential overfitting. We employed the Stochastic Gradient Descent (SGD) optimizer with an initial learning rate of 0.01, a momentum coefficient of 0.937, and a weight decay of 5 × 10⁻⁴. The batch size was dynamically optimized to fully utilize the available GPU memory. Crucially, to enhance the detectability of extremely small vessels, the input patches of 320 × 320 pixels were unsampled to 640 × 640 pixels before being processed by the networks. This upsampling doubles the linear pixel count of the targets, facilitating the extraction of fine-grained structural features. Furthermore, a diverse suite of data augmentation techniques including random rotation, horizontal and vertical flipping, scaling, color jittering and mosaic augmentation was implemented to expose the models to a wider variety of simulated environmental conditions [45].
All experiments and performance benchmarking were conducted on a high-performance computing workstation equipped with a single NVIDIA RTX 3090 GPU (24 GB VRAM). The software environment was built upon Python 3.12 and PyTorch 2.5, utilizing the Ultralytics open-source framework for model implementation and evaluation. This standardized hardware and software setup ensures the reproducibility of the results and provides a reliable baseline for comparing the impact of AC on ship detection performance across different DL architectures.
2.6. Evaluation Metrics
To comprehensively and quantitatively assess the detection performance of the various YOLO models on both the L1C and L2R datasets, a standardized suite of evaluation metrics was employed [46]. Specifically, Precision (P), Recall (R), F1-score, and mean Average Precision (mAP) at different Intersection over Union (IoU) thresholds were adopted as the primary benchmarking criteria. These metrics are derived from the counts of True Positives (TP, correctly identified vessels), False Positives (FP, background or noise incorrectly classified as vessels), and False Negatives (FN, actual vessels missed by the model). Precision, Recall, and the F1-score are mathematically defined as follows:
Furthermore, Average Precision (AP) is utilized to evaluate the performance of individual classes. AP is defined as the area under the Precision–Recall (P-R) curve, which is generated by varying the confidence threshold. It can be expressed as the definite integral of Precision as a function of Recall:
The mAP represents the average of the AP values across all object categories (though in this study, it primarily targets the single “vessel” class). In our evaluation protocol, mAP50, mAP75, and mAP50–95 denote the mAP calculated at IoU thresholds of 0.5, 0.75, and the average over the strict IoU range from 0.5 to 0.95 (with a step size of 0.05), respectively [47].
Given the inherent physical characteristics of our dataset where vessel targets are extremely small and often occupy only a few pixels, achieving a perfect bounding box overlap such as IoU greater than 0.75 is exceedingly difficult. Even a minor localized pixel shift can heavily penalize the mAP75 or mAP50-95 scores, despite the model locating the target [48]. Therefore, to ensure a robust, fair, and practically meaningful performance assessment, the F1-score and mAP50 were selected as the primary evaluation metrics to guide our comparative analysis.
In addition to detection accuracy, we further quantified each model’s architectural complexity and theoretical computational efficiency using two standardized metrics: Params (M, millions of parameters) and GFLOPs (billions of floating-point operations). In contrast to inference runtime latency, which fluctuates heavily with local hardware and software configurations, Params and GFLOPs serve as hardware-agnostic benchmarks for assessing the memory footprint and computational load of each network.
3. Results
3.1. Performance Evaluation Across Different Object Detection Models
To identify the optimal detection architecture for complex coastal environments, this study systematically compares the conventional two-stage Faster R-CNN detector against six medium-scale YOLO variants (YOLOv8m, YOLOv9m, YOLOv10m, YOLO11m, YOLO12m, and YOLO26m). The comparative evaluation primarily focuses on their performance across the atmospherically corrected L2R surface reflectance dataset, with detailed quantitative metrics summarized in Table 2. The experimental results indicate that all evaluated models possess robust baseline capabilities for capturing small maritime targets, demonstrating the maturity of single-stage detectors in extracting discriminative features from sub-pixel scale objects.
Table 2.
Comparative evaluation of detection performance of different models on L1C and L2R datasets. The bold numbers represent the best results for each metric.
A detailed analysis of individual model performance on the L2R dataset reveals distinct architectural strengths. For instance, the widely established YOLOv8m achieved a global maximum Precision of 0.8500. This high precision reflects its superior capability in bounding box regression and strict false-positive control, which is essential for minimizing false alarms triggered by sea clutter or breaking waves. Conversely, YOLOv9m demonstrated the highest sensitivity in terms of vessel retrieval, attaining a peak Recall of 0.8453. This suggests that YOLOv9m is particularly effective for surveillance scenarios where missing a potential target is more critical than occasional false detections. Meanwhile, the YOLOv10m, YOLO11m, and YOLO12m maintain highly balanced and stable performance profiles across most evaluation criteria. Additionally, while the two-stage Faster R-CNN delivers consistent localization performance, it achieves markedly lower recall values owing to intrinsic constraints of its region proposal network when detecting subpixel ship targets, alongside substantially higher computational overhead in both parameter count and GFLOPs.
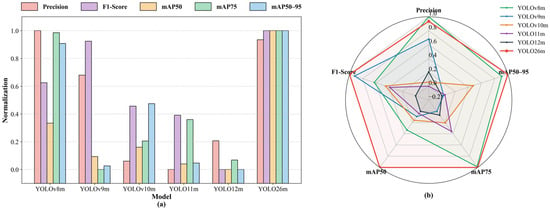
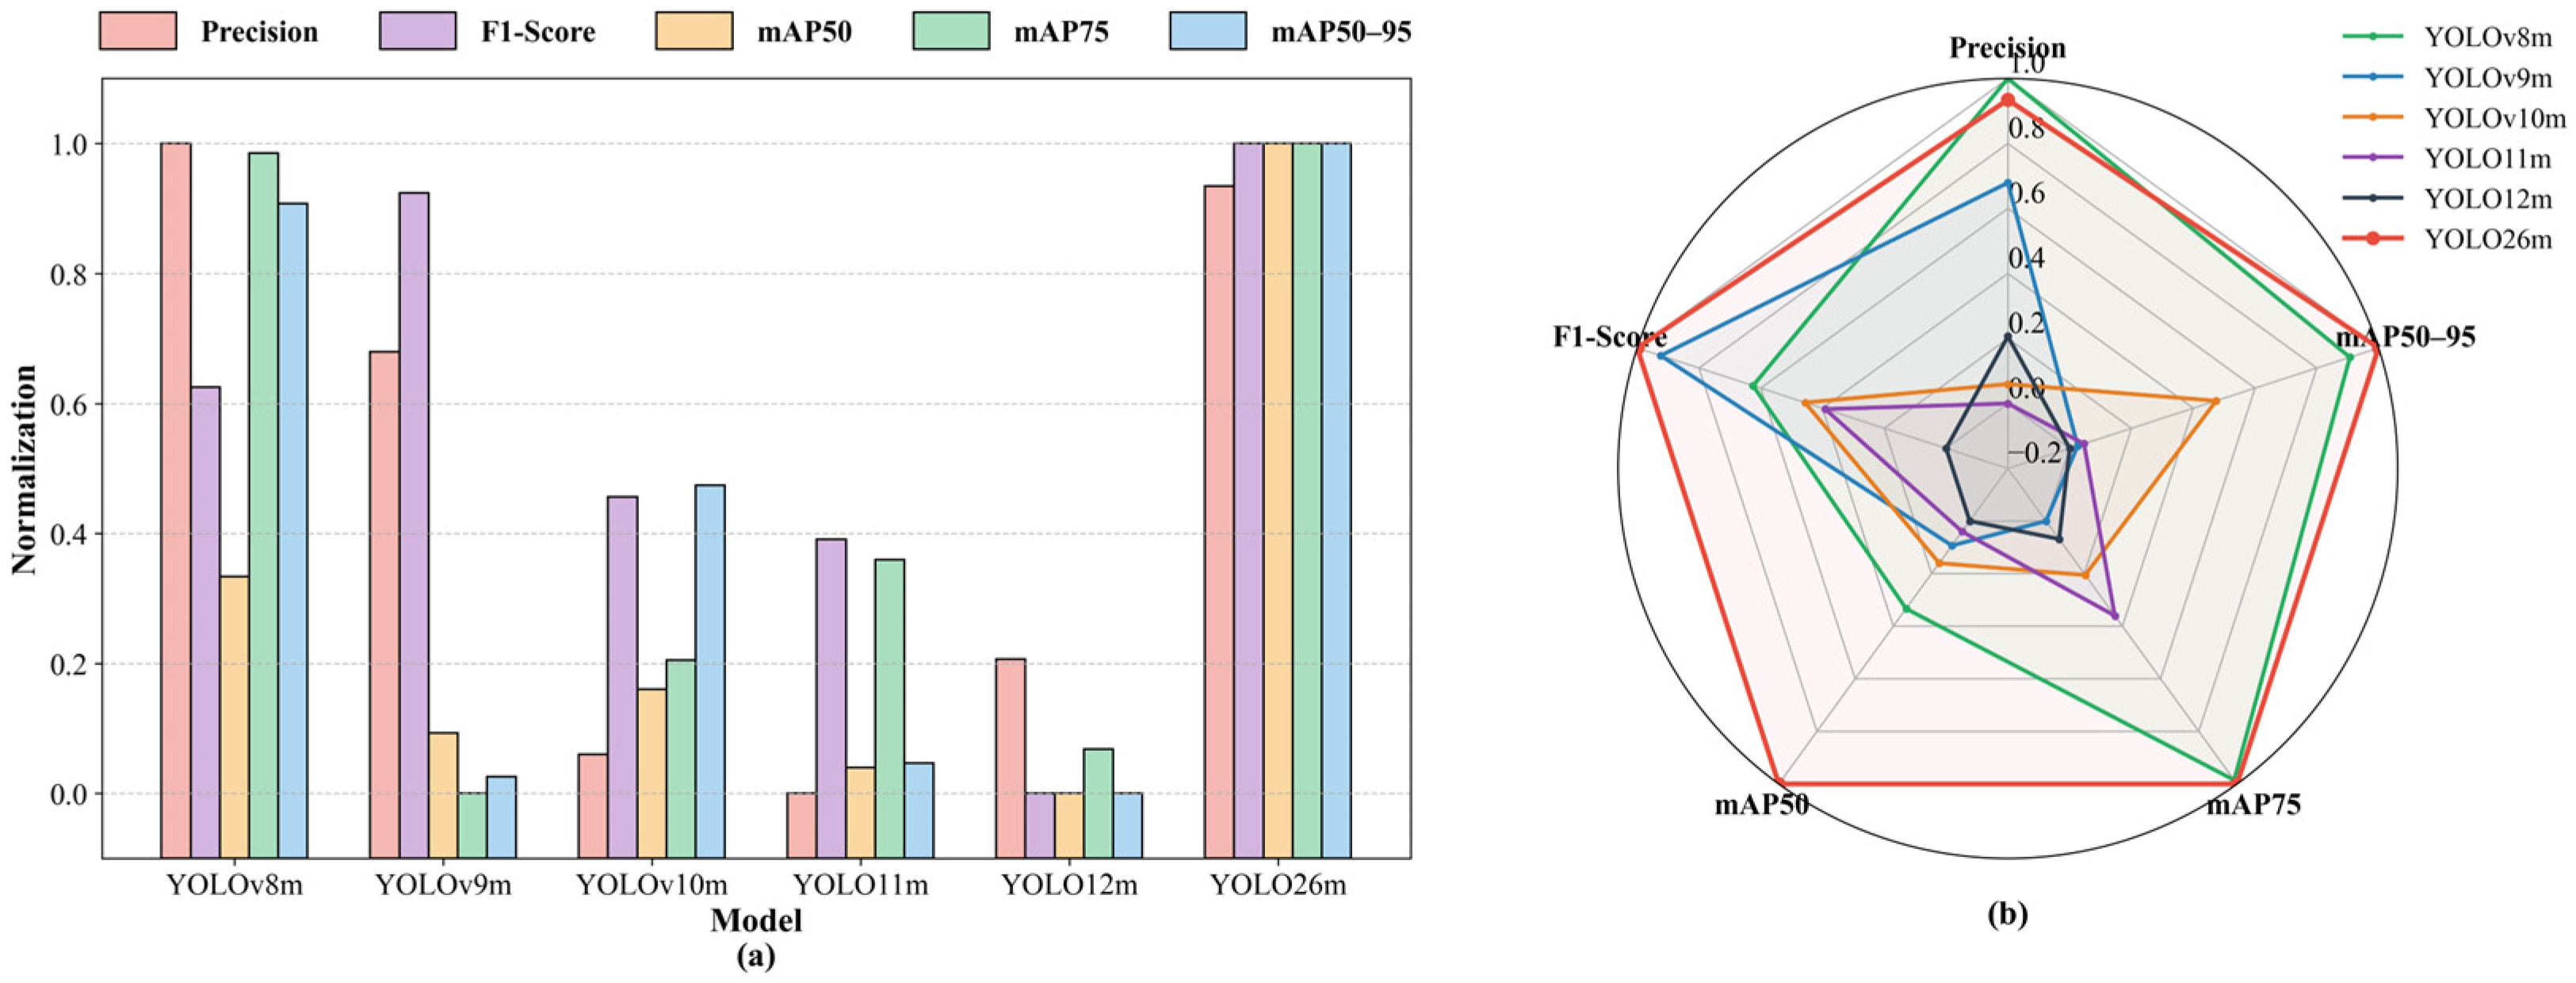
To better illustrate the overall performance within the single-stage paradigm, evaluation metrics of the six YOLO models on the L2R dataset were normalized and presented using both bar charts and radar charts (Figure 5). The normalized bar chart (Figure 5a) clearly illustrates the relative performance levels across models. While YOLOv8m excels in precision category, YOLO26m decisively outperforms the other variants in the remaining four critical metrics, including F1-Score, mAP50, mAP75, and mAP50-95. This multi-dimensional dominance is even more evident in the radar chart (Figure 5b). The performance polygon for YOLO26m (red line) forms the outermost contour for nearly all metrics, effectively enclosing those of all other comparative models.
Figure 5.
Normalized performance comparison of the six YOLO models evaluated on the L2R dataset. (a) Normalized bar chart. (b) Radar chart.
In terms of performance, YOLO26m demonstrated the best results on the L2R dataset, achieving an F1-score of 0.8461, mAP50 of 0.8979, and mAP50–95 of 0.5536 (Table 2). Notably, our method achieves state-of-the-art detection accuracy while maintaining an exceptionally lightweight architecture, with only 20.4 M trainable parameters and 67.8 GFLOPs. It therefore demonstrates a substantially more favorable accuracy–efficiency trade-off compared to the other evaluated baseline models. This comprehensive superiority further establishes YOLO26m as a highly reliable architecture for extracting fine-grained vessel features over the complex coastal environments. The strong performance can be primarily attributed to its advanced structural design, particularly the incorporation of the C2PSA and C3k2 modules. These enhancements improve both local and global attention mechanisms, enabling the network to effectively aggregate contextual information and accurately differentiate small vessel pixels from interference, including sea surface glint and small reefs.
3.2. Impact of AC on Ship Detection Performance
The comprehensive experimental results explicitly confirm that applying the ACOLITE AC algorithm to generate L2R surface reflectance data effectively enhances small ship detection capabilities compared to using the original L1C TOA data. As detailed in Table 2, the performance metrics across all six evaluated YOLO models consistently improved when trained and tested on the L2R dataset. Taking the optimal YOLO26m model as an example, its F1-score increased from 0.8361 (on L1C) to 0.8461 (on L2R), while the more stringent mAP75 metric showed a notable rise from 0.5556 to 0.5989. Similar improvements in precision and recall were observed across other model variants, strongly suggesting that the ACOLITE algorithm effectively mitigates sea-surface aerosol scattering and atmospheric attenuation, thus providing a cleaner and more reliable signal for the neural networks.
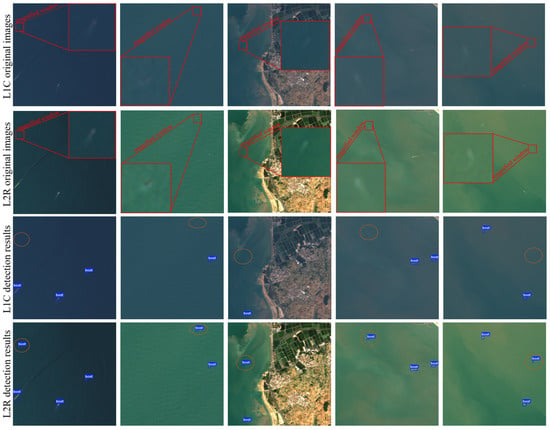
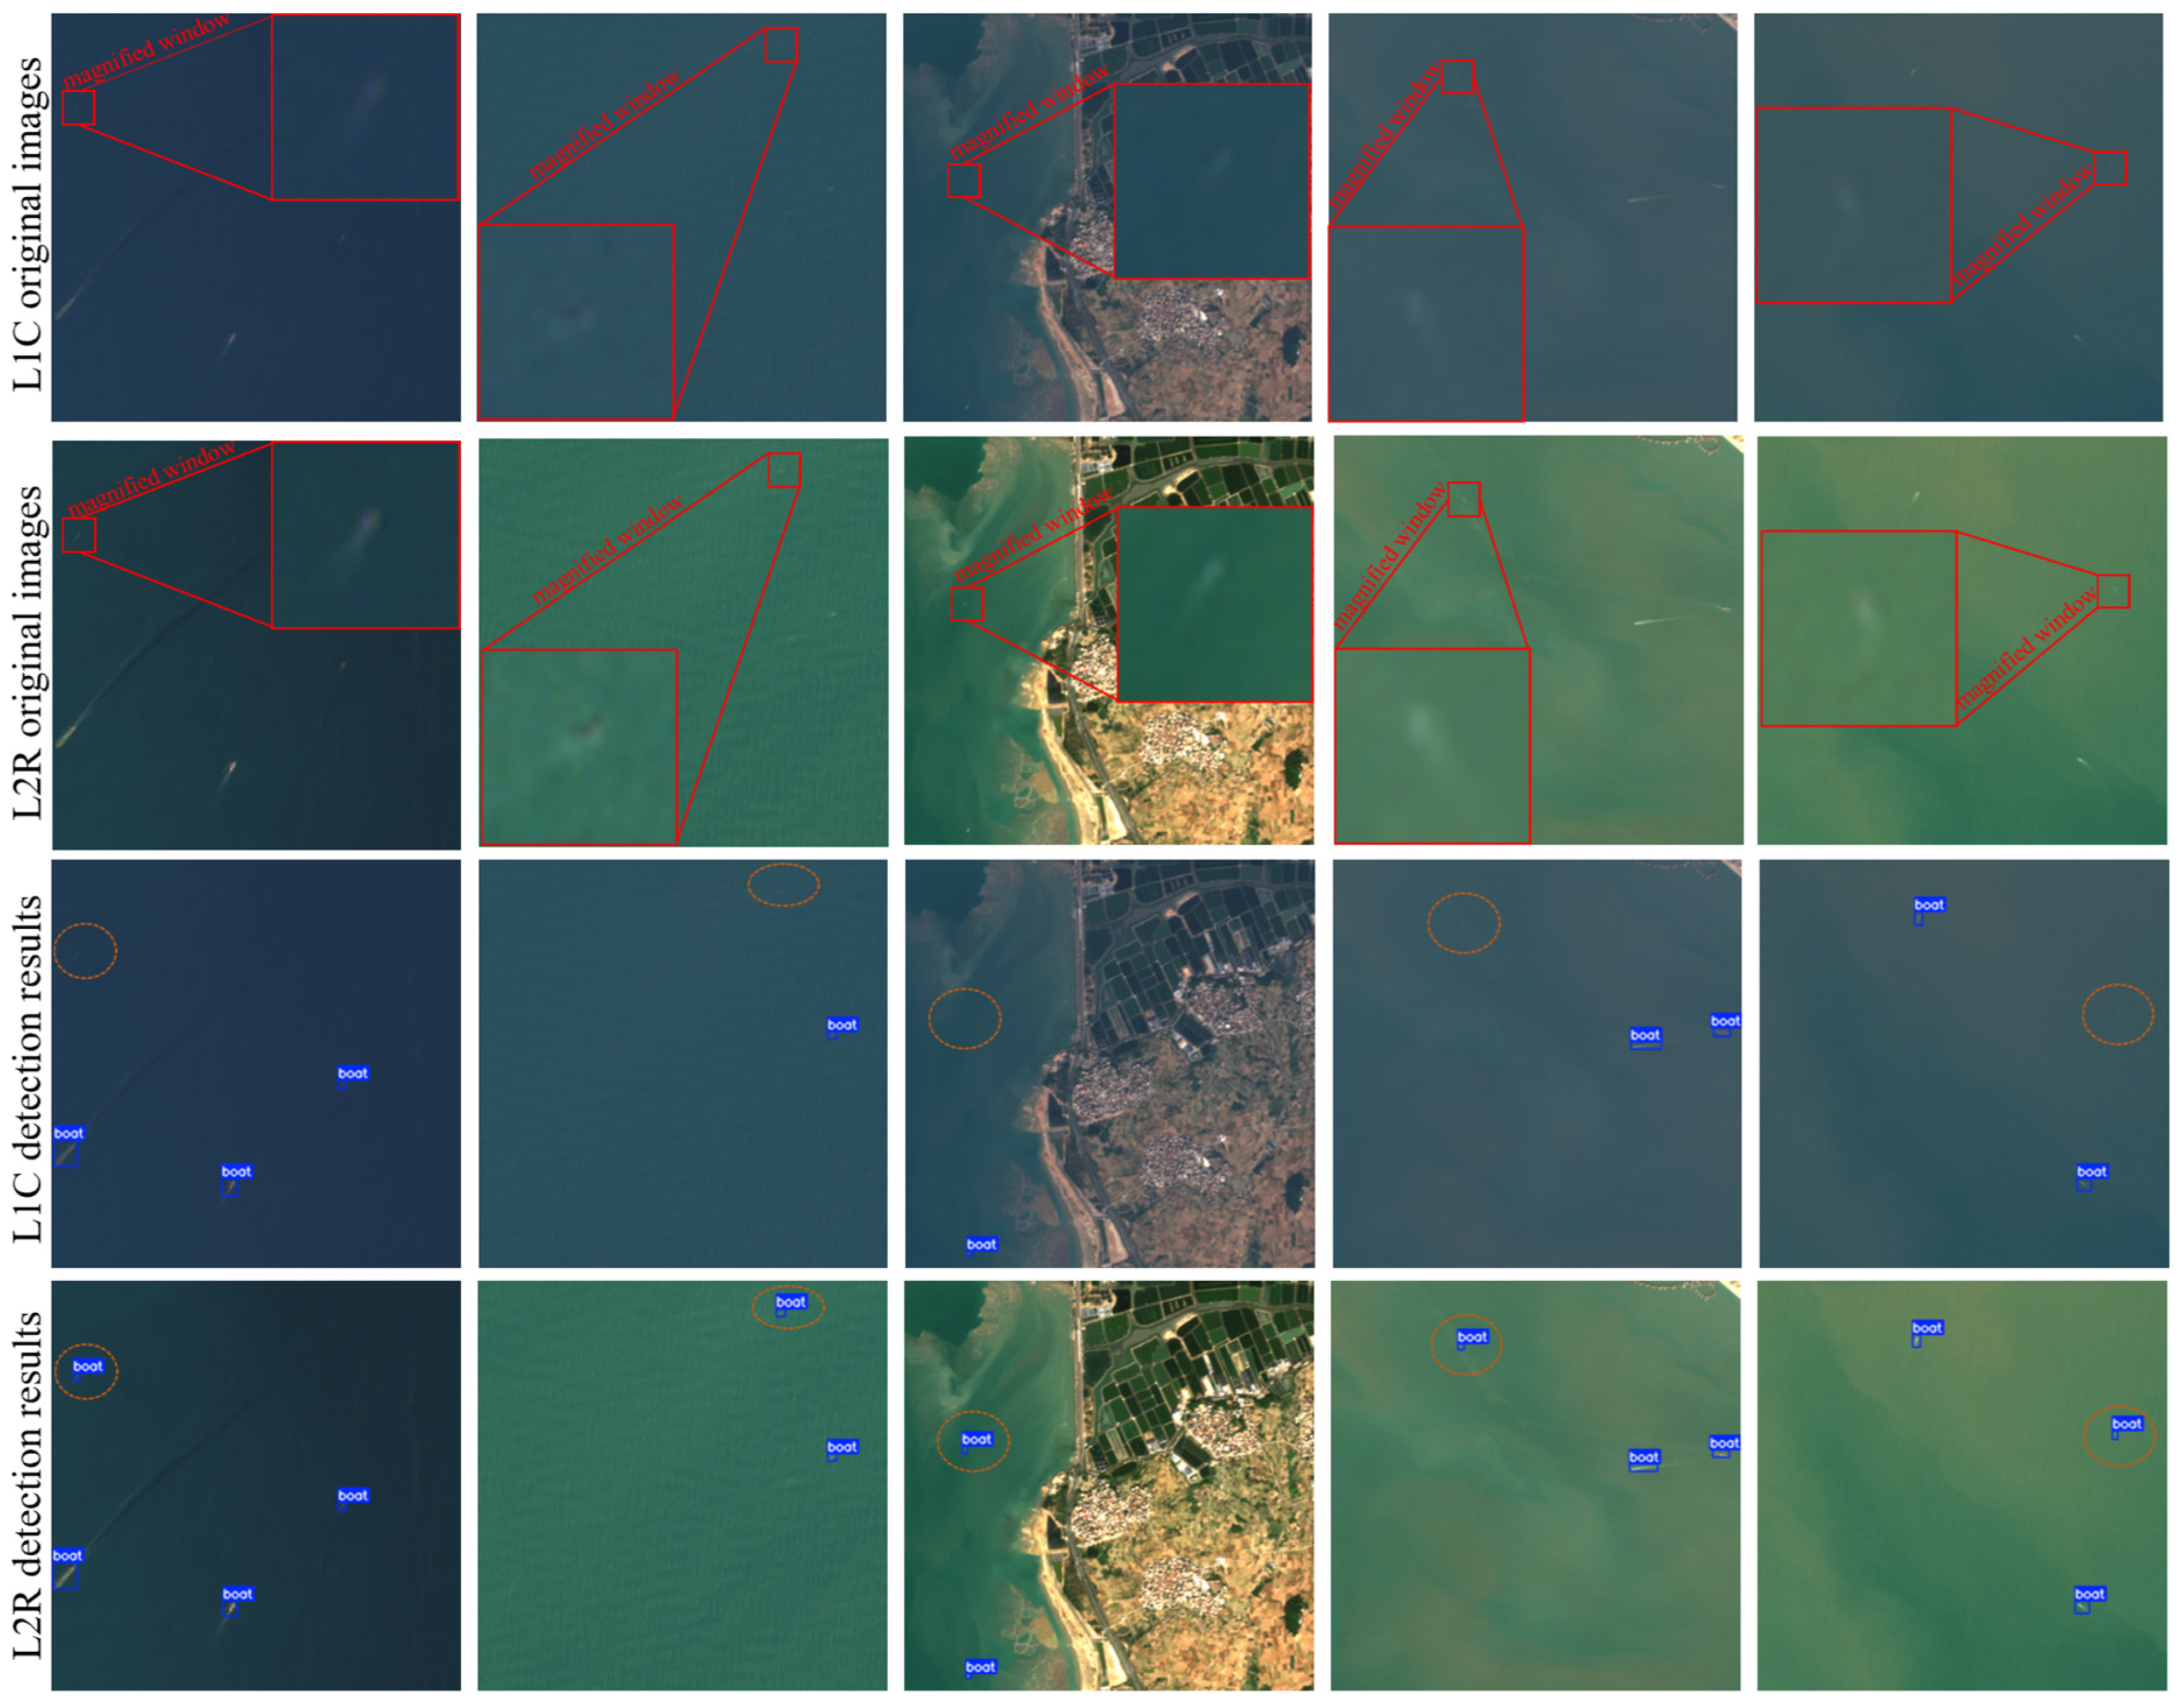
This quantitative improvement is further corroborated by qualitative visual inspections. Figure 6 presents a direct side-by-side visual comparison of the original image patches and the corresponding YOLO26m detection results for both the L1C and L2R datasets. The magnified windows in the top rows clearly illustrate that the original L1C images suffer from atmospheric haze, resulting in a low target-background contrast and making faint vessels extremely difficult to detect. In contrast, the L2R imagery effectively restores the true water-leaving reflectance, producing notably sharper vessel profiles and reducing background clutter. As highlighted by the dashed orange circles in the detection result rows, the model struggles with missed detections (false negatives) on faint, low-contrast targets in the L1C data. However, it accurately identifies and bounds these same vessels in the L2R data.
Figure 6.
Visual comparison of ship detection performance between L1C and L2R datasets using YOLO26m. Red boxes denote magnified windows, while orange dashed circles indicate faint targets that were missed in L1C but detected in L2R.
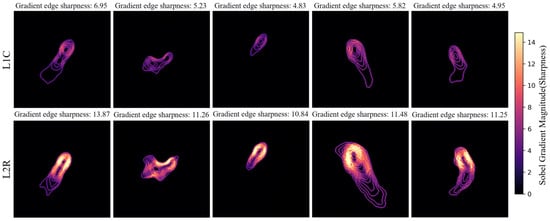
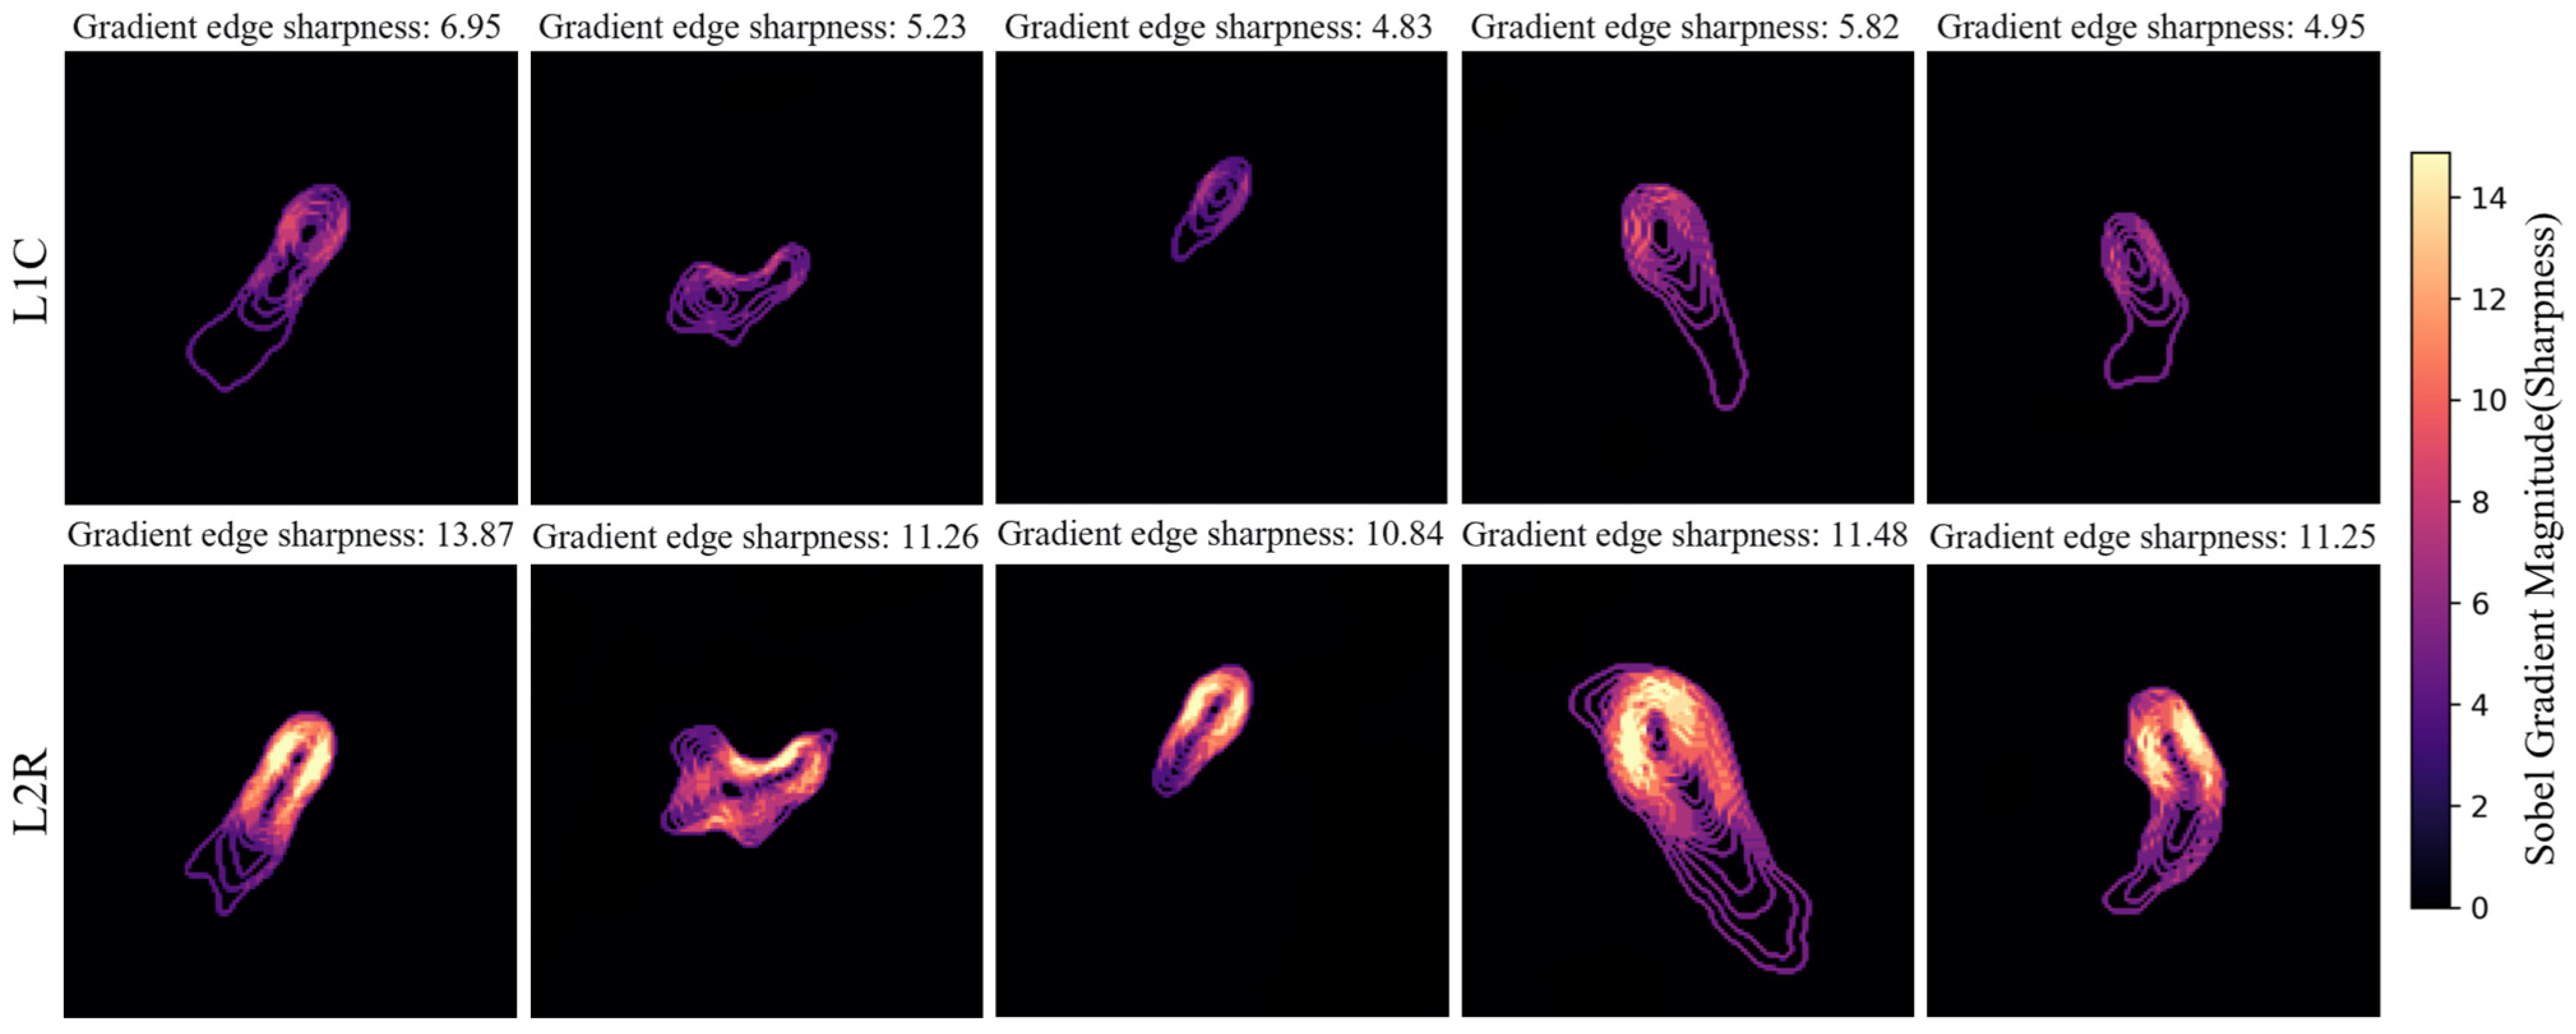
To provide a rigorous physical explanation for the improved detectability and its direct impact on bounding box regression, a pixel-level quantitative assessment was performed using the Sobel gradient operator Figure 7 shows the gradient-magnitude heatmaps for various vessel targets after applying a bilateral filter to suppress high-frequency sea-surface ripples while preserving structural edges. This analysis provides an objective measure of spatial edge sharpness: the vessel contours in the uncorrected L1C data yield relatively weak gradient scores (ranging from 4.83 to 6.95), whereas the exact same targets in the atmospherically corrected L2R data exhibit remarkably intensified edge gradients (ranging from 10.84 to 13.87). Specifically, the structural edge sharpness is quantified by the Average Gradient Magnitude (AGM), defined as:
where and denote the horizontal and vertical gradient components computed via the Sobel operator at pixel , and represents the total pixel count within the localized target patch. By effectively mitigating the low-pass filtering effect caused by aerosol scattering, the L2R data nearly doubles the edge sharpness and restores critical high-frequency spatial details. This pixel-level evidence explains why models trained on the L2R dataset exhibit superior localization and ship-detection performance.
Figure 7.
Quantitative comparison of vessel edge sharpness between the L1C and L2R datasets, assessed using Sobel gradient magnitude. The analysis is based on the magnified windows from Figure 6, highlighting the improvements in spatial edge clarity resulting from atmospheric correction.
Finally, we compare multiple correction schemes against Sen2Cor and 6S AC approaches with YOLO26m, verifying ACOLITE as the optimal solution (Table 3). The empirical results demonstrate that Sen2Cor and 6S AC approaches fail to improve sub-pixel target detection, performing worse or comparably to uncorrected L1C data, as these conventional tools frequently induce over-correction and amplified noise in turbid coastal waters that weaken target-background contrast. In contrast, ACOLITE’s water-specific processing avoids these drawbacks and delivers higher detection accuracy for all metrics, as it accurately retrieves realistic water-leaving reflectance whilst retaining fine target edge features.
Table 3.
Performance comparison of different AC schemes using YOLO26m. The bold numbers represent the best results for each metric.
3.3. Quantitative Optimization of Slicing Parameters and Window Scales
To establish the scientific validity and mathematical optimality of the configurations utilized during the dataset preprocessing pipeline, a 5 × 5 grid search was executed to evaluate the boundary truncation threshold and the background retention rate (Table 4). The joint performance trajectory reveals a single-peak convex surface, where the absolute peak (mAP50: 0.8979, F1-Score: 0.8461) is rigorously achieved at the intersection of a 0.5 truncation threshold and a 10% background retention rate. This parameter optimization landscape is visualized as a continuous composite response surface in Figure S1 (Supplementary Materials), illustrating the sharp performance drop-off when deviating from the optimal core. Lowering background retention (0% or 5%) fails to model background noise, accelerating false positives from wave clutter, whereas exceeding 10% introduces severe class imbalance that dilutes rare vessel features and desensitizes loss gradients. For truncation, a loose threshold (0.3 or 0.4) introduces geometric noise from fragmented boxes that hinders boundary regression, while a strict threshold (0.6 or 0.7) prematurely prunes valid edge targets, suppressing the global recall rate.
Table 4.
Two-dimensional grid search optimization for Truncation Threshold and Negative Retention Rate using YOLO26m on the L2R dataset (Metrics: mAP50 / F1-Score). The bold numbers represent the best results for each metric.
The dimensional scale of the sliding window defines the mathematical balance between preserving target contextual geometry and optimizing global computational throughput (Table 5). Expanding the window size from 160 to 640 pixels compresses the spatial processing batches from 19,346 to 3221, scaling down the full-scene forward pass duration from 16.8 s to 1.09 s. Despite this inverse relationship with speed, the accuracy metrics demonstrate that the 320 × 320 configuration stands as a mathematically optimal resolution.
Table 5.
Performance comparison of different sliding window sizes using YOLO26m on the L2R dataset. The bold numbers represent the best results for each metric.
Restricting the window size to 160 or 256 pixels severely limits the local receptive field, causing narrow boundaries to frequently segment structurally continuous features, such as elongated, high-reflectance turbulent wake structures at patch edges. This spatial fragmentation prevents the attention mechanism of YOLO26m from aggregating necessary hydrodynamic context, thereby suppressing detection precision. Conversely, increasing the window size to 512 or 640 pixels leads to a marked decline in performance, with mAP50 dropping to 0.8291, attributable to spatial feature dilution. At 10 m spatial resolution, sub-pixel-scale small craft embedded within a broad oceanic background experience a substantial reduction in foreground-to-background ratio, causing weak activation signals to be progressively attenuated during successive multi-layer downsampling. Therefore, the configuration of a 320 × 320 pixel window, combined with a 10% negative retention rate and a 0.5 truncation threshold, is empirically validated as the optimal parameter setting under the evaluated conditions.
3.4. Ablation Experiment on Core Modules
To quantitatively evaluate the individual and synergistic contributions of the C3k2 and C2PSA modules embedded in the YOLO26m architecture, a systematic ablation experiment was conducted on the L2R dataset. Four controlled experimental groups were established under identical hardware environments and training hyperparameters, with the quantitative results summarized in Table 6.
Table 6.
Ablation analysis of C2PSA and C3k2 modules within the YOLO26m architecture on the L2R dataset. “✓” and “×” indicate the inclusion and exclusion of the corresponding module, respectively. The bold numbers represent the best results for each metric.
The empirical results demonstrate a stepwise performance decline upon deactivating or isolating either component, confirming their architectural necessity. Specifically, integrating the C3k2 module alone improves target recall by optimizing localized contextual feature aggregation. Conversely, isolating the C2PSA attention mechanism enhances detection precision by capturing global long-range dependencies and suppressing coastal wave clutter. Enabling both modules simultaneously generates prominent synergistic gains, delivering the highest F1-score (0.8461) and mAP50 (0.8979). This mathematical progression demonstrates that pairing fine-scale context aggregation with robust spatial attention vectors provides the optimal architectural design for sub-pixel scale maritime target detection.
3.5. Spatiotemporal Characteristics of Ship Traffic off the Fujian Coast
To demonstrate the application potential of the proposed framework in maritime traffic monitoring, we applied the best-performing YOLO26m model (trained on L2R data) to detect vessels across all available Sentinel-2 imagery for three study regions along the Fujian coast: Fuzhou (50RQP), Xiamen & Quanzhou (50RPN), and Zhangzhou (50QNM), covering the entire year of 2025. The data were consistently selected from relative orbit 089, captured between 10:00 and 12:00 local time to ensure consistency in lighting and viewing angles. Imagery affected by severe cloud cover or extreme sea states, which are known to generate high false-positive rates due to wave interference and sun glint, was carefully excluded. Following a rigorous screening process, three high-quality images were retained for each month. In the post-processing stage, a water body mask was applied to filter out false detections on land, and the remaining detections were used to generate 1 km × 1 km maritime traffic density heatmaps, providing a clear overview of vessel distribution and movement patterns.
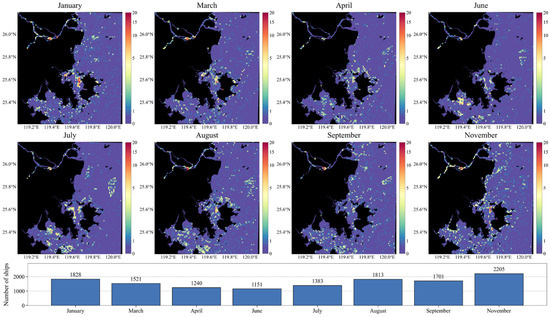
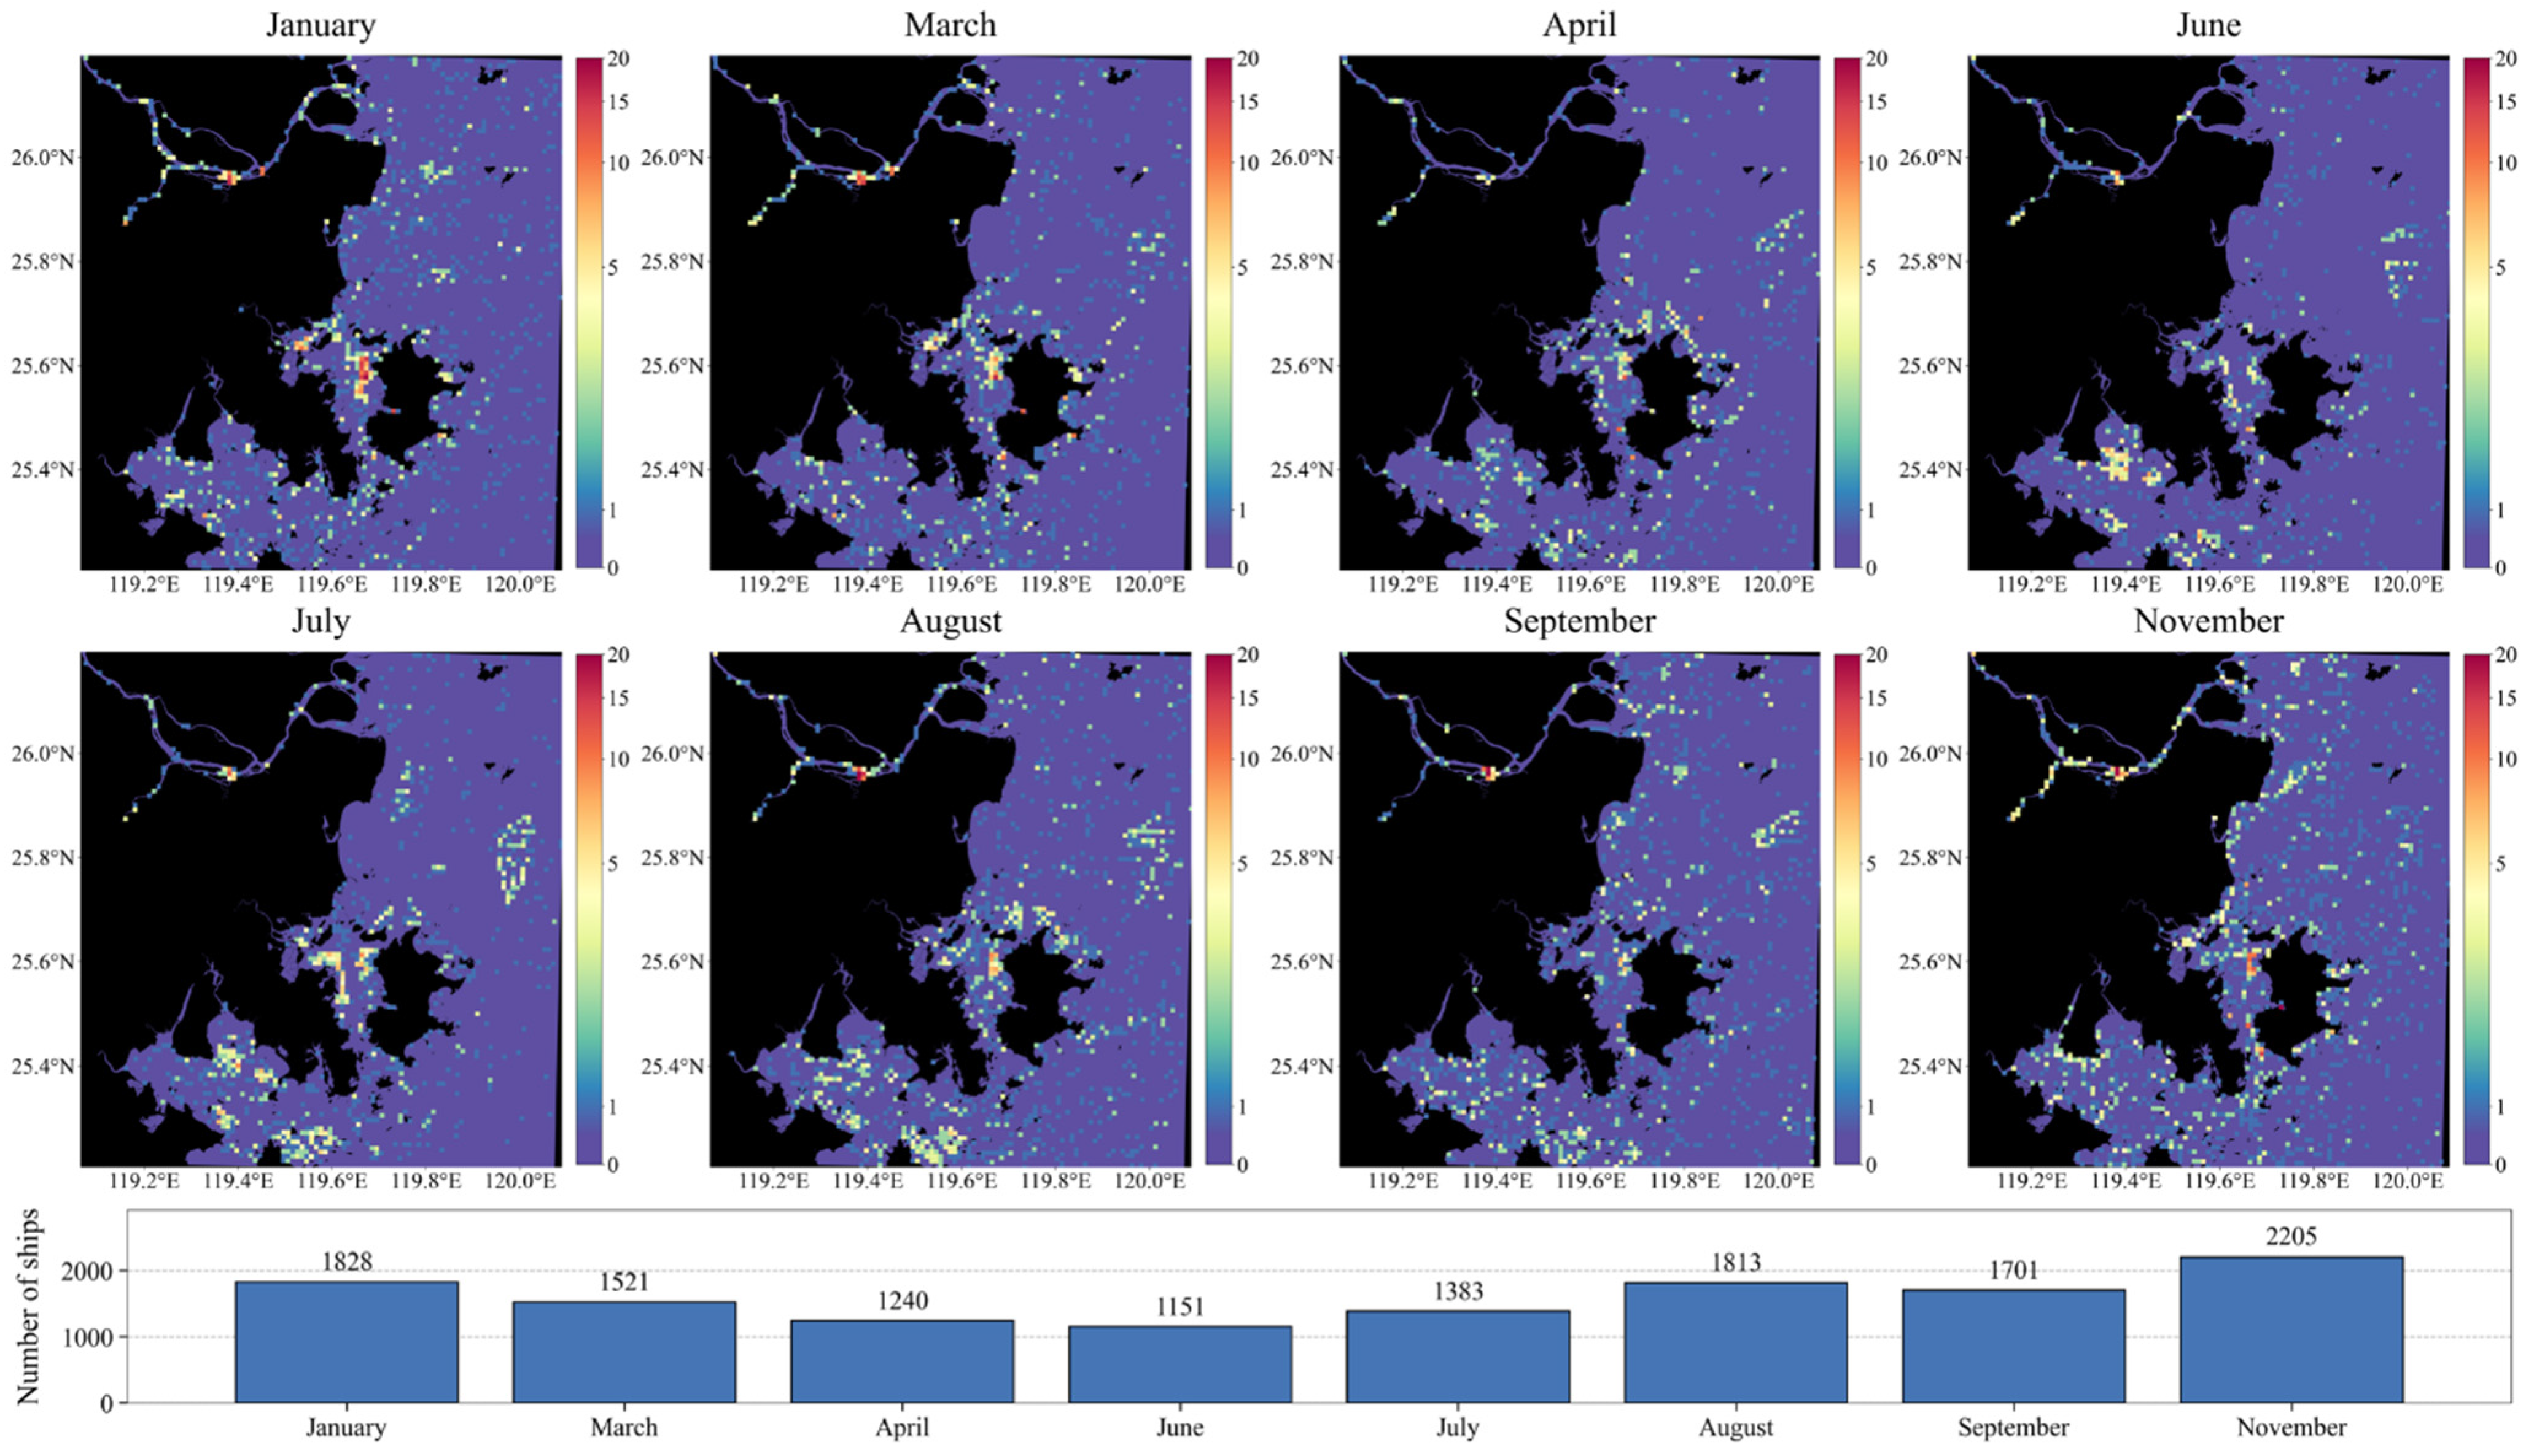
As illustrated in Figure 8, the monitoring of the Fuzhou coastal region (50RQP) encompassed January, March, April, June, July, August, September, and November of 2025. Traffic activity was notably more intense during the autumn and winter months, with November recording the highest total of 2205 detected vessels, including a single-day peak of 856 vessels on 25 November. January (1828 vessels) and August (1813 vessels) followed, with 30 August recording a single-day high of 814 vessels. Traffic volumes were comparatively lower in April (1240 vessels) and June (1151 vessels). The heatmaps reveal a clear shoreward aggregation of vessels, primarily concentrated along the coastline, the Min River Estuary, and primary nearshore shipping lanes. As a critical maritime chokepoint, the Min River Estuary experienced a notable increase in vessel density during the autumn and winter months, driven by higher transport demands and the commencement of the autumn fishing season in the Mindong fishing grounds.
Figure 8.
Monthly maritime traffic heatmaps and detection statistics for the Fuzhou coastal region (50RQP) in 2025. Heatmap values represent the number of vessels detected within a 1 km × 1 km grid.
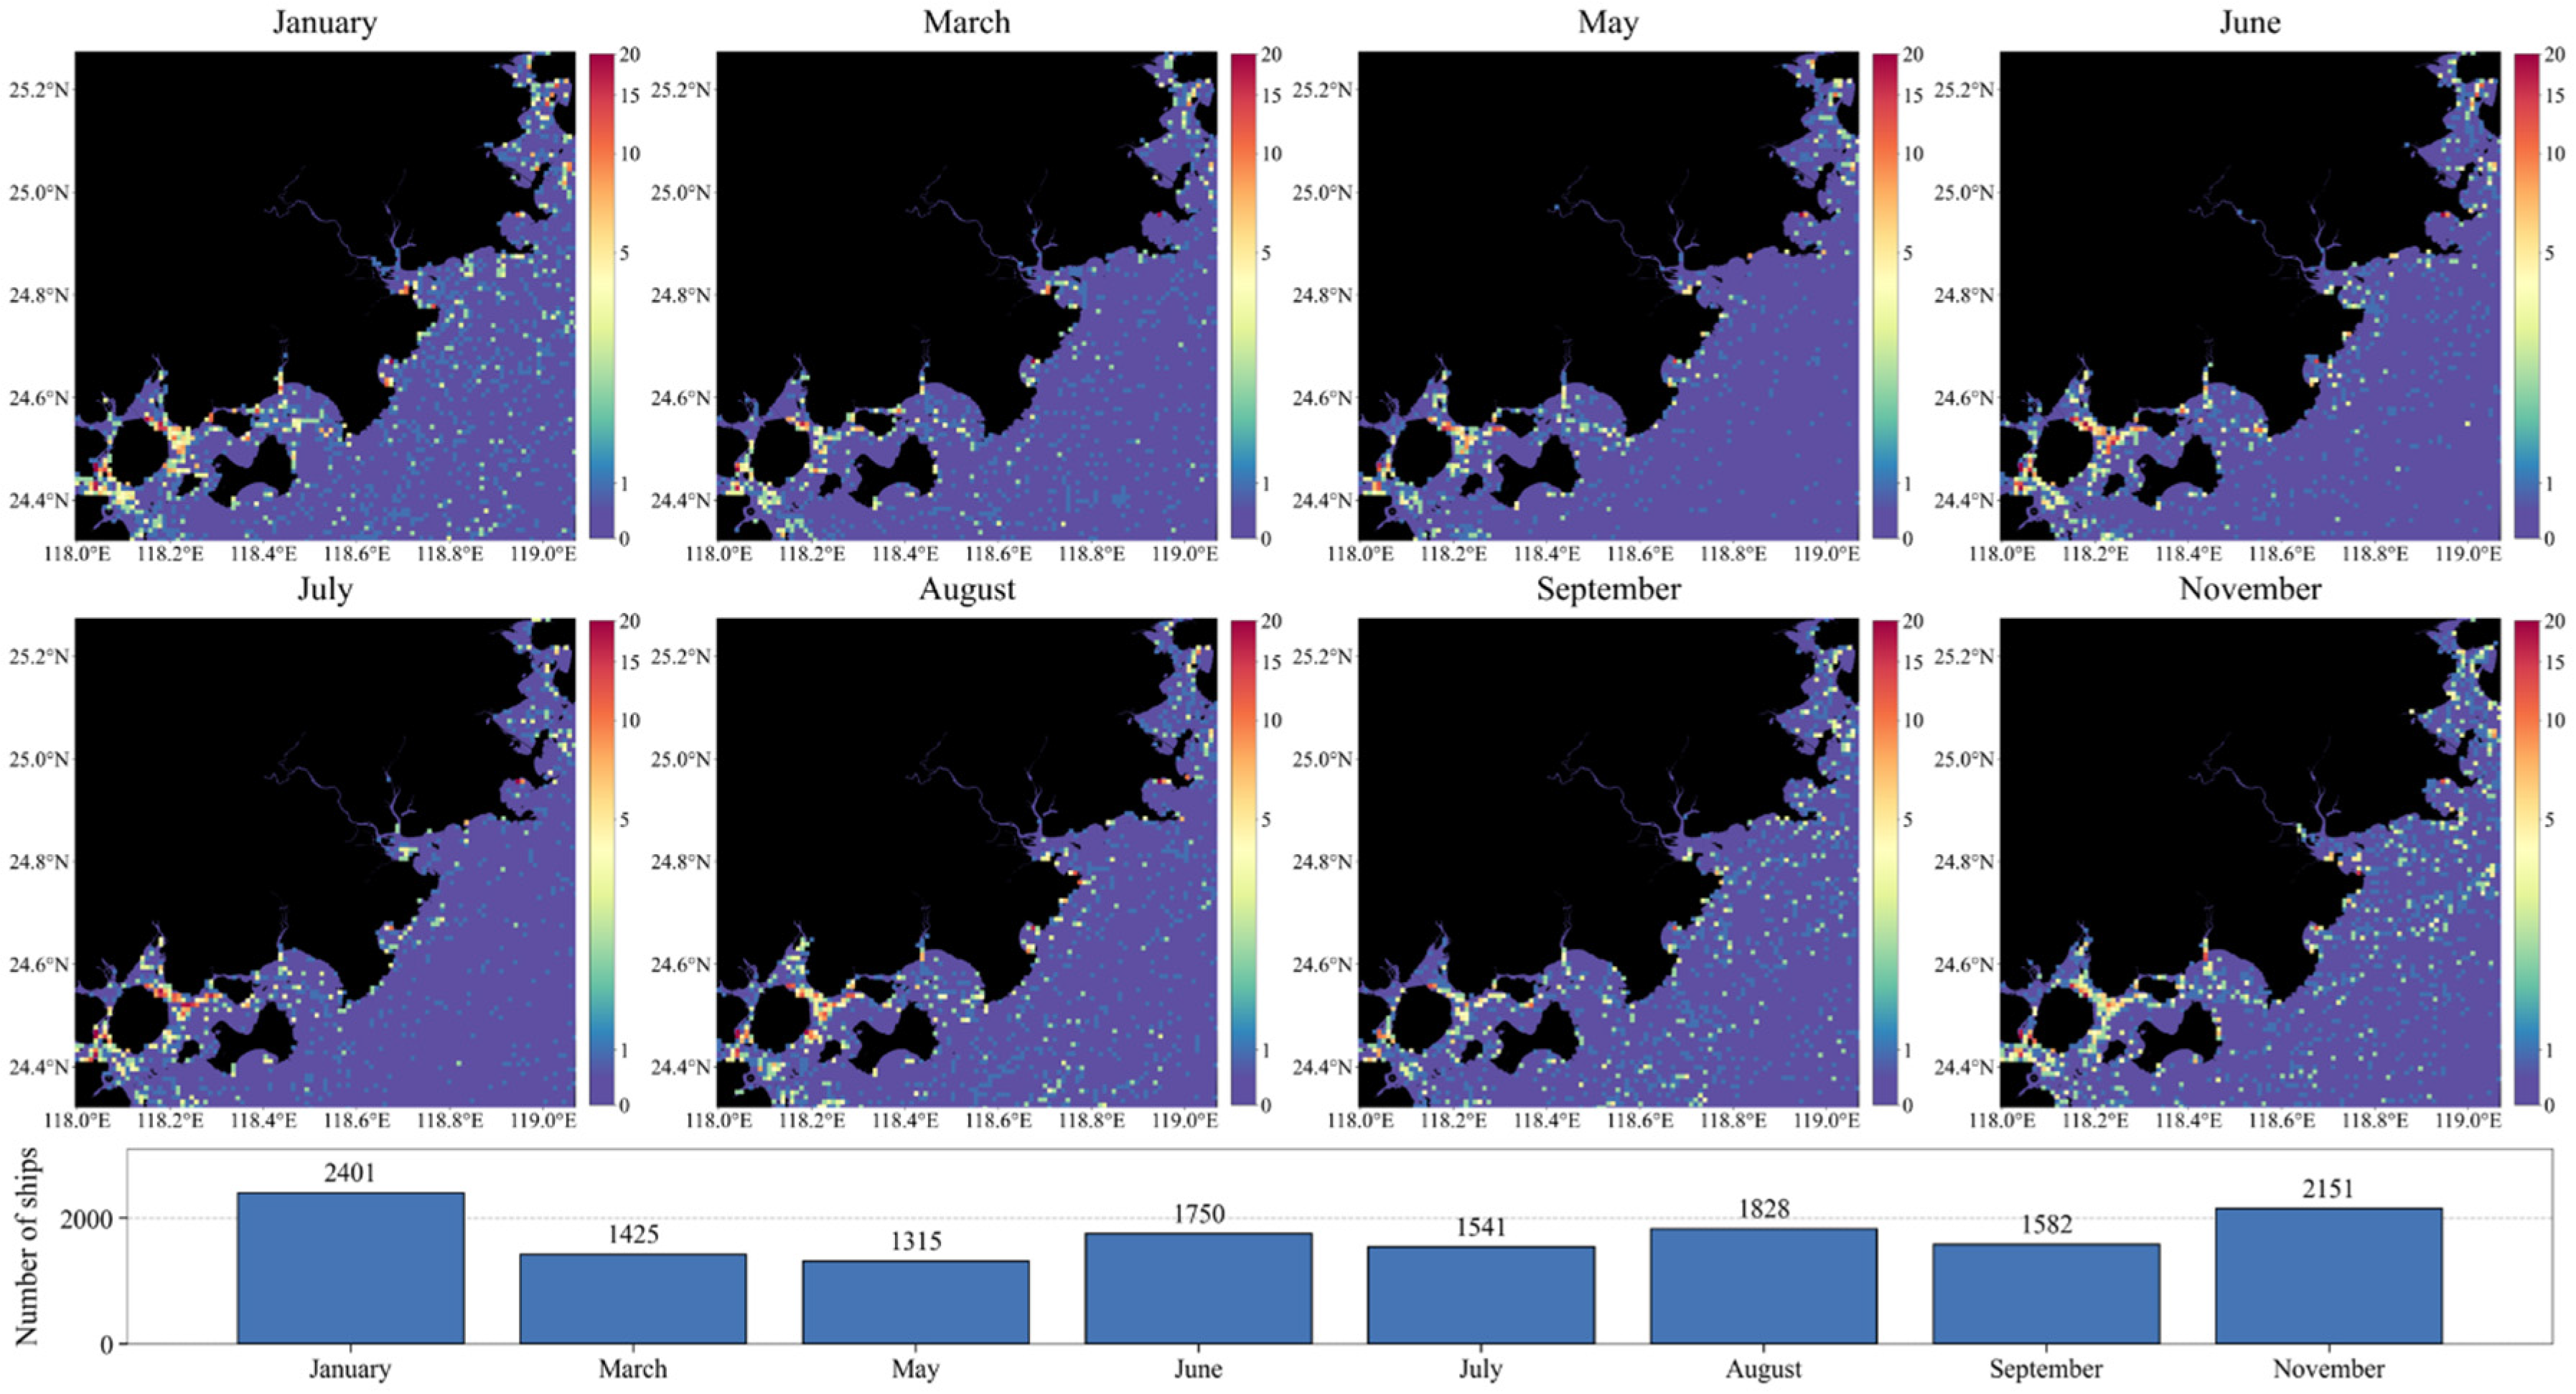
The traffic dynamics for the Xiamen and Quanzhou coastal region (50RPN) during the designated months of 2025 are illustrated in Figure 9. Vessel traffic in this region remained consistently high throughout the year, with a distinct peak observed during the winter months. January recorded the highest vessel count at 2401, including a yearly single-day peak of 1078 vessels on 17 January. November followed closely with 2151 vessels. Robust traffic levels were also observed in August (1828 vessels) and June (1750 vessels), with a notable 987 vessels detected on 30 August. The heatmaps highlight dense vessel concentrations in Xiamen Bay, Quanzhou Bay, and deep-water shipping channels, forming “maritime corridors” characterized by high vessel density. The surge in traffic during January is likely linked to the peak in manufacturing logistics that precedes the Chinese Lunar New Year, driven by increased demand for goods and transportation during this period.
Figure 9.
Monthly maritime traffic heatmaps and detection statistics for the Xiamen and Quanzhou coastal region (50RPN) in 2025. Heatmap values represent the number of vessels detected within a 1 km × 1 km grid.
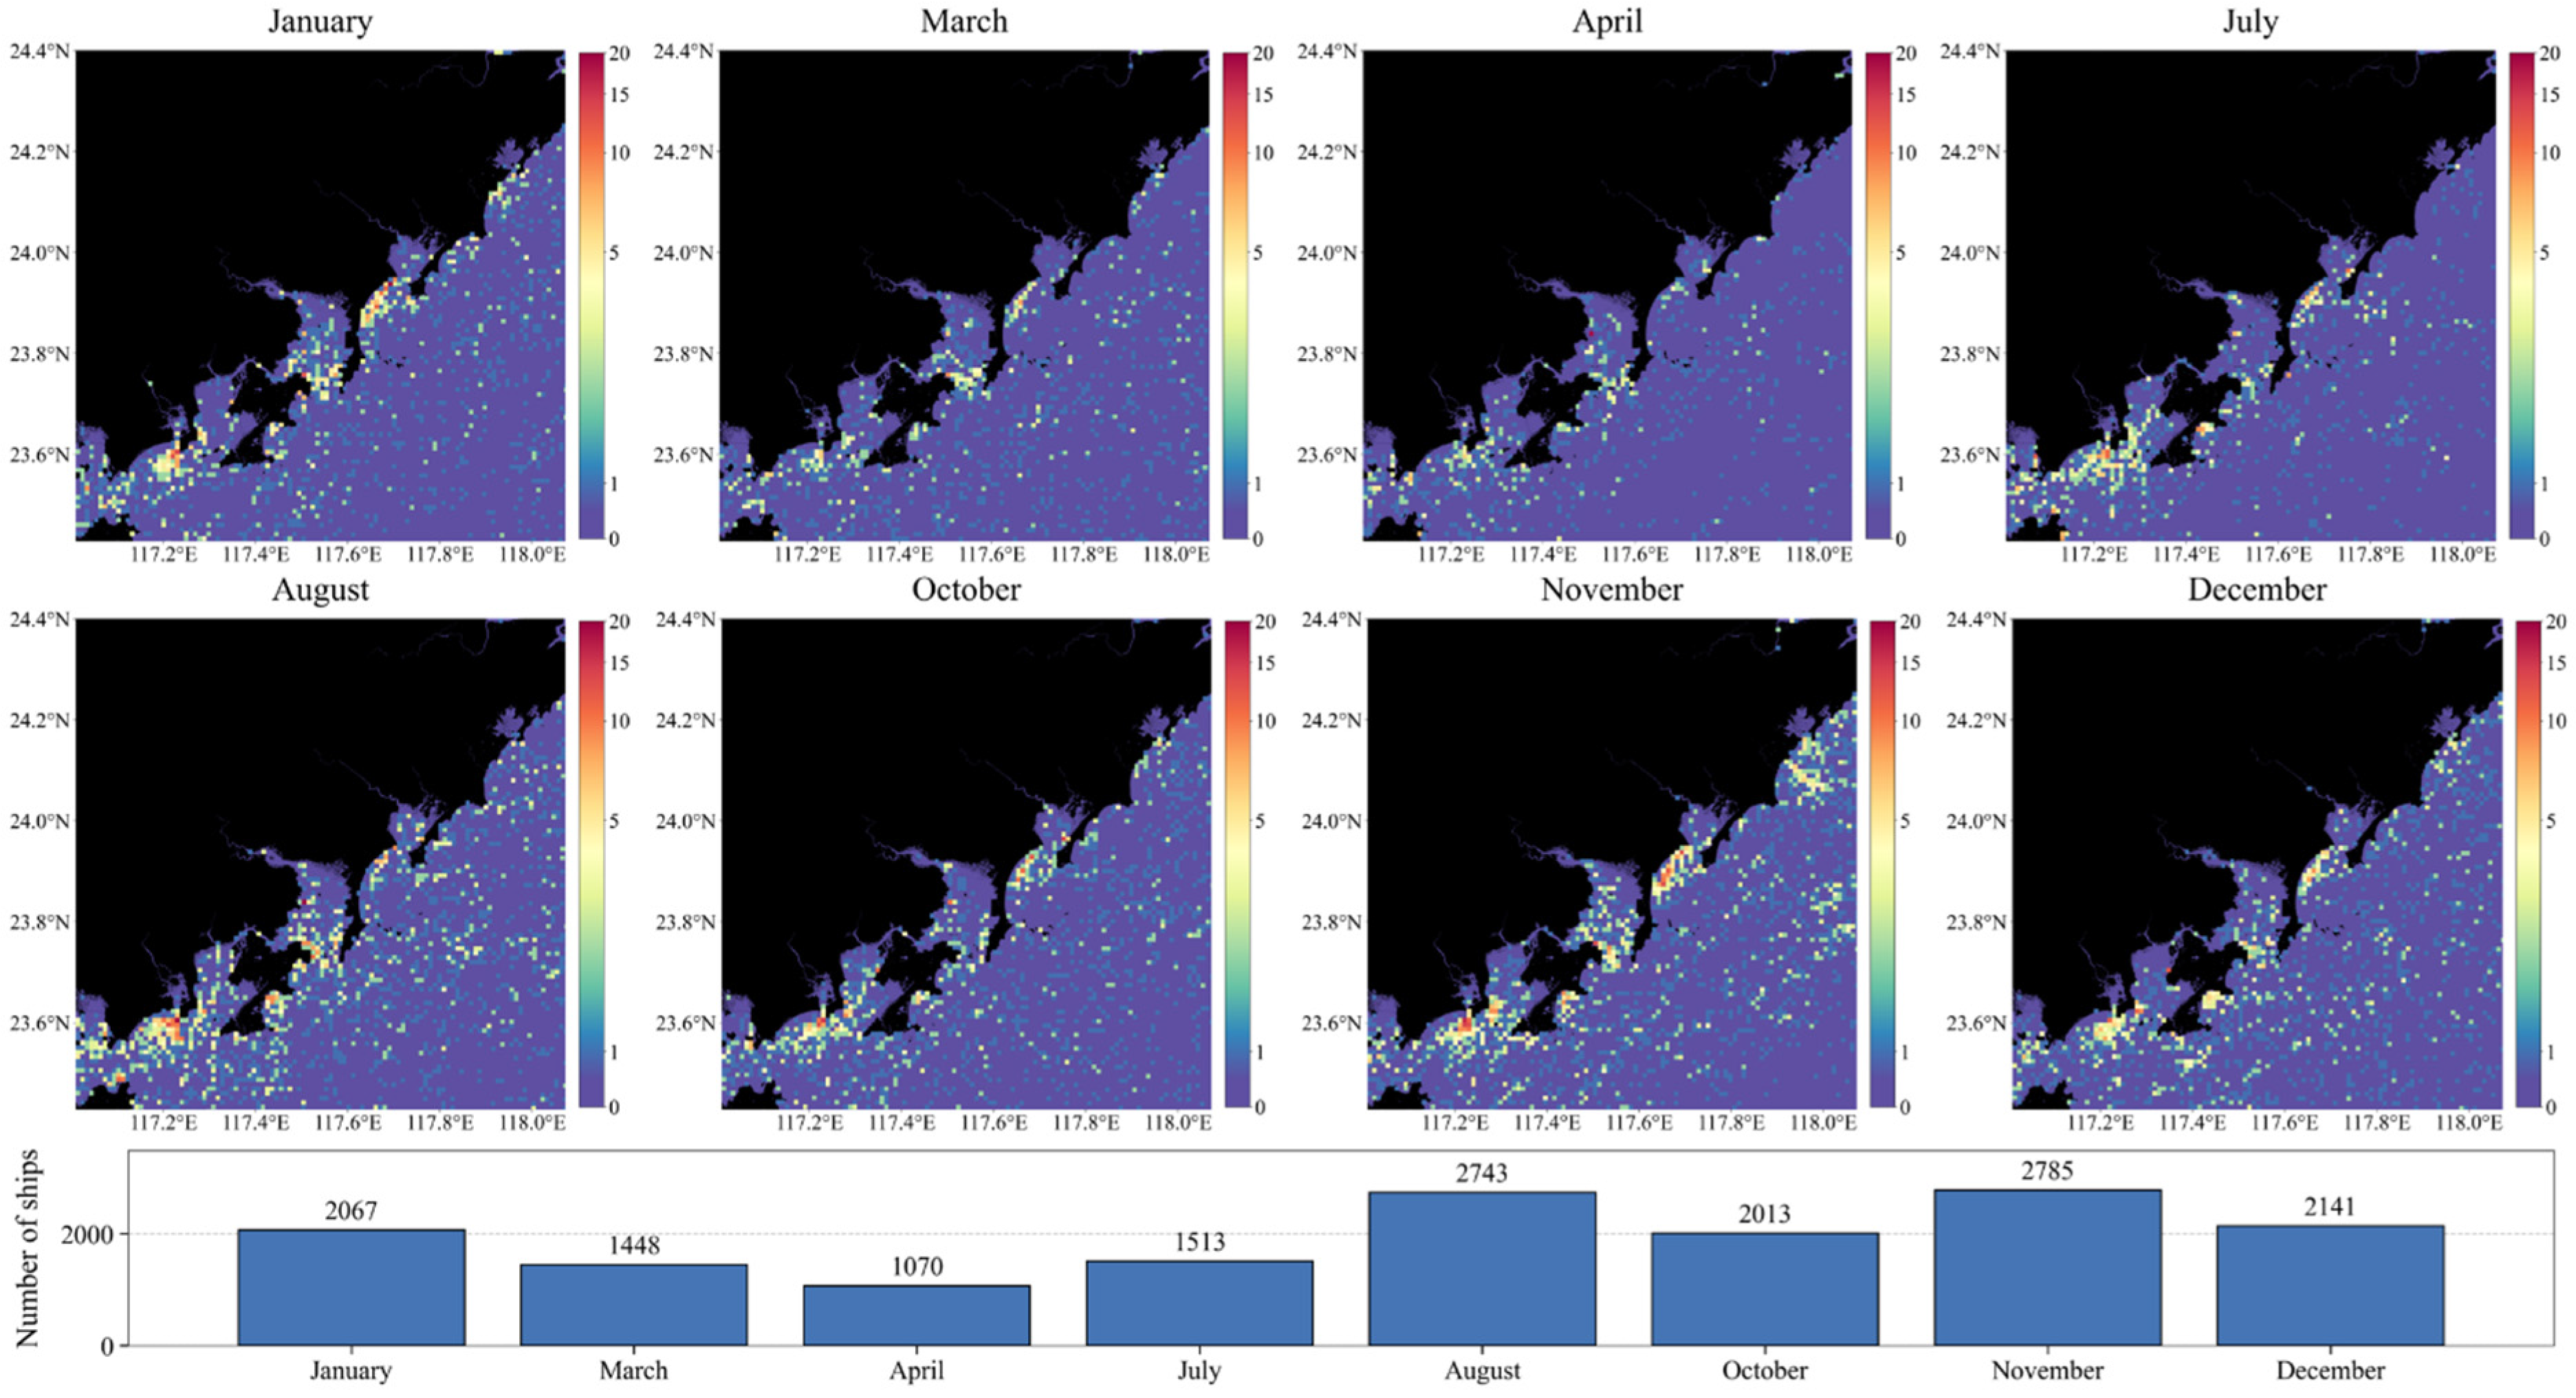
Figure 10 illustrates the spatial distribution of vessel traffic in the Zhangzhou coastal region (50QNM). Traffic density in the second half of the year was notably higher compared to the first half. November (2785 vessels) and August (2743 vessels) marked the annual dual peaks, while April recorded the lowest vessel count of the year at 1070. A regional record was set on 10 August with 1367 vessels detected in a single day, followed closely by 1229 detections on 16 October. Spatial distribution of vessels revealed pronounced hotspots concentrated along the coastline, with particular clustering in nearshore bays such as Dongshan Bay and Zhao’an Bay. These intense seasonal fluctuations are primarily attributed to fishery activities, with the end of the summer fishing moratorium in early August triggering a surge in vessel traffic as fishing fleets resumed operations, while the peaks in October and November were driven by the combined effects of the peak fishing season and increased demand for mariculture-related transportation.
Figure 10.
Monthly maritime traffic heatmaps and detection statistics for the Zhangzhou coastal region (50QNM) in 2025. Heatmap values represent the number of vessels detected within a 1 km × 1 km grid.
Comprehensive analysis indicates that maritime traffic along the Fujian coast exhibits notable seasonal characteristics and high spatial concentration, particularly within ports, estuaries, and key nearshore shipping channels. These results demonstrate that the effectiveness of integrating atmospherically corrected Sentinel-2 L2R data with optimized YOLO-based models in effectively improving the detection accuracy of small vessels in complex coastal environments. Our method enhances detection precision and delivers robust, reliable quantitative insights that are crucial for supporting marine spatial planning, fishery regulation, and the assessment of ecological stressors.
4. Discussion
The empirical results of this study highlight the immense potential of integrating medium-resolution optical remote sensing data with advanced DL technologies for comprehensive maritime traffic surveillance. While the AIS remains the cornerstone of global maritime regulation, it has inherent limitations, including systemic blind spots that cannot be ignored. In addition to the number of small-to-medium vessels lacking transponders due to cost constraints or regulatory gaps, some vessels engaged in Illegal, Unreported, and Unregulated (IUU) fishing deliberately disable their equipment or spoof signals to evade monitoring [6,49]. To overcome these bottlenecks, Sentinel-2 was selected as the core data source. Compared to SAR, which is susceptible to speckle noise, multi-spectral optical imagery provides more intuitive morphological features and turbulent wake signatures, while reflecting sea states and environmental contexts. Furthermore, while the 5-day global revisit cycle is inadequate for real-time tactical tracking, it provides a cost-effective statistical sampling frequency. Combined with the 290 km imaging swath, this configuration meets the requirements for large-scale, long-term strategic observation, and effectively bridges the operational gap between expensive VHR satellites and coarse low-resolution sensors [10,50].
To address the sub-pixel target detection challenges posed by the 10 m spatial resolution of Sentinel-2, the YOLO-based DL framework developed in this study demonstrated exceptional feature extraction and generalization capabilities. In 10 m resolution imagery, a typical small fishing boat may occupy only a few pixels, making it easily confused with seafoam or complex reef edges. However, the top-performing YOLO26m model, through the integration of advanced C2PSA attention mechanisms and C3k2 contextual aggregation modules, is capable of precisely locking onto vessel hulls while effectively extracting V-shaped turbulent wakes as critical spatial prior features [51]. By treating both localization and classification as a unified regression problem, such single-stage detectors achieve high precision while accelerating inference speeds. This efficiency allows for the rapid processing of large-scale remote sensing tiles, meeting the massive computational demands of macroscopic maritime monitoring [14].
A core theoretical finding of this study is the indispensable role of rigorous atmospheric correction (AC) in identifying small targets in optically shallow and complex coastal environments. In nearshore regions, often referred to as Case II waters, the optical properties are highly complex due to suspended sediments and colored dissolved organic matter (CDOM), with up to 90% of the signal received by the satellite sensor originating from atmospheric molecular scattering and aerosol path radiance [18,52]. Direct use of L1C data in such areas can completely obscure faint water-leaving reflectance signals from vessels, masked by this “atmospheric veil.” While prior studies have used ACOLITE-corrected Sentinel-2 imagery for aquatic remote sensing and floating water-surface target detection [53,54,55], the role of such correction in improving the fine-scale boundaries of small vessels for YOLO-based detection remains less explicitly quantified. Therefore, this study uses paired L1C/L2R samples with identical annotations, data partitions, and detector settings to link atmospheric correction with detection performance and Sobel-derived edge sharpness. Pixel-level Sobel gradient analysis provides conclusive evidence that the L2R data nearly doubles the structural edge sharpness of vessel targets, with the localized AGM demonstrating a 2.1-fold mathematical increase, as comprehensively validated in Text S1 and Figure S2 of the Supplementary Materials. This substantial enhancement in radiometric contrast effectively resolves the issue of false negatives (missed detections) caused by low contrast in original data, enabling the DL model to perform inference in a cleaner feature space with a higher signal-to-noise ratio [35].
From a broader perspective of marine spatial planning and integrated management, the high-resolution maritime traffic density heatmaps generated by this framework have profound policy and ecological value [24]. The refined spatiotemporal analysis not only captured the explosive growth of fishing fleets following the end of the summer fishing moratorium in Zhangzhou waters but also mapped the clustering of commercial vessels driven by the pre-Lunar New Year logistics cycle in the Xiamen–Quanzhou region. This objective quantification of maritime activity provides a reliable baseline for optimizing “port-channel” network designs and mitigating collision risks [56]. Moreover, high-frequency traffic mapping serves as a valuable quantitative foundation for assessing human-induced ecological stresses, such as underwater noise pollution, ballast water discharge risks, and potential strike threats to marine mammals [57]. Such insights are essential for the effective implementation of regional targets under UN Sustainable Development Goal 14 (Life Below Water).
Despite these achievements, several challenges remain that must be addressed to fully realize an automated intelligent maritime monitoring system. First, optical remote sensing is highly dependent on clear sky conditions. In the cloud-prone coastal regions of Fujian, many images are often rendered unusable due to heavy cloud cover or intense sea-surface sun glint. Second, the 10 m resolution presents limitations when it comes to fine-grained classification of vessel types, such as distinguishing between bulk carriers, container ships, or specialized fishing vessels, based solely on visual features. Future research should focus on the development of multi-modal data fusion techniques, particularly deep coupling of all-weather SAR data, optical imagery, and real-time AIS trajectories, to create a seamless and robust monitoring network [4]. Additionally, exploring DL super-resolution techniques and deploying lightweight detection models onto satellite-based edge computing units for millisecond-level response to anomalous maritime activities will be critical directions for the next generation of satellite-based maritime regulation technologies [22,58].
5. Conclusions
In this study, we developed a robust end-to-end DL framework for macroscopic maritime traffic monitoring using Sentinel-2 optical imagery. By systematically integrating the ACOLITE AC algorithm, we demonstrated that removing atmospheric interference to restore true water-leaving reflectance effectively enhances target-background contrast and sharpens structural edges of ships. This critical radiometric enhancement enabled the optimized YOLO26m single-stage detector to achieve an F1-score of 0.8461 and an mAP50 of 0.8979 for sub-pixel vessel detection. The practical application of this framework across the Fujian coastal region translated raw detection outputs into high-resolution spatiotemporal traffic heatmaps, capturing complex seasonal characteristics driven by regional commercial logistics and fishing moratoriums. Despite inherent limitations such as weather dependency and restricted classification granularity, this approach provides a highly reliable, cost-effective, and scalable solution to bridge the observational blind spots of traditional AIS data, offering vital quantitative intelligence for advancing marine spatial planning, maritime regulation, and sustainable coastal ecosystem management.
Supplementary Materials
The following supporting information can be downloaded at: https://www.mdpi.com/article/10.3390/rs18142378/s1, Figure S1: Grid search response surface for parameter optimization, where the red star denotes the optimum; Figure S2: Paired effect-size analysis of Sobel-based vessel edge-sharpness enhancement; Text S1: Quantitative validation of Sobel-based vessel edge-sharpness enhancement.
Author Contributions
Conceptualization, Z.S.; methodology, P.Z., Z.S. and X.H.; software, P.Z. and Z.S.; validation, P.Z.; formal analysis, Z.S., Q.N. and S.Y.; investigation, P.Z. and Z.S.; resources, P.Z., X.H. and Z.L.; data curation, W.M., X.D. and Y.J.; writing—original draft preparation, P.Z.; writing—review and editing, Z.S., W.M., X.H. and S.Y.; visualization, X.H., S.Y., Y.J. and Q.N.; supervision, X.Z., W.M. and X.D.; project administration, W.M., Z.L. and X.D.; funding acquisition, W.M., Z.L. and Q.N. All authors have read and agreed to the published version of the manuscript.
Funding
This work was supported by the Research Startup Fund of Xiamen University of Technology (Grant #YKJ25049R), the Natural Science Foundation of Fujian Province (Grants #2021H0026, #2025J011276, #2024J011194, and #2023J011427), the Xiamen Industry–University–Research Cooperation Project (Grant #2024FCD012025010117), the Natural Resources Science and Technology Innovation Project of Fujian Province (Grant # KY-030000-04-2025-022), the Research Project of Fujian Provincial Department of Industry and Information Technology (Grant #50102250012), and the Special Project of the Academician Expert Station of Xiamen University of Technology (Grant #50199250001).
Data Availability Statement
Sentinel-2 data can be downloaded from the European Space Agency (ESA) Copernicus Open Access Hub (https://browser.dataspace.copernicus.eu/; accessed on 28 March 2026). Dataset for ship traffic monitoring from Sentinel-2 images in Fujian coastal waters are openly and freely available at Figshare (https://doi.org/10.6084/m9.figshare.32113534).
Acknowledgments
We gratefully thank the European Space Agency (ESA) Copernicus Open Access Hub for providing the Sentinel-2 data (https://browser.dataspace.copernicus.eu/). We highly appreciate the Royal Belgian Institute of Natural Sciences (RBINS) for providing the open-source ACOLITE atmospheric correction processor (https://github.com/acolite/acolite; accessed on 28 March 2026).
Conflicts of Interest
The authors declare no conflicts of interest.
References
- Virtanen, E.A.; Kallio, N.; Nurmi, M.; Jernberg, S.; Saikkonen, L.; Forsblom, L. Recreational land use contributes to the loss of marine biodiversity. People Nat. 2023, 6, 1758–1773. [Google Scholar] [CrossRef] [Scilit]
- United Nations Conference on Trade and Development (UNCTAD). Review of Maritime Transport 2021 Overview: Challenges Faced by Seafarers in View of the COVID-19 Crisis. 2021. Available online: https://digitallibrary.un.org/record/4042158?ln=zh_CN&v=pdf (accessed on 28 March 2026).
- Reggiannini, M.; Salerno, E.; Bacciu, C.; D’Errico, A.; Lo Duca, A.; Marchetti, A.; Martinelli, M.; Mercurio, C.; Mistretta, A.; Righi, M.; et al. Remote Sensing for Maritime Traffic Understanding. Remote Sens. 2024, 16, 557. [Google Scholar] [CrossRef] [Scilit]
- Li, F.; Yu, K.; Yuan, C.; Tian, Y.; Yang, G.; Yin, K.; Li, Y. Dark Ship Detection via Optical and SAR Collaboration: An Improved Multi-Feature Association Method Between Remote Sensing Images and AIS Data. Remote Sens. 2025, 17, 2201. [Google Scholar] [CrossRef] [Scilit]
- Hague, E.; Walters, A.; Moscrop, A.; Steel, E.; Dyke, K.; Hartny-Mills, L.; Lomax, A.; Dudley, R.; Garrard, P.; Hampson, J.; et al. AIS data underrepresents vessel traffic around coastal Scotland. Mar. Policy 2025, 178, 106719. [Google Scholar] [CrossRef] [Scilit]
- Paolo, F.S.; Kroodsma, D.; Raynor, J.; Hochberg, T.; Davis, P.; Cleary, J.; Marsaglia, L.; Orofino, S.; Thomas, C.; Halpin, P. Satellite mapping reveals extensive industrial activity at sea. Nature 2024, 625, 85–91. [Google Scholar] [CrossRef] [Scilit] [PubMed]
- Shao, Z.; Lyu, H.; Yin, Y.; Cheng, T.; Gao, X.; Zhang, W.; Jing, Q.; Zhao, Y.; Zhang, L. Multi-Scale Object Detection Model for Autonomous Ship Navigation in Maritime Environment. J. Mar. Sci. Eng. 2022, 10, 1783. [Google Scholar] [CrossRef] [Scilit]
- Wu, B.; Liu, C.; Chen, J. A Review of Spaceborne High-Resolution Spotlight/Sliding Spotlight Mode SAR Imaging. Remote Sens. 2024, 17, 38. [Google Scholar] [CrossRef] [Scilit]
- Yoshida, T.; Ouchi, K. Detection of Ships Cruising in the Azimuth Direction Using Spotlight SAR Images with a Deep Learning Method. Remote Sens. 2022, 14, 4691. [Google Scholar] [CrossRef] [Scilit]
- Kanan, A.H.; Vittorio, M.; Giupponi, C. A Deep Learning Approach for Boat Detection in the Venice Lagoon. Remote Sens. 2026, 18, 421. [Google Scholar] [CrossRef] [Scilit]
- Kurekin, A.A.; Loveday, B.R.; Clements, O.; Quartly, G.D.; Miller, P.I.; Wiafe, G.; Adu Agyekum, K. Operational Monitoring of Illegal Fishing in Ghana through Exploitation of Satellite Earth Observation and AIS Data. Remote Sens. 2019, 11, 293. [Google Scholar] [CrossRef] [Scilit]
- Xiuling, Z.; Huijuan, W.; Yu, S.; Gang, C.; Suhua, Z.; Quanbo, Y. Starting from the structure: A review of small object detection based on deep learning. Image Vis. Comput. 2024, 146, 105054. [Google Scholar] [CrossRef] [Scilit]
- Zhang, X.; Zhang, T.; Wang, G.; Zhu, P.; Tang, X.; Jia, X.; Jiao, L. Remote Sensing Object Detection Meets Deep Learning: A metareview of challenges and advances. IEEE Geosci. Remote Sens. Mag. 2023, 11, 8–44. [Google Scholar] [CrossRef] [Scilit]
- Gui, S.; Song, S.; Qin, R.; Tang, Y. Remote Sensing Object Detection in the Deep Learning Era—A Review. Remote Sens. 2024, 16, 327. [Google Scholar] [CrossRef] [Scilit]
- Redmon, J.; Divvala, S.; Girshick, R.; Farhadi, A. You Only Look Once: Unified, Real-Time Object Detection. In Proceedings of the 2016 IEEE Conference on Computer Vision and Pattern Recognition (CVPR), Denver, CO, USA, 5–7 June 2016; Computer Vision Foundation: New York, NY, USA, 2016; pp. 779–788. [Google Scholar]
- Zhao, T.; Wang, Y.; Li, Z.; Gao, Y.; Chen, C.; Feng, H.; Zhao, Z. Ship Detection with Deep Learning in Optical Remote-Sensing Images: A Survey of Challenges and Advances. Remote Sens. 2024, 16, 1145. [Google Scholar] [CrossRef] [Scilit]
- Magalhães, R.; Falcão, A.P.; Barbosa, A. Vessel detection leveraging satellite imagery and YOLO in maritime surveillance. Remote Sens. Appl. Soc. Environ. 2025, 40, 101730. [Google Scholar] [CrossRef] [Scilit]
- Lathif, S.A.; Al Shehhi, M.R. Sensitivity Assessment of Atmospheric Corrections for Clear and Moderately Turbid Optical Waters. IEEE J. Sel. Top. Appl. Earth Obs. Remote Sens. 2025, 18, 1174–1195. [Google Scholar] [CrossRef] [Scilit]
- Warren, M.A.; Simis, S.G.H.; Martinez-Vicente, V.; Poser, K.; Bresciani, M.; Alikas, K.; Spyrakos, E.; Giardino, C.; Ansper, A. Assessment of atmospheric correction algorithms for the Sentinel-2A MultiSpectral Imager over coastal and inland waters. Remote Sens. Environ. 2019, 225, 267–289. [Google Scholar] [CrossRef] [Scilit]
- Chen, Y.; Li, Y.; Wang, J.; Chen, W.; Zhang, X. Remote Sensing Image Ship Detection under Complex Sea Conditions Based on Deep Semantic Segmentation. Remote Sens. 2020, 12, 625. [Google Scholar] [CrossRef] [Scilit]
- Hong, X.; Fu, D.; Tang, J.; Lyne, V.; Luo, M.; Su, F. Ship detection in reefs and deep-sea with medium-high resolution images. Geo-Spat. Inf. Sci. 2024, 28, 1653–1667. [Google Scholar] [CrossRef] [Scilit]
- Fang, Z.; Wang, X.; Zhang, L.; Jiang, B. YOLO-RSA: A Multiscale Ship Detection Algorithm Based on Optical Remote Sensing Image. J. Mar. Sci. Eng. 2024, 12, 603. [Google Scholar] [CrossRef] [Scilit]
- Nelson, K.E. Fishing Vessel Detection in Exclusive Economic Zones from Low Earth Orbit Satellites with Power and Computational Constraints. Master’s Thesis, Utah State University, Logan, UT, USA, 2024. [Google Scholar]
- Luo, F.; He, L.; He, Z.; Zeng, W.; Wang, Y. Evaluation of Coastal Ecological Security Barrier Functions Based on Ecosystem Services: A Case Study of Fujian Province, China. Sustainability 2024, 16, 6787. [Google Scholar] [CrossRef] [Scilit]
- Zhu, C.; Lei, J.; Wang, Z.; Zheng, D.; Yu, C.; Chen, M.; He, W. Risk Analysis and Visualization of Merchant and Fishing Vessel Collisions in Coastal Waters: A Case Study of Fujian Coastal Area. J. Mar. Sci. Eng. 2024, 12, 681. [Google Scholar] [CrossRef] [Scilit]
- Prata, A.T.; Schroeder, T.; Woodcock, R.; Cherukuru, N.; Anstee, J.; Paget, M.J.; Lovell, J.; Qin, Y.; Held, A. Evaluation of the ACOLITE atmospheric correction algorithm at a tropical coastal site. Opt. Express 2025, 33, 52373–52398. [Google Scholar] [CrossRef] [Scilit]
- Vanhellemont, Q.; Ruddick, K. Atmospheric correction of metre-scale optical satellite data for inland and coastal water applications. Remote Sens. Environ. 2018, 216, 586–597. [Google Scholar] [CrossRef] [Scilit]
- Vanhellemont, Q. Adaptation of the dark spectrum fitting atmospheric correction for aquatic applications of the Landsat and Sentinel-2 archives. Remote Sens. Environ. 2019, 225, 175–192. [Google Scholar] [CrossRef] [Scilit]
- Drusch, M.; Del, U.; Carlier, S.; Colin, O.; Fernandez, V.; Gascon, F.; Hoersch, B.; Isola, C.; Laberinti, P.; Martimort, P. Sentinel-2: ESA’s Optical High-Resolution Mission for GMES Operational Services. Remote Sens. Environ. 2012, 120, 25–36. [Google Scholar] [CrossRef] [Scilit]
- Pahlevan, N.; Sarkar, S.; Franz, B.A.; Balasubramanian, S.V.; He, J. Sentinel-2 MultiSpectral Instrument (MSI) data processing for aquatic science applications: Demonstrations and validations. Remote Sens. Environ. 2017, 201, 47–56. [Google Scholar] [CrossRef] [Scilit]
- Main-Knorn, M.; Pflug, B.; Louis, J.; Debaecker, V.; Müller-Wilm, U.; Gascon, F. Sen2Cor for Sentinel-2; SPIE: Bellingham, WA, USA, 2017; Volume 10427. [Google Scholar]
- Vermote, E.F.; Tanre, D.; Deuze, J.L.; Herman, M.; Morcette, J.J. Second Simulation of the Satellite Signal in the Solar Spectrum, 6S: An overview. IEEE Trans. Geosci. Remote Sens. 1997, 35, 675–686. [Google Scholar] [CrossRef] [Scilit]
- Liu, Y.; Zhang, R.; Deng, R.; Zhao, J. Ship detection and classification based on cascaded detection of hull and wake from optical satellite remote sensing imagery. GISci. Remote Sens. 2023, 60, 2196159. [Google Scholar] [CrossRef] [Scilit]
- Zhang, J.; Huang, B.; Chen, G.; Ge, L.; Xia, L.; Zhang, X. DHT-SWNet: Frequency-aware ship and wake detection in multi-source optical remote sensing imagery. ISPRS J. Photogramm. Remote Sens. 2026, 235, 399–415. [Google Scholar] [CrossRef] [Scilit]
- Pahlevan, N.; Mangin, A.; Balasubramanian, S.V.; Smith, B.; Alikas, K.; Arai, K.; Barbosa, C.; Bélanger, S.; Binding, C.; Bresciani, M.; et al. ACIX-Aqua: A global assessment of atmospheric correction methods for Landsat-8 and Sentinel-2 over lakes, rivers, and coastal waters. Remote Sens. Environ. 2021, 258, 112366. [Google Scholar] [CrossRef] [Scilit]
- Cheng, J.; Xiang, D.; Tang, J.; Zheng, Y.; Guan, D.; Du, B. Inshore Ship Detection in Large-Scale SAR Images Based on Saliency Enhancement and Bhattacharyya-like Distance. Remote Sens. 2022, 14, 2832. [Google Scholar] [CrossRef] [Scilit]
- Xia, G.-S.; Bai, X.; Ding, J.; Zhu, Z.; Belongie, S.; Luo, J.; Datcu, M.; Pelillo, M.; Zhang, L. DOTA: A Large-scale Dataset for Object Detection in Aerial Images. arXiv 2017, arXiv:1711.10398. [Google Scholar] [CrossRef] [Scilit]
- Li, K.; Wan, G.; Cheng, G.; Meng, L.; Han, J. Object detection in optical remote sensing images: A survey and a new benchmark. ISPRS J. Photogramm. Remote Sens. 2020, 159, 296–307. [Google Scholar] [CrossRef] [Scilit]
- Ren, S.; He, K.; Girshick, R.; Sun, J. Faster R-CNN: Towards Real-Time Object Detection with Region Proposal Networks. arXiv 2015, arXiv:1506.01497. [Google Scholar] [CrossRef] [Scilit]
- Liu, W.; Anguelov, D.; Erhan, D.; Szegedy, C.; Reed, S.; Fu, C.-Y.; Berg, A.C. SSD: Single Shot MultiBox Detector. arXiv 2015, arXiv:1512.02325. [Google Scholar] [CrossRef] [Scilit]
- Lin, T.Y.; Goyal, P.; Girshick, R.; He, K.; Dollar, P. Focal Loss for Dense Object Detection. IEEE Trans. Pattern Anal. Mach. Intell. 2020, 42, 318–327. [Google Scholar] [CrossRef] [Scilit] [PubMed]
- Wang, A.; Chen, H.; Liu, L.; Chen, K.; Lin, Z.; Han, J.; Ding, G. YOLOv10: Real-Time End-to-End Object Detection. arXiv 2024, arXiv:2405.14458. [Google Scholar] [CrossRef] [Scilit]
- Wang, C.-Y.; Yeh, I.-H.; Liao, H.-Y.M. YOLOv9: Learning What You Want to Learn Using Programmable Gradient Information. arXiv 2024, arXiv:2402.13616. [Google Scholar] [CrossRef] [Scilit]
- Sapkota, R.; Harsha Cheppally, R.; Sharda, A.; Karkee, M. YOLO26: Key Architectural Enhancements and Performance Benchmarking for Real-Time Object Detection. arXiv 2025, arXiv:2509.25164. [Google Scholar] [CrossRef] [Scilit]
- Bochkovskiy, A.; Wang, C.-Y.; Liao, H.-Y.M. YOLOv4: Optimal Speed and Accuracy of Object Detection. arXiv 2020, arXiv:2004.10934. [Google Scholar] [CrossRef] [Scilit]
- Padilla, R.; Netto, S.L.; da Silva, E.A.B. A Survey on Performance Metrics for Object-Detection Algorithms. In Proceedings of the 2020 International Conference on Systems, Signals and Image Processing (IWSSIP), Niteroi, Brazil, 1–3 July 2020; IEEE: New York, NY, USA, 2020; pp. 237–242. [Google Scholar] [CrossRef] [Scilit]
- Lin, T.-Y.; Maire, M.; Belongie, S.; Bourdev, L.; Girshick, R.; Hays, J.; Perona, P.; Ramanan, D.; Zitnick, C.L.; Dollár, P. Microsoft COCO: Common Objects in Context. arXiv 2014, arXiv:1405.0312. [Google Scholar] [CrossRef] [Scilit]
- Wang, J.; Xu, C.; Yang, W.; Yu, L. A Normalized Gaussian Wasserstein Distance for Tiny Object Detection. arXiv 2021, arXiv:2110.13389. [Google Scholar] [CrossRef] [Scilit]
- Kroodsma, D.A.; Mayorga, J.; Hochberg, T.; Miller, N.A.; Boerder, K.; Ferretti, F.; Wilson, A.; Bergman, B.; White, T.D.; Block, B.A. Tracking the global footprint of fisheries. Science 2018, 359, 904–908. [Google Scholar] [CrossRef] [Scilit] [PubMed]
- Mäyrä, J.; Virtanen, E.A.; Jokinen, A.-P.; Koskikala, J.; Väkevä, S.; Attila, J. Mapping recreational marine traffic from Sentinel-2 imagery using YOLO object detection models. Remote Sens. Environ. 2025, 326, 114791. [Google Scholar] [CrossRef] [Scilit]
- Qiu, R.; Bi, N.; Yin, C. OptWake-YOLO: A lightweight and efficient ship wake detection model based on optical remote sensing images. Front. Mar. Sci. 2025, 12, 1624323. [Google Scholar] [CrossRef] [Scilit]
- Gordon, H.R.; Wang, M. Retrieval of water-leaving radiance and aerosol optical thickness over the oceans with SeaWiFS: A preliminary algorithm. Appl. Opt. 1994, 33, 443–452. [Google Scholar] [CrossRef] [Scilit] [PubMed]
- Kikaki, K.; Kakogeorgiou, I.; Mikeli, P.; Raitsos, D.E.; Karantzalos, K. MARIDA: A benchmark for Marine Debris detection from Sentinel-2 remote sensing data. PLoS ONE 2022, 17, e0262247. [Google Scholar] [CrossRef] [Scilit] [PubMed]
- Pathira Arachchilage, K.R.L.; Tang, D.; Yu, J.; Wang, S. A Preliminary Analysis towards Detecting Floating Marine Macro Plastics Using an Index Developed for Sentinel 2 ACOLITE and Sen2Cor Images. J. Geospat. Surv. 2022, 2, 1–10. [Google Scholar] [CrossRef] [Scilit]
- Ciappa, A.C. Marine Litter Detection by Sentinel-2: A Case Study in North Adriatic (Summer 2020). Remote Sens. 2022, 14, 2409. [Google Scholar] [CrossRef] [Scilit]
- Pu, T. Mining and Analysis of the Traffic Information Situation in the South China Sea Based on Satellite AIS Data. Int. J. Data Warehous. Min. 2023, 19, 1–25. [Google Scholar] [CrossRef] [Scilit]
- Duarte, C.M.; Chapuis, L.; Collin, S.P.; Costa, D.P.; Devassy, R.P.; Eguiluz, V.M.; Erbe, C.; Gordon, T.A.C.; Halpern, B.S.; Harding, H.R.; et al. The soundscape of the Anthropocene ocean. Science 2021, 371, eaba4658. [Google Scholar] [CrossRef] [Scilit] [PubMed]
- Liu, X.; Ji, S.; Sun, M.; Fan, D.; Lv, J.; Suo, M.; Zhang, R.; Yan, Z.; Li, Y. On-orbit image processing technology for intelligent remote sensing satellites: Progress, challenges, and opportunities. Aerosp. Sci. Technol. 2026, 174, 111859. [Google Scholar] [CrossRef] [Scilit]

Disclaimer/Publisher’s Note: The statements, opinions and data contained in all publications are solely those of the individual author(s) and contributor(s) and not of MDPI and/or the editor(s). MDPI and/or the editor(s) disclaim responsibility for any injury to people or property resulting from any ideas, methods, instructions or products referred to in the content. |
© 2026 by the authors. Licensee MDPI, Basel, Switzerland. This article is an open access article distributed under the terms and conditions of the Creative Commons Attribution (CC BY) license.