


Highlights
What are the main findings?
- Across 34 datasets spanning nine sensing modalities on a 143-item seeded minefield, UAV-based RGB imagery achieved the highest detection rate (94.8%) and highest proportion of uniquely identifiable targets for surface ordnance.
- Traditional handheld metal detectors remained the most effective tool for detecting buried metallic ordnance > 95.9% detection rate, while GPR was the only modality capable of detecting buried plastic targets.
What is the implication of the main finding?
- UAV RGB surveys provide a scalable, cost-effective approach for rapidly identifying and mapping surface ordnance, while UAV-based subsurface detection methods struggle with low altitude constraints and non-unique signatures, leading to higher false positive rates.
- We found that no single sensing modality for landmine detection is effective across all explosive contamination scenarios and thus provide a data-driven cost–benefit analysis with practical guidelines for selecting the appropriate remote sensing techniques depending on the nature of the contaminated area.
Abstract
Reliable and scalable landmine detection technologies are essential for humanitarian mine action (HMA), yet standardized benchmarks for Unmanned Aerial Vehicle (UAV)-based sensing in operationally relevant environments remain limited. This study presents a comprehensive evaluation of 34 multimodal datasets acquired over a standardized seeded test site for landmine and unexploded ordnance detection. Nine sensing modalities, including RGB, thermal, multispectral, hyperspectral, LiDAR, and Synthetic Aperture Radar (SAR), are evaluated using the Anomaly, Identifiable Anomaly, Unique Identifiable Anomaly (AIU) index to establish a unified framework for quantifying detection fidelity. Results indicate that RGB imagery achieves the highest surface detection rate (94.8%), with 45.4% of targets classified as uniquely identifiable, reducing false-positive risk. For sub-surface detection, handheld electromagnetic induction (EMI) and magnetometry exceed 95% detection for ferrous items but fall below 10% for plastic ordnance. Ground-penetrating radar (GPR) is the only modality capable of detecting buried plastic targets (55.6% for cart-based systems), whereas UAV-mounted GPR remains limited (18.2%) at current operational flight heights. Based on the comparative analysis, we discuss the gaps in current detection capabilities, compare false-positive rates across modalities, and perform a cost–benefit analysis fitting contamination scenarios with the most cost-effective detection method. All datasets are publicly released, along with an interactive web-map, to support reproducible benchmarking and cross-modality comparison in UAV-enabled explosive hazard detection.
1. Introduction
Landmines, unexploded ordnance (UXO), improvised explosive devices, and other explosive remnants of war (ERW), collectively referred to as explosive ordnance, reside in 58 conflict and post-conflict countries and regions around the world [1]. Both during and after conflicts, these explosive devices hinder community and country-wide development and welfare by restricting land access, stifling economic growth, limiting mobility, and damaging ecosystems [2,3,4,5]. From 1999 to 2023, there were a recorded 159,445 casualties caused by landmines and explosive remnants of war, with 80% of the victims being civilians [1]. The War in Ukraine, which began in 2014 with the annexation of Crimea and escalated to a full-scale invasion of Ukraine by Russian forces in 2022 greatly exacerbated this humanitarian crisis, with Ukraine becoming the most contaminated country in the world with an estimated 138,000 km2 of land contaminated by explosive ordnance as of 2025 [6]. Mitigating the massive humanitarian, societal and global impact of this problem demands the modernization of the land release process through rapid development and implementation of remote sensing technology and advanced data processing techniques [7]. A critical need within the humanitarian mine action sector is to have open access, comparative datasets of remote sensing and geophysical surveys of simulated or real minefields. Such datasets would enable the mine action community to make informed, data-driven decisions about how to test, develop, fund, and implement remote sensing technologies for improving the safety, speed, and costs associated with landmine detection. This study addresses this need by testing a variety of remote sensing and geophysical techniques on a standardized seeded minefield to assess the viability of each technique for application in landmine and UXO detection.
The primary contributions of this work are summarized below:
- 1.
- Comprehensive Multimodal Assessment: We provide a systematic evaluation of 34 unique datasets (ground-based and drone-based) across nine sensing modalities (RGB, Thermal, Multi/Hyperspectral, Magnetometry, EMI, GPR, LiDAR, and SAR). To the best of our knowledge, this represents the most diverse aerial geophysical survey to date of a standardized minefield seeded with 143 items of unexploded ordnance (UXO) and landmines.
- 2.
- Open-Access Research Resources: To ensure reproducible research and address the critical lack of open access benchmarks in the field, we release all 34 georeferenced datasets via Zenodo (https://zenodo.org/records/19100554 (accessed on 2 May 2026) [8,9] and provide an interactive web map platform (accessible at http://de-mine.com/webmap (accessed on 2 May 2026)) to serve as a global benchmark for the mine action community. The dataset, introduced as the DRC (Demining Research Community) Seeded Minefield Dataset, represents, to the best of our knowledge, the first standardized multimodal UAV–geophysical benchmark developed specifically for comparative landmine detection research. These resources provide researchers with logical paths for multi-sensor fusion, while enabling policymakers and economic stakeholders to make informed, data-driven decisions regarding the incorporation of new technologies into land release.
- 3.
- Standardized Detection Fidelity Framework: We implement the Anomaly, Identifiable Anomaly, Unique Identifiable Anomaly (AIU) Index [10] to move beyond simple binary detection. This framework allows for a quantifiable comparison of false-alarm potential across disparate sensor types, providing a roadmap for operational reliability.
- 4.
- Operational Guidelines and Economic Analysis: We provide a comprehensive cost–benefit analysis alongside practical guidelines for field deployment. By categorizing detection performance into specific “problem sets” (e.g., surface vs. buried, ferrous vs. plastic), we allow stakeholders to make data-driven decisions on tool selection based on the specific contamination history of a region.
Figure 1 provides an overview of the experimental design, illustrating the types of explosive ordnance investigated, the three seeded field sites, and the multimodal data collection strategies employed across handheld, cart-based, and UAV platforms.
Figure 1.
Project overview graphic. From top to bottom, the panels show the types of explosive ordnance present in the field, the three seeded field locations and the data collection modalities and quantities. The arrows correspond to which modalities were collected on each of the three test sites. The color of the dot represents the dataset collection method (handheld, cart, aerial/UAV). The bottom two panels show the sections for the results and discussion.
The remainder of this paper is organized as follows. Section 2 provides background on sensors for explosive ordnance detection and outlines the motivation for this study. Section 3 describes the methodology, including the seeded minefield experimental design, multimodal UAV data collection, and the target picking and detection fidelity assessment using the AIU index. Section 4 presents the results, detailing detection performance for surface and sub-surface ordnance as well as detection rates by item. Section 5 discusses the findings, including limitations, false positives, capability assessment in operational field conditions, identified gaps in current capabilities, and directions for future work. Section 6 concludes the paper.
2. Background
Research into the use of remote sensing and geophysical techniques for landmine detection has been ongoing for over a century. The end of World War I saw the introduction of crude, bulky, coil-based electromagnetic-induction (EMI) metal detectors to locate the abundance of UXO left over from the war [11]. To find the landmines, which are smaller and more volatile, traditional demining techniques of prodding and full excavation were employed, which remain the standard method for demining operations to this day [12]. While effective, traditional manual demining using metal detectors and prodders are slow, labor intensive, and present safety concerns.
Invigorated by the full-scale Russian invasion of Ukraine, many new landmine detection methods have been proposed in academia and industry [13]. While these methods or technologies are often built upon thorough research, very few of them make it into the hands of deminers and actually achieve a tangible impact in the mine action community. There are many reasons for this phenomenon. One such reason is that the individual sensor is tested in isolation, thus making it impossible to compare the results to different modalities and judge its compatibility with current International Mine Action Standards. Additionally, false positive rates and the ability to distinguish mines from clutter or other objects presents a fundamental problem for EMI, GPR, and other geophysical modalities [14,15,16]. Moreover, many of the sensors and methods proposed are only useful in very specific environmental contexts, and without a well-defined test environment, the limitations or advantages of the method are not transparent.
While crucially important, landmine and explosive ordnance detection is just one step in the process of land release. Land release is defined as the process of using all reasonable effort to remove the explosive ordnance from a plot of land and returning that land to the community it belongs to [17]. The first step in land release is a desk assessment followed by a non-invasive information gathering process called the non-technical survey (NTS). An NTS involves aggregating as much information about a suspected hazardous area (SHA) as one can, without physically crossing into the boundaries of that area. The process usually consists of community interviews and inspecting the area with binoculars, but drones are increasing in popularity for collecting direct and indirect evidence of explosive ordnance within the SHA [18]. The primary goal of the NTS is to determine the extent of type of explosive contamination in the surveyed area. This allows one to classify it as either a confirmed hazardous area, meaning direct evidence is present, a suspected hazardous area, meaning only indirect evidence was found, or a candidate for land release, meaning neither was found. For suspected or confirmed hazardous areas, the next steps in the land release process are technical survey and clearance. These two steps often occur simultaneously and are carried out by deminers and explosive ordnance disposal (EOD) technicians. The technical survey involves using physical intervention to confirm the presence or absence of explosive ordnance. Clearance is predominantly conducted by human deminers carrying out traditional mine detection methods using handheld metal detectors, prods and rakes. In appropriate terrains and contamination types, mechanical assets such as demining machines are used for clearance. Notably, clearance methods for humanitarian demining have not changed significantly since World War II [12,19].
The main challenge in the land release process is locating the explosive ordnance and defining the boundaries of the contaminated area [18]. Recent advancements in geophysical sensors, unmanned aerial systems (UASs), machine learning, and signal processing have proven to be incredibly valuable in increasing the efficiency and fidelity of NTS and technical surveys by addressing the detection challenge. While progress is exciting, it is crucial to objectively evaluate these methodologies by putting each tool into context for mine action operations.
2.1. Sensors for Explosive Ordnance Detection
In this study, we test UAV-based sensors, including visual, thermal, multispectral, hyperspectral, LiDAR, SAR, magnetometry, and GPR, on the same seeded minefield. We also collected handheld and cart-based datasets, including handheld metal detection, spectroscopy, and GPR. Numerous additional approaches have been investigated for explosive ordnance detection, including biological sensing using trained animals and insects (e.g., dogs, rats, and honeybees), neutron-based interrogation systems, chemical trace detection, and emerging quantum sensing technologies [20,21,22,23]. This study focuses specifically on the comparative evaluation of remote sensing and geophysical sensing modalities applicable to UAV and field-based survey operations. In the following sections, we explain each modality, its benefits, and its limitations in the context of explosive ordnance detection.
2.1.1. Visual (RGB)
Optical imagery in the visual spectrum (RGB imagery) captures what the human eye can see. This includes images taken from smartphones and common cameras. The visible spectrum is a portion of the electromagnetic spectrum capturing wavelengths from 400 nm to 700 nm [24]. Most commercial-off-the-shelf (COTS) UAVs are equipped with an RGB camera, allowing for RGB imagery to be collected for a variety of applications that include photography, agriculture, construction, geological mapping and conservation [25,26,27,28]. Visual cameras are among the most affordable imaging sensors, with COTS drones with built-in RGB cameras starting at a few hundred dollars. UAV-based RGB cameras have been used during NTS in several post-conflict regions and are capable of detecting visual surface explosive contamination [29,30].
While RGB imagery is considered a simple modality, it offers significant benefits, including material-agnostic detections for surface ordnance, visually distinct and easily identifiable targets, simple data processing and interpretation for non-specialists, and high technology maturity capable of covering large areas in a single flight. Additionally, RGB imagery provides an immense amount of utility for detecting both direct and indirect evidence that an area is contaminated. These pieces of evidence may include identifying recently disturbed earth, explosive ordnance, mine signs, artillery fragments, crater holes, animal carcasses, destroyed trucks or tractors and scorched or scarred earth.
While the benefits of RGB imagery are numerous, the limitations must also be considered. For landmine detection, optical imagery is excellent for finding visible surface contamination but cannot see through vegetation or underground to find buried objects. The main internal variable affecting visual detection is the resolution of the imagery. Higher resolution images can resolve smaller objects, while lower resolution images cannot. Baur and Nitsche [10] quantified that with 125 pixels on target for RGB imagery, a human analyst can characterize the object as an identifiable anomaly. The resolution is determined by camera properties and flight height. Additional internal variables such as sensor size and megapixels influence the image quality and noise. External variables that affect visual detection include lighting conditions, time since target item emplacement, vegetation, erosion and outwash, target contrast to the background environment, and object size. Since RGB imagery is able to resolve explosive ordnance from drone surveys, there have been substantial efforts to automate the detection of explosive ordnance using object detection techniques.
The current state-of-the-art methods for UAV-based object detection in RGB imagery are CNN or transformer deep-learning object detection models, which have reliably proven their ability to detect and decipher small objects from UAV imagery, including detecting PFM-1 antipersonnel mines with a 91.8% accuracy [30,31,32,33]. Additional studies show that PFM-1s can be detected from thermal, multispectral, and hyperspectral sensors using deep learning and statistical methods [34,35,36]. RGB imagery is usually processed using structure-from-motion photogrammetry to stitch a nadir mapping mission into a georeferenced orthomosaic, digital surface model (DSM), and 3D model. Additional advanced processing techniques can take the structure-from-motion-derived DSM and compute vegetation height maps and detection rate heat maps, quantifying the detection uncertainty due to vegetation coverage [37]. Recent studies suggest the addition of uncertainty metrics in deep learning models for improved accuracy and robustness. Lekhak et al. in [38], using a simulated dataset, demonstrated that the deep learning models for surface landmine and UXO classification exhibit reduced reliability under adversarial inputs, highlighting the importance of incorporating uncertainty quantification for improved model robustness and trustworthiness.
2.1.2. Thermal (LWIR, SWIR)
Thermal infrared imagery captures the thermal radiation emitted from objects due to their temperatures. Long-wave infrared (LWIR) with electromagnetic wavelengths between 8000 nm and 14,000 nm detects emitted radiation [39]. Short-wave infrared (SWIR) sensors capture wavelengths between 900 nm and 2500 nm and primarily measure reflected or absorbed light [39]. LWIR imaging is used for detecting temperature differences in a captured scene and is one of the most widely available cameras, frequently integrated into high-end off-the-shelf drones. Thermal sensors are used in a wide range of applications, including precision agriculture, archaeology, ecology, hydrology, search and rescue, military reconnaissance, and infrastructure assessment [40,41,42,43,44].
Thermal radiation is influenced by an object’s material properties, such as thermal conductivity, emissivity, specific heat capacity, thermal inertia and surface texture, as well as environmental factors such as current temperature and temperature changes throughout the day [45]. Due to these properties, previous studies have proven the ability to detect landmines on the surface and at shallow depths using thermal infrared imagery, especially at times with the highest temperature differentials such as the early morning or near dusk [46,47,48,49]. Unlike visual imagery, thermal imagery retains utility in low-light or nighttime conditions, making data collection during the night possible.
Limitations of thermal imagery include weather sensitivity, lower spatial resolution and higher cost than RGB cameras, radiometric calibration for accurate temperature readings, and low thermal contrasts when objects thermally equilibrate with the surrounding environment. The internal variables affecting thermal detection of explosive ordnance from UAV include spatial resolution determined by camera and flight height, thermal sensitivity (noise-equivalent temperature difference), radiometric calibration, camera emissivity settings and frame rate and exposure time [50,51]. External variables that influence thermal infrared radiation include the time of day (ground temperatures can change drastically between day and night), weather conditions (rain, fog, or high humidity can distort thermal readings), soil moisture content (affects heat retention in the ground), and material properties of the target object [52,53]. The data products that can be processed from UAV-collected thermal imagery are radiance and reflectance maps.
2.1.3. Multispectral
Multispectral imaging refers to a sensor that captures multiple broad spectral bands (typically 3 to 10 bands depending on the sensor) of the electromagnetic spectrum typically ranging from the visible spectrum to near-infrared (400 nm to 1000 nm) [54]. Due to the wideband nature, multispectral cameras lack the spectral resolution to resolve specific material properties but are widely used in agriculture, environmental monitoring, and geological studies for surface-level spectral analysis [55]. One common application for multispectral imaging is the calculation of vegetation indices such as NDVI, LAI, and EVI [56,57,58].
The benefits of multispectral imaging that do not overlap with those from visible imaging include capture of specific non-visible light bands such as red-edge, near-infrared and infrared that allow for the detection of stressed vegetation and differentiation of soil types or surface disturbances. While these additional benefits do not directly detect explosive ordnance, they can be used to indicate indirect evidence associated with the deployment or presence of explosive ordnance.
2.1.4. Hyperspectral
Hyperspectral imaging (HSI) is a powerful remote sensing modality that captures spectral information across a large number of continuous narrow bands, typically spanning the visible to near-infrared (VNIR: 400–1000 nm) and shortwave infrared (SWIR: 1000–2500 nm) regions. Unlike RGB or multispectral imagery, which record reflectance in a few broad, discrete bands, HSI collects many more—often hundreds—finely spaced, narrow spectral bands, enabling unique material “spectral signatures” to be assigned to specific objects or surfaces [55,59,60]. However, capturing more bands results in much larger file sizes and greater data redundancy. Based on the scanning mechanism, hyperspectral sensors can be classified into whisk-broom (point scanning), push-broom (line scanning), and snapshot (simultaneous spatial–spectral) architectures [61]. Early hyperspectral imaging (HSI) sensors were large and limited to satellites and manned aircraft for atmospheric and surface studies. They have since significantly reduced in size and weight to meet SWaP-C (Size, Weight, Power, and Cost) constraints, enabling integration into UAVs and expanding their applications across domains such as vegetation monitoring, material spectroscopy, medical imaging, industrial inspection, mining, food safety, and defense [62,63]. Recent efforts of real-time HSI anomaly detection are 20x more efficient than traditional workstation post-processing, with only a 4% reduction in UAV flight endurance [64].
Hyperspectral imaging (HSI) offers a few distinct benefits for surficial landmine and UXO detection. Each pixel in an HSI dataset contains detailed spectral information across hundreds of narrow wavelengths, providing unique spectral signatures for objects within the scene [65]. This rich spectral data enables the identification of target materials through both supervised and unsupervised algorithms, leveraging statistical methods and deep learning techniques [66]. Unlike RGB imagery, where detection often relies heavily on spatial characteristics and can be confounded by targets with colors similar to the background, HSI provides distinct spectral features that improve differentiation of complex or camouflaged targets [67]. Consequently, HSI can reduce false positives in environments where objects share similar visual appearances but differ spectrally. HSI sensors integrated into drone-based systems enable higher spatial resolution compared to satellite or manned airborne platforms while offering non-contact detection of spectral anomalies across large and otherwise inaccessible areas [68].
Hyperspectral imaging (HSI) has been widely investigated for landmine and explosive ordnance detection due to its ability to capture fine-grained spectral signatures associated with disturbed soil, vegetation stress, and material composition. Early surveys summarized signal processing and target detection approaches applied to airborne and ground-based hyperspectral data, highlighting both the promise of spectral discrimination and the challenges posed by environmental variability [69]. More recent UAV-based implementations have demonstrated the feasibility of high-resolution hyperspectral mapping for surface ordnance detection. For example, researchers in [70] utilized UAV-based hyperspectral imaging to detect surficial explosive ordnance and reported successful identification of surface explosive items using drone-mounted HSI systems, emphasizing spatial resolution and spectral feature selection. Similarly, another study evaluated the data quality and operational constraints of UAV-mounted hyperspectral platforms for UXO detection, underscoring the importance of calibration and flight parameter optimization [71]. In addition, Lekhak et al. [35] compared deep learning and classical statistical detection approaches for hyperspectral UAV imagery, demonstrating the impact of algorithmic choice on detection performance for low-metal-content landmines.
Despite its advantages, HSI faces several challenges in real-world applications. UAV-based HSI systems face challenges such as motion-induced distortions, limited flight endurance, and reduced spatial resolution, which can hinder the detection of small or subpixel buried targets in complex environments [62]. Occlusion remains a significant issue, as targets may be partially or fully covered by vegetation or debris. The small size of many landmines results in pixels containing mixed spectral signals, complicating detection due to spectral mixing effects [72]. This is exacerbated by the inherent tradeoff between spatial and spectral resolution; lower spatial resolution hinders the ability to detect small or subpixel targets, even though advanced subpixel target detection techniques exist [65]. Additionally, errors introduced during orthorectification, mosaicking, and georeferencing can distort the data. Atmospheric factors such as variable illumination and absorption further degrade spectral quality [73]. Moreover, the large volume of hyperspectral data demands intensive processing and analysis, increasing computational complexity and cost. Finally, the high cost of HSI sensors and associated processing infrastructure can limit widespread adoption, particularly in resource-constrained environments.
2.1.5. Electromagnetic Induction
Electromagnetic induction (EMI) is an active-source geophysical detection method, transmitting a controlled time-varying electromagnetic field into the ground to induce secondary currents in subsurface targets. These induced responses are then measured to infer object properties such as size, depth, and conductivity [74,75,76,77]. EMI is particularly advantageous for detecting both ferrous and non-ferrous targets and for enabling target classification based on electromagnetic response characteristics. In contrast, magnetometry is a passive-source method, relying on the detection of perturbations in the ambient geomagnetic field caused by the presence of ferromagnetic materials [78,79]. While magnetometry is limited to ferrous targets, it offers high sensitivity and efficiency in detecting deeply buried ordnance, especially in environments where EMI performance may degrade such as highly conductive or magnetic soils or saline environments [80].
EMI is widely recognized as an irreplaceable technology in HMA surveys due to its ability to target a wide range of common types of landmines and UXO at typical depths of their deployment. The key capability of an EMI system lies in its ability to detect electrically conductive objects, enabling the identification of all types of metallic items regardless of their magnetic properties [75]. Despite these advantages, EMI systems have significant limitations. In metal-rich or cluttered environments, encountering false positives can be a frequent occurrence, resulting in massive cost and time expenditures in follow-up excavation [77]. Furthermore, EMI sensors can only detect metallic components, making them less effective for minimum-metal content or plastic-cased mines, which may require higher sensitivity settings or specialized equipment [74]. Detection success is influenced by a range of internal and external variables. Internally, the sensitivity, resolution, operating frequency, and coil configuration of the sensor determine detection depth and signal fidelity. Externally, soil conductivity, moisture content, and heterogeneities affect electromagnetic field propagation and can obscure or distort signals [80]. Additionally, the size, orientation, shape, and material composition of the target object influence signal polarity, symmetry, and amplitude, directly impacting the interpretability of results [81]. Recent aerial EMI systems have demonstrated a comparable accuracy to ground-based systems for detecting landmines and UXOs while offering advantages in survey speed and operator safety, but the difficulties of processing the data remains a major hurdle to operational success [82]. In particular, interpolating sparsely sampled signals from small, low-metal-content landmines and UXO is very challenging in cluttered environments. Such targets may be missed or smoothed out during signal reconstruction across large survey areas, potentially reducing overall detection reliability. To enhance airborne EMI performance, Lekhak et al. [82] proposed and applied their normalization technique that improved the identification of anomalies in EM61Lite data, particularly in the presence of low-metal targets amid larger metallic clutter. To mitigate false positives and improve discrimination, modern EMI surveys often incorporate statistical analysis and advanced geophysical classification (AGC) techniques [76]. These methods use multi-axis coil arrays and software platforms such as Seequent’s UXO classification tools, which analyze polarizability tensors and compare measured responses to databases of known ordnance and clutter signatures [83]. This approach enables automated assessment of whether a detected object is a target of interest or benign clutter, improving decision making and reducing unnecessary excavations [84]. Data products generated by EMI surveys typically include raw and processed signal amplitude maps, target depth estimates, signal polarizability ellipsoids, and classification confidence scores. These outputs form the basis for prioritization in clearance operations and provide traceable, georeferenced evidence for each identified anomaly, supporting both operational decision making and regulatory compliance in humanitarian and military demining contexts.
2.1.6. Magnetometry
Magnetometry is a passive geophysical technique widely used in the detection of buried ferromagnetic objects, including UXO and landmines [85]. It is particularly effective in environments where targets are obscured by vegetation or surface debris, offering a non-invasive means of identifying anomalies that are otherwise invisible to visual inspection [86,87]. Magnetometers detect variations in the Earth’s magnetic field that arise when buried ferrous objects distort local field lines. This makes the method well-suited for locating ordnance containing iron or steel, provided that target composition, geometry, and orientation generate a sufficiently strong and distinct signal. The size, shape, depth, orientation, and composition of a buried object determine the strength and geometry of the magnetic anomaly it produces. Ferrous objects aligned vertically and near the surface tend to produce distinct dipolar anomalies, whereas small or deeply buried items may result in weaker, more ambiguous signatures. In general, only ferromagnetic targets can be detected by magnetometry, making the method unsuitable for plastic or minimum-metal-content mines [87,88].
One of the most significant advantages of magnetometry is its scalability and compatibility with unmanned aerial vehicle (UAV) platforms. UAV-mounted magnetometers can rapidly survey wide areas and generate high-resolution magnetic anomaly maps that are georeferenced and immediately useful for operational planning [85,89]. These systems are particularly valuable in post-conflict zones, environmentally sensitive terrain, or inaccessible regions where ground-based methods pose risks or logistical barriers. When integrated into a well-designed survey plan, UAV magnetometry can pinpoint anomaly locations with sub-meter accuracy, greatly improving the efficiency of follow-up inspection or clearance. The primary data product of a magnetometry survey is a magnetic anomaly map, typically delivered as a georeferenced raster. When processed using advanced inversion techniques, these maps can also include estimates of target depth, orientation, and dipole polarity, though such interpretations require careful calibration and are rarely definitive without ground truthing the datasets.
Despite methodological and operational strengths, magnetometry has several notable limitations. The magnetic signal decays with the cube of the distance from the source, meaning that detection sensitivity drops sharply with increased flight height or target depth [90]. As a result, surveys aiming to identify small or deeply buried items must be flown at low altitudes, which may not always be practical due to terrain, vegetation, or safety considerations. However, small unmanned ground vehicles (UGVs) can traverse the surface in difficult environments with magnetic sensor packages keeping a constant, low distance from the ground [91]. Additionally, magnetometry data are non-unique and difficult to automate, typically requiring expert interpretation and specialized software for data processing, inversion, and anomaly classification [88]. While automated workflows are being developed, particularly for UAV platforms, these remain limited in cluttered or geologically complex environments [90,92,93]. A range of internal and external variables also affect detection success. Internally, sensor sensitivity plays a central role. Proper instrument calibration is essential to avoid drift and ensure consistency across datasets. Additionally, the UAV will produce magnetic self-noise that must be compensated for with careful sensor placement and/or additional modeling and calibration maneuvers [94,95]. Survey configuration, including transect spacing, sensor altitude, and orientation, also governs resolution and the detectability of small or complex anomalies. Externally, detection quality may be degraded by global and local magnetic field variations, environmental noise, metal-rich soils, basaltic geology, or anthropogenic metallic clutter, all of which can generate misleading signals or mask true targets [87]. These challenges are particularly relevant for single-sensor magnetometry, and it should be noted that many of these limitations can be alleviated through magnetic gradiometry. By capturing multiple spatial derivatives of the magnetic field, gradiometers exploit the invariants of the full magnetic gradient tensor, enhancing signal-to-noise ratio and improving anomaly localization [96]. Gradiometry not only suppresses regional and temporal magnetic field variations but also amplifies subtle gradients from deeply buried or low-signature ferrous objects that may be undetectable with single-sensor systems.
2.1.7. Ground Penetration Radar
Ground penetrating radar (GPR) is an active-source geophysical method widely used in landmine and IED detection [97]. It operates by transmitting high-frequency electromagnetic pulses into the ground and recording the reflections produced at material boundaries. Although most operational GPR systems are ground-based, there has been growing interest in extending this method to aerial platforms for remote or high-risk applications. The following discussion focuses on conventional ground-based systems, which remain the operational standard. GPR is uniquely suited for detecting both metallic and non-metallic ordnance, making it an essential tool in scenarios where plastic-cased or minimum-metal mines are present [97,98]. Detection is based on contrasts in dielectric permittivity, with clearer signals emerging when targets are embedded in homogeneous, low-conductivity soils such as dry sand. However, signal attenuation increases significantly in highly conductive soils—such as clay-rich or saline substrates—limiting depth penetration and resolution [99]. As a result, site conditions play a major role in determining the practical utility of GPR during demining operations.
When deployed under favorable environmental conditions, GPR offers significant operational advantages, particularly in its ability to resolve non-metallic targets that elude detection by magnetic or EMI-based methods. Its output includes radargrams, which represent vertical cross-sections of the subsurface and reveal hyperbolic reflections typically associated with buried ordnance. Raw GPR data are often further processed into 2D and 3D images to enhance target visualization and facilitate interpretation by field operators. When collected over a grid and paired with differential GPS, these scans can be stitched into georeferenced 3D volumes, offering spatially accurate anomaly maps for clearance planning [98]. These volumetric datasets also enable estimation of target geometry and depth, aiding in risk assessment and prioritization during follow-up excavation. In modern workflows, these data products serve both tactical and documentation roles, allowing clearance teams to justify field decisions and preserve digital records of subsurface conditions.
The effectiveness of GPR depends on several technical and environmental variables. Antenna frequency is a key design choice: high-frequency systems (e.g., 1–2 GHz) provide excellent resolution for shallow targets such as anti-personnel mines, while lower-frequency systems (e.g., 200–500 MHz) penetrate deeper but at reduced resolution, suitable for detection of deeper, larger UXOs. Antenna design, including shielding, footprint, and ground coupling, also affects data quality and operational flexibility [100]. Interpretation is complicated by clutter, surface reflections, and variable soil stratigraphy, necessitating advanced signal processing techniques such as digital filtering, clutter suppression, and time–frequency analysis [99,101]. Aerial GPR remains an experimental technique with substantial limitations. Mounting GPR on UAVs offers theoretical advantages in hazardous or inaccessible areas, but success has been limited to date [102]. Strong radar reflections from the air–ground interface often obscure subsurface returns, and maintaining the low, stable altitudes needed for sufficient signal penetration and resolution presents major challenges. Additionally, airborne systems struggle to achieve the tight ground coupling that improves signal quality in traditional ground-based deployments. As a result, aerial GPR has yet to demonstrate operational reliability and remains an area of active research rather than field-ready capability [103].
2.1.8. LiDAR
Light detection and ranging (LiDAR) sensors measure the distance between the sensor and a surface by emitting pulses of light and recording the time for light reflected off the surface to return to the receiver. LiDAR sensors are commonly integrated onto UAVs or airplanes to produce highly accurate 3D elevation models and digital surface models (often using swath scanning) for a variety of applications, including construction, mapping, forestry, archaeology, and terrain modeling [104,105,106,107,108,109,110]. LiDAR surveys have significant advantages over RGB surveys, as they can generate higher accuracy digital elevation models and digital surface models compared with structure-from-motion photogrammetry, especially in vegetated areas [111,112]. This is due to the fact that LiDAR pulses can penetrate foliage and return ground points, allowing for mapping of sub-canopy terrain. Additionally, since LiDAR sensors are active-source, the quality of data is not dependent on daylight and thus can operate in low-light or nighttime conditions. For humanitarian mine action, LiDAR sensors can provide detailed terrain mapping and 3D modeling capabilities, improving situational awareness and assisting with mission planning. The ability to penetrate vegetation has the added benefit of accurately determining the amount of vegetation (biomass) required for vegetation clearance. Past studies have shown LiDAR surveys can be useful for the detection of indirect evidence of explosive ordnance such as craters, trench lines, foxholes, soil disturbances and terrain patterns [113].
Additionally, other indirect indicators of explosive ordnance that may be highlighted include terrain maps of old supply and vehicle routes where mines are more likely to have been placed. One key limitation of LiDAR is that it has not been proven to reliably detect surface explosive ordnance and is incapable of detecting subsurface ordnance, although recent studies have investigated its use for supporting surface anomaly detection and terrain-based inference of hazardous areas [31]. The main internal variables affecting LiDAR data quality include point density, flight height, and scan angle (all of which determine point cloud resolution), as well as the accuracy of the inertial measurement unit (IMU) and the global navigation satellite system (GNSS) for georeferencing the point cloud [114]. External variables include the reflectivity of material properties, which impact intensity values. For example, water and metal are highly reflective compared to vegetation and soil. While there are no algorithms for the detection of explosive ordnance from LiDAR surveys, one common way to process LiDAR derived point clouds is to use point cloud classification algorithms that can separate ground from vegetation or water and other easily identifiable features [115]. The data products produced by LiDAR include point clouds, 3D mesh and 3D models, DEM, DSM, digital obstacle or obstruction models (DOM), directional derivative maps, canopy height models, and slope maps.
2.1.9. Synthetic Aperture Radar
Synthetic aperture radar (SAR) is a radar imaging technique that produces high-resolution two- and three-dimensional representations of a scene using radio and microwave frequencies [116]. Satellite-based SAR is widely utilized in the geosciences, often through polarimetric (PolSAR) and interferometric (InSAR) methods [117]. PolSAR enables the classification, mapping, and extraction of surface features by analyzing the polarization properties of the returned signals [118]. In contrast, InSAR excels in capturing landscape-scale topographic information and monitoring ground surface deformation over time, offering detailed insights into changes such as subsidence, landslides, and tectonic activity [119].
SAR achieves fine cross-range resolution by synthesizing a large virtual aperture through the motion of the antenna, while its range resolution is determined by the bandwidth of the transmitted signal. Notably, SAR resolution is independent of the slant-range distance to the target, meaning that SAR can maintain consistent image quality and detail regardless of how far the sensor is from the scene being imaged, unlike optical or passive microwave systems where resolution typically degrades with distance. To generate focused imagery, complex SAR data, recorded as phase history, must undergo coherent signal processing techniques such as matched filtering. Recent advances have expanded SAR’s capabilities beyond satellites; for instance, the researchers in [120,121] demonstrated proof of concept for landmine detection using a UAV-based SAR-GPR system. Similarly, the authors in [122] demonstrated that UAV-based SAR systems can detect buried simulated landmines in controlled environments.
Since SAR is an active-imaging modality, it can operate in daylight or night conditions and diverse weather conditions. It is also able to penetrate through soils if operating at lower L-band radio frequencies (i.e., GPR frequencies) to provide either periodic or continuous monitoring capabilities. Unlike GPR, SAR can image a large area with a single linear trajectory. Moreover, SAR is theoretically capable of detecting partially obscured UXOs at higher frequencies. Typical SAR data products include two- and three-dimensional single-look complex raster images that contain both magnitude and phase information. These data can be used to make coherent change detection maps that can detect changes on the order of a fraction of a wavelength from one time to another.
SAR is an invaluable remote sensing tool in environmental and geosciences applications [119]; however, it has several key deficiencies that make it less useful for the fine-scale analyses necessary in HMA. Longer-wavelength bands such as L-band (1–2 GHz) or P/UHF bands can penetrate soil but do so at the expense of spatial resolution, while most the commercial systems operate at X-band (10 GHz) that can offer sub-decimetre resolution provide little to no ground penetration for detecting buried UXO [123]. Detection of small low-metal landmines is a major challenge due to their low dielectric constant. The finest resolution currently fielded is 0.1m, which may be adequate resolution for anomaly detection of UXO greater than 0.1m. SAR also requires a larger power aperture than GPR to obtain similar penetration depths due to its operational heights, which means larger, more power hungry sensors, hence reducing UAV endurance. SAR detection performance is also impacted by several variables such as radio frequency interference (RFI) and the dielectric properties of UXO. Conductive UXO have high dielectric constants, which is good for detection, while those based on plastics have low dielectric constants and are difficult to detect with this particular modality.
Despite these technological advancements, a significant gap remains between experimental sensor research and operational demining requirements. This disconnect is largely due to a lack of comprehensive, multimodal datasets that allow for a direct comparison of different sensing technologies under identical environmental conditions. Without such benchmarks, it is difficult to assess which sensor combinations most effectively address specific contamination scenarios, such as plastic vs. ferrous ordnance or surface vs. sub-surface targets. This study seeks to address this gap by providing a systematic evaluation of nine sensing modalities on a standardized seeded minefield, thereby establishing a data-driven framework for selecting and deploying UAV-based tools in humanitarian land release operations.
3. Materials and Methods
3.1. Seeded Minefield Experimental Design
The seeded field used as the test site for this research is operated and designed by the US-based non-profit organization the Demining Research Community in partnership with the Oklahoma State University Global Consortium for Explosive Hazard Mitigation [124]. The field was designed to accelerate research in the field of humanitarian mine action by providing an accessible, diverse, testing area located at Oklahoma State University (OSU’s) Center for Fire and Explosives, Forensic Investigation, Training and Research range in Pawnee, Oklahoma. The seeded field consists of 143 inert items organized into a grid pattern with 6 columns A–F and 25 rows, as shown in the condensed grid in Figure 2.
Figure 2.
Condensed grid for visualization of all items in seeded field (modified from [124]). Items are organized into rows A–F and columns 1–25.
The inert items in the field are extremely diverse, spanning nearly every type of explosive contamination, including 31 grenades, 27 anti-personnel mines, 25 projectiles, 11 pieces of metallic clutter, 10 3D printed ERWs, 10 shells or casings, 9 submunitions, 8 control holes, 7 improvised explosive devices, 2 anti-tank mines, and 1 TNT stick. The diversity and quantity of items makes this test site one of a kind, providing this study with a wide breadth of targets on which to assess detection methodologies. Each item was systematically buried to a specific depth ranging from 0 to 20 cm based on the likely deployment or depth of penetration of that explosive ordnance, with some submunitions and scatterable landmines placed on the surface as shown in Figure 3.
Figure 3.
Orthomosaic of Site 2 of the seeded minefield with ordnance items depth and material property indicated by the colored shapes. Note that white items are on the surface.
The site is also equipped with six Global Navigation Satellite System (GNSS) Trimble Geo7x located ground-control points and an instrument verification strip with three buried industry standard objects for calibration of metal detectors. The top soil consists of a reddish silty-clay loam common in central Oklahoma. Prior to burial, each item was classified, weighed, measured, and tested to determine whether it consisted of ferrous or non-ferrous materials. The depth, placement and measured attributes for each item are provided in Supplemental Table 1, and in Table 2 and Table 4 in Baur et al., 2023 [124]. The targets were migrated from test Site 1 to test Site 2 and later Site 3 but maintained the same placement and configuration. Site 1 was established in March 2023 with datasets collected in June 2023. Site 2, located approximately 200 m southeast of Site 1, was seeded in June 2023, with the majority of datasets collected from May to June 2024. Site 3 was established after the dataset collection on Site 2 in June 2024. The time between burial and data collection resulted in soil deposition and vegetation growth creating a more realistic environment to mimic real-world minefield conditions. Site 1, 2, and 3 all had organic sparse vegetation growth, creating natural vegetation coverage diversity over the seeded field. More details about the seeded field’s design and motivation can be found in [124].
3.2. Multimodal UAV Data Collection and Technical Documentation
Data were acquired over three field seasons (June 2023–June 2024) through a coordinated multi-institutional campaign organized by the Demining Research Community. Participating institutions included five universities (Columbia University, Binghamton University, Oklahoma State University, Rochester Institute of Technology, and University of Maryland), two commercial partners (SPH Engineering and Aletair), and one non-profit organization. The campaign produced 34 unique datasets (42 sub-IDs), spanning airborne and ground-based sensing modalities relevant to explosive ordnance detection.
The collected datasets include optical, thermal, geophysical, and radar-based sensing systems deployed on UAV, handheld, and cart-based platforms. A summary of sensing modalities and dataset counts is provided in Table 1, while specific sensor models and hardware configurations are listed in Table 2.
Table 1.
Summary of sensing modalities and number of datasets collected.
Table 2.
Sensors deployed across modalities during the data collection campaign.
Figure 1 summarizes the sensing modalities deployed across Sites 1, 2, and 3. UAV flight altitudes ranged from 0.2m (low-altitude magnetometry surveys) to 20m (hyperspectral acquisitions), depending on sensor type and operational constraints. Detailed acquisition parameters, including platform configuration, collection methodology, survey date, and dataset metadata, are provided in Figure 4.
Figure 4.
Metadata attributes for the geophysical detection datasets collected over the seeded fields.
All datasets are georeferenced and accessible for download here, https://zenodo.org/records/19100554, from the Zenodo database [9]. These datasets are also viewable through the interactive web map accompanying the paper at this link: http://de-mine.com/webmap.
Although this paper focuses on comparative analysis, comprehensive technical documentation and sensor-specific processing workflows are provided for each modality in a series of dedicated companion studies, as summarized in Table 3. Specifically, the collection and processing of RGB, thermal, and multispectral data is detailed in [10], while specialized processing for UAV-based and handheld EMI metal detectors is provided in [82]; and the processing chains for aerial magnetometry datasets can be found in [125]. Furthermore, detailed preprocessing steps for the visible and near-infrared (VNIR) hyperspectral data, including reflectance retrieval, validation, and access to ground truth spectral measurements for all targets, are available for download in [126]. The detection of PFM-1s in this dataset using VNIR hyperspectral data using statistical and deep learning methods is detailed in [35]. For the GPR dataset, a 400 MHz cart-mounted GPR system was selected as a representative terrestrial benchmark because it provides a practical balance between spatial resolution and depth of investigation for shallow subsurface targets. Previous studies have demonstrated that sufficiently sampled 400 MHz surveys can resolve small near-surface objects and structures while maintaining adequate penetration depth [127,128].
Table 3.
Reference guide for modality-specific processing workflows.
3.3. Target Picking and Detection Fidelity Using the AIU Index
In order to compare the results of different imagery and geophysical modalities on the seeded field, we apply an anomaly classification framework developed for landmine detection called the AIU Index [10]. The three categories in the AIU index are anomaly (level 1-A), identifiable anomaly (level 2-I), and unique identifiable anomaly (level 3-U), as determined by human interpretation of imagery or geophysical data. The false positive rates for these classifications decrease as the levels increase, with level 1 (anomaly) having the highest false positive rate and level 3 (unique identifiable anomalies) having the lowest. We choose to apply the AIU Index for this analysis since it can be generalized for multiple sensor outputs, providing a unified framework to compare all collected modalities with each other. Additionally, the AIU Index emphasizes the importance of identifying unique versus non-unique anomalies and prescribes the fidelity of detection with expected false positive rate for each target class. Figure 5 describes the discrimination criteria to sort each target into the AIU Index classifications.
Figure 5.
Classification criteria for the AIU Index object disambiguation framework (adapted from [10]).
Protocol for Target Picking Using AIU Index
Once each dataset is processed and georeferenced into its final data product, an analyst classifies each item using the AIU Index. Each modality has different properties, such as spatial resolution, that determines if an object is distinguishable from the background environment, and if it is categorized as an anomaly, identifiable anomaly or unique identifiable anomaly. Considering inherent physical limitations, some modalities will never be able to achieve a level 2 or 3 (unique identifiable anomalies) discrimination criteria with current techniques. Additionally, in the results section, we investigate surface and sub-surface targets separately since some methods can only detect surface objects. For the imagery-based datasets, including RGB, thermal, multispectral, hyperspectral, LWIR, and SWIR, we applied the discrimination criteria in Figure 5 to sort each target into the three AIU Index classes. For hyperspectral, we also considered the spectral uniqueness of a target by analyzing the top 15 principal component analysis (PCA) bands. For target classification in the LiDAR datasets, we analyzed the DSM derived LiDAR GeoTIFFs in QGIS to see if there were any surface disturbances in the elevation model over each item. Any surface anomaly over a target differing from the local background was classified as an anomaly and any surface disturbance over a target that had the shape and size of the object was classified as an identifiable anomaly. If the shape and size were unique in the DSM, that target would be considered a unique identifiable anomaly. For the handheld metal detectors (both EMI and magnetometry based), all audible beeps triggered by a magnetic anomaly above a calibrated noise threshold were classified as anomalies. For the handheld metal detectors used in this study, the binary audible beep does not meet the criteria for identifiable or unique identifiable anomaly. Certain military-grade metal detectors use digital signal processing to discriminate small metallic fragments and produce distinct tone transitions only when a unique, identifiable anomaly is detected.
The UAV magnetometry targets were selected by identifying anomalies with the most significant peaks compared to the background noise. First, the residual grid was inspected, followed by the analytical signal grid. Anomalies collocated with ordnance items that exhibited prominent peaks were classified as level 1 detections, as determined by a trained geophysist. At 1.0m flight height, small anomalies were difficult to interpret and excluded from the analysis as they were associated with streaking artifacts. More details about UAV magnetometry target picking and processing can be found in [125].
Detections using GPR were identified by the presence of characteristic hyperbolic reflections (parabolas) at locations corresponding to surface or buried objects. All GPR detections were characterized as anomalies since the raw GPR signals produce geophysically non-unique hyperbolic reflections. Moreover, post-processing GPR depth-slice raster data amplitude information is a unitless relative measure of dielectric permittivity. SAR data are similar to GPR in that they produce two-dimensional surface maps and in appropriate lower frequency longer wavelengths (L-band) depth profile information as well. SAR surficial reflectivity maps can also be used to potentially detect differences in materials. In this study, the SAR frequency was unable to penetrate into the subsurface.
Once all items in each dataset were categorized using the AIU Index, these data, together with item and dataset attributes, were compiled into a multi-dimensional data array using the Xarray Python (version 2025.07.0) library. All analysis for the results section was conducted using this Xarray data array, which allowed us to index or multi-index by modality, flight height, item type, depth, material property, aerial vs ground-based, and other attributes of the sensors and items.
4. Results
4.1. Detection of Surface Ordnance
In this section, we explore the results across all modalities for the detection of visible surface items. Visualization of six of the orthomosaics from these datasets can be seen in Figure 6. Figure 7 shows the average detection rate for each modality discretized into the percentage of detections that fall into anomaly, identifiable anomaly and unique identifiable anomaly. The exact percentages are reported in Table 4. Each black marker represents an individual survey conducted. The spread of black markers illustrates the intra-modality variability that may have arisen from flight height and resolution, sensor sensitivity, environmental factors, or mode of collection (handheld versus aerial). Overall, RGB imagery had the highest average detection rate across all modalities at 94.8%, with 3.2%, 46.2%, and 45.4% being characterized as anomaly, identifiable anomaly, and unique identifiable anomaly respectively. For UAV-collected modalities, thermal cameras have the next highest average detection rate at 83.7% followed by multispectral at 64.0% and hyperspectral at 58.5%. Interestingly, even though the hyperspectral had a lower overall detection rate (likely due to lower spatial resolution than the Thermal Infrared (TIR)), it had the second highest unique identifiable anomaly rate at 9.8% from taking into account both the spectral and spatial uniqueness of the targets. The handheld metal detectors had the second and fourth highest detection rates at 84.8% and 72.1% for EMI and magnetometry, respectively. For the imagery-based datasets, as image resolution increases, the results shift from no anomaly, to visual anomaly, to identifiable anomaly, to unique identifiable anomaly. This means that as resolution increased, the detection rate increased, and the false positive rate decreased.
Figure 6.
Orthomosaics derived from six imagery datasets collected at Site 2. The label in the lower-left corner of each panel indicates the spectral band–sensor combination (dataset ID). (A) RGB orthomosaic acquired with the DJI Mavic 3E. (B) Thermal infrared (TIR) orthomosaic acquired with the Autel EVO II Dual. (C) Near-infrared (NIR) orthomosaic acquired with the Parrot Sequoia multispectral camera. (D) Red-band orthomosaic acquired with the Parrot Sequoia multispectral camera. (E) Long-wave infrared (LWIR) orthomosaic acquired with the Tamarisk thermal camera. (F) LiDAR-derived digital surface model (DSM) acquired with the Velodyne VLP-16. Note that only panel (A) is a true three-band RGB image; panels (B–F) are false-color visualizations of single-band datasets.
Figure 7.
Detection rate for surface explosive ordnance by modality. Each black dot represents an individual survey conducted, with the shape of the dot representing the collection method. Circular is handheld, square is cart, and triangle is UAV-collected. The colored bars show the mean across the surveys per modality for the AIU percentages.
Table 4.
Average detection rate and AIU Index (anomaly, identifiable anomaly, unique identifiable anomaly) for surface targets for modalities tested on the seeded field. These statistics are visually represented in Figure 7.
To more fairly compare the detection rates of the top two performing UAV sensors for surface ordnance, Baur and Nitsche [10] assessed the detection rates classified by the AIU Index for the RGB and TIR seeded minefield data in the pixel on target domain. This allowed for an unbiased assessment of the value of an RGB pixel versus a TIR pixel independent of resolution or object size. This was accomplished by calculating the target’s surface area and multiplying it by the GSD to convert each object into pixels on target. Figure 8 shows that, at the same pixels on target, RGB imagery had a higher percentage of identifiable and unique identifiable anomalies compared to TIR imagery, meaning that an RGB pixel provides greater ability to detect and identify an object compared to thermal imagery. Additionally, thermal cameras are usually lower resolution than RGB cameras, which would require a lower flight height to achieve the same GSD, further emphasizing the utility RGB imagery provides.
Figure 8.
Plot showing AIU detection rates as a function of pixels on target for RGB imagery (left panel) compared to thermal imagery (right panel) adapted from [10].
4.2. Detection of Sub-Surface Ordnance
For sub-surface detection of explosive ordnance, traditional handheld metal detectors remain the gold standard with the MineLab CTX 3030 (EMI all metal) detecting 98.0% of the ferrous objects, 72.2% of non-ferrous metallic objects, and 2.3% of plastic objects. The Subsurface ML-3 ferrous metal detector resulted in 95.9% detection rate of ferrous objects, 19.5% for non-ferrous metallic objects, and 9.7% of plastic objects. The UAV magnetometer datasets achieved an average detection rate for ferrous objects of 40.8% (Table 5). Further, a UAV-based electromagnetic induction (EMI) all-metal detector, EM61Lite, was deployed over the same test site in a pseudo–drone-based configuration to simulate UAV operation. The system demonstrated detection performance comparable to the MineLab CTX 3030, while offering additional advantages in terms of survey speed and operational safety. A detailed comparative analysis of detection results obtained from the MineLab CTX 3030, ML-3 ferrous metal detector, and EM61Lite is presented in [82]. An example magnetometer survey is shown in part (A) of Figure 9. The magnetometer and metal detector picked up some non-ferrous metals likely due to these items becoming slightly magnetized. The plastic objects may have also had very small metallic components that the instruments were able to pick up. The large variability within the UAV-magnetometer is due to different flight heights between 20 cm and 1 m. Figure 10 compares the detection rate for subsurface objects using handheld EMI, handheld magnetometry, aerial magnetometry, aerial and cart-based GPR, and thermal imaging.
Table 5.
Average detection rate of buried objects by material property.
Figure 9.
Subsurface UAV sensor modalities over the seeded test area. (A) UAV-Magnetometry: analytic signal grid at 0.5 m AGL acquired with MagNIMBUS with dataset ID 14-2. (B) UAV-GPR: 0–10 cm below-surface amplitude slice at 0.5 m AGL from Radarteam Cobra with dataset ID 13. (C) UAV-Thermal: freshly buried items imaged at 12 m AGL with Autel EVO II Dual with dataset ID 4-2. AGL = flight height above ground level. Parts A and B are over Site 2, and part C is collected over Site 1.
Figure 10.
Detection rate for buried objects by modality. Each dot represents an individual dataset’s detection rate (all classified as anomaly only), with the shape representing the collection method and the colored bar representing the mean detection rate per modality per material property. Each modality shows the detection rate for ferrous metal items (light blue), non-ferrous metal items (dark blue), and plastic items (yellow). Only modalities with greater than 0% detection rate are shown, all modalities with no detections are listed to the top right.
Figure 11 shows that for the UAS magnetometer surveys, as flight height increased, detection rate decreased across nearly all object weights and that heavier objects tended to have greater detection rates. Interestingly, the small objects that fall between 50 g and 100 g which include the PFM-1 (18) and KSF-cap (1), were not detected at any flight height with the airborne magnetometer highlighting a gap in capability. This is likely due to the PFM-1 having minimal metal content, making its magnetic signatures too small for aerial detection.
Figure 11.
Plot showing detection rate for UAV magnetometry datasets as a function of flight height. The square boxes are the average for all ferrous items and the colored dots correspond to the average detection rate per weight bin of the items.
The ground penetrating radar surveys achieved a detection rate of 50.0%, 80.6% and 55.6% for ferrous, non-ferrous, and plastic objects, respectively, for the cart based system. The UAV-mounted system achieved substantially lower detection rates at a flight height of 0.5 m with detection rates of 12.1%, 11.8% and 18.2% for ferrous, non-ferrous, and plastic objects, respectively, as shown in part (B) of Figure 9. While UAV-GPR had lower detection rates for ferrous objects, it is the only system capable of detecting subsurface plastic and non-ferrous objects and estimating depth of the targets, but has insufficient detection rates for most humanitarian demining operations. The thermal infrared camera had detection rates of 0.7%, 1.4%, and 0.0% for buried objects. Given the extremely low detection rate and high likelihood of non-unique signatures that could be treated as false positives, thermal infrared cameras are highly unreliable for detection of subsurface objects in most environments. However, dataset 4-2 collected within an hour after burial shows clear thermal anomalies of the disturbed earth as seen in part (C) of Figure 9. This shows that TIR can be used to detect freshly buried items by detecting thermal anomalies above disturbed earth, but that problem is mostly relevant in the military context and not for HMA.
Unlike the surface contamination, none of the subsurface detections were classified as identifiable or uniquely identifiable anomalies with the exception of the thermal infrared detection characterized as a level 2 identifiable anomaly. This means that while subsurface detection is possible using metal detectors, magnetometers, and GPR, the detections themselves are non-identifiable and non-unique correlating with high false positive or false alarm rates due to the inability to distinguish explosive ordnance from other clutter. The specific false alarm rate is context dependent, but the inability to distinguish targets from non-targets remains a core constraint.
4.3. Detection Rate by Item
In this section, we analyze the detection rate of the top performing detection modalities by item type divided into eight superclasses—3D-printed mines (plastic), anti-personnel (AP) landmines, anti-tank (AT) landmines, casing/clutter, IEDs, PFM-1s, projectiles, and grenade/submunitions. Figure 12 shows the detection rate across the eight item classes for the top performing modalities for surface and subsurface explosive ordnance. For the surface modalities, RGB had the highest detection rate for all item classes besides AP mines. Furthermore, the imagery-based datasets are capable of detecting any explosive ordnance class regardless of material, as long as they are on the surface and visible. It is important to note that not all detections are equal in fidelity and that RGB imagery has the highest number of unique identifiable anomalies. Noticeably, aerial subsurface detection methods, including UAV-based magnetometry and GPR, had much lower detection rates less than 50% for nearly all item classes. Neither method detected a single PFM-1, due to their small size and minimal metal content, despite most being surface-lain. The handheld EMI metal detector was the only subsurface detection modality with strong performance, in which 6/8 classes had over 80% detection rate. The two exceptions were the 3D-printed mine class composed of plastic and the AT mines, where one of two was the VS 1.6 mine that had minimal metal content and is of a majority plastic composition.
Figure 12.
Detection rates by explosive ordnance class across six sensing modalities. Classes are defined in the legend at the top of the plot, with each color representing a different explosive ordnance class. N shows the number of samples present for each superclass bar.
The most detected item across all the datasets was A17, an M65AI projectile detected in 39/42 datasets. The projectile was on the surface, weighed 922 g, was painted white (highly distinct from the background soil), and was ferrous, making it an ideal candidate for most modalities. Figure 13 shows the signature of A17 in different datasets along with the AIU classification per dataset. This figure illustrates how detection fidelity (anomaly, identifiable anomaly, and unique identifiable anomaly) is important when considering the false positive rate and the ability to distinguish from clutter.
Figure 13.
Example signatures from different modalities of item A17 in the test field. Note: this plot is meant for visualization purposes only, so scale bars and legends are removed.
5. Discussion
5.1. Limitations
While this study has a diversity of items and geophysical modalities, the datasets are limited to one environment and thus the detection rates for certain modalities of this field cannot be broadly applied. Instead, we can use this information to identify the general capability of each modality and their respective performance to each other on the same field. For the analysis, there is a degree of subjectivity in the AIU characterization process, as there is not a distinct transition between the discrimination levels. We apply the criteria described in Figure 5 and group consensus for difficult objects to try to limit the degree of subjectivity and reduce individual biases for each analysis. Due to varying flight heights, differing resolutions, sensor quality differences, and other variables intra- and inter-sensor types, direct comparisons can be challenging. To mitigate this, we processed and collected each dataset using best practices and standardized workflows to optimize the sensor’s effectiveness for landmine detection. Furthermore, to remove the bias caused by different imagery resolutions, we compared the top two performing UAV-imaging techniques (RGB and thermal infrared) on a pixel-to-pixel comparison in Figure 6.
5.2. False Positives
We choose not to explicitly report on false positive rates for this study, as false positives are very context-specific. For example, using a metal detector in one field may have a high amount of anthropogenic metal pollution creating many false alarms, while another field that has no existing metal debris would result in no false alarms. Instead, we use the AIU Index classifications based on the object uniqueness of the target signatures to indicate false positive rates. For surface items, RGB imagery has the highest percentage of detections classified as level 3 (unique identifiable anomalies), which corresponds to the lowest theoretical false positive rate as a human is able to distinguish a target from another object. This allows a domain expert to distinguish the metallic clutter targets on the seeded field from the explosive ordnance effectively removing suspect targets. Note, we distinguish false positives based on a domain expert’s inability to confirm or remove a target’s signature. This is separate from algorithmically predicted false positives that are dependent on the algorithm’s accuracy and generalizability. For all buried objects, no individual modality yielded unique identifiable anomalies and were therefore unable to reliably distinguish between clutter and explosive ordnance at depth. This means, as reflected in the data, that these anomalies were all non-unique (think any metal causing a beep on a metal detector, or any buried rock or root creating a parabola in a GPR signal). Operationally, these geophysical subsurface detections must be assessed with prior information about the expected contamination level of the field, the sensitivity of the task, and how much metal or buried debris may be present. When surveying a clean, mostly homogenous environment, an operator may be able to investigate every anomaly class, whereas when surveying a dirty field or false positive rich environment, an operator may choose to only investigate the higher confidence signals.
5.3. Capability Assessment and Considerations in the Field
Based on the results of this study, we found each modality has different use cases for mine action operations shown in Table 6.
Table 6.
Detection methods with corresponding data products and capabilities for mine action.
While quantifying the sensor responses on a seeded field and their corresponding capabilities is a crucial first step in developing technology for landmine detection, it is important to determine if these technologies are ready and useful for field operations. Considerations to include are the maturity of the system, the cost, the existence of commercially available hardware and software solutions, and the level of expertise required to process or interpret the data. If any of these factors present significant barriers for an organization, they are unlikely to adopt the system regardless of the detection rate or utility. The technology readiness level (TRL) is a scale commonly used to assess the maturity of a technology or method [129]. TRL is ranked on a scale from 1 being basic principles of a concept observed to 9 being the system is fully operational and extremely mature. We apply the TRL framework here to assist with the feasibility analysis. Table 7 provides ranges on these considerations for UAV-based mine action operations for select modalities.
Table 7.
Considerations for remote sensing-based landmine detection techniques using UAV platforms.
One of the most important factors for adopting remote sensing systems is cost. The cost for advanced UAS presents a major barrier for wide-scale adoption of new techniques in HMA, requiring new technologies to provide safety and efficiency gains, but also be within budget. Figure 14 shows the cost of different sensors and their aerial platforms tested in this study, with each dot representing the different sensors tested (these costs are reflected in the cost for hardware column in Table 7). At the time of this study, we see that RGB or visual imagery is the cheapest drone-based detection system followed by multispectral and thermal cameras in the cost range of $3000 to $10,000. The subsurface detection methods such as magnetometry and GPR are substantially more expensive with the UAV-magnetometry systems ranging from $27,100–46,600, and the UAS GPR system costing $57,000. These cost differences tend to reflect the different maturity levels.
Figure 14.
Average cost at the time of this study of the sensor systems (including platform) for all modalities in this study. The bars represent the average cost per modality and the dots represent the individual sensor system costs.
An interesting distinction on usability between surface and subsurface detection modalities is the flight height required for optimal data collection. Most imagery-based modalities can collect high-resolution imagery that can resolve anti-personnel mines at flight heights between 10 and 50 m, whereas the subsurface geophysical modalities (magnetometry and GPR) need to fly with the sensor extremely close to the ground for best results, typically less than 2 m and ideally less than 1 m for the best results. Operationally, this means imaging systems like RGB can cover much more area per day than the geophysical modalities, which are constrained by flight height and complex terrain-following flight paths. For example, a typical mapping drone such as the DJI Mavic 3E used in this study can cover up to 20 hectares per day for photogrammetry mapping missions at 0.3 cm/pixel resolution, while a magnetometry system can only cover a few hectares in that same time.
Considering the low-cost, scalability of surveying, required expertise, highest detection rates, and highest detection fidelity, UAV RGB imagery is holistically the best way to map out and detect surface objects like those in this study. For nighttime operations when RGB is not useful, thermal infrared imagery would provide the next best option to detect surface ordnance but struggles with non-unique signatures using the AIU Index. For subsurface targets, no other modalities match RGB’s price, speed, detection rates, and detection fidelity. At this point in time, the only method to reliably detect subsurface ordnance with a high degree accuracy (>90%) are handheld metal detectors. UAV-based approaches such as airborne magnetometry and GPR resulted in <50% detection rate of all targets in this study (with only level 1 AIU fidelity) with the requirement that the sensor must be less than 1 m off the ground during the flight which requires excellent flight planning software or manual terrain-following that may be impossible due to vegetation or other obstacles. Due to incompatible flight heights, it is not advisable to mount combinations of multiple sensors on a UAV unless the resolution requirements during data acquisition are aligned. There are use cases, such as looking for large metallic buried objects in lightly vegetated fields, where UAV-based geophysical sensors can increase efficiency for identifying suspected areas, as well as provide evidence for areas where ordnance items are not found, which can bolster the ability to reduce suspected hazardous area polygons. It is worth noting that all of these statements are for sensors used in isolation—sensor-fusion can greatly improve detection and classification capabilities, but at the expense of increased cost and complexity [130,131]. One example of successful implementation of a multi-sensor system for landmine detection includes the handheld dual-sensor metal detector and GPR system that can detect both metal and plastic objects and reduce false positive rates [132]. When applying multi-sensor systems to UAVs or UGVs, several factors must be considered, including sensor weight and power requirements, required survey altitude, data collection speed, false positive rate, and whether multiple sensors can be operated simultaneously. Some modalities provide partially redundant information (RGB and multispectral), which may increase confidence in detections through corroboration, whereas other modalities provide non-overlapping capabilities (RGB and magnetometry) that expand applicability across a wider range of contamination scenarios. Consequently, future explosive ordnance survey systems will likely benefit from carefully selected combinations of complementary sensors coupled with advanced data fusion and machine learning techniques. This study outlines non-overlapping capabilities that can be effectively combined in future sensor-fusion systems. Overall, UAV-based RGB imagery is the most effective method for detecting and mapping surface contamination and UAV-based detection of subsurface contamination requires further development to match traditional metal detector approaches.
Understanding the nature of explosive ordnance contamination at a site should be the starting place for determining which remote sensing methods will be effective and feasible to increase the efficiency for land release. Using this logic, we divide the type, properties, and emplacement of explosive contamination into the following problem sets/use cases and pair them with the most holistically effective and operational tool with associated cost and detection rate based on this seeded field study. A comparison of detection capabilities, sensing tools, operational costs, and detection rates across the evaluated contamination scenarios is presented in Table 8.
Table 8.
Comparison of detection capabilities, sensing tools, costs, and detection rates for different contamination scenarios from this study.
A contaminated area may contain one or a combination of the listed problem sets depending on the battle history. Figure 15 graphically represents the problem sets paired with UAV detection capabilities rated by detection rate, cost, and practicality. An operator can use this framework and apply a set of questions such as, “is there expected surface contamination?”, “are the targets expected to be ferrous or non-ferrous?”, and “how deep is the contamination likely to be?”, to select the best remote sensing approach and its relevant utility to help map out landmines and other explosive remnants of war on any given task. Problem set 1 (visible surface contamination) is especially relevant in Ukraine and other areas of recent conflict.
Figure 15.
Graphic illustration of different UAV-based landmine and UXO detection capabilities divided by problem set. The colored stars indicate which modality has the highest detection rate, cheapest, and most mature/practical depending on the star color.
Based on this comprehensive study, we determined for robust and reliable clearance, handheld metal detectors remain a necessary and essential tool for deminers during clearance operations. We also underscore that no single technology is effective across all contamination types or problem sets. Instead, aligning modality capabilities to specific problem sets is the most practical way to integrate remote sensing techniques to increase efficiency in the field. We show that multiple remote sensing technologies, when applied to the correct problem set, can provide both direct and indirect evidence of explosive ordnance during non-technical and technical surveys. This information can provide critical information regarding the types and extent of explosive hazards in a contaminated area, which in turn can improve the safety and efficiency of the land-release process as well as inform decision makers on priority of clearance.
5.4. Gaps in Current Capabilities
Based on our comprehensive analysis across all modalities and explosive ordnance types in a controlled field in a near-ideal environment (low vegetation, flat terrain), we highlight gaps in current UAV-based detection capabilities. Figure 10 highlights how airborne GPR and magnetometry failed to detect the PFM-1, a small scatterable minimum-metal content AP mine. Imagery-based methods such as RGB and TIR were able to detect these mines on the surface, but no UAV-attached modality can detect these items if visually obscured (by vegetation or subsurface at any depth). This gap likely also extends to other small plastic and minimum metal mines, presenting a danger in the field and emphasizing the need to use traditional manual detection methods like metal detectors and prodding instruments or mechanical assets when applicable.
Vegetation presents additional challenges for remote detection of explosive ordnance. First, as vegetation cover increases over surface ordnance, the detection rate and the ability to visually discern an object decreases along a sigmoid curve [37]. Once completely covered, RGB, thermal, hyperspectral, multispectral and other imaging modalities cannot penetrate the vegetation, and thus the objects are undetectable if fully covered. In theory, LiDAR can penetrate vegetation, but in practice the data were noisy and resulted in only a 9.6% detection rate for visible surface items without vegetation, and 0% detection for items obscured by vegetation. Vegetation height greater than 1 m may also prevent the ability for aerial magnetometry to fly low enough to detect explosive ordnance, as the magnetic field strength of a ferrous object decreases as the inverse cube of distance (∝1/r3) [133]. To minimize risk to an expensive UAV and sensor, flying 1 m above the vegetated surface is recommended, so the distance above the targets becomes vegetation height + 1 m, which may preclude detection of most smaller explosive ordnance less than 1000 g. This trend of decreasing detection rate with increasing flight height is shown in Figure 11. Similarly, GPR performance also degrades with increased standoff distance as the radar signal weakens upon transmission of the air–ground interface. As the antenna is elevated, signal penetration and resolution decrease, particularly for small or low-contrast objects, making reliable detection increasingly unlikely beyond shallow depths or in dense vegetation [134]. This shows that the main gap is the lack of UAV-based detection for buried objects at flight heights greater than 1 m, or in heavily vegetated environments.
Another gap is that UAV-GPR struggles to produce useful data in soil types that are water saturated, have high clay content, or are rich in conductive minerals even in non-vegetated environments [135]. Since GPR was the only modality that detected subsurface plastic objects, this results in the inability for plastic or non-ferrous targets to be detected in certain soil types. Furthermore, the UAV-GPR survey from this study had a very low average detection rate across all items at 11.1% at 0.5m flight height, making the utility limited even in a controlled setting. Broadly, this means that detection of buried plastic ordnance via UAVs is not reliable with current techniques. Theoretically, SAR may help to overcome some of the limitations of GPR, but the SAR system tested in this study failed to detect any ordnance. Additionally, aerial magnetic gradiometry has some potential for detecting subsurface hazards at scale, but was not explicitly tested in this study. While remote sensing technologies are showing promise for scalable, safe, and efficient results for landmine detection, the presented gaps in capabilities emphasize that these technologies can be used to augment, not replace current manual detection methods.
5.5. Future Work
This study presents the most diverse and expansive open-source seeded minefield with multimodal geophysical datasets and associated detection results for each modality. This presents future researchers an opportunity to investigate this rich comparative dataset and analyze trends and trade-offs between sensors, specific items, material properties, depths, flight heights and more. Due to the wide scope of this study, we purposefully did not include machine learning or algorithmic methods to automate the detection of ordnance from the sensor data. Instead, we choose to focus solely on the target signatures, as understanding the signatures and their inherent properties and uniqueness is the basis for developing automated detection methods such as machine learning. In workflows where detection algorithms are operationally utilized, detection rates are a function of the target signature (discussed in this study) along with algorithm accuracy, and thus must be assessed in conjunction with each other. For example, for a PFM-1 antipersonnel mine to be detected from RGB UAV-imagery using an ML algorithm, first the PFM-1 must be on the surface and visible (characterized by the AIU Index), and then the model must detect that mine (recall and precision of machine learning model) [136]. The open-source datasets produced from this study enable future researchers to investigate data-driven sensor-fusion techniques and the development of machine learning models to automate detection in different modalities. Additionally, the gaps in current capabilities highlight a breadth of technical challenges to work on to provide meaningful contributions for humanitarian mine action. Lastly, the seeded field used in this study is still available for future testing. In fact, the Demining Research Community has expanded the seeded minefield to include a neighboring UXO field with 19 new targets. These targets are larger, all metallic, and buried deeper between 0.5 and 1.5 m. The field includes three BM-21 122 mm grad rockets buried at 90 degrees, 30 degrees and 0 degrees meant to represent a battle area clearance environment. We invite other researchers interested in evaluating and developing UXO and landmine detection technology to come to the seeded field and contribute to this growing open-source humanitarian project.
6. Conclusions
This study encompassed the largest ever multimodal remote sensing datasets on a seeded minefield and assessment on the state-of-art UAV-based explosive ordnance detection methods. We analyzed and compared 34 unique datasets covering all common remote sensing and geophysical modalities for 143 explosive ordnance. We found that UAV-based RGB imagery was the most cost-effective, scalable, and highest-accuracy method for detecting surface targets, and the traditional handheld EMI-based metal detector was the most effective way to detect subsurface targets. This study encourages future research analyzing the multimodal, open-source benchmark datasets, interactive web map, and seeded field that accompany this paper.
Author Contributions
Conceptualization, J.B., S.L. and G.S.; methodology, J.B., S.L., G.S., A.N., T.d.S., A.B. and H.M.; software, J.B., S.L., A.N., T.d.S., H.M., T.B. and N.R.; data curation, J.B., S.L., G.S., A.N., T.d.S., A.B., E.J.I., H.M., T.B. and N.R.; validation, J.B., S.L., A.N., T.d.S. and E.J.I.; formal analysis, J.B., S.L., A.N., T.d.S., A.B. and H.M.; investigation, J.B., S.L. and G.S.; resources, J.B., S.L., G.S., A.N., T.d.S., A.B., E.J.I., H.M., J.E., T.B., N.R. and J.F.; visualization, J.B. and J.E.; supervision, A.N., E.J.I., F.N. and J.F.; project administration, J.B.; funding acquisition, J.B., G.S., A.N., T.d.S., E.J.I., H.M. and J.F.; writing—original draft, J.B., S.L., A.N. and T.d.S.; writing—review and editing, J.B., S.L., G.S., A.N., T.d.S., E.J.I., F.N. and H.M. All authors have read and agreed to the published version of the manuscript.
Funding
This research received no external funding. The costs associated with field trials and data collection were managed and supported independently by the participating individual teams and their respective institutions.
Institutional Review Board Statement
Not applicable.
Informed Consent Statement
Not applicable.
Data Availability Statement
The datasets analyzed in this study are openly available on Zenodo at https://zenodo.org/records/19100554 (accessed on 2 May 2026). The accompanying interactive web map is available at http://de-mine.com/webmap (accessed on 2 May 2026).
Acknowledgments
The authors would like to thank the staff and volunteers of the Demining Research Community for their essential assistance in seeded field preparation and multimodal data collection. We also acknowledge the institutional support from the collaborating research laboratories at the Rochester Institute of Technology, the OSU Global Consortium for Explosive Hazard Mitigation, Lamont-Doherty Earth Observatory at Columbia University, and Binghamton University for providing the necessary technical facilities and sensor equipment. Finally, the authors express their gratitude to all individuals who provided technical expertise and feedback during the field trials. During the preparation of this manuscript, the authors used ChatGPT (GPT-4o) for the purposes of LaTeX formatting. The authors have reviewed and edited the output and take full responsibility for the content of this publication.
Conflicts of Interest
Authors Timothy de Smet were employed by the Aletair LLC Company. The remaining authors declare that the research was conducted in the absence of any commercial or financial relationships that could be construed as a potential conflict of interest.
References
- International Campaign to Ban Landmines–Cluster Munition Coalition (ICBL-CMC). Landmine Monitor 2024. Available online: https://the-monitor.org/reports/landmine-monitor-2024 (accessed on 2 May 2026).
- Garbino, H. The Impact of Landmines and Explosive Remnants of War on Food Security: The Lebanese Case. J. Conv. Weapons Destr. 2019, 23, 6. [Google Scholar]
- Sobhani, P.; Daneshmehr, H. Landmines and Human Security in Post-Conflict Era: Analyzing the Narratives of Landmine Victims in Kurdistan Province, Iran. J. Borderl. Stud. 2024, 40, 477–496. [Google Scholar] [CrossRef] [Scilit]
- Gunawardana, H.; Tantrigoda, D.; Kumara, U. Humanitarian Demining and Sustainable Land Management in Post-Conflict Settings in Sri Lanka: Literature Review. J. Manag. Sustain. 2016, 6, 79. [Google Scholar] [CrossRef] [Scilit]
- Frost, A.; Boyle, P.; Autier, P.; King, C.; Zwijnenburg, W.; Hewitson, D.; Sullivan, R. The effect of explosive remnants of war on global public health: A systematic mixed-studies review using narrative synthesis. Lancet Public Health 2017, 2, e286–e296. [Google Scholar] [CrossRef] [Scilit] [PubMed]
- ReliefWeb. Ukraine’s Landmines Need to Be Cleared Before Minerals Can Be Mined; HALO Trust: London, UK, 2025. [Google Scholar]
- Lekhak, S. Researchers are Combining Drones and AI to Make Removing Land Mines Faster and Safer. The Conversation, 2026. Available online: https://www.seattlepi.com/news/researchers-are-combining-drones-and-ai-to-make-a21956868 (accessed on 24 June 2026).
- Baur, J.; Steinberg, G.; Lekhak, S.; Nikulin, A.; de Smet, T.; Ientilucci, E.J.; Brinkley, A.; Myers, H.; Nitsche, F. Demining Research Community Seeded Field Multimodal Landmine Detection Dataset; Zenodo dataset; Zenodo: Geneva, Switzerland, 2026. [Google Scholar] [CrossRef]
- Baur, J.; Steinberg, G. Demining Research Community Seeded Field: High- Resolution RGB, Thermal IR, and Multispectral Orthomosaics; Zenodo dataset; Zenodo: Geneva, Switzerland, 2025. [Google Scholar] [CrossRef]
- Baur, J.; Nitsche, F.O. A False-Positive-Centric Framework for Object Detection Disambiguation. Remote Sens. 2025, 17, 2429. [Google Scholar] [CrossRef] [Scilit]
- Gutton, M.C. Sur une balance d’induction destinée à la recherche des obus enterrés dans les terrains à mettre en culture. In Comptes Rendus l’Académie des Sciences; National Academy of Sciences: Washington, DC, USA, 1915; pp. 71–73. [Google Scholar]
- Evans, R.; Temple, T.P.; Nelson, L. The Detection Problem: An Eight-Decade Challenge: The Difficulty of Practically Detecting and Discriminating Mines, Booby Traps, and Victim Operated Improvised Explosive Devices. J. Conv. Weapons Destr. 2024, 28, 8. [Google Scholar]
- Crowther, E.; Shepel, N. Phase II Testing of UAV/Sensor Systems for Humanitarian Mine Action In Ukraine. J. Conv. Weapons Destr. 2024, 28, 8. [Google Scholar]
- Kappler, K.N.; Gasperikova, E. A hybrid method for UXO vs. non-UXO discrimination. J. Environ. Eng. Geophys. 2011, 16, 177–189. [Google Scholar] [CrossRef] [Scilit]
- Núñez-Nieto, X.; Solla, M.; Gómez-Pérez, P.; Lorenzo, H. GPR Signal Characterization for Automated Landmine and UXO Detection Based on Machine Learning Techniques. Remote Sens. 2014, 6, 9729–9748. [Google Scholar] [CrossRef] [Scilit]
- Bray, M.P.; Link, C.A. Learning Machine Identification of Ferromagnetic UXO Using Magnetometry. IEEE J. Sel. Top. Appl. Earth Obs. Remote Sens. 2015, 8, 835–844. [Google Scholar] [CrossRef] [Scilit]
- United Nations Mine Action Service (UNMAS). International Mine Action Standards (IMAS 07.10): Guidelines and Requirements for the Management of Land Release and Residual Contamination Operations, 7th ed.; United Nations Mine Action Service (UNMAS): New York, NY, USA, 2018; Available online: https://www.mineactionstandards.org/fileadmin/uploads/imas/Standards/English/IMAS_07.10_Ed.1_Am.7.pdf (accessed on 3 February 2026).
- Geneva International Centre for Humanitarian Demining (GICHD). A Guide to Mine Action, 5th ed.; GICHD: Geneva, Switzerland, 2014; Available online: https://www.gichd.org/publications-resources/publications/guide-to-mine-action-2014/ (accessed on 24 June 2026).
- Macdonald, J.; Lockwood, J.; Mcfee, J.; Altshuler, T.; Broach, T.; Carin, L.; Harmon, R.; Rappaport, C.; Scott, W.; Weaver, R. Alternatives for Landmine Detection; RAND: Santa Monica, CA, USA, 2003. [Google Scholar]
- Bromenshenk, J.; Henderson, C.; Seccomb, R.; Rice, S.; Etter, R.; Bender, S.; Rodacy, P.; Shaw, J.; Seldomridge, N.; Spangler, L.; et al. Can honey bees assist in area reduction and landmine detection? J. Conv. Weapons Destr. 2003, 7, 5. [Google Scholar]
- Prada, P.A.; Rodríguez, M.C. Demining dogs in Colombia–A review of operational challenges, chemical perspectives, and practical implications. Sci. Justice 2016, 56, 269–277. [Google Scholar] [PubMed]
- Kasianchuk, A.; Lastivka, H.; Samila, A. Perspectives on the Development and Use of Nuclear Methods for Detecting Landmines and Minefields: A Review. Secur. Infocommun. Syst. Internet Things 2025, 3, 01010. [Google Scholar] [CrossRef] [Scilit]
- Jeremic, A.; Nehorai, A. Landmine detection and localization using chemical sensor array processing. IEEE Trans. Signal Process. 2000, 48, 1295–1305. [Google Scholar]
- Udayakumar, N. Visible Light Imaging. In Imaging with Electromagnetic Spectrum; Manickavasagan, A., Jayasuriya, H., Eds.; Springer: Berlin/Heidelberg, Germany, 2014; pp. 83–100. [Google Scholar] [CrossRef] [Scilit]
- Green, D.; Hagon, J.; Gómez, C.; Gregory, B. Using low-cost UAVs for environmental monitoring, mapping, and modelling: Examples from the coastal zone. In Coastal Management; Krishnamurthy, R., Jonathan, M., Srinivasalu, S., Glaeser, B., Eds.; Elsevier: Amsterdam, The Netherlands, 2019; pp. 465–501. [Google Scholar] [CrossRef] [Scilit]
- James, M.R.; Carr, B.; D’Arcy, F.; Diefenbach, A.; Dietterich, H.; Fornaciai, A.; Lev, E.; Liu, E.; Pieri, D.; Rodgers, M.; et al. Volcanological applications of unoccupied aircraft systems (UAS): Developments, strategies, and future challenges. Volcanica 2020, 3, 67–114. [Google Scholar] [CrossRef] [Scilit]
- Olson, D.; Anderson, J. Review on unmanned aerial vehicles, remote sensors, imagery processing, and their applications in agriculture. Agron. J. 2021, 113, 971–992. [Google Scholar] [CrossRef] [Scilit]
- Remondino, F.; Barazzetti, L.; Nex, F.; Scaioni, M.; Sarazzi, D. UAV photogrammetry for mapping and 3D modeling-Current status and future perspectives. Int. Arch. Photogramm. Remote Sens. Spat. Inf. Sci. 2011, XXXVIII-1/C22, 25–31. [Google Scholar] [CrossRef] [Scilit]
- Baur, J. Ukraine is Riddled with Land Mines: Drones and AI Can Help. IEEE Spectr. 2024, 61, 42–49. [Google Scholar] [CrossRef] [Scilit]
- Baur, J.; Steinberg, G.; Nikulin, A.; Chiu, K.; de Smet, T. How to Implement Drones and Machine Learning to Reduce Time, Costs, and Dangers Associated with Landmine Detection. J. Conv. Weapons Destr. 2021, 25, 29. [Google Scholar]
- Vivoli, E.; Bertini, M.; Capineri, L. Deep learning-based real-time detection of surface landmines using optical imaging. Remote Sens. 2024, 16, 677. [Google Scholar]
- Cao, Y.; He, Z.; Wang, L.; Wang, W.; Yuan, Y.; Zhang, D.; Zhang, J.; Zhu, P.; Gool, L.; Han, J.; et al. VisDrone-DET2021: The Vision Meets Drone Object detection Challenge Results. In 2021 IEEE/CVF International Conference on Computer Vision Workshops (ICCVW); IEEE: New York, NY, USA, 2021; pp. 2847–2854. [Google Scholar] [CrossRef] [Scilit]
- Redmon, J.; Divvala, S.; Girshick, R.; Farhadi, A. You Only Look Once: Unified, Real-Time Object Detection. In Proceedings of the 2016 IEEE Conference on Computer Vision and Pattern Recognition (CVPR); IEEE: New York, NY, USA, 2016; pp. 779–788. [Google Scholar] [CrossRef] [Scilit]
- Karwandyar, S.; Pingel, T.J.; Nikulin, A. Deep Learning and Multiview-Based Detection of Scatterable PFM-1 Landmines: Performance, Out-of-Sample Evaluation, and Field Readiness. Geomatics 2026, 6, 54. [Google Scholar] [CrossRef] [Scilit]
- Lekhak, S.; Pulakurthi, P.R.; Bhatta, R.; Ientilucci, E.J. Benchmarking Deep Learning and Statistical Target Detection Methods for PFM-1 Landmine Detection in UAV Hyperspectral Imagery. arXiv 2026, arXiv:2602.10434. [Google Scholar]
- Malizia, M.; Hasselmann, K.; Miuccio, A.; Haelterman, R.; Tsiogkas, N.; Demeester, E. PFM-1 Landmine Detection in Vegetation Using Thermal Imaging with Limited Training Data. In Proceedings of the 2025 25th International Conference on Control, Automation and Systems (ICCAS); IEEE: New York, NY, USA, 2025; pp. 1864–1869. [Google Scholar]
- Baur, J.; Dewey, K.; Steinberg, G.; Nitsche, F.O. Modeling the effect of vegetation coverage on unmanned aerial vehicles-based object detection: A study in the minefield environment. Remote Sens. 2024, 16, 2046. [Google Scholar] [CrossRef] [Scilit]
- Lekhak, S.; Ientilucci, E.J.; Dera, D.; Ghosh, S. Uncertainty Quantification in Surface Landmines and UXO Classification using MC Dropout. In Proceedings of the IGARSS 2025—2025 IEEE International Geoscience and Remote Sensing Symposium; IEEE: New York, NY, USA, 2025; pp. 1177–1181. [Google Scholar] [CrossRef] [Scilit]
- Driggers, R.G.; Friedman, M.H.; Devitt, J.W.; Furxhi, O.; Singh, A. Introduction to Infrared and Electro-Optical Systems, 3rd ed.; Artech House: Norwood, MA, USA, 2022. [Google Scholar]
- Ishimwe, R.; Abutaleb, K.; Ahmed, F. Applications of Thermal Imaging in Agriculture—A Review. Adv. Remote Sens. 2014, 3, 128–140. [Google Scholar] [CrossRef]
- DiNapoli, R.J.; Lipo, C.P.; de Smet, T.S.; Hunt, T.L. Thermal Imaging Shows Submarine Groundwater Discharge Plumes Associated with Ancient Settlements on Rapa Nui (Easter Island, Chile). Remote Sens. 2021, 13, 2531. [Google Scholar] [CrossRef] [Scilit]
- Yeom, S. Thermal Image Tracking for Search and Rescue Missions with a Drone. Drones 2024, 8, 53. [Google Scholar] [CrossRef] [Scilit]
- Sundar, R.; Gupta, S.C.; Verma, K.S. Thermal Imaging: Reconnaissance & Surveillance Applications. J. Opt. 1980, 9, 33–40. [Google Scholar] [CrossRef] [Scilit]
- Garrido, I.; Lagüela, S.; Otero, R.; Arias, P. Thermographic methodologies used in infrastructure inspection: A review—data acquisition procedures. Infrared Phys. Technol. 2020, 111, 103481. [Google Scholar] [CrossRef] [Scilit]
- Smet, T.; Nikulin, A. Catching “butterflies” in the morning: A new methodology for rapid detection of aerially deployed plastic land mines from UAVs. Lead. Edge 2018, 37, 367–371. [Google Scholar] [CrossRef] [Scilit]
- Nikulin, A.; De Smet, T.S.; Baur, J.; Frazer, W.D.; Abramowitz, J.C. Detection and Identification of Remnant PFM-1 ‘Butterfly Mines’ with a UAV-Based Thermal-Imaging Protocol. Remote Sens. 2018, 10. [Google Scholar] [CrossRef] [Scilit]
- deSmet, T.; Nikulin, A.; Frazer, W.; Baur, J.; Abramowitz, J.; Finan, D.; Denara, S.; Aglietti, N.; Campos, G. Drones and “Butterflies”: A Low-Cost UAV System for Rapid Detection and Identification of Unconventional Minefields. J. Conv. Weapons Destr. 2018, 22, 10. [Google Scholar]
- Bajić, M.; Potočnik, B. UAV Thermal Imaging for Unexploded Ordnance Detection by Using Deep Learning. Remote Sens. 2023, 15, 967. [Google Scholar] [CrossRef] [Scilit]
- Khanafer, K.; Vafai, K. Thermal analysis of buried land mines over a diurnal cycle. IEEE Trans. Geosci. Remote Sens. 2002, 40, 461–473. [Google Scholar] [CrossRef]
- Chrzanowski, K. Noise Equivalent Temperature Difference of Infrared Systems under Field Conditions. Opt. Appl. 1993, 23, 61. [Google Scholar]
- Torres-Rua, A. Vicarious Calibration of sUAS Microbolometer Temperature Imagery for Estimation of Radiometric Land Surface Temperature. Sensors 2017, 17, 1499. [Google Scholar] [CrossRef] [Scilit] [PubMed]
- Tyo, J.S.; Ratliff, B.M.; Boger, J.K.; Black, W.T.; Bowers, D.L.; Fetrow, M.P. The Effects of Thermal Equilibrium and Contrast in LWIR Polarimetric Images. Opt. Express 2007, 15, 15161–15167. [Google Scholar] [CrossRef] [Scilit] [PubMed]
- Sendur, I.K.; Baertlein, B.A. Numerical simulation of thermal signatures of buried mines over a diurnal cycle. In Proceedings of the Detection and Remediation Technologies for Mines and Minelike Targets V; Dubey, A.C., Harvey, J.F., Broach, J.T., Dugan, R.E., Eds.; International Society for Optics and Photonics, SPIE: Cergy, France, 2000; Volume 4038, pp. 156–167. [Google Scholar] [CrossRef] [Scilit]
- Campbell, J.B.; Wynne, R.H.; Thomas, V.A. Introduction to Remote Sensing, 6th ed.; Guilford Press: New York, NY, USA, 2022. [Google Scholar]
- Goetz, A.F.H.; Vane, G.; Solomon, J.E.; Rock, B.N. Imaging Spectrometry for Earth Remote Sensing. Science 1985, 228, 1147–1153. [Google Scholar] [CrossRef] [Scilit] [PubMed]
- Tucker, C.J. Red and Photographic Infrared Linear Combinations for Monitoring Vegetation. Remote Sens. Environ. 1979, 8, 127–150. [Google Scholar] [CrossRef] [Scilit]
- Watson, D.J. Comparative Physiological Studies on the Growth of Field Crops: I. Variation in Net Assimilation Rate and Leaf Area between Species and Varieties, and within and between Years. Ann. Bot. 1947, 11, 41–76. [Google Scholar] [CrossRef] [Scilit]
- Huete, A.; Didan, K.; Miura, T.; Rodriguez, E.; Gao, X.; Ferreira, L. Overview of the radiometric and biophysical performance of the MODIS vegetation indices. Remote Sens. Environ. 2002, 83, 195–213. [Google Scholar] [CrossRef] [Scilit]
- Kerekes, J.P.; Schott, J.R. Hyperspectral Imaging Systems. In Hyperspectral Data Exploitation; Chang, C.I., Ed.; Wiley: Hoboken, NJ, USA, 2007. [Google Scholar] [CrossRef] [Scilit]
- McFee, J.E.; Anger, C.; Achal, S.; Ivanco, T. Landmine detection using passive hyperspectral imaging. In Proceedings of SPIE: Chemical and Biological Sensing VIII; SPIE: Bellingham, WA, USA, 2007; Volume 6554, p. 655404. [Google Scholar] [CrossRef] [Scilit]
- Fowler, J.E. Compressive pushbroom and whiskbroom sensing for hyperspectral remote-sensing imaging. In Proceedings of the 2014 IEEE International Conference on Image Processing (ICIP); IEEE: New York, NY, USA, 2014; pp. 684–688. [Google Scholar] [CrossRef] [Scilit]
- Aasen, H.; Honkavaara, E.; Lucieer, A.; Zarco-Tejada, P.J. Quantitative Remote Sensing at Ultra-High Resolution with UAV Spectroscopy: A Review of Sensor Technology, Measurement Procedures, and Data Correction Workflows. Remote Sens. 2018, 10, 1091. [Google Scholar] [CrossRef] [Scilit]
- Jia, J.; Wang, Y.; Chen, J.; Guo, R.; Shu, R.; Wang, J. Status and application of advanced airborne hyperspectral imaging technology: A review. Infrared Phys. Technol. 2020, 104, 103115. [Google Scholar] [CrossRef] [Scilit]
- Dastranj, M.; Smet, T.; Wigdahl-Perry, C.; Chiu, K.; Bihl, T.; Boubin, J. REMIX: Real-time Hyperspectral Anomaly Detection for Small UAVs. In 2025 International Conference on Unmanned Aircraft Systems (ICUAS); IEEE: New York, NY, USA, 2025. [Google Scholar] [CrossRef] [Scilit]
- Manolakis, D.; Shaw, G. Detection algorithms for hyperspectral Imaging applications. Signal Process. Mag. 2002, 19, 29–43. [Google Scholar] [CrossRef] [Scilit]
- Bioucas-Dias, J.; Plaza, A.; Camps-Valls, G.; Scheunders, P.; Nasrabadi, N.; Chanussot, J. Hyperspectral Remote Sensing Data Analysis and Future Challenges. Geosci. Remote Sens. Mag. 2013, 1, 6–36. [Google Scholar] [CrossRef] [Scilit]
- Stuart, M.B.; McGonigle, A.J.S.; Willmott, J.R. Hyperspectral Imaging in Environmental Monitoring: A Review of Recent Developments and Technological Advances in Compact Field Deployable Systems. Sensors 2019, 19, 3071. [Google Scholar] [CrossRef] [Scilit] [PubMed]
- Adão, T.; Hruška, J.; Pádua, L.; Bessa, J.; Peres, E.; Morais, R.; Sousa, J.J. Hyperspectral Imaging: A Review on UAV-Based Sensors, Data Processing and Applications for Agriculture and Forestry. Remote Sens. 2017, 9, 110. [Google Scholar] [CrossRef] [Scilit]
- Makki, I.; Younes, R.; Francis, C.; Bianchi, T.; Zucchetti, M. A survey of landmine detection using hyperspectral imaging. ISPRS J. Photogramm. Remote Sens. 2017, 124, 40–53. [Google Scholar] [CrossRef] [Scilit]
- Tuohy, M.; Baur, J.; Steinberg, G.; Pirro, J.; Mitchell, T.; Nikulin, A.; Frucci, J.; Smet, T. Utilizing UAV-based hyperspectral imaging to detect surficial explosive ordnance. Lead. Edge 2023, 42, 98–102. [Google Scholar] [CrossRef] [Scilit]
- Pietersen, R.A.; Park, J.; Reasoner, J.W.; Robinson, B.M.; Diltz, R.A.; Einstein, H.H. Data quality assessment of drone-mounted hyperspectral imaging system for unexploded ordnance (UXO) detection. In Proceedings of the Algorithms, Technologies, and Applications for Multispectral and Hyperspectral Imaging XXX; Velez-Reyes, M., Messinger, D.W., Eds.; International Society for Optics and Photonics, SPIE: Cergy, France, 2024; Volume 13031, p. 1303108. [Google Scholar] [CrossRef] [Scilit]
- Keshava, N.; Mustard, J. Spectral unmixing. IEEE Signal Process. Mag. 2002, 19, 44–57. [Google Scholar] [CrossRef] [Scilit]
- Griffin, M.; Burke, H.h. Compensation of Hyperspectral Data for Atmospheric Effects. Linc. Lab. J. 2003, 14, 29–54. [Google Scholar]
- Everett, M.E. Theoretical Developments in Electromagnetic Induction Geophysics with Selected Applications in the Near Surface. Surv. Geophys. 2012, 33, 29–63. [Google Scholar]
- Bell, T.; Barrow, B.; Miller, J. Subsurface discrimination using electromagnetic induction sensors. IEEE Trans. Geosci. Remote Sens. 2001, 39, 1286–1293. [Google Scholar] [CrossRef] [Scilit]
- Smet, T.; Everett, M.; Pierce, C.; Pertermann, D.; Dickson, D. Electromagnetic induction in subsurface metal targets: Cluster analysis using local point-pattern spatial statistics. Geophysics 2012, 77, WB161–WB169. [Google Scholar] [CrossRef] [Scilit]
- Scott, W.R. Broadband electromagnetic induction sensor for detecting buried landmines. In Proceedings of the 2007 IEEE International Geoscience and Remote Sensing Symposium; IEEE: New York, NY, USA, 2007; pp. 22–25. [Google Scholar] [CrossRef] [Scilit]
- Butler, D.K.; Simms, J.E.; Furey, J.S.; Bennett, H.H. Review of Magnetic Modeling for UXO and Applications to Small Items and Close Distances. J. Environ. Eng. Geophys. 2012, 17, 53–73. [Google Scholar] [CrossRef] [Scilit]
- Billings, S.; Li, Y.; Goodrich, W. Advanced UXO Discrimination Using Magnetometry: Understanding Remanent Magnetization; Technical Report UX-1380; Office of the Deputy Assistant Secretary of Defense (Energy Resilience and Optimization): Washington, DC, USA, 2009; 83p. [Google Scholar]
- Das, Y. Effects of soil electromagnetic properties on metal detectors. IEEE Trans. Geosci. Remote Sens. 2006, 44, 1444–1453. [Google Scholar] [CrossRef] [Scilit]
- Pasion, L.R.; Oldenburg, D.W. A Discrimination Algorithm for UXO Using Time Domain Electromagnetics. J. Environ. Eng. Geophys. 2001, 6, 91–102. [Google Scholar] [CrossRef] [Scilit]
- Lekhak, S.; Ientilucci, E.J.; Brinkley, A.W. Viability of Substituting Handheld Metal Detectors with an Airborne Metal Detection System for Landmine and Unexploded Ordnance Detection. Remote Sens. 2024, 16, 4732. [Google Scholar] [CrossRef] [Scilit]
- Gasperikova, E.; Smith, J.T.; Morrison, H.F.; Becker, A. Berkeley UXO Discriminator (BUD). In Symposium on the Application of Geophysics to Engineering and Environmental Problems Proceedings; GeoScienceWorld: McLean, VA, USA, 2007. [Google Scholar] [CrossRef] [Scilit]
- Barrow, B.; Grejner-Brzezinska, D.; Toth, C.; Ostrowski, S.; Soloviev, A.; Beran, L.; Pasion, L.; Zelt, B.; Lhomme, N.; Kingdon, K.; et al. UXO and UXO Sensor Technology. In Proceedings of the Symposium on the Application of Geophysics to Engineering and Environmental Problems; Society of Exploration Geophysicists: Houston, TX, USA, 2015; Volume 28, pp. 601–614. [Google Scholar]
- Nikulin, P.D.; deSmet, P.D.; Puliaiev, A.; Zhurakhov, V.; Fasullo, S.; Chen, G.; Spiegel, I.; Cappuccio, K. Automated UAS aeromagnetic surveys to detect MBRL unexploded ordnance. J. Conv. Weapons Destr. 2020, 24, 13. [Google Scholar]
- Doll, W.E.; Gamey, T.J.; Bell, D.T.; Beard, L.P.; Sheehan, J.R.; Norton, J.; Holladay, J.S.; Lee, J.L.C. Historical development and performance of airborne magnetic and electromagnetic systems for mapping and detection of unexploded ordnance. J. Environ. Eng. Geophys. 2012, 17, 1–17. [Google Scholar] [CrossRef] [Scilit]
- Deng, E.A.; Doro, K.O.; Bank, C.G. Suitability of magnetometry to detect clandestine buried firearms from a controlled field site and numerical modeling. Forensic Sci. Int. 2020, 314, 110396. [Google Scholar] [CrossRef] [Scilit]
- Billings, S.D.; Pasion, L.R.; Oldenburg, D.W. Discrimination and Identification of UXO by Geophysical Inversion of Total-Field Magnetic Data; US Army Corps of Engineers, Engineer Research and Development Center: Vicksburg, MS, USA, 2002. [Google Scholar]
- Le Maire, P.; Bertrand, L.; Munschy, M.; Diraison, M.; Géraud, Y. Aerial magnetic mapping with an unmanned aerial vehicle and a fluxgate magnetometer: A new method for rapid mapping and upscaling from the field to regional scale. Geophys. Prospect. 2020, 68, 2307–2319. [Google Scholar] [CrossRef] [Scilit]
- Mu, Y.; Zhang, X.; Xie, W.; Zheng, Y. Automatic detection of near-surface targets for unmanned aerial vehicle (UAV) magnetic survey. Remote Sens. 2020, 12, 452. [Google Scholar] [CrossRef] [Scilit]
- Oladunjoye, O.; Maffattone, C.; Al-Nawal, J.; Fasullo, S.; Greenspan, E.; Koller, J.; Nikulin, A.; de Smet, T.; Clayton, G.M. Omnidirectional All-Terrain Screw-Driven Robot Design, Modeling, and Application in Humanitarian Demining. IFAC-PapersOnLine 2022, 55, 7–12. [Google Scholar]
- de Smet, T.S.; Nikulin, A.; Romanzo, N.; Graber, N.; Dietrich, C.; Puliaiev, A. Successful application of drone-based aeromagnetic surveys to locate legacy oil and gas wells in Cattaraugus county, New York. J. Appl. Geophys. 2021, 186, 104250. [Google Scholar] [CrossRef] [Scilit]
- Nikulin, A.; de Smet, T.S. UAV-based aeromagnetic surveys for orphaned well location: Emerging best practices. Lead. Edge 2023, 42, 817–823. [Google Scholar] [CrossRef] [Scilit]
- Zheng, Y.; Li, S.; Xing, K.; Zhang, X. Unmanned aerial vehicles for magnetic surveys: A review on platform selection and interference suppression. Drones 2021, 5, 93. [Google Scholar] [CrossRef] [Scilit]
- Myers, H.P.; Lekic, V.; Lathrop, D.P. Development of a Tetrahedral Magnetic Gradiometer for UXO and Landmine Detection. In Proceedings of the AGU Fall Meeting Abstracts; NASA: Washington, DC, USA, 2022; Volume 2022, p. NS42B-0304. [Google Scholar]
- Myers, H.; Lathrop, D.; Lekic, V. Enabling small anomaly detection using finite-difference magnetic gradiometry. Geophysics 2025, 90, G93–G108. [Google Scholar] [CrossRef] [Scilit]
- Daniels, D.J. A review of GPR for landmine detection. Sens. Imaging 2006, 7, 90. [Google Scholar] [CrossRef] [Scilit]
- Daniels, D.J. Ground penetrating radar for buried landmine and IED detection. In Unexploded Ordnance Detection and Mitigation; Springer: Dordrecht, The Netherlands, 2009; pp. 89–111. [Google Scholar]
- Potin, D.; Duflos, E.; Vanheeghe, P. Landmines ground-penetrating radar signal enhancement by digital filtering. IEEE Trans. Geosci. Remote Sens. 2006, 44, 2393–2406. [Google Scholar] [CrossRef] [Scilit]
- Scheers, B. Ultra-Wideband Ground Penetrating Radar with Application to the Detection of Anti Personnel Landmines; Royal Military Academy: Brussels, Belgium, 2001. [Google Scholar]
- Ho, K.; Carin, L.; Gader, P.D.; Wilson, J.N. An investigation of using the spectral characteristics from ground penetrating radar for landmine/clutter discrimination. IEEE Trans. Geosci. Remote Sens. 2008, 46, 1177–1191. [Google Scholar] [CrossRef] [Scilit]
- Hutsul, T.; Khobzei, M.; Tkach, V.; Krulikovskyi, O.; Moisiuk, O.; Ivashko, V.; Samila, A. Review of approaches to the use of unmanned aerial vehicles, remote sensing and geographic information systems in humanitarian demining: Ukrainian case. Heliyon 2024, 10, e29142. [Google Scholar] [CrossRef] [Scilit] [PubMed]
- Brants, M.; Dobrovolskiy, A.; Schikorra, M. UXO Target Detection Test Using Drone-Based Ground Penetrating Radar System; Technical report; SPH Engineering SIA: Riga, Latvia, 2023. [Google Scholar]
- Wallace, L.; Lucieer, A.; Watson, C.; Turner, D. Development of a UAV-LiDAR system with application to forest inventory. Remote Sens. 2012, 4, 1519–1543. [Google Scholar]
- Lin, Y.C.; Cheng, Y.T.; Zhou, T.; Ravi, R.; Hasheminasab, S.M.; Flatt, J.E.; Troy, C.; Habib, A. Evaluation of UAV LiDAR for mapping coastal environments. Remote Sens. 2019, 11, 2893. [Google Scholar] [CrossRef] [Scilit]
- Mehendale, N.; Neoge, S. Review on lidar technology. SSRN 2020. [Google Scholar] [CrossRef] [Scilit]
- Guan, S.; Zhu, Z.; Wang, G. A review on UAV-based remote sensing technologies for construction and civil applications. Drones 2022, 6, 117. [Google Scholar] [CrossRef] [Scilit]
- De Smet, T.S.; Smith, M.F. Emerging remote sensing methods in underwater archaeology. In New Directions in the Search for the First Floridians; University Press of Florida: Gainesville, FL, USA, 2019; pp. 221–240. [Google Scholar]
- Davis, D.S.; Cook Hale, J.W.; Hale, N.L.; Johnston, T.Z.; Sanger, M.C. Bathymetric LiDAR and Semi-Automated Feature Extraction Assist Underwater Archaeological Surveys. Archaeol. Prospect. 2024, 31, 171–186. [Google Scholar]
- Friedman, R.A.; Sofaer, A.; Weiner, R.S. Remote Sensing of Chaco Roads Revisited: Lidar Documentation of the Great North Road, Pueblo Alto Landscape, and Aztec Airport Mesa Road. Adv. Archaeol. Pract. 2017, 5, 365–381. [Google Scholar]
- Gil, A.L.; Núñez-Casillas, L.; Isenburg, M.; Benito, A.A.; Bello, J.J.R.; Arbelo, M. A comparison between LiDAR and photogrammetry digital terrain models in a forest area on Tenerife Island. Can. J. Remote Sens. 2013, 39, 396–409. [Google Scholar]
- Rogers, S.R.; Manning, I.; Livingstone, W. Comparing the spatial accuracy of digital surface models from four unoccupied aerial systems: Photogrammetry versus LiDAR. Remote Sens. 2020, 12, 2806. [Google Scholar] [CrossRef] [Scilit]
- James, K.; Riemersma, G.; Pacheco, P. How UAV LIDAR Imaging Can Locate and Map Minefield Features: Cuito Cuanavale, Angola. J. Conv. Weapons Destr. 2023, 27, 7. [Google Scholar]
- U.S. Geological Survey. Lidar Base Specification Version 2.1; Public Domain specification document; U.S. Geological Survey: Reston, VA, USA, 2019. [Google Scholar]
- Diab, A.; Kashef, R.; Shaker, A. Deep learning for LiDAR point cloud classification in remote sensing. Sensors 2022, 22, 7868. [Google Scholar] [CrossRef] [Scilit] [PubMed]
- Oliver, C.; Quegan, S. Understanding Synthetic Aperture Radar Images; SciTech Publishing: Raleigh, NC, USA, 2004. [Google Scholar]
- Zhou, X.; Chang, N.B.; Li, S. Applications of SAR interferometry in earth and environmental science research. Sensors 2009, 9, 1876–1912. [Google Scholar] [CrossRef] [Scilit] [PubMed]
- Karachristos, K.; Koukiou, G.; Anastassopoulos, V. A review on PolSAR decompositions for feature extraction. J. Imaging 2024, 10, 75. [Google Scholar] [CrossRef] [Scilit] [PubMed]
- Meng, L.; Yan, C.; Lv, S.; Sun, H.; Xue, S.; Li, Q.; Zhou, L.; Edwing, D.; Edwing, K.; Geng, X.; et al. Synthetic aperture radar for geosciences. Rev. Geophys. 2024, 62, e2023RG000821. [Google Scholar] [CrossRef] [Scilit]
- Fernández, M.G.; López, Y.Á.; Arboleya, A.A.; Valdés, B.G.; Vaqueiro, Y.R.; Andrés, F.L.H.; García, A.P. Synthetic aperture radar imaging system for landmine detection using a ground penetrating radar on board a unmanned aerial vehicle. IEEE Access 2018, 6, 45100–45112. [Google Scholar] [CrossRef] [Scilit]
- Garcia-Fernandez, M.; Alvarez-Lopez, Y.; Las Heras, F. Autonomous airborne 3D SAR imaging system for subsurface sensing: UWB-GPR on board a UAV for landmine and IED detection. Remote Sens. 2019, 11, 2357. [Google Scholar] [CrossRef] [Scilit]
- Bähnemann, R.; Lawrance, N.; Streichenberg, L.; Chung, J.J.; Pantic, M.; Grathwohl, A.; Waldschmidt, C.; Siegwart, R. Under the sand: Navigation and localization of a micro aerial vehicle for landmine detection with ground-penetrating synthetic aperture radar. Field Robot. 2022, 2, 1028–1067. [Google Scholar] [CrossRef] [Scilit]
- Koyama, C.N.; Liu, H.; Takahashi, K.; Shimada, M.; Watanabe, M.; Khuut, T.; Sato, M. In-situ measurement of soil permittivity at various depths for the calibration and validation of low-frequency SAR soil moisture models by using GPR. Remote Sens. 2017, 9, 580. [Google Scholar]
- Baur, J.; Steinberg, G.; Frucci, J.; Brinkley, A. An accessible seeded field for humanitarian mine action research. J. Conv. Weapons Destr. 2023, 27, 2. [Google Scholar]
- Andriksons, M.; Dobrovolskiy, A.; Owens, D. Comparative Analysis of UXO Detection Using an Atomic Total-Field and a Fluxgate Magnetometer at the Oklahoma State University Testing Range; SPH Engineering: Riga, Latvia, 2024. [Google Scholar]
- Lekhak, S.; Ientilucci, E.J.; Baur, J.; Ghosh, S. A UAV-Based VNIR Hyperspectral Benchmark Dataset for Landmine and UXO Detection. arXiv 2025, arXiv:2510.02700. [Google Scholar] [CrossRef] [Scilit]
- Bain, J.C.; Day, F.P.; Butnor, J.R. Experimental evaluation of several key factors affecting root biomass estimation by 1500 MHz ground-penetrating radar. Remote Sens. 2017, 9, 1337. [Google Scholar] [CrossRef] [Scilit]
- Grasmueck, M.; Novo, A. 3D GPR imaging of shallow plastic pipes, tree roots, and small objects. In Proceedings of the 2016 16th International Conference on Ground Penetrating Radar (GPR); IEEE: New York, NY, USA, 2016; pp. 1–6. [Google Scholar]
- Mankins, J.C. Technology Readiness Levels; NASA: Washington, DC, USA, 1995. [Google Scholar]
- Capineri, L.; Pochanin, G.; Ruban, V.; Bossi, L.; Falorni, P.; Ogurtsova, T.; Bechtel, T.; Crawford, F. Enhancing Minefield Detection: A Robotic Approach for Multi-Sensor Detection and Discrimination of Small Low-Metal-Content Landmines. IEEE Trans. Geosci. Remote Sens. 2025, 63, 5108711. [Google Scholar]
- Pochanin, G.; Pochanina, I.; Ogurtsova, T.; Crawford, F.; Capineri, L.; Bechtel, T. Perspective approaches to landmine detection, identification and positioning. In Proceedings of the 2025 13th International Workshop on Advanced Ground Penetrating Radar (IWAGPR); IEEE: New York, NY, USA, 2025; pp. 1–5. [Google Scholar]
- Kim, B.; Kang, J.; Kim, D.; Yun, J.; Choi, S.; Paek, I. Dual-sensor landmine detection system utilizing GPR and metal detector. In Proceedings of the 2018 international symposium on antennas and propagation (ISAP); IEEE: New York, NY, USA, 2018; pp. 1–2. [Google Scholar]
- Li, Y.; Devriese, S.G.; Krahenbuhl, R.A.; Davis, K. Enhancement of magnetic data by stable downward continuation for UXO application. IEEE Trans. Geosci. Remote Sens. 2012, 51, 3605–3614. [Google Scholar] [CrossRef] [Scilit]
- Annan, A.P. Electromagnetic principles of ground penetrating radar. In Ground Penetrating Radar Theory and Applications; Elsevier: Boca Raton, FL, USA, 2009; pp. 1–40. [Google Scholar]
- Knight, R. Ground penetrating radar for environmental applications. Annu. Rev. Earth Planet. Sci. 2001, 29, 229–255. [Google Scholar] [CrossRef] [Scilit]
- Baur, J.; Steinberg, G.; Nikulin, A.; Chiu, K.; de Smet, T.S. Applying Deep Learning to Automate UAV-Based Detection of Scatterable Landmines. Remote Sens. 2020, 12, 859. [Google Scholar] [CrossRef] [Scilit]
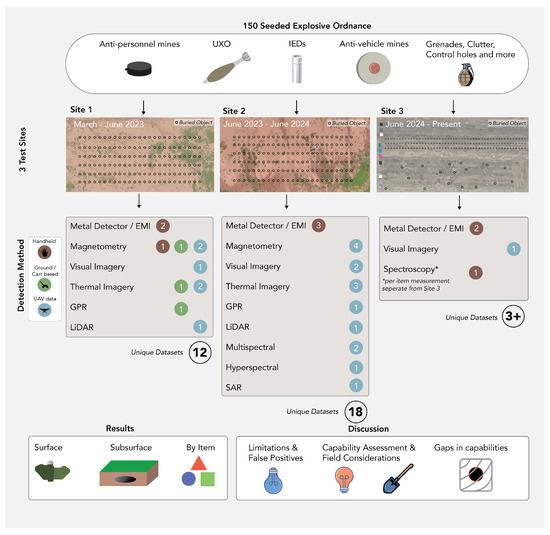
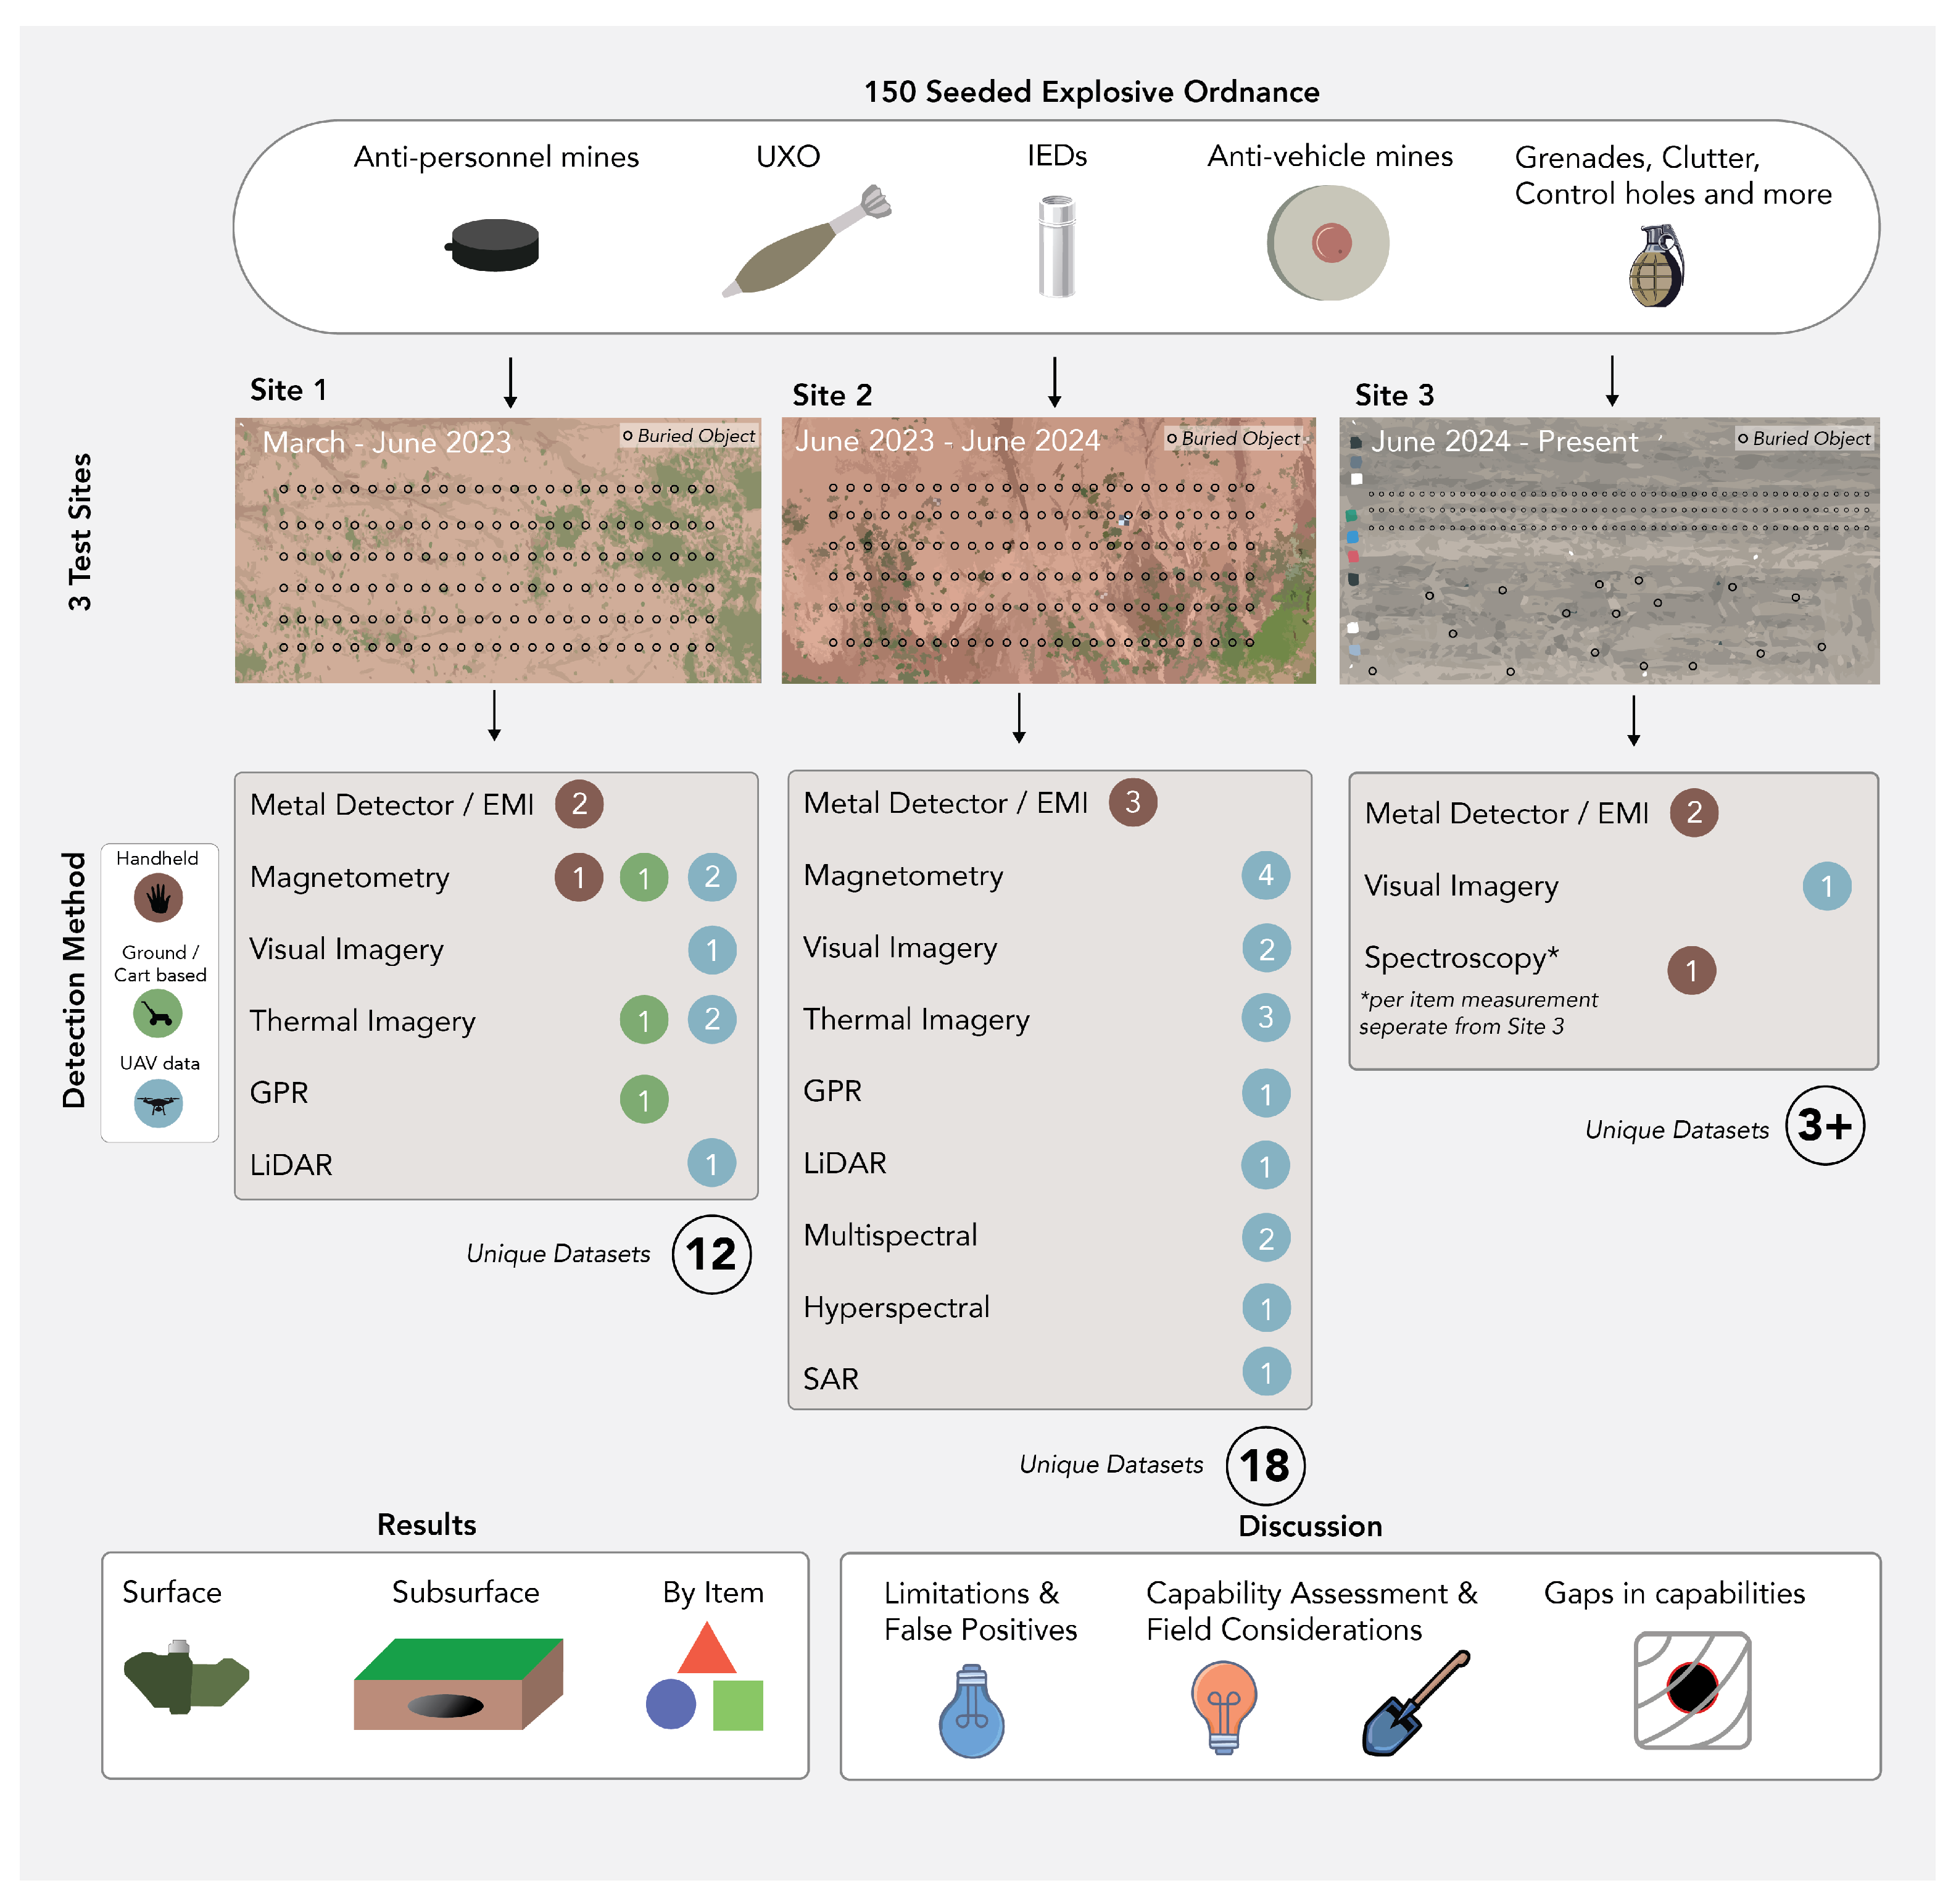
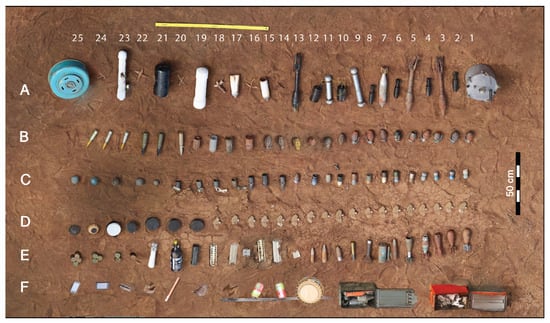
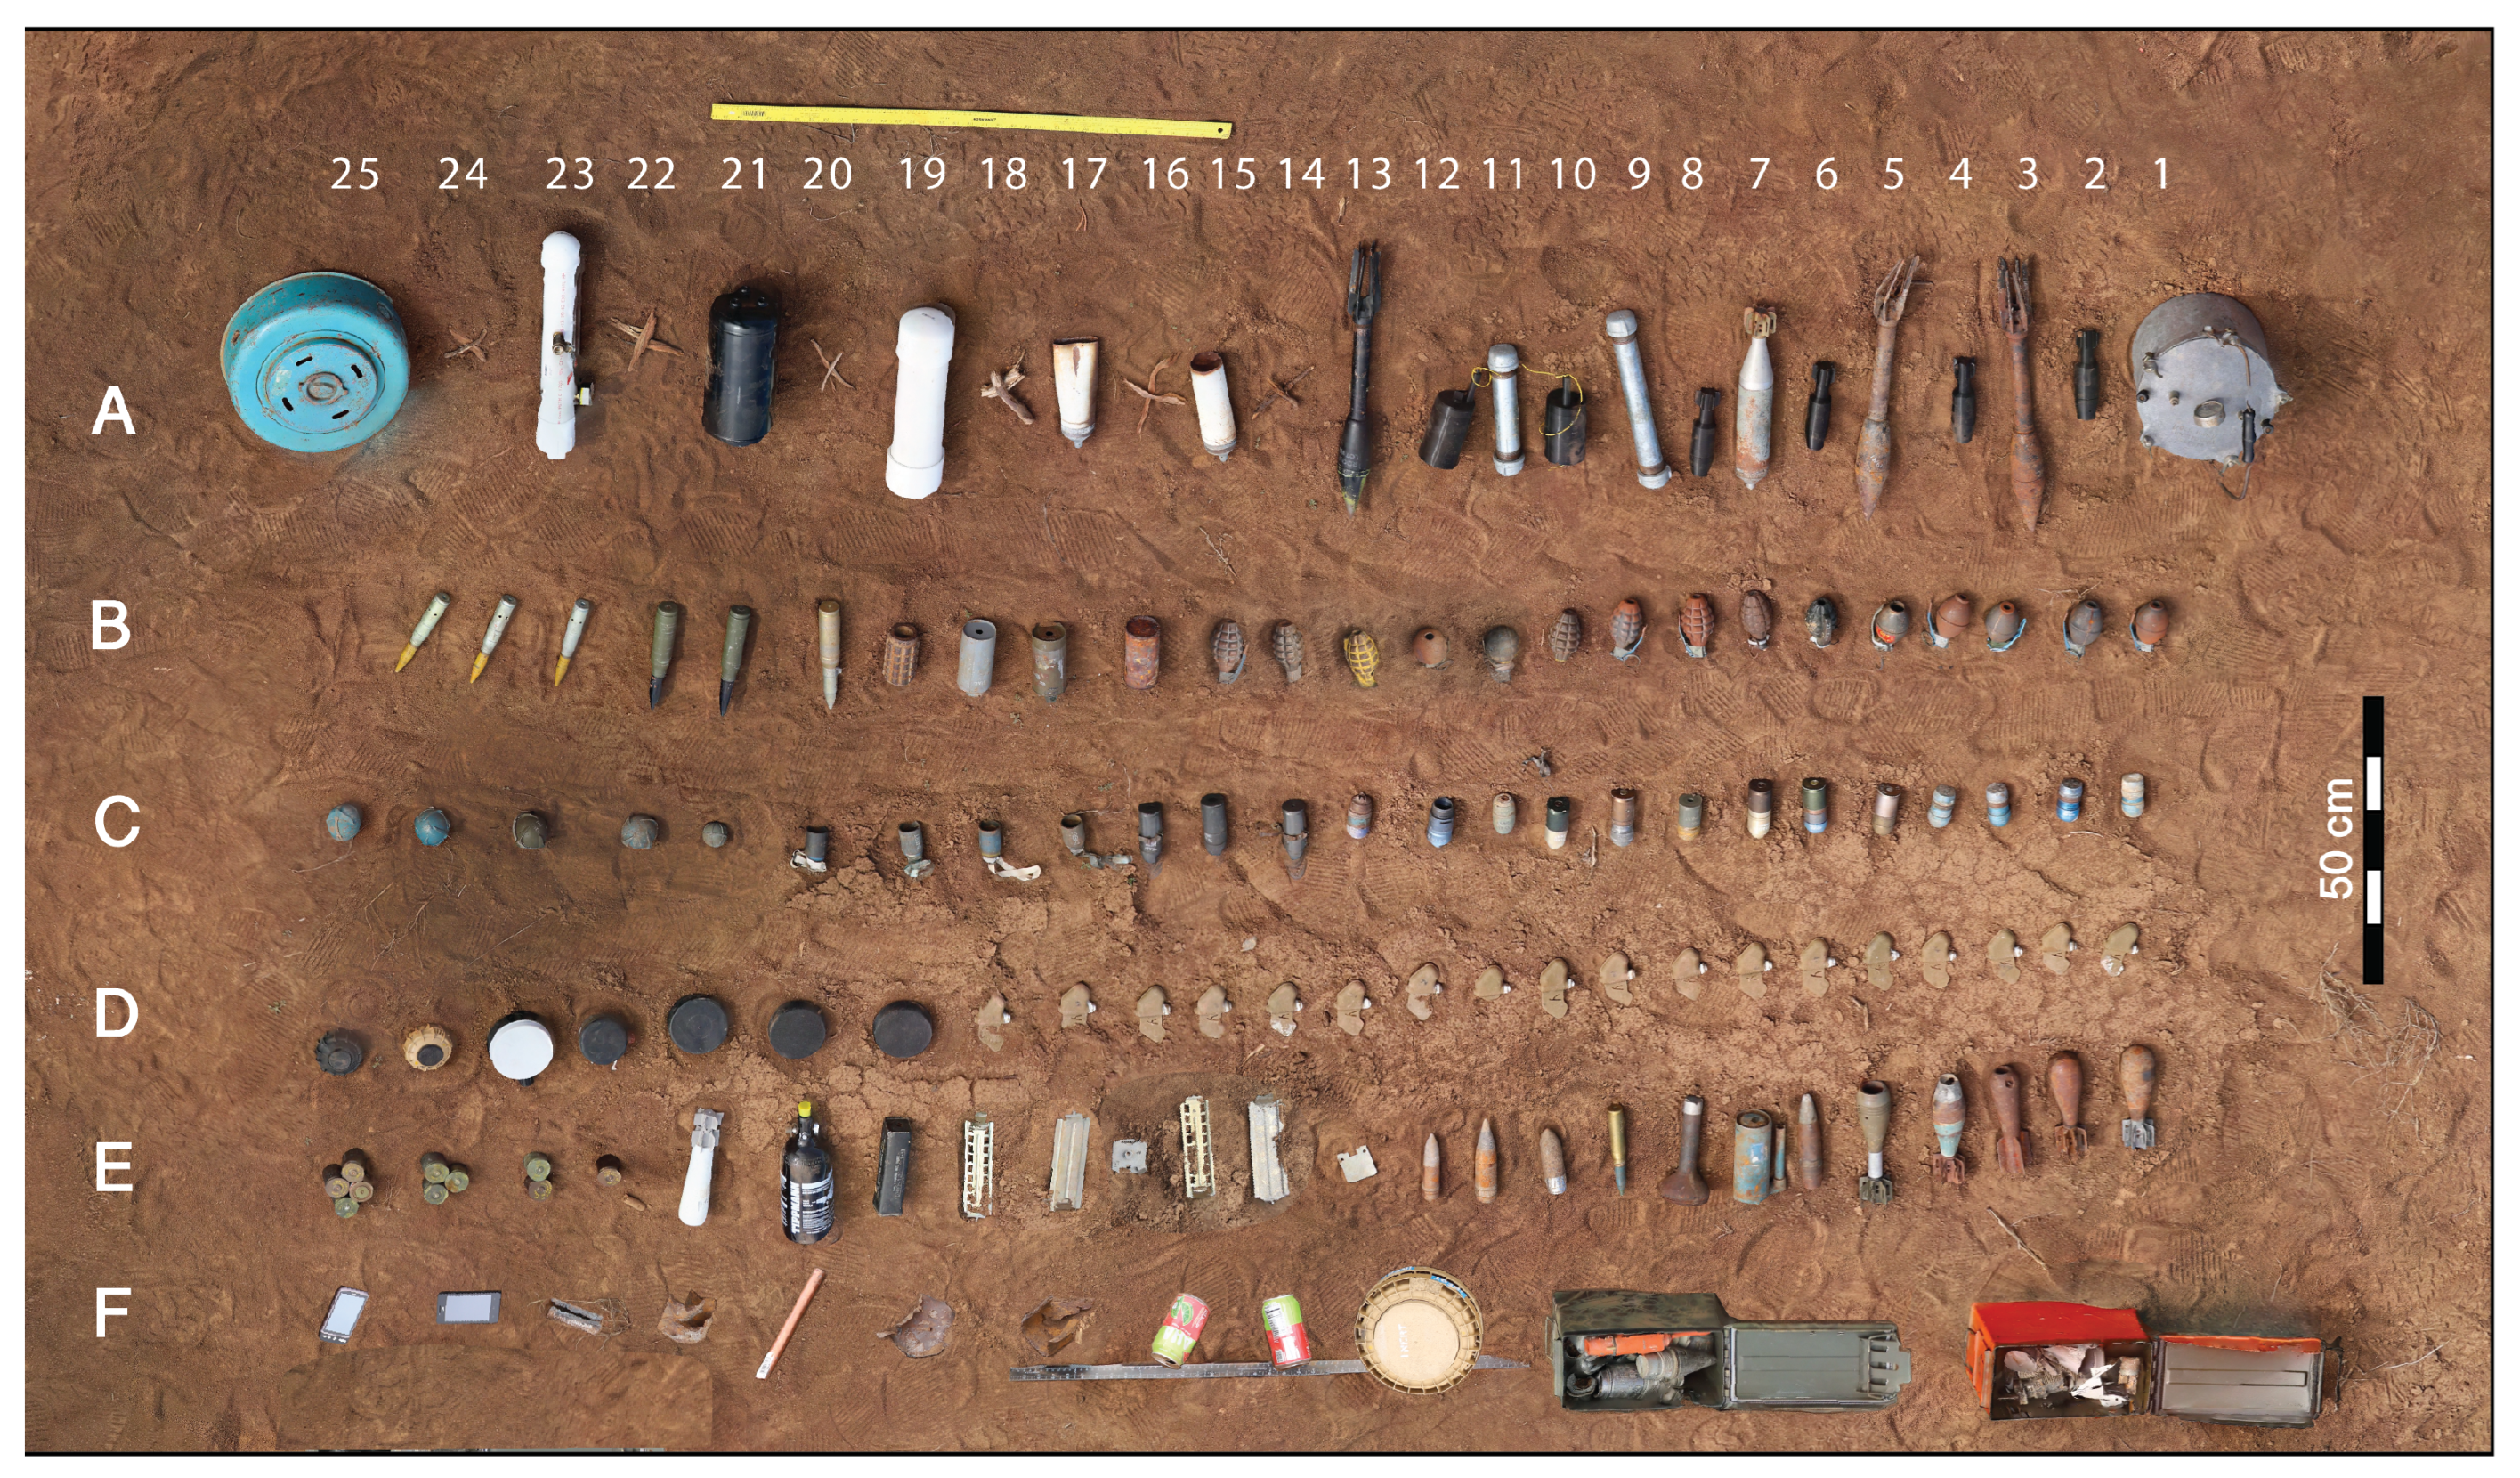
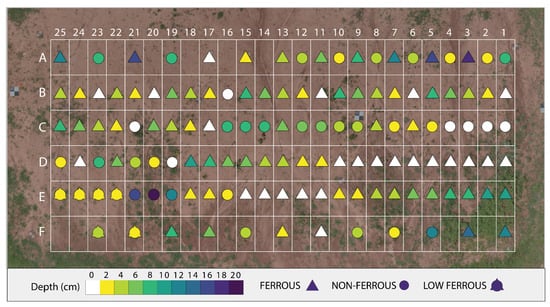
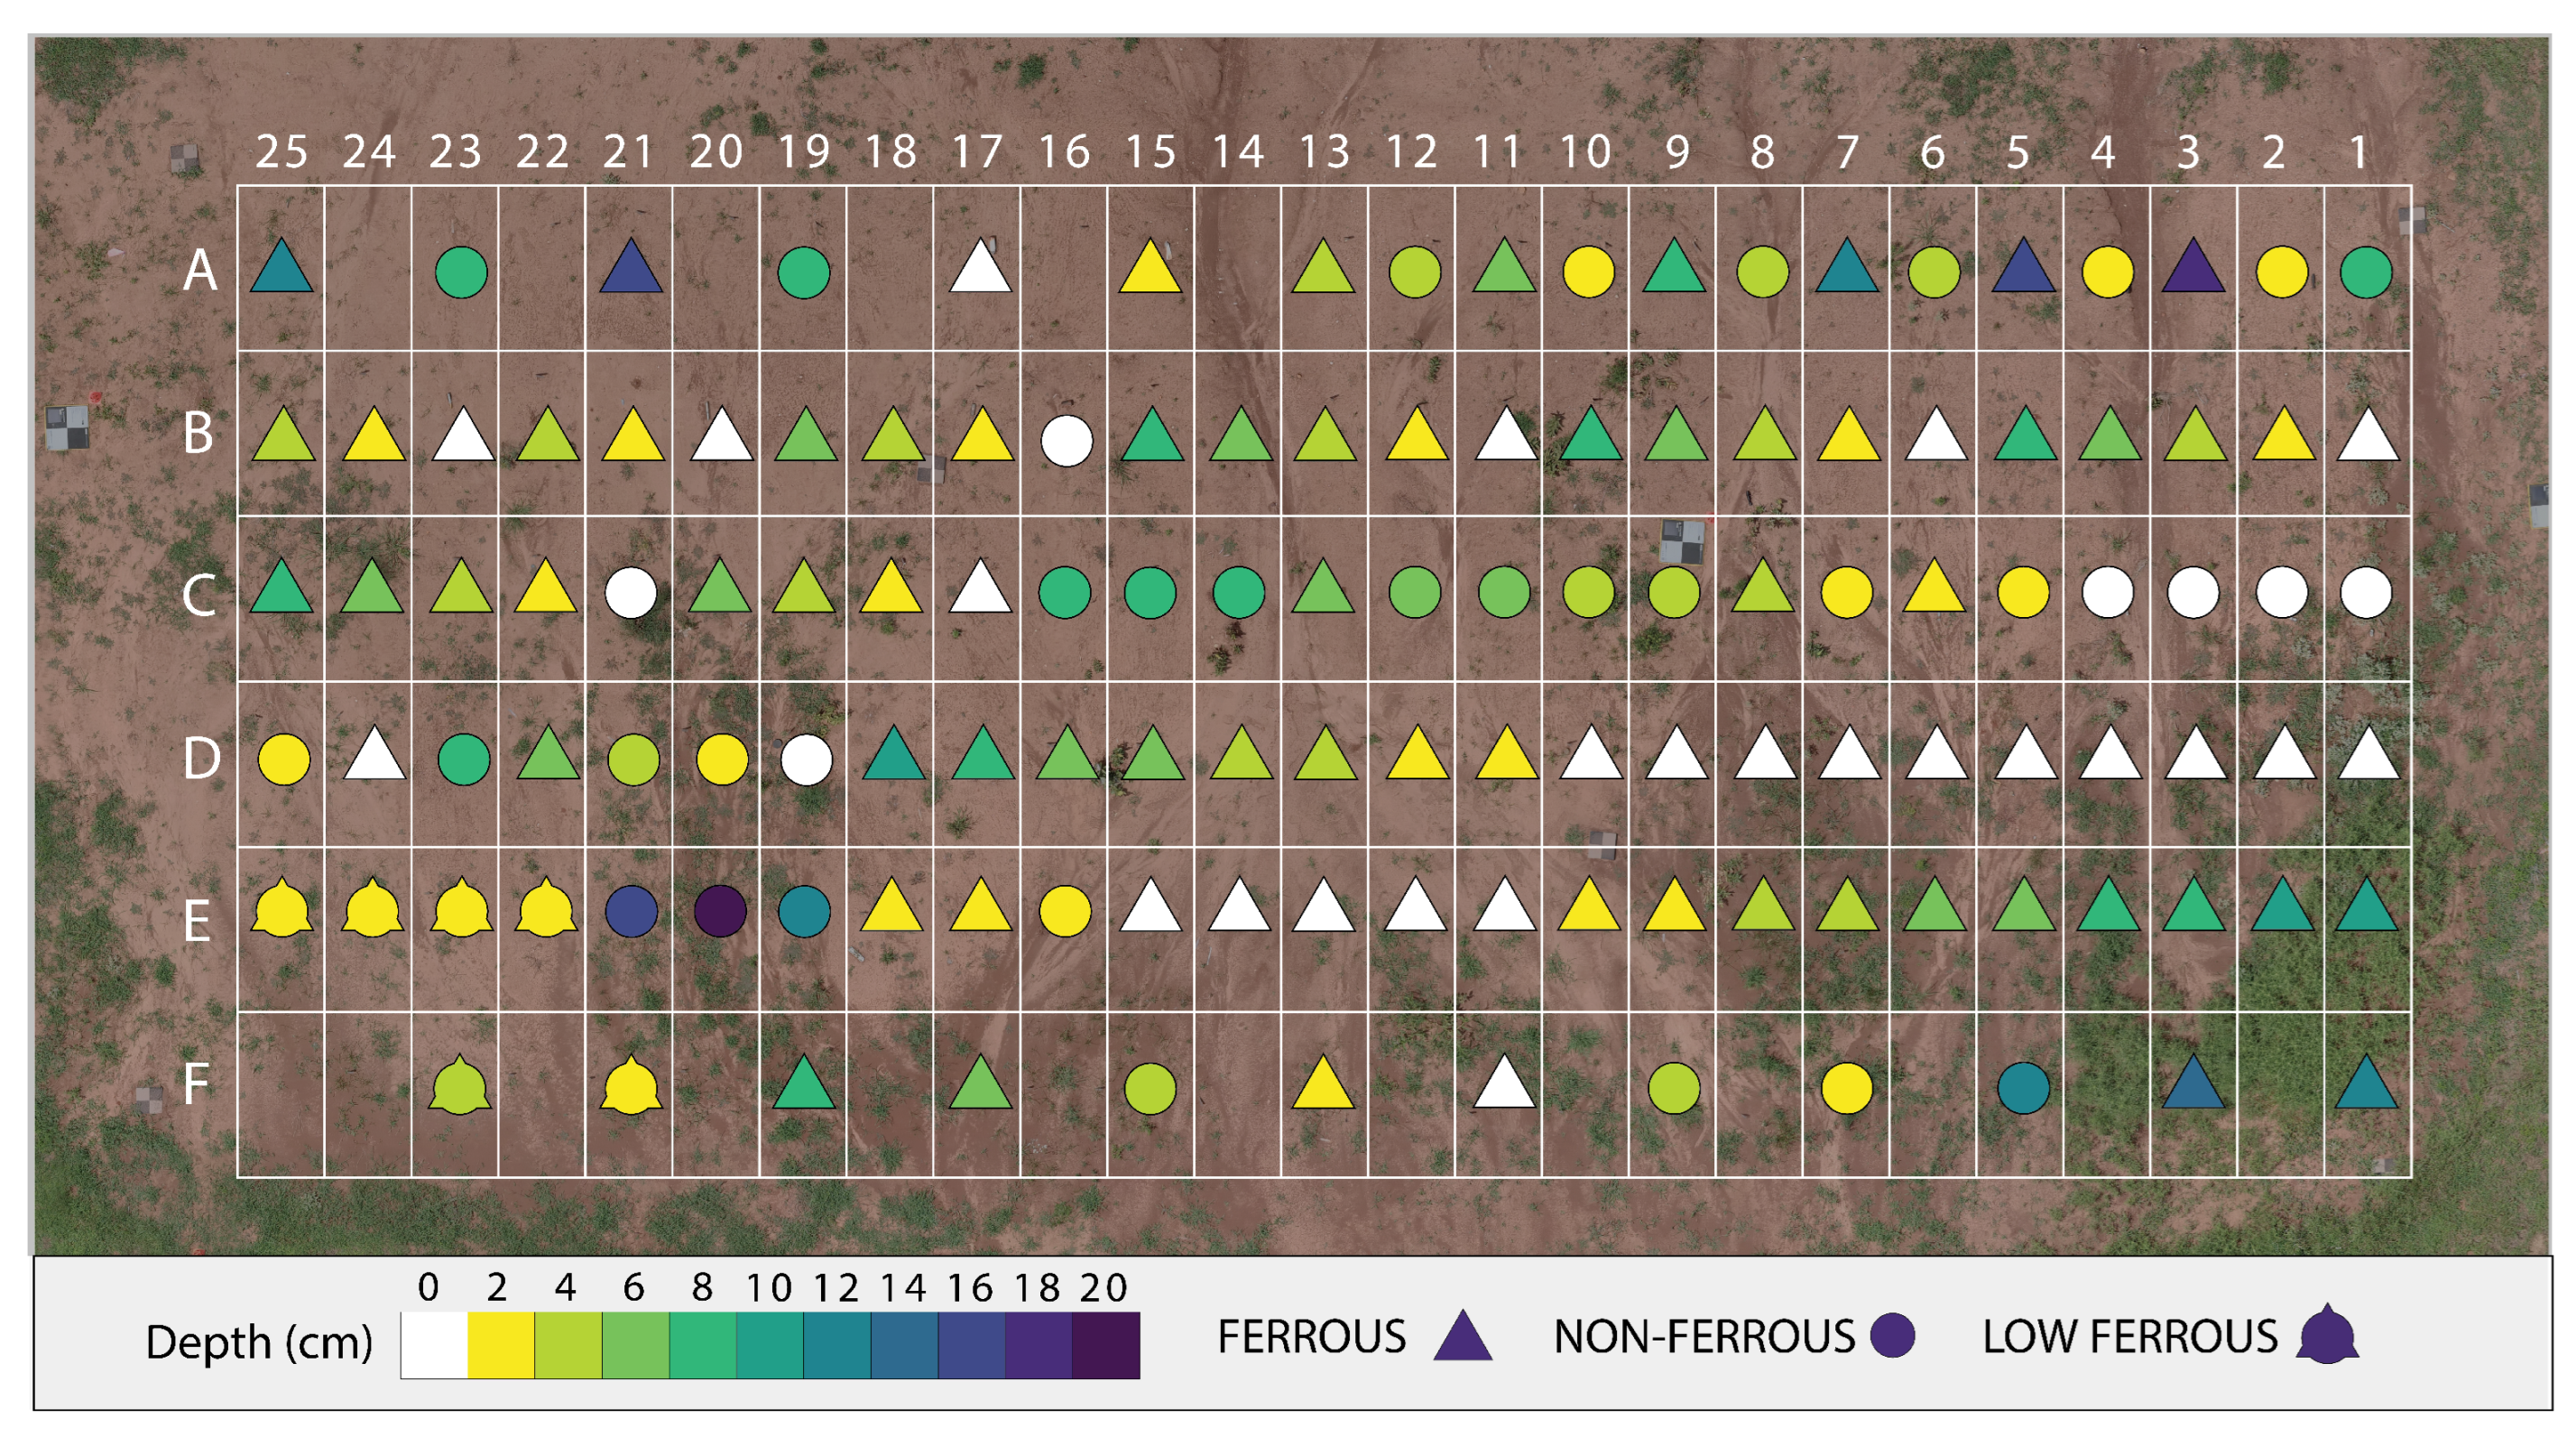


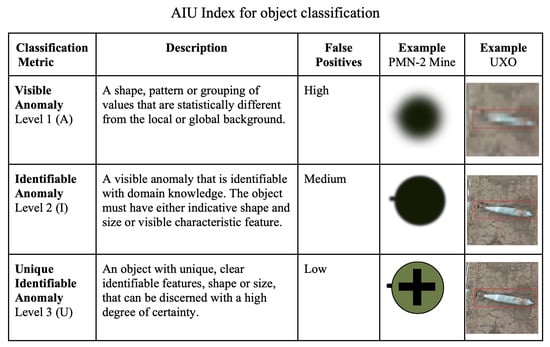
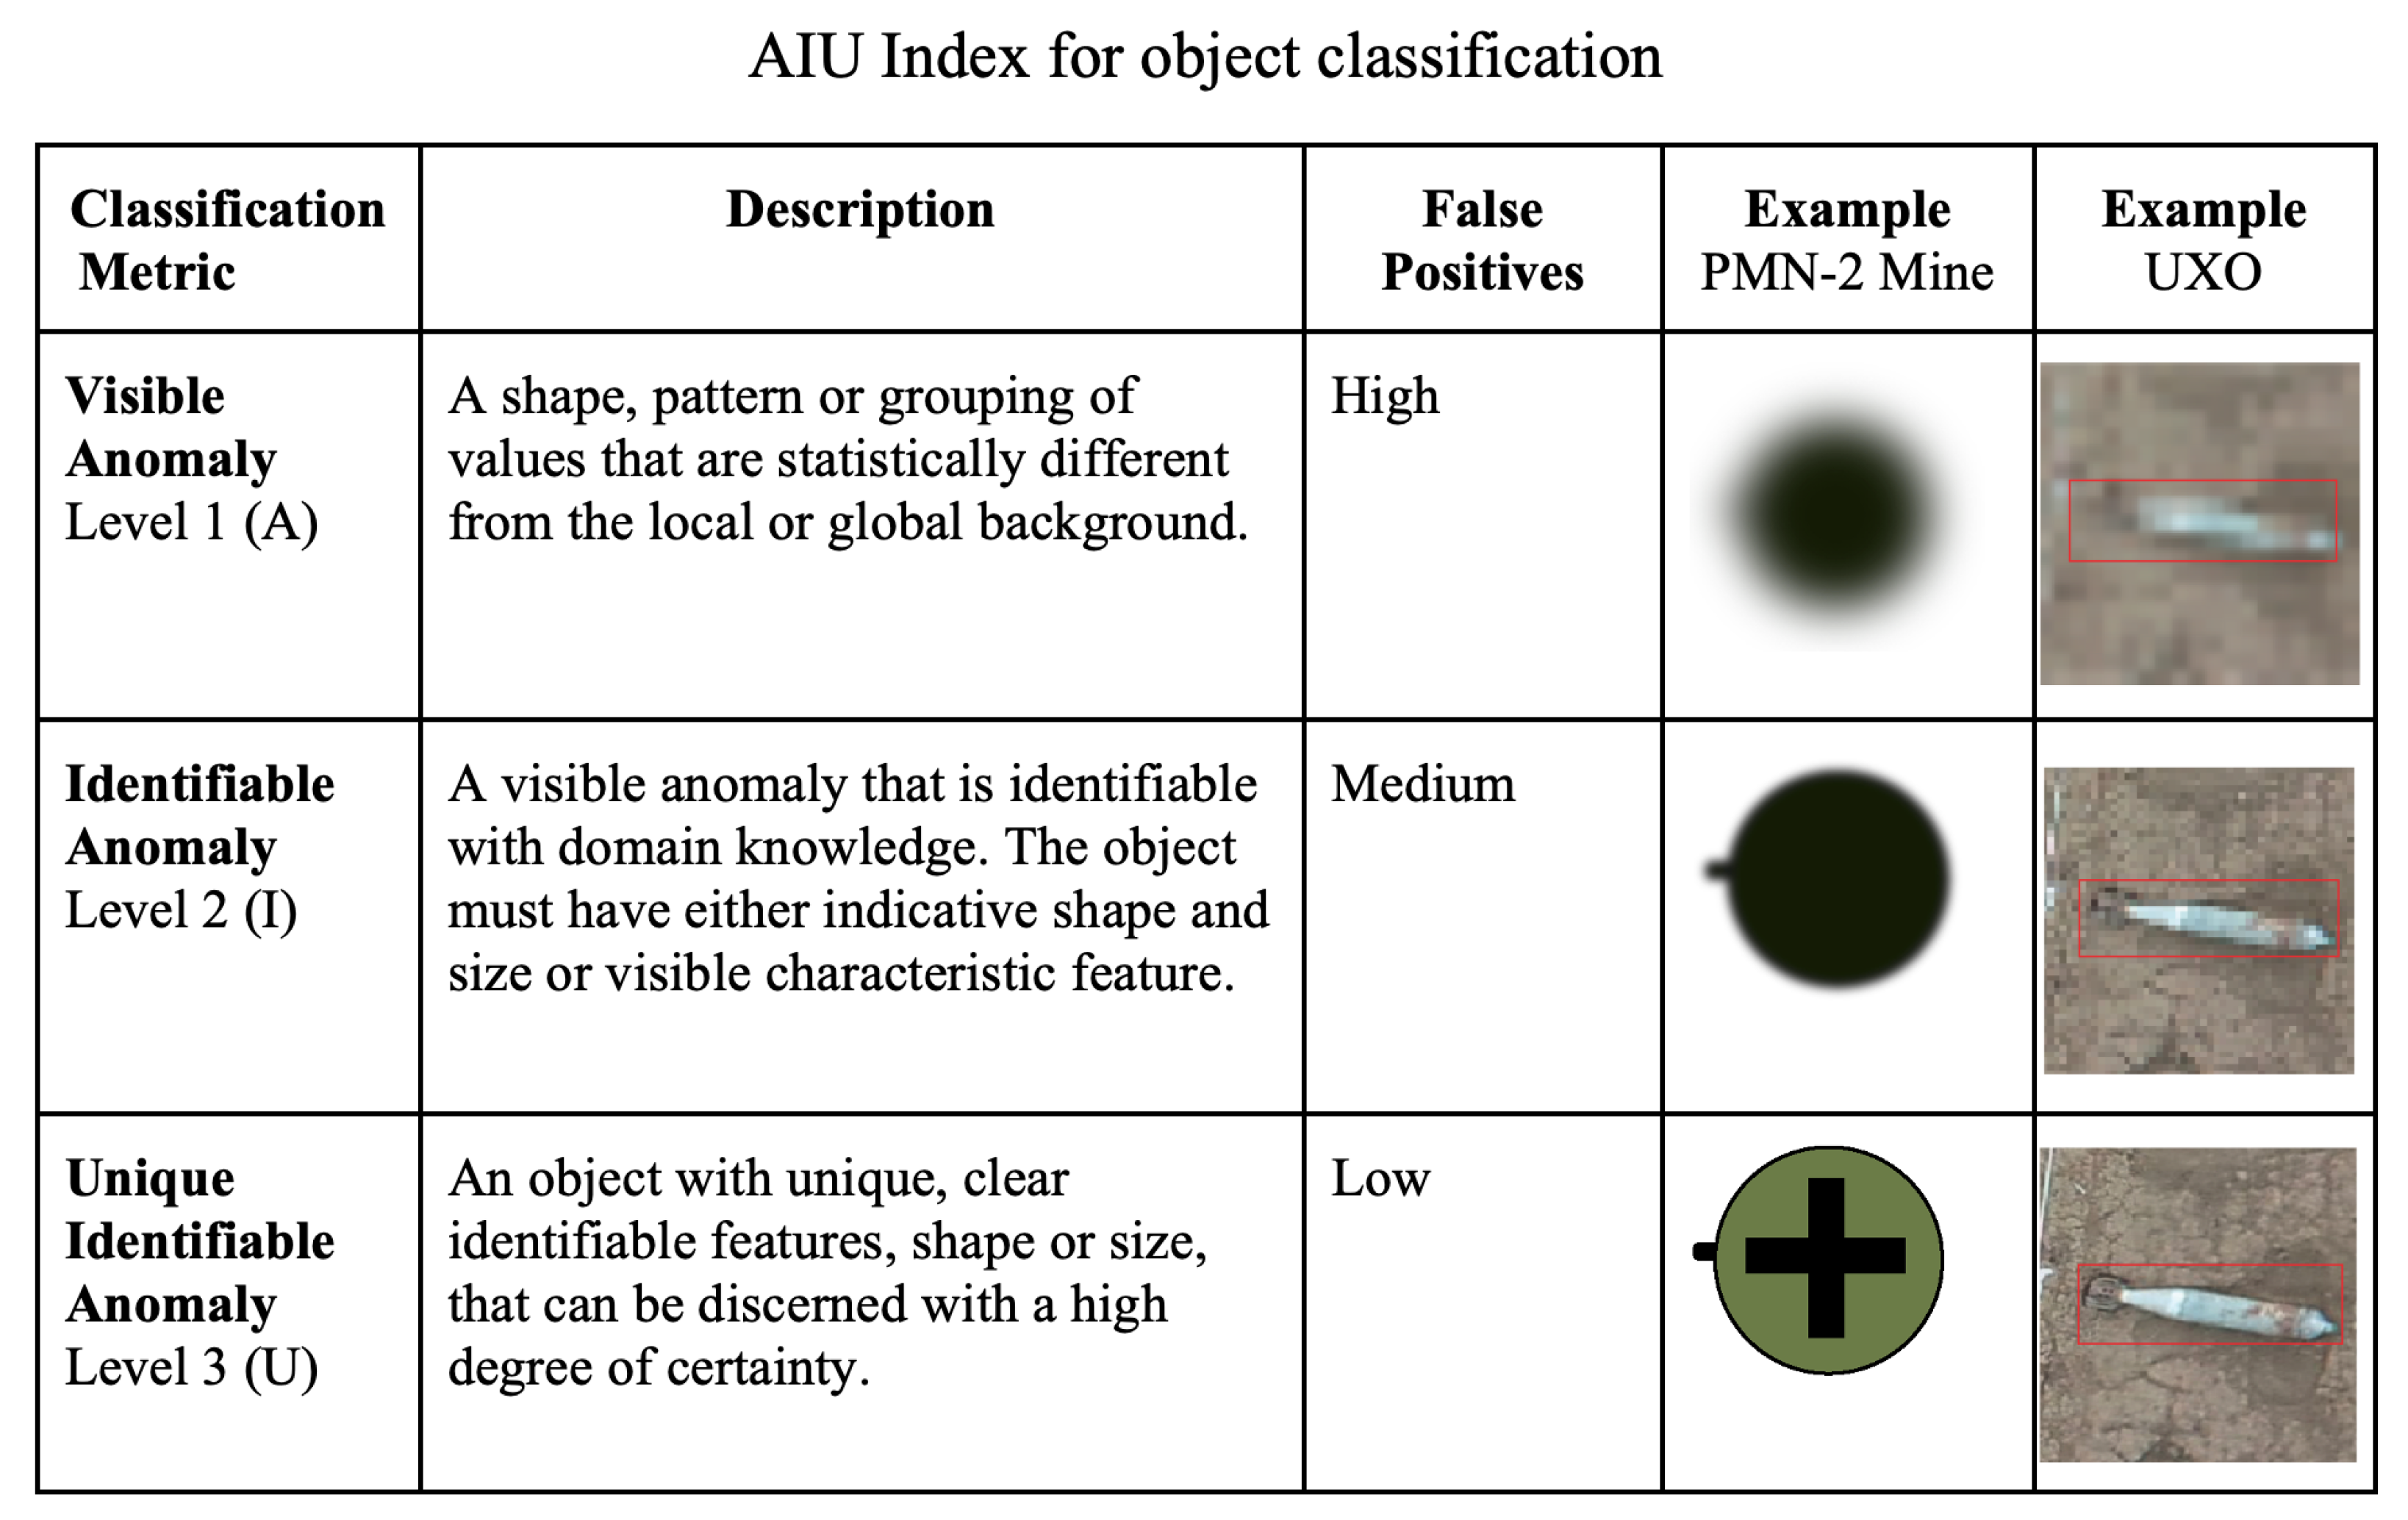
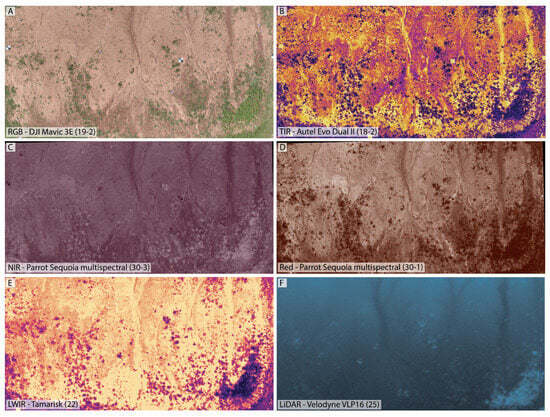
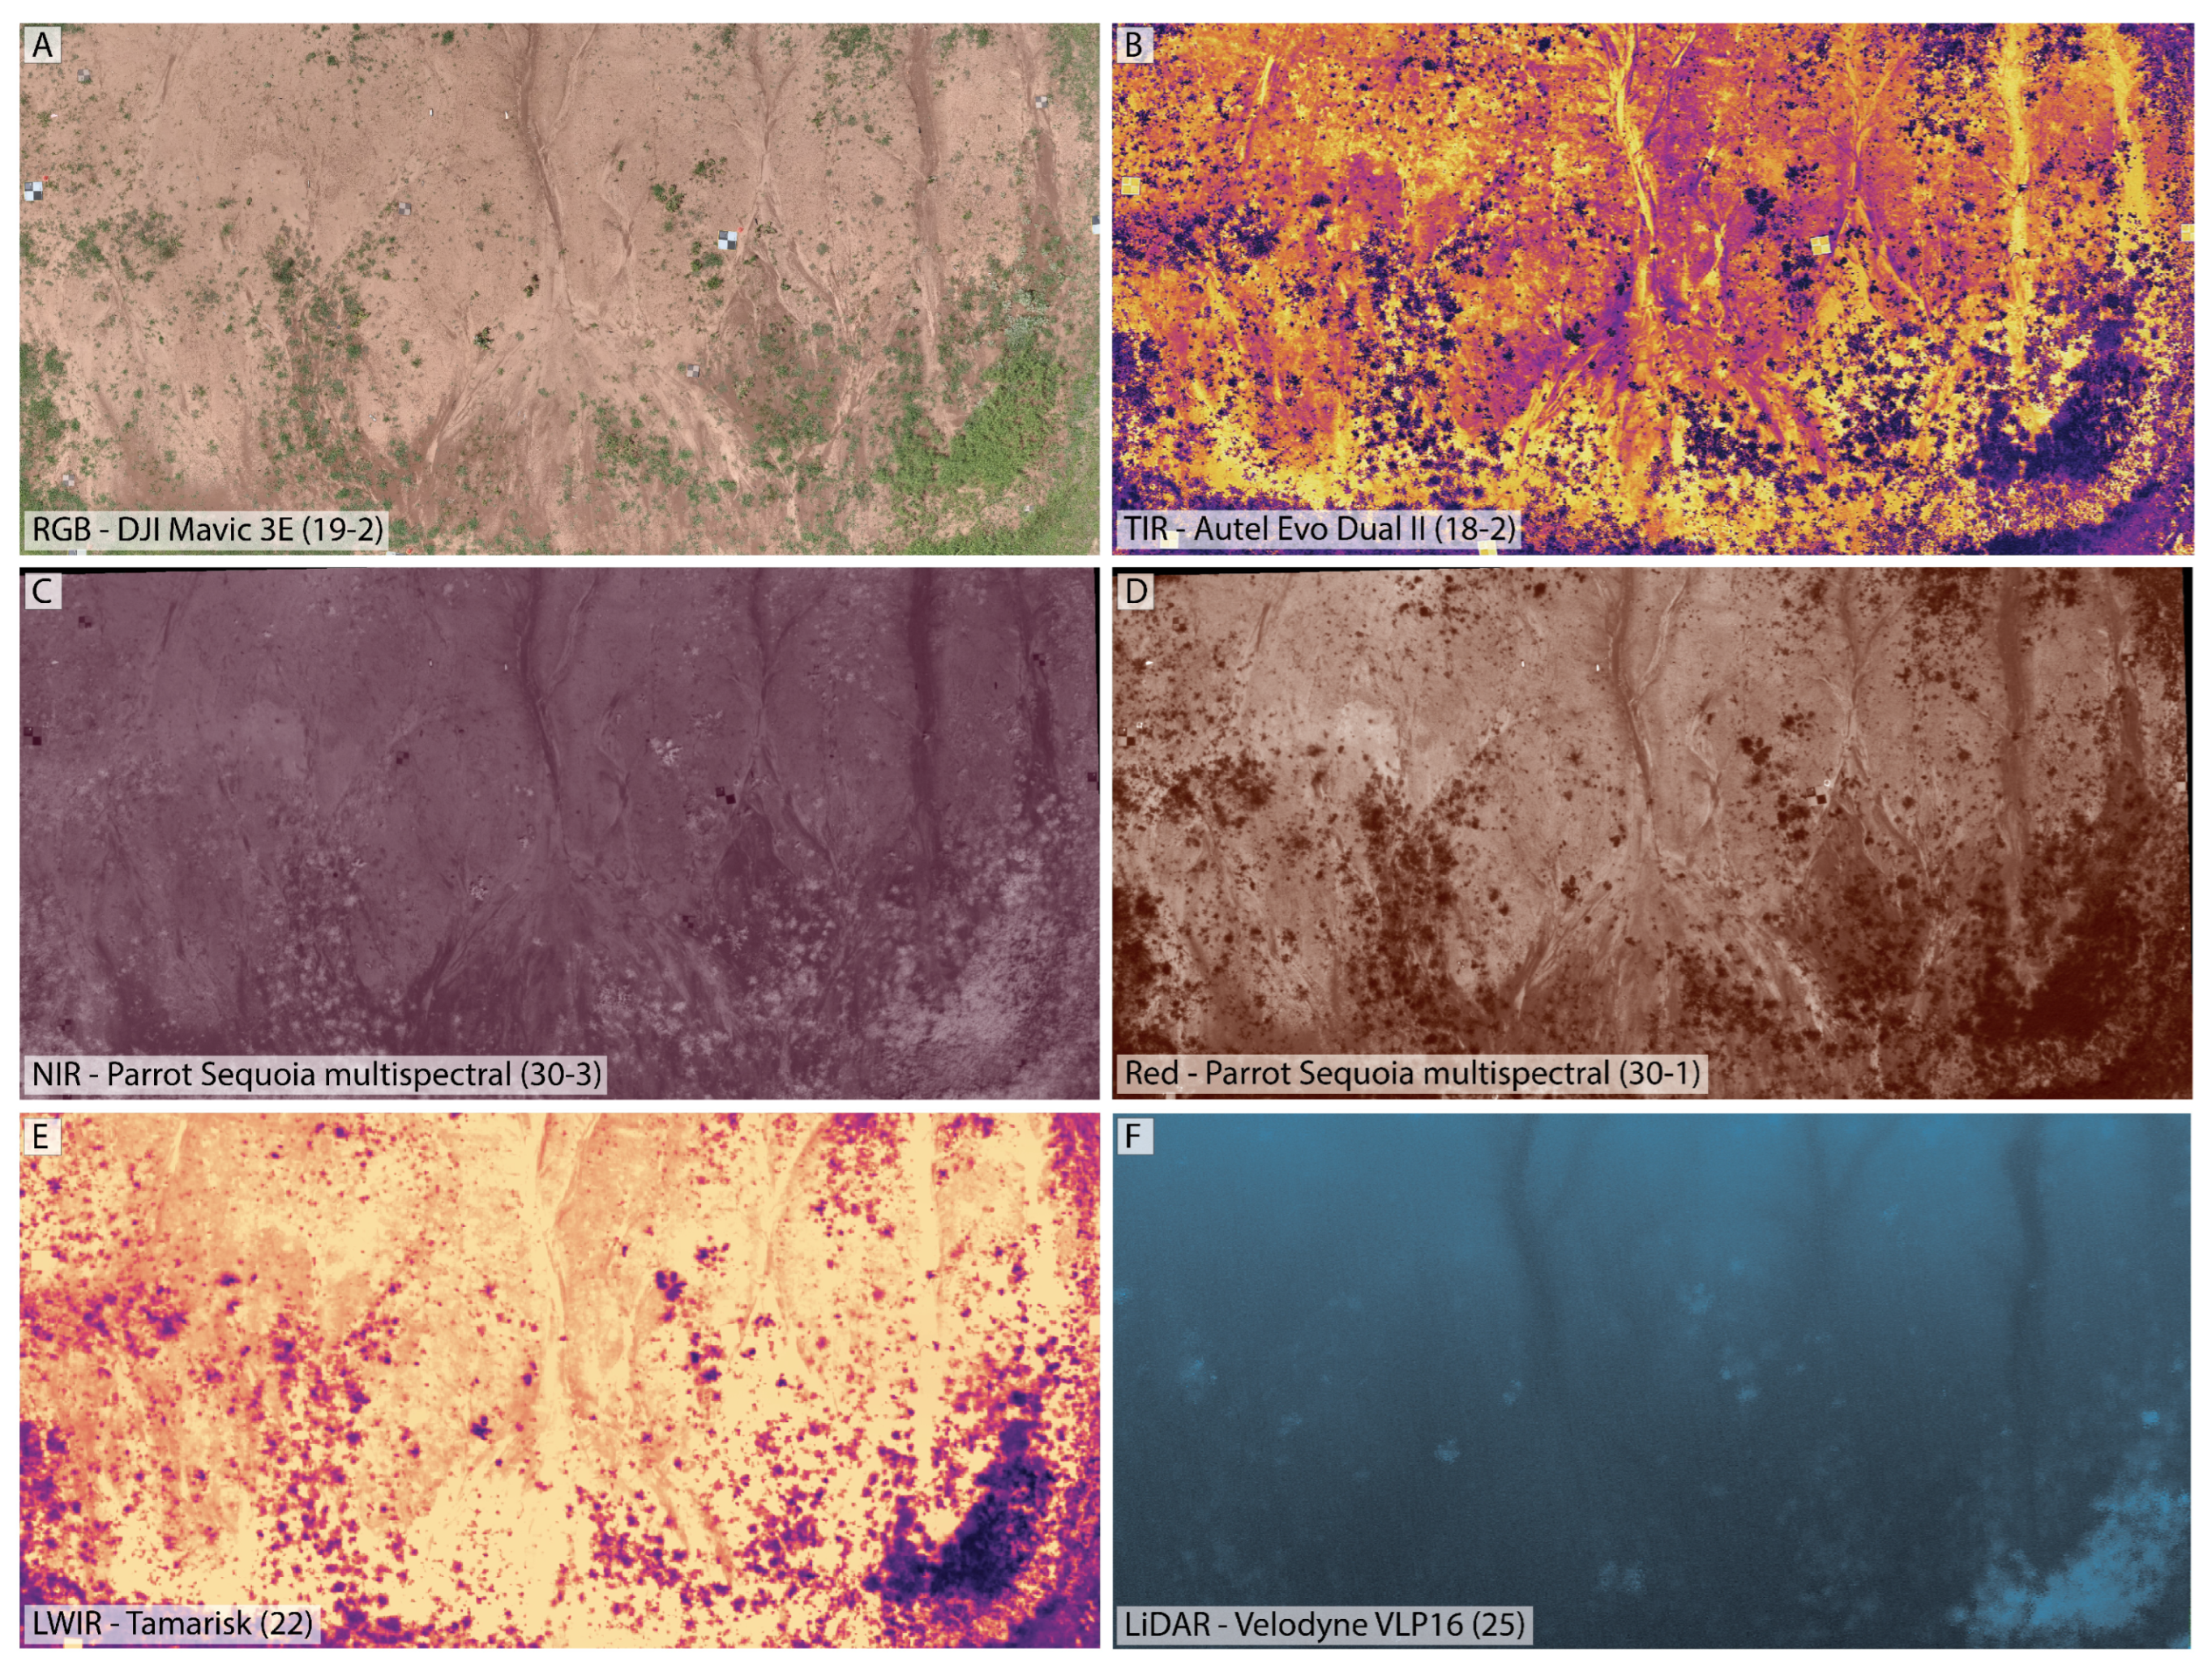
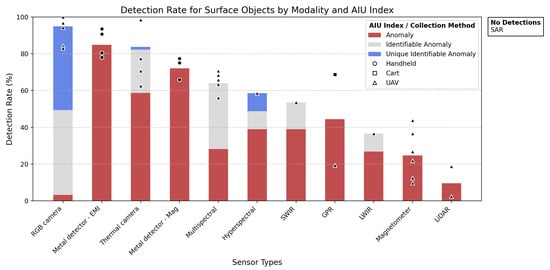
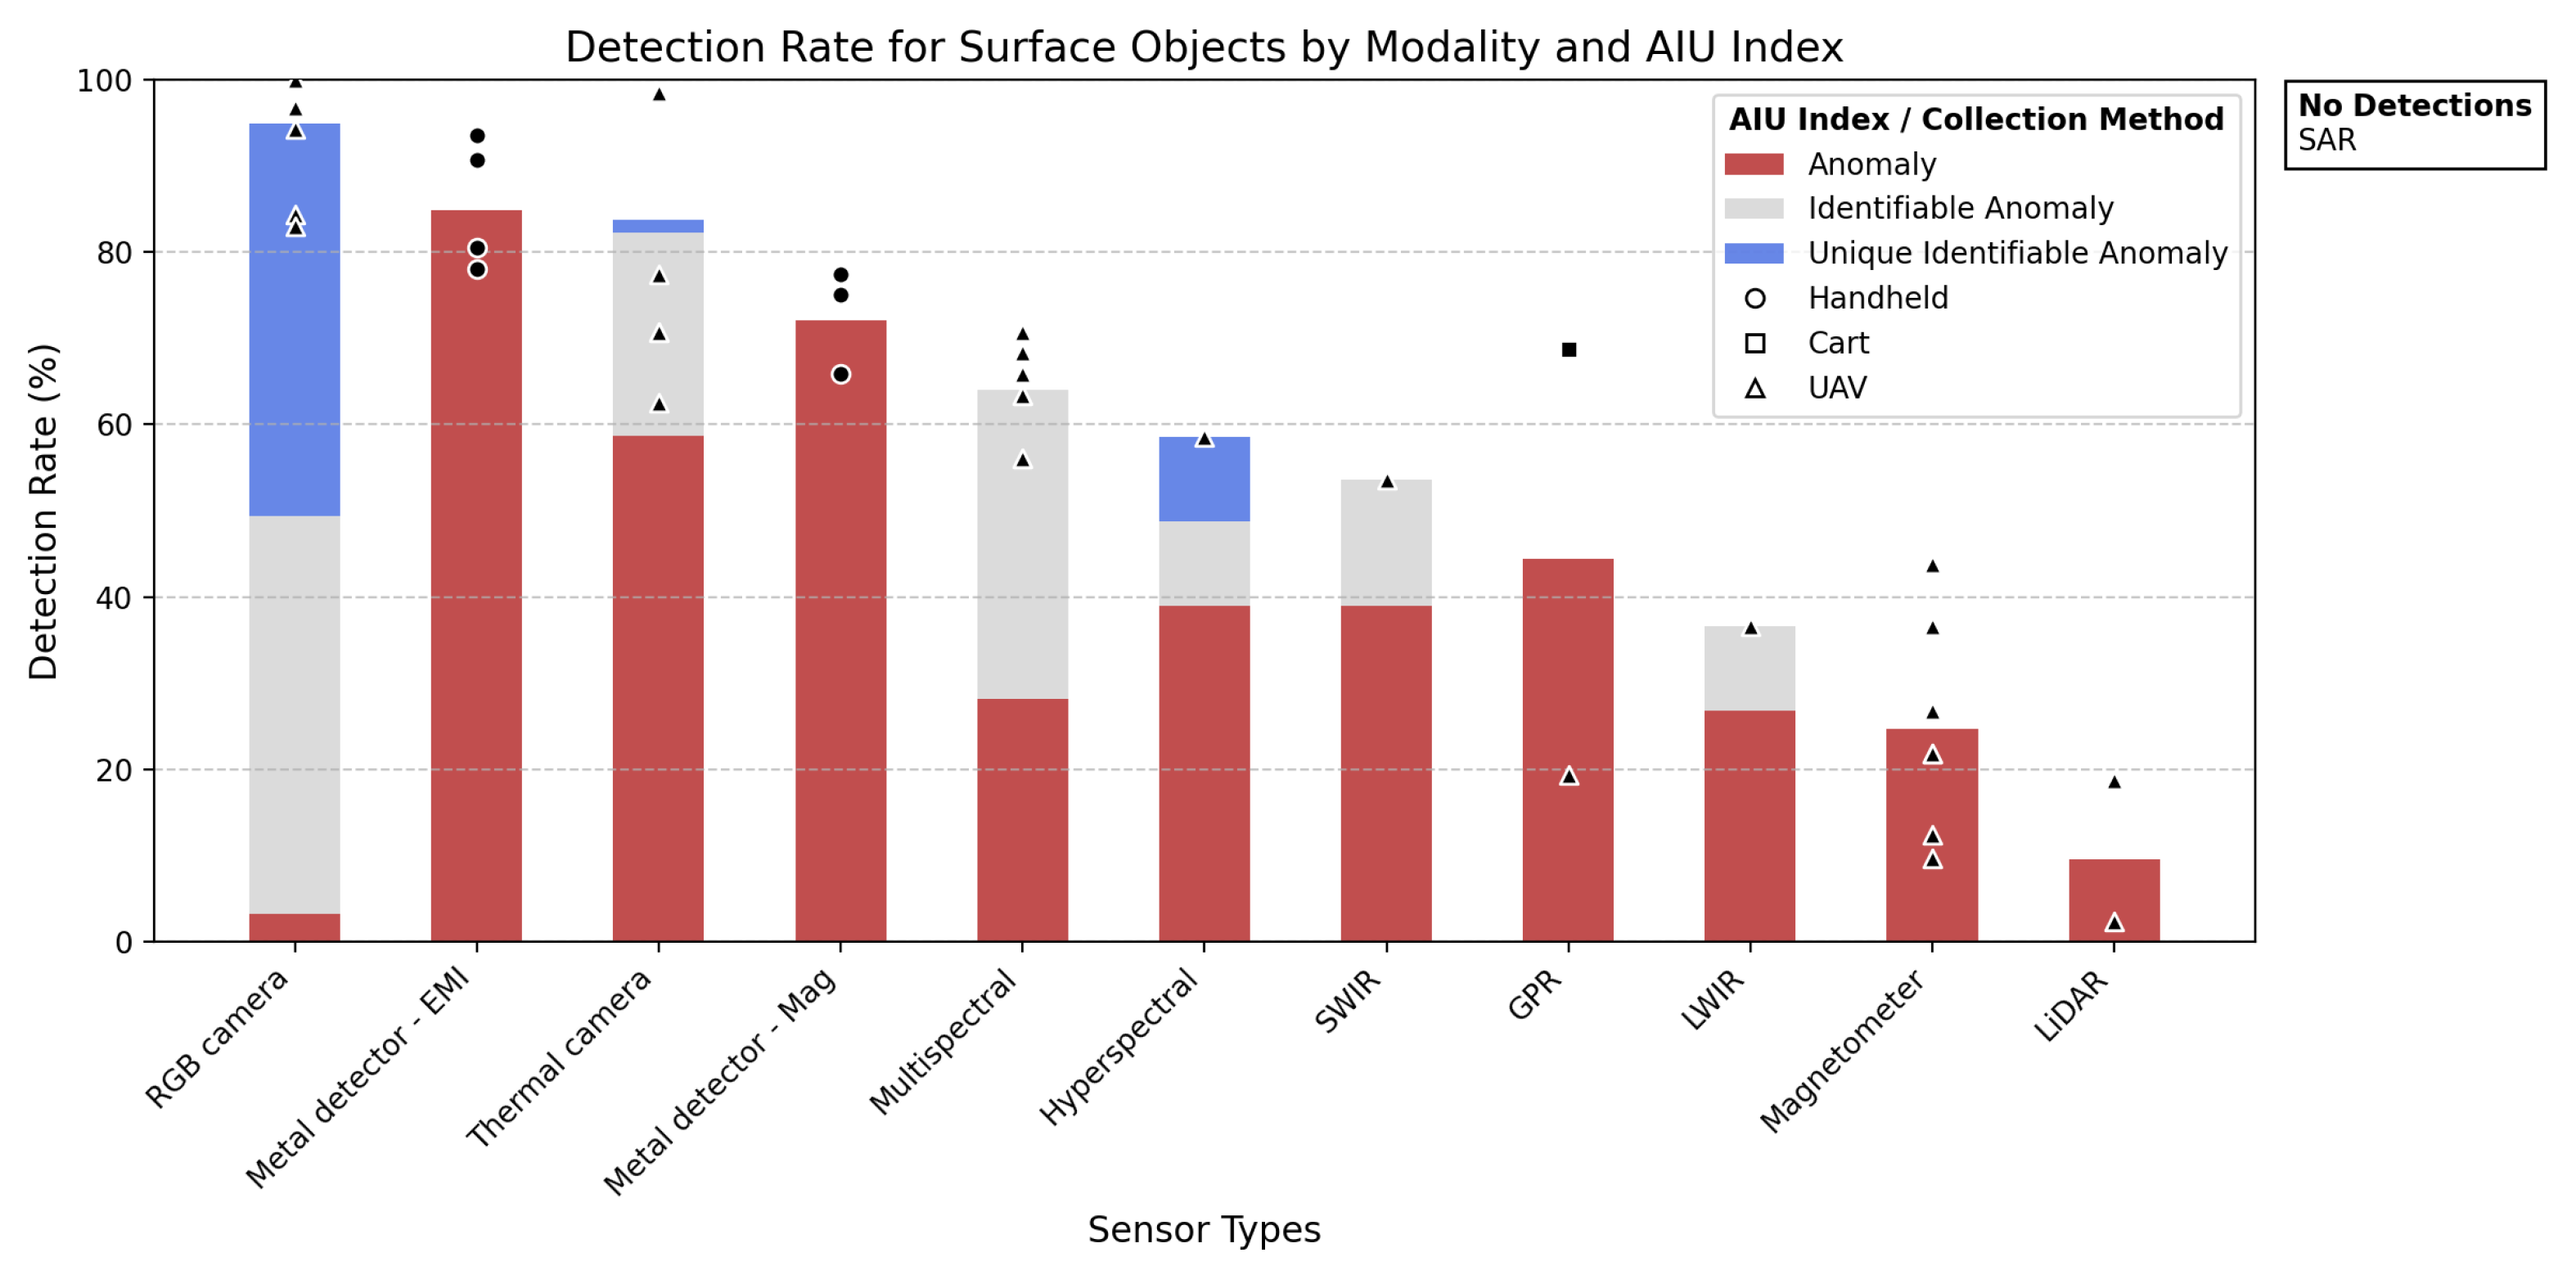
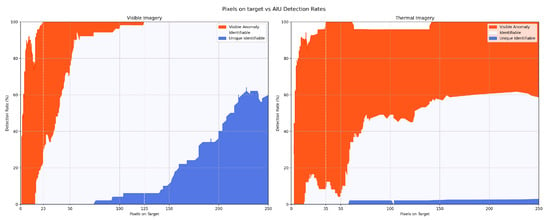
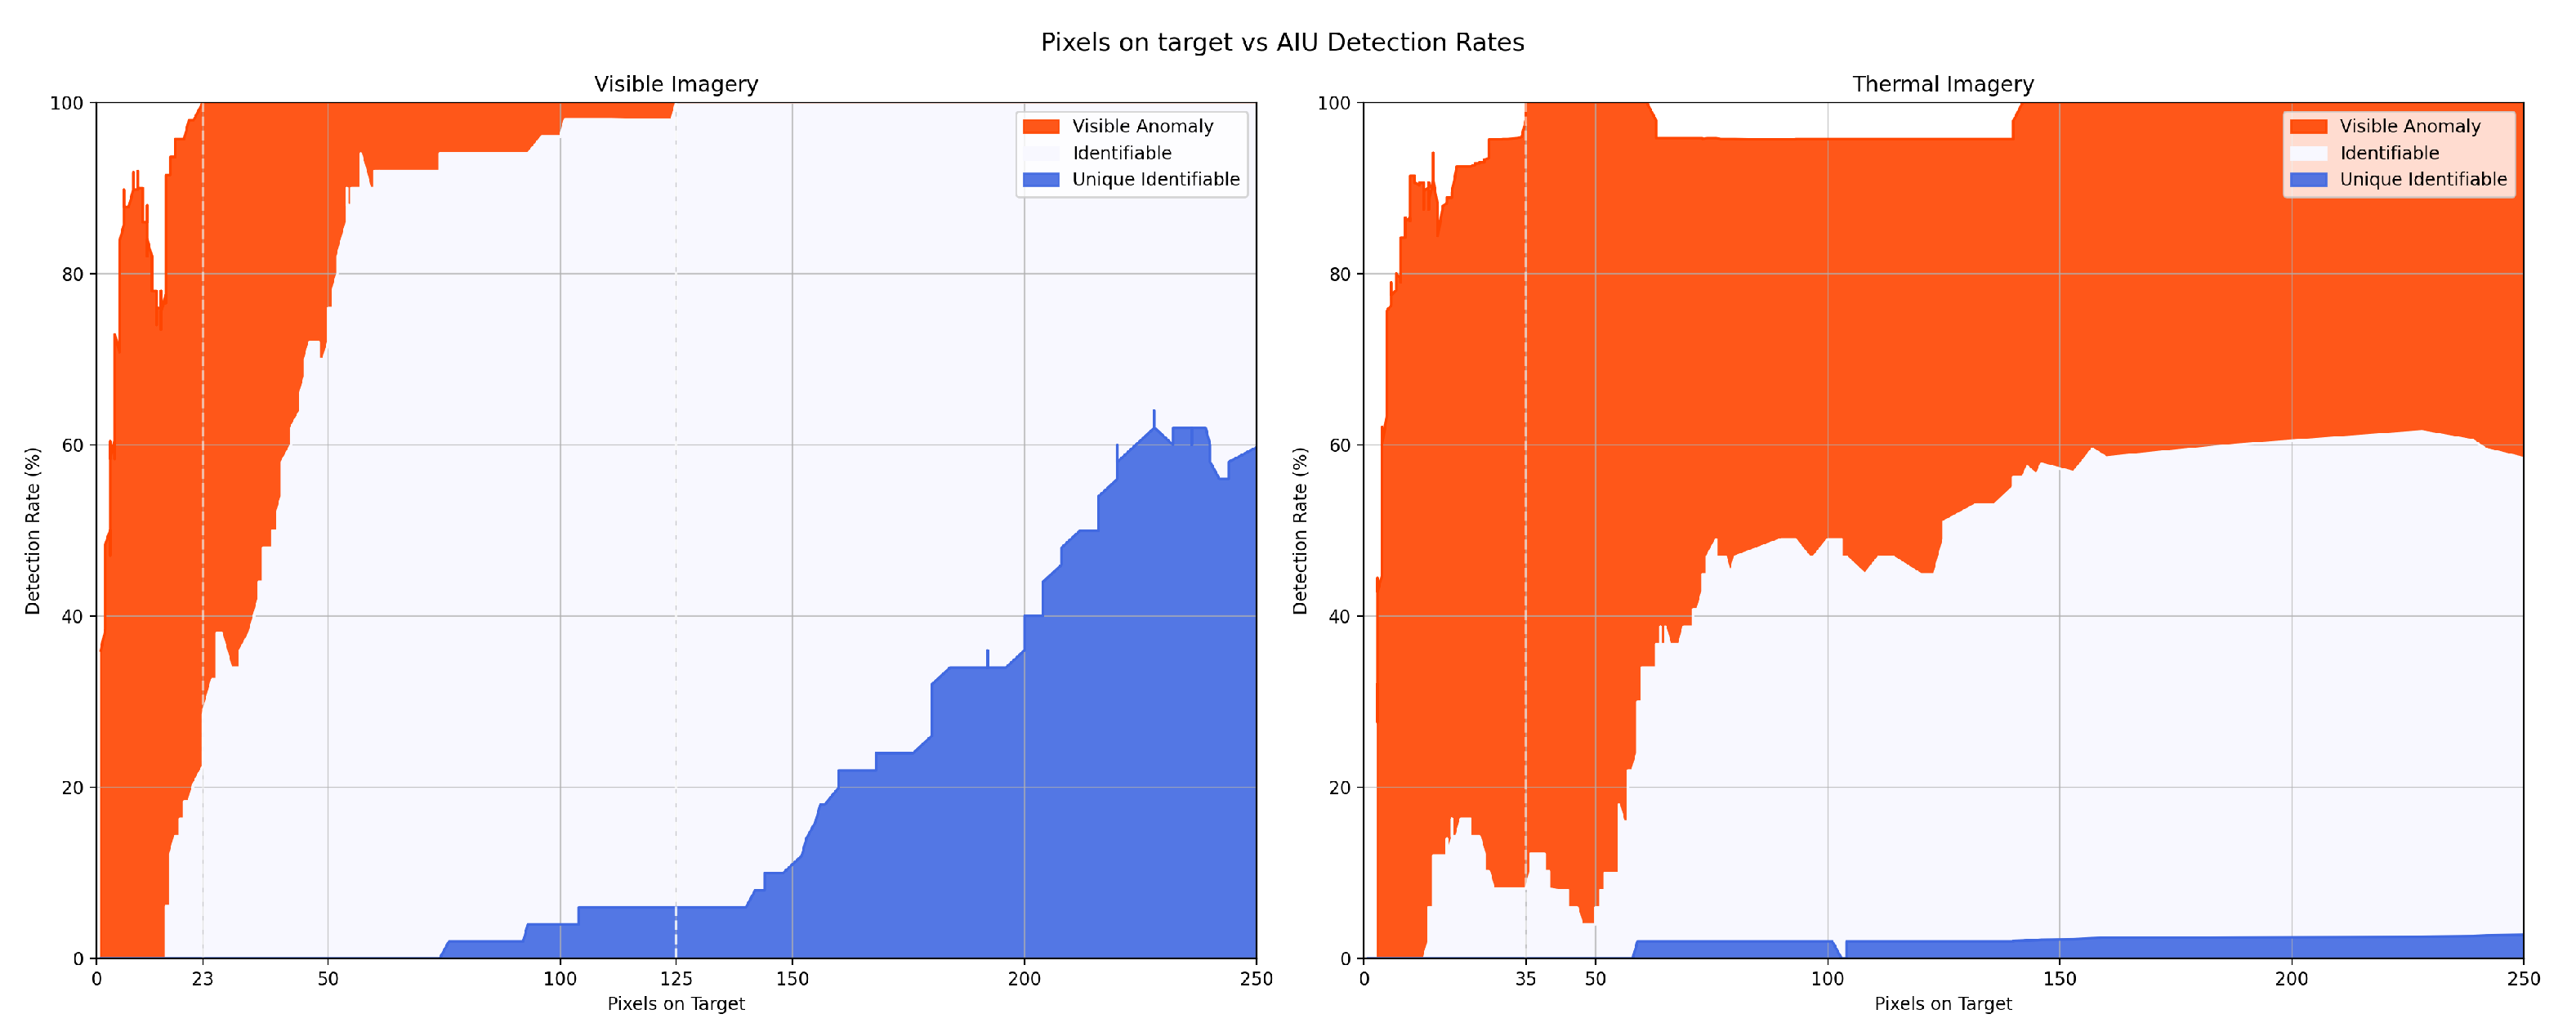
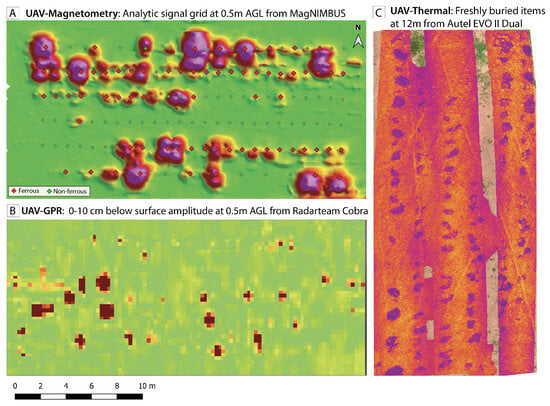
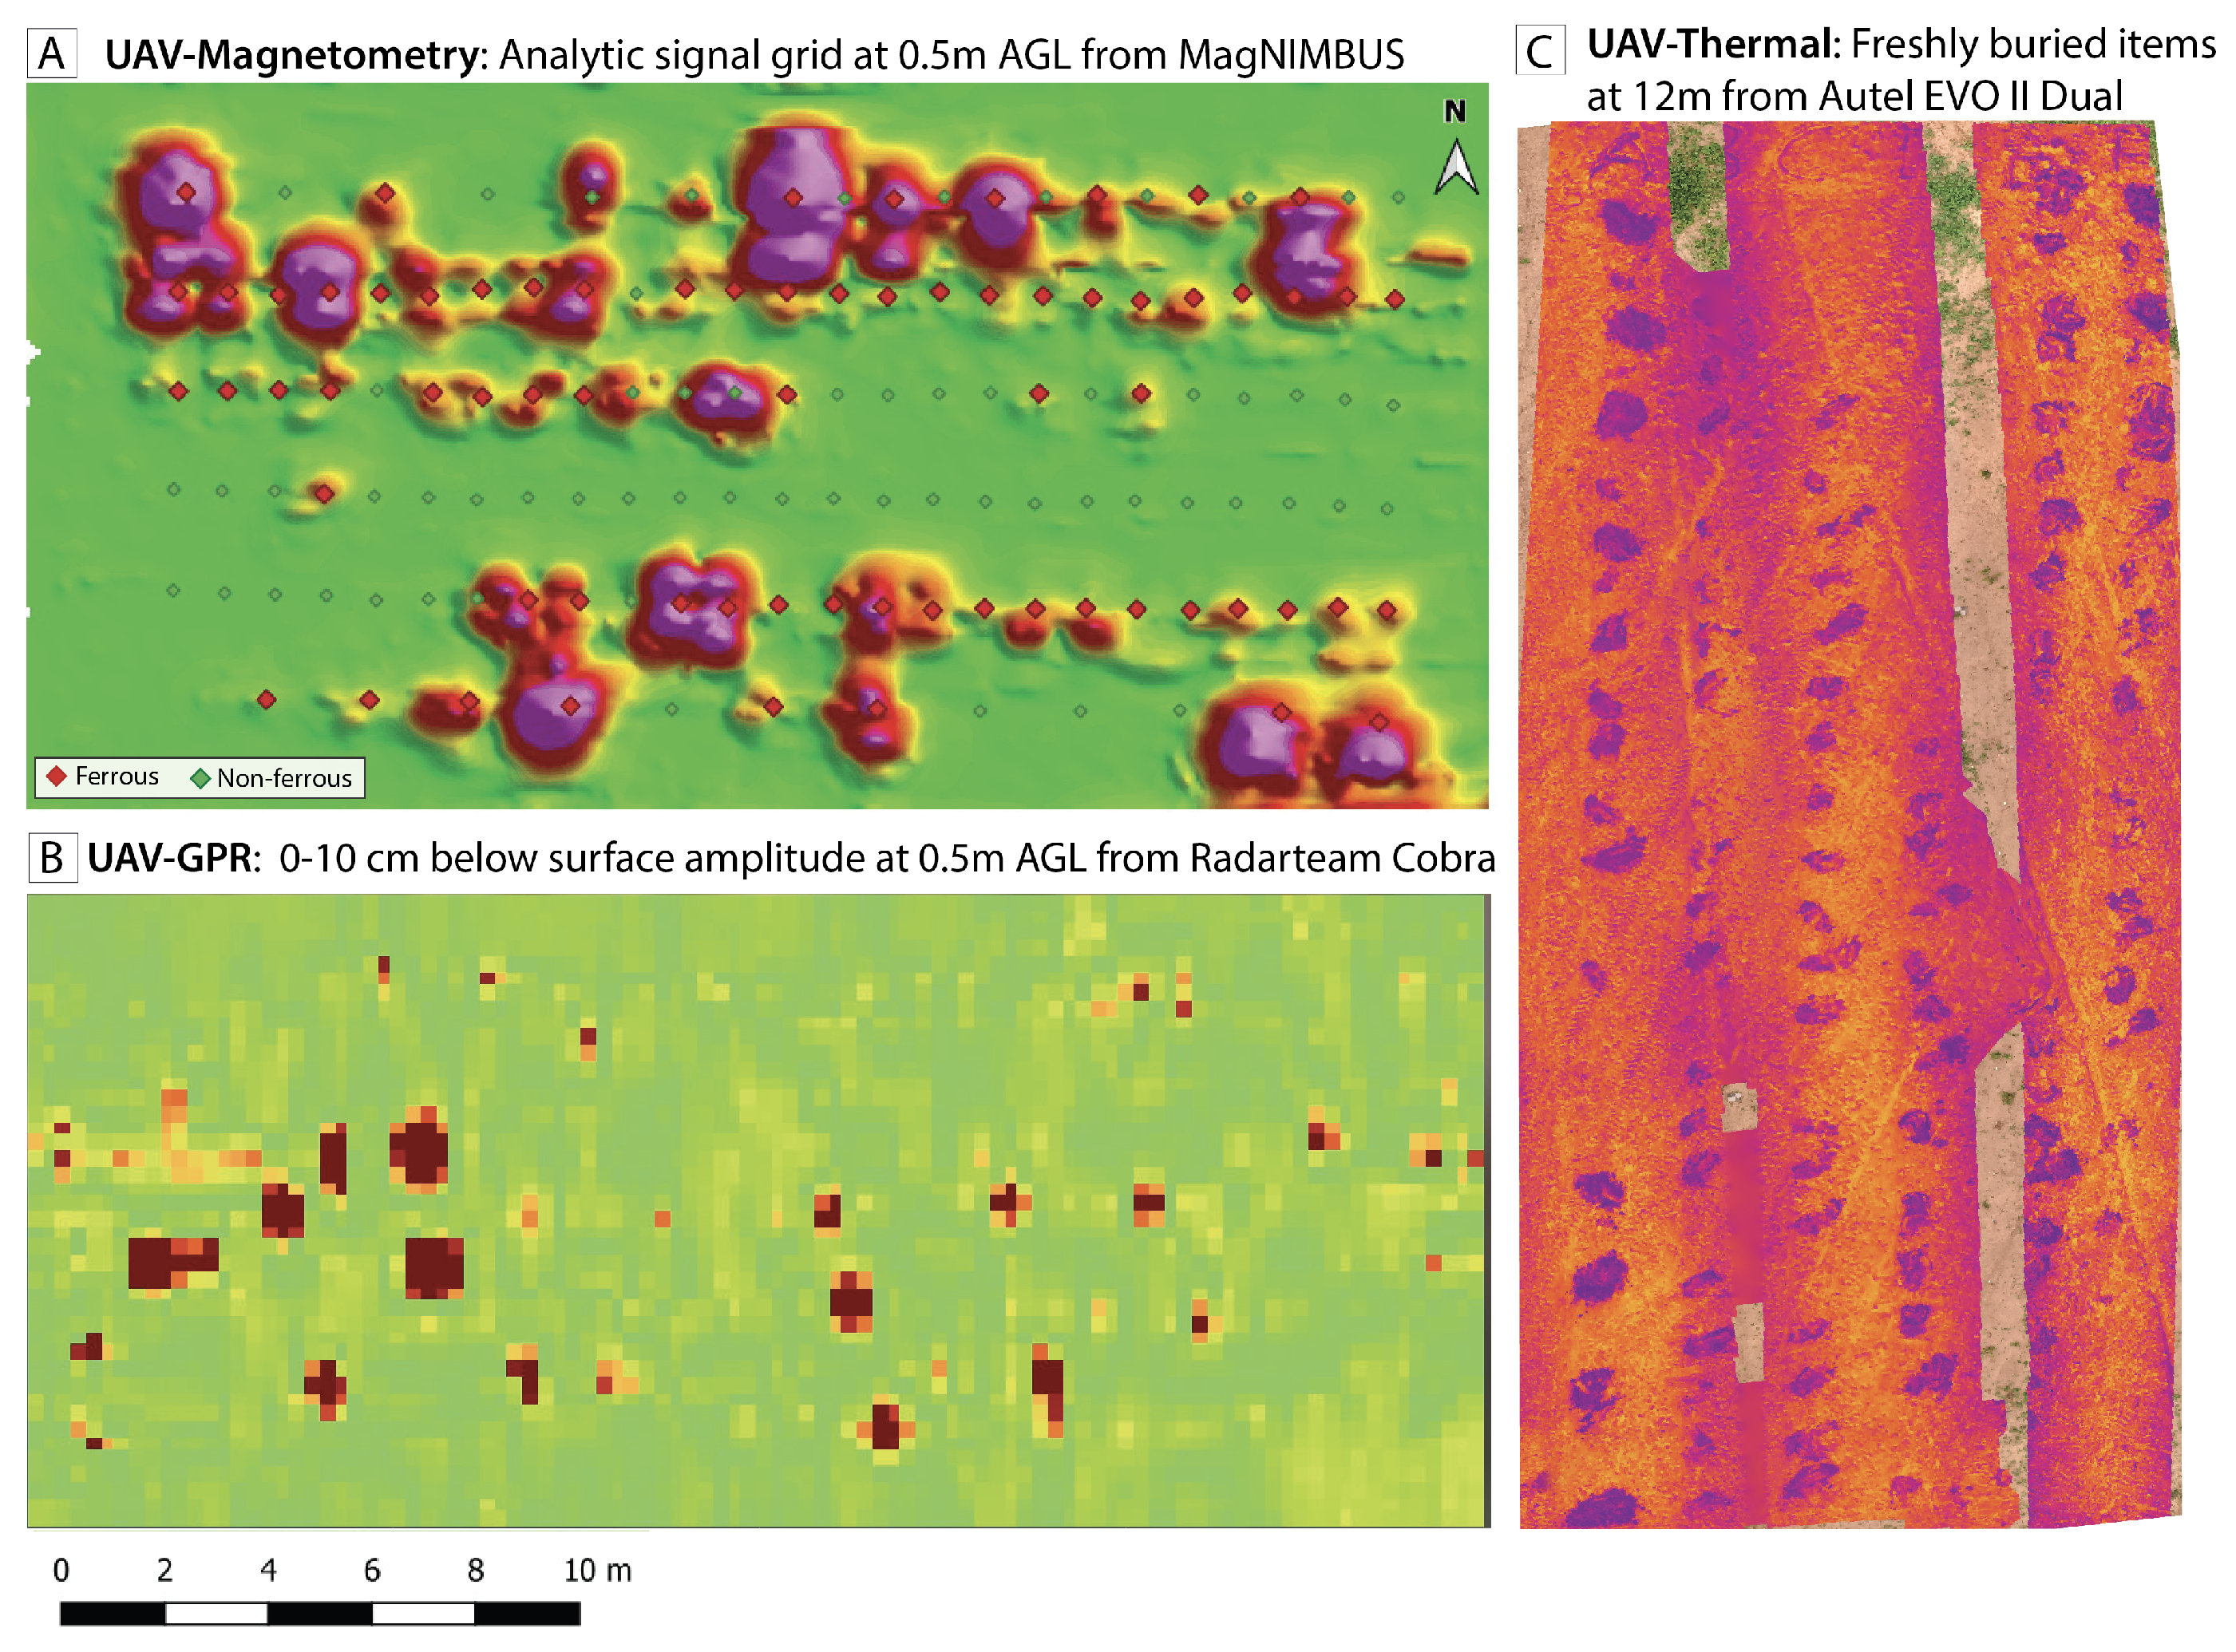
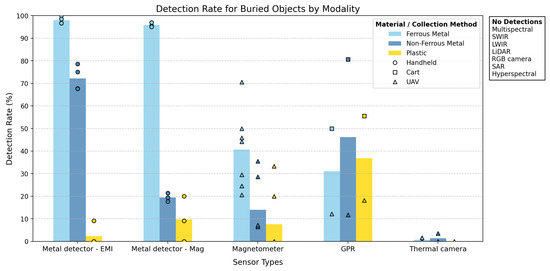
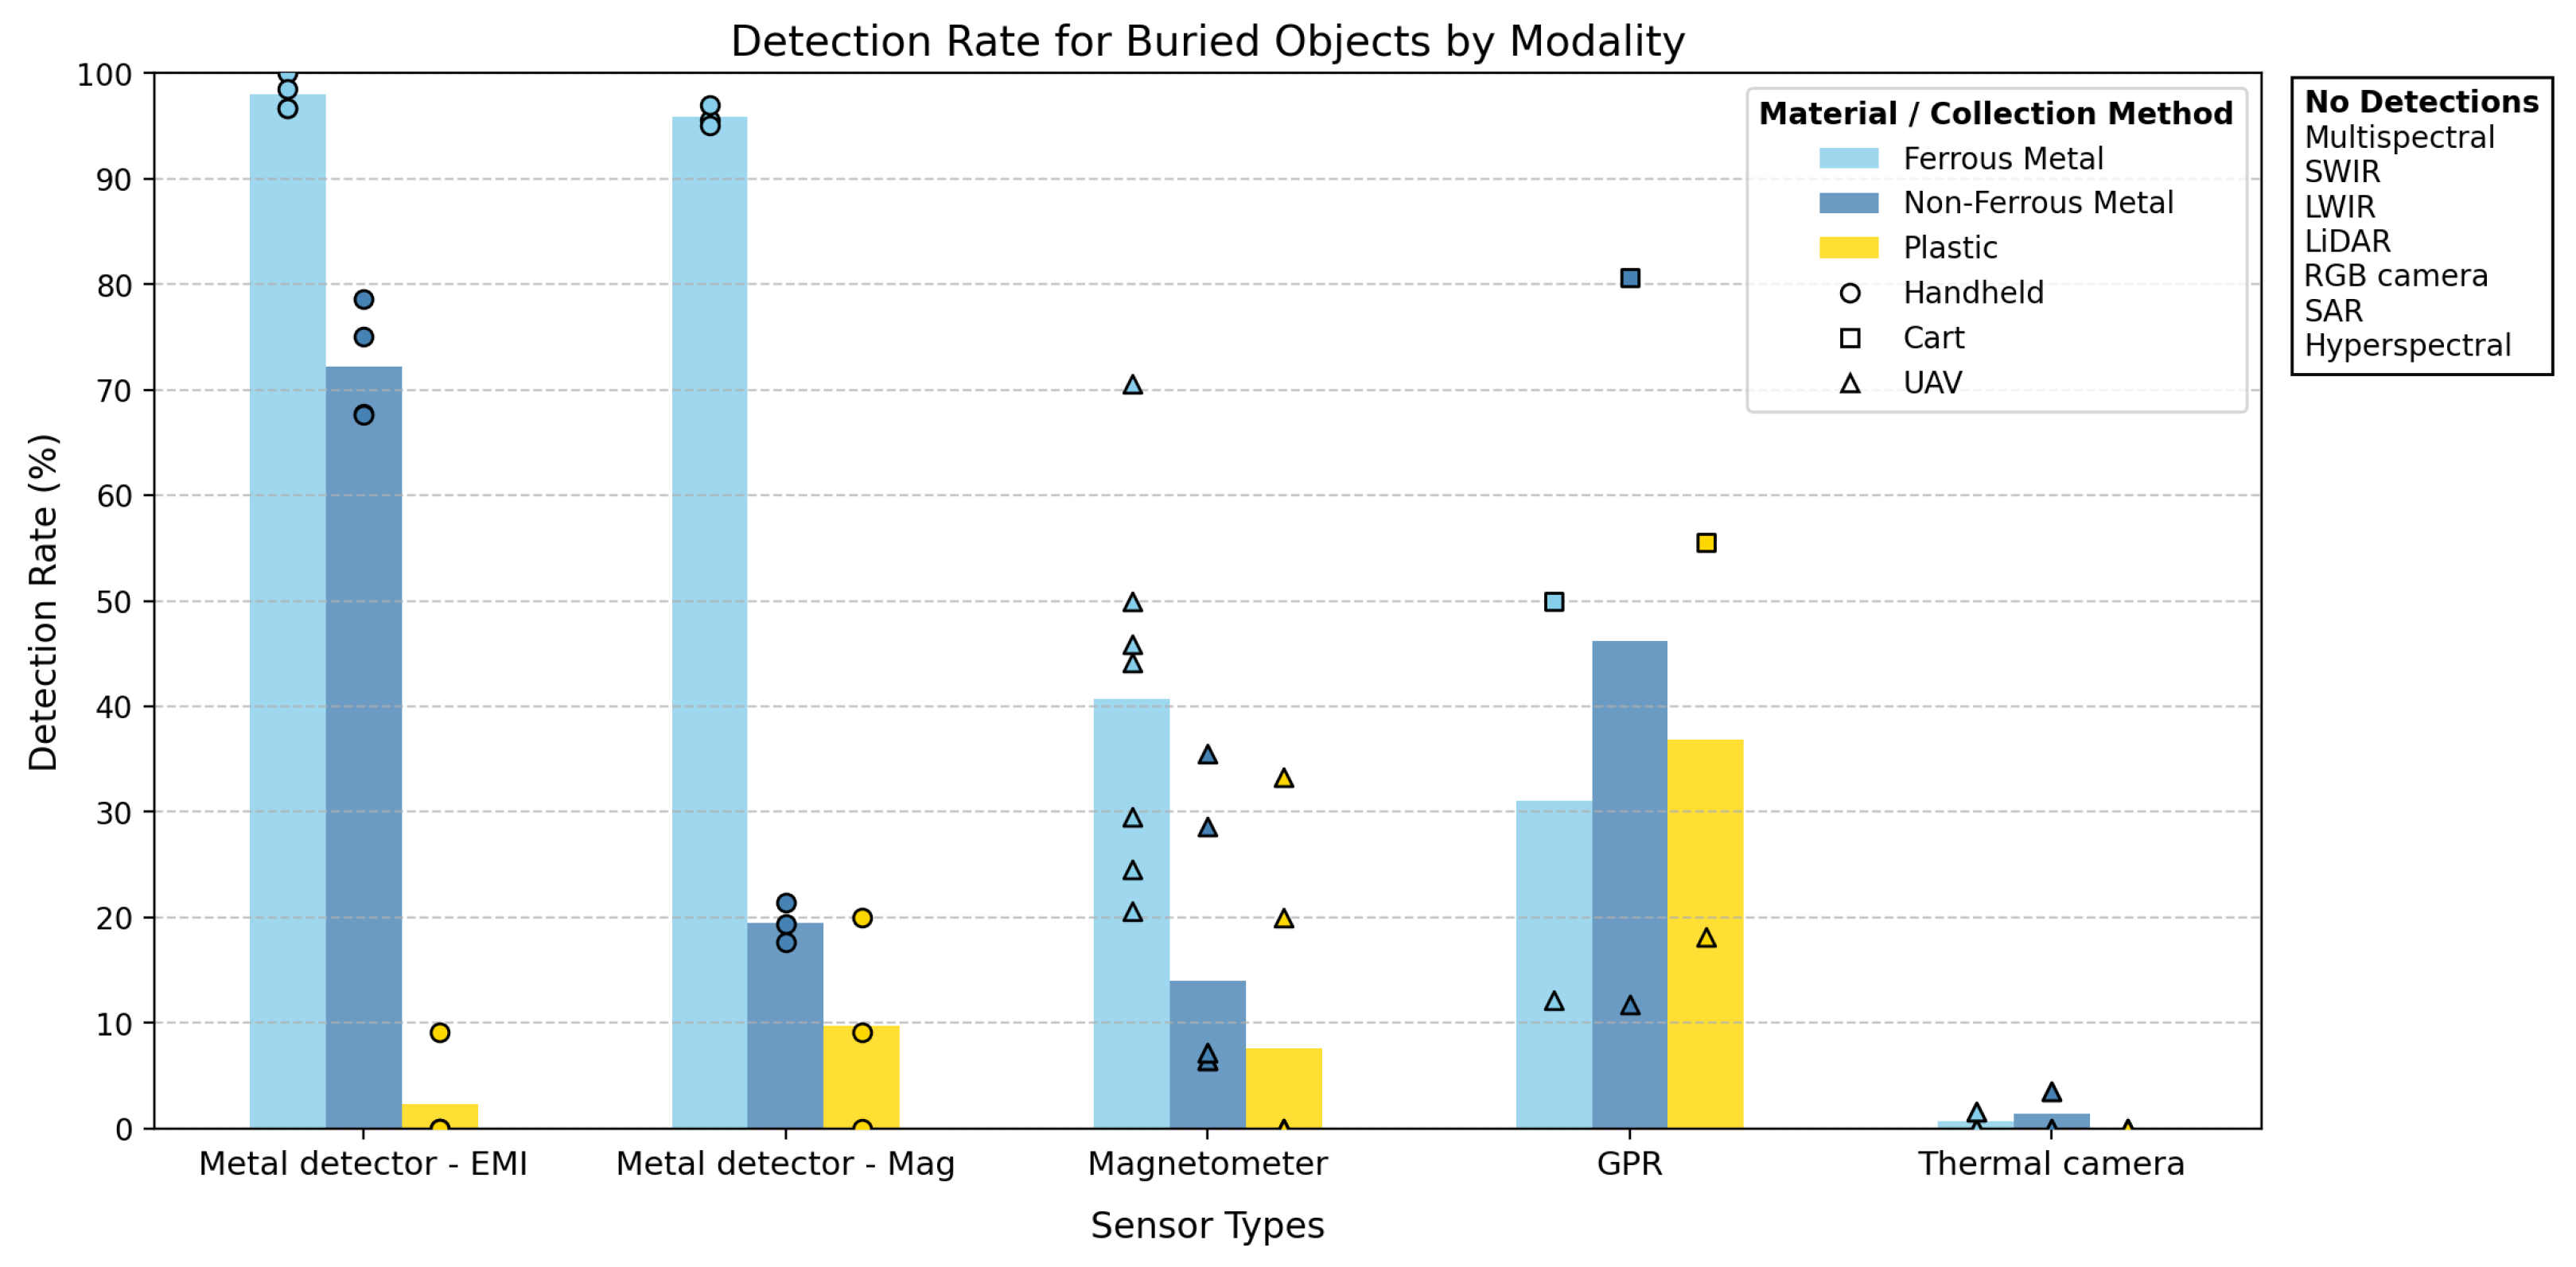
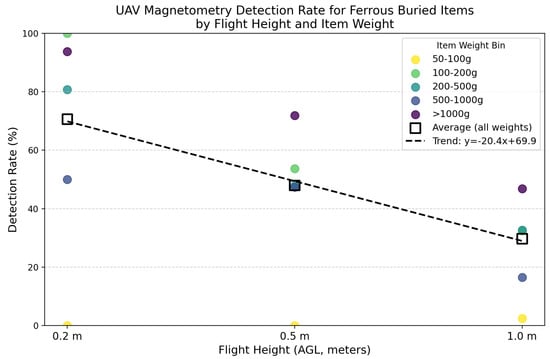
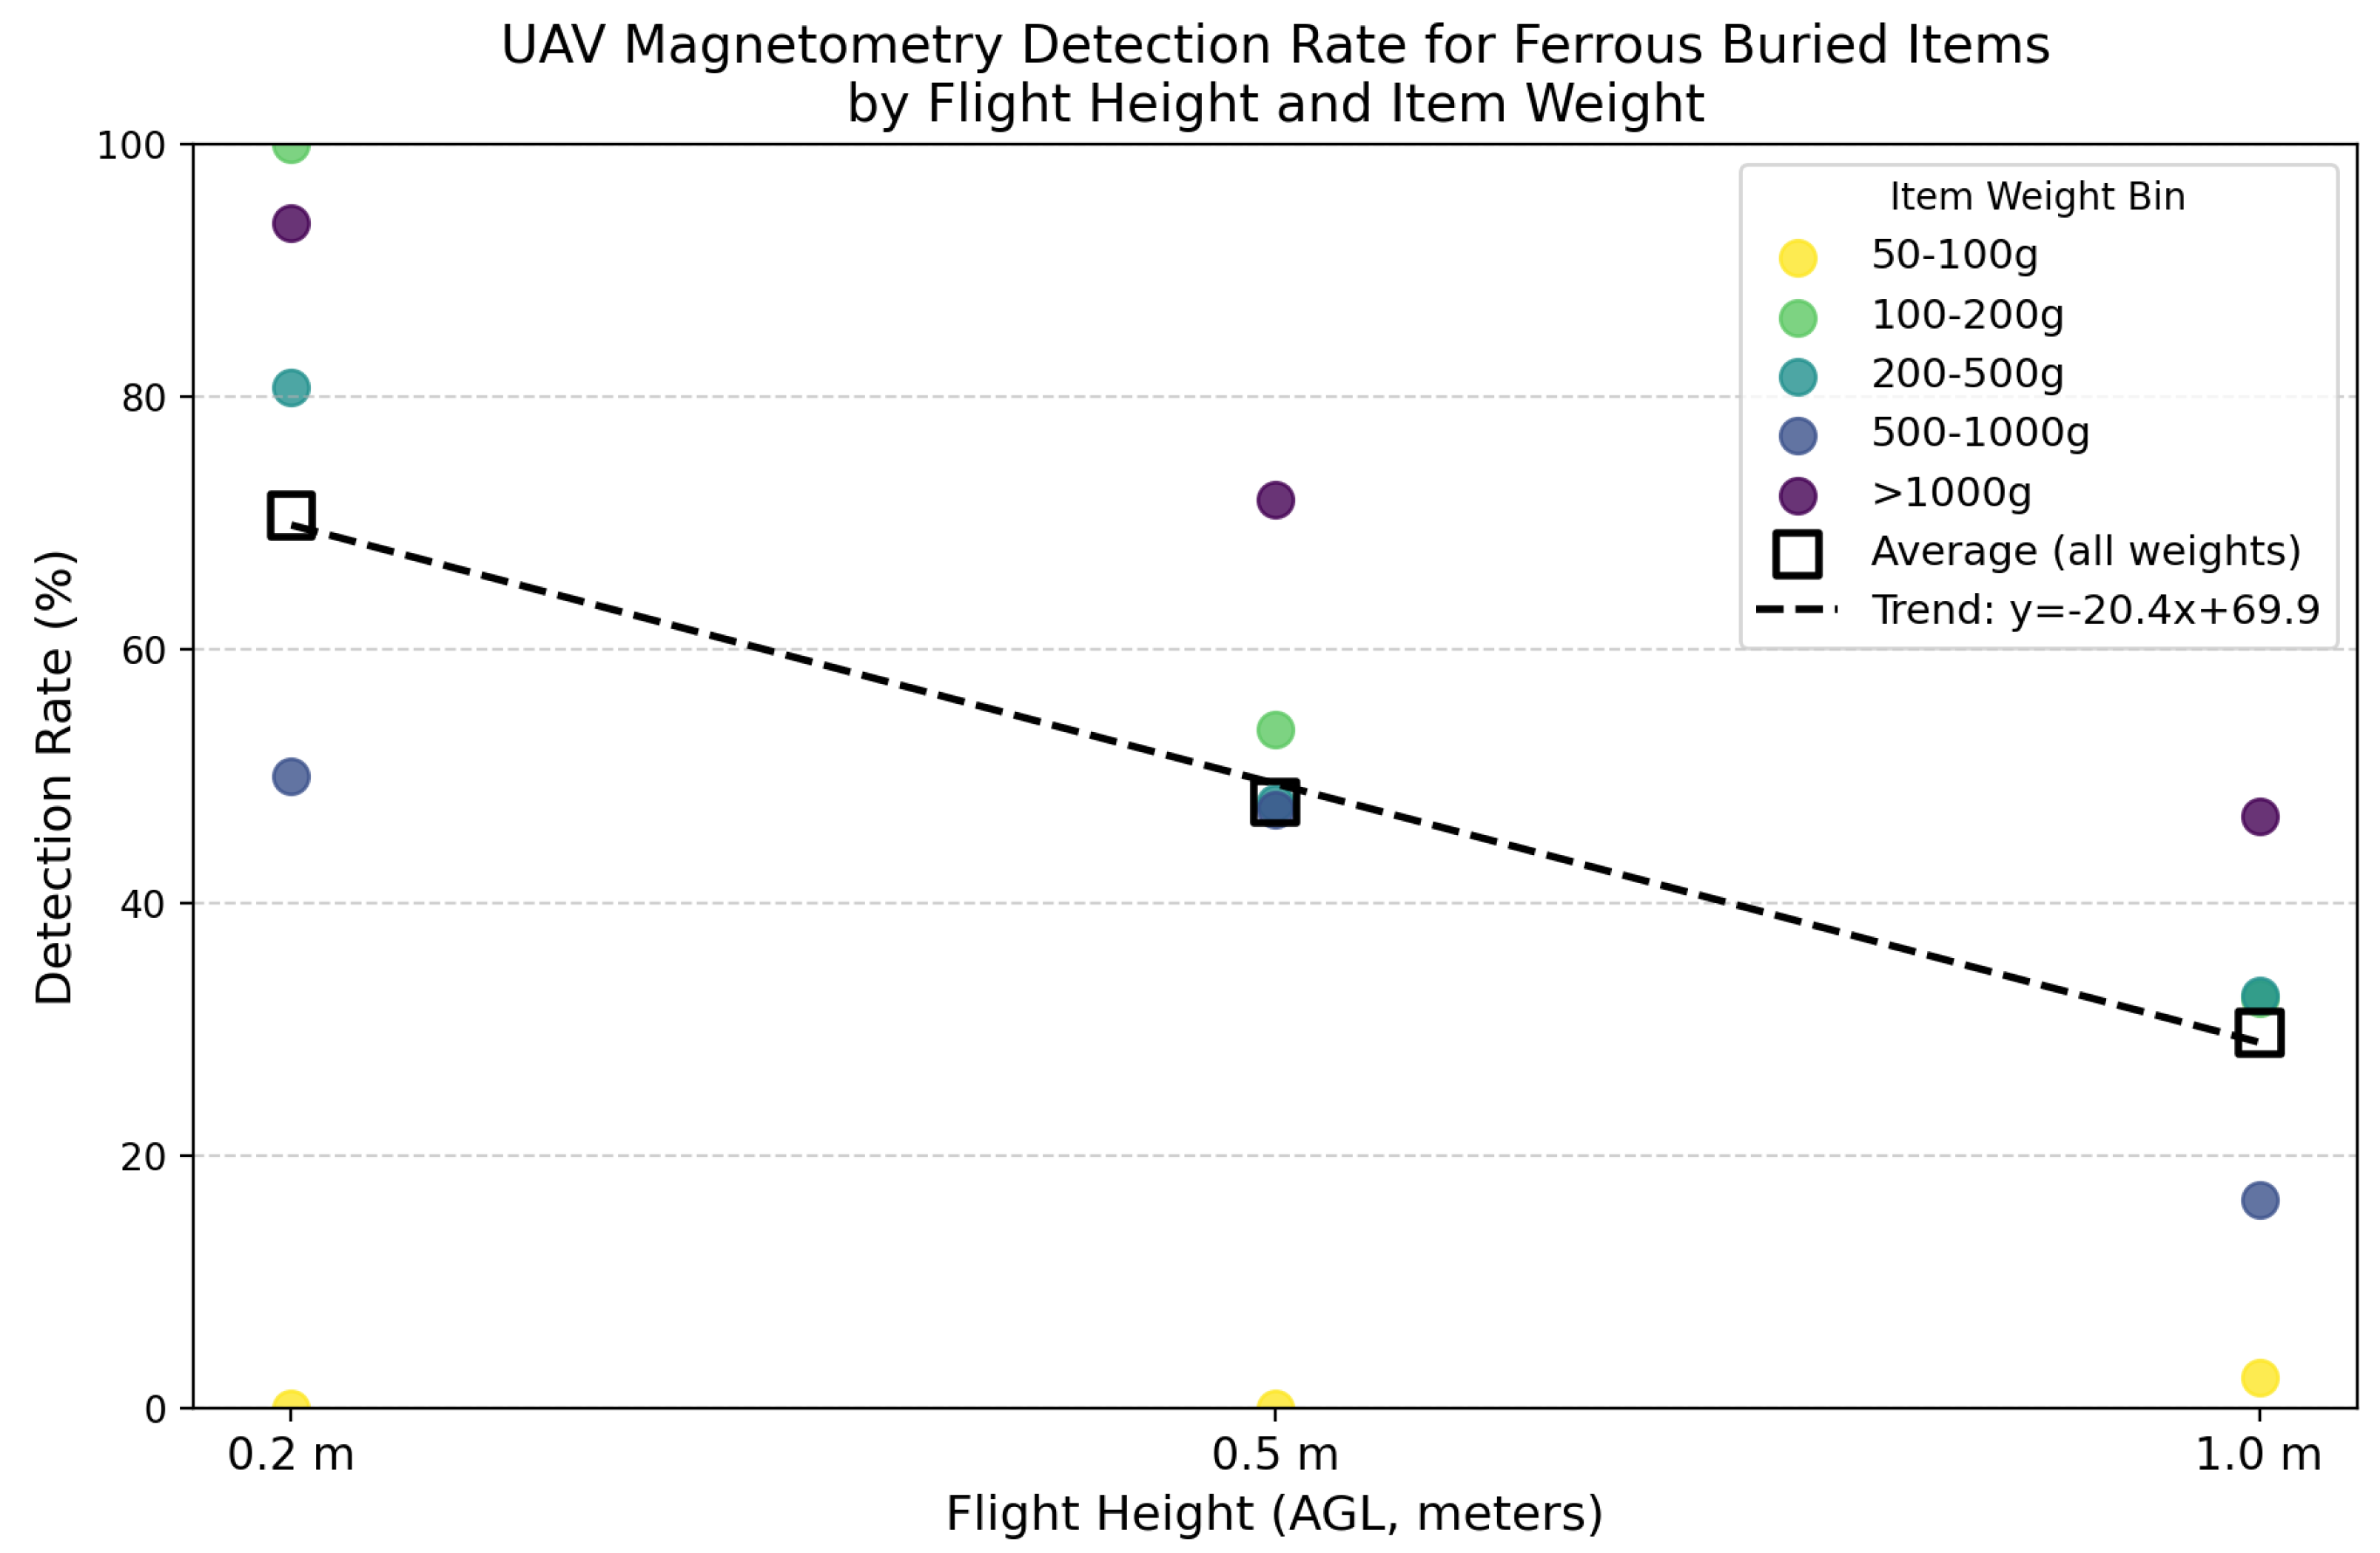
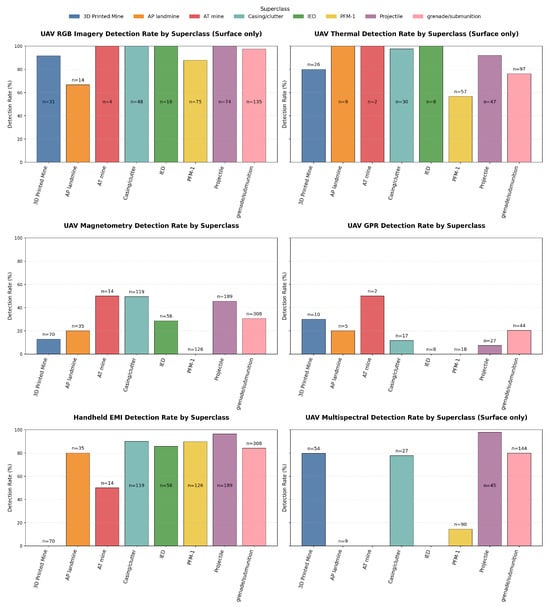
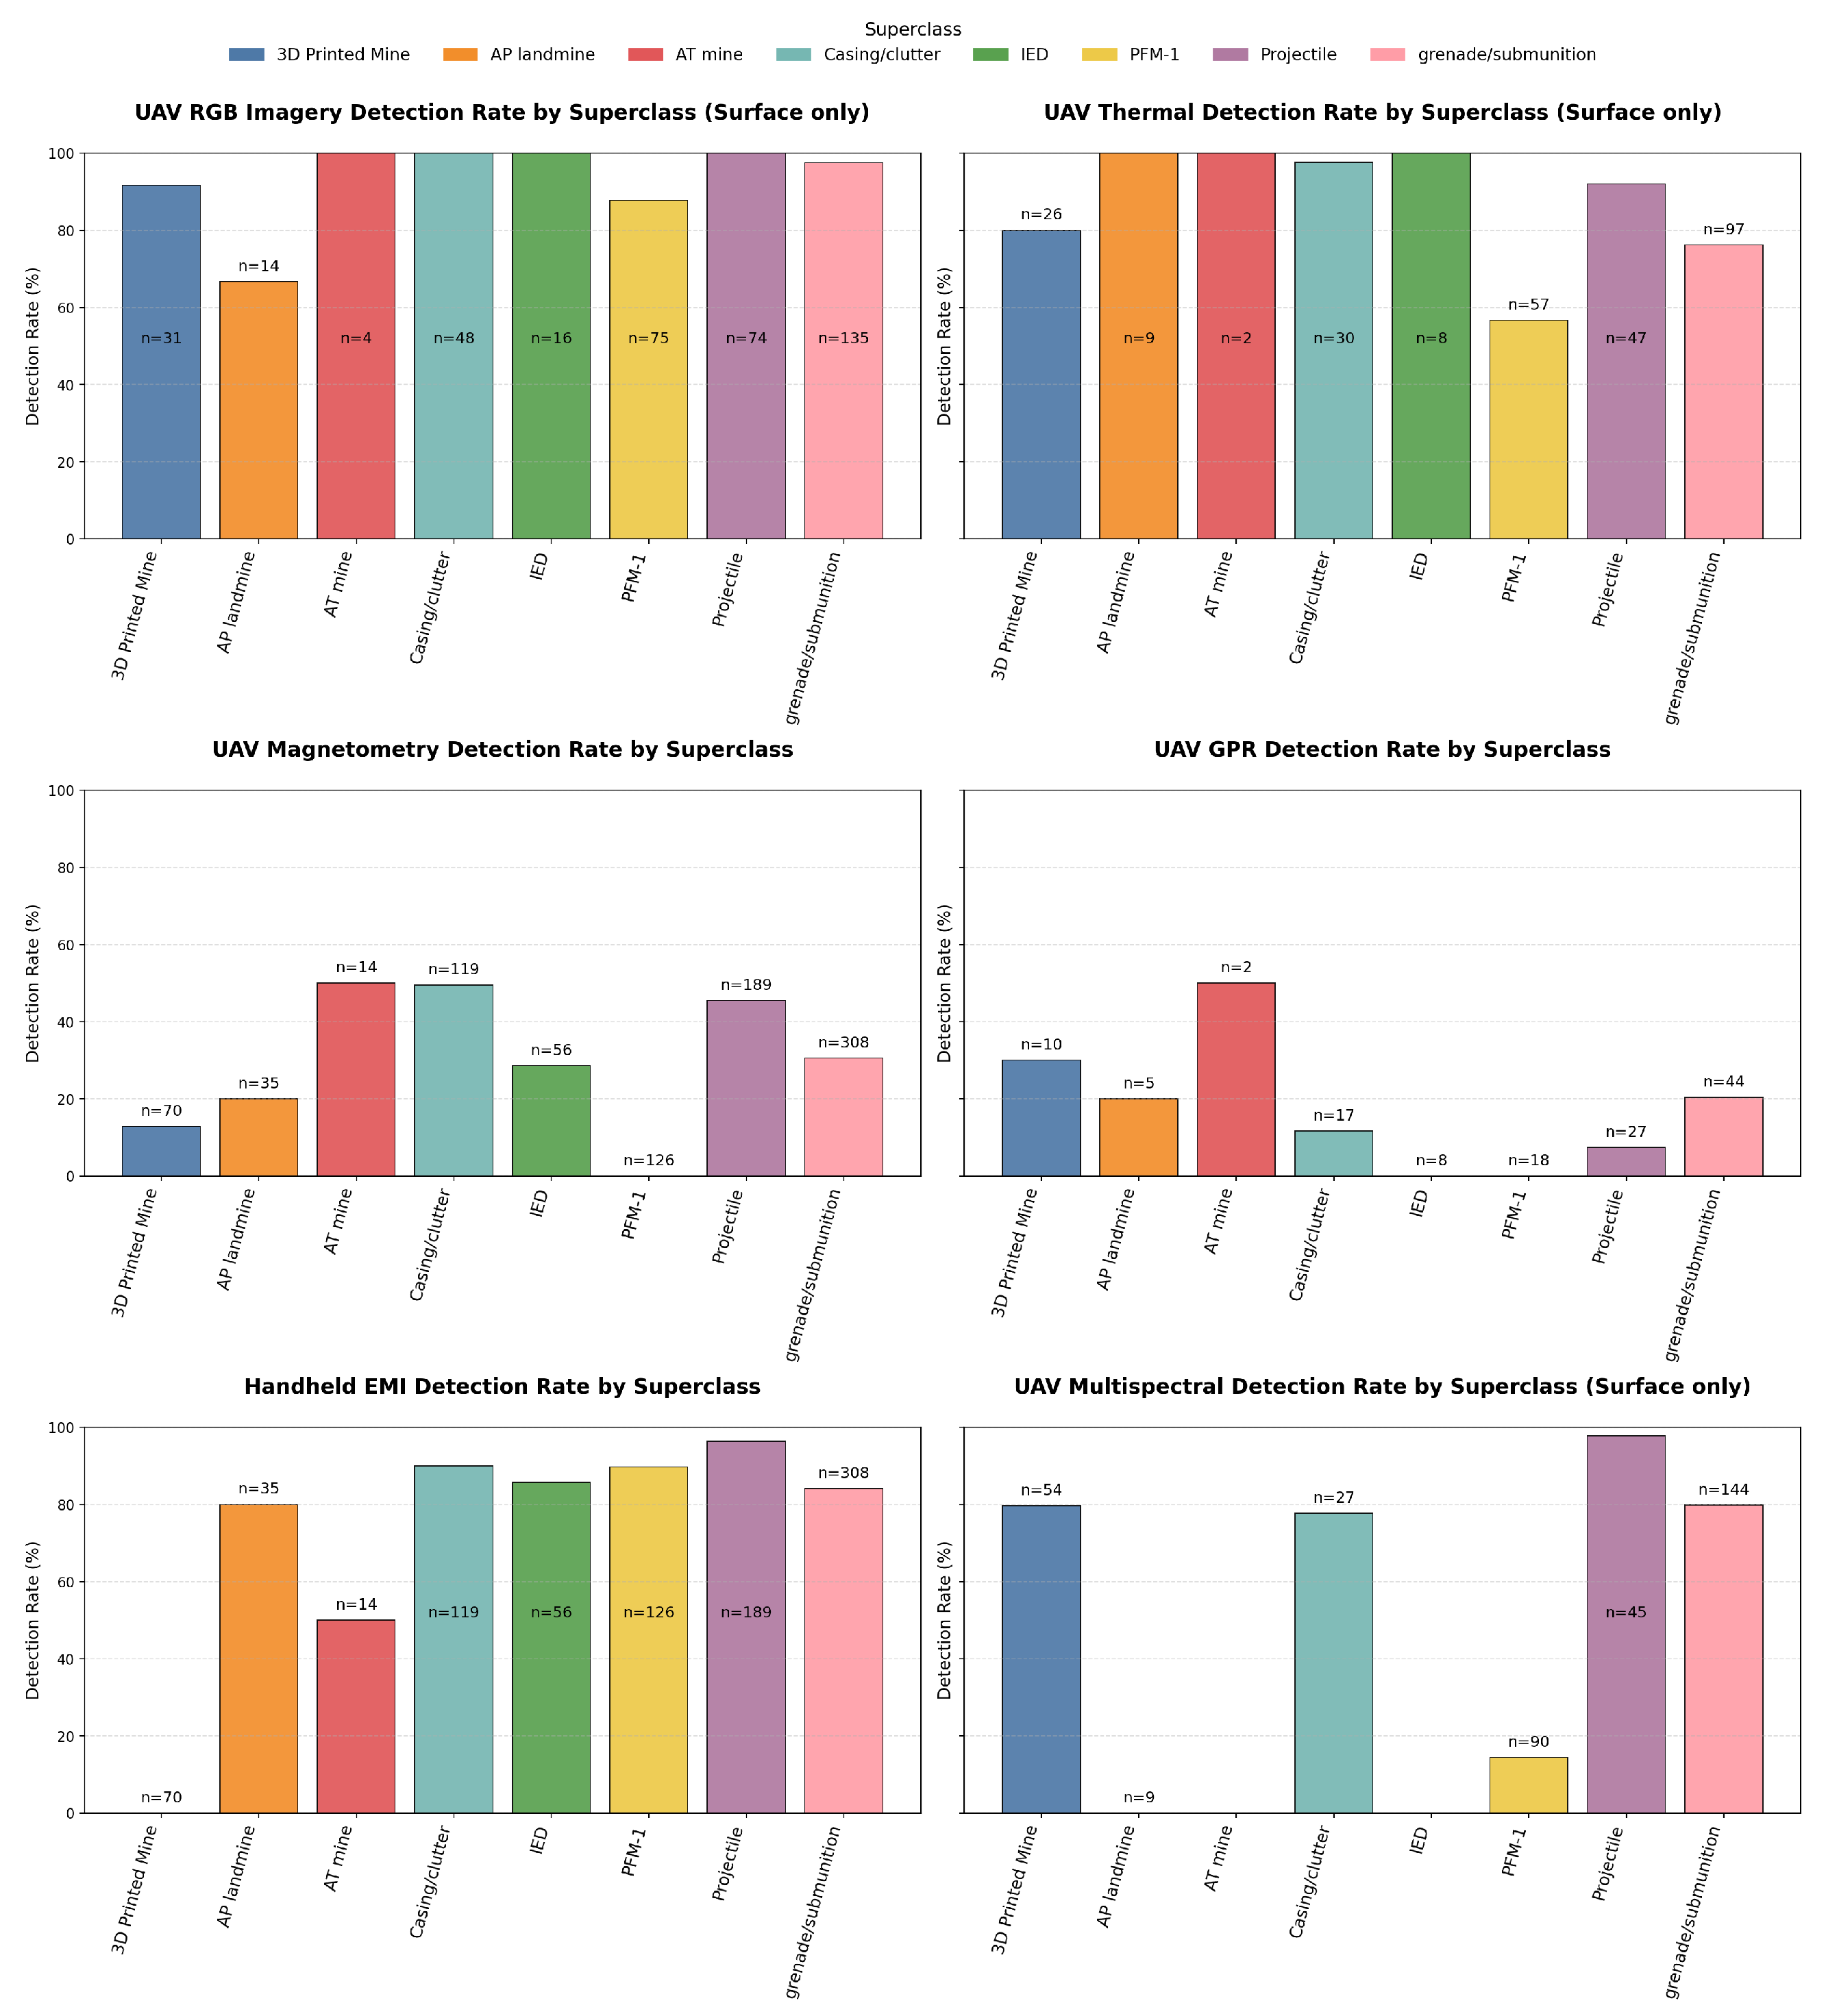
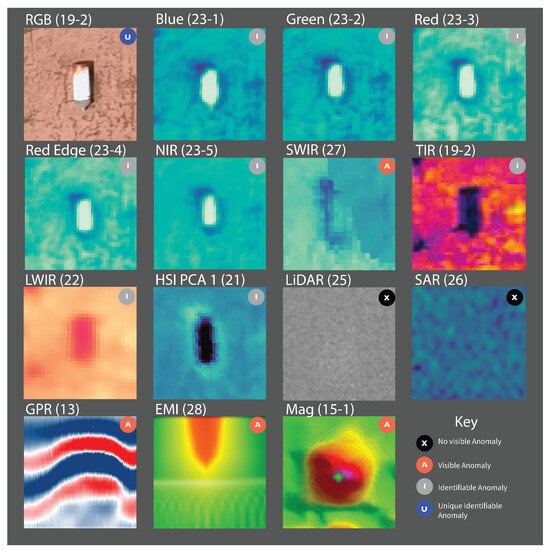
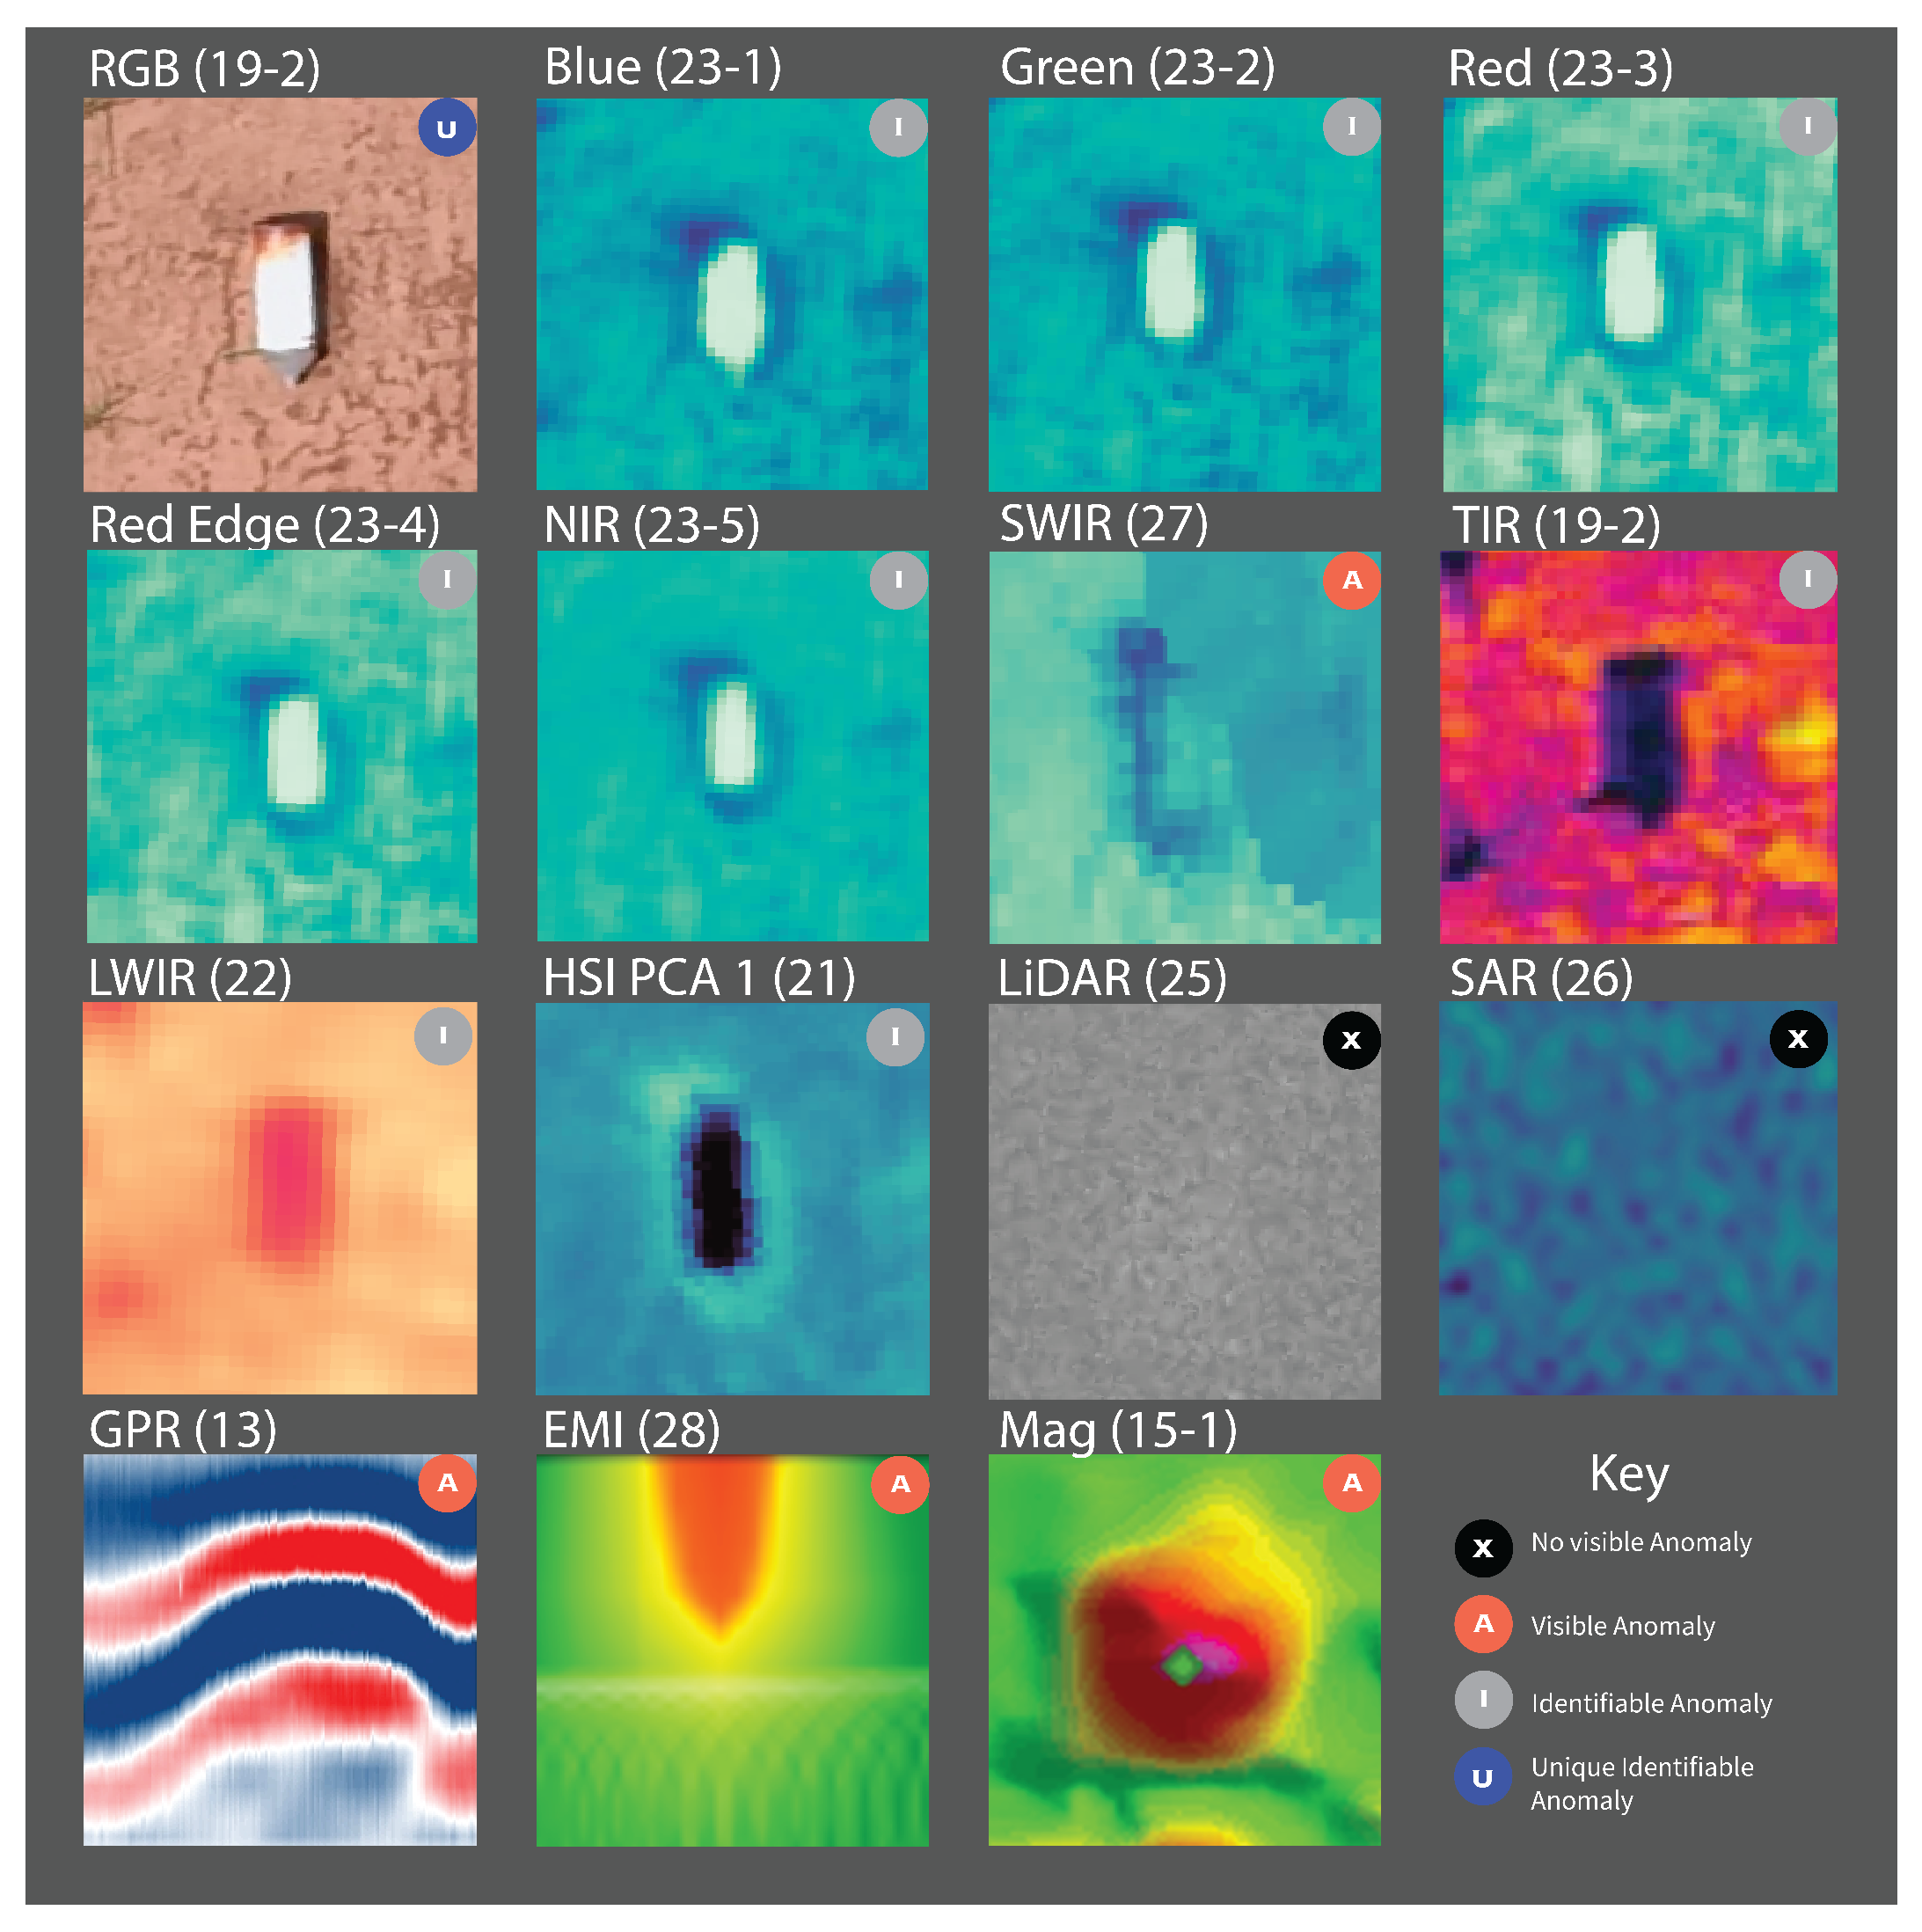
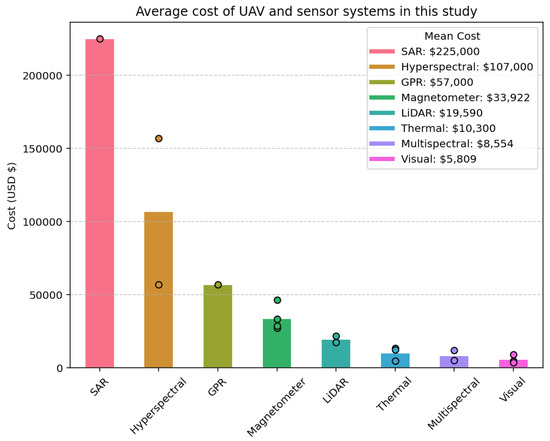
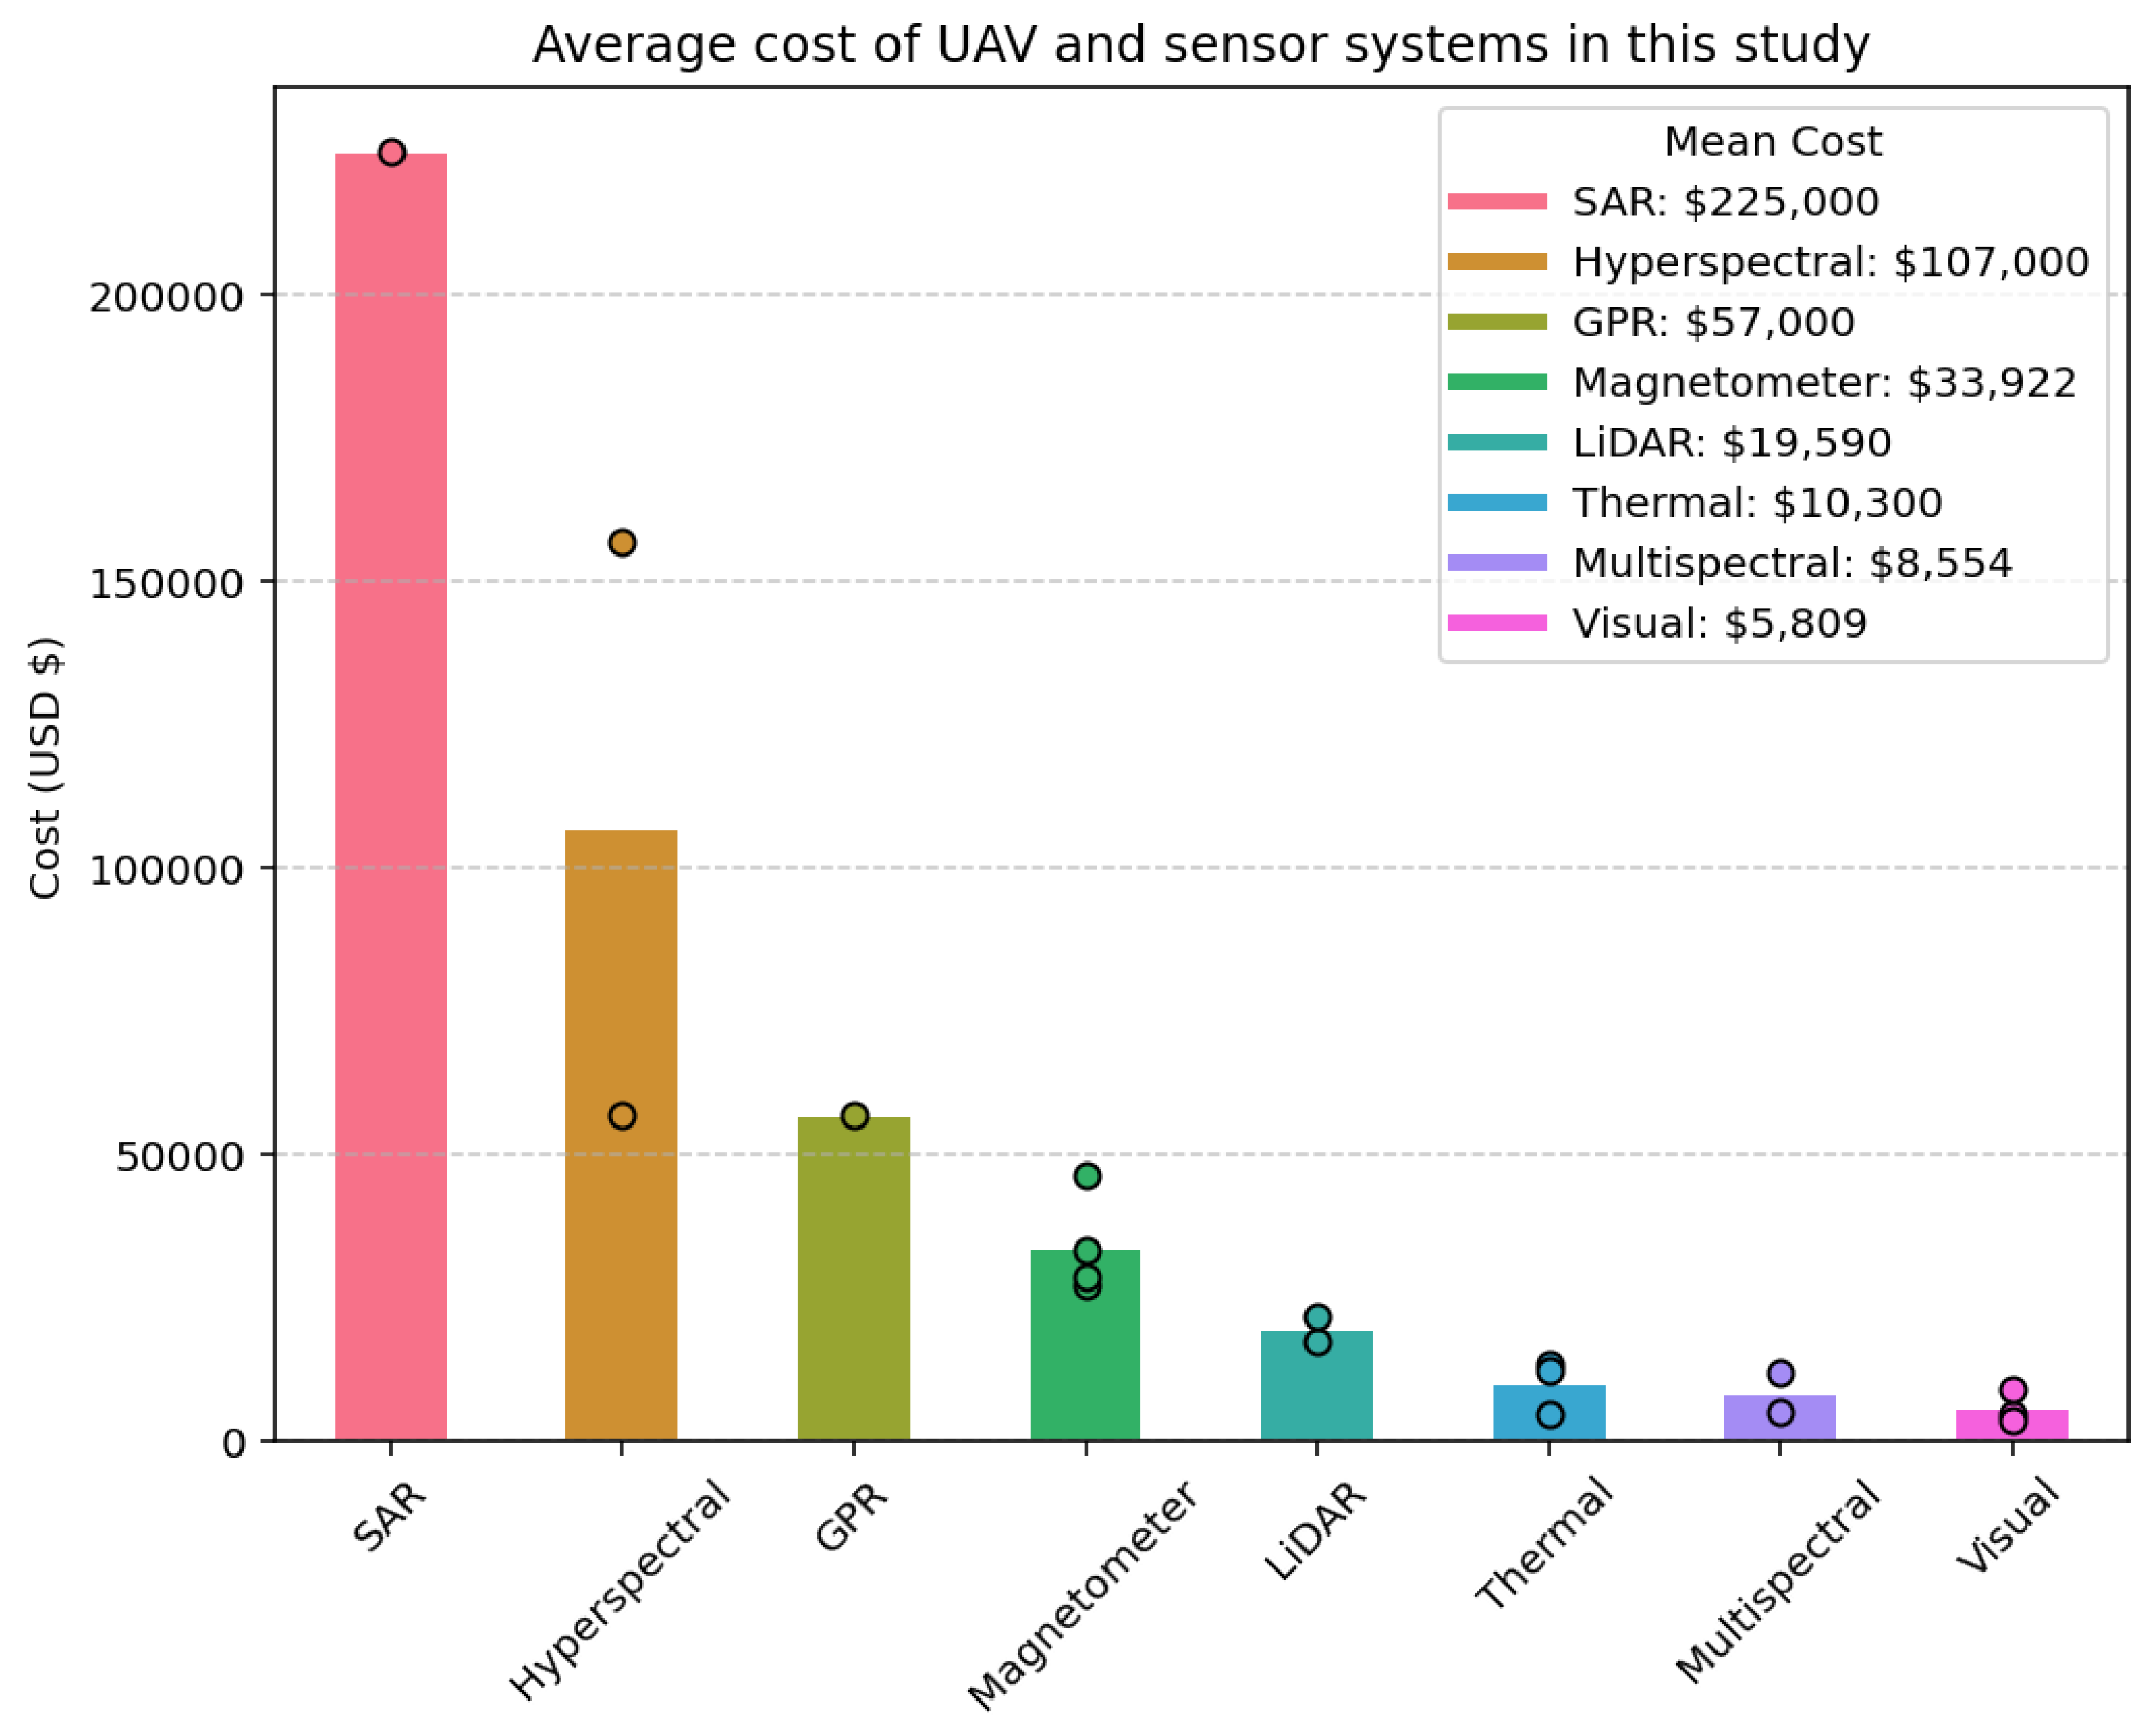
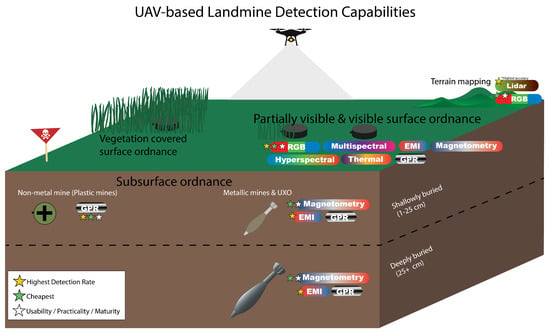
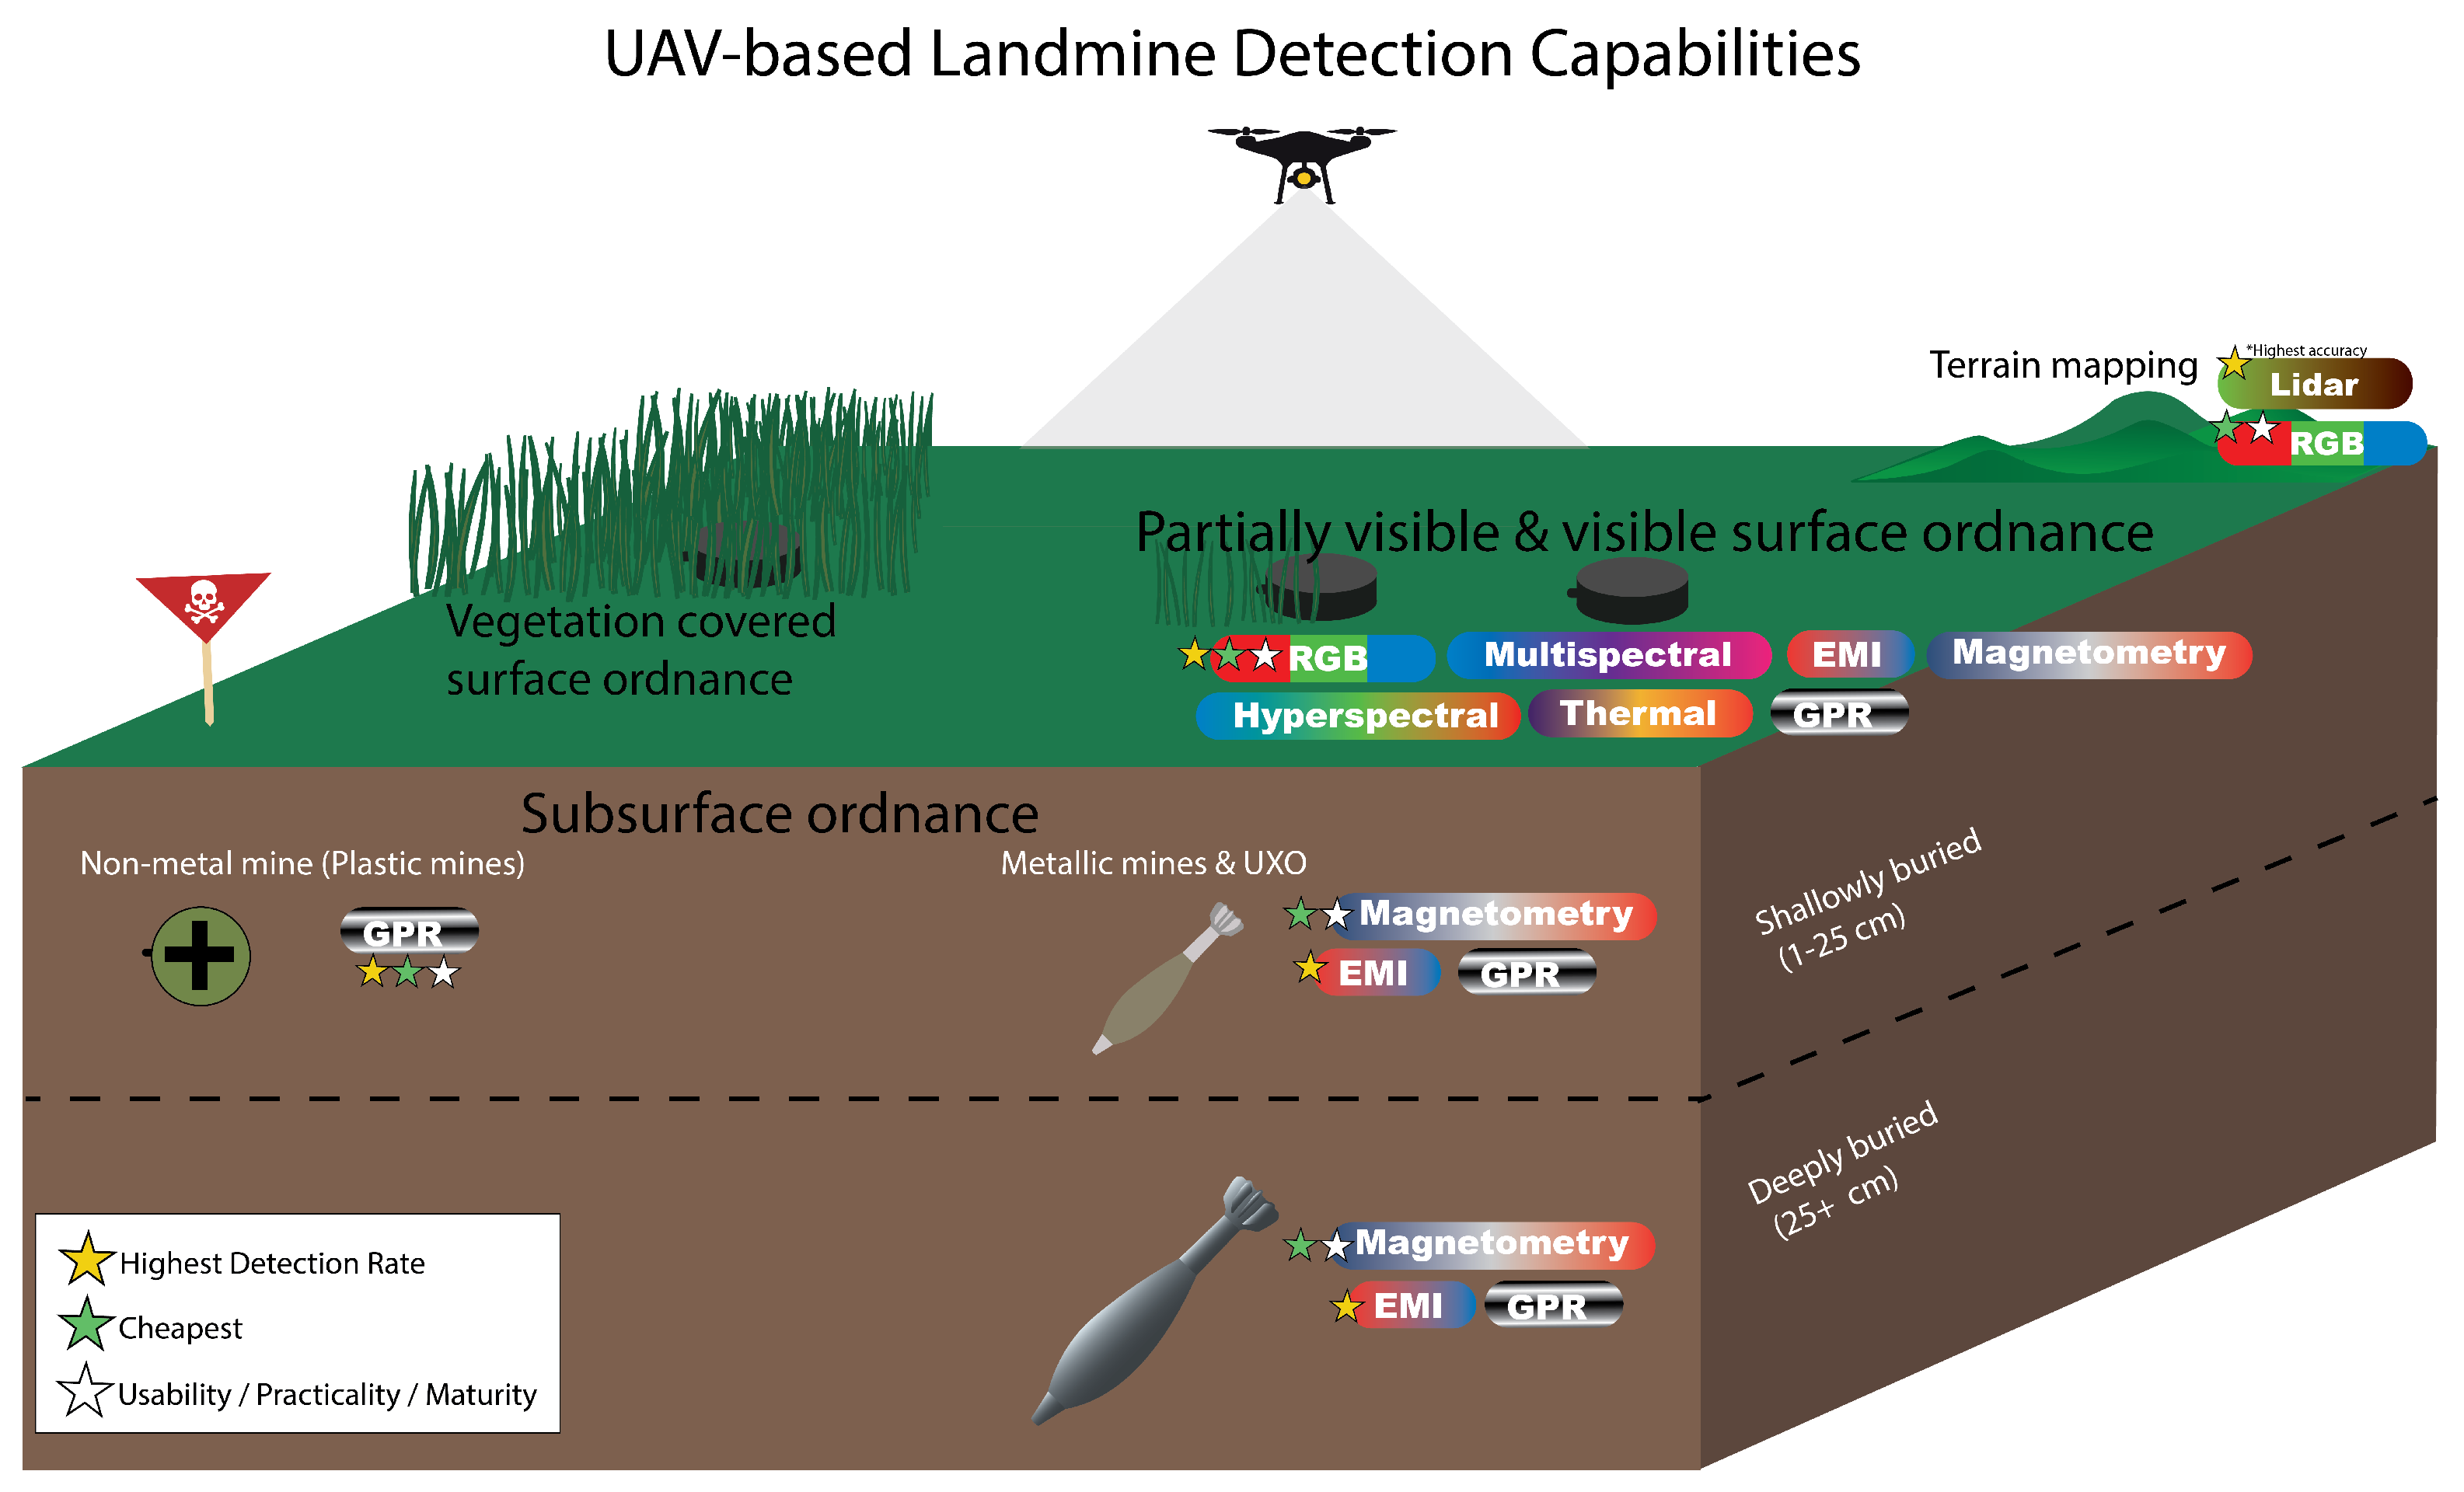

Disclaimer/Publisher’s Note: The statements, opinions and data contained in all publications are solely those of the individual author(s) and contributor(s) and not of MDPI and/or the editor(s). MDPI and/or the editor(s) disclaim responsibility for any injury to people or property resulting from any ideas, methods, instructions or products referred to in the content. |
© 2026 by the authors. Licensee MDPI, Basel, Switzerland. This article is an open access article distributed under the terms and conditions of the Creative Commons Attribution (CC BY) license.