


Highlights
What are the main findings?
- Cloud-type compositions are nearly identical between Northeast China Cold Vortex (NCCV) and non-NCCV situations, while microphysical properties differ markedly between the two, with the liquid water path (LWP) showing the most contrast and being evidently larger in NCCV than in non-NCCV cloud systems.
- In the NCCV domain, LWP and IWP tend to have stronger spatial heterogeneity than Re_liq and Re_ice. LWP gets notably larger in the northern to northwestern sectors, whereas IWP shows much higher variations in both radial and azimuthal dimensions.
What are the implications of the main findings?
- The statistical features and spatial structures of the microphysical characteristics of cloud systems associated with NCCV were revealed.
- The results provide a reference for a deeper understanding of the unique cloud and precipitation physical processes of NCCV cloud systems.
Abstract
The Northeast China Cold Vortex (NCCV), a typical synoptic-scale system in Northeast China, North China, and the Jianghuai region, frequently triggers thunderstorms, strong winds, and heavy precipitation, making it significant for meteorological monitoring and operational forecasting. However, the cloud microphysical properties of NCCV-associated cloud systems remain poorly characterized, as long-term cloud microphysical observations are limited. This study utilizes cloud products from the Moderate Resolution Imaging Spectroradiometer (MODIS) to analyze cloud-type frequencies and four key cloud microphysical properties under NCCV conditions: liquid effective radius (Re_liq), ice effective radius (Re_ice), liquid water path (LWP), and ice water path (IWP). Nearly identical cloud-type compositions are found for the two groups, NCCV and non-NCCV samples with similar cloud fractions on the regional scale, which are dominated by stratocumulus (Sc), altostratus (As), cumulus (Cu), and stratus (St), with Sc accounting for above 40% of total cloud occurrence. Yet microphysical properties differ markedly between these two groups. LWP shows the most contrast and it is evidently larger in NCCV than in non-NCCV cloud systems. As for the spatial structure of cloud microphysics in the NCCV domain, it is found that Sc, As, St, and nimbostratus (Ns) constitute the primary background, and Sc remains the dominant cloud type in almost all spatial sectors. LWP and IWP tend to have stronger spatial heterogeneity than Re_liq and Re_ice. LWP gets notably larger in the northern to northwestern sectors, whereas IWP shows much higher variations in both radial and azimuthal dimensions. These results reveal the statistical microphysical characteristics of cloud systems associated with NCCV from the perspective of satellite observations, providing a reference for a deeper understanding of their unique cloud and precipitation physical processes.
1. Introduction
The Northeast China Cold Vortex (NCCV) is a major warm-season synoptic system affecting Northeast China and adjacent regions. It is generally characterized by a cold-core cyclonic circulation in the mid to upper troposphere, usually accompanied by a closed geopotential-height contour near 500 hPa and a vortex center located over Northeast China or nearby areas. NCCV often persists for several days, moves slowly, and influences broad regions through persistent rainfall, localized severe convection, low-temperature events, and other hazardous weather. Because of these impacts, the definition, identification, climatology, and weather effects of NCCV have long been central topics in studies of mid- and high-latitude weather systems in China [1,2,3,4,5,6,7,8].
Previous studies have mainly examined NCCV from synoptic and dynamical perspectives. The formation and maintenance of NCCV have been linked to blocking circulation, Rossby wave activity, cold-air intrusions, terrain effects, transient eddy forcing, and large-scale teleconnection patterns [2,6,9,10]. Objective identification studies have further quantified the occurrence frequency, duration, active regions, and seasonal variations of NCCV, especially during May–August, when NCCV is most relevant to warm-season precipitation over Northeast China [3,4,5]. These studies have established a relatively mature understanding of the synoptic evolution, circulation background, and climatological behavior of NCCV.
NCCV-related precipitation has also received considerable attention. Case studies and diagnostic analyses have shown that NCCV precipitation is closely associated with moisture transport, vertical motion, convective instability, potential-vorticity evolution, and the interaction between cold-vortex circulation and embedded mesoscale systems [11,12,13,14,15,16,17]. These studies have clarified many aspects of rainfall formation under NCCV backgrounds. However, most of them focus on precipitation processes and circulation conditions, while the cloud physical characteristics of NCCV cloud systems, especially their cloud microphysical properties, remain less systematically documented.
Cloud microphysical properties provide important information on cloud development, precipitation formation, and radiative effects. Cloud effective radius and cloud water path are key optical and microphysical quantities because they are directly related to cloud particle size, condensed water amount, and cloud radiative behavior [18,19,20,21]. Therefore, examining NCCV cloud systems from a microphysical perspective can complement traditional circulation and precipitation-based analyses and provide a more complete description of cloud physical processes within cold-vortex systems.
Existing studies on NCCV cloud microphysics are mainly based on individual cases. Aircraft observations of an NCCV convective cloud band revealed pronounced variability in both macrophysical and microphysical cloud properties. The observed cloud band contained abundant supercooled liquid water, high ice-particle concentrations, and differences in particle size distributions under different dynamical conditions [22]. CloudSat-based analyses further documented the vertical structures of convective cloud bands associated with cold vortex, including stage-dependent echo structures, dry-air intrusion, and vertical layering of ice and liquid water contents [23]. Shi et al. [24] used multiple datasets, including CloudSat radar observations, to reconstruct the three-dimensional structure and precipitation evolution of an atypical NCCV case. More recent aircraft measurements also showed distinct vertical variations in particle number concentration, liquid water content, particle spectra, and hydrometeor types within an NCCV cloud system [25]. Recent satellite-based work has also examined the typical precipitation structures and microphysical characteristics of NCCV systems using GPM dual-frequency precipitation radar observations [26]. These studies provide useful case evidence, but they cannot fully describe the statistical microphysical characteristics of NCCV cloud systems.
Satellite observations have enabled broader statistical analyses of cloud microphysical properties. The bispectral retrieval framework established by [18] provides the theoretical basis for retrieving cloud optical thickness and effective particle radius from reflected solar radiation. MODIS cloud products further provide cloud optical and microphysical variables, including optical thickness, effective particle radius, and water path for liquid and ice clouds [19,21,27]. Based on MODIS observations, ref. [28] showed that effective-radius retrievals can differ among spectral bands and are sensitive to cloud regime, optical thickness, and horizontal heterogeneity. Using CloudSat/CALIPSO data, ref. [29] characterized the vertical structures of cloud microphysical properties for different cloud types over East Asia. These studies demonstrate the value of satellite observations for cloud microphysical statistics, but their samples generally include multiple weather regimes and do not isolate NCCV as a specific synoptic background.
Two issues motivate this study. Existing studies of NCCV cloud microphysics have mainly focused on individual cases, so multi-event statistical evidence remains limited. In addition, broader satellite-based studies usually describe regional or global cloud statistics without explicitly separating NCCV backgrounds. Therefore, the cloud microphysical characteristics and internal spatial organization of NCCV cloud systems remain insufficiently documented.
To address these issues, this study uses MODIS satellite cloud products, identified NCCV samples, and non-NCCV samples constrained by similar cloud fractions. We examine cloud-type composition, cloud microphysical differences, characteristics of different cloud types, and spatial structures within NCCV cloud systems. We first compare cloud types and microphysical properties between NCCV and non-NCCV conditions and test the statistical significance of the observed differences. We also assess how these differences vary among cloud types. For spatial structure analysis, we construct an NCCV spatial framework by normalizing each NCCV to its equivalent radius and analyze cloud-type frequency and microphysical properties across radial zones and azimuthal sectors. By examining cloud-type distributions and microphysical properties in a common NCCV framework, this study provides satellite-based statistical evidence for understanding the cloud physical characteristics of NCCV systems.
2. Data and Methods
2.1. Data Sources and Cloud Parameters
This study analyzes cloud microphysical properties associated with NCCV using cloud products from the Moderate Resolution Imaging Spectroradiometer (MODIS) aboard the Aqua satellite. MODIS provides multispectral observations in visible, near-infrared, and thermal infrared bands, enabling the retrieval of cloud-top, optical, thermodynamic, and microphysical properties [19,21,27].
We used the MODIS/Aqua Level-3 daily atmosphere product MYD08_D3, Collection 6.1. This product provides daily global gridded atmospheric variables at a spatial resolution of 1° × 1°, including cloud fraction, cloud optical thickness, cloud effective radius, cloud water path, cloud phase, and related atmospheric parameters [30]. MYD08_D3 aggregates quality-controlled pixel-level retrievals onto a regular daily grid, making it suitable for regional statistical analyses of cloud properties for synoptic backgrounds.
The study period spans April–August of 2020–2024, corresponding to the main warm season activity period of NCCVs. For each day, MODIS cloud variables were extracted over the study domain. The classification of these daily samples into NCCV and non-NCCV groups is described in the following section.
In addition to MODIS cloud products, this study uses the 500 hPa geopotential height field from ERA5 reanalysis to characterize the circulation structure and horizontal scale of each NCCV [31]. The 500 hPa level is commonly used in NCCV identification because it is typically manifested as closed cold-core cyclonic systems in the middle troposphere [3,4,5]. In this study, the 500 hPa geopotential height field is used to determine the vortex-center position and the outer closed geopotential-height contour. The area enclosed by this contour is then converted into an equivalent radius, which provides the geometric basis for the NCCV spatial analysis.
We selected four MODIS cloud microphysical variables: Re_liq, Re_ice, LWP, and IWP. These variables represent two complementary categories of cloud microphysical information. Re_liq and Re_ice describe the characteristic particle size of liquid and ice clouds, respectively, whereas LWP and IWP describe the column-integrated liquid and ice condensate amounts. Hereafter, cloud effective radius (Re) refers to Re_liq and Re_ice in a general sense. Liquid water path (LWP) and ice water path (IWP) denote the column-integrated liquid and ice condensate amounts, respectively, with units of . Cloud water path (CWP) is used only as a collective category referring to LWP and IWP; it is not treated as a separate retrieved or analyzed variable in this study. This separation allows us to examine whether NCCV-related cloud microphysical differences are mainly reflected in particle size, condensate loading, or both.
The retrieval of cloud optical thickness and effective particle radius from reflected solar radiation follows the bispectral framework established by Nakajima and King [18]. MODIS cloud products provide effective radius and water path for liquid and ice cloud phases based on cloud optical and microphysical retrieval algorithms [19,21]. Effective radius is closely related to cloud optical properties and radiative transfer, while cloud water path characterizes the bulk condensate amount within the atmospheric column. For ice clouds, the interpretation of effective radius also involves uncertainties associated with particle habit, mass, and projected area assumptions [20]. Together, Re_liq, Re_ice, LWP, and IWP provide a compact description of the particle size and condensate amount characteristics of NCCV cloud systems.
2.2. NCCV Samples
To characterize cloud microphysical statistics associated with NCCV, we assembled two sample sets representing NCCV and non-NCCV conditions. The NCCV days were taken from an existing NCCV event list, rather than identified independently in this study. The event list was constructed using ERA5 500 hPa geopotential-height fields following commonly used synoptic and objective identification methods for NCCV. In these methods, an NCCV is generally identified as a cold-core cyclonic circulation in the middle troposphere with a closed geopotential-height contour near 500 hPa, and the 500 hPa geopotential-height field is used to determine vortex occurrence, center position, and closed-contour structure [3,4,5,7,10,32].
The event records include the year, month, day, vortex-center longitude and latitude, the outermost closed geopotential-height contour value, the minimum geopotential-height contour value, their difference, the maximum anomaly of the closed contour relative to climatology, and the anomaly at the vortex center. These fields provide the basis for selecting NCCV days, defining the vortex-center position, and determining the outer closed contour used for equivalent-radius normalization. Because this study focuses on cloud microphysical statistics rather than developing a new NCCV identification algorithm, the existing event list was used as the NCCV sample basis.
We compared NCCV and non-NCCV samples over an East Asian domain spanning 10°–55°N and 70°–140°E. This domain covers Northeast China and adjacent regions influenced by NCCV, while remaining broad enough to provide stable regional cloud statistics.
Cloud fraction can strongly affect the statistical distribution of cloud microphysical properties. Therefore, when selecting non-NCCV samples, we applied a cloud fraction constraint to reduce the influence of different overall cloudiness between the two groups. Here, CA denotes the cloud fraction at the MYD08_D3 grid-cell scale. For each NCCV day, we calculated four cloud fraction metrics over the East Asian domain: the domain mean cloud fraction and the proportions of grid cells with a cloud fraction above 0.7, 0.8, and 0.9. These metrics are defined as follows:
and
where denotes the cloud fraction of grid cell i, N denotes the number of valid grid cells in the domain, is an indicator function, and denotes the fraction of grid cells exceeding threshold t.
We then calculated the mean and standard deviation of each cloud fraction metric from the NCCV samples. The same four metrics were calculated for all candidate non-NCCV days. A candidate non-NCCV day was retained if its domain mean cloud fraction fell within one standard deviation of the NCCV day distribution and its values satisfied broader tolerance ranges:
and
where and are the mean and standard deviation of the domain mean cloud fraction for NCCV days, and and are the corresponding statistics of . The tolerance factor was set to 2 or 3 depending on the threshold-based metric. The stricter constraint on ensured comparable overall cloudiness between the two groups, while the broader constraints on retained sufficient variability in cloud spatial structure.
The original NCCV day list contained 218 NCCV days during April–August 2020–2024. However, MYD08_D3 data were unavailable for 5–7 April 2022. Therefore, 215 MODIS-available NCCV days, corresponding to 49 distinct NCCV events, were used for the MODIS-based cloud microphysical analysis. The selected non-NCCV control sample included 346 days. The 49 NCCV events had a mean duration of 4.39 days, a median duration of 3 days, and a duration range of 3–11 days.
2.3. Cloud-Type Classification
To examine how cloud microphysical properties vary among cloud types, this study employs the International Satellite Cloud Climatology Project (ISCCP) nine type cloud classification. The ISCCP scheme classifies clouds using cloud top pressure (CTP) and cloud optical depth (COD), thereby combining information on cloud vertical position and optical thickness [33]. This CTP–COD framework has been widely used in satellite-based cloud climatology and in comparisons among ISCCP, MODIS, and other satellite cloud products [34].
Following the ISCCP framework, clouds are first divided into high, middle, and low categories according to CTP. Within each height category, clouds are further divided by COD into optically thin, intermediate, and thick classes. Combining the three CTP categories with the three COD categories yields nine cloud types: cirrus (Ci), cirrostratus (Cs), deep convective clouds (Dc), altocumulus (Ac), altostratus (As), nimbostratus (Ns), cumulus (Cu), stratocumulus (Sc), and stratus (St). This classification provides a consistent basis for subsequent analysis in different cloud types.
2.4. Statistical Scheme
We characterize the statistical distributions of cloud microphysical properties using probability density functions (PDFs). For a random variable X representing a cloud microphysical property, its PDF satisfies
and
The PDF describes the full distributional shape of a variable, including its central tendency, dispersion, skewness, and tail behavior. Compared with simple comparisons of means or extremes, PDF analysis captures more complete differences in cloud microphysical distributions. Accordingly, we construct PDFs for NCCV and non-NCCV samples and compare the distributional differences of each cloud microphysical variable under the two weather backgrounds.
To quantify differences between two PDFs, we use the first-order Wasserstein distance. The Wasserstein distance originates from optimal transport theory and measures the minimum cost required to transform one probability distribution into another [35,36]. For two probability distributions P and Q, the first-order Wasserstein distance is defined as
where denotes the set of all joint distributions with marginals P and Q. Unlike conventional scalar statistics, the Wasserstein distance accounts for the displacement of probability mass along the variable axis and therefore captures both location and shape differences between distributions.
Because the four cloud microphysical variables have different units and magnitudes, we normalize the Wasserstein distance by the standard deviation of each variable:
where is the standard deviation of the corresponding variable calculated from the pooled NCCV and non-NCCV samples. This normalization permits direct comparison of distributional differences among Re_liq, Re_ice, LWP, and IWP. Hereafter, unless otherwise specified, “Wasserstein distance” refers to the normalized Wasserstein distance.
To evaluate the statistical significance of distributional differences between NCCV and non-NCCV samples, we apply a month-stratified nonparametric permutation test [37,38]. This method builds an empirical null distribution of the normalized Wasserstein distance by reshuffling sample labels while preserving the monthly sampling structure. Specifically, NCCV and non-NCCV labels are randomly exchanged only within the same month, and the original monthly sample sizes of the two groups are retained. The permuted samples from April to August are then pooled, and a single full-period normalized Wasserstein distance is recalculated. This procedure is repeated 500 times to construct the stratified null distribution.
The reported standardized statistic and permutation p-value are derived from this full-period stratified null distribution, rather than from an average or sum of monthly statistics. Details of the test statistic, monthly label permutation, null distribution, z-value, and p-value are provided in Appendix A.
Because several NCCV days can belong to the same synoptic event, daily NCCV samples should not be interpreted as fully independent event realizations. To examine the sensitivity of the distributional results to event-level dependence, we further conducted an event-pooled bootstrap analysis. In each bootstrap realization, the 49 NCCV events were resampled with replacement as complete units, and all valid MODIS samples within each selected event were retained. The 346 non-NCCV control days were also resampled with replacement. The normalized Wasserstein response index was then recalculated using the same definition as in the main distributional analysis. This procedure was repeated 500 times to estimate the uncertainty range of the response index under event-level resampling.
As a more conservative sensitivity test, we also compared event-mean NCCV values with control-day and control-block means. In this comparison, each NCCV event contributed one equally weighted mean value, and temporally continuous control days were additionally grouped into consecutive control blocks. This test was used to assess whether the distributional contrasts could also be interpreted as stable shifts in event-mean microphysical properties.
3. Results
3.1. Cloud-Type and Cloud Microphysical Features of NCCV
All subsequent cloud-type analyses are based on the nine ISCCP cloud types introduced in Section 2.3: Ci, Cs, Dc, Ac, As, Ns, Cu, Sc, and St.
To characterize the cloud structure and microphysical features associated with NCCV, the frequency distributions of the nine cloud types were first compared between NCCV and non-NCCV samples. The constraint on similar cloud fractions is described in the Methods and is not repeated here. Shown in Figure 1, both exhibited broadly similar cloud-type compositions. Sc, As, Cu, and St dominated in both NCCV and non-NCCV, with Sc occupying the highest rank in two samples. Sc frequency was about 42.5% in the NCCV sample and 44% in the non-NCCV sample, exceeding 40% in both cases. By contrast, Ci, Dc, and Ac appeared much less often. Differences in cloud-type composition between the two samples were minor. The NCCV sample had slightly higher frequencies of Ci, Cs, Dc, Ns, and St, while the non-NCCV sample had slightly higher frequencies of Sc and Cu. However, these deviations were small relative to the dominant cloud-type pattern.
Figure 1.
Frequency distributions of the nine cloud types in NCCV and non-NCCV. The bar height denotes the frequency of each cloud type in the corresponding sample. The frequency is calculated as the ratio of valid pixels of each given cloud type to all valid cloud-type pixels.
After the comparison of cloud-type compositions between NCCV and non-NCCV, the distributions and distribution differences of Re_liq, Re_ice, LWP, and IWP were examined.
Although the overall distribution shapes were similar, differences emerged in specific portions of the property distributions in Figure 2. For cloud effective radius (Re, including Re_liq and Re_ice), deviations were confined to particular radius intervals, indicating that NCCV conditions did not produce a uniform shift of the entire particle size distribution. In contrast, LWP showed more pronounced deviations across a broader range of values, implying that LWP provided the strongest signal among the microphysical differences. The PDF of IWP remained near zero across most of its range, indicating no consistent overall shift between the two samples. This aggregate behavior describes the pooled NCCV and non-NCCV distributions only and does not address whether IWP varies among cloud types or across vortex-relative locations within NCCV. Together, these findings indicate that, for samples with comparable cloud-type backgrounds, NCCV-related microphysical differences manifest primarily in LWP rather than as synchronous changes across all microphysical properties.
Figure 2.
Probability density distributions of and differences in major cloud microphysical properties under NCCV and non-NCCV conditions. (a) Probability density functions (PDFs) of cloud effective radius (Re). (b) PDFs of cloud water path (CWP). (c) PDF differences (PDF) of Re. (d) PDF differences (PDF) of CWP. Here, Re refers collectively to Re_liq and Re_ice, and CWP refers collectively to LWP and IWP. The units are m for Re_liq and Re_ice and for LWP and IWP. Red and blue curves denote liquid and ice phase properties, respectively. Dashed and solid curves denote NCCV and non-NCCV samples, respectively. Here, PDF = PDFNCCV − PDFnon−NCCV.
To quantify these differences, a month-stratified permutation test was applied. Within each month, the NCCV and non-NCCV labels were randomly shuffled 500 times to construct a null distribution of the difference magnitude. A standardized statistic, z, was then computed to locate the observed difference within the null distribution, and a permutation-based p-value was calculated to express the probability of obtaining the observed difference or a larger one under random relabeling.
The permutation test showed that the magnitude of microphysical differences varied considerably across properties in Figure 3. LWP exhibited the largest aggregate distributional difference between NCCV and non-NCCV conditions (, ), indicating a strong LWP contrast under NCCV conditions. Re_ice also reached significance (, ), but its signal was weaker than that of LWP. Re_liq reached the significance level as well (, ), but its statistical evidence was much lower. By contrast, IWP did not differ significantly in the aggregate NCCV and non-NCCV comparison (, ), indicating that the pooled IWP distribution does not show a consistent domain-wide shift between the two samples. This aggregate nonsignificance should not be interpreted as spatial uniformity within NCCV or as an absence of cloud-type-dependent IWP differences. Instead, it indicates that IWP differences may vary in sign and magnitude across cloud types and vortex-relative locations when all samples are pooled.
Figure 3.
Permutation test results for the overall differences in cloud microphysical properties between NCCV and non-NCCV conditions. The upper panels show the null distributions of the differences in liquid effective radius, ice effective radius, LWP, and IWP. Solid curves denote the null distributions generated from 500 month-stratified random permutations, and dashed vertical lines denote the observed differences. Gray dashed and dash-dotted lines denote the 95th and 99th percentile thresholds of the null distribution, respectively. The lower panel shows the standardized statistic z and the permutation-based p-value for each property.
To examine whether the distributional contrasts between NCCV and non-NCCV samples were dominated by a small number of long-lived NCCV events, we further conducted an event-level bootstrap sensitivity analysis. The 215 MODIS available NCCV days corresponded to 49 distinct NCCV events. The event pooled bootstrap showed that the original Wasserstein response indices of all four variables fell within the corresponding 95% confidence intervals. The bootstrap mean response indices were 0.0025 for Re_liq, 0.0042 for Re_ice, 0.0064 for LWP, and 0.0039 for IWP. LWP retained the largest event-level distributional contrast, followed by Re_ice. This result indicates that the main Wasserstein distributional distances between NCCV and non-NCCV samples were not controlled by a few long-lived NCCV events.
However, the more conservative event mean and control-block mean comparisons produced wider uncertainty, and the signed mean difference confidence intervals between NCCV and non-NCCV samples crossed zero for all four variables. Therefore, the differences between NCCV and non-NCCV samples reported here should be interpreted primarily as distributional contrasts rather than as robust shifts in event mean microphysical properties.
For similar cloud-type structures, microphysical differences between NCCV and non-NCCV samples are uneven across properties. LWP exhibits the clearest overall signal, followed by Re_ice. The difference in Re_liq is weaker, and IWP is not significant in the aggregate statistics. The lack of a significant aggregate IWP difference does not imply that IWP is insensitive to NCCV conditions. Rather, it reflects that IWP differences vary in sign and magnitude among cloud types and may partly compensate when all cloud types are pooled.
Within a single cloud-type classification framework, mean values of Re_liq, Re_ice, LWP, and IWP were computed for each cloud type. For each bin, the difference was defined as the NCCV mean minus the non-NCCV mean for the same cloud type. This approach determines whether overall differences reflect consistent changes across multiple cloud types or are restricted to specific cloud-type conditions.
Differences in Re across cloud types were generally small in Figure 4. Re_liq varied little and was close to zero in most cloud types. Re_ice showed clearer but inconsistent differences across cloud types. In some types, the NCCV sample had slightly larger Re_ice, whereas in Sc, St, and Ns the differences were negative. These patterns indicate that particle size changes depend on specific cloud types rather than on a uniform shift across all cloud types.
Figure 4.
Re means in different cloud types of NCCV and non-NCCV, and differences in Re between NCCV and non-NCCV. Rows in each panel denote high, middle, and low clouds, and columns denote thin, moderate, and thick optical-depth categories, corresponding to Ci, Cs, Dc, Ac, As, Ns, Cu, Sc, and St. The left and middle columns show the NCCV and non-NCCV means, respectively. The right column shows the mean difference, defined as NCCV minus non-NCCV. Numbers in parentheses indicate the number of valid samples in each cloud-type bin.
Figure 5 shows that CWP differences varied markedly by cloud type. In terms of raw mean differences, LWP was higher in the NCCV sample for most cloud types, with larger increases in Cs, Dc, Ns, As, and Sc. This pattern indicates that the rise in LWP was not confined to a single cloud class. IWP exhibited a more complex dependence on cloud type: positive differences appeared mainly in several thick-cloud categories, while weak or negative differences occurred in Sc, Cu, and Ac. Thus, although some cloud types show substantial IWP changes, these cloud-type-dependent differences do not combine into a consistent aggregate signal when all cloud types are pooled.
Figure 5.
Means of CWP (LWP and IWP) for different cloud types in NCCV and non-NCCV samples, and their differences between the two samples. LWP and IWP are shown separately, and cloud water path (CWP) is used only as a collective category referring to LWP and IWP. Same as Figure 4, but for water-path properties.
To test whether the mean differences in each cloud type exceeded random fluctuations, the month-stratified permutation test was applied separately to each cloud type. The standardized statistic z was used to locate the observed difference within the null distribution. The p-value was reported as the probability of obtaining the observed difference or a larger one under random relabeling.
As is shown in Figure 6, the permutation test in different cloud types indicates that differences in Re vary by cloud type. Re_liq achieved statistical significance in several cloud types, but the associated z-values were generally small, indicating limited statistical evidence. In contrast, Re_ice reached significance in a larger number of cloud types and produced clearer signals in Ns, Ci, Cs, and St. This pattern suggests that Re_ice shows more distinct differences across cloud types than Re_liq.
Figure 6.
Statistical signal magnitude of mean microphysical differences among different cloud types between NCCV and non-NCCV. The upper row shows the dimensionless difference index for each cloud type, and the lower row shows the corresponding standardized statistic z. The z-value is calculated from the null distribution generated by 500 month-stratified random permutations. The p-value represents the probability of obtaining the observed or a larger difference under random relabeling. The symbols “*” and “**” indicate and , respectively.
For CWP properties, significant LWP differences occurred primarily in Ci, As, Cu, Sc, and Ac. Sc and As exhibited relatively high z-values, indicating that LWP differences remained relatively stable across several major cloud types. The significance pattern for IWP was more dispersed. Ci, Cs, Ac, As, and Cu reached the significance threshold, while Sc and Ns did not show significant positive differences. Considering the mean differences, this pattern implies that IWP differences vary in both sign and magnitude among cloud types, which helps explain why IWP does not produce a significant aggregate difference. Thus, the cloud-type analysis reveals IWP sensitivity that is partly masked in the aggregate distributional comparison.
The PDFs, permutation tests, and cloud type analyses collectively show that CWP, particularly LWP, exhibits the clearest microphysical difference in NCCV. This signal is most prominent in the aggregate statistics and is confirmed across multiple cloud types. Changes in Re are weaker overall, although Re_ice shows clearer signals than Re_liq. IWP, by contrast, depends strongly on cloud type: its mean differences vary across types and therefore do not produce a consistent aggregate signal, even though several individual cloud types show evident IWP differences. In sum, when cloud-type structure is similar, NCCV-associated microphysical changes are primarily marked by increased LWP, with more localized adjustments in Re and IWP confined to specific cloud types.
3.2. Spatial Structure of Cloud Microphysical Characteristics in the NCCV Domain
The previous section demonstrated that NCCV and non-NCCV samples still differ in their microphysical properties under similar cloud fraction backgrounds. This contrast is most pronounced for LWP, while Re_liq, Re_ice, and IWP vary more with cloud type. Furthermore, this study examines the internal spatial structures of NCCV cloud systems. We first define a normalized NCCV coordinate framework and map the spatial distribution of different cloud types. This framework is then used to characterize the overall spatial structures of Re_liq, Re_ice, LWP, and IWP, quantify their radial and azimuthal heterogeneity, and compare their spatial anomaly patterns using Spearman correlation coefficients. Finally, the mean microphysical properties are summarized for different cloud types, and their spatial structures are examined within individual cloud types.
Previous cold vortex composite studies have commonly used the vortex center as the reference point and analyzed the mean structure within a fixed-size domain [32]. This method is effective for large-scale circulation analysis, but it is less suitable for examining cloud microphysical properties inside the vortex body. An individual cold vortex can differ substantially in horizontal scale; therefore, for smaller vortices, a fixed-size domain may include cloud systems or surrounding environments that are not part of the vortex itself. To reduce the impact caused by changes in the scale of the cold vortex itself, this study uses an equivalent-radius normalization to map NCCV cases of different sizes onto a common spatial framework relative to the NCCV.
ERA5 500 hPa geopotential height data at 08:00 were used to identify the outermost closed contour for each NCCV case, with adjustments applied when necessary. The area enclosed by this contour defines the NCCV region. If the area of the NCCV is A, then R is the radius of a circle whose area is equivalent to this area.
For any point in the NCCV domain, the horizontal distance from the vortex center is denoted by d. The normalized radius r is then defined as
Here, r is a dimensionless coordinate that denotes a point’s position relative to the NCCV scale. This normalization is applied for internal spatial structure analysis. It does not change the physical size of any NCCV case. Instead, it maps NCCV of different absolute sizes onto a common relative radius coordinate, providing a consistent reference for radial and azimuthal statistics.
Using this framework, we subdivided the NCCV domain into two dimensional spatial cells. The normalized region was divided into three radial layers: inner (), middle (), and outer (). Then it was azimuthally divided into eight sectors: E, NE, N, NW, W, SW, S, and SE. These radial and azimuthal divisions yielded 24 spatial cells, which were used to compute cloud-type frequencies and microphysical properties at different NCCV locations. All subsequent references to radial position denote r rather than geographic distance.
We also evaluated the sampling support of the 1° MYD08_D3 grid for this normalized 24-cell framework. For the 212 NCCV days with both valid MODIS retrievals and matched ERA5 closed-contour masks, the equivalent radius had a mean of 635.1 km, a median of 599.3 km, and a 10th–90th percentile range of 368.9–957.5 km. The grid-support diagnostic showed that each inner-sector cell contained 1.8–3.7 MYD08_D3 1° grid cells per centered-mask day on average, while the corresponding ranges were 4.7–10.1 for the middle layer and 8.2–17.8 for the outer layer. Across the 212-day composite, even the sparsest inner-sector cells accumulated 378 grid samples. Therefore, the normalized framework is used to describe broad radial–azimuthal composite patterns, whereas localized anomalies in individual inner-sector cells are interpreted cautiously because of the coarse 1° sampling.
The equivalent-radius normalization is also a geometric simplification. It does not fully preserve the asymmetric shape of individual NCCV systems, such as elliptical structures, frontal extensions, or elongated cloud bands. Therefore, the normalized framework is intended to support comparable vortex relative composite statistics across many NCCV cases, rather than to reconstruct the exact geometry of each individual vortex.
All NCCV samples were mapped to the common normalized spatial framework, and all valid pixels were pooled for statistics. For cloud-type frequency, pixel counts of each cloud type were accumulated within each NCCV spatial cell. The overall frequency of cloud type k was defined as the ratio of valid pixels of type k to all valid cloud-type pixels in the NCCV sample.
The conditional spatial distribution of each cloud type was computed across the 24 spatial cells to determine where it is concentrated in the NCCV domain. Let denote the number of pixels of cloud type k in radial layer r and azimuthal sector d. The conditional spatial distribution is defined as follows:
where is the total number of pixels of cloud type k in all spatial cells. This metric gives the probability that a pixel falls in a particular spatial cell, conditional on the pixel belonging to cloud type k. Thus, it characterizes the spatial distribution of cloud type k within the vortex rather than its absolute occurrence frequency. Because the outer cells cover larger areas than the inner cells, directly comparing can overemphasize the outer region owing to geometric area effects. To mitigate this bias, the conditional probability was normalized by the fractional area of each spatial cell, , yielding the area normalized conditional probability density:
When , cloud type k is more concentrated in that spatial cell than its area fraction predicts. When , cloud type k occurs less frequently in that cell.
Microphysical properties were composited using the same normalized spatial framework. Let denote a valid pixel value of a given property within spatial cell for cloud type k. The corresponding spatial mean is calculated as follows:
where is the number of valid pixels. Thus, the microphysical means reported in this study are pooled pixel-level composites from all NCCV samples that meet the spatial cell, cloud type, and variable validity criteria. This pooling maximizes use of available samples and maintains a consistent statistical framework across spatial cells and cloud types. Because a pooled pixel-level composite may give greater weight to larger or longer-lived NCCV events, we further evaluated event support for each vortex-relative spatial cell. This diagnostic was performed for the 212 NCCV days for which both valid MODIS retrievals and matched ERA5 closed-contour masks were available. For each of the 24 spatial cells and each microphysical property, we counted the number of distinct NCCV events contributing valid samples and calculated the maximum fractional contribution from a single event.
We also constructed an event normalized spatial composite as a sensitivity test. In this analysis, the mean value of each property was first calculated within each NCCV event and each spatial cell. These event-level cell means were then averaged with equal event weight. This procedure reduces the influence of events with more valid pixels or longer duration and provides a direct comparison with the original pixel-pooled composite.
Based on the normalized framework, the following analysis first describes the spatial structure of cloud types within NCCV, then examines the overall spatial structures and radial–azimuthal variability of Re_liq, Re_ice, LWP, and IWP, and finally analyzes the means and spatial structures of these microphysical properties in different cloud types.
Figure 7 presents two complementary metrics for the nine cloud types: overall frequency and area normalized conditional probability density. The left panel gives the overall frequency distribution of cloud types inside NCCV. It shows that the NCCV cloud system’s background is dominated primarily by Sc, As, St, and Ns. Sc occurred most frequently, with a frequency of 0.270, followed by As, St, and Ns, with frequencies of 0.184, 0.175, and 0.135, respectively. All other cloud types had frequencies below 0.10, with Ci, Ac, and Cu especially rare. These values indicate that the NCCV background is primarily composed of stratiform, relatively thick clouds in the low and middle layers.
Figure 7.
Cloud-type frequency and area normalized conditional probability density of the nine cloud types in the NCCV domain. The bar chart shows the overall frequency of each cloud type in NCCV. The polar plots show the area normalized conditional probability density of each cloud type across the 24 spatial cells. Red colors indicate that the cloud type is relatively concentrated in the corresponding spatial cell.
Overall frequency measures how common a cloud type is, while conditional probability density characterizes its spatial distribution within the NCCV body. The area normalized conditional probability density indicates that cloud types occupy distinct preferred positions within the NCCV domain. Ci, Ac, and Cu concentrate primarily in the southern to southeastern sectors of the outer layer. Sc is more concentrated in the southwest of the outer layer. Dc tends to be mainly gathered on the east side of the inner layer of the NCCV.
The relative ranking of the nine cloud types within each spatial cell is shown in Figure 8, which identifies the dominant cloud types in each cell. The rankings across the 24 spatial cells indicate that the cloud-type composition of NCCV is generally stable. Sc ranked first in 23 of the 24 cells, reflecting that its dominance reflects a broad spatial pattern rather than a few localized concentrations. St, As, and Ns also occupied consistently high ranks in most cells, and together they form the primary cloud-type assemblage in the NCCV domain. In contrast, Ci, Ac, and Cu typically ranked lower, implying that although these types can be locally concentrated, they do not constitute the dominant cloud types in most cells.
Figure 8.
Relative ranking of the nine cloud-type frequencies across the 24 spatial cells in the NCCV domain. Each pie chart corresponds to one spatial cell defined by three normalized radial layers and eight azimuthal sectors. Colored sectors denote the frequency fraction of each cloud type within that cell, calculated as the ratio of pixels of a given cloud type to all valid cloud-type pixels in the same spatial cell.
Two figures collectively indicate the features of the NCCV cloud-type spatial structure. Sc, As, St, and Ns constitute the primary background cloud-type assemblage. Additionally, Sc is the most frequent type in nearly all spatial cells and thus represents the vortex’s most persistent dominant cloud type. Several low-frequency cloud types show pronounced local concentration, particularly in the southern or southeastern sectors of the outer layer. In other words, the NCCV cloud system combines a relatively stable dominant cloud-type composition with the spatial distribution of specific cloud types at particular NCCV positions. The following microphysical spatial analysis is performed within this cloud-type background.
The overall spatial structure of microphysical properties within NCCV was then examined. At this stage, the spatial means and standardized anomalies of Re_liq, Re_ice, LWP, and IWP were computed across the 24 NCCV spatial cells. The numeric value shown in each cell gives the original mean of the property. Cell color represents the standardized anomaly relative to the 24-cell mean for that property. Thus, the numbers convey the absolute magnitude of each property, and the colors indicate whether a given spatial cell is higher or lower than the NCCV mean state for that property.
Distinct structures among microphysical properties in the NCCV domain are shown in Figure 9. CWP properties exhibit markedly greater spatial heterogeneity than Re, with IWP showing the strongest variability and LWP the next most pronounced. IWP tends to be higher in the inner northern and southwestern portions of the composite and lower in the outer eastern sector, indicating combined radial and azimuthal contrasts. LWP is chiefly larger in the northern and northwestern sectors and smaller in the southern sector, which produces a marked azimuthal asymmetry. By contrast, Re_liq varies less in space and displays a pattern broadly opposite that of LWP. Larger Re_liq values occur mainly in the southern outer layer. This contrast indicates that regions with greater liquid water within the NCCV do not correspond to larger liquid droplet sizes. Re_ice shows relatively weak spatial fluctuations overall but a clearer radial gradient, increasing from the inner to the outer layer, especially in the northern and northwestern outer sectors.
Figure 9.
Spatial structures and standardized anomalies of overall cloud microphysical properties within NCCV. Each panel corresponds to one cloud microphysical property. Numbers denote the original mean values in each spatial cell, and colors denote standardized anomalies relative to the 24-cell mean of the same property. The units are m for Re_liq and Re_ice, and for LWP and IWP. Red and blue indicate positive and negative anomalies, respectively.
The radial and azimuthal analyses further quantify the spatial structures described above. In Figure 10, the upper row boxes show the spread of the eight azimuthal cell means within each radial layer, whereas the lower row boxes show the spread of the three radial layer means within each azimuthal sector. Thus, the box height provides additional information on within-layer azimuthal variability or within-sector radial variability.
Figure 10.
Radial and azimuthal variations of overall cloud microphysical properties in the NCCV domain. The upper and lower rows show variations among radial layers and azimuthal sectors, respectively. The statistics are calculated from property means in the 24 spatial cells rather than from raw pixel values. The units are m for Re_liq and Re_ice, and for LWP and IWP. In the radial panels, each box represents the eight azimuthal cell means within a given radial layer. In the azimuthal panels, each box represents the three radial cell means within a given azimuthal sector. Lines denote mean values, and error bars denote the dispersion among spatial cell means.
After radial averaging, IWP decreases from the inner to the outer layer, while Re_ice increases outward, indicating opposite radial trends between ice water amount and ice particle size. The relatively large IWP boxes in each radial layer further indicate that azimuthal differences remain evident even within the same radial zone. In contrast, Re_ice shows a clearer mean radial increase, while its within-layer spread is smaller, suggesting that its spatial variation is more strongly organized by radius than by direction.
LWP shows only a weak radial gradient, but its azimuthal variation is much clearer. Its mean values are larger from the northern to northwestern sectors and smaller in the southern sector. The azimuthal boxes further show that some sectors retain noticeable radial spread, but the dominant signal is the north–south contrast in the azimuthal mean. Re_liq also varies mainly with azimuth, with larger values from the southern to southeastern sectors. This pattern is broadly opposite to that of LWP, reinforcing the result that greater liquid water amount does not coincide with larger liquid droplet size.
Furthermore, the CV statistics in Table 1 quantify the spatial structures shown in Figure 10. IWP has the largest spatial CV, followed by LWP, whereas Re_liq and Re_ice show weaker spatial fluctuations. This result addresses a different question from the aggregate NCCV and non-NCCV comparison: the nonsignificant aggregate IWP difference indicates no consistent pooled between-sample shift, whereas the large spatial CV indicates strong internal IWP heterogeneity within the NCCV domain. The azimuthal/radial ratio further separates the dominant modes of variability: LWP and Re_liq are mainly controlled by azimuthal differences, Re_ice is more strongly radial, and IWP contains both radial and azimuthal contrasts. Together, Figure 10 and Table 1 show that the spatial heterogeneity of CWP properties is stronger than that of Re, and that the liquid and ice components differ in how their spatial variability is organized within the vortex. In particular, IWP shows a weak aggregate distributional difference between samples but a strong spatial-structure signal within NCCV.
Table 1.
Spatial coefficient of variation (CV) statistics for overall cloud microphysical properties in the NCCV domain. CV is calculated as the standard deviation divided by the mean. Spatial CV is calculated from the 24 NCCV spatial cells. Azimuthal CV and radial CV quantify variability among azimuthal sectors and radial layers, respectively. An azimuthal/radial ratio larger than 1 indicates stronger azimuthal variability, whereas a value smaller than 1 indicates stronger radial variability.
The event support diagnostic suggested that the 24-cell spatial composites were not dominated by a small number of NCCV events. Re_liq and LWP had at least 41 contributing events in each spatial cell, whereas Re_ice and IWP had at least 39 contributing events. The largest single event contribution was 7.77% for Re_liq and LWP and 9.59% for Re_ice and IWP, and no spatial cell exceeded the 15% single event contribution threshold. Thus, the main 24-cell composites were supported by multiple NCCV events rather than by a few large or long-lived cases.
The event normalized composite further confirmed the robustness of the broad spatial patterns. The Pearson correlations between the pixel-pooled and event normalized 24-cell means were 0.906 for Re_liq, 0.811 for Re_ice, 0.808 for LWP, and 0.680 for IWP. The corresponding Spearman correlations were 0.917, 0.767, 0.855, and 0.638, respectively. The spatial-CV ranking was unchanged after event normalization, remaining IWP > LWP > Re_liq > Re_ice. These results indicate that event weighting does not substantially alter the main spatial heterogeneity pattern, although some localized cells are sensitive to event weighting and should be interpreted cautiously.
To clearly summarize the overall microphysical spatial structure, we calculated Spearman correlation coefficients among the standardized spatial anomalies of Re_liq, Re_ice, LWP, and IWP across the 24 NCCV spatial cells. This can describe the spatial correspondence among different microphysical properties. In addition, we calculated the mean value of each microphysical property for each cloud type in the NCCV domain, without separating radial layers or azimuthal sectors.
Figure 11a shows that LWP and Re_liq are strongly negatively correlated in space, indicating that their relative high-value regions are spatially separated within the vortex. This result is consistent with Figure 9: LWP is larger mainly in the northern and northwestern sectors, whereas Re_liq is larger primarily in the southern outer layer. LWP and IWP show a weak to moderate positive correlation, suggesting that their high and low anomalies partly overlap in some spatial cells. By contrast, the correlation between IWP and Re_ice is weak, indicating that the spatial variation of ice water amount is not simply represented by the spatial variation of ice particle size.
Figure 11.
Spearman spatial correlations between microphysical properties and microphysical property means for each cloud type in the NCCV domain. (a) Spearman correlation coefficients among the standardized spatial anomalies of Re_liq, Re_ice, LWP, and IWP across the 24 spatial cells. Both the numbers and colors denote Spearman correlation coefficients. (b) Mean values of the four microphysical properties for each cloud type. Numbers denote original mean values, and colors denote row-standardized means calculated across cloud types separately for each microphysical property, i.e., within each row.
Figure 11b shows that the mean values of the four microphysical properties differ among cloud types. LWP is relatively large in Dc and Ns and is also elevated in St, whereas Cu has the lowest LWP mean. IWP shows larger values in St, Ns, and Dc, but much lower values in Cu, Ac, and Ci. Re_ice is relatively large in Cu and St, while Dc has the smallest mean value. For Re_liq, the cloud-type differences are weaker than those of LWP and IWP, with relatively larger values in Ci and Ac and smaller values in Dc and Ns. These property means describe the overall microphysical level of each cloud type in the NCCV domain and provide a baseline for interpreting the following specific spatial structures.
How these microphysical properties vary spatially within individual cloud types was then examined. In Figure 12, the numbers represent the original mean values for each cloud type and spatial cell, and the colors represent standardized spatial anomalies computed relative to the 24-cell mean for that same cloud type. These standardized anomalies are calculated independently for each cloud type. Therefore, color intensity indicates relative spatial variation within a cloud type and should not be interpreted as a direct measure of absolute anomaly magnitude across different cloud types.
Figure 12.
Spatial structures and standardized anomalies of each cloud type in the NCCV domain for Re_liq and Re_ice. The left and right panels show Re_liq and Re_ice, respectively. Numbers denote the original mean values in each spatial cell, and colors denote standardized anomalies relative to the 24-cell mean within the same cloud type. Red and blue indicate positive and negative anomalies, respectively.
Re spatial structures show clearer southern enhancement of Re_liq in low-cloud types, particularly in Cu, Sc, and St, where positive anomalies occur in the southern sectors or parts of the outer layer. By contrast, although Sc is the most frequent cloud type within the vortex, its Re_liq exhibits only weak spatial variation overall. Re_ice increases outward in several cloud types, especially in some middle to high and optically thick categories, which is consistent with the overall radial pattern of larger ice particle sizes from the inner to the outer layer. In sum, Re displays spatial variability, but its magnitude is modest and mainly appears as localized differences tied to particular cloud types and NCCV locations.
The analysis reveals pronounced spatial structures in both LWP and IWP, as shown in Figure 13. Larger LWP in the northern and northwestern sectors is evident mainly for As, Ns, and some optically thick cloud types. By contrast, low cloud types show LWP anomalies that are more localized and patchy. The reduced IWP in the outer eastern sector appears across most cloud types, indicating that this feature is relatively consistent. Conversely, a tendency toward higher IWP in the inner southwestern portion is more apparent in several frequent cloud types, including Sc and As. These results show that LWP and IWP differ not only among cloud types in their overall mean values, but also within the same cloud type across radial layers and azimuthal sectors.
Figure 13.
Spatial structures and standardized anomalies of LWP and IWP for each cloud type in the NCCV domain. Same as Figure 12, but for LWP and IWP properties.
Overall, the spatial structure of NCCV cloud systems can be described from both cloud-type and microphysical perspectives. Sc, As, St, and Ns constitute the primary cloud-type background in the NCCV domain, with Sc remaining the most frequent type in most spatial cells. The four cloud microphysical properties show distinct spatial structures. LWP and IWP exhibit stronger spatial heterogeneity than Re_liq and Re_ice. LWP is mainly characterized by a north–south azimuthal contrast, whereas IWP shows the largest spatial variability and contains both radial and azimuthal contrasts. Re_liq shows larger values in the southern to southeastern outer sectors, and Re_ice increases more clearly from the inner to the outer layer. Furthermore, the mean values and spatial patterns of these properties vary among cloud types. Together, these results characterize NCCV cloud systems from complementary perspectives of cloud-type composition and cloud microphysical organization.
4. Discussion
The comparison between NCCV and non-NCCV samples should be interpreted primarily as a distributional contrast under similar regional cloud-fraction conditions. The month-stratified permutation test indicates that the clearest difference occurs in LWP, while the differences in Re_ice and Re_liq are weaker and IWP does not show a significant aggregate difference. The event-level bootstrap suggests that the main distributional contrasts are not dominated by a few long-lived NCCV events. However, the event-mean and control-block sensitivity tests indicate that these contrasts should not be interpreted as robust shifts in event-mean values. Therefore, the NCCV-related differences identified in this study are better understood as changes in the statistical distributions of cloud microphysical properties, rather than as uniform event-scale mean changes. This point is important for interpreting the LWP result: the enhanced LWP signal represents a MODIS-based statistical contrast between the two sample groups and should not be directly equated with a deterministic liquid water increase in every NCCV event. Previous NCCV studies have documented cloud and precipitation structures in cold vortex environments using aircraft observations, CloudSat observations, case analyses, and GPM precipitation radar data [22,23,24,25,26]. The present study complements these studies by extending the analysis from individual events and precipitation structures to multi-year MODIS statistics of cloud microphysical properties under NCCV and non-NCCV conditions.
The spatial results should also be interpreted in terms of composite organization rather than exact vortex geometry. The equivalent-radius normalization allows NCCV cases with different horizontal scales to be compared within a common vortex-relative framework, and the event-support analysis indicates that the 24-cell composites are supported by multiple NCCV events. The event normalized composite further preserves the main spatial-variability ranking, suggesting that the broad spatial patterns are not simply produced by events with more valid pixels or longer duration. At the same time, the 1° MYD08_D3 grid and the use of an equivalent circular radius impose clear limits on spatial interpretation. This limitation is particularly relevant for small and less frequent cloud types such as Cu and Dc, whose cloud-type-specific microphysical signals may be more strongly affected by Level-3 spatial aggregation. The framework is suitable for identifying broad radial and azimuthal composite structures, such as the northwestern enhancement of LWP and the combined radial and azimuthal heterogeneity of IWP, but it should not be used to overinterpret localized anomalies in individual inner-sector cells or to reconstruct the detailed asymmetric shape of each vortex. This distinction also helps explain the behavior of IWP: its pooled NCCV and non-NCCV difference is not significant, whereas its cloud-type dependence and internal spatial heterogeneity remain evident within the NCCV domain. Future work should combine higher-resolution passive observations, active sensor measurements, and dynamical diagnostics based on reanalysis data to examine whether these composite microphysical structures are linked to moisture transport, vertical motion, cold air intrusion, and cloud-phase conversion within NCCV systems.
5. Conclusions
This study employed MODIS satellite cloud products, along with a catalog of Northeast China Cold Vortex (NCCV) events and matched non-NCCV samples with similar cloud fractions. The original NCCV day list contained 218 days, of which 215 days had available MYD08_D3 cloud microphysical retrievals and were used in the MODIS-based cloud microphysical analysis. These 215 NCCV days corresponded to 49 distinct NCCV events. The selected non-NCCV sample included 346 days. Based on these samples, we investigated the cloud-type composition, cloud microphysical features, and internal spatial structure of NCCV cloud systems. Four cloud microphysical properties were concerned, liquid water path (LWP), ice water path (IWP), liquid effective radius (Re_liq), and ice effective radius (Re_ice). The main findings are as follows.
- (1)
- The overall cloud-type compositions of the NCCV and non-NCCV samples are broadly similar. Both samples are dominated by Sc, As, Cu, and St, with Sc being the most frequent type and accounting for more than 40% in each sample. This result indicates that, under comparable regional cloud-amount conditions, the NCCV background does not fundamentally change the overall cloud-type distribution. However, the two samples still show clear differences in cloud microphysical properties. In the aggregated statistics, LWP exhibits the largest divergence, followed by Re_ice. The difference in Re_liq is relatively modest, whereas IWP does not show a significant aggregate difference between NCCV and non-NCCV samples. These results suggest that cloud-type frequency alone cannot fully characterize NCCV cloud systems, and that cloud microphysical properties provide additional information for distinguishing NCCV from non-NCCV clouds. Event-level sensitivity tests further indicate that these distributional contrasts are not dominated by a few long-lived NCCV events, although they should not be interpreted as robust shifts in event-mean microphysical properties.
- (2)
- The microphysical differences between NCCV and non-NCCV samples vary across cloud types. LWP is larger in the NCCV samples for several major cloud types, particularly Dc, Ns, As, and Sc, and therefore constitutes the most stable differentiating signal in the aggregated statistics. In contrast, differences in IWP, Re_ice, and Re_liq are more concentrated in specific cloud types. IWP differences are more cloud-type dependent and appear mainly in some optically thick cloud types, while changes in Re_ice and Re_liq are generally weaker and not fully consistent in sign across cloud types. Thus, the overall microphysical contrasts between NCCV and non-NCCV samples do not arise from a single cloud type alone, but rather depend on whether similar differences appear across several major cloud types.
- (3)
- In the NCCV domain, Sc exhibits the highest frequency in nearly all spatial cells and represents the most stable dominant cloud type. As, St, and Ns constitute the secondary cloud-type background. Compared with the regional statistics, where Sc, As, Cu, and St dominate, the relative importance of Ns increases inside the NCCV body, suggesting that the normalized NCCV interior is more closely associated with stratiform and mid-level optically thick clouds. Several cloud types with relatively low overall frequencies also show localized concentration, particularly in the outer southern and southeastern sectors. These results indicate that NCCV cloud systems feature both a stable dominant cloud-type combination and a distribution of individual cloud types within the vortex.
- (4)
- The four cloud microphysical properties show distinct internal spatial structures in the NCCV domain. LWP and IWP are more spatially heterogeneous than Re_liq and Re_ice, with IWP showing the strongest heterogeneity and exhibiting both radial and azimuthal contrasts. Therefore, the absence of a significant aggregate IWP difference does not contradict its strong internal spatial organization within the NCCV domain. LWP mainly displays an azimuthal asymmetry, with larger values in the northern to northwestern sectors and smaller values in the southern sector. Re_liq is also dominated by azimuthal variability, but its larger values mainly occur in the outer southern to southeastern sectors, indicating that high-LWP regions do not necessarily correspond to larger liquid droplet sizes. Re_ice shows weaker spatial variability and is mainly characterized by an outward-increasing radial structure. The mean values for each cloud type further show that the four microphysical properties differ among cloud types. Moreover, these structures vary with microphysical property and appear to different degrees within the major cloud types, especially the IWP reduction in the outer eastern region and the Re_liq enhancement in the southern outer layer.
The enhanced LWP under NCCV conditions may be related to the cold-core cyclonic circulation, moisture convergence, and persistent ascent associated with cold vortex systems. These conditions may favor condensation and the maintenance of liquid water in stratiform and mixed cloud systems. The northwestern LWP maximum may further reflect sectoral asymmetry in cold air intrusion, moisture inflow, and vertical motion within the vortex. This interpretation remains at hypothesis level because this study does not directly diagnose vertical motion, moisture flux, or cloud phase conversion.
Overall, NCCV cloud systems are characterized not only by their cloud-type composition but also by their cloud microphysical contrasts and internal spatial organization. The similarity in cloud-type composition between NCCV and non-NCCV samples, together with the distributional, cloud-type-dependent, and spatial signals in microphysical properties, shows that cloud microphysics provides information that cannot be captured by cloud-type frequency alone. Within the NCCV body, the stronger spatial heterogeneity of LWP and IWP further indicates that NCCV cloud systems should be examined as organized systems with internal radial and azimuthal structures. These findings extend previous understanding of NCCV from synoptic circulation, precipitation, and cloud amount to cloud microphysical properties, and provide satellite-based observational evidence for further studies of cloud and precipitation processes associated with NCCV. Because this study is based on MODIS Level-3 statistical composites, the results should be interpreted as broad satellite-based composite signals rather than direct dynamical evidence. Moreover, MODIS passive-sensor retrievals provide two-dimensional cloud optical and microphysical information and cannot directly resolve vertical cloud structure or precipitation microphysics. Future work should combine reanalysis-based dynamical diagnostics with higher-resolution passive observations, active sensor measurements, or ground-based observations to further test the physical links between NCCV dynamics and cloud microphysical structures.
Author Contributions
Conceptualization, Q.L.; methodology, Q.L. and Z.Q.; data curation, Z.Q. and Y.L.; formal analysis, Z.Q.; funding acquisition, Q.L.; software, Z.Q. and Y.L.; supervision, Q.L.; visualization, Z.Q.; writing—original draft preparation, Z.Q. and Q.L.; writing—review and editing, Z.Q., Q.L., Z.L. and J.C. All authors have read and agreed to the published version of the manuscript.
Funding
This work was jointly supported by the National Key R&D Program of China (2023YFC3007700, 2023YFC3007704), the National Natural Science Foundation of China (42075075), and FY Satellite Advanced Planning (FY-APP-2024.0102).
Data Availability Statement
The MODIS MYD08_D3 Collection 6.1 product used in this study is publicly available from NASA LAADS DAAC at https://ladsweb.modaps.eosdis.nasa.gov/ (accessed on 28 May 2026). ERA5 reanalysis data are publicly available from the Copernicus Climate Data Store at https://cds.climate.copernicus.eu/ (accessed on 28 May 2026). The NCCV event records and processed data generated during the current study are available from the corresponding author upon reasonable request.
Acknowledgments
We would like to thank NASA LAADS DAAC and the MODIS science team for providing the MYD08_D3 product, and ECMWF/Copernicus Climate Data Store for providing ERA5 reanalysis data. We also thank Zhongda Lin for providing the NCCV event records.
Conflicts of Interest
The authors declare no conflicts of interest.
Appendix A. Month-Stratified Permutation Test
For each cloud microphysical variable, the statistical significance of the NCCV and non-NCCV distributional difference was evaluated using a month-stratified permutation test. Let and denote the samples from NCCV and non-NCCV days in month m, respectively, where represents April to August. The observed full-period statistic was defined as
where is the first-order Wasserstein distance and is the standard deviation of the corresponding variable calculated from the pooled NCCV and non-NCCV samples.
For the bth permutation, NCCV and non-NCCV labels were randomly exchanged only within the same month. The original monthly sample sizes and were preserved. The permuted samples from all months were then pooled, and the same full-period statistic was recalculated as
where and are the permuted NCCV and non-NCCV samples in month m. Repeating this procedure times produced the stratified null distribution . The standardized statistic was calculated as
where and are the mean and standard deviation of the stratified permutation null distribution. The one-sided permutation p-value was estimated as
where is an indicator function. Thus, the reported z- and p-values were not obtained by averaging or summing monthly statistics. Monthly stratification was imposed during the label-permutation step, and a single full-period null distribution was constructed after pooling the permuted April–August samples.
References
- Zhang, L.X.; Li, Z.C. A review of studies on the Northeast China cold vortex. Clim. Environ. Res. 2009, 14, 218–228. (In Chinese) [Google Scholar]
- Zhu, Z.Y.; He, J.H. Characteristics, impacts, and possible mechanisms of the Northeast China cold vortex. Meteorol. Disaster Reduct. Res. 2010, 33, 1–8. (In Chinese) [Google Scholar]
- Wang, W.Z.; Li, J.; Hu, C.L.; Li, J.; Jiao, M. A review of the definition, identification, and quantification of the Northeast China cold vortex. J. Meteorol. Sci. 2017, 37, 394–402. (In Chinese) [Google Scholar]
- Liu, G.; Lian, Y.; Cao, L.; Yan, P.C.; Zeng, Y.X.; Yang, X. Objective identification and classification of Northeast China cold vortices from May to August and associated Northern Hemisphere circulation characteristics. Sci. Geogr. Sin. 2015, 35, 1042–1050. (In Chinese) [Google Scholar]
- Huang, X.; Li, D. Objective identification method and variation characteristics of the Northeast China cold vortex from May to August of 1979–2018. Acta Meteorol. Sin. 2020, 78, 945–961. (In Chinese) [Google Scholar]
- Sun, J.H.; Zhou, Y.S.; Fu, S.M.; Yang, S.; Zhang, Y.C.; Wang, H.J.; Huang, Y. Progress on Vortices in China in the Past Ten Years. Chin. J. Atmos. Sci. 2024, 48, 228–260. (In Chinese) [Google Scholar]
- Xie, Z.W.; Bueh, C. Different types of cold vortex circulations over Northeast China and their weather impacts. Mon. Weather. Rev. 2015, 143, 845–863. [Google Scholar] [CrossRef] [Scilit]
- Lian, Y.; Shen, B.Z.; Li, S.F.; Liu, G.; Yang, X. Mechanisms for the formation of Northeast China cold vortex and its activities and impacts: An overview. J. Meteorol. Res. 2016, 30, 881–896. [Google Scholar] [CrossRef] [Scilit]
- Bueh, C.L.; Xie, Z.W. Circulation and dynamical characteristics of the Northeast China cold vortex. Adv. Meteorol. Sci. Technol. 2013, 3, 34–39. (In Chinese) [Google Scholar]
- Xie, Z.W.; Bueh, C. Cold vortex events over Northeast China associated with the Yakutsk–Okhotsk blocking. Int. J. Climatol. 2017, 37, 381–398. [Google Scholar]
- Yuan, M.Y. Convective Rainstorms under the Background of the Northeast China Cold Vortex; Nanjing University of Information Science and Technology: Nanjing, China, 2009. (In Chinese) [Google Scholar]
- Wang, N.; Xu, X.D.; Xu, H.X.; Mu, X.X.; Niu, L.Q.; Li, S.F. Moisture transport characteristics and potential-vorticity analysis of a rainstorm associated with the Northeast China cold vortex. In Proceedings of the Ninth National Seminar on Forecasting Techniques for Disastrous Weather, Beijing, China, 18 December 2012; pp. 103–112. (In Chinese) [Google Scholar]
- Peng, L. Process analysis of a precipitation event associated with a Northeast China cold vortex. In Proceedings of the 30th Annual Meeting of the Chinese Meteorological Society, Nanjing, China, 23 October 2013; pp. 1–11. (In Chinese) [Google Scholar]
- Li, M.J.; Song, J.; Cui, Y.M.; Gong, X.; Chen, X. Process analysis of a typical precipitation event associated with the Northeast China cold vortex. Anhui Agric. Sci. Bull. 2022, 28, 173–180. (In Chinese) [Google Scholar]
- Li, Y.Y. Simulation Study on Moisture Sources and Precipitation Physical Processes of a Rainstorm Associated with the Northeast China Cold Vortex; Chengdu University of Information Technology: Chengdu, China, 2023. (In Chinese) [Google Scholar]
- Chen, X.; Xue, M.; Fang, J. Objective identification and climatic characteristics of heavy-precipitation Northeastern China cold vortexes. Adv. Atmos. Sci. 2023, 40, 305–316. [Google Scholar]
- Huang, L.; Cui, X.; Chen, L.; Zou, Q.; Yang, Y. Objective circulation classification of rainstorm days associated with Northeast China cold vortexes in the warm seasons of 2000–2019. Front. Earth Sci. 2023, 10, 1066070. [Google Scholar] [CrossRef] [Scilit]
- Nakajima, T.; King, M.D. Determination of the optical thickness and effective particle radius of clouds from reflected solar radiation measurements. Part I: Theory. J. Atmos. Sci. 1990, 47, 1878–1893. [Google Scholar] [CrossRef] [Scilit]
- Platnick, S.; King, M.D.; Ackerman, S.A.; Menzel, W.P.; Baum, B.A.; Riedi, J.C.; Frey, R.A. The MODIS cloud products: Algorithms and examples from Terra. IEEE Trans. Geosci. Remote Sens. 2003, 41, 459–473. [Google Scholar] [CrossRef] [Scilit]
- Heymsfield, A.J.; Schmitt, C.; Bansemer, A.; van Zadelhoff, G.-J.; McGill, M.J.; Twohy, C.; Baumgardner, D. Effective radius of ice cloud particle populations derived from aircraft probes. J. Atmos. Ocean. Technol. 2006, 23, 361–380. [Google Scholar] [CrossRef] [Scilit]
- Platnick, S.; Meyer, K.G.; King, M.D.; Wind, G.; Amarasinghe, N.; Marchant, B.; Arnold, G.T.; Zhang, Z.; Hubanks, P.A.; Holz, R.E.; et al. The MODIS cloud optical and microphysical products: Collection 6 updates and examples from Terra and Aqua. IEEE Trans. Geosci. Remote Sens. 2017, 55, 502–525. [Google Scholar] [CrossRef] [Scilit] [PubMed]
- Qi, Y.B.; Guo, X.L.; Jin, D.Z. Observational study on the macro- and microphysical structure of a convective cloud band in a Northeast China cold vortex. Chin. J. Atmos. Sci. 2007, 31, 621–634. (In Chinese) [Google Scholar]
- Zhong, S.X.; Wang, D.H.; Zhang, R.H.; Liu, Y. Vertical structure characteristics of convective cloud bands in a cold vortex based on CloudSat data. J. Appl. Meteorol. Sci. 2011, 22, 257–264. (In Chinese) [Google Scholar]
- Shi, C.H.; Li, H.; Zheng, B.; Guo, D. Structure and precipitation of an atypical Northeast China cold vortex based on CloudSat observations. Chin. J. Geophys. 2013, 56, 2594–2602. (In Chinese) [Google Scholar]
- Li, D.N.; Liu, X.G.; Gao, Q.N.; Yuan, C.; Li, P.; An, Y.Y. Analysis of macro- and microphysical characteristics of a Northeast China cold vortex process. Meteorol. Sci. Technol. 2021, 49, 227–234. (In Chinese) [Google Scholar]
- Wang, J.; Zhuge, X.; Chen, F.; Chen, X.; Wang, Y. A preliminary analysis of typical structures and microphysical characteristics of precipitation in northeastern China cold vortexes. Remote Sens. 2023, 15, 3399. [Google Scholar] [CrossRef] [Scilit]
- King, M.D.; Platnick, S.; Menzel, W.P.; Ackerman, S.A.; Hubanks, P.A. Spatial and temporal distribution of clouds observed by MODIS onboard the Terra and Aqua satellites. IEEE Trans. Geosci. Remote Sens. 2013, 51, 3826–3852. [Google Scholar] [CrossRef] [Scilit]
- Zhang, Z.; Platnick, S. An assessment of differences between cloud effective particle radius retrievals for marine water clouds from three MODIS spectral bands. J. Geophys. Res. Atmos. 2011, 116, D20215. [Google Scholar] [CrossRef] [Scilit]
- Miao, H.; Wang, X.; Liu, Y.; Wu, G. Characterization of cloud microphysical properties in different cloud types over East Asia based on CloudSat/CALIPSO satellite products. Atmos. Ocean. Sci. Lett. 2021, 14, 100050. [Google Scholar] [CrossRef] [Scilit]
- MODIS Atmosphere Science Team. MYD08_D3 MODIS/Aqua Aerosol Cloud Water Vapor Ozone Daily L3 Global 1Deg CMG, Collection 6.1. NASA Level-1 and Atmosphere Archive and Distribution System Distributed Active Archive Center. 2017. Available online: https://ladsweb.modaps.eosdis.nasa.gov/ (accessed on 29 May 2026).
- Hersbach, H.; Bell, B.; Berrisford, P.; Hirahara, S.; Horányi, A.; Muñoz-Sabater, J.; Nicolas, J.; Peubey, C.; Radu, R.; Schepers, D.; et al. The ERA5 global reanalysis. Q. J. R. Meteorol. Soc. 2020, 146, 1999–2049. [Google Scholar] [CrossRef] [Scilit]
- Shen, X.Y.; Zhang, C.; Gao, H.Y.; Wang, L.; Li, X.F. Classification and dynamic composite analysis of three types of upper-level cold vortices. Torrential Rain Disasters 2020, 39, 1–9. (In Chinese) [Google Scholar]
- Rossow, W.B.; Schiffer, R.A. Advances in understanding clouds from ISCCP. Bull. Am. Meteorol. Soc. 1999, 80, 2261–2288. [Google Scholar] [CrossRef] [Scilit]
- Marchand, R.; Ackerman, T.; Smyth, M.; Rossow, W.B. A review of cloud top height and optical depth histograms from MISR, ISCCP, and MODIS. J. Geophys. Res. Atmos. 2010, 115, D16206. [Google Scholar] [CrossRef] [Scilit]
- Villani, C. Optimal Transport: Old and New; Springer: Berlin, Germany, 2009. [Google Scholar]
- Peyré, G.; Cuturi, M. Computational optimal transport. Found. Trends Mach. Learn. 2019, 11, 355–607. [Google Scholar] [CrossRef] [Scilit]
- Good, P.I. Permutation, Parametric, and Bootstrap Tests of Hypotheses, 3rd ed.; Springer: New York, NY, USA, 2005. [Google Scholar]
- Ernst, M.D. Permutation methods: A basis for exact inference. Stat. Sci. 2004, 19, 676–685. [Google Scholar] [CrossRef] [Scilit]
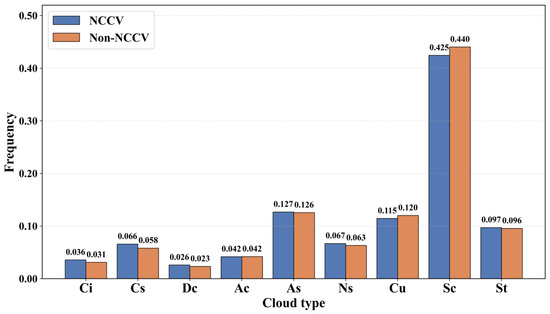
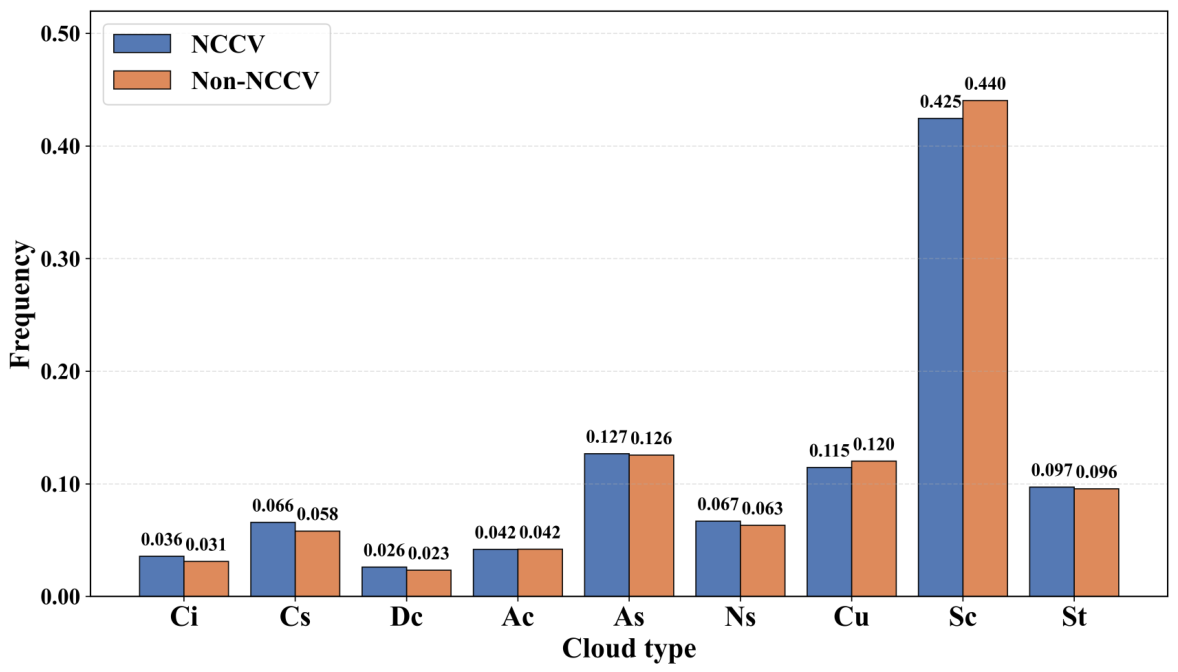
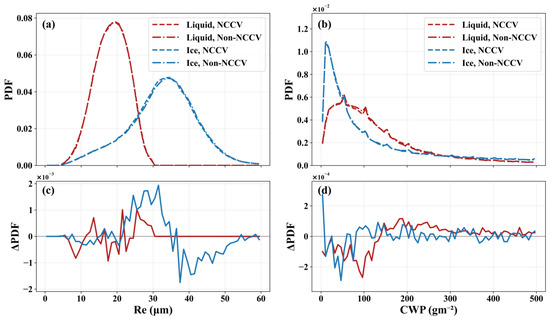
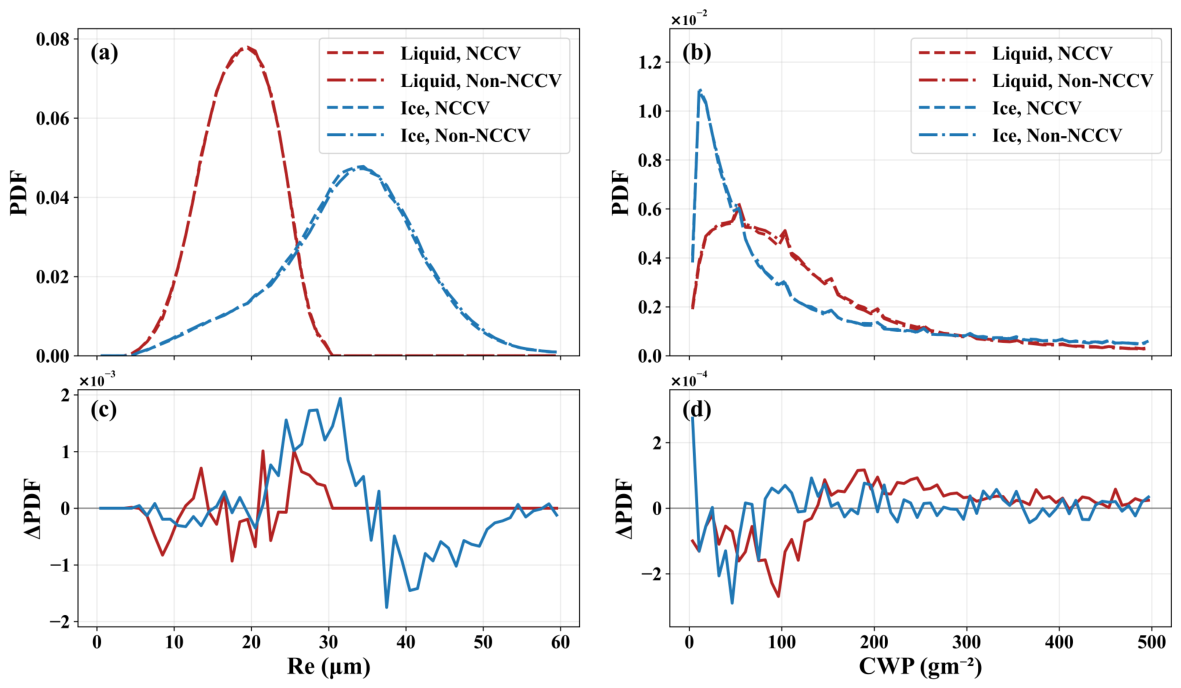
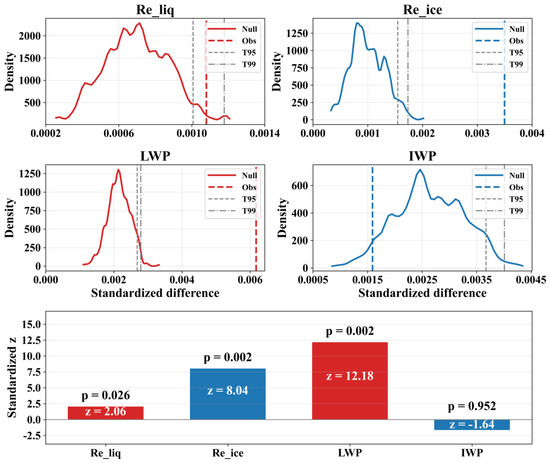
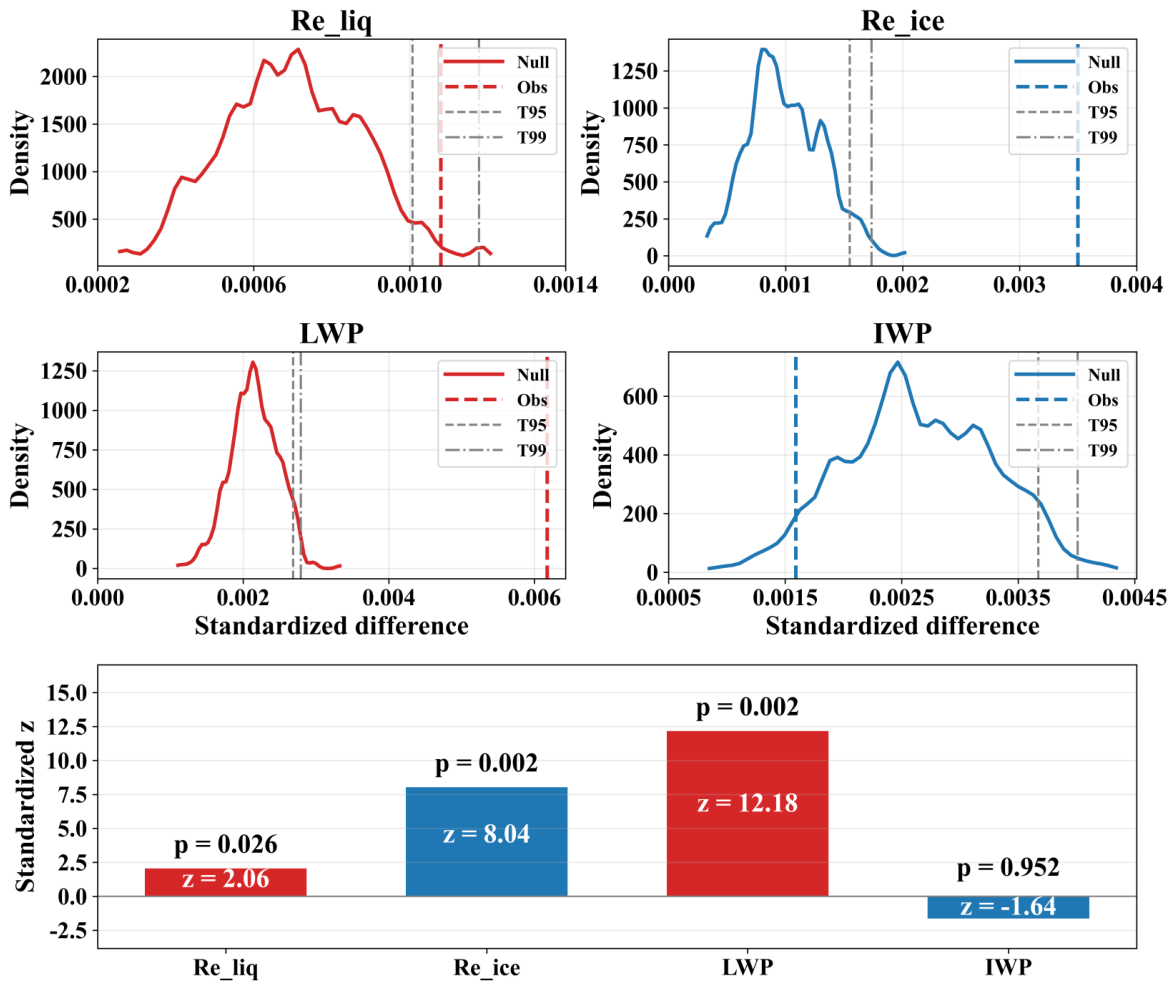
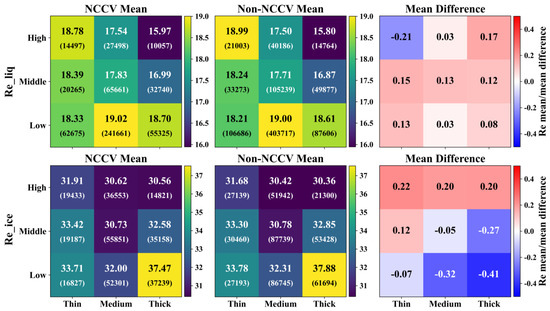
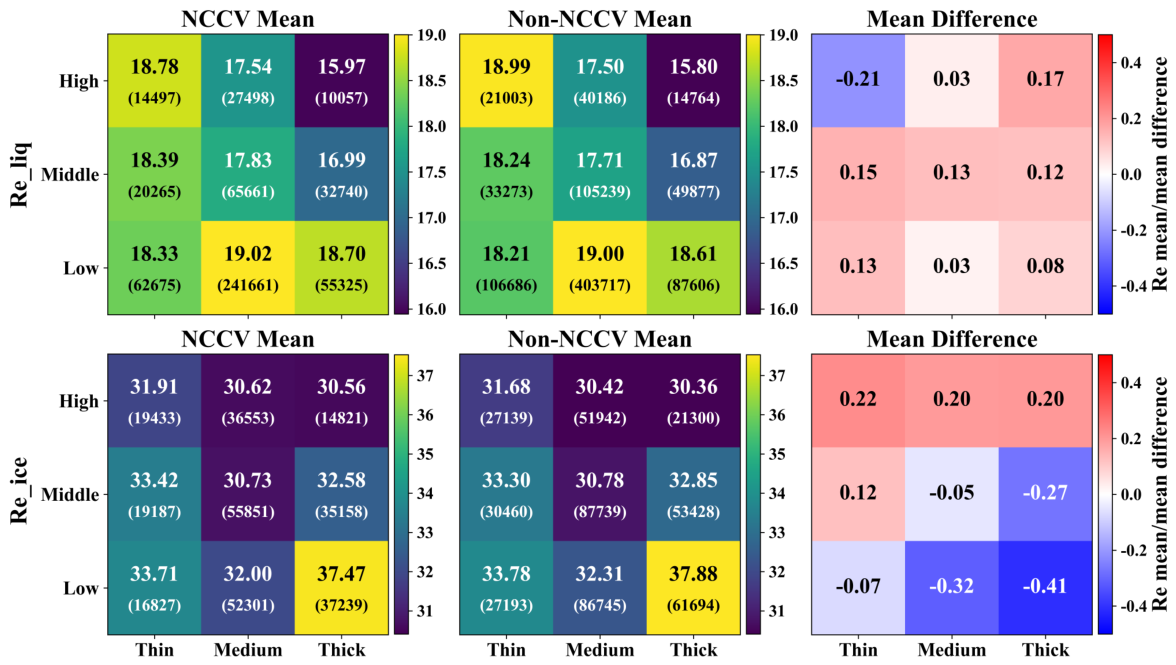
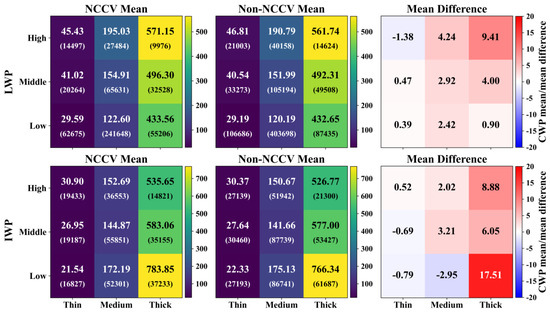
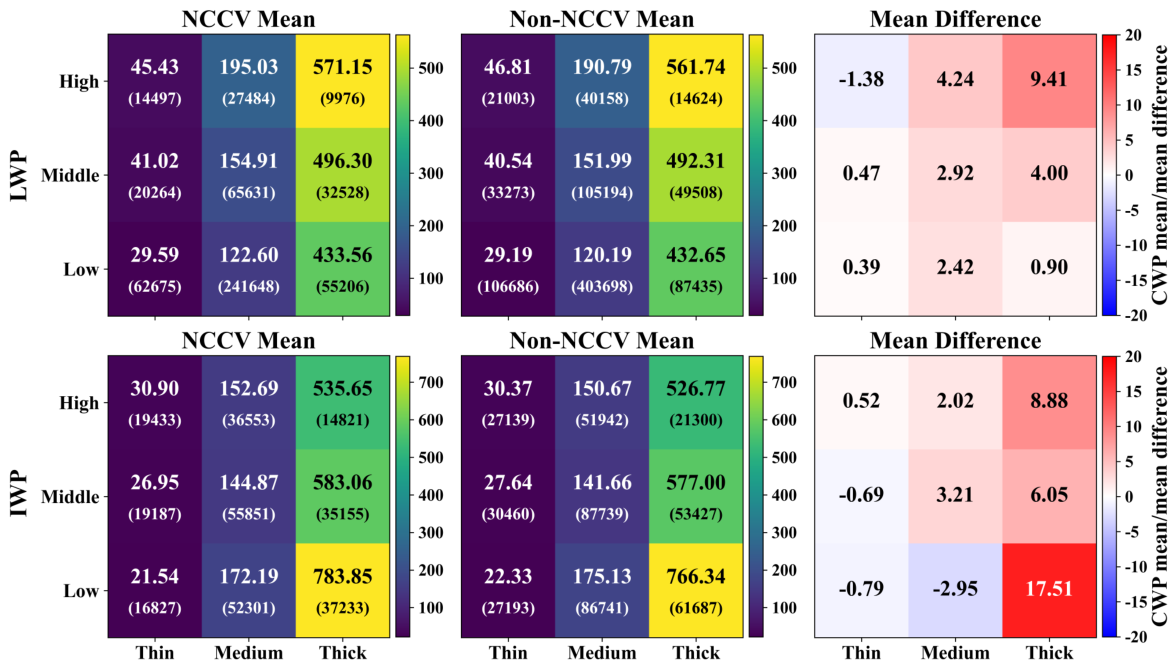
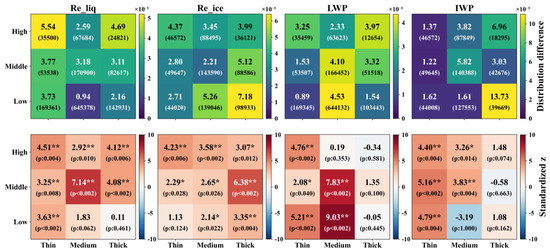
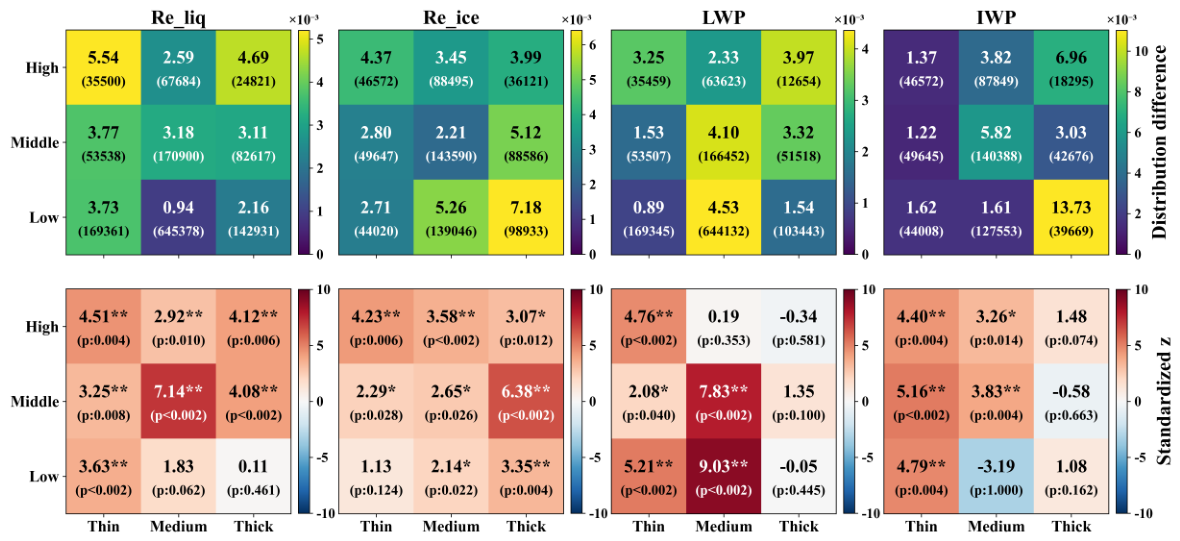
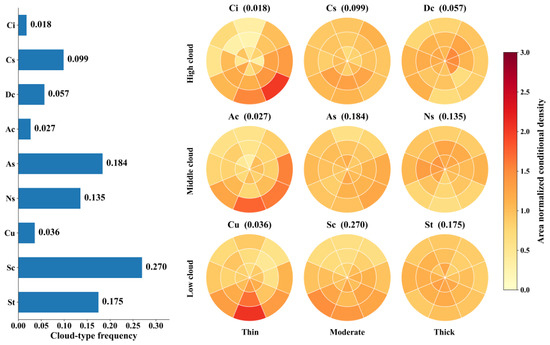
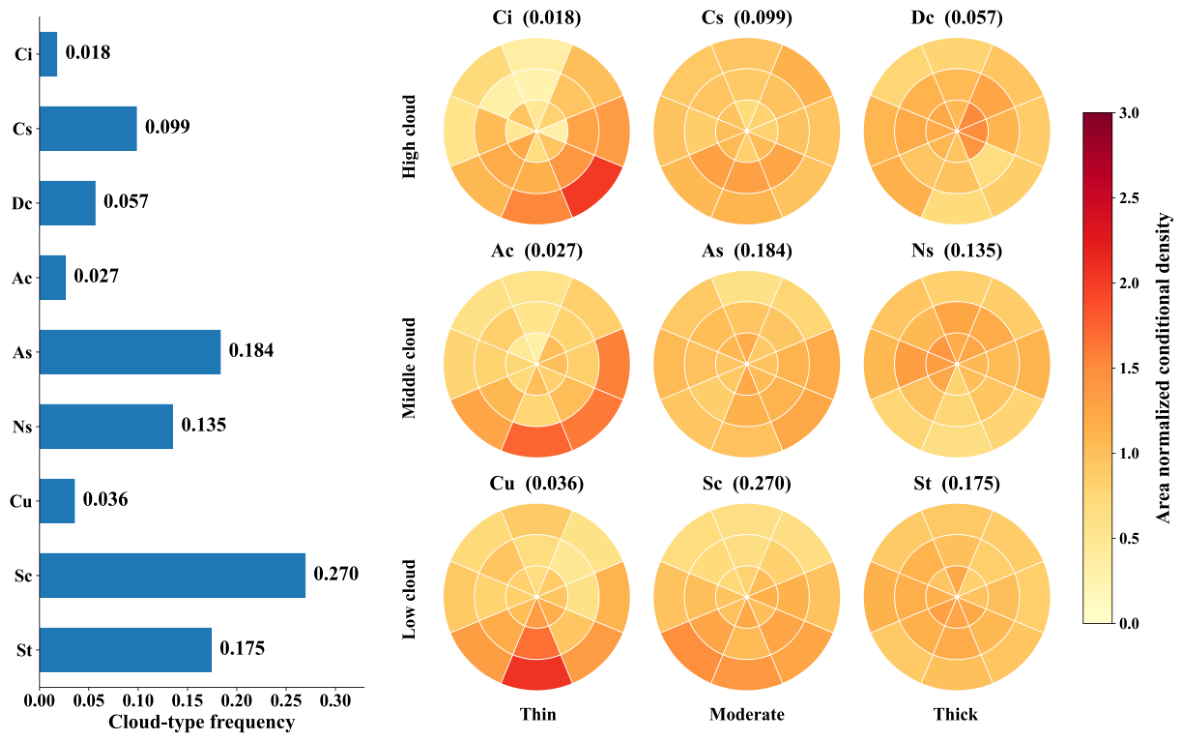
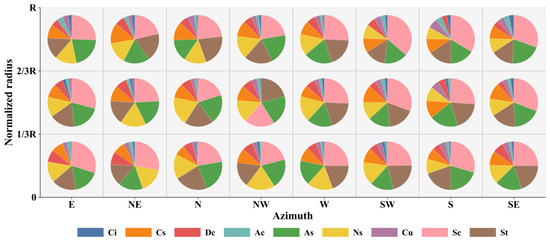
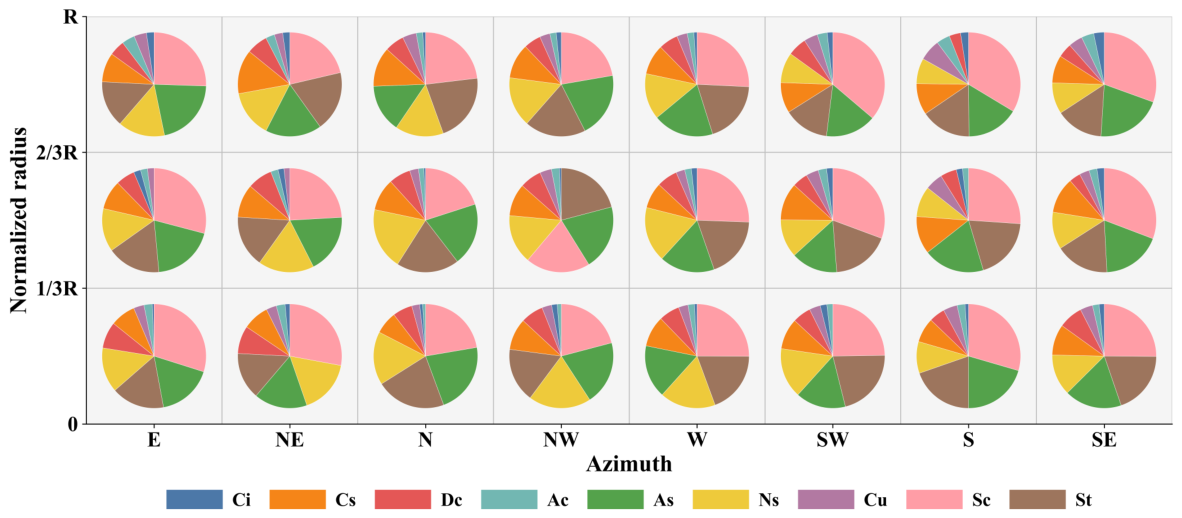
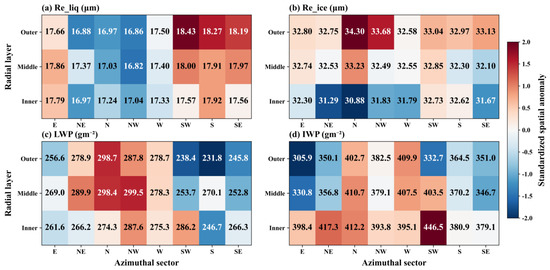
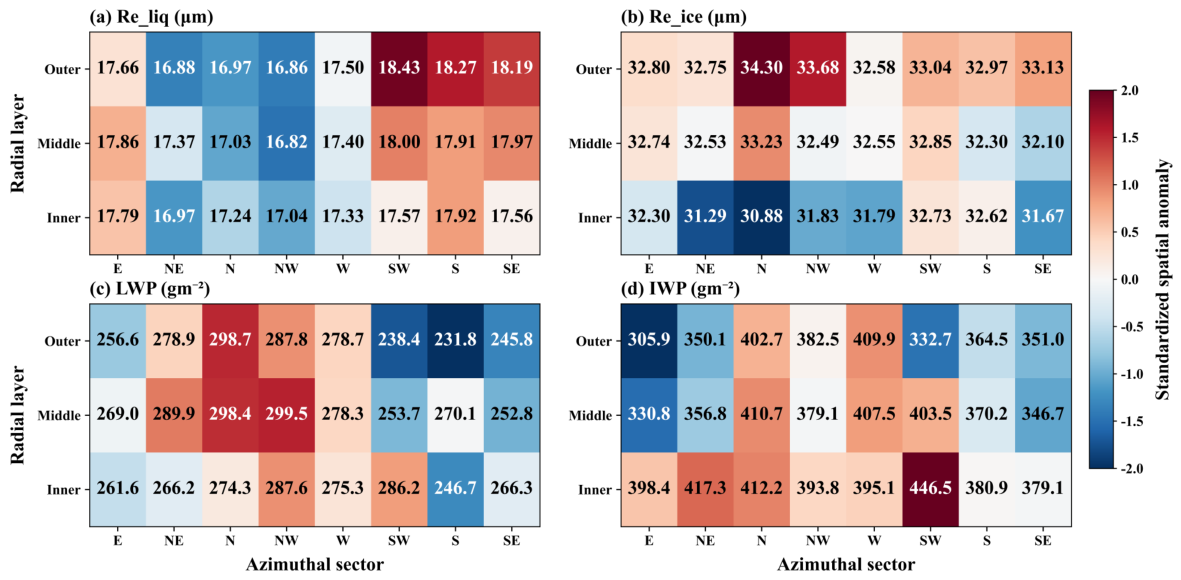
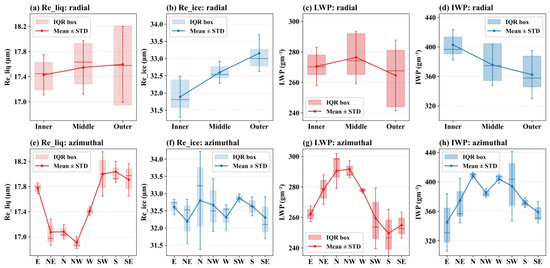
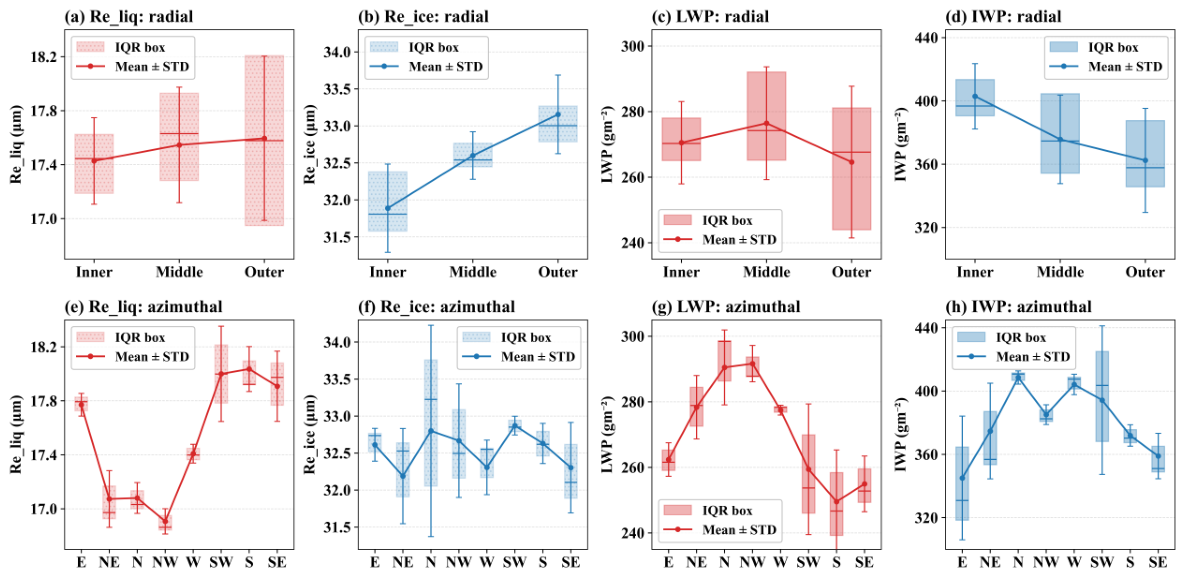
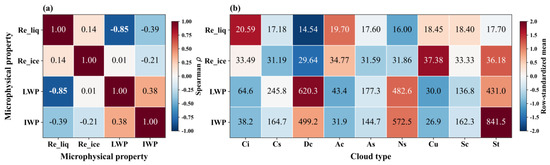
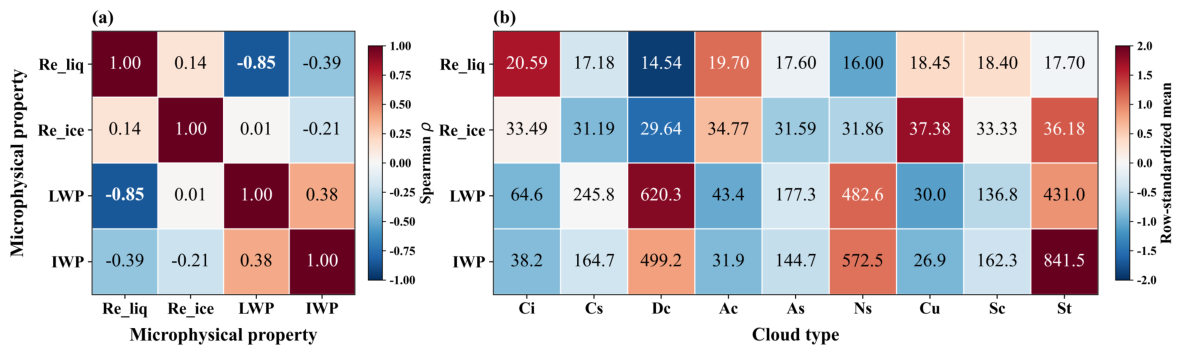
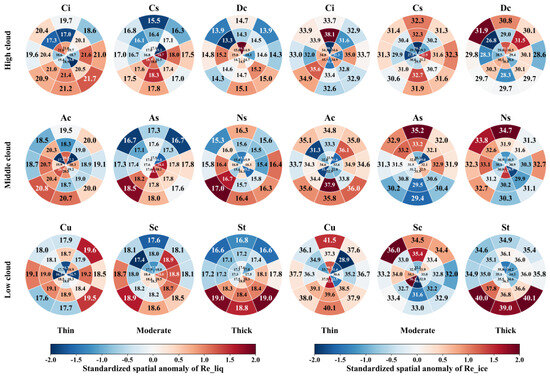
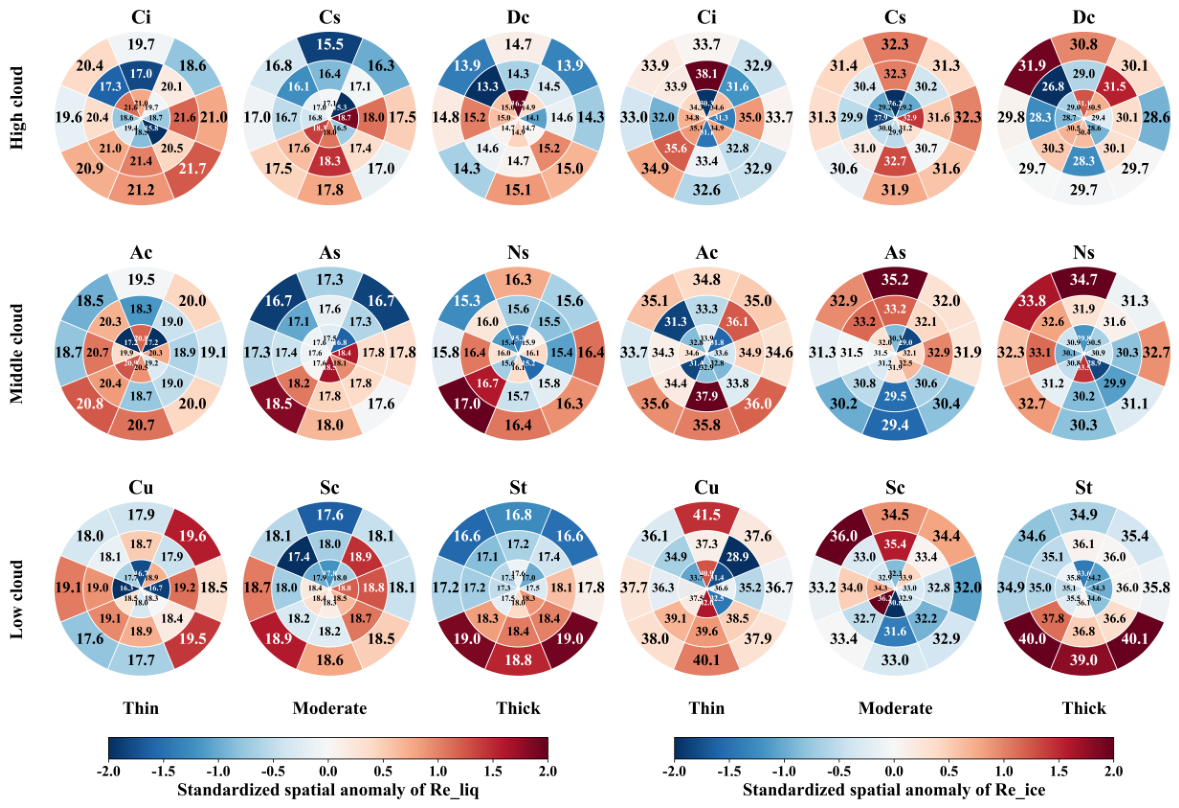
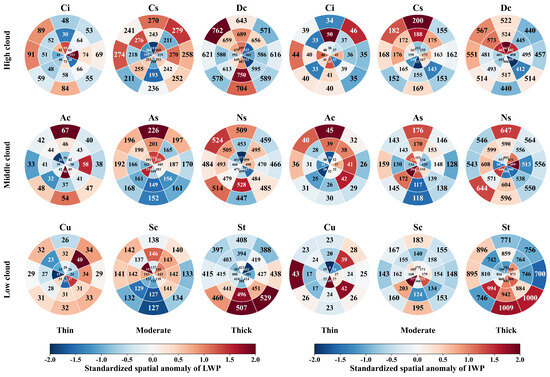
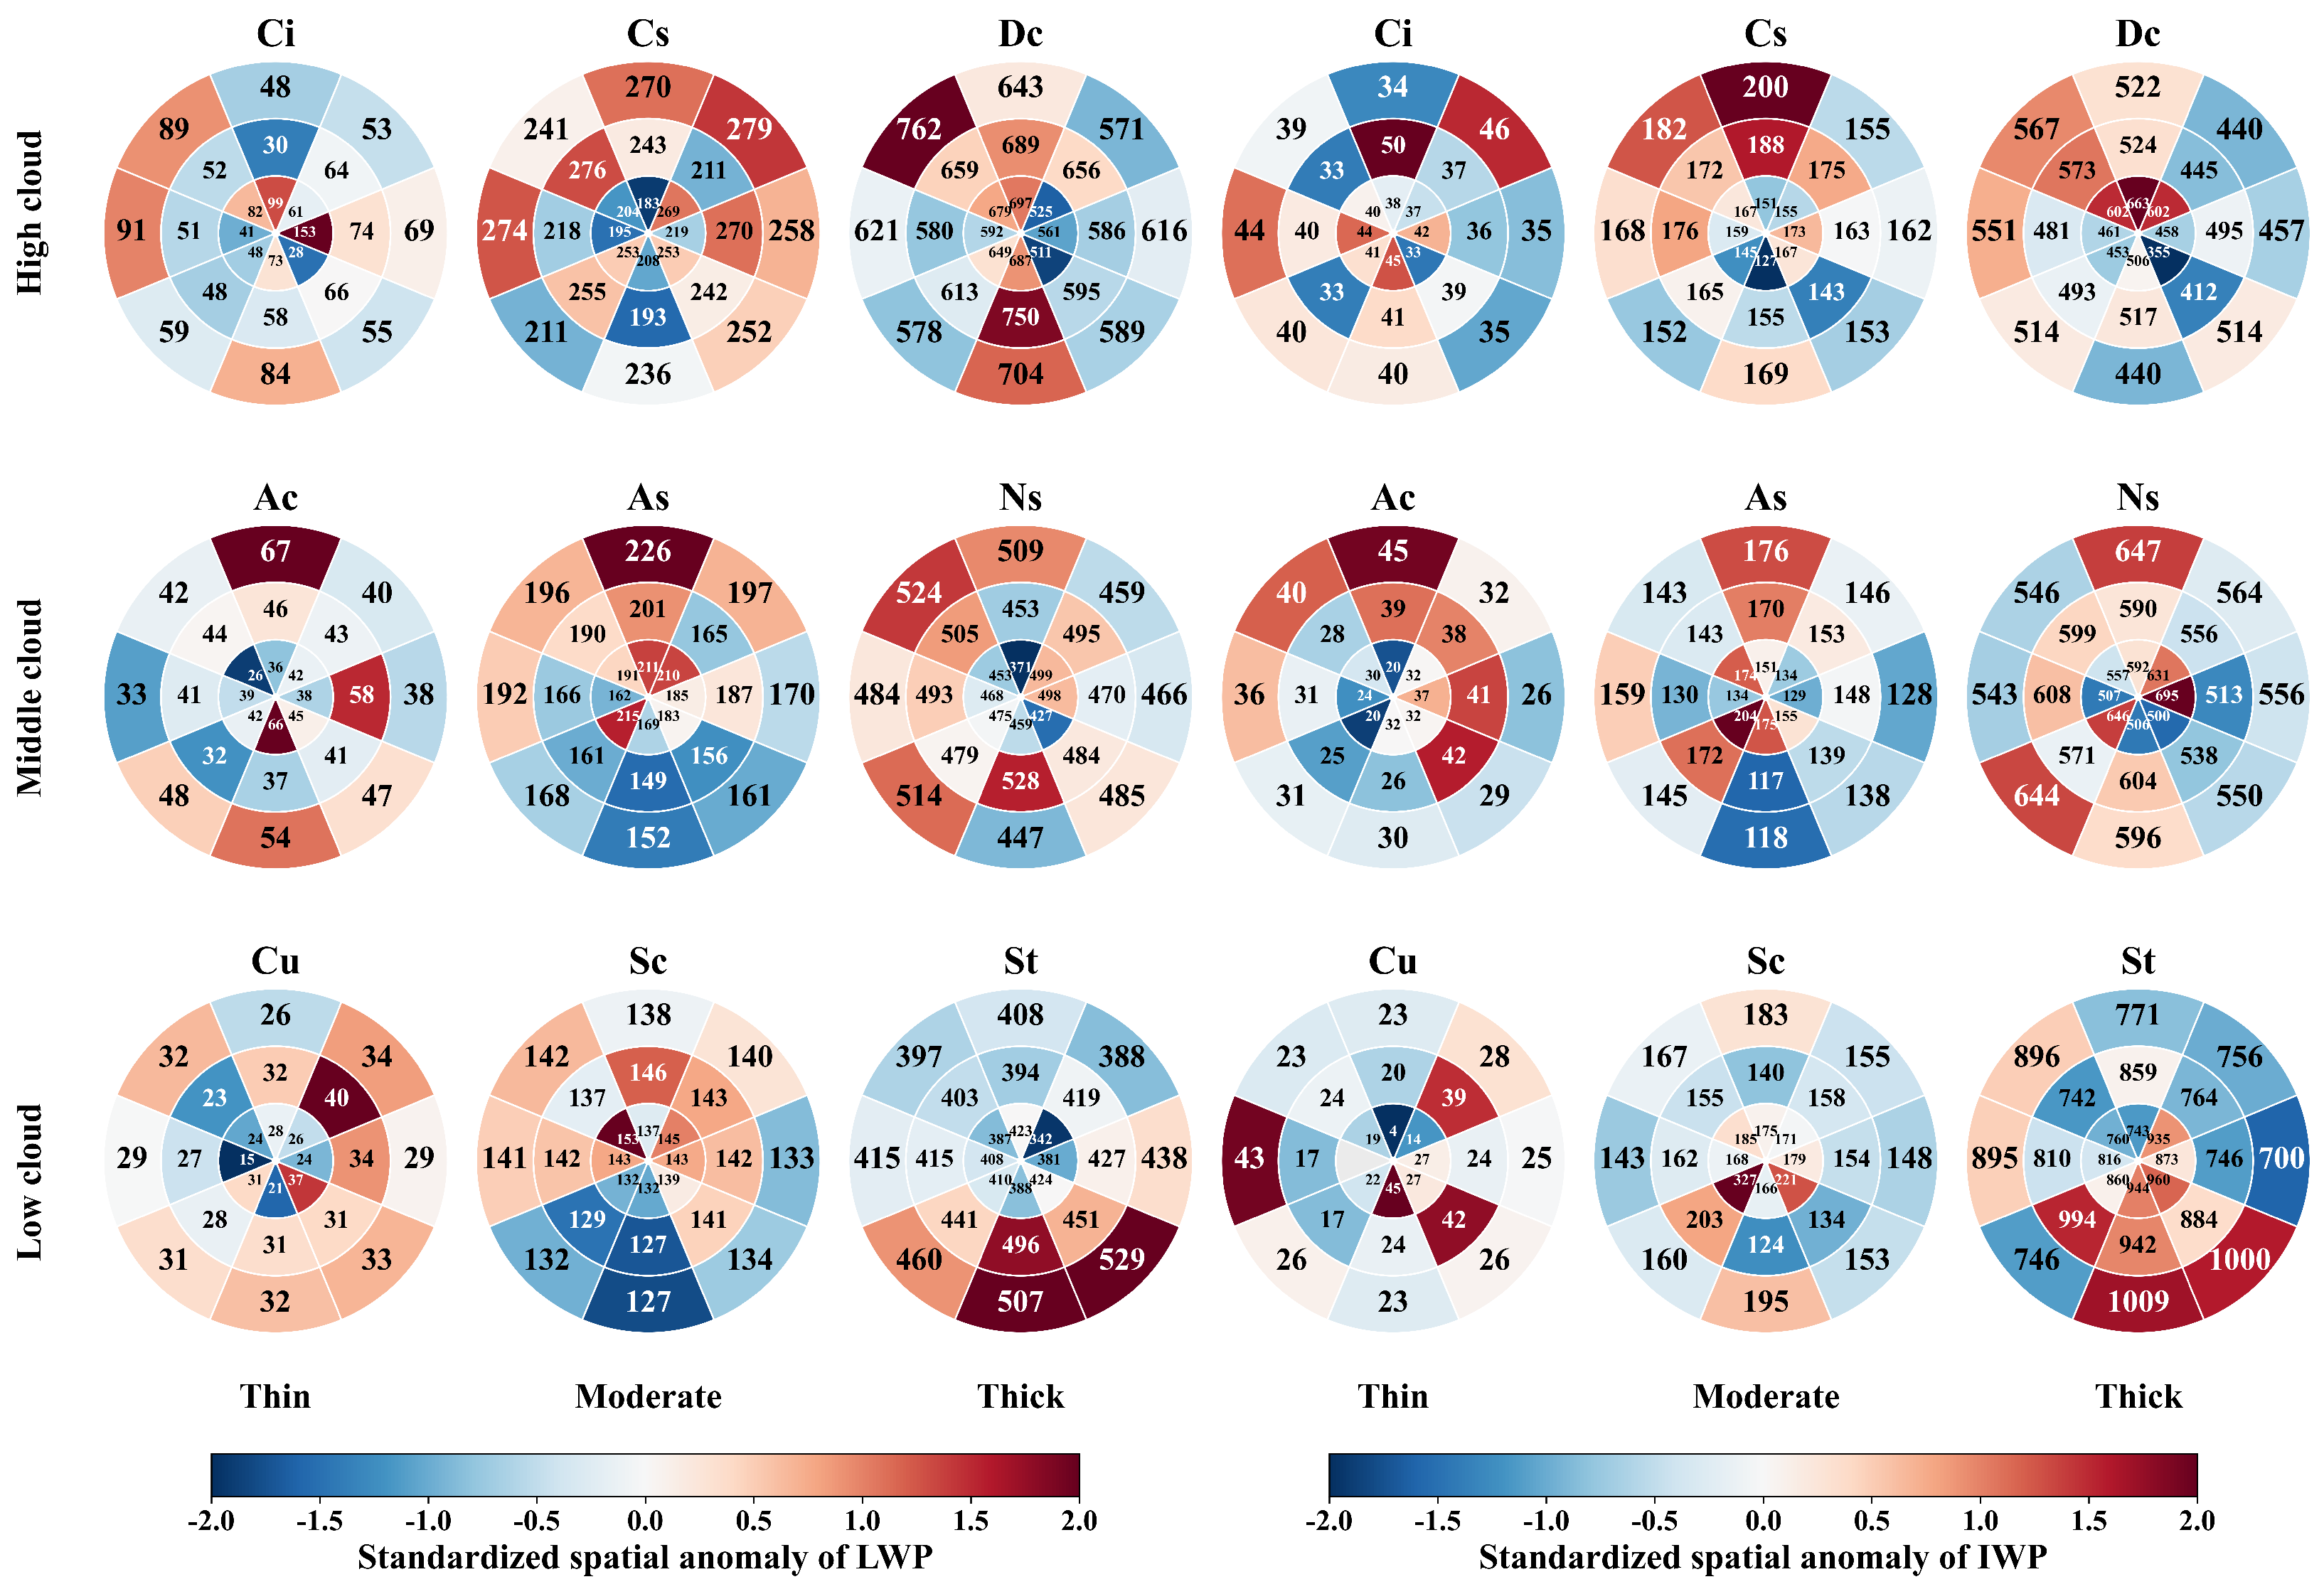

Disclaimer/Publisher’s Note: The statements, opinions and data contained in all publications are solely those of the individual author(s) and contributor(s) and not of MDPI and/or the editor(s). MDPI and/or the editor(s) disclaim responsibility for any injury to people or property resulting from any ideas, methods, instructions or products referred to in the content. |
© 2026 by the authors. Licensee MDPI, Basel, Switzerland. This article is an open access article distributed under the terms and conditions of the Creative Commons Attribution (CC BY) license.