


Highlights
What are the main findings?
- Fusion of complementary detection models (e.g., YOLOv9 and YOLOv12) significantly improves vehicle counting accuracy and reduces density estimation errors, indicating that combining models with different detection characteristics enhances task-oriented performance beyond single-model capabilities.
- Classical detection metrics (e.g., mAP) are insufficient to assess model quality in real-world EO applications, as they do not capture functional aspects such as object counting accuracy, spatial distribution consistency, and the reliability of derived indicators.
What are the implications of the main findings?
- Evaluation of remote sensing detection models should include functional metrics such as object counting, density, and occupancy, not only detection accuracy.
- Model fusion and domain adaptation (fine-tuning) are key strategies for improving the reliability of EO-based activity analysis.
Abstract
The rapid development of deep learning methods has significantly improved the effectiveness of object detection in Earth Observation (EO) imagery. However, standard metrics such as Mean Average Precision (mAP) do not fully reflect their utility in operational analyses. This paper proposes a multi-stage methodology for evaluating vehicle detection models, combining classical evaluation with functional analysis encompassing object counting, density estimation, and occupancy index. The research was conducted on high-resolution imagery (WorldView, Pleiades) and the xView dataset, evaluating five YOLO variants alongside transformer-based and two-stage detectors under three training strategies, including fine-tuning. The results show that models achieving high mAP values (up to 0.952) can simultaneously produce significant errors in object count estimation. Models trained exclusively on xView exhibit a substantial performance drop (mAP@0.50 ≈ 0.45) under domain shift conditions. The best results were obtained using a fusion-based approach combining YOLOv9 and YOLOv12, which reduced the mean relative error to 0.14 and the counting error to 13 objects, maintaining a low density error (0.0023). Functional validation across 20 parking areas confirmed the stability of the proposed approach. The findings confirm that functional analysis constitutes a critical complement to classical evaluation in remote sensing applications.
1. Introduction
The dynamic development of Earth observation (EO) systems, particularly small satellite constellations, has significantly increased the availability of imagery with high spatial and temporal resolution. Commercial platforms, such as Planet Labs and BlackSky, enable the regular acquisition of data with high revisit frequencies, which, combined with the development of orbital video imaging technologies, allows for the observation of dynamic phenomena occurring on the Earth’s surface [1,2,3]. At the same time, technologies for data acquisition using unmanned aerial vehicles (UAVs are also rapidly evolving, enabling the generation of very high-resolution imagery and serving as a significant complement to satellite data [4,5,6]. Consequently, EO systems are becoming an important tool in the analysis of anthropogenic activity, infrastructure monitoring, and decision support.
Along with advances in data acquisition technology, there has also been a rapid development of data processing and analysis methods [7]. This includes both traditional image processing techniques [8] and modern approaches based on deep learning [9,10], such as image quality enhancement [11] and object detection. These solutions significantly enhance the utility of satellite [12,13] and UAV [14,15] data, particularly in the context of analyzing small objects and complex scenes with high spatial variability.
One of the key indicators of human activity is the presence and distribution of vehicles. In recent years, methods for object detection have been developed for both optical imagery [16] and radar (SAR) imagery [17]. SAR imagery offers a significant advantage due to its independence from lighting and weather conditions, making it an attractive data source for operational applications [18]. However, due to lower spatial resolution, speckle noise, and more complex signal characteristics, the detection of small objects, such as vehicles, remains more challenging and typically less accurate in these data [19].
Consequently, EO optical imagery remains the primary data source for tasks that require high-precision vehicle detection. Vehicle detection in EO imagery is used in traffic analysis, assessment of transport infrastructure utilization, monitoring of economic activity, as well as in reconnaissance and security systems. However, in many cases, these analyses are still performed semi-automatically or manually. In recent years, the development of deep learning methods has led to a significant increase in object detection performance, as evidenced by high values of standard metrics such as precision, recall, and mean Average Precision (mAP) [20,21].
Significant progress has been made in the field of detecting small objects in remote sensing images, as confirmed by comprehensive literature reviews [22,23]. The challenges arising from the small number of pixels representing objects, lighting variations, occlusion, and complex backgrounds have been extensively analyzed and systematized [22]. Dedicated approaches include GAN-assisted super-resolution [24] and image degradation reconstruction methods, both of which aim to improve the representation of small objects prior to the detection stage. Single-stage detectors, particularly the YOLO family, have become the dominant paradigm due to their favorable trade-off between speed and accuracy, although two-stage methods and transformer-based architectures remain competitive in scenarios requiring high localization precision [22]. An alternative to the detection-then-count paradigm is offered by density-map-based and regression-based counting methods [25,26], which bypass explicit localization and directly estimate object counts. While such approaches have demonstrated strong performance for crowd and vehicle counting in aerial imagery—including parking-lot scenarios [25]—they are optimized for counting accuracy rather than spatial localization. In the very-high-resolution regime addressed in this study (GSD ≈ 0.5 m), individual vehicles are resolvable as discrete objects, and the detection-based pipeline is preferred because it provides explicit bounding-box localization required for spatial density mapping and per-area occupancy estimation.
Despite these advances, most of the existing work treats vehicle detection as an end in itself, focusing on maximizing detection accuracy at the level of individual objects. Meanwhile, in practical applications, detection is merely an intermediate step leading to the estimation of higher-level information, such as vehicle density, parking lot occupancy, traffic volume, or overall area activity. In this context, even minor detection errors can lead to significant distortions in conclusions, particularly in areas with a low number of objects or high spatial variability.
There are studies in the literature that use EO data to analyze spatial activity and dynamic phenomena [27,28,29,30], but in most cases they focus on the level of object detection or classification, while neglecting the analysis of how detection errors propagate to the level of functional indicators. To the best of our knowledge, there are no studies that systematically combine the assessment of detection quality with an analysis of its impact on the accuracy of functional indicator estimates, such as object density or infrastructure occupancy levels.
An additional challenge is the growing availability of multi-temporal data and quasi-video EO imagery, which enable the analysis of the dynamics of phenomena. Unlike single scenes, sequential data allow for tracking changes in activity over time but require ensuring detection consistency between successive observations. A lack of detection stability can lead to misinterpretations of changes, limiting the reliability of analyses based on EO data. Recent advances in spatio-temporal change detection, such as ChangeMamba [31], which leverages state-space models for temporal consistency across sequential EO observations, provide a promising methodological foundation for extending detection-based functional analysis into the multi-temporal domain.
Despite the significance of this problem, the literature lacks systematic studies analyzing the impact of object detection quality on the reliability of functional indicators and their stability over time. In particular, there is a lack of approaches that explicitly link the assessment of detection quality with an analysis of its impact on the estimation of spatial indicators. Furthermore, it remains unclear to what extent standard detection metrics reflect the actual utility of models in land cover analysis.
In light of the identified limitations of standard detection metrics and the lack of a clear assessment of their impact on the quality of functional indicator estimates, the following research questions were formulated in this study:
- RQ1: To what extent do vehicle detection errors affect the accuracy of functional indicator estimates?
- RQ2: How does the relationship between detection quality and errors in functional indicators manifest itself in practical EO analysis scenarios?
- RQ3: How do different types of scenes (e.g., parking lots with varying densities) affect the reliability of the estimated indicators?
- RQ4: Does the fusion of multiple detection models improve the accuracy of functional indicator estimates compared to single models?
Main contribution:
- C1: Propose an approach to evaluating vehicle detection in EO imagery from a functional perspective, taking into account its impact on the estimation of area activity indicators.
- C2: Introduce of a set of functional metrics enabling the quantitative assessment of estimation errors for vehicle density, parking lot occupancy, and traffic intensity proxies.
- C3: Propose a model selection and fusion strategy driven by functional performance indicators, demonstrating that pairing complementary detectors—identified through functional rather than classical evaluation—improves vehicle counting stability and reduces density estimation errors beyond single-model performance.
- C4: Analyze the impact of model fusion on the reliability of area activity indicators.
The remainder of the paper is organized as follows. Section 2 presents the proposed multi-stage framework for vehicle detection and functional analysis, including the estimation of vehicle density and parking occupancy, as well as the fusion of detection models. Section 3 describes the experimental setup and provides a comprehensive analysis of the results, covering both classical detection metrics and functional indicators such as accuracy counting, density estimation, and occupancy assessment. Section 4 discusses the obtained results, including the impact of domain shift, the role of fine-tuning, the limitations of classical metrics, and the effectiveness of model fusion. Finally, Section 5 concludes the paper and outlines directions for future research.
2. Materials and Methods
2.1. Data
This work utilizes a proprietary dataset prepared in the YOLO standard, designed for the task of vehicle detection in satellite imagery. The dataset comprises 640 × 640-pixel images, which are cropped sections of imagery from WorldView-2 (Westminster, CO, USA), WorldView-3 (Westminster, CO, USA), and archival Pleiades (Toulouse, France) data.
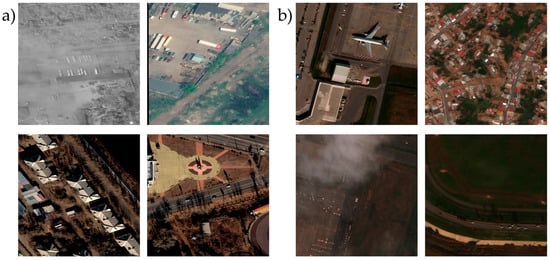
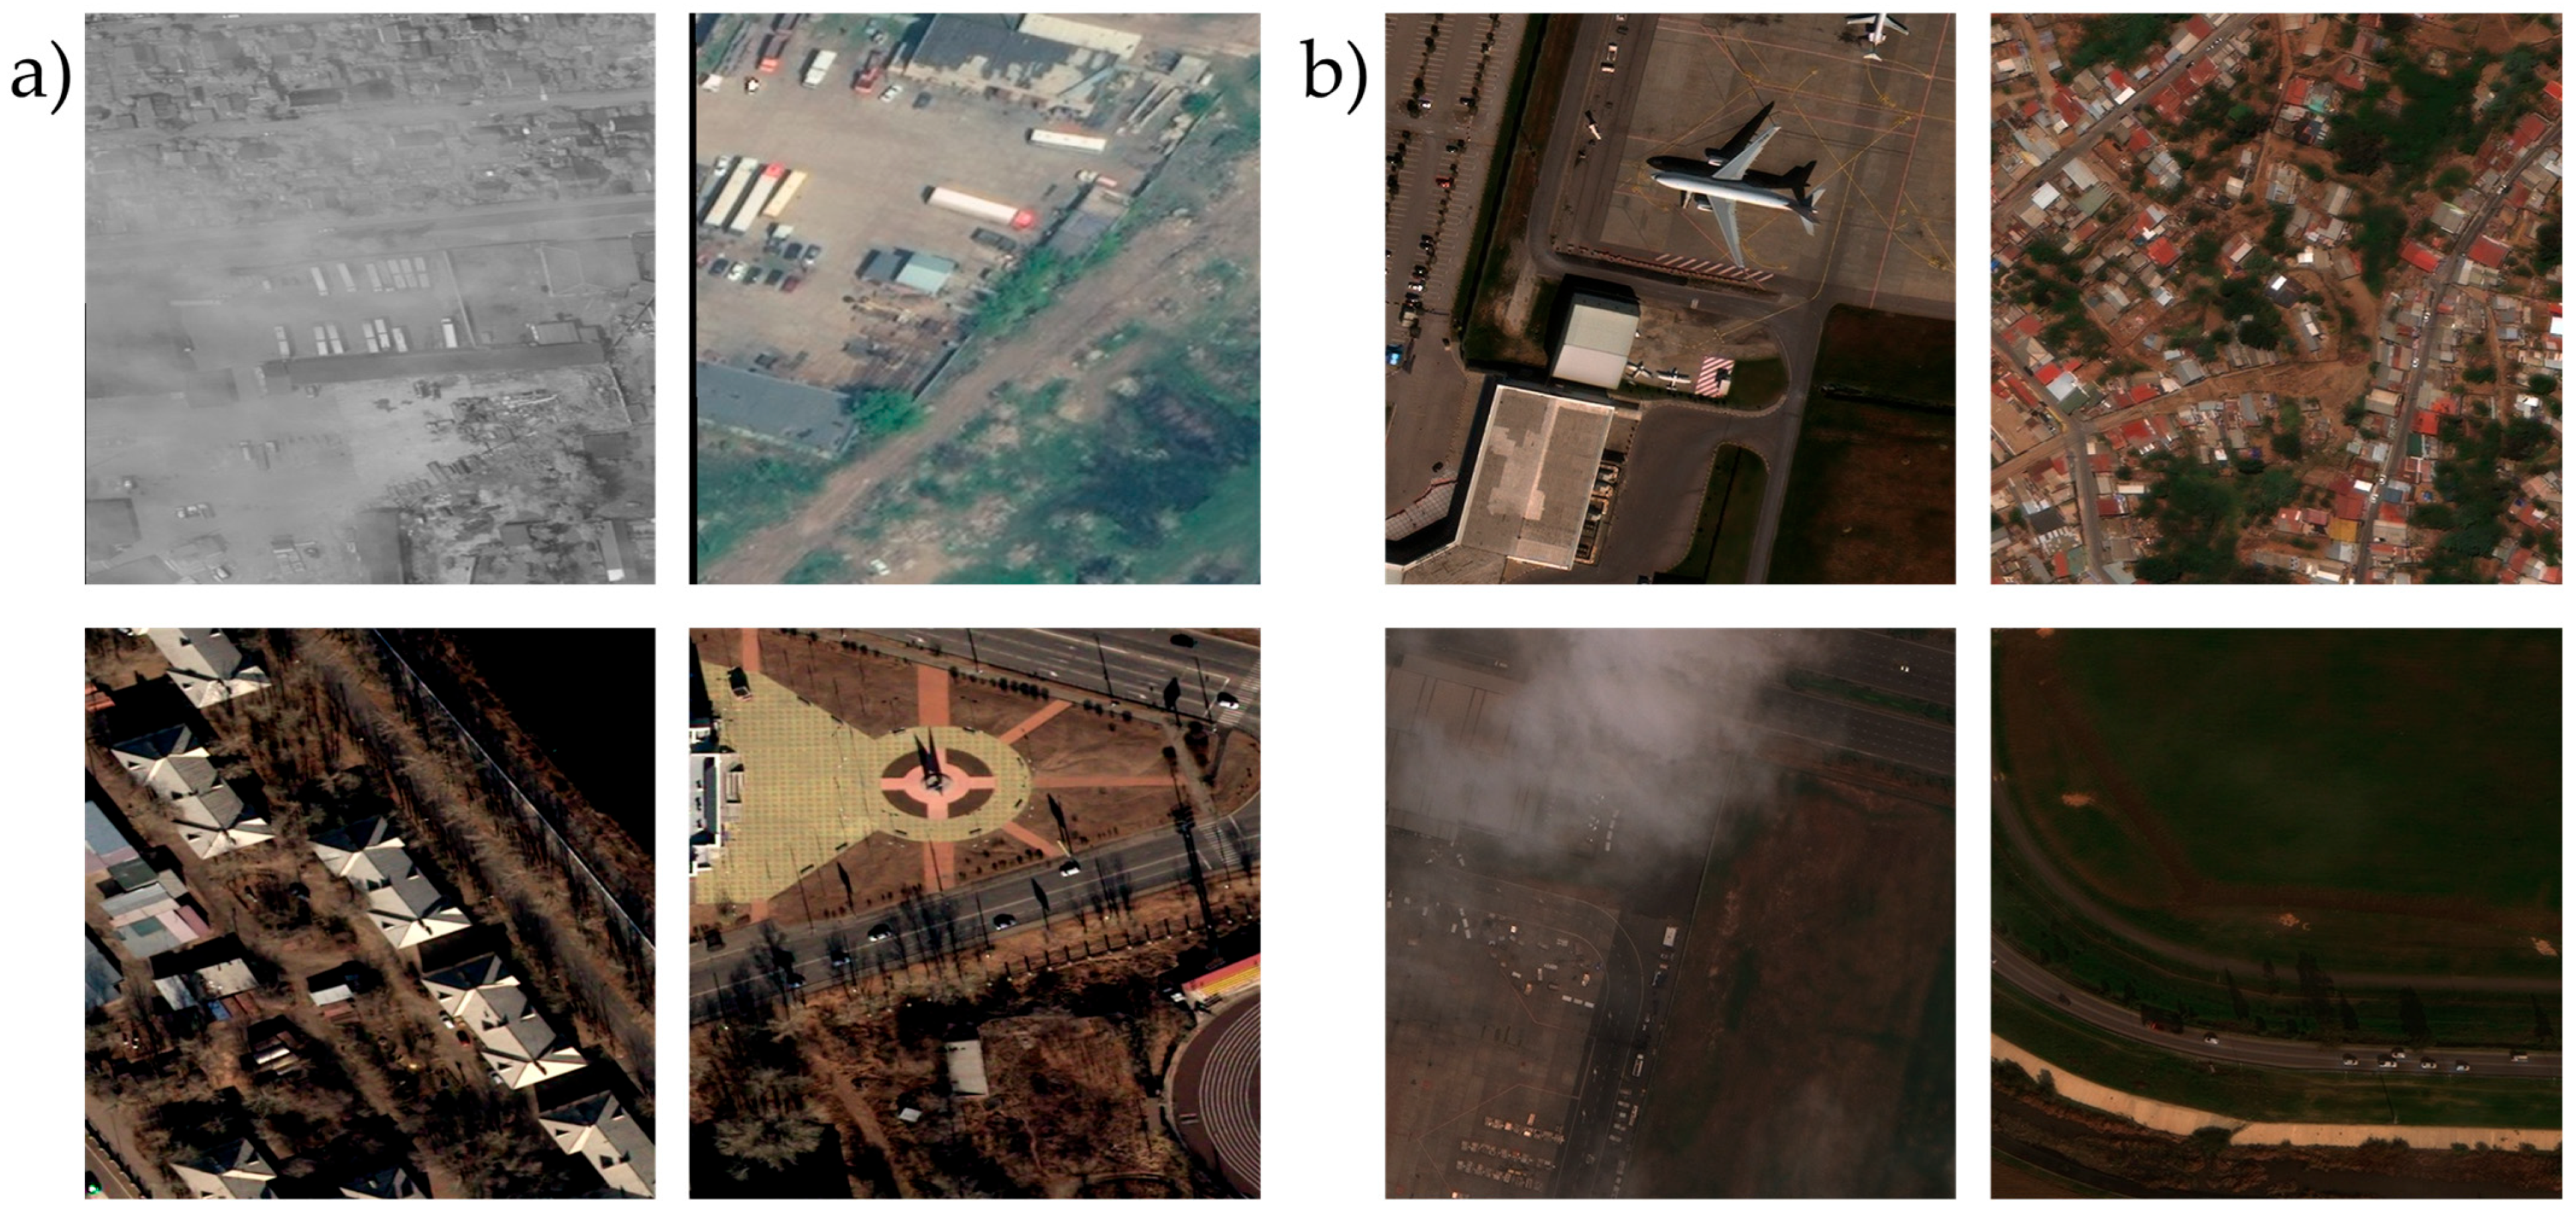
Images subjected to pansharpening were used in the dataset preparation, allowing for a high spatial resolution. Pansharpening improves the spatial representation of small objects, which is particularly important for vehicle detection in high-resolution EO imagery. However, it may also introduce spectral distortions and local artifacts that can affect the appearance of objects and background textures. Previous studies indicate that the influence of pansharpening on deep learning-based object detection depends on both the fusion method and the target object scale. In this work, the Gram–Schmidt pansharpening method was used due to its favorable balance between spatial enhancement and spectral preservation. The input data are characterized by varying spatial resolution—ranging from approximately 0.3 m (WorldView-3) to approximately 1 m (Pleiades). Consequently, objects representing vehicles occupy different sizes in the images, ranging from approximately 135 × 135 pixels for larger vehicles (e.g., trucks) to approximately 20 × 20 pixels for small passenger vehicles (Figure 1a).
Figure 1.
Example image patches used in the study: (a) samples from the proposed dataset, (b) samples from the xView dataset.
The dataset was divided into three subsets: training, validation, and test, and contains a total of 24,240 images, including 15,650 in the training set, 5643 in the validation set, and 2947 in the test set. The detection task was formulated as a single-class problem (vehicle), and all annotations were recorded as normalized bounding boxes.
To expand the analysis and evaluate the models’ generalization ability, the publicly available xView dataset [32] was also used, containing high-resolution satellite imagery with object annotations. Due to the nature of the research, only classes corresponding to vehicles were extracted from the original dataset and transformed into a single-class problem (vehicle), analogous to the approach used in the proprietary dataset. Specifically, the following xView category identifiers were merged into a single vehicle class: Small Car, Bus, Pickup Truck, Utility Truck, Truck, Cargo Truck, Truck Tractor, Trailer, Truck Tractor with Box Trailer, Truck Tractor with Flatbed Trailer and Truck Tractor with Liquid Tank. Very large vehicles such as trains and aircraft were excluded. This mapping follows the convention adopted in prior xView-based vehicle detection studies and ensures consistency with the single-class formulation used in the proprietary dataset. The data were also prepared in the YOLO standard, comprising images and corresponding annotations in the form of normalized bounding boxes.
After processing, the xView dataset contains 14,424 images, including 11,539 in the training set, 1442 in the validation set, and 1443 in the test set. The total number of object annotations is 438,603, with an average of approximately 30.4 vehicles per image.
The xView dataset (Figure 1b) is characterized by high object density and significant scene diversity, covering urban, industrial, and infrastructure areas. Compared to the proprietary dataset, it contains a significantly larger number of objects per image, leading to numerous instances of partial object overlap and clusters of objects.
Analysis of bounding box statistics also indicates the presence of objects of varying scales, ranging from very small (less than 0.01% of the image area) to relatively large objects occupying up to approximately 24% of the image area, which further increases the complexity of the detection task.
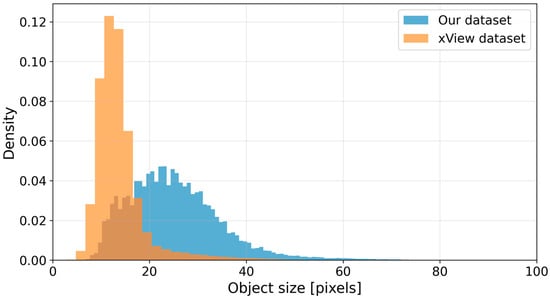
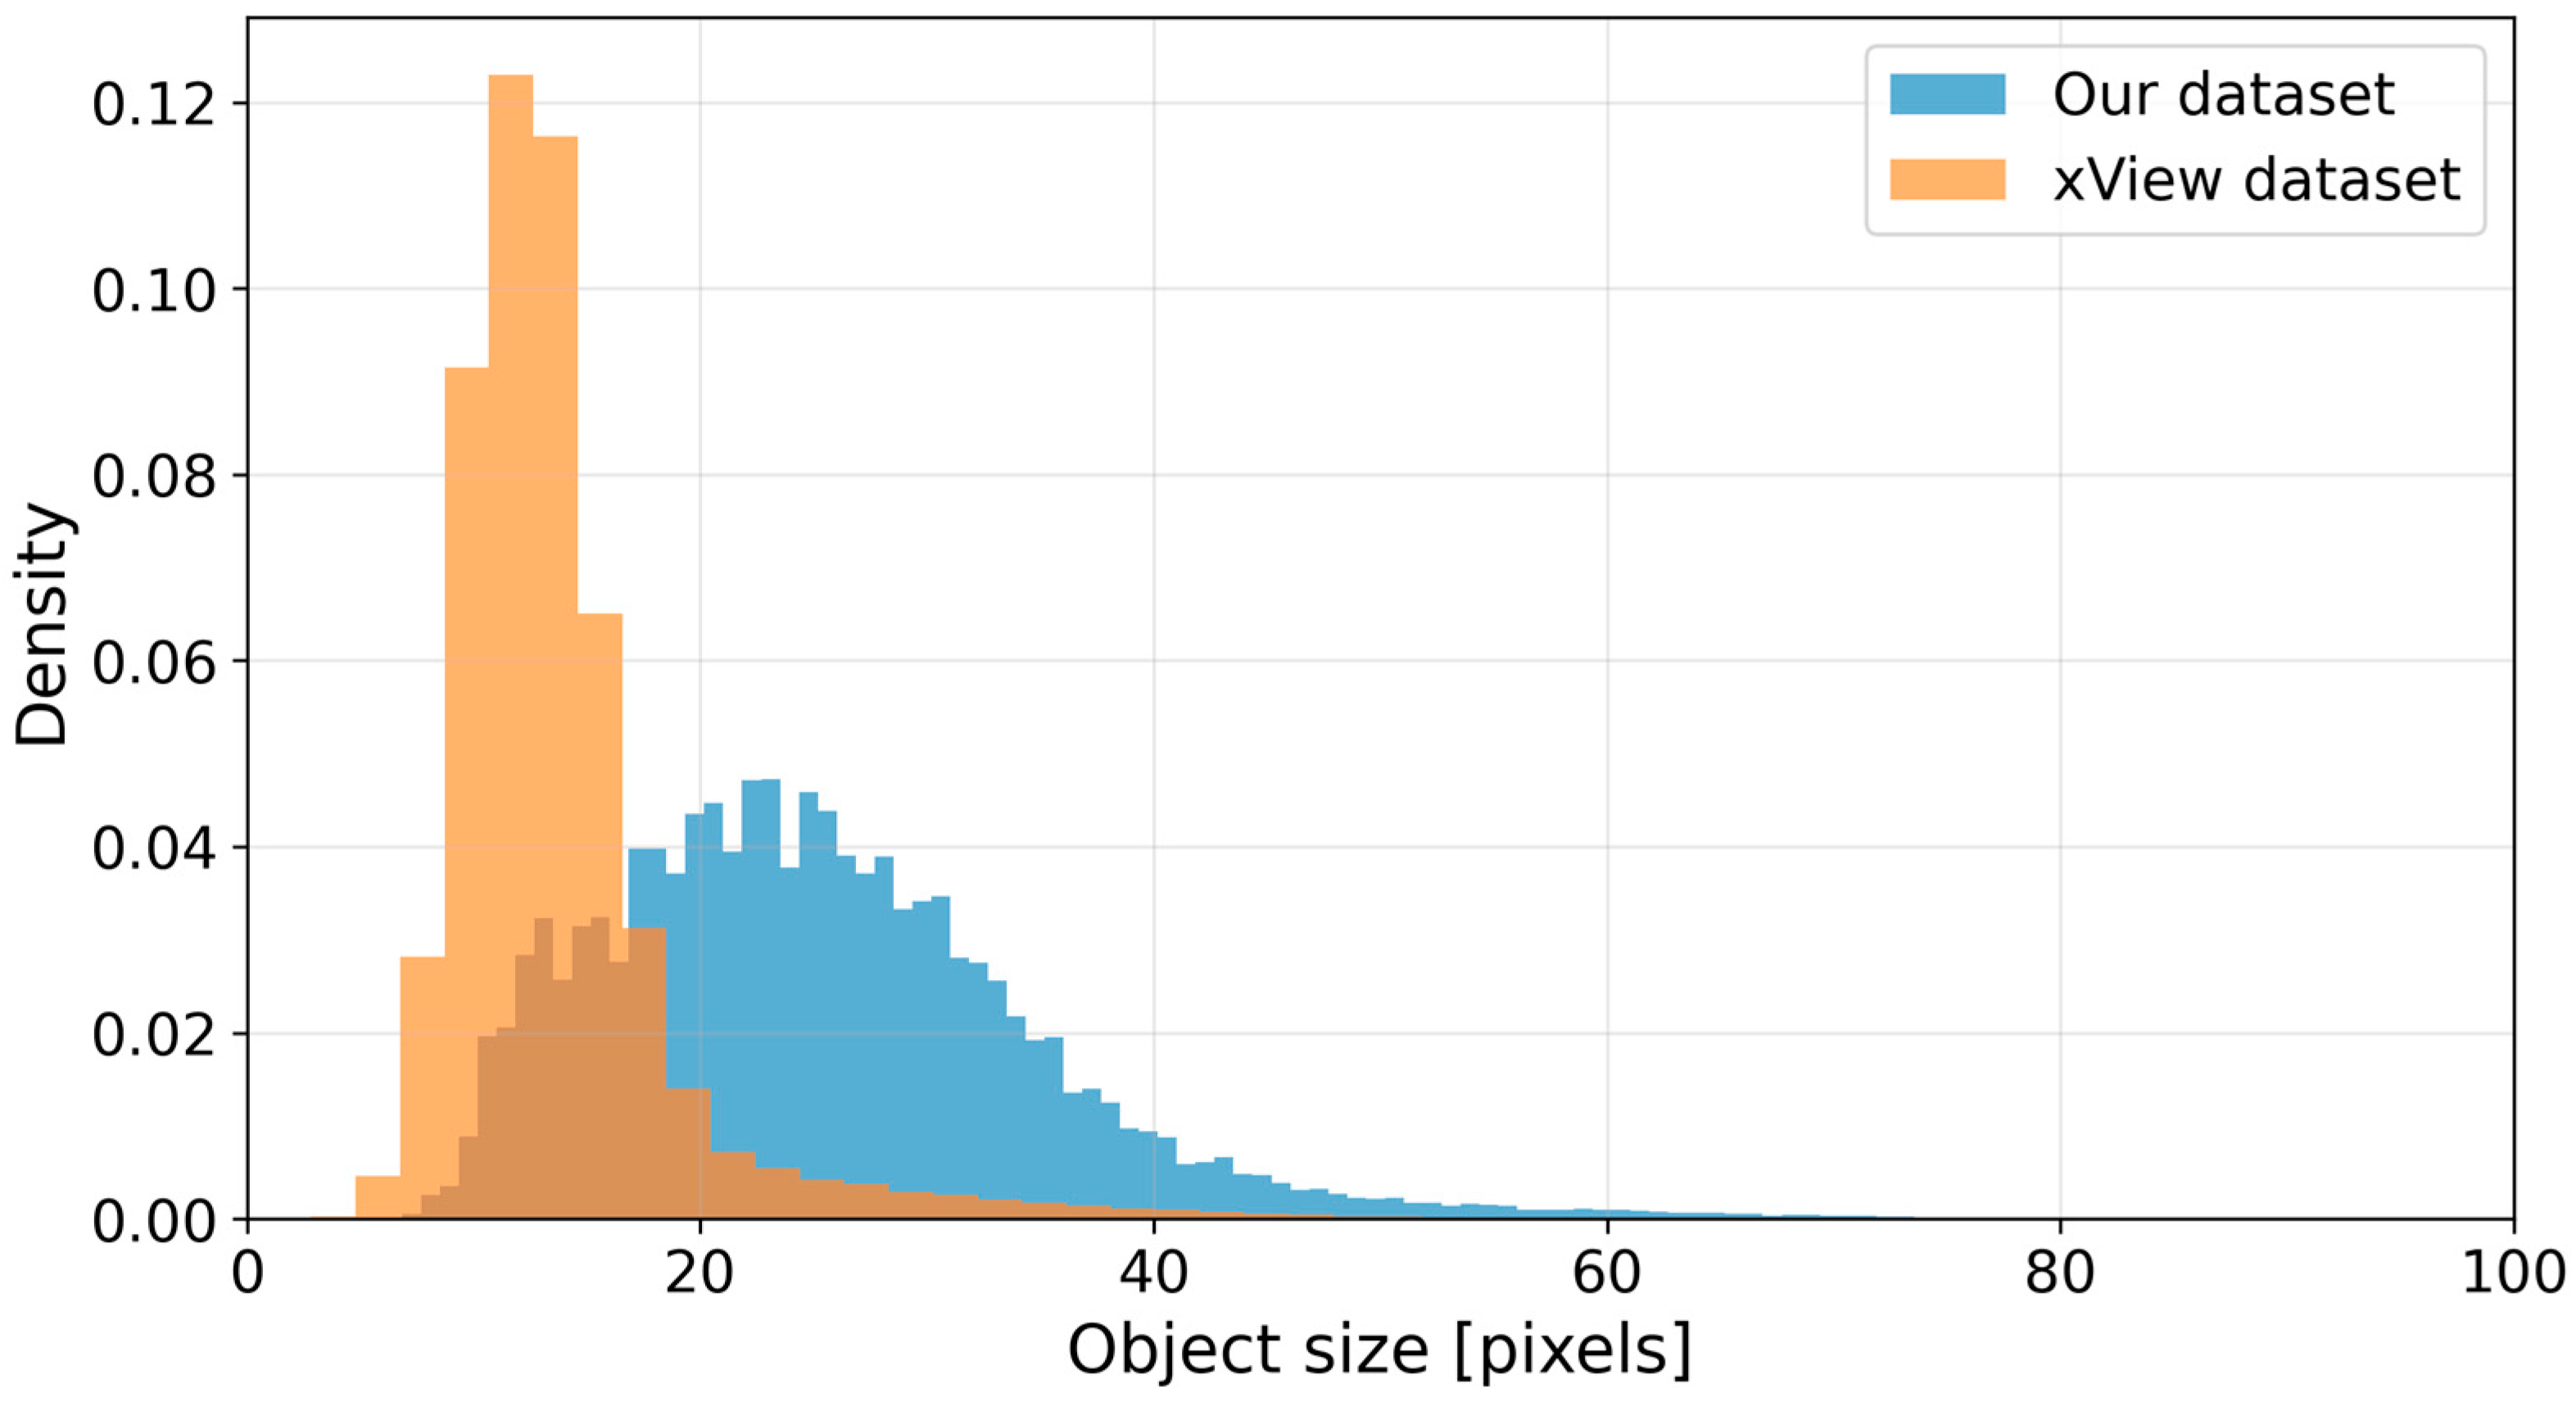
To quantitatively analyze the distribution of object sizes, an additional analysis of the statistics of bounding boxes in the pixel space was conducted (Figure 2). The histograms are presented in normalized form (density), which allows for a direct comparison of the distributions despite the varying number of objects in the analyzed datasets.
Figure 2.
Distribution of object sizes expressed in pixel units for the proprietary dataset and the xView dataset. The proprietary dataset is characterized by a broader range of object sizes, with a peak around 20–25 pixels, while the xView dataset exhibits a higher concentration of smaller objects, typically below 20 pixels.
As shown in the figure, the proprietary dataset is characterized by a predominance of objects ranging in size from approximately 15 to 35 pixels, with the peak of the distribution occurring around 20–25 pixels. In the case of the xView dataset, a shift in the distribution toward smaller values is observed, with a distinct peak in the range of approximately 10–20 pixels, indicating a higher proportion of very small objects. At the same time, the xView dataset exhibits a more concentrated distribution (lower variance), while the author’s dataset covers a wider range of object sizes, including larger vehicles. These results confirm significant differences in the characteristics of both datasets and indicate a different level of detection difficulty resulting from both the scale and density of objects.
2.2. Models
This study analyzed the following models: YOLOv9 [33], YOLOv10 [34], YOLOv11 [35], YOLOv12 [36] and YOLOv26 [37]. This selection stems from the need to assess the impact of successive modifications to the architecture of single-stage detectors on the effectiveness of detecting small objects in satellite imagery. In addition, to broaden the comparison beyond single-stage detectors and assess the generalizability of the proposed functional evaluation framework, three representative non-YOLO architectures were included: RT-DETR [38], Swin Transformer [39], and Cascade R-CNN [40].
The selected models represent different stages in the development of the YOLO family. The YOLOv9 model serves as a stable reference solution, utilizing an architecture based on efficient gradient propagation and feature aggregation modules (GELAN). The YOLOv10–YOLOv12 models have been optimized for the detection and inference process. They incorporate, among other things, an end-to-end approach that eliminates the need for classical non-maximum suppression (NMS), as well as modifications to the backbone and neck structures and improvements to multi-scale feature representation. The YOLOv26 model builds on these foundations through further improvements in feature extraction and aggregation, as well as optimization of the overall detection pipeline.
RT-DETR (Real-Time Detection Transformer) [38] is a transformer-based end-to-end object detector developed by Baidu. Unlike YOLO-family models, RT-DETR eliminates the need for non-maximum suppression post-processing through an attention-based decoding mechanism. It processes multiscale features using an efficient hybrid encoder that decouples intra-scale interaction and cross-scale fusion, and employs IoU-aware query selection to focus on the most relevant objects.
The Swin Transformer (Swin-T) [39] is a hierarchical vision transformer using shifted windows for feature extraction. Its design enables efficient computation of self-attention within local windows while allowing cross-window connections through the shifting mechanism, yielding a multi-scale feature representation well-suited for dense prediction tasks. In the context of object detection, Swin Transformer serves as a powerful backbone within two-stage frameworks, achieving strong performance on small object detection benchmarks.
Cascade R-CNN [40] is a multi-stage two-stage detector composed of a sequence of detectors trained with progressively increasing IoU thresholds. This cascade architecture addresses the quality mismatch between training and inference: each stage resamples hypotheses from the previous one, improving localization quality and reducing close false positives. Cascade R-CNN consistently achieves high localization precision and remains a competitive baseline for scenarios where accurate bounding-box quality is critical, such as the vehicle detection task considered in this study.
This comparison of models enables the analysis of the impact of architectural changes on detection quality and the identification of solutions best suited for detecting small objects with high spatial density, characteristic of parking scenes in high-resolution imagery. By including representatives of single-stage (YOLO family), transformer-based real-time (RT-DETR), transformer backbone (Swin-T), and multi-stage (Cascade R-CNN) paradigms, the study also demonstrates that the proposed functional evaluation framework is applicable beyond a single detector family. In particular, this allows for the evaluation of the models’ ability to separate closely spaced objects under conditions of partial overlap and low contrast relative to the background.
2.3. Methods
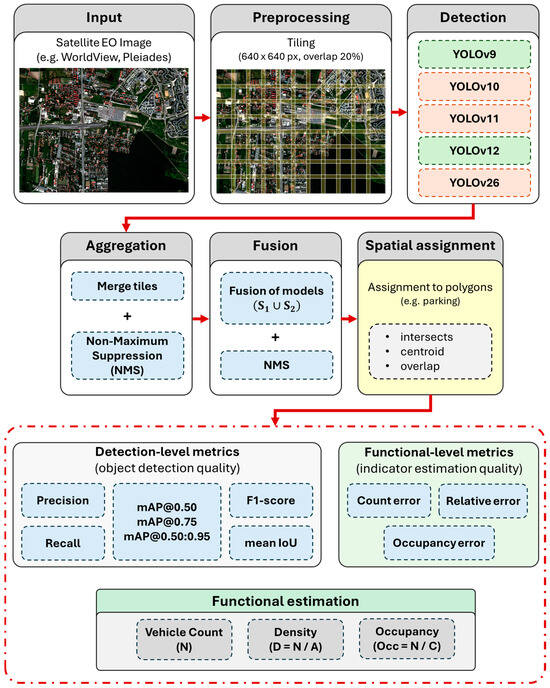
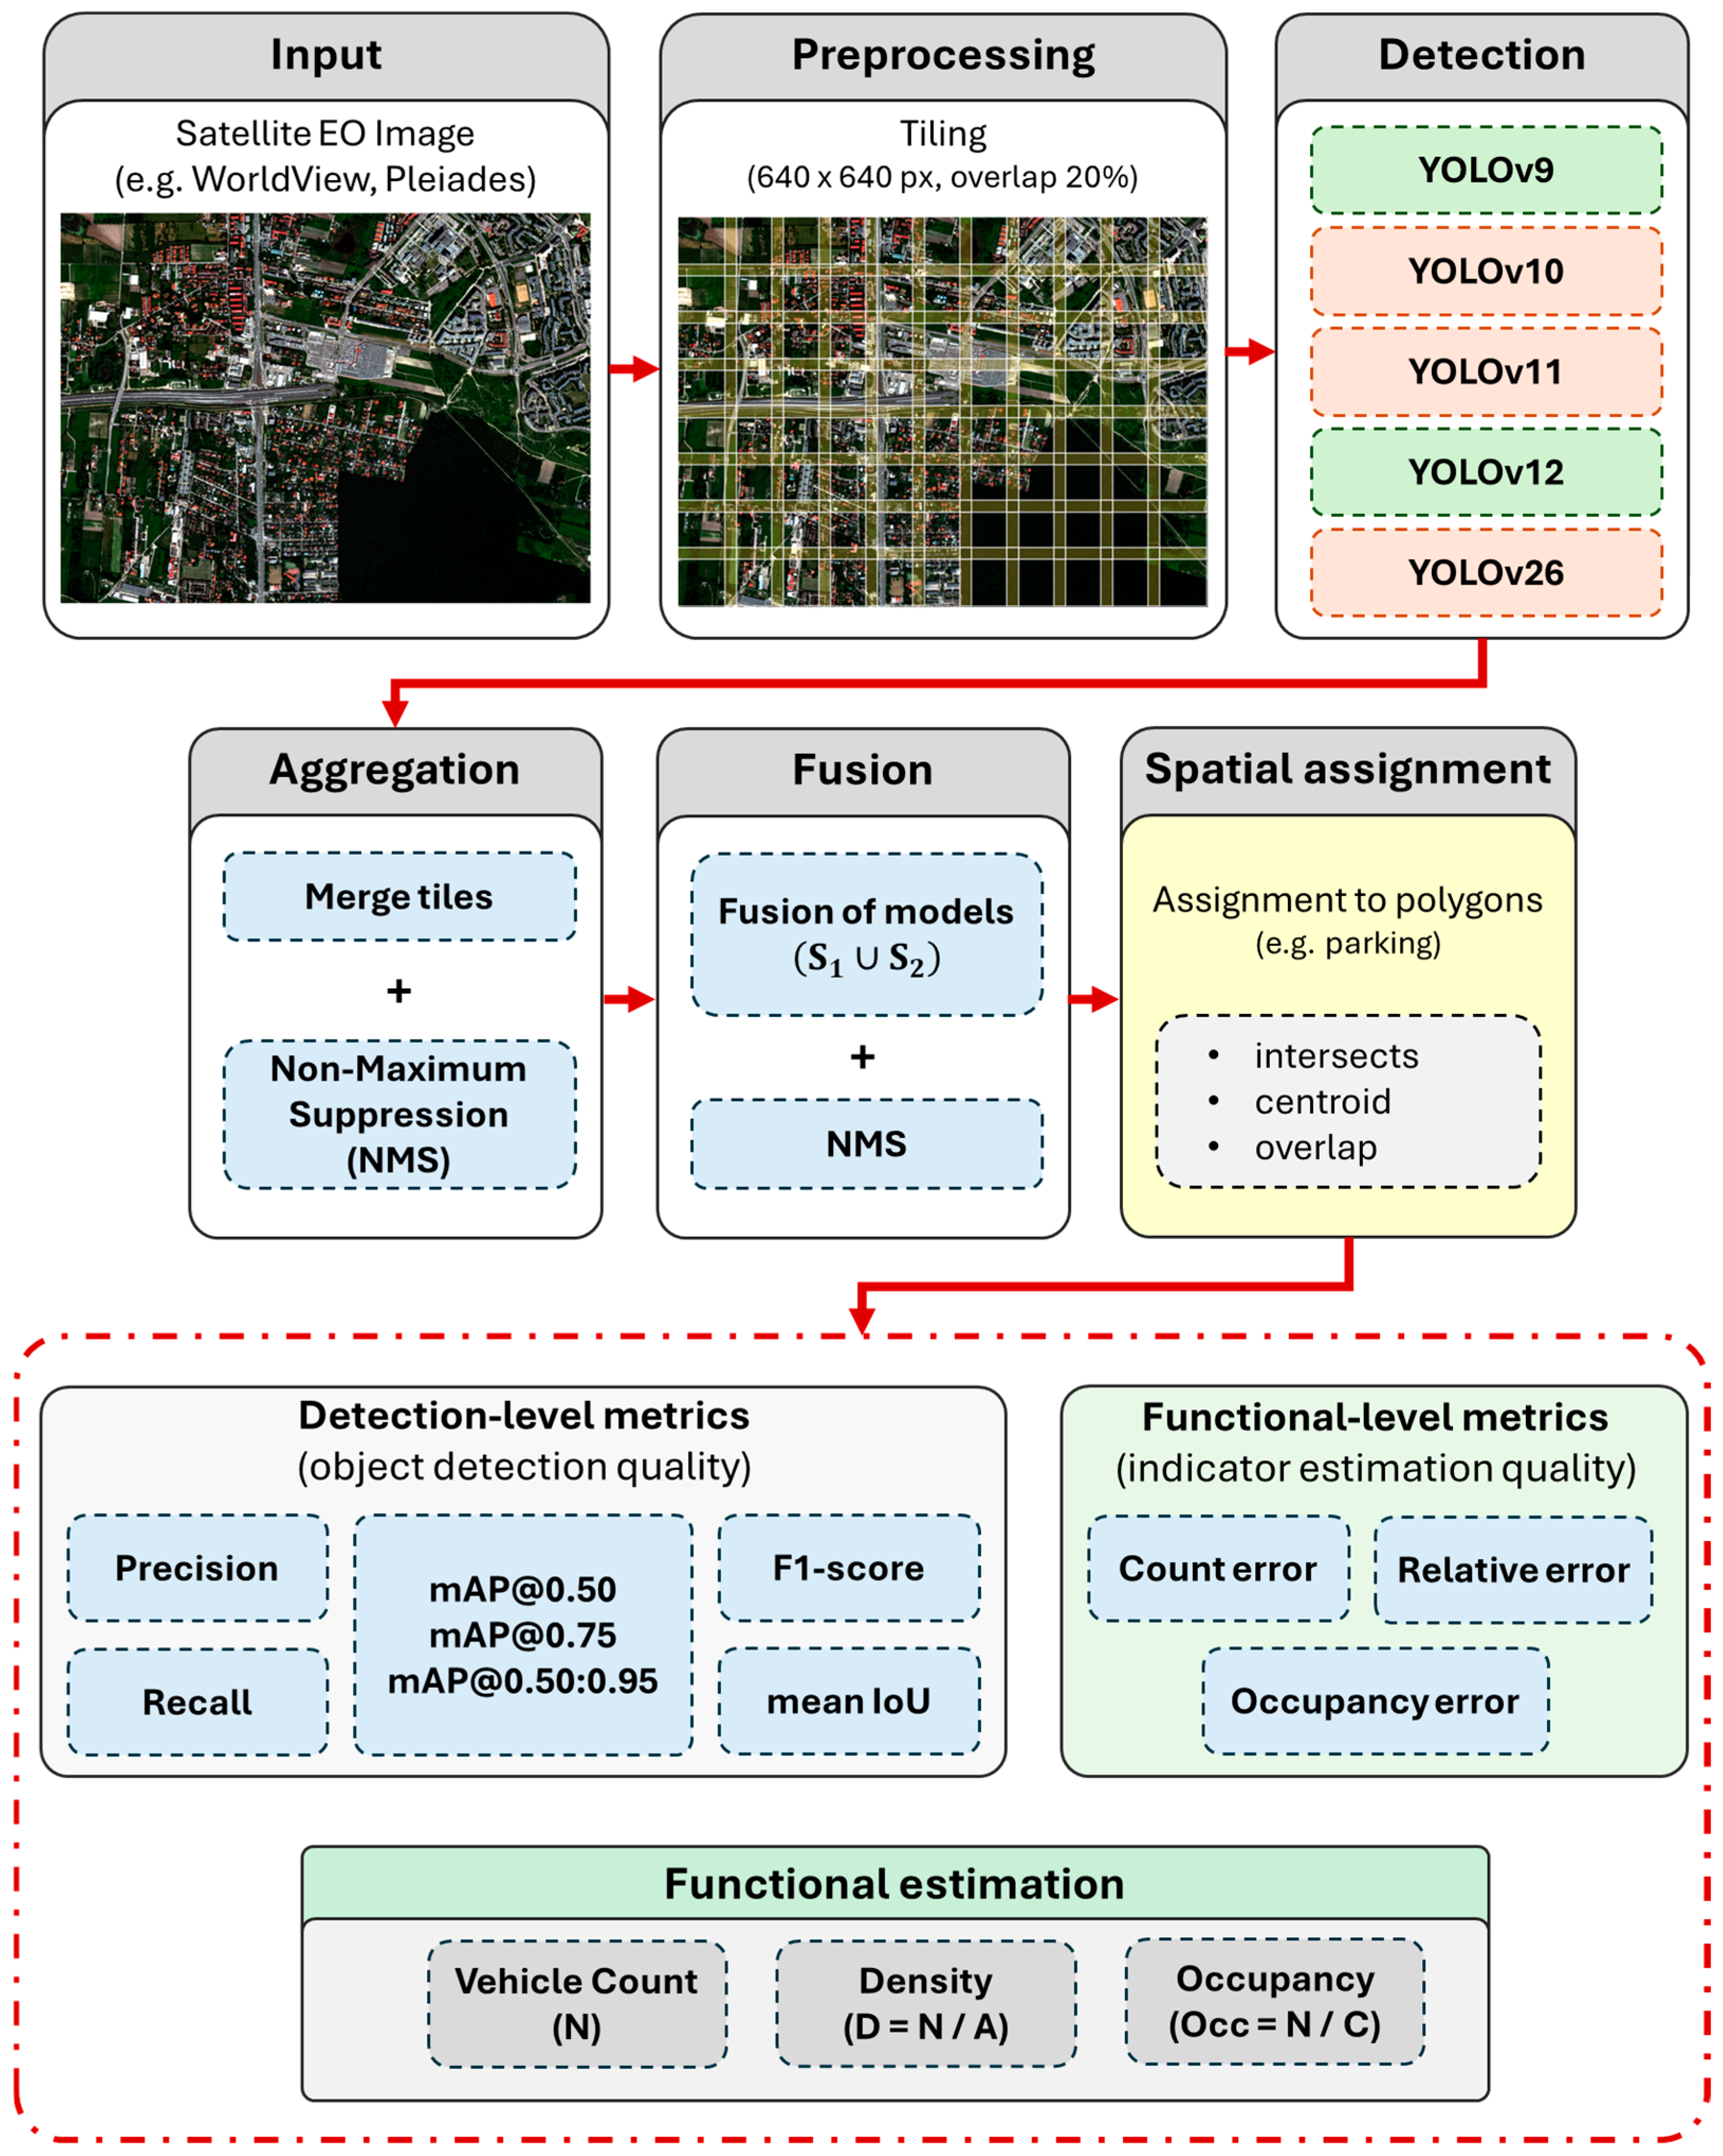
This paper proposes a methodology for estimating vehicle density in optical Earth observation (EO) imagery, focused on the functional analysis of areas such as parking lots. A diagram of the proposed methodology is presented in Figure 3. Unlike the classical approach, in which vehicle detection is an end in itself, we adopt a perspective in which detection results are used to determine indicators describing spatial activity.
Figure 3.
Overview of the proposed multi-stage framework for vehicle detection and functional indicator estimation.
The proposed approach is a three-stage process. In the first stage, the effectiveness of the detection models is evaluated at the level of individual objects. In the second stage, their suitability for estimating functional indicators, such as vehicle density and parking lot occupancy, is analyzed. In the third stage, a procedure for fusing the results of multiple detection models is applied, with the aim of reducing the number of false positives and false negatives, thereby improving the quality of aggregated indicators.
Additionally, the problem of processing large-format images, which require division into tiles, was addressed. Let denote the analyzed satellite image. Then, a set of tiles is defined:
where each tile has a fixed size and a specific coverage level relative to neighboring tiles. Independent detection is performed for each tile, and then the results are aggregated. The final set of detections for the image is obtained by aggregating the results from all tiles and eliminating spatial redundancy. To eliminate duplicates arising in areas where tiles overlap, a non-maximum suppression (NMS) procedure was applied [41].
Furthermore, the impact of tiling parameters, such as tile size and coverage level, on detection quality was analyzed, which allowed for the development of an effective procedure for reducing duplicate detections in tile overlap areas. The methodology defined in this way enables a consistent analysis of the vehicle detection process in EO imagery, covering both the detection and functional levels, while taking into account the practical aspects of satellite data processing.
2.3.1. Detection Quality Assessment
In the first stage, a classical evaluation of vehicle detection models was conducted on a test set. The objective of this stage was to determine the quality of the models at the level of individual detections and to lay the groundwork for further functional analysis. These metrics serve as a reference point for further functional analysis, but do not directly reflect the quality of aggregated indicator estimates.
For each image (in the test set), the prediction results were compared with reference data using a matching criterion based on the Intersection over Union (IoU) metric. A prediction was considered correct (True Positive, TP) if it corresponded to a reference object of the same class and satisfied the condition:
where and denote the areas of the prediction bounding box and the reference bounding box, respectively, and is the adopted agreement threshold. Based on this, three detection categories were distinguished: True Positives (TP), False Positives (FP), and False Negatives (FN).
A set of standard detection metrics, supplemented by a frame localization quality measure, was used to evaluate model quality. The set of metrics used can be found in Table 1.
Table 1.
Definitions of vehicle detection evaluation metrics.
However, it should be emphasized that IoU-based metrics are insufficient for evaluating the usefulness of models in functional analysis. In particular, even when the condition is satisfied, the size and shape of the prediction frames may differ from the reference frames. Consequently, models may achieve high detection metric values while simultaneously generating errors in the estimation of the number of objects or their spatial distribution. For this reason, an additional stage of functional analysis was introduced.
2.3.2. Functional Analysis
In the second stage, a functional analysis of vehicle detection results was proposed, in which object detection is treated as an intermediate step leading to the estimation of indicators describing the analyzed area.
Let denote the polygon representing the parking lot area, and let denote the detection frame of the th vehicle. To assign the detection to the parking lot area, three strategies were considered:
- (1)
- centroid-based: ,
- (2)
- intersection-based: ,
- (3)
- area-ratio-based: ,
where denotes the frame’s centroid, denotes the area, and is a fixed threshold.
In the subsequent analysis, the intersection-based approach was adopted as the primary assignment method, while the other methods were used to assess the stability of the obtained results.
Based on the assigned detections, the number of vehicles in the area was determined:
Vehicle density was defined as:
where N denotes the number of vehicles, and denotes the area of the analyzed zone.
The parking occupancy rate was calculated as the ratio of the number of vehicles within the parking zone to its capacity or reference value
where ‘’ denotes the parking capacity or the reference value, estimated through manual interpretation of high-resolution imagery by counting marked parking spaces within each analyzed zone.
To assess the quality of the estimates, the following error measures were introduced:
where denotes the reference value, and denotes the value estimated by the model.
Metrics defined in this way allow for the evaluation of models in aggregate terms, providing a basis for inferring their ability to correctly estimate spatial indicators.
2.3.3. Fusion of Results
To increase the reliability of the detection results and reduce the impact of the errors characteristic of individual models, a procedure for fusing detection results based on spatial aggregation of predictions was introduced.
Let and denote two detection models, and and the corresponding detection sets:
where denotes the detection frame of the -th object obtained by the model .
The detection set after fusion is defined as:
where denotes the non-maximum suppression operator acting in geometric space, whose purpose is to eliminate redundant detections with a high degree of overlap. The IoU threshold for the fusion NMS operator was set to 0.50, consistent with the matching threshold used in the primary detection evaluation (Equation (2)) and with common practice in the object-detection fusion literature [41,42], ensuring that the duplicate-removal criterion is aligned with the same geometric agreement standard used elsewhere in the evaluation pipeline.
The introduction of fusion stems from the observation that different detection models may exhibit complementary error characteristics, encompassing both differences in detection completeness (recall) and localization precision. In particular, objects missed by one model may be correctly detected by the other, leading to a reduction in the number of false negatives. At the same time, the aggregation of detection sets results in an increase in the number of duplicates, which is effectively reduced through the application of the NMS procedure.
It should be emphasized that more advanced fusion strategies are proposed in the literature, such as Soft-NMS [41] or Weighted Boxes Fusion (WBF) [42], which additionally take into account detection confidence information and enable more precise frame aggregation. However, in this work, a classical NMS-based approach was used as a deliberately simplified solution, allowing for the isolation of the influence of model complementarity itself on the quality of results, without introducing additional factors related to the parameterization of the fusion process.
From the perspective of functional analysis, fusion directly affects the stability of estimates of aggregated metrics, such as the number of objects or their spatial density, limiting the propagation of detection errors to higher levels of analysis. In particular, reducing false negatives improves counting accuracy, while eliminating duplicates limits the risk of overestimating the number of objects.
In this work, the fusion procedure was applied to the two models with the highest performance as determined by functional analysis, which yielded a solution combining high detection sensitivity with a limited level of systematic errors. This approach enables more stable and reliable estimates of functional indicators under diverse observational conditions.
3. Results
3.1. Implementation Details
All YOLO-family models (YOLOv9, YOLOv10, YOLOv11, YOLOv12, YOLOv26) were trained under a unified experimental protocol. RT-DETR, Cascade R-CNN, and Swin Transformer (Swin-T), due to architectural differences, was trained with an adjusted batch size. All experiments shared the following configuration unless stated otherwise:
- Input resolution: 640 × 640 px
- Epochs: 250, with early stopping patience of 30
- Optimizer: SGD, initial learning rate 0.01, cosine annealing schedule, weight decay 0.0005
- Batch size: 16 (YOLO-family models), 8 (RT-DETR, Cascade R-CNN, Swin-T)
- Augmentation: standard Ultralytics (version 8.3.0) pipeline (mosaic, random flip, HSV jitter)
- Inference: confidence threshold 0.25, NMS IoU threshold 0.45
- Random seed: 42 (fixed throughout to ensure reproducibility)
- Hardware: NVIDIA A100 GPU (80 GB VRAM), CUDA 12.4, cuDNN 8.8.1.
For Strategy III, xView-pretrained weights were used as initialization with the learning rate reduced to 0.001. The fusion model (YOLOv9_12) applied NMS over the union of both detection sets using an IoU threshold of 0.50.
3.2. Detection Quality
The first stage of the research involved evaluating the quality of vehicle detection models. The objective of this stage was to determine the models’ performance at the level of individual objects and to establish a reference point for further functional analysis. As part of the experiment, three model training strategies were considered: (I) training from scratch on a proprietary dataset, (II) training on the xView dataset, and (III) transfer learning, in which weights pretrained on the xView dataset were further fine-tuned on the proprietary dataset.
The models were evaluated on a test set from the proprietary dataset, which allowed an analysis of their suitability for the target application scenario. Additionally, models trained exclusively on the xView dataset were evaluated on two test sets: the proprietary dataset and the xView dataset. The metric values obtained for the xView test set are given in parentheses, allowing for a direct comparison of the impact of the data domain on detection quality (Table 2). To illustrate the proposed functional evaluation methodology, five parking areas were selected as representative test cases covering a range of vehicle densities and observational conditions. A broader statistical validation of the functional metrics across an extended set of parking areas is presented in Discussion (Section 4).
Table 2.
Detection performance of YOLO models under different training strategies. Values in parentheses indicate results obtained on the xView test set.
The conducted research showed that the effectiveness of vehicle detection in high-resolution satellite imagery is strongly dependent on both the characteristics of the training data and the adopted learning strategy. Models trained exclusively on the xView dataset, despite their high performance on the dataset’s own data, exhibit limited generalization ability to imagery from other sensors (e.g., WorldView), which stems from differences in resolution, radiometric properties, and data processing methods. Consequently, a significant decline in detection quality is observed, particularly in terms of recall.
The best results were obtained for models fine-tuned on the proprietary dataset, confirming the key role of domain adaptation in remote sensing tasks. In this variant, the models achieved the highest metric values and stable performance under target data conditions. Accordingly, Strategy III weights were used for both component models of the YOLOv9_12 fusion, as this training variant yielded the highest detection performance across all evaluated architectures.
In light of the obtained results and the identified limitations of classical evaluation metrics, particularly mAP, further analysis was directed toward a functional evaluation of detection models. The objective of this stage was to determine the actual utility of the models in the context of remote sensing analyses, taking into account detection completeness, the number of false positives, and the accuracy of object localization. The functional analysis focuses on evaluating detection completeness, the number of false positives, and object localization accuracy, enabling the identification of differences between models that are not fully reflected by standard quantitative metrics. Particular attention was paid to the YOLOv9 and YOLOv12 models as solutions with complementary detection properties.
As part of the functional analysis, a detailed evaluation of the detection models’ performance was conducted, going beyond standard quantitative metrics. The aim of this stage was to determine the actual usefulness of the models in the context of remote sensing analysis, with particular emphasis on their ability to correctly identify objects in complex high-density scenes and under variable observation conditions. The analysis considered aspects such as detection completeness (the number of detected objects relative to the reference), the number of false positives (false detections), as well as object localization accuracy expressed through metrics based on the IoU coefficient.
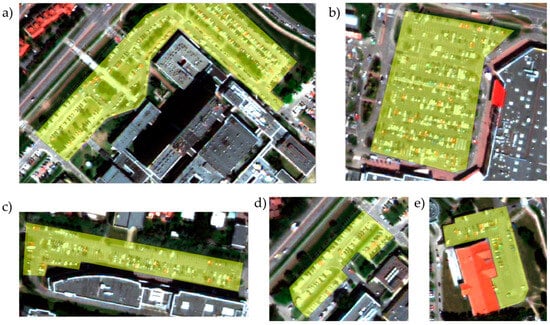
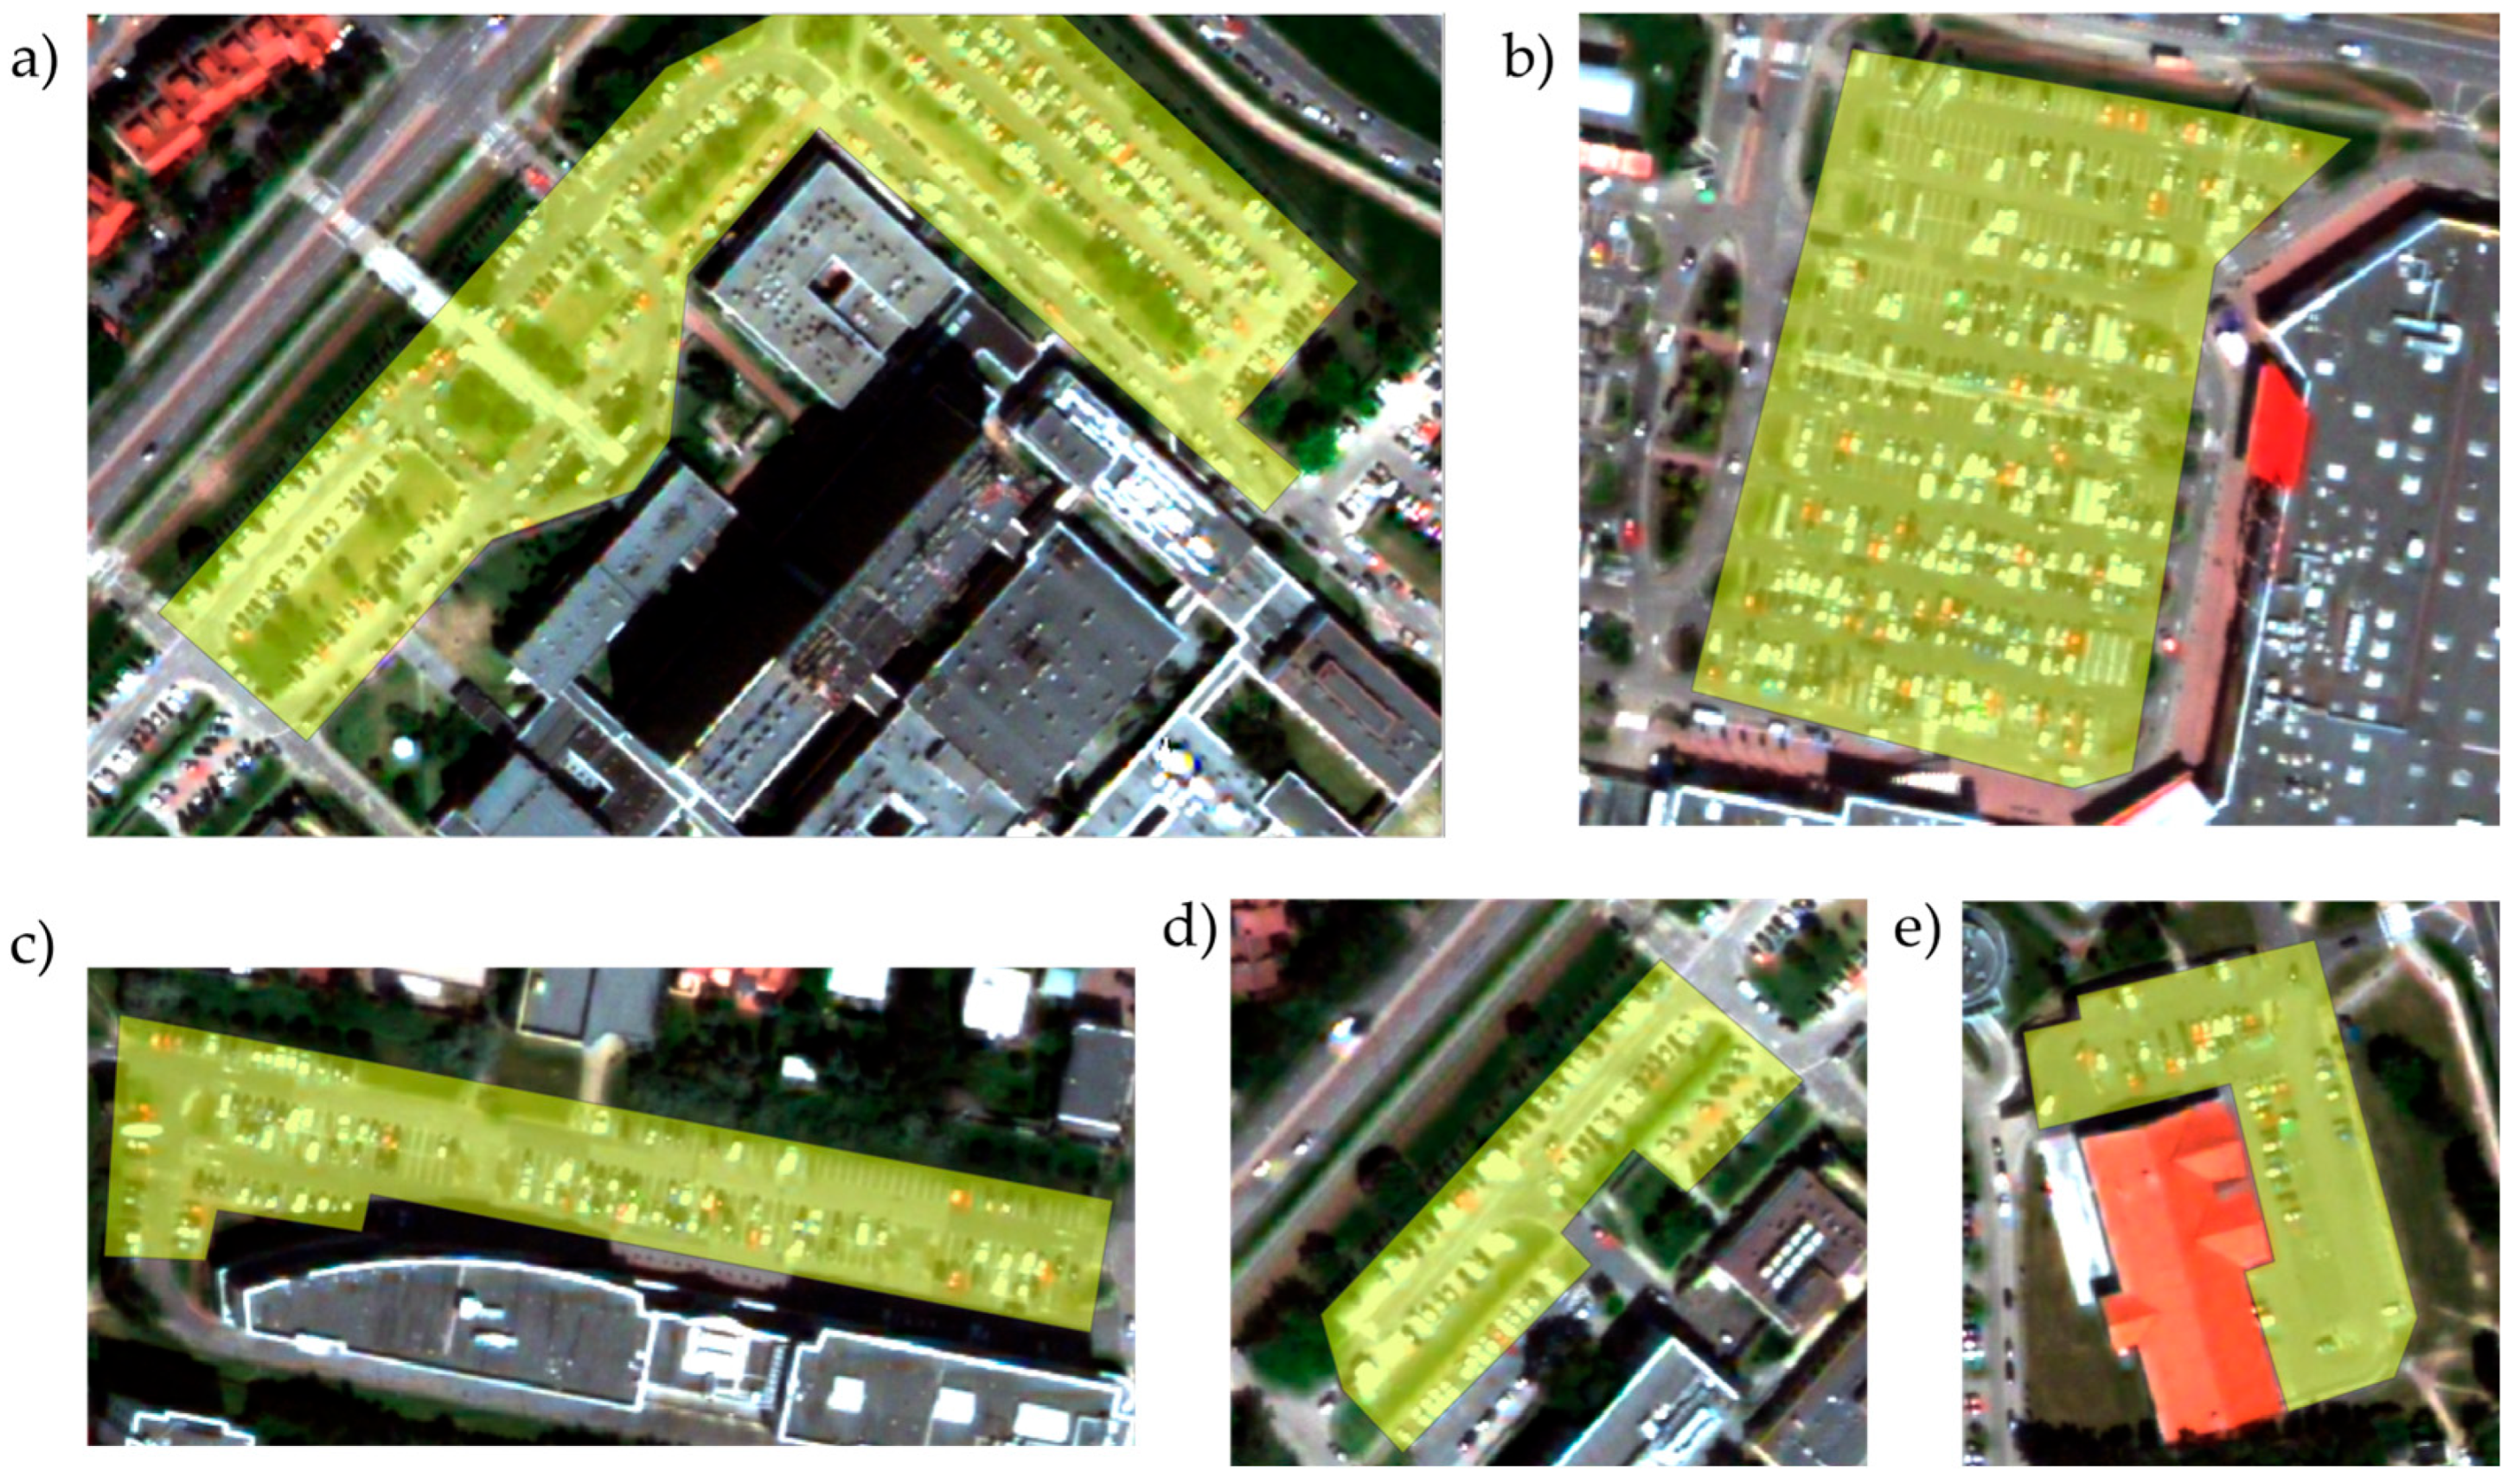
The functional analysis utilized five test areas comprising parking lots with varying degrees of vehicle density. The input data consisted of segments of WorldView-2 satellite imagery subjected to pansharpening using the Gram–Schmidt method. Despite the high spatial resolution (0.5 m), the detection of passenger vehicles remains a challenging task due to the small size of the objects in the image. Although a spatial resolution of 0.5 m can be considered high in the context of satellite EO imagery, passenger vehicles are still represented by a relatively limited number of pixels, typically ranging from approximately 8 to 15 pixels along the vehicle length, depending on the acquisition geometry and vehicle type. Consequently, vehicles remain small objects from the perspective of deep learning detectors, making reliable localization and the separation of closely spaced vehicles significantly more difficult, particularly in densely occupied parking areas (Figure 4).
Figure 4.
Test parking areas used in the functional analysis, extracted from WorldView-2 imagery (pansharpened using the Gram–Schmidt method, GSD = 0.5), with analyzed regions marked in yellow. All scenes are located in Central Europe. Approximate area of each analyzed parking zone: (a) parking_0 (15,863 m2), (b) parking_1 (11,611 m2), (c) parking_2 (6273 m2), (d) parking_3 (3479 m2), (e) parking_4 (4098 m2).
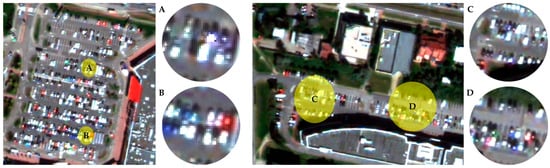
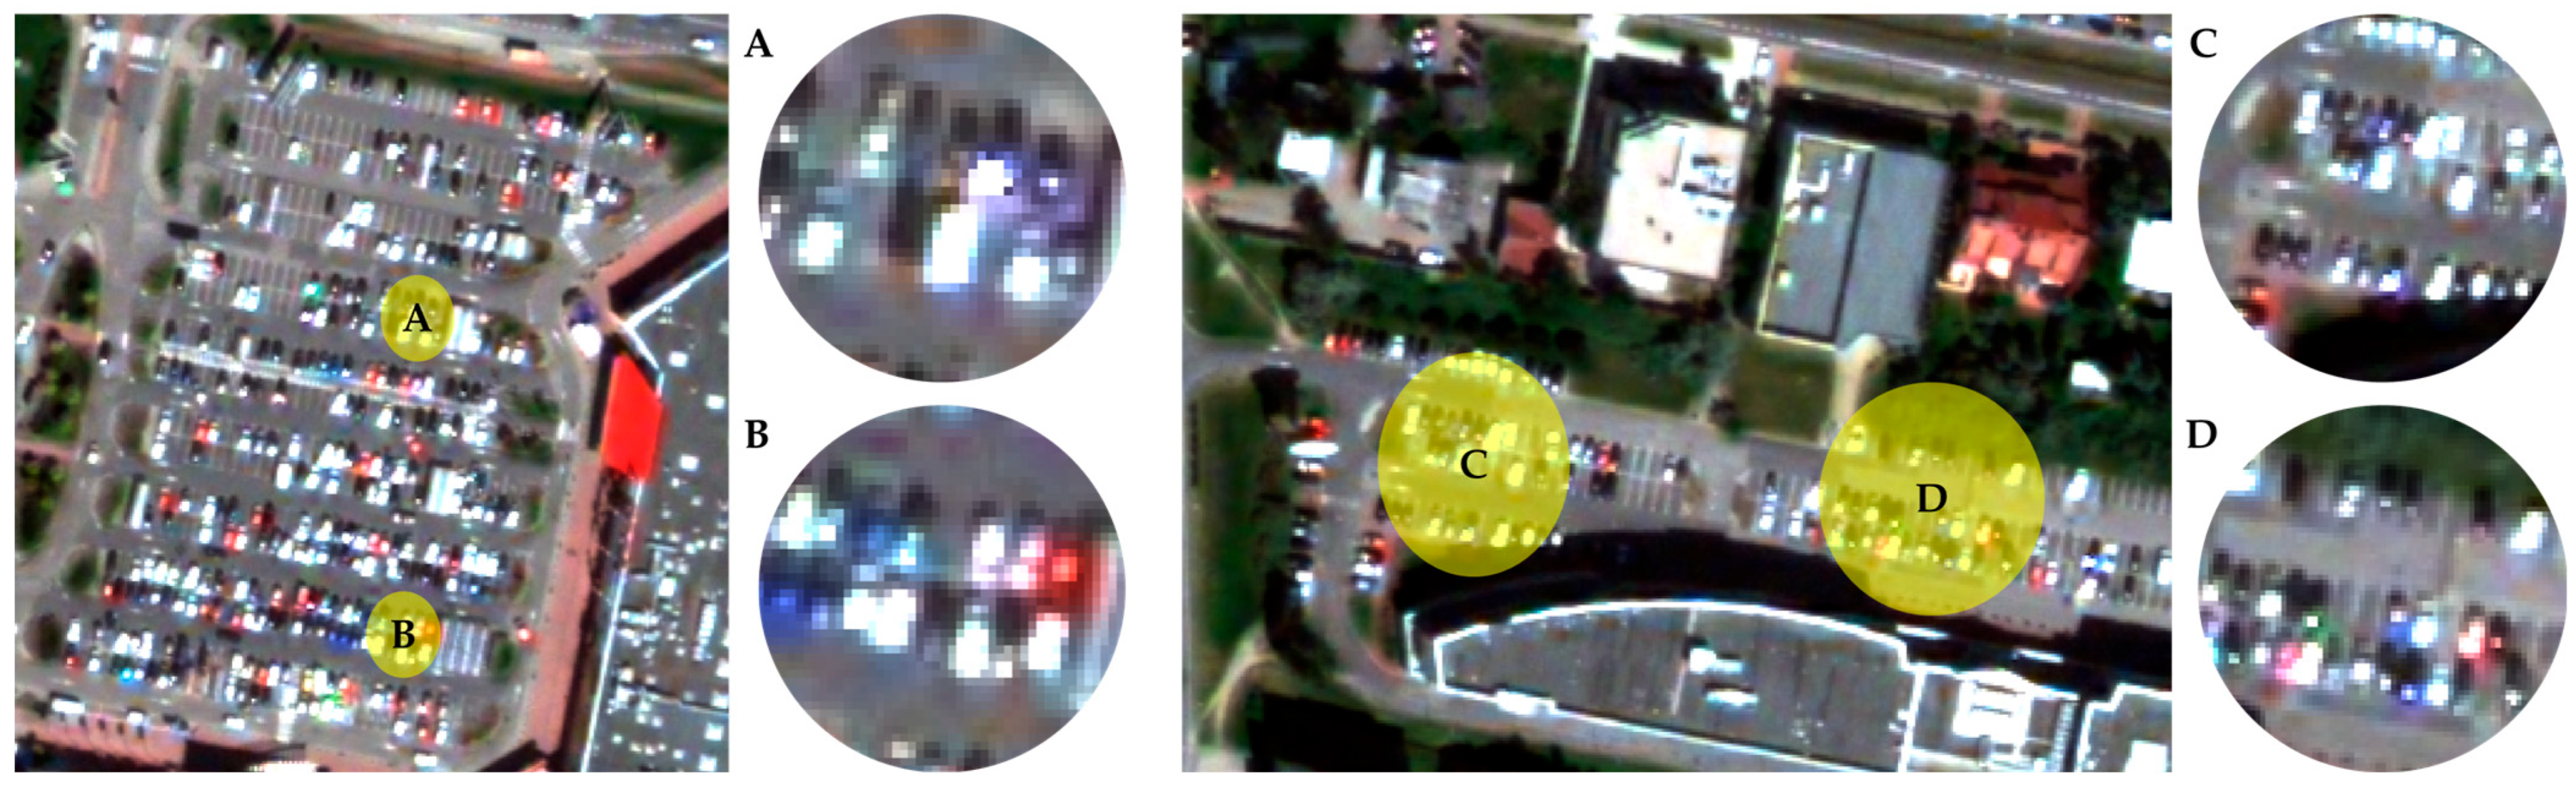
An additional challenge is posed by observation conditions—some vehicles are in the shade or under tree canopies, while dark-colored vehicles (gray, black) often blend into the background (asphalt surface). In contrast, for light-colored vehicles, local artifacts resulting from the reflection of sunlight are observed. These factors significantly affect detection quality and pose a realistic challenge for the analyzed models (Figure 5).
Figure 5.
Challenges in vehicle detection in satellite data (WorldView-2, GSD = 0.5, Central Europe): shadows, occlusion by trees, low contrast, and reflection artifacts for bright objects. Yellow circles indicate selected regions of interest, while capital letters (A–D) link these regions to the corresponding enlarged examples shown next to the satellite images.
The results confirm significant differences between the models in terms of their actual performance in object detection and counting tasks. As shown in Table 3, the model fusion-based approach (YOLOv9_12) achieves the lowest values for mean relative error (0.14), counting error (13.0), and density error (0.0023). At the same time, the global relative error for this model remains close to zero (−0.015), indicating no significant systematic over- or underestimation of the number of objects.
Table 3.
Comparison of detection-based vehicle counting performance and density estimation accuracy across models.
Compared to single-class models, YOLOv12 achieves a similar level of relative accuracy (Table 3), but is characterized by a higher counting error and a more pronounced tendency to underestimate the number of objects. In turn, the YOLOv9 model exhibits significantly larger relative errors and a systematic underestimation of the number of vehicles, which limits its usefulness in quantitative tasks. The remaining models (YOLOv10, YOLOv11, YOLOv26) are characterized by even larger errors, confirming their lower stability in the analyzed scenario. To further contextualize these results, three non-YOLO architectures were included in the functional evaluation: RT-DETR, Swin Transformer (Swin-T), and Cascade R-CNN. All three models exhibited higher functional errors than the best-performing YOLO variants.
Another important aspect of the analysis was evaluating the impact of the method used to assign detections to ground truth objects. As shown in Table 4, the results obtained for different matching strategies (centroid, intersects, overlap ratio) are similar, and in all cases, the YOLOv9_12 model achieves the best results. The slight differences in error values between the assignment methods indicate that the final assessment of detection quality depends only to a limited extent on the chosen matching strategy, which confirms the stability of the obtained results. Therefore, for the purposes of further functional analysis, the intersects method was adopted as the approach ensuring stable and representative results.
Table 4.
Impact of assignment method on vehicle counting accuracy.
A comparison of relative errors for individual parking lots indicates distinctly different characteristics of the YOLOv9 and YOLOv12 models and confirms the validity of their integration (Table 5). The YOLOv9 model exhibits high variability in the results across the analyzed areas—ranging from full agreement with the reference in the case of parking_4 to a very strong underestimation in parking_1 and parking_2. This means that despite the high detection completeness observed in the global analysis, its performance at the local level is less stable, particularly in scenes with higher vehicle density or more challenging observation conditions.
Table 5.
Variability of vehicle counting error across parking areas for different detection models.
Against this backdrop, the YOLOv12 model demonstrates significantly greater stability across different test areas. In its case, relative error values remain at a low and consistent level, indicating more predictable model behavior regardless of the scene’s specifics. At the same time, this model consistently shows a slight tendency to underestimate the number of vehicles, which is consistent with earlier observations regarding its more conservative detection strategy.
The most balanced results were obtained for the integrated YOLOv9_12 model, which in most cases achieves the lowest relative error values. This is particularly evident for parking_0, parking_1, and parking_3, where fusion allows for the reduction in errors present in the individual models. The results indicate that combining both models allows for the utilization of their complementary properties: on the one hand, YOLOv9’s ability to detect a greater number of objects, and on the other, YOLOv12’s greater stability and precision. Consequently, the fusion-based approach leads to more reliable counting results under diverse scene conditions.
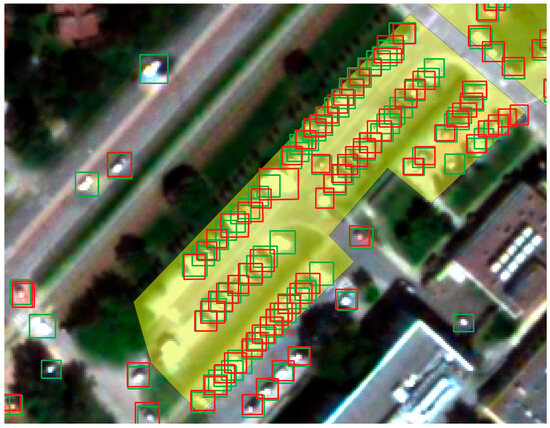
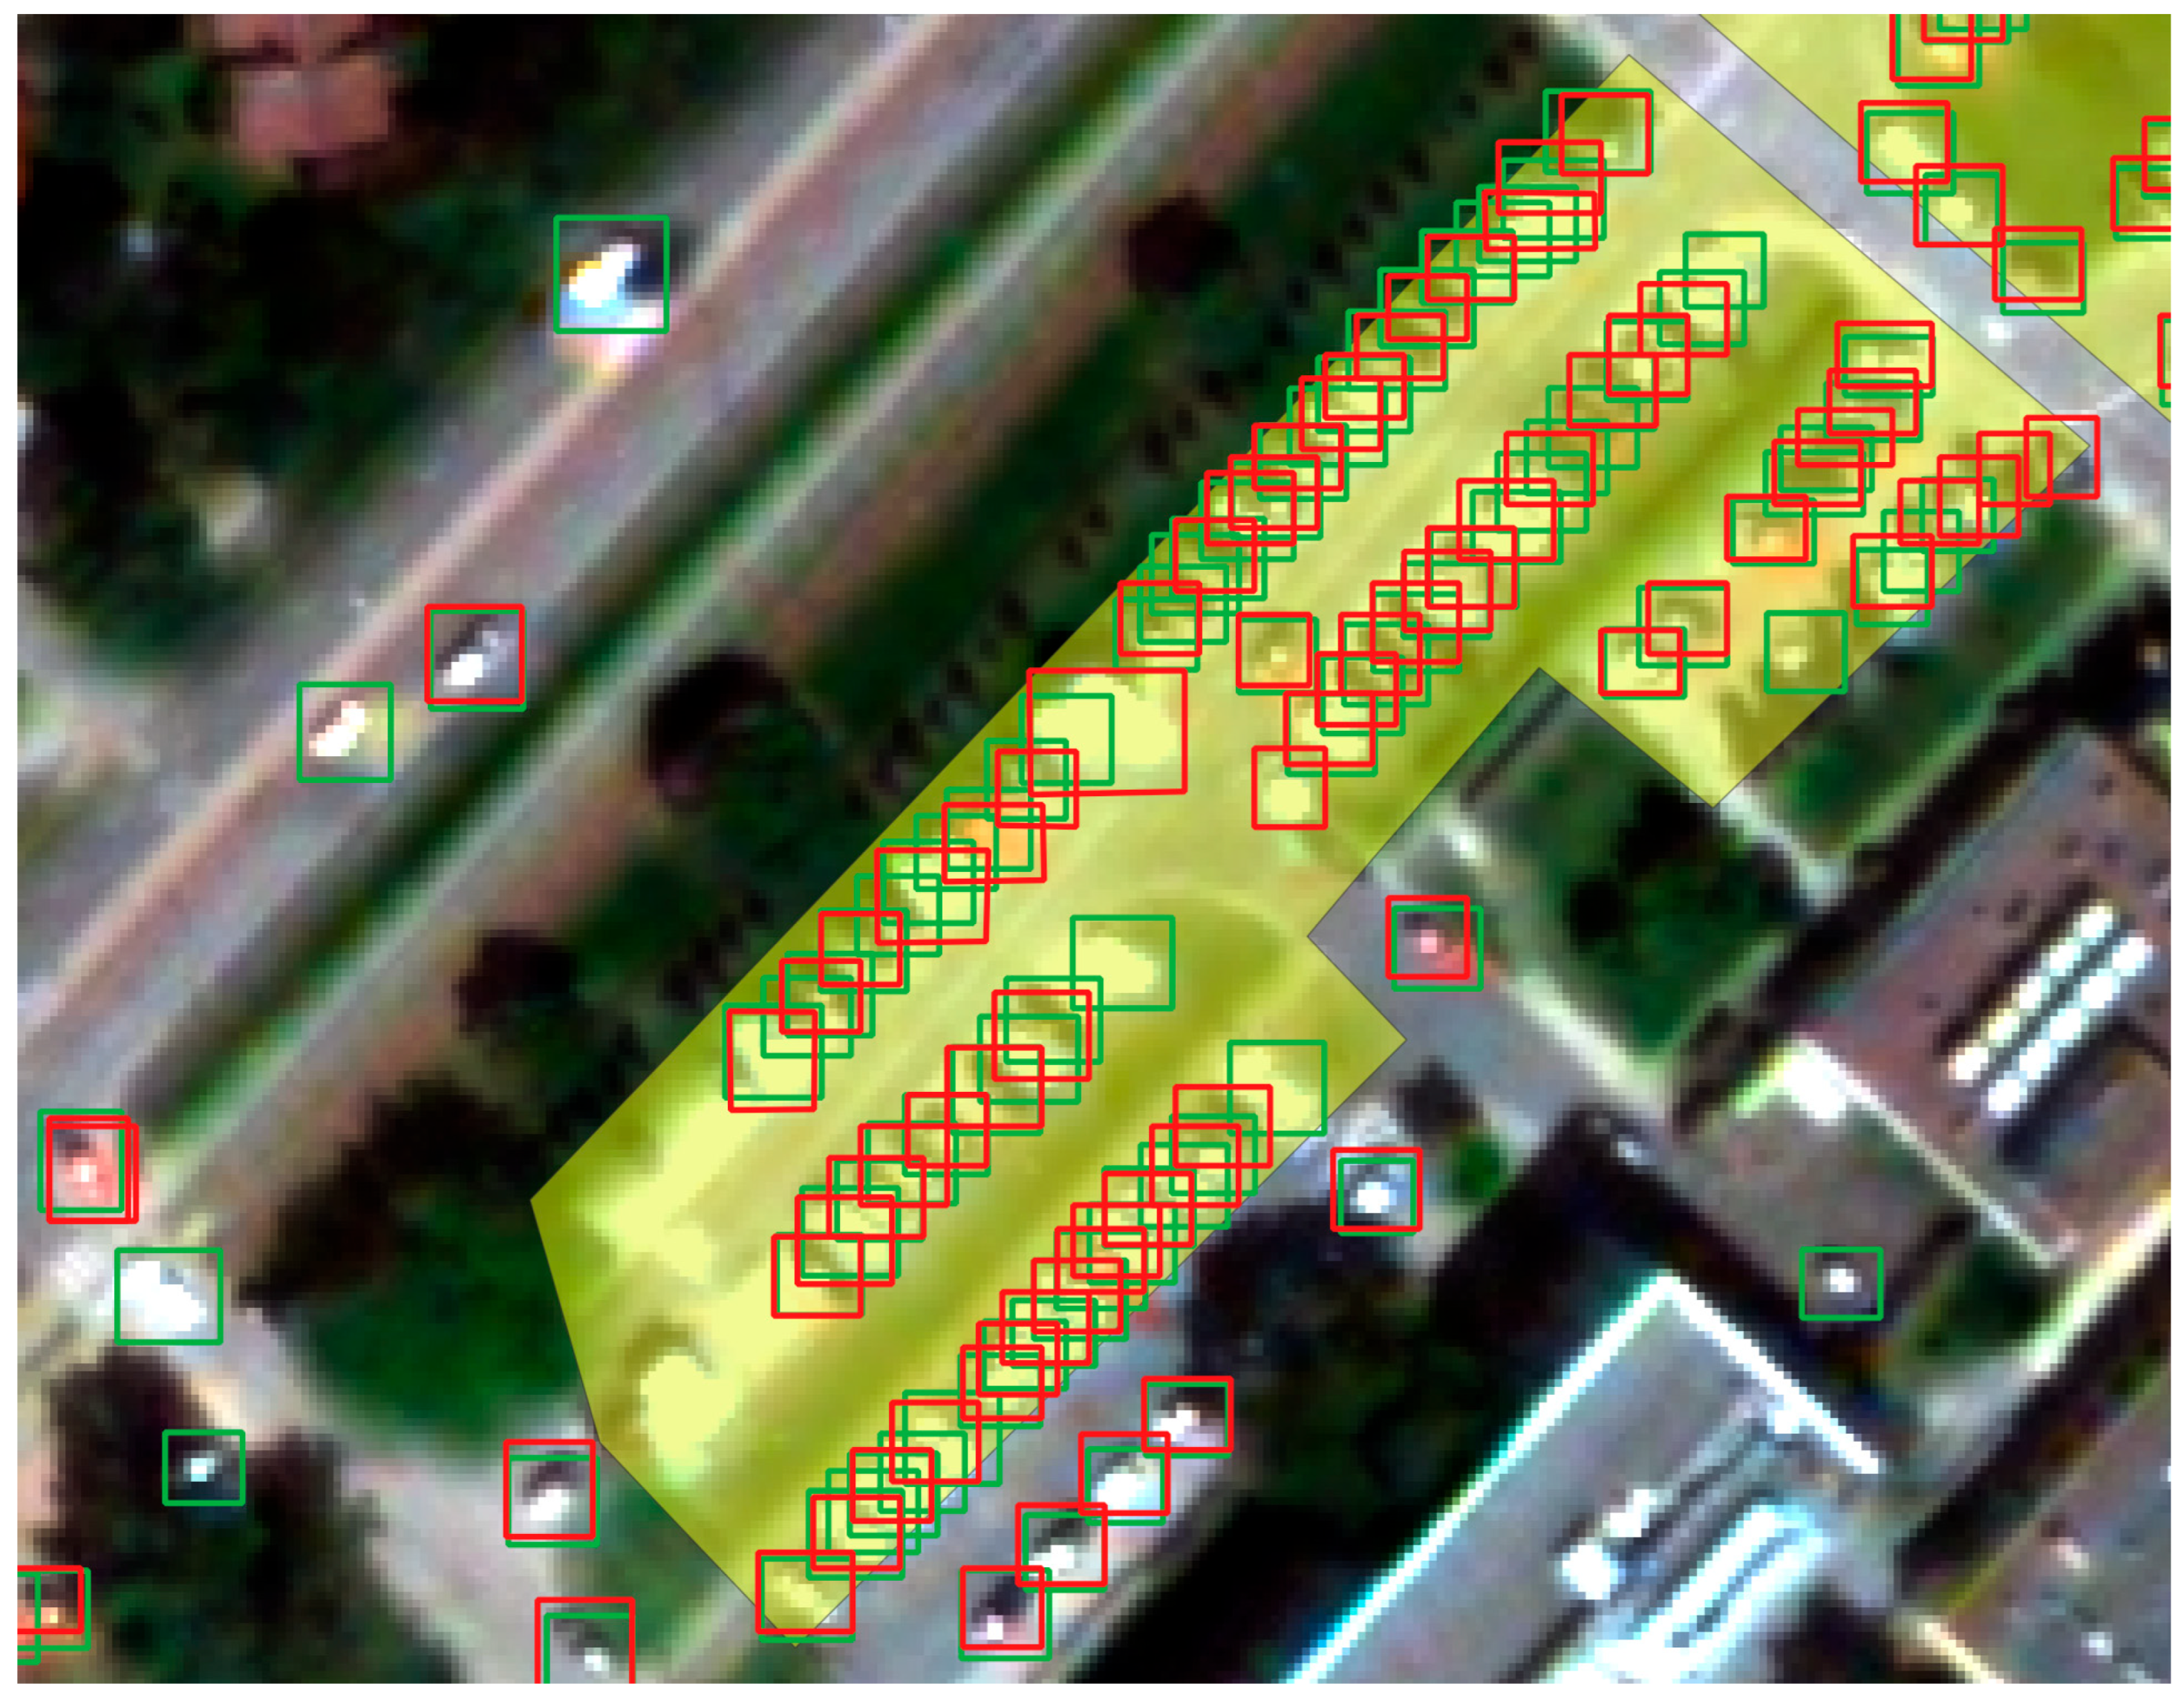
When analyzing the results, Parking_3 is an interesting case, as it showed a very high degree of agreement with the reference data, while slightly overestimating the number of vehicles. Therefore, an additional visual analysis was conducted for this area (Figure 6). The red rectangles mark the reference objects, while the green rectangles mark the detections obtained by the YOLOv9_12 model. In the analyzed case, the model detected all vehicles included in the reference database, as well as additional objects that were not marked during the annotation process. Independent visual verification confirmed that the additional detections correspond to real vehicles not included in the original annotation, consistent with the known tendency of human annotators to underreport objects under ambiguous observational conditions [43]. When analyzing the broader context of the scene, it can be observed that the model effectively identifies vehicles not only within the parking lot but also in its surroundings. Objects located on the road and vehicles partially obscured by tree canopies are correctly detected, which confirms the model’s high resistance to local observational disturbances.
Figure 6.
Detection results for Parking_3. Red boxes denote reference objects, while green boxes indicate model detections. The model successfully detects all reference vehicles and identifies additional objects, including partially occluded vehicles.
These findings are directly confirmed by the analysis of counting results and object density mapping for the integrated model (Table 6). In all analyzed cases, the YOLOv9_12 model achieves a low relative error, ranging from −0.098 to 0.031, indicating a high agreement between the number of detections and the reference data (Table 7). At the same time, the density error values remain very low and stable (up to approximately 0.0023), confirming the model’s ability to correctly map the spatial distribution of vehicles.
Table 6.
Per-area vehicle counting and density estimation accuracy using the fused detection model. * Reference counts were established through manual visual interpretation of high-resolution satellite imagery. Human annotators in remote sensing tasks tend to exhibit a systematic bias toward False Negatives [43]. For Parking_3, independent visual verification confirmed that two additional detections returned by the model correspond to real vehicles absent from the original annotation. The reference count should therefore be treated as a conservative estimate.
Table 7.
Integrated evaluation of vehicle counting, density, and occupancy estimation across parking areas. Parking capacity values (C) were estimated through manual visual interpretation of high-resolution satellite imagery by counting marked parking spaces within each analyzed zone.
It is particularly important that the model maintains a low error level both in areas with a large number of objects (parking_0, parking_1) and in smaller scenes (parking_3, parking_4). In the case of parking_3, a slight overestimation of the number of vehicles is observed (δ = 0.031), but this does not significantly affect the accuracy of density mapping, which remains very high. For more complex scenes, a slight tendency to underestimate the number of objects is observed, but its scale remains limited and does not significantly affect the quality of the final results.
Comparing these results with the error analysis for individual models (Table 7), it can be seen that model fusion effectively reduces both the high variability characteristic of YOLOv9 and the systematic underestimation observed in the YOLOv12 model. As a result, the YOLOv9_12 model not only provides more stable results across different test areas but also higher reliability in the context of quantitative and spatial analyses.
These conclusions are also reflected in the analysis of the parking occupancy rate (Table 7), which directly translates the detection results into a functional interpretation. The obtained values are in high agreement with the reference values , and the differences between them are small, ranging from −0.071 to 0.030. Additional statistical analysis indicates that the average difference is approximately −0.021 with a standard deviation of 0.036, confirming moderate variability in the results and the absence of significant systematic error.
The highest agreement was achieved for parking_3, where the model accurately reproduced the occupancy level, confirming its high effectiveness under conditions of moderate vehicle density. At the same time, it should be noted that the largest deviations are observed for scenes with a more complex spatial structure (e.g., parking_1 and parking_2), indicating a significant influence of observation conditions and object density on estimation accuracy.
For the remaining areas, a slight tendency to underestimate occupancy is observed, which is a direct consequence of the previously identified underestimation of the number of objects. At the same time, it should be emphasized that the use of model fusion allows for more effective object detection under difficult observation conditions, including vehicles located near trees, those in the shade, as well as objects with low contrast relative to the background (dark vehicles) and objects with local radiometric artifacts resulting from radiation reflection (white vehicles). The observed tendency toward underestimation is systematic in nature, but its scale remains limited and does not significantly affect the functional interpretation of the analyzed areas.
At the same time, it should be emphasized that even in the case of parking lots with a large number of parking spaces (e.g., parking_0, parking_1), the differences between the reference and estimated values remain limited, which indicates the stability of the model regardless of the scale of the analyzed area. This indicates that the proposed approach maintains consistency of results for both small and large areas, which is important from the perspective of operational applications.
Analysis of density values (,) and the occupancy rate leads to consistent conclusions—the YOLOv9_12 model provides a reliable representation of both the number of objects and their spatial distribution, which translates to a correct estimation of the utilization rate of the analyzed areas. The low variability of density errors further confirms the stability of the spatial detection mapping, regardless of local scene conditions.
4. Discussion
The analysis of the results allowed for an in-depth assessment of the effectiveness of vehicle detection models in high-resolution satellite imagery, both in terms of traditional detection metrics and in the context of their actual operational utility. Unlike standard approaches based solely on metrics such as mAP, this study also included a functional analysis encompassing object counting, density estimation, and occupancy rate, which enabled the identification of significant differences between models that were not apparent at the level of classical evaluation.
4.1. Impact of Training Strategy (Domain Shift)
The results clearly indicate that the effectiveness of detection models is strongly dependent on the consistency between the training and test data domains. Models trained exclusively on the xView dataset, despite high performance on data from the same source, exhibit a significant decline in detection quality on WorldView imagery. This phenomenon is particularly evident in the drop in recall values, indicating the models’ limited ability to detect objects under new observational conditions. Similar observations have been reported in the literature, where it has been shown that differences between datasets, resulting, among other things, from varying sensor characteristics, spatial resolution, and radiometric properties, significantly affect the generalization ability of deep learning models in remote sensing [19,44].
4.2. The Importance of Fine-Tuning
The best results were obtained for models fine-tuned on the proprietary dataset, which confirms the role of domain adaptation in object detection tasks. In this variant, the models achieve high and stable metric values, and the differences between individual architectures are reduced. This means that in the analyzed scenario, adapting the model to the characteristics of the target data is more important than choosing a specific model version. These results confirm observations presented in the literature, according to which domain adaptation and fine-tuning often have a greater impact on model performance than the choice of a specific network architecture, particularly in remote sensing tasks characterized by high data variability [44].
4.3. Limitations of Classical Metrics (mAP)
The analysis conducted showed that classical evaluation metrics, such as mAP, are insufficient for a comprehensive characterization of detection quality in remote sensing applications. Models achieving similar mAP values exhibit significant differences in the accuracy of object counting and the estimation of their spatial distribution. In particular, mAP does not account for the impact of detection errors on aggregated metrics, such as density or the level of occupancy of the analyzed areas, which limits its usefulness in operational analyses. Similar conclusions were reported in [45] where it was shown that mAP, particularly in the COCO evaluation protocol, does not correlate well with counting quality. In contrast, the F1-score better reflects the model’s utility, as standard mAP (COCO, multiple IoU thresholds) tends to overemphasize localization accuracy rather than detection completeness. To quantitatively assess this relationship, Spearman rank correlation was computed between mAP@0.50 (Table 2, Strategy I) and mean absolute counting error (Table 3) across all eight evaluated single models. The analysis yielded r = −0.905 (p = 0.002), indicating a strong and statistically significant negative correlation—models with higher mAP do not necessarily achieve lower counting errors. This result provides direct quantitative evidence that classical detection metrics are a poor proxy for functional performance and strongly supports the use of dedicated functional metrics as a necessary complement to mAP-based evaluation.
4.4. Effectiveness of Model Fusion
The use of an approach based on the fusion of the YOLOv9 and YOLOv12 models yielded the best results in the analyzed scenario. The integrated model achieves the lowest values for relative errors, counting errors, and density errors, while maintaining high stability across different test areas. The fusion enables the use of the models’ complementary properties—YOLOv9’s high completeness and YOLOv12’s greater stability—which translates into more reliable analysis results.
It should be noted that YOLOv12 trained under Strategy III shows a notably lower mAP@0.50 (0.630) than the other YOLO variants (all above 0.93, Table 2), which were used as fusion components. We attribute this to reduced confidence calibration during fine-tuning rather than a loss of object-level detection capability, since the fusion operator (Equation (9)) acts on raw detection boxes prior to NMS, allowing YOLOv12 to still contribute correctly localized boxes to the fused set. This is supported by Table 5, where YOLOv9_12 outperforms YOLOv9 alone in most test areas, indicating that YOLOv12’s contribution is substantial and not merely incidental to YOLOv9’s performance.
Beyond quantitative accuracy, the fused model also demonstrates robustness to challenging observational conditions identified in Section 3, including partially occluded vehicles, dark-colored vehicles blending into asphalt backgrounds, and varying acquisition geometries. As illustrated in Figure 6 and discussed in the context of Parking_3, the YOLOv9_12 model successfully detects vehicles under tree canopies and in shaded areas—conditions under which single models tend to produce false negatives. This suggests that the fusion strategy not only reduces the counting error, but also improves the resilience to the scene-level variability inherent in satellite EO imagery. Specifically, YOLOv9’s high recall allows it to capture vehicles missed by YOLOv12 under challenging lighting and occlusion conditions, while YOLOv12’s higher precision limits the number of false detections generated by YOLOv9 in scenes affected by reflection artifacts—together providing a more effective balance than either model achieves individually.
4.5. Functional Analysis
The use of functional analysis allowed us to identify differences between models that are not apparent at the level of classical metrics. In particular, it was demonstrated that models with similar mAP values can differ significantly in terms of object counting accuracy and the estimation of their spatial distribution. These results confirm that in remote sensing tasks, additional evaluation metrics that reflect the actual operational use of the models must be considered.
It should be noted that although density-map-based and regression-based counting methods constitute a recognized alternative, they are primarily designed for low-resolution or heavily occluded scenes where individual objects cannot be resolved. In the VHR regime considered here (GSD ≈ 0.5 m), individual vehicles are spatially separable, and detection-based counting additionally provides explicit spatial localization required for per-zone functional indicators such as occupancy rates and density estimates. Detection-based counting is, therefore, the methodologically appropriate choice for this application context.
4.6. Statistical Validation of Functional Metrics
To validate the generalizability of the functional evaluation framework beyond the five case study areas presented in Section 3, the YOLOv9_12 fusion model was applied to an extended set of 20 parking areas of varying size (787–15,863 m2) and density of vehicle. The results confirm the stability of the proposed approach across diverse scene conditions (Table 8).
Table 8.
Extended functional validation of vehicle counting and density estimation using the YOLOv9_12 fusion model.
The mean absolute relative error across all 20 areas is 0.043 (std = 0.030), and the mean density error is 0.0007 vehicles/m2 (std = 0.0005). The relative error ranges from −0.100 to 0.031, with 17 out of 20 areas showing an absolute relative error below 0.10. A systematic tendency toward slight underestimation is observed (global relative error = −0.040), consistent with the findings from Section 3. These results confirm that the YOLOv9_12 fusion model maintains reliable counting performance across parking areas of different scales and occupancy levels. To further assess the robustness of these results, two additional statistical analyses were performed. A leave-one-out (LOO) analysis, in which each parking area was successively excluded and the mean relative error recomputed on the remaining 19 areas, yielded a LOO mean range of −0.044 to −0.037 (std = 0.0018), confirming that no single parking area disproportionately influences the aggregate result. Additionally, a 95% confidence interval for the mean relative error was estimated as [−0.057, −0.024], indicating that the observed systematic underestimation tendency is consistent and statistically distinguishable from zero.
4.7. Limitations
The effectiveness of vehicle detection is strongly dependent on the spatial resolution of the imagery. In the case of lower-resolution data, the representation of vehicles is significantly limited, which makes their detection considerably more difficult, especially for small objects. Consequently, the effectiveness of the proposed approach may be lower for images of lower spatial quality.
It should also be emphasized that the effectiveness of the models depends on the characteristics of the input data. Under different observational conditions, different architectures may prove superior; therefore, in applied research, it is reasonable to compare multiple models and select the solution best suited to a specific case, rather than necessarily the latest model achieving the highest benchmark results.
An additional limitation is related to the variability of observation geometry in commercial EO imagery. The analyzed scenes include acquisitions obtained under different viewing conditions, including off-nadir observations, which may affect the apparent geometry of vehicles, shadow characteristics, object visibility, and the effective spatial representation of small targets. Such factors may influence both localization accuracy and detection reliability, particularly in densely built-up or partially occluded areas. Due to the limited consistency and availability of acquisition metadata for all archival scenes, a systematic analysis of the influence of the look angle was outside the scope of this study and remains an important direction for future research.
5. Conclusions
This paper proposes a multi-stage approach to evaluating vehicle detection models in optical Earth imagery, taking into account not only classical detection metrics but also functional analysis, including the estimation of the number of objects, their density, and the occupancy rate of parking areas.
The results clearly indicate that standard metrics, such as mAP, are insufficient for a comprehensive assessment of model performance in remote sensing applications. Models achieving similar mAP values may differ significantly in terms of object counting accuracy and representation of their spatial distribution, which has a direct impact on the reliability of operational analyses. The analysis also demonstrated that model performance is strongly dependent on the compatibility of the training and test data domains. Models trained exclusively on the xView dataset exhibit limited generalization ability to WorldView imagery, whereas fine-tuning on the target data leads to a significant improvement in results. The best results were obtained for an approach based on the fusion of YOLOv9 and YOLOv12 models, which allowed for a reduction in counting error and stabilization of density estimates, while simultaneously limiting systematic errors.
The results confirm that the functional approach constitutes a significant complement to the classical evaluation of object detectors and enables a more reliable assessment of their usefulness in practical remote sensing applications, such as land use analysis or infrastructure monitoring. In particular, the proposed methodology allows for a better correlation between detection quality and its actual utility in operational tasks, where detection is only an intermediate step in the decision-making process. The results also indicate the need to extend standard evaluation protocols with functional metrics that account for the propagation of detection errors to the level of aggregated indicators.
In future research, it is reasonable to extend the analysis to imagery with varying spatial resolutions and other types of scenes, as well as to incorporate multi-temporal data to assess the stability of detection in a dynamic context. In this regard, recent spatio-temporal change detection methods, such as ChangeMamba [31], offer a concrete methodological pathway toward multi-temporal stability analysis of functional indicators. Another important direction for future work is the development of adaptive model fusion methods and the integration of information from various data sources, including radar imagery (SAR).
Author Contributions
Conceptualization, D.W. and K.K.; methodology, K.K. and D.W.; software, K.K. and W.K.; validation, K.K. and W.K.; formal analysis, W.K. and V.K.; investigation, D.W., K.K. and W.K.; resources, K.K.; data curation, K.K.; writing—original draft preparation, D.W. and K.K.; writing—review and editing, W.K. and V.K.; visualization, K.K. and W.K.; supervision, D.W.; project administration, D.W.; funding acquisition, D.W. All authors have read and agreed to the published version of the manuscript.
Funding
This research was funded by Military University of Technology, Faculty of Civil Engineering and Geodesy, grant number UGB 531-000105-W400-22 WAT.
Data Availability Statement
The original contributions presented in the study are included in the article, further inquiries can be directed to the corresponding author.
Conflicts of Interest
The authors declare no conflicts of interest.
Abbreviations
The following abbreviations are used in this manuscript:
| EO | Earth Observation |
| UAV | Unmanned Aerial Vehicle |
| SAR | Synthetic Aperture Radar |
| DL | Deep Learning |
| YOLO | You Only Look Once |
| NMS | Non-Maximum Suppression |
| IoU | Intersection over Union |
| TP | True Positive |
| FP | False Positive |
| FN | False Negative |
| AP | Average Precision |
| mAP | mean Average Precision |
| N | Number of vehicles |
| A | Area of the analyzed region |
| D | Vehicle density |
| Occ | Occupancy rate |
References
- Ustin, S.L.; Middleton, E.M. Current and Near-Term Earth-Observing Environmental Satellites, Their Missions, Characteristics, Instruments, and Applications. Sensors 2024, 24, 3488. [Google Scholar] [CrossRef] [Scilit] [PubMed]
- Ustin, S.L.; Middleton, E.M. Current and Near-Term Advances in Earth Observation for Ecological Applications. Ecol. Process 2021, 10, 1. [Google Scholar] [CrossRef] [Scilit] [PubMed]
- Rijlaarsdam, D.; Hendrix, T.; González, P.T.T.; Velasco-Mata, A.; Buckley, L.; Miquel, J.P.; Casaled, O.A.; Dunne, A. The Next Era for Earth Observation Spacecraft: An Overview of CogniSAT-6. IEEE J. Sel. Top. Appl. Earth Obs. Remote Sens. 2025, 18, 2450–2463. [Google Scholar] [CrossRef] [Scilit]
- Wierzbicki, D. Multi-Camera Imaging System for UAV Photogrammetry. Sensors 2018, 18, 2433. [Google Scholar] [CrossRef] [Scilit] [PubMed]
- Lalak, M.; Wierzbicki, D.; Kędzierski, M. Methodology of Processing Single-Strip Blocks of Imagery with Reduction and Optimization Number of Ground Control Points in UAV Photogrammetry. Remote Sens. 2020, 12, 3336. [Google Scholar] [CrossRef] [Scilit]
- Wierzbicki, D.; Nienaltowski, M. Accuracy Analysis of a 3D Model of Excavation, Created from Images Acquired with an Action Camera from Low Altitudes. ISPRS Int. J. Geo-Inf. 2019, 8, 83. [Google Scholar] [CrossRef] [Scilit]
- Miller, L.; Pelletier, C.; Webb, G.I. Deep Learning for Satellite Image Time-Series Analysis: A Review. IEEE Geosci. Remote Sens. Mag. 2024, 12, 81–124. [Google Scholar] [CrossRef] [Scilit]
- Bielecka, E.; Jenerowicz, A. Intellectual Structure of CORINE Land Cover Research Applications in Web of Science: A Europe-Wide Review. Remote Sens. 2019, 11, 2017. [Google Scholar] [CrossRef] [Scilit]
- Li, Z.; Wang, Y.; Zhang, N.; Zhang, Y.; Zhao, Z.; Xu, D.; Ben, G.; Gao, Y. Deep Learning-Based Object Detection Techniques for Remote Sensing Images: A Survey. Remote Sens. 2022, 14, 2385. [Google Scholar] [CrossRef] [Scilit]
- Gui, S.; Song, S.; Qin, R.; Tang, Y. Remote Sensing Object Detection in the Deep Learning Era—A Review. Remote Sens. 2024, 16, 327. [Google Scholar] [CrossRef] [Scilit]
- Karwowska, K.; Wierzbicki, D. MCWESRGAN: Improving Enhanced Super-Resolution Generative Adversarial Network for Satellite Images. IEEE J. Sel. Top. Appl. Earth Obs. Remote Sens. 2023, 16, 9886–9906. [Google Scholar] [CrossRef] [Scilit]
- Karwowska, K.; Slesinski, J.; Sekrecka, A.; Smiarowski, M.; Metsoja, K. Integrating Optical and Radar Satellite Data for Conflict-Related Change Detection in Ukraine. Sci. Rep. 2026, 16, 12557. [Google Scholar] [CrossRef] [Scilit] [PubMed]
- Cariello, S.; Malaguti, A.B.; Corradino, C.; Del Negro, C. V-STAR: A Cloud-Based Tool for Satellite Detection and Mapping of Volcanic Thermal Anomalies. GeoHazards 2025, 6, 24. [Google Scholar] [CrossRef] [Scilit]
- Pasternak, K.; Fryśkowska-Skibniewska, A. Automated Analysis of Slavic Buried Settlements Based on LiDAR Point Cloud, UAV and Image Processing. J. Cult. Herit. 2025, 73, 305–316. [Google Scholar] [CrossRef] [Scilit]
- Kedzierski, M.; Wierzbicki, D.; Sekrecka, A.; Fryskowska, A.; Walczykowski, P.; Siewert, J. Influence of Lower Atmosphere on the Radiometric Quality of Unmanned Aerial Vehicle Imagery. Remote Sens. 2019, 11, 1214. [Google Scholar] [CrossRef] [Scilit]
- Reda, K.; Kedzierski, M. Detection, Classification and Boundary Regularization of Buildings in Satellite Imagery Using Faster Edge Region Convolutional Neural Networks. Remote Sens. 2020, 12, 2240. [Google Scholar] [CrossRef] [Scilit]
- Lang, P.; Fu, X.; Dong, J.; Yang, H.; Yin, J.; Yang, J.; Martorella, M. Recent Advances in Deep-Learning-Based SAR Image Target Detection and Recognition. IEEE J. Sel. Top. Appl. Earth Obs. Remote Sens. 2025, 18, 6884–6915. [Google Scholar] [CrossRef] [Scilit]
- Slesinski, J.; Wierzbicki, D. Review of Synthetic Aperture Radar Automatic Target Recognition: A Dual Perspective on Classical and Deep Learning Techniques. IEEE J. Sel. Top. Appl. Earth Obs. Remote Sens. 2025, 18, 18978–19024. [Google Scholar] [CrossRef] [Scilit]
- Karwowska, K.; Slesinski, J.; Wierzbicki, D. Effectiveness of YOLO Variants for Small Object Detection in SAR Images Using a New Dataset. Sci. Rep. 2025, 15, 45405. [Google Scholar] [CrossRef] [Scilit] [PubMed]
- Slesinski, J.; Wierzbicki, D.; Kedzierski, M. Application of Multitemporal Change Detection in Radar Satellite Imagery Using REACTIV-Based Method for Geospatial Intelligence. Sensors 2023, 23, 4922. [Google Scholar] [CrossRef] [Scilit] [PubMed]
- Zhang, Y.; Ye, M.; Zhu, G.; Liu, Y.; Guo, P.; Yan, J. FFCA-YOLO for Small Object Detection in Remote Sensing Images. IEEE Trans. Geosci. Remote Sens. 2024, 62, 1432. [Google Scholar] [CrossRef] [Scilit]
- Han, W.; Chen, J.; Wang, L.; Feng, R.; Li, F.; Wu, L.; Tian, T.; Yan, J. Methods for Small, Weak Object Detection in Optical High-Resolution Remote Sensing Images: A Survey of Advances and Challenges. IEEE Geosci. Remote Sens. Mag. 2021, 9, 8–34. [Google Scholar] [CrossRef] [Scilit]
- Wang, X.; Wang, A.; Yi, J.; Song, Y.; Chehri, A. Small Object Detection Based on Deep Learning for Remote Sensing: A Comprehensive Review. Remote Sens. 2023, 15, 3265. [Google Scholar] [CrossRef] [Scilit]
- Courtrai, L.; Pham, M.-T.; Lefèvre, S. Small Object Detection in Remote Sensing Images Based on Super-Resolution with Auxiliary Generative Adversarial Networks. Remote Sens. 2020, 12, 3152. [Google Scholar] [CrossRef] [Scilit]
- Wan, J.; Wang, Q.; Chan, A.B. Kernel-Based Density Map Generation for Dense Object Counting. IEEE Trans. Pattern Anal. Mach. Intell. 2022, 44, 1357–1370. [Google Scholar] [CrossRef] [Scilit] [PubMed]
- Kang, D.; Ma, Z.; Chan, A.B. Beyond Counting: Comparisons of Density Maps for Crowd Analysis Tasks—Counting, Detection, and Tracking. IEEE Trans. Circuits Syst. Video Technol. 2019, 29, 1408–1422. [Google Scholar] [CrossRef] [Scilit]
- Al-Emadi, N.; Weber, I.; Yang, Y.; Ofli, F. VME: A Satellite Imagery Dataset and Benchmark for Detecting Vehicles in the Middle East and Beyond. Sci. Data 2025, 12, 500. [Google Scholar] [CrossRef] [Scilit] [PubMed]
- Haroon, M.; Shahzad, M.; Fraz, M.M. Multisized Object Detection Using Spaceborne Optical Imagery. IEEE J. Sel. Top. Appl. Earth Obs. Remote Sens. 2020, 13, 3032–3046. [Google Scholar] [CrossRef] [Scilit]
- Zhao, C.; Guo, D.; Shao, C.; Zhao, K.; Sun, M.; Shuai, H. SatDetX-YOLO: A More Accurate Method for Vehicle Target Detection in Satellite Remote Sensing Imagery. IEEE Access 2024, 12, 46024–46041. [Google Scholar] [CrossRef] [Scilit]
- Tan, Q.; Ling, J.; Hu, J.; Qin, X.; Hu, J. Vehicle Detection in High Resolution Satellite Remote Sensing Images Based on Deep Learning. IEEE Access 2020, 8, 153394–153402. [Google Scholar] [CrossRef] [Scilit]
- Chen, H.; Song, J.; Han, C.; Xia, J.; Yokoya, N. ChangeMamba: Remote Sensing Change Detection with Spatiotemporal State Space Model. IEEE Trans. Geosci. Remote Sens. 2024, 62, 4409720. [Google Scholar] [CrossRef] [Scilit]
- Lam, D.; Kuzma, R.; McGee, K.; Dooley, S.; Laielli, M.; Klaric, M.; Bulatov, Y.; McCord, B. xView: Objects in Context in Overhead Imagery. arXiv 2018, arXiv:1802.07856. [Google Scholar]
- Wang, C.-Y.; Yeh, I.-H.; Liao, H.-Y.M. YOLOv9: Learning What You Want to Learn Using Programmable Gradient Information. In Proceedings of the European Conference on Computer Vision; Springer Nature: Cham, Switzerland, 2024; pp. 1–21. [Google Scholar]
- Wang, A.; Chen, H.; Liu, L.; Chen, K.; Lin, Z.; Han, J.; Ding, G. YOLOv10: Real-Time End-to-End Object Detection. Adv. Neural Inf. Process. Syst. 2024, 37, 107984–108011. [Google Scholar]
- Khanam, R.; Hussain, M. YOLOv11: An Overview of the Key Architectural Enhancements. arXiv 2024, arXiv:2410.17725. [Google Scholar] [CrossRef] [Scilit]
- Tian, Y.; Ye, Q.; Doermann, D. YOLOv12: Attention-Centric Real-Time Object Detectors. Adv. Neural Inf. Process. Syst. 2026, 38, 78433–78457. [Google Scholar]
- Sapkota, R.; Cheppally, R.H.; Sharda, A.; Karkee, M. YOLO26: Key Architectural Enhancements and Performance Benchmarking for Real-Time Object Detection. arXiv 2025, arXiv:2509.25164. [Google Scholar] [CrossRef] [Scilit]
- Zhao, Y.; Lv, W.; Xu, S.; Wei, J.; Wang, G.; Dang, Q.; Liu, Y.; Chen, J. DETRs Beat YOLOs on Real-Time Object Detection. In Proceedings of the 2024 IEEE/CVF Conference on Computer Vision and Pattern Recognition (CVPR), Seattle, WA, USA, 17–21 June 2024; pp. 16965–16974. [Google Scholar]
- Liu, Z.; Lin, Y.; Cao, Y.; Hu, H.; Wei, Y.; Zhang, Z.; Lin, S.; Guo, B. Swin Transformer: Hierarchical Vision Transformer Using Shifted Windows. In Proceedings of the 2021 IEEE/CVF International Conference on Computer Vision (ICCV), Online, 11–17 October 2021; pp. 9992–10002. [Google Scholar]
- Cai, Z.; Vasconcelos, N. Cascade R-CNN: High Quality Object Detection and Instance Segmentation. IEEE Trans. Pattern Anal. Mach. Intell. 2021, 43, 1483–1498. [Google Scholar] [CrossRef] [Scilit] [PubMed]
- Bodla, N.; Singh, B.; Chellappa, R.; Davis, L.S. Soft-NMS—Improving Object Detection with One Line of Code. arXiv 2017, arXiv:1704.04503v2. [Google Scholar] [CrossRef] [Scilit]
- Solovyev, R.; Wang, W.; Gabruseva, T. Weighted Boxes Fusion: Ensembling Boxes from Different Object Detection Models. Image Vis. Comput. 2021, 107, 104117. [Google Scholar] [CrossRef] [Scilit]
- Blushtein-Livnon, R.; Svoray, T.; Dorman, M. Performance of Human Annotators in Object Detection and Segmentation of Remotely Sensed Data. IEEE Trans. Geosci. Remote Sens. 2025, 63, 4407116. [Google Scholar] [CrossRef] [Scilit]
- Tuia, D.; Persello, C.; Bruzzone, L. Domain Adaptation for the Classification of Remote Sensing Data: An Overview of Recent Advances. IEEE Geosci. Remote Sens. Mag. 2016, 4, 41–57. [Google Scholar] [CrossRef] [Scilit]
- Moreni, M.; Theau, J.; Foucher, S. Do You Get What You See? Insights of Using mAP to Select Architectures of Pretrained Neural Networks for Automated Aerial Animal Detection. PLoS ONE 2023, 18, e0284449. [Google Scholar] [CrossRef] [Scilit] [PubMed]

Disclaimer/Publisher’s Note: The statements, opinions and data contained in all publications are solely those of the individual author(s) and contributor(s) and not of MDPI and/or the editor(s). MDPI and/or the editor(s) disclaim responsibility for any injury to people or property resulting from any ideas, methods, instructions or products referred to in the content. |
© 2026 by the authors. Licensee MDPI, Basel, Switzerland. This article is an open access article distributed under the terms and conditions of the Creative Commons Attribution (CC BY) license.