


Highlights
What are the main findings?
- GPP across China’s three major forest regions showed a clear south–north spatial gradient from 2005 to 2025.
- Forest GPP generally increased during the study period, but the magnitude, stability, and trend significance differed substantially among regions.
- Temperature and VPD jointly controlled GPP variability, with distinct dominant climatic drivers across the northeast, southern, and southwest forest regions.
- Clear temperature–VPD thresholds were identified, with turning points occurring at approximately 11.74 °C, 10.43 °C, and 25.64 °C in the northeast, southwest, and southern forest regions, respectively.
- GPP responses to hydrothermal conditions exhibited strong nonlinear characteristics and region-specific optimal temperature–VPD combinations.
What are the implications of the main findings?
- Forest carbon sink responses to climate change are strongly region-dependent and cannot be explained by a single climatic control mechanism.
- Increasing atmospheric dryness may weaken warming-induced productivity gains, particularly in regions with strong hydrothermal coupling and moisture constraints.
- Nonlinear threshold effects should be incorporated into future assessments of forest carbon sink vulnerability and climate adaptation strategies.
Abstract
Gross primary productivity (GPP) is central to terrestrial carbon cycling and forest carbon sink assessment. Using Google Earth Engine, MODIS GPP, ERA5-Land meteorological data, and forest extent masks, this study examined GPP dynamics and climatic controls in China’s northeast, southern, and southwest forest regions from 2005 to 2025. GPP increased overall in all three regions, with higher values in the south and lower values in the north. Climatic drivers differed regionally: in the northeast, GPP responded positively to temperature, while VPD slightly exceeded temperature in the dominant-control area; in the southern region, temperature was the main driver but VPD remained important; in the southwest, temperature dominated larger areas, whereas moisture-related controls showed stronger spatial heterogeneity. Piecewise analysis identified temperature–VPD turning points of 11.74 °C, 10.43 °C, and 25.64 °C for the northeast, southwest, and southern regions, respectively. Two-dimensional temperature–VPD binning further revealed nonlinear GPP distributions and distinct optimal hydrothermal combinations across regions. These results show that warming effects on forest productivity are region-specific and constrained by atmospheric dryness, providing evidence for assessing China’s forest carbon sink responses to climate change.
1. Introduction
With ongoing global climate change, the terrestrial carbon cycle has become a central topic in global change research. Gross primary productivity (GPP) refers to the total amount of atmospheric CO2 assimilated and organic carbon fixed by vegetation through photosynthesis. It represents the carbon uptake capacity of terrestrial ecosystems and is a fundamental component of the terrestrial carbon cycle, serving as a baseline variable for understanding ecosystem carbon budgets [1,2]. As a key link between vegetation physiological processes and regional carbon budgets, GPP is widely used to measure ecosystem productivity, carbon sink function, and their changes over time [2]. Forest ecosystems, as a major part of terrestrial ecosystems, are a critical reservoir of the global carbon pool and carbon sink, and they play an irreplaceable role in regulating the global carbon cycle and mitigating climate change [3,4]. However, under the combined pressures of continued warming and intensifying natural disturbances, forest carbon sink function also shows clear vulnerability and uncertainty: extreme drought events can greatly weaken the carbon uptake capacity of large forest ecosystems and even trigger the release of biomass carbon [5]; future warming and more frequent disturbances may further raise the risk of some forests shifting from carbon sinks to carbon sources [6].
From a broader geographical perspective, mid-latitude forests of the Northern Hemisphere account for a large share of the global terrestrial carbon sink and are highly sensitive to climate anomalies. Large-scale observations have shown that drought events can substantially alter water-use processes linked to carbon uptake in Northern Hemisphere forest ecosystems [7]. At the same time, although climate warming may extend the growing season of temperate forests, it may also offset some of the carbon gains by increasing respiratory losses during hot summers, creating a clear phenological trade-off [8]. This climatic sensitivity has also been confirmed in typical mid-latitude forests, with the composition and productivity of temperate broad-leaved Korean pine forests in Northeast China responding clearly to climate change [9]. Focusing further on the Eurasian continent, East Asian forests, shaped by both monsoon activity and anomalous meteorological events, show clear spatial heterogeneity in their GPP responses to climatic fluctuations [10].
Within this broader context, China, as the core region of the East Asian monsoon system, has typical forest ecosystems whose carbon dynamics are particularly representative. Therefore, a systematic study of GPP and carbon exchange in forest ecosystems is of considerable scientific value for understanding regional carbon cycle mechanisms, assessing forest carbon sink function, and evaluating ecosystem responses to climate change [3,4]. In practice, the responses of ecosystem carbon exchange processes to climatic variability are far from uniform; rather, they display strong spatial heterogeneity. Studies based on the ChinaFLUX observation network have indicated that the seasonal and spatial patterns of carbon fluxes such as GPP across China’s terrestrial ecosystems are shaped by latitudinal zonality and regional combinations of temperature and moisture [11]. Meanwhile, changes in environmental moisture gradients not only directly constrain photosynthetic physiological activity but may also cause a clear “decoupling” between forest canopy structure (greenness) and actual primary productivity (GPP) in humid regions [12]. These findings suggest that relying solely on a single indicator or large-scale averaged assessments cannot faithfully capture the carbon sink potential and vulnerability of forests under specific climatic conditions.
China’s forests have become an important component of the global and Northern Hemisphere terrestrial carbon sink. National forest-inventory, atmospheric-inversion, and model-data fusion studies have shown that forest carbon storage and annual carbon sequestration in China have increased over recent decades, partly because of climate change, CO2 fertilization, ecological restoration, afforestation, and forest management. For example, data fusion estimates reported a forest carbon stock of 7.08 Pg C in China during 2004–2008, representing an increase of 2.24 Pg C from 1984 to 2008 [13]. At the national scale, vegetation carbon sequestration has also accelerated after 2010, with GPP and NPP increasing at rates of 49.1–53.1 Tg C yr−2 and 22.4–24.9 Tg C yr−2, respectively, during 2001–2018 [14]. At the regional and stand scales, carbon sequestration potential in subtropical plantations is also strongly modulated by stand structure, forest age, and management intensity [15]. However, these gains are increasingly exposed to longer growing seasons, more frequent heat extremes, drought events, and anthropogenic disturbances. Therefore, quantifying regional differences in GPP and hydrothermal constraints across China’s major forest regions is necessary for evaluating whether recent carbon sink gains can be sustained under future climate stress. Regional evidence from tropical forest ecosystems, such as Hainan Island, further indicates that forest carbon sequestration can show strong temporal fluctuations under the combined effects of land-use change, vegetation condition, terrain, and human activity [16].
In recent years, with advances in remote sensing techniques and ecological modeling, large-scale GPP estimation based on satellite data such as MODIS has progressed considerably and has become a primary data source for monitoring the spatiotemporal dynamics of terrestrial ecosystem productivity. Existing studies generally agree that temperature, precipitation, radiation, and vapor pressure deficit (VPD) are the key environmental factors driving GPP variation in forest ecosystems [17,18]. Among these, temperature affects GPP mainly by modulating light-use efficiency, whereas precipitation acts largely through its influence on the absorption and utilization of photosynthetically active radiation by vegetation [19]. As global warming continues to increase atmospheric water demand, VPD has also been widely regarded as a major driving force constraining the carbon sink function of China’s forest ecosystems [20]. Moreover, the climatic drivers of forest GPP do not operate through simple linear relationships; rather, they involve clear threshold effects and nonlinear hydrothermal constraints. Global-scale studies have found that higher atmospheric VPD significantly suppresses vegetation growth, with distinct hydrothermal threshold characteristics [21]. Flux network observations have also shown that high VPD and low soil moisture impose systematically different constraints on ecosystem productivity [22]. Studies focused on China have further pointed to identifiable transition thresholds between energy-limited and water-limited regimes in ecosystem carbon and water fluxes, and that GPP responses to compound hot–drought events differ considerably across regions [23,24].
Although existing studies have described the differential responses of forest GPP to precipitation, temperature, and VPD from the angle of single regions or individual climatic factors—for example, interannual variation in growing season GPP in the forest regions of Southwest China is strongly influenced by precipitation, while the relationships between GPP and temperature, precipitation, and VPD in karst forest regions follow different constraint patterns [17,25]—systematic comparisons of GPP spatiotemporal variation and its climatic drivers across different typical forest regions of China under a unified data and methodological framework are still lacking. In particular, comprehensive identification and quantitative assessment at the regional scale remain insufficient with regard to the nonlinear characteristics of GPP responses to changing hydrothermal conditions, their threshold effects, and possible asymmetric responses. These three forest regions were selected because they represent contrasting climatic, ecological, and topographic settings in China: the northeast region is mainly energy-limited temperate forest, the southern region is humid subtropical forest with abundant hydrothermal resources, and the southwest region is characterized by complex mountainous terrain, vertical climatic gradients, and stronger moisture heterogeneity. To fill these gaps, this study takes China’s northeast, southern, and southwest forest regions as the study areas. Based on a unified framework combining MODIS GPP data, ERA5-Land meteorological data, and forest mask datasets, we evaluate the spatiotemporal dynamics of GPP and the regional differences in its climatic drivers across the three major forest regions over the period 2005–2025. Building on this, through dominant driver identification, temperature–VPD piecewise regression, and two-dimensional binning analysis of GPP responses, we further examine the threshold effects, nonlinear characteristics, and potential asymmetric responses of forest GPP to changing hydrothermal conditions under different climatic backgrounds. The work aims to provide regional-scale evidence for understanding the regional differentiation patterns and climatic response mechanisms of carbon sink changes in China’s typical forest ecosystems.
2. Materials and Methods
2.1. Study Area
The study area covers China’s three major typical forest regions: the northeast forest region, the southwest forest region, and the southern forest region (Figure 1). The northeast forest region is mainly distributed in the Greater Khingan Mountains, Lesser Khingan Mountains, and Changbai Mountains and is characterized by a temperate monsoon climate. The southwest forest region is located in the Hengduan Mountains and the Yunnan–Guizhou Plateau, where the terrain is complex and vertical climatic differentiation is clear. The southern forest region is controlled by a subtropical monsoon climate and has abundant hydrothermal conditions. Together, these three regions represent an energy-limited temperate forest system, a humid subtropical forest system, and a topographically complex mountain forest system, providing a suitable basis for comparing regional GPP dynamics and nonlinear climate-response patterns.
Figure 1.
Distribution of the three major forest regions in China: national overview (a), northeast forest region (b), southern forest region (c), and southwest forest region (d). Forest pixels were extracted from the MODIS MCD12Q1.061 land-cover product, and the forest region polygons were obtained from Tiandiwang.
2.2. Data Collection and Preprocessing
Forest extent masks were derived from the MODIS MCD12Q1 land-cover product [26] by extracting forest-class pixels and intersecting them with the three regional forest-boundary masks obtained from Tiandiwang [27]. The GPP data were obtained from the MODIS/Terra MOD17A2H.061 Gross Primary Productivity 8-day L4 Global 500 m product through Google Earth Engine [28]. The original temporal resolution was 8 days and the spatial resolution was 500 m, and the data were aggregated to a monthly scale. Although alternative GPP products such as GLASS, GOSIF/SIF-based products, and FLUXCOM are available, MODIS GPP was selected because it provides a long-term, globally consistent, moderate-resolution product with established quality-control information and direct accessibility in GEE. MODIS GPP products have been widely used to monitor vegetation productivity from regional to global scales and have been validated across multiple biomes and forest ecosystems, although their accuracy may still be affected by parameterization schemes, meteorological forcing data, and canopy structural representation [29]. Because MOD17-type GPP products are generated using a light-use-efficiency framework with meteorological constraints, including temperature, radiation, and atmospheric moisture-related stress terms, and because LUE-based GPP models are sensitive to parameterization and environmental scalars [30], the relationships between MODIS GPP and climate variables in this study should be interpreted as statistical associations within a remote sensing product framework rather than as fully independent physiological evidence. To evaluate the possible influence of MODIS data quality, we further summarized monthly GPP quality-control information using the MODIS QC layers. For each region and month, we calculated the mean GPP together with the fractions of good MODLAND quality and clear or assumed-clear observations. These QC summaries were used to assess whether regional time-series fluctuations could partly reflect optical-data quality limitations (Table S4).
Meteorological variables were obtained from ERA5-Land monthly averaged data provided by the Copernicus Climate Change Service Climate Data Store (CDS) [31]. The native spatial resolution of ERA5-Land is approximately 0.1° (~9 km), and the data were spatially aligned with the MODIS GPP grid only for overlay and regional aggregation. As a land-surface reanalysis dataset with high spatial and temporal resolution, ERA5-Land has been widely applied in regional climate and ecological-environment studies. Previous studies have shown that ERA5-Land has good capability for reproducing meteorological variables such as temperature and precipitation across different regions of China, although local-scale biases may remain due to topographic complexity and regional climatic differences [32,33,34,35]. The native spatial resolution and temporal resolution of each dataset are summarized in Table S1. ERA5-Land was spatially aligned with the MODIS GPP grid for overlay analysis and regional/elevation-band aggregation, but this alignment was not interpreted as generating true 500 m local meteorological fields, particularly in mountainous terrain. Vapor pressure deficit (VPD) is the difference between saturated vapor pressure and actual vapor pressure. In this study, saturated vapor pressure and actual vapor pressure were calculated from the 2 m air temperature and dew-point temperature, respectively, and monthly VPD was then obtained [36].
During data preprocessing, forest masks for the three major forest regions were first constructed. MODIS GPP was then aggregated to a monthly scale to form a monthly GPP dataset for 2005–2025. ERA5-Land meteorological variables were spatially aligned with the MODIS GPP grid for overlay analysis and regional/elevation-band aggregation, while retaining the interpretation that the meteorological information reflects the coarser reanalysis scale. Trend analysis, stability analysis, and partial correlation analysis were conducted at the pixel scale to identify spatial patterns, whereas temperature–VPD threshold identification and two-dimensional response analysis were performed using monthly regional mean values of forest pixels in each forest region to compare regional response differences.
2.3. Methods
2.3.1. Theil–Sen Median Trend Analysis
To accurately assess the spatiotemporal evolution of forest ecosystem productivity over a long time series and effectively avoid the influence of outliers on the overall trend [25], the Theil–Sen median trend method was used to calculate the rate of GPP change from 2005 to 2025. This method is suitable for non-normally distributed time series and series containing outliers and can be used to characterize the long-term direction and magnitude of GPP changes in the three major forest regions. The formula is as follows:
where β is the Sen slope estimator, and and denote the GPP values at the and j time steps, respectively. A beta value greater than 0 indicates an increasing GPP trend, whereas a beta value less than 0 indicates a decreasing trend.
2.3.2. Mann–Kendall (M–K) Significance Test
The Mann–Kendall test was used to determine the significance of the trend. This method does not require the data to follow a specific distribution and is suitable for trend testing of long ecological time series. The standardized test statistic Z is defined as:
where is the Mann–Kendall statistic, is its variance, and alpha is the significance level. At a given confidence level, if is greater than , the trend is considered statistically significant.
2.3.3. Partial Correlation Analysis
Because climatic factors such as temperature, precipitation, and VPD are coupled under natural conditions, partial correlation analysis was used as an exploratory statistical tool to describe the association between GPP and individual climatic variables while controlling for another variable [17,37]. Taking the first-order partial correlation between variables x and y while controlling variable z as an example, the following equation can be obtained:
where is the partial correlation coefficient between variables and after controlling for variable , and , , and are the corresponding simple correlation coefficients between variables. Given the inherent coupling between temperature and VPD and the meteorological dependence of MODIS GPP, the partial correlation results were interpreted as exploratory statistical associations rather than causal attribution of independent physiological drivers. To quantify this issue, we additionally calculated Pearson correlations between air temperature and VPD and variance inflation factors (VIFs) for the climatic variables (Table S3).
2.3.4. Coefficient of Variation (CV)
Quantitatively evaluating the temporal variability of ecosystem productivity is a key prerequisite for assessing regional carbon sink stability and sustainability [23]. To compare regional differences in forest productivity stability among the three major forest regions, the coefficient of variation (CV) was used to characterize interannual GPP fluctuation. Based on CV values, forest pixels were classified into high-stability zones (CV < 0.1), moderate-stability zones (0.1 ≤ CV < 0.2), and low-stability zones (CV ≥ 0.2), and the area and proportion of each class were calculated. The CV was calculated as:
where is the standard deviation of GPP during the study period and is the multi-year mean. Larger CV values indicate stronger interannual GPP fluctuation and lower forest productivity stability [17]. Spatial mapping of CV can show the spatial patterns of vulnerability and resistance of China’s typical forest ecosystems under climate variability [38].
2.3.5. Temperature–VPD Threshold Identification and Two-Dimensional Response Analysis
To identify the statistical turning point at which atmospheric drought effects intensify under warming, this study followed nonlinear threshold identification methods for forest productivity [39] and incorporated existing evidence that forest GPP responds to air temperature and VPD through a threshold pattern characterized by an initial increase followed by a decline [37]. Based on monthly regional mean data for forest pixels in the three major forest regions from 2005 to 2025, relationships among air temperature, VPD, and GPP were constructed. A segmented linear regression model was used to fit the temperature–VPD response, expressed as:
where is the vapor pressure deficit of the i-th time sample, is the corresponding air temperature, is the temperature threshold to be identified, , , and are regression coefficients, and is the random error term. The candidate threshold was searched iteratively, and the minimum residual sum of squares was used as the optimality criterion to determine the statistical turning point of the temperature–VPD relationship:
where is the residual sum of squares corresponding to candidate threshold and is the sample size. When RSS(c) reaches its minimum, the corresponding is taken as the optimal temperature threshold. To evaluate whether regional averaging masked topographic heterogeneity, we further conducted an elevation-stratified sensitivity analysis. Forest pixels in each region were divided into three elevation bands (<1000 m, 1000–2000 m, and ≥2000 m) using the SRTM DEM, and the same segmented monthly temperature–VPD regression was fitted separately for each elevation band [40,41]. These elevation-stratified results were used to assess whether the full-region turning points should be interpreted as robust regional summaries or as spatially uniform ecological thresholds (Table S2).
On this basis, because atmospheric drought (VPD) has been shown to be a key driver limiting photosynthesis independently of temperature [42], temperature and VPD were divided into multiple intervals to further show the nonlinear response characteristics of GPP under different hydrothermal combinations. The mean GPP within each temperature–VPD bin was calculated as:
where is the mean GPP corresponding to the temperature interval and the VPD interval, is the number of samples in that bin, and is the GPP value of the sample falling within the bin. By constructing a two-dimensional temperature–VPD response space, the distribution of GPP under different hydrothermal combinations in the three major forest regions was analyzed to quantitatively clarify interactive stress characteristics and their nonlinear control on forest productivity [43]. This analysis helps show nonlinear responses and regional differences in forest ecosystem responses to climate change and provides a more accurate basis for evaluating ecological vulnerability and resistance in different Chinese forest regions under compound extreme events such as droughts and heat waves [44].
3. Results
3.1. Spatial Distribution
As shown in Figure 2, GPP across China’s three major forest regions from 2005 to 2025 followed a clear south-high, north-low pattern. The southern forest region had the highest multi-year mean GPP at 1838.94 g C m−2 yr−1, followed by the southwest forest region at 1759.94 g C m−2 yr−1, with the northeast forest region being relatively lower at 1609.90 g C m−2 yr−1. At the pixel scale, the spatial standard deviations of multi-year mean GPP for the northeast, southern, and southwest forest regions were 246.79, 537.34, and 724.20 g C m−2 yr−1, respectively, with corresponding 2–98% quantile intervals of 1387.22–1984.39, 1241.74–3024.05, and 690.39–3203.83 g C m−2 yr−1. These values indicate that the southwest forest region had the largest internal dispersion, followed by the southern forest region, while the northeast forest region was relatively concentrated. Spatially, high GPP values in the northeast forest region were concentrated mainly in the eastern and mountainous forest areas where water and heat conditions are more favorable. In the southern forest region, a band of high GPP values ran fairly continuously along humid mountainous areas and coastal hills. The southwest forest region, influenced by topographic dissection and elevation gradients, showed a patchy mosaic of high and low values, with the strongest spatial differentiation among the three regions.
Figure 2.
Multi-year mean spatial distribution of GPP across China’s three major forest regions, 2005–2025.
3.2. Temporal Variation
As shown in Figure 3, the M–K significance test further indicated that pixels with increasing trends dominated all three forest regions, but the significance structure differed clearly among them. In the southern forest region, the proportions of significantly increasing and non-significantly increasing pixels were 51.4% and 41.2%, respectively, with significantly and non-significantly decreasing pixels together accounting for only 7.4%. In the northeast forest region, the corresponding proportions were 40.6%, 50.9%, 0.1%, and 8.3%, also with increasing trends prevailing. In the southwest forest region, significantly increasing pixels accounted for only 17.8% and non-significantly increasing pixels for 46.2%, whereas significantly and non-significantly decreasing pixels together reached 36.1%, suggesting stronger directional divergence in its trend pattern.
Figure 3.
Spatial distribution of GPP trend significance (M–K test) across China’s three major forest regions, 2005–2025.
Spatially, as shown in Figure 3, the areas with increasing trends were distributed fairly continuously in the northeast and southern forest regions, with significantly increasing areas occurring more often in core forest zones and zones of higher productivity. In the southwest forest region, increasing and decreasing patches were intermingled, with a relatively larger share of non-significant changes and localized declines, indicating that under the combined influence of complex terrain and hydrothermal differences, the spatial coherence of GPP temporal changes in this region was weaker than in the other two forest regions.
As shown in Figure 4, the annual mean GPP of the three forest regions all displayed clear interannual fluctuations from 2005 to 2025, but with different temporal patterns. The southern forest region showed the strongest upward trend, with a linear growth rate of approximately 7.79 g C m−2 yr−2; its annual mean GPP rose from 1838.94 g C m−2 yr−1 in 2005 to 1956.97 g C m−2 yr−1 in 2025, peaking at 2107.38 g C m−2 yr−1 in 2021. The northeast forest region experienced a slow and steady increase, with a growth rate of approximately 4.42 g C m−2 yr−2, its lowest value occurring in 2007 (1571.06 g C m−2 yr−1) and its highest in 2023 (1698.25 g C m−2 yr−1). The southwest forest region showed a weak increasing trend based on linear fitting, with a growth rate of approximately 2.00 g C m−2 yr−2; however, due to fluctuations, its 2025 value (1737.67 g C m−2 yr−1) was slightly lower than that of 2005 (1759.94 g C m−2 yr−1), showing an overall pattern of initial increase followed by fluctuating decline. Its lowest value occurred in 2010 (1731.62 g C m−2 yr−1) and its highest in 2022 (1892.52 g C m−2 yr−1). Regarding fluctuation magnitude, the southern forest region had the largest range (268.44 g C m−2 yr−1), followed by the southwest forest region (160.90 g C m−2 yr−1), with the northeast forest region being the smallest (127.19 g C m−2 yr−1).
Figure 4.
Interannual variation in mean GPP across China’s three major forest regions, 2005–2025.
3.3. Stability
To further compare interannual fluctuation differences in forest productivity among the three regions, forest pixels were classified by stability level according to the GPP coefficient of variation (CV), with results summarized in Table 1. Overall, high-stability zones dominated all three forest regions, but the degree of stability differed clearly across regions. The southern forest region had the highest area proportion of high-stability zones (95.6%), followed by the northeast forest region (92.9%), with the southwest forest region being the lowest (69.8%), suggesting that forest ecosystems in different regions differ in their sensitivity to external fluctuations.
Table 1.
GPP stability classification statistics for the three major forest regions.
Further, the moderate-stability and low-stability zones in the southwest forest region accounted for 27.8% and 2.4%, respectively, clearly higher than those in the northeast forest region (7.1% and <0.1%) and the southern forest region (4.3% and 0.1%). This indicates that moderate- and low-stability zones were concentrated mainly in the southwest forest region, while in the northeast and southern forest regions they accounted for only small proportions and appeared mostly as scattered patches along edges or transitional belts. A consistent relationship emerged between stability and productivity: taking the southwest forest region as an example, the mean GPP of the high-stability zone was approximately 2082.36 g C m−2 yr−1, clearly higher than that of the moderate-stability zone (1379.35 g C m−2 yr−1) and the low-stability zone (928.15 g C m−2 yr−1). The northeast and southern forest regions also showed the general pattern that mean GPP in high-stability zones was higher than in moderate-stability zones, indicating that declining stability is often accompanied by lower productivity and stronger spatial differentiation.
3.4. Regional Differences in Climatic Drivers
As shown in Figure 5, the change backgrounds of the main climatic factors differed clearly among the three forest regions. The northeast forest region showed a fairly continuous warming signal; the southern forest region had relatively abundant water and heat conditions overall; and the southwest forest region, influenced jointly by complex terrain and monsoons, displayed stronger hydrothermal fluctuations and spatial heterogeneity. These patterns provide the regional climatic context for the subsequent partial correlation analysis and classification of the statistically strongest climate–GPP associations.
Figure 5.
Change trends of major climatic factors in the three major forest regions for precipitation (a), temperature (b), VPD (c), and radiation (d).
As shown in Figure 6, the partial correlation analysis mainly reflected the response direction and spatial patterns of GPP to different climatic factors in the three forest regions. In the northeast forest region, the positive response of GPP to temperature was distributed fairly continuously, suggesting that improved thermal conditions exerted a steady promoting effect on forest productivity in this region. The southern forest region showed a spatial pattern shaped jointly by temperature and VPD, indicating that its productivity changes were regulated by both thermal conditions and atmospheric dryness. The southwest forest region displayed more complex water–heat coupling, with temperature-, VPD-, and precipitation-correlated patches interlaced, showing the strongest spatial heterogeneity.
Figure 6.
Spatial distribution of partial correlation coefficients between GPP and precipitation (a), temperature (b), radiation (c), and VPD (d) across China’s three major forest regions.
As shown in Figure 7, the spatial distribution of the statistically strongest climatic signals associated with GPP differed clearly among the three forest regions. The northeast forest region was mainly associated with VPD and temperature signals. The southern forest region showed broad temperature-associated areas accompanied by a fairly continuous VPD-associated belt. The southwest forest region was mainly associated with temperature, but precipitation- and radiation-associated patches were more prominently intermingled, reflecting the spatial heterogeneity of hydrothermal constraints against a background of complex terrain.
Figure 7.
Spatial distribution of the statistically strongest climate–GPP association in China’s three major forest regions.
As shown in Figure 8, the statistically strongest climate–GPP association results further quantified the area proportions of different climatic factors in each forest region. In the northeast forest region, the VPD-dominated area was the largest (39.6%), followed by the temperature-dominated area (33.1%), with radiation and precipitation accounting for 14.5% and 12.7%, respectively. In the southern forest region, temperature dominance was most prominent (46.3%), with the VPD-dominated area also being fairly high (34.0%), and radiation and precipitation at 11.3% and 8.4%, respectively. In the southwest forest region, the temperature-dominated area was the largest (55.6%), with VPD, radiation, and precipitation at 17.6%, 17.0%, and 9.7%, respectively. These results indicate that although the northeast forest region showed a clear positive temperature response, both VPD and temperature accounted for high proportions in terms of dominant-control area, with VPD holding a slight edge. The southern forest region was mainly temperature-controlled, while VPD also played an important role. In the southwest forest region, temperature held an advantage in the dominant-control area, but moisture-related factors were distributed in a more fragmented pattern, suggesting more complex water–heat coupling. The multicollinearity diagnostics confirmed strong coupling between air temperature and VPD (Table S3). The Tair–VPD correlations ranged from 0.94 to 0.96 in the north, 0.83 to 0.90 in the south, and 0.33 to 0.86 in the southwest. The VIF ranges were 16.4–17.5 for Tair and 13.0–18.3 for VPD in the north, 9.4–14.1 and 10.0–14.5 in the south, and 8.0–20.7 and 6.8–15.1 in the southwest. Therefore, these mapped areas should be interpreted as statistically strongest climate–GPP associations, not as fully independent climatic controls.
Figure 8.
Area proportions of the statistically strongest climate–GPP associations in the three major forest regions.
3.5. Temperature–VPD Thresholds and Nonlinear GPP Responses
To further understand the synergistic response of forest productivity to hydrothermal factors in the three forest regions, we constructed a composite figure (Figure 9) combining the study area map, temperature–VPD piecewise regression results, and two-dimensional GPP binning results. The results showed that the GPP response to temperature and VPD was not a simple linear relationship but instead displayed clear threshold effects, nonlinear characteristics, and regional differences.
Figure 9.
Study area location (a), temperature–VPD statistical turning-point relationship (b), and two-dimensional temperature-VPD binning of mean monthly GPP (g C m−2 month−1) (c). Gray polygons in panel (a) indicate the forest region subdivisions used for regional comparison.
As shown in Figure 9b, the statistical turning points differed considerably among the three forest regions: approximately 11.74 °C for the northeast forest region, 10.43 °C for the southwest forest region, and 25.64 °C for the southern forest region. In general, the northeast and southwest forest regions showed a clear VPD intensification trend at relatively low temperatures, whereas in the southern forest region the notable change occurred mainly at the high-temperature end, suggesting that the sensitivity of atmospheric drought effects to warming differs substantially across climatic backgrounds. As a supplementary sensitivity analysis, the segmented regression was further repeated within elevation bands (Table S2). The additional analysis showed that the elevation-band turning-point ranges were −9.17 to 5.54 °C in the north, 18.62 to 26.95 °C in the south, and 2.29 to 25.50 °C in the southwest, with corresponding piecewise R2 ranges of 0.89–0.95, 0.72–0.82, and 0.23–0.85, respectively. This indicates that the full-region turning points in Figure 9 should be interpreted as monthly regional statistical summaries rather than spatially uniform ecophysiological thresholds.
As shown in Figure 9c, GPP displayed a clear nonlinear distribution across the hydrothermal space in all three forest regions, but the temperature–VPD combinations corresponding to high GPP values differed substantially among them. In the northeast forest region, GPP showed a fairly clear gradient increase with rising temperature, with high values concentrated mainly under higher temperatures and moderate-to-high VPD conditions. In the southern forest region, high GPP values were mainly distributed under high-temperature conditions, indicating a relatively strong capacity to maintain high productivity under abundant heat, although the rapid intensification of VPD at the high-temperature end could still weaken the gains from warming. The southwest forest region displayed a more complex water–heat coupling pattern: a clear turning point existed, but the scatter of responses beyond the threshold was relatively high, suggesting that forest productivity in this region is jointly regulated by temperature, moisture, and topographic conditions.
Taken together, all three forest regions showed clear optimal hydrothermal combination intervals, indicating that GPP responses to climate change are distinctly nonlinear and regionally heterogeneous, and pointing to the segmented effects of warming across different temperature intervals and their coupling constraints with increasing atmospheric dryness.
4. Discussion
4.1. GPP Spatial Patterns and Regional Differences
The results of this study show that GPP across China’s three major forest regions from 2005 to 2025 followed a clear south-high, north-low spatial pattern, a differentiation that aligns well with the regional distribution of water and heat resources and forest types. This spatial pattern is consistent with previous reports based on both remote sensing and flux observations [11,19,45,46]. Specifically, this macroscopic latitudinal gradient and its dependence on annual temperature, precipitation, and growing season length have been widely corroborated ecosystems in China [46]. The southern forest region lies within the subtropical monsoon climate zone, where abundant heat, plentiful precipitation, and a long growing season allow evergreen forests to sustain high photosynthetic intensity throughout the year, yielding the highest multi-year mean GPP. The northeast forest region, constrained by higher latitude and low temperatures, has a relatively short growing season, and insufficient heat remains a key factor limiting forest productivity accumulation, resulting in a lower mean GPP. Furthermore, recent evidence highlights that such macroscopic hydrothermal gradients fundamentally shape productivity by modulating ecosystem light response parameters, such as the maximum gross photosynthetic rate [47]. The southwest forest region, although possessing relatively favorable thermal conditions, is characterized by complex terrain and marked vertical climatic differentiation, which cause strong spatial unevenness in water and heat availability; its overall GPP therefore lies between those of the southern and northern regions, with stronger local heterogeneity. Indeed, topographic factors such as elevation and localized radiation play a dominant role in driving the high spatial variability of GPP in these complex southwestern terrains [48].
This spatial differentiation not only reflects differences in hydrothermal backgrounds among the forest regions but also aligns with existing understanding of warming responses in high-latitude forests. High-latitude forest productivity generally responds positively to warming, and such gains are more likely in areas where heat constraints are stronger [49]. At the macro-scale, temperature and spring phenology have increasingly become the statistical associations of such productivity gains across the Northern Hemisphere [50,51]. However, while accurate modeling of this spring phenology is essential [52]. Recent work on seasonal stability of vegetation growth in northern China further indicates that early-season greening does not necessarily translate into sustained annual productivity gains [53], often showing a decoupling between apparent greenness and actual photosynthesis [54], because late-season temperature and intra-seasonal carryover processes—such as adverse moisture legacy effects triggered by early spring water depletion [55,56]—can regulate warming benefits in energy-limited regions [53]. The lower multi-year mean GPP and heat-limited characteristics of the northeast forest region thus provide mechanistic support for the north–south contrast found in this study.
4.2. GPP Trends, Stability, and Climatic Context
In terms of temporal variation, GPP in all three forest regions showed a fluctuating upward trend over the study period, suggesting that under the combined effects of climate warming and forest recovery [57], the overall carbon sink capacity of China’s major forest areas has increased, particularly after the 2010 turning point [14]. Among them, the southern forest region showed the largest increase, indicating that under sufficient water and heat conditions, forest productivity responds more strongly to environmental improvement driven by vegetation structural changes and CO2 fertilization [58,59]. The northeast forest region, though lower in absolute level, displayed a clear increasing trend, reflecting the sustained promoting effect of warming on energy-limited forests [60]. The southwest forest region showed a steady increase, but influenced by monsoon fluctuations, topographic differentiation, and dry–wet season transitions, its interannual variability and local stability differences deserve greater attention. At the same time, the stability analysis also showed that high GPP does not necessarily imply the most stable system, as the resistance and resilience of different forest regions under climatic fluctuations still differ considerably [61].
These results also suggest that GPP growth trends need to be understood together with regional stability and moisture constraints. Forests in humid regions can generally maintain high productivity when water and heat conditions improve, but when soil moisture approaches or crosses a critical threshold, ecological processes may gradually shift from energy-limited to water-limited regimes [23]. Recent China-scale analyses further show that soil moisture and VPD affect GPP synchronously but with clear regional differences, while the promoting effect of temperature on GPP is often mediated indirectly through LAI and root-zone soil moisture [62,63]. Meanwhile, moisture-vulnerable regions such as the southwest respond more strongly to droughts across different time scales [64]. For instance, extreme droughts in Southwest China can severely limit the carbon sink capacity of tall forests due to their inherently high water demand [65]. Furthermore, comprehensive evaluations reveal that the resistance and resilience of terrestrial ecosystems to drought in this region are highly heterogeneous [66] and can be further compromised by human disturbances in ecologically fragile karst landscapes [67], reflecting divergent response patterns between restored and natural forests [68]. Thus, the more prominent interannual fluctuation and stability differentiation found in the southwest forest region in this study may reflect the ecological effects of intensified moisture constraints and specific geomorphological features like karst landscapes [67] in the context of climatic fluctuations.
4.3. Regional Heterogeneity of Climatic Limiting Factors
This study identified clear regional heterogeneity in the climatic factors limiting GPP across the three forest regions, a difference closely related to the hydrothermal backgrounds and constraint mechanisms of each region. The northeast forest region showed the most continuous positive temperature response, and both temperature and VPD accounted for high proportions of the dominant-control area, suggesting that this region is still mainly characterized by the alleviation of energy limitation, although some areas have begun to show synergistic constraints from atmospheric moisture. This is consistent with the understanding that high-latitude forests are generally sensitive to warming: improved growing season heat typically promotes carbon uptake, while VPD constraints increase in parallel with rising evapotranspiration demand [49,53]. Indeed, recent evidence from northern temperate forests confirms that compound heat and moisture stress can induce canopy stomatal closure, strictly modulating the upper limit of energy-driven growth [69,70]. This sensitivity suggests that the warming-induced carbon sink dividend in the northeast forest region may be increasingly offset by atmospheric dryness [71].
The southern forest region was mainly temperature-controlled, with VPD also playing an important role, indicating that under relatively favorable water and heat conditions, productivity changes are regulated more by thermal factors, accompanied by notable atmospheric moisture constraints. Recent China-scale studies suggest that the climatic response of GPP in humid regions is not driven by temperature alone, but jointly regulated by temperature, VPD, soil moisture, and LAI-mediated indirect effects [62,63]. Therefore, short-term productivity changes in the southern forest region may appear thermally driven, whereas long-term maintenance still depends on stable water supply and relatively low atmospheric drought pressure. Recent evidence confirms that GPP is more sensitive to moisture deficits than to heat stress [72], a vulnerability evidenced by the severe carbon sink reduction during southern China’s 2022 extreme heatwave-drought [73].
In the southwest forest region, temperature held an advantage in the dominant-control area, but moisture-related factors showed a more fragmented spatial distribution, indicating that the regulation of GPP by water-heat coupling has stronger spatial heterogeneity against a background of complex terrain. Previous studies have shown that southwest forests are relatively sensitive to seasonal drought and extreme water deficits, and that topographic differentiation further amplifies such response differences [64,74], a vulnerability particularly pronounced in tall forests constrained by high water demand [65]. Recent analyses of the 2023 compound heatwave–drought event in Southwest China and GPP modeling for karst evergreen broadleaf forests also indicate that low soil moisture, high VPD, frequent cloud and rainfall conditions, and rugged terrain jointly increase the uncertainty in productivity estimation and climatic-response interpretation in this region [48,75,76,77], highlighting the unique adaptive responses of karst vegetation to such extreme compound droughts [78].
Overall, no single uniform climatic control mode applies across China’s three major forest regions. Instead, they show different dominant-control mechanisms along an energy-limited to water-limited gradient: the northeast forest region is closer to the energy-limited end, the southern forest region shows joint regulation by energy and atmospheric moisture, and the southwest forest region displays more complex water–heat coupling and spatial heterogeneity. This integrated pattern is broadly consistent with recent understanding of transitions from energy-limited to water-limited regimes under critical moisture conditions along wet-to-dry climate gradients [79], as well as global evidence on critical soil moisture thresholds that trigger such regime shifts [80]. Furthermore, the spatial shift in the dominant role of atmospheric vapor pressure deficit and soil moisture on vegetation growth has been explicitly documented across China [81], particularly with soil moisture imposing an increasingly severe constraint on productivity in recent decades [82]. Such patterns are further supported by high-resolution evidence identifying precisely when and where soil dryness becomes the dominant factor for ecosystem photosynthesis [83], collectively reinforcing the divergent constraints imposed by soil moisture and VPD on vegetation productivity [23,62,84].
4.4. Nonlinear Threshold Response and Its Ecological Mechanisms
What this study directly demonstrates is the nonlinear threshold response under temperature–VPD constraints, rather than an asymmetric response in the strict, fully quantified sense. Figure 9 shows that the promoting effect of warming on GPP in all three forest regions depends clearly on the temperature interval: in the lower- or moderate-temperature range, warming is generally accompanied by enhanced photosynthetic enzyme activity, an extended growing season, or the alleviation of energy limitation, thereby boosting forest productivity [39]. Such nonlinear sensitivity has been further confirmed by recent observations in Chinese forest ecosystems, where GPP initially increases with temperature and VPD but exhibits a sharp decline once specific environmental thresholds are surpassed [85]. However, when temperatures continue to rise and drive a rapid increase in VPD, the higher atmospheric evapotranspiration demand leads vegetation to reduce stomatal conductance to limit water loss, which in turn restricts CO2 uptake and carbon fixation [86]. This is highly consistent with recent global evidence showing a convergent VPD threshold, beyond which atmospheric drought stress fundamentally overrides CO2 fertilization and temperature benefits by severely constraining stomatal conductance [87].
This piecewise response helps explain why different forest regions show different statistical turning points and optimal hydrothermal combinations [88,89]. The northeast forest region is more strongly energy-limited, so the promoting effect of warming is more apparent in the low-to-moderate-temperature range, but constraints appear earlier as VPD rises concurrently. The southern forest region can maintain high productivity under high-temperature, humid conditions, although its carbon sink sensitivity is primarily dominated by water factors like precipitation and soil moisture in these subtropical zones [89]. Such regional variations are further clarified by findings that moderately water-dominated hydrothermal synergy provides the optimal conditions for forest photosynthesis [88]. The southwest forest region, with stronger topographic relief and spatial and temporal moisture fluctuations, shows more complex scatter beyond the threshold, reflecting the intricate ways that hydrothermal integration and synergy regulate forest carbon exchange. Recent multi-source evidence further shows that high VPD constraints on GPP intensify with warming and drought severity, and that a shift from energy limitation to water limitation can occur near-critical soil moisture thresholds [23,86]. China-scale comparisons of soil moisture and VPD effects also confirm that their constraints on vegetation productivity differ substantially among regions [62].
Therefore, under continued warming, the future risk lies not in warming per se inevitably suppressing GPP, but in the possibility that, if warming coincides with intensified atmospheric drought, the carbon sink gains in some forest regions may be weakened [90], or may even shift from being promoted to being constrained [91]. This conclusion is a mechanistic inference based on the current threshold relationships, two-dimensional response patterns, and recent evidence of VPD limitation [21,86,87]. Specifically, recent projections suggest that high VPD-dominated drought stress could lead to nearly a 100% loss of annual aggregated dryland GPP by the end of the 21st century [90]. Moreover, the asymmetric suppression of GPP over ecosystem respiration by elevated VPD further elucidates why carbon sequestration capacity may deteriorate under progressive warming [91]. Such conclusions still require further verification using higher temporal resolution observations and process-based models.
These regional patterns are also consistent with broader global evidence that warming can enhance productivity in energy-limited temperate and boreal forests, whereas increasing VPD and drought stress increasingly constrain productivity in humid subtropical, tropical, and water-sensitive forest systems. Therefore, China’s major forest regions should not be interpreted as uniformly resilient or vulnerable. Instead, the northeast forest region shows stronger temperature-related gains under energy limitation, while the southern and southwest forest regions show stronger exposure to atmospheric dryness and hydrothermal coupling, a pattern comparable to VPD-related constraints reported in other forest biomes worldwide. However, recent evidence from boreal forests in Northeast China suggests that permafrost degradation and thaw-induced hydrological changes may shift forest growth from energy limitation toward water limitation, thereby weakening aboveground carbon sink strength [92].
4.5. Uncertainties and Research Outlook
Although this study analyzed the spatiotemporal variation in GPP and its climatic responses across China’s three major forest regions within a unified data and methodological framework, certain uncertainties remain. Recent assessments of multiple remote sensing GPP products over China have pointed out that, owing to differences in algorithm structure, input data, and site representativeness, non-negligible errors persist in large-scale spatial consistency and interannual variability capture [93].
First, the MODIS GPP product may have some saturation effect in areas with high vegetation cover, thereby affecting estimation accuracy in high-value zones. The latest China-scale evaluation shows that remote sensing GPP products differ considerably across ecosystem types and spatiotemporal scales; GOSIF and related products agree well with flux observations in forest ecosystems, whereas some products still have limitations in reproducing interannual variability and growing season peaks [93]. These limitations are largely driven by the choice of input vegetation indices; recent studies on planted forests demonstrate that emerging proxies like NIRv and SIF are significantly more effective than traditional NDVI and EVI in tracking growing season dynamics and interannual GPP variations [94]. Furthermore, early validation efforts using eddy covariance data have highlighted that while remote sensing models can capture broad seasonal phases, precisely matching the GPP magnitude in specific ecosystems, such as old-growth temperate mixed forests, requires continuous site-specific calibration [95]. Recent cross-validation focused on the complex forested terrain of Southwest China further confirmed that existing remote sensing GPP products still generally underestimate GPP during the peak growing season of evergreen broadleaved forests, with complex terrain and heterogeneous vegetation structure remaining core challenges for estimation accuracy [77]. To mitigate these biases in complex tropical ecosystems, regional-scale correction models, such as the VPM-based approach applied in Xishuangbanna, have demonstrated that optimizing water stress and vegetation index parameters can significantly improve GPP estimation under persistent cloud cover [96]. In addition, work on karst evergreen broadleaf forests in Southwest China shows that persistent cloud and rainfall, rugged topography, and sparse observations increase the difficulty of GPP simulation, while parameter optimization and phase-specific bias correction can substantially improve model performance [76]. In addition, we added a MODIS GPP quality-control summary to evaluate the possible influence of optical-data quality on the regional GPP time series. The additional QC summary showed that the mean good MODLAND-quality fractions were 0.782, 0.801, and 0.813 for the north, south, and southwest, respectively, whereas the clear or assumed-clear fractions were 0.677, 0.603, and 0.700 (Table S4). During the May–September growing season, the north showed higher QC support, with a good MODLAND fraction of 0.915 and a clear or assumed-clear fraction of 0.881. These results suggest that the main GPP patterns are supported by substantial valid observations, but cloud and rainfall effects, especially in the southern and southwest forest regions, remain a source of uncertainty in interpreting interannual fluctuations. Similar cautions have also been raised in heterogeneous coastal–urban ecosystems, where satellite-derived GPP can be affected by land-cover transitions and human disturbance [96].
Second, the forest mask was generated by extracting forest-class pixels from a land-cover type map. Although this effectively constrains the analysis extent, different land-cover products may themselves contain classification errors, even though MODIS land-cover products have been widely characterized and algorithmically refined in previous studies [26]. Such classification uncertainty can affect key biophysical inputs such as LAI; recent tower-to-global upscaling research shows that remotely sensed LAI, shortwave radiation, and latent heat flux are important predictors for GPP and carbon flux estimation, and differences among MODIS-LAI, Sentinel-3-LAI, and ERA5-Land inputs can propagate into regional estimates [97]. A spatial-scale mismatch also exists between the 500 m MODIS GPP product and the coarser ERA5-Land meteorological fields. Although the datasets were spatially aligned for overlay and aggregation, this procedure does not provide true 500 m microclimatic information. This limitation is particularly relevant in the southwest forest region, where complex terrain and vertical climatic gradients can cause local hydrothermal conditions to deviate from reanalysis-scale averages (Table S1), as also suggested by evaluations of ERA5-Land performance in mountainous regions of China [35]. Furthermore, a systematic evaluation of GPP simulations across China emphasizes that the choice of vegetation classification systems and the representativeness of site-level datasets remain substantial sources of uncertainty in large-scale productivity mapping [98]. In addition, forest age and stand structure may further confound the attribution of carbon sink variation to climatic drivers alone, as shown by recent regional analyses of forest carbon sinks in arid China [99].
Third, the temperature–VPD threshold identification was based on monthly aggregated regional or elevation-band mean data, Therefore, the identified turning points represent monthly statistical changes in the temperature–VPD relationship, not direct physiological thresholds for stomatal closure or short-term drought stress. Daily or half-hourly flux-tower observations would be required to validate whether these monthly statistical turning points correspond to actual ecophysiological critical thresholds. Previous studies have indicated that vegetation responses to drought stress in China mostly occur on shorter time scales [39], and that drought intensity thresholds for GPP loss differ between monthly, seasonal, and longer-term drought processes [100]. Therefore, statistical identification using monthly data may smooth out these short-period transient physiological stress features, leading to a discrepancy between statistical turning points and actual physiological triggering thresholds.
The elevation-stratified sensitivity analysis further showed that threshold estimates varied across topographic settings, especially in the southwest forest region (Table S2). Thus, the full-region Figure 9 turning points should be viewed as regional statistical summaries, while elevation-specific or pixel-level analyses are needed for finer-scale ecological interpretation. The latest study based on observation-constrained models, satellite retrievals, and Dynamic Global Vegetation Model simulations further suggests that VPD constraints on GPP intensify under warming and affect terrestrial carbon uptake through stomatal regulation and plant hydraulic function [81]. Future research could integrate higher-resolution remote sensing products, tower-to-regional and tower-to-global upscaling methods [94], advanced chlorophyll fluorescence-based constraints on photosynthetic capacity [101], the broader application of satellite-derived SIF for quantifying structural and physiological variations in contrasting forest ecosystems [102], and future climate scenario simulations to further investigate the potential risks and vulnerabilities that climate change poses to forest carbon sinks under continued warming [103] and to further assess the change trends and risk thresholds of carbon sink functions across the three major forest regions.
5. Conclusions
Based on the Google Earth Engine (GEE) platform, this study integrated forest extent masks for the three major forest regions, the MODIS GPP product, and ERA5-Land monthly meteorological data to analyze the spatiotemporal variation in GPP, regional differences in climatic drivers, and the nonlinear and threshold response of GPP to changing hydrothermal conditions across China’s three major forest regions from 2005 to 2025. The main conclusions are as follows:
- (1)
- From 2005 to 2025, GPP across China’s three major forest regions followed an overall south-high, north-low spatial pattern. The southern forest region had the highest multi-year mean GPP, followed by the southwest forest region, with the northeast forest region being relatively lower. The southwest forest region showed the largest internal dispersion and the strongest spatial heterogeneity.
- (2)
- Over the study period, GPP in the three forest regions showed an overall fluctuating upward trend, but with clear differences in stability. The southern forest region had the most prominent increase and the highest proportion of high-stability zones; the northeast forest region showed a slow and steady rise with intermediate stability; the southwest forest region, despite a slight overall increase, displayed stronger directional divergence in its trends and the highest proportion of moderate- and low-stability zones, suggesting it is more sensitive to external fluctuations.
- (3)
- The statistical climate–GPP association patterns differed clearly among regions. Partial correlation results showed that the northeast forest region had a more continuous positive temperature response; the southern forest region was shaped jointly by temperature and VPD; and the southwest forest region displayed more complex water–heat coupling and spatial heterogeneity. In terms of dominant-control area, VPD and temperature accounted for 39.6% and 33.1%, respectively, in the northeast forest region; temperature and VPD accounted for 46.3% and 34.0% in the southern forest region; and temperature accounted for 55.6% in the southwest forest region, indicating that the strongest statistical climate signals and their spatial organization differ among the three forest regions.
- (4)
- Monthly statistical turning points were identified in the temperature–VPD relationship, with thresholds of approximately 11.74 °C, 10.43 °C, and 25.64 °C for the northeast, southwest, and southern forest regions, respectively. Two-dimensional binning results further showed that all three forest regions had optimal hydrothermal combination intervals, and that the effect of warming differed clearly across temperature intervals and was coupled with constraints from increasing atmospheric dryness. The VPD constraint appeared earlier in the northeast and southwest forest regions, whereas in the southern forest region the intensifying effect was mainly seen at the high-temperature end. The supplementary elevation-stratified analysis further indicated that these values should be interpreted as regional statistical summaries rather than spatially uniform physiological thresholds.
Overall, the responses of forest ecosystems to climate change across China’s three major forest regions are clearly regionally heterogeneous and display distinct nonlinear and threshold characteristics. This study provides regional-scale evidence for understanding forest carbon sink changes and their potential risks under different climatic backgrounds.
Supplementary Materials
The following supporting information can be downloaded at https://www.mdpi.com/article/10.3390/rs18132125/s1: Table S1. Data sources, native resolution, temporal resolution, and preprocessing; Table S2. Elevation-stratified sensitivity analysis of monthly temperature-VPD statistical turning points; Table S3. Multicollinearity diagnostics for air temperature and VPD; Table S4. MODIS GPP quality-control summary by region.
Author Contributions
Conceptualization, H.Z.; Methodology, H.L. and L.Z.; Software, H.L.; Validation, H.L. and L.Z.; Formal Analysis, H.L., L.Z., P.W. and Y.X.; Investigation, H.L. and L.Z.; Data Curation, H.L., L.Z., R.Y., C.C., P.W. and Y.X.; Writing—Original Draft, H.L.; Writing—Review and Editing, H.Z.; Visualization, H.L. and H.W.; Supervision, H.Z.; Funding Acquisition, H.Z. All authors have read and agreed to the published version of the manuscript.
Funding
This research was funded by the National Natural Science Foundation of China (grant number 42507651).
Data Availability Statement
All datasets used in this study are publicly available. The MODIS GPP data were obtained from the MOD17A2H.061 product provided by the NASA Land Processes Distributed Active Archive Center (LP DAAC; https://doi.org/10.5067/MODIS/MOD17A2H.061). The MODIS land-cover data used for forest masking were obtained from the MCD12Q1.061 product provided by NASA LP DAAC (https://doi.org/10.5067/MODIS/MCD12Q1.061). ERA5-Land monthly climate data were obtained from the Copernicus Climate Data Store (https://doi.org/10.24381/cds.68d2bb30). Elevation data were obtained from the NASA Shuttle Radar Topography Mission Global 1 arc-second product provided by NASA LP DAAC (https://doi.org/10.5067/MEASURES/SRTM/SRTMGL1.003). Forest region boundary data were obtained from Tianditu/National Platform for Common Geospatial Information Services (https://www.tianditu.gov.cn/). The processed data supporting the figures and tables are included in the article and Supplementary Materials.
Acknowledgments
We sincerely thank the anonymous reviewers for their constructive comments, which have greatly improved this study. We also extend our appreciation to all individuals and institutions that supported and contributed to this research.
Conflicts of Interest
The authors declare no conflicts of interest.
References
- Chen, B.; Arain, M.A.; Chen, J.M.; Wang, S.Q.; Fang, H.L.; Liu, Z.H.; Mo, G.; Liu, J. Importance of Shaded Leaf Contribution to the Total GPP of Canadian Terrestrial Ecosystems: Evaluation of MODIS GPP. J. Geophys. Res. Biogeosci. 2021, 126, e2020JG005917. [Google Scholar] [CrossRef] [Scilit]
- Lv, Y.; Li, X.Y.; Chi, W.F. Maximum Gross Primary Productivity Dominates the Trend in Gross Primary Productivity in China’s Deciduous Forest Ecosystems. Forests 2023, 14, 1880. [Google Scholar] [CrossRef] [Scilit]
- Li, W.; Ciais, P.; Wang, Y.L.; Yin, Y.; Peng, S.S.; Zhu, Z.C.; Bastos, A.; Yue, C.; Ballantyne, A.P.; Broquet, G.; et al. Recent Changes in Global Photosynthesis and Terrestrial Ecosystem Respiration Constrained From Multiple Observations. Geophys. Res. Lett. 2018, 45, 1058–1068. [Google Scholar] [CrossRef] [Scilit]
- Uchale, G.; Burman, P.K.D.; Tiwari, Y.K.; Datye, A.; Sarkar, A. Investigating Terrestrial Carbon Uptake Over India Using Multimodel Simulations of Gross Primary Productivity and Satellite-Based Biophysical Product. J. Geophys. Res. Biogeosci. 2023, 128, e2023JG007468. [Google Scholar] [CrossRef] [Scilit]
- Phillips, O.L.; Aragao, L.; Lewis, S.L.; Fisher, J.B.; Lloyd, J.; López-González, G.; Malhi, Y.; Monteagudo, A.; Peacock, J.; Quesada, C.A.; et al. Drought Sensitivity of the Amazon Rainforest. Science 2009, 323, 1344–1347. [Google Scholar] [CrossRef] [Scilit] [PubMed]
- Albrich, K.; Seidl, R.; Rammer, W.; Thom, D. From sink to source: Changing climate and disturbance regimes could tip the 21st century carbon balance of an unmanaged mountain forest landscape. Forestry 2023, 96, 399–409. [Google Scholar] [CrossRef] [Scilit]
- Zhao, J.X.; Feng, H.Z.; Xu, T.R.; Xiao, J.F.; Guerrieri, R.; Liu, S.M.; Wu, X.C.; He, X.L.; He, X.P. Physiological and environmental control on ecosystem water use efficiency in response to drought across the northern hemisphere. Sci. Total Environ. 2021, 758, 143599. [Google Scholar] [CrossRef] [Scilit] [PubMed]
- Duveneck, M.J.; Thompson, J.R. Climate change imposes phenological trade-offs on forest net primary productivity. J. Geophys. Res. Biogeosci. 2017, 122, 2298–2313. [Google Scholar] [CrossRef] [Scilit]
- Wu, M.M.; Liang, Y.; Taubert, F.; Huth, A.; Zhang, M.; Wang, X.G. Sensitivity of forest composition and productivity to climate change in mixed broadleaved-Korean pine forest of Northeastern China. Ecol. Model. 2023, 483, 110434. [Google Scholar] [CrossRef] [Scilit]
- Saigusa, N.; Ichii, K.; Murakami, H.; Hirata, R.; Asanuma, J.; Den, H.; Han, S.J.; Ide, R.; Li, S.G.; Ohta, T.; et al. Impact of meteorological anomalies in the 2003 summer on Gross Primary Productivity in East Asia. Biogeosciences 2010, 7, 641–655. [Google Scholar] [CrossRef] [Scilit]
- Han, L.; Wang, Q.F.; Chen, Z.; Yu, G.R.; Zhou, G.S.; Chen, S.P.; Li, Y.N.; Zhang, Y.P.; Yan, J.H.; Wang, H.M.; et al. Spatial patterns and climate controls of seasonal variations in carbon fluxes in China’s terrestrial ecosystems. Glob. Planet. Change 2020, 189, 103175. [Google Scholar] [CrossRef] [Scilit]
- Hu, Z.M.; Piao, S.L.; Knapp, A.K.; Wang, X.H.; Peng, S.S.; Yuan, W.P.; Running, S.; Mao, J.F.; Shi, X.Y.; Ciais, P.; et al. Decoupling of greenness and gross primary productivity as aridity decreases. Remote Sens. Environ. 2022, 279, 113120. [Google Scholar] [CrossRef] [Scilit]
- Yue, T.X.; Wang, Y.F.; Du, Z.P.; Zhao, M.W.; Zhang, L.L.; Zhao, N.; Lu, M.; Larocque, G.R.; Wilson, J.P. Analysing the uncertainty of estimating forest carbon stocks in China. Biogeosciences 2016, 13, 3991–4004. [Google Scholar] [CrossRef] [Scilit]
- Chen, Y.Z.; Feng, X.M.; Tian, H.Q.; Wu, X.T.; Gao, Z.; Feng, Y.; Piao, S.L.; Lv, N.; Pan, N.Q.; Fu, B.J. Accelerated increase in vegetation carbon sequestration in China after 2010: A turning point resulting from climate and human interaction. Glob. Change Biol. 2021, 27, 5848–5864. [Google Scholar] [CrossRef] [Scilit] [PubMed]
- Chen, G.Q.; Dou, X.W.; Huang, L.; Liu, Z.H.; Liu, C.X.; Zhang, X.; Lei, X.D.; Zhu, G.Y.; Wu, S.; Li, Z.R. Structural dominance and environmental modulation of carbon sequestration potential in subtropical Chinese fir plantations. Ind. Crops Prod. 2026, 241, 122872. [Google Scholar] [CrossRef] [Scilit]
- Pi, Z.H.; Liu, X.Y.; Wei, Y.; Wang, X.; Zang, Z.; Song, X.Q. Spatiotemporal variation in carbon sequestration in the forest ecosystem of Hainan Island over a 30-year period and its driving factors. Ecol. Indic. 2026, 182, 114587. [Google Scholar] [CrossRef] [Scilit]
- Li, Y.Z.; Zhang, Y.; Lv, J. Interannual variations in GPP in forest ecosystems in Southwest China and regional differences in the climatic contributions. Ecol. Inform. 2022, 70, 101591. [Google Scholar] [CrossRef] [Scilit]
- Ji, Y.Y.; Zeng, S.D.; Liu, X.; Xia, J. Mutual inhibition effects of elevated CO2 and climate change on global forest GPP. Environ. Res. 2024, 252, 119145. [Google Scholar] [CrossRef] [Scilit] [PubMed]
- Zhu, X.J.; Yu, G.R.; Wang, Q.F.; Gao, Y.N.; He, H.L.; Zheng, H.; Chen, Z.; Shi, P.L.; Zhao, L.; Li, Y.N.; et al. Approaches of climate factors affecting the spatial variation of annual gross primary productivity among terrestrial ecosystems in China. Ecol. Indic. 2016, 62, 174–181. [Google Scholar] [CrossRef] [Scilit]
- Chen, N.; Song, C.C.; Xu, X.F.; Wang, X.W.; Cong, N.; Jiang, P.P.; Zu, J.X.; Sun, L.; Song, Y.Y.; Zuo, Y.J.; et al. Divergent impacts of atmospheric water demand on gross primary productivity in three typical ecosystems in China. Agric. For. Meteorol. 2021, 307, 108527. [Google Scholar] [CrossRef] [Scilit]
- Yuan, W.P.; Zheng, Y.; Piao, S.L.; Ciais, P.; Lombardozzi, D.; Wang, Y.P.; Ryu, Y.; Chen, G.X.; Dong, W.J.; Hu, Z.M.; et al. Increased atmospheric vapor pressure deficit reduces global vegetation growth. Sci. Adv. 2019, 5, eaax1396. [Google Scholar] [CrossRef] [Scilit] [PubMed]
- Xu, S.Q.; Gentine, P.; Li, L.C.; Wang, L.X.; Yu, Z.B.; Dong, N.P.; Ju, Q.; Zhang, Y.L. Response of Ecosystem Productivity to High Vapor Pressure Deficit and Low Soil Moisture: Lessons Learned From the Global Eddy-Covariance Observations. Earth’s Future 2023, 11, e2022EF003252. [Google Scholar] [CrossRef] [Scilit]
- Liu, Y.; Xiao, J.F.; Li, X.; Li, Y. Critical soil moisture detection and water-energy limit shift attribution using satellite-based water and carbon fluxes over China. Hydrol. Earth Syst. Sci. 2025, 29, 1241–1258. [Google Scholar] [CrossRef] [Scilit]
- Qin, Y.; Jiang, Q.X.; Zhao, Y.Z.; Wang, Z.L.; Tao, M.Y.; Li, B.H. Dynamic responses of gross primary productivity to compound hot extremes and drought across different geographical regions of China. Front. Plant Sci. 2026, 16, 1715432. [Google Scholar] [CrossRef] [Scilit] [PubMed]
- Liao, Z.Z.; Fei, X.H.; Zhou, B.H.; Zhu, J.Y.; Jia, H.Y.; Chen, W.D.; Chen, R.; Xu, P.; Li, W.J. Spatiotemporal variation and response of gross primary productivity to climate factors in forests in Qiannan state from 2000 to 2020. Front. For. Glob. Change 2024, 7, 1386762. [Google Scholar] [CrossRef] [Scilit]
- Friedl, M.A.; Sulla-Menashe, D.; Tan, B.; Schneider, A.; Ramankutty, N.; Sibley, A.; Huang, X.M. MODIS Collection 5 global land cover: Algorithm refinements and characterization of new datasets. Remote Sens. Environ. 2010, 114, 168–182. [Google Scholar] [CrossRef] [Scilit]
- Chen, J.; Xiang, L.G.; Gong, J.Y. Virtual globe-based integration and sharing service method of GeoSpatial Information. Sci. China-Earth Sci. 2013, 56, 1780–1790. [Google Scholar] [CrossRef] [Scilit]
- Gorelick, N.; Hancher, M.; Dixon, M.; Ilyushchenko, S.; Thau, D.; Moore, R. Google Earth Engine: Planetary-scale geospatial analysis for everyone. Remote Sens. Environ. 2017, 202, 18–27. [Google Scholar] [CrossRef] [Scilit]
- Fu, G.; Zhang, J.; Shen, Z.X.; Shi, P.L.; He, Y.T.; Zhang, X.Z. Validation of collection of 6 MODIS/Terra and MODIS/Aqua gross primary production in an alpine meadow of the Northern Tibetan Plateau. Int. J. Remote Sens. 2017, 38, 4517–4534. [Google Scholar] [CrossRef] [Scilit]
- He, M.Z.; Ju, W.M.; Zhou, Y.L.; Chen, J.M.; He, H.L.; Wang, S.Q.; Wang, H.M.; Guan, D.X.; Yan, J.H.; Li, Y.N.; et al. Development of a two-leaf light use efficiency model for improving the calculation of terrestrial gross primary productivity. Agric. For. Meteorol. 2013, 173, 28–39. [Google Scholar] [CrossRef] [Scilit]
- Muñoz-Sabater, J.; Dutra, E.; Agustí-Panareda, A.; Albergel, C.; Arduini, G.; Balsamo, G.; Boussetta, S.; Choulga, M.; Harrigan, S.; Hersbach, H.; et al. ERA5-Land: A state-of-the-art global reanalysis dataset for land applications. Earth Syst. Sci. Data 2021, 13, 4349–4383. [Google Scholar] [CrossRef] [Scilit]
- Zhao, P.; He, Z.B. A First Evaluation of ERA5-Land Reanalysis Temperature Product Over the Chinese Qilian Mountains. Front. Earth Sci. 2022, 10, 907730. [Google Scholar] [CrossRef] [Scilit]
- Qian, L.H.; Zhao, P. Assessment of ERA5-Land Reanalysis Precipitation Data in the Qilian Mountains of China. Atmosphere 2025, 16, 826. [Google Scholar] [CrossRef] [Scilit]
- Zhang, L.; Yan, Z.Y.; Huang, K.D.; Zhang, W. Evaluation and statistical bias correction of ERA5-Land meteorological variables for a humid river basin in Southwest China. Sci. Rep. 2025, 15, 41101. [Google Scholar] [CrossRef] [Scilit] [PubMed]
- Li, Y.Z.; Qin, X.; Liu, Y.S.; Jin, Z.Z.; Liu, J.; Wang, L.H.; Chen, J.Z. Evaluation of Long-Term and High-Resolution Gridded Precipitation and Temperature Products in the Qilian Mountains, Qinghai-Tibet Plateau. Front. Environ. Sci. 2022, 10, 906821. [Google Scholar] [CrossRef] [Scilit]
- He, Q.; Williams, A.P.; Johnston, M.R.; Juang, C.S.; Wang, B.W. Influence of Time-Averaging of Climate Data on Estimates of Atmospheric Vapor Pressure Deficit and Inferred Relationships With Wildfire Area in the Western United States. Geophys. Res. Lett. 2025, 52, e2024GL113708. [Google Scholar] [CrossRef] [Scilit]
- Chen, S.S.; Xiao, J.F.; Li, X.; Wu, M.C.; Yang, J. Disentangling the climate-VPD-GPP Nexus: Global patterns and underlying drivers. Glob. Planet. Change 2026, 256, 105141. [Google Scholar] [CrossRef] [Scilit]
- He, J.; Yang, M.M.; Liu, J.E.; Chen, J.M.; Xie, X.Y. Impacts of vegetation greening and climate change on trend and interannual variability in vegetation productivity in the Wuyi Mountain region. Geo-Spat. Inf. Sci. 2025, 28, 224–245. [Google Scholar] [CrossRef] [Scilit]
- Pau, S.; Detto, M.; Kim, Y.; Still, C.J. Tropical forest temperature thresholds for gross primary productivity. Ecosphere 2018, 9, e02311. [Google Scholar] [CrossRef] [Scilit]
- Rabus, B.; Eineder, M.; Roth, A.; Bamler, R. The shuttle radar topography mission—A new class of digital elevation models acquired by spaceborne radar. ISPRS J. Photogramm. Remote Sens. 2003, 57, 241–262. [Google Scholar] [CrossRef] [Scilit]
- Brown, C.G., Jr.; Sarabandi, K.; Pierce, L.E. Validation of the shuttle radar topography mission height data. IEEE Trans. Geosci. Remote Sens. 2005, 43, 1707–1715. [Google Scholar] [CrossRef]
- Fu, Z.; Ciais, P.; Prentice, I.C.; Gentine, P.; Makowski, D.; Bastos, A.; Luo, X.Z.; Green, J.K.; Stoy, P.C.; Yang, H.; et al. Atmospheric dryness reduces photosynthesis along a large range of soil water deficits. Nat. Commun. 2022, 13, 2089. [Google Scholar] [CrossRef] [Scilit] [PubMed]
- Wang, H.; Yan, S.J.; Ciais, P.; Wigneron, J.P.; Liu, L.B.; Li, Y.; Fu, Z.; Ma, H.L.; Liang, Z.; Wei, F.L.; et al. Exploring complex water stress-gross primary production relationships: Impact of climatic drivers, main effects, and interactive effects. Glob. Change Biol. 2022, 28, 4110–4123. [Google Scholar] [CrossRef] [Scilit] [PubMed]
- Guo, W.W.; Huang, S.Z.; Huang, Q.; Leng, G.Y.; Mu, Z.X.; Han, Z.M.; Wei, X.T.; She, D.X.; Wang, H.Y.; Wang, Z.X.; et al. Drought trigger thresholds for different levels of vegetation loss in China and their dynamics. Agric. For. Meteorol. 2023, 331, 109349. [Google Scholar] [CrossRef] [Scilit]
- Yao, Y.T.; Wang, X.H.; Li, Y.; Wang, T.; Shen, M.G.; Du, M.Y.; He, H.L.; Li, Y.N.; Luo, W.J.; Ma, M.G.; et al. Spatiotemporal pattern of gross primary productivity and its covariation with climate in China over the last thirty years. Glob. Change Biol. 2018, 24, 184–196. [Google Scholar] [CrossRef] [Scilit] [PubMed]
- Xiao, J.F.; Sun, G.; Chen, J.Q.; Chen, H.; Chen, S.P.; Dong, G.; Gao, S.H.; Guo, H.Q.; Guo, J.X.; Han, S.J.; et al. Carbon fluxes, evapotranspiration, and water use efficiency of terrestrial ecosystems in China. Agric. For. Meteorol. 2013, 182, 76–90. [Google Scholar] [CrossRef] [Scilit]
- Lin, Y.; Chen, Z.; Yu, G.R.; Yang, M.; Hao, T.X.; Zhu, X.J.; Zhang, W.K.; Han, L.; Liu, Z.G.; Ma, L.X.; et al. Spatial patterns of light response parameters and their regulation on gross primary productivity in China. Agric. For. Meteorol. 2024, 345, 109833. [Google Scholar] [CrossRef] [Scilit]
- Ge, Z.X.; Qu, Y.D.; Teng, H.Q.; Tang, B.H. Uncertainty Analysis of Gross Primary Production (GPP) Remote-Sensing Products and Its Influencing Factors in Southwest China. Remote Sens. 2026, 18, 764. [Google Scholar] [CrossRef] [Scilit]
- Hu, L.; Fan, W.J.; Yuan, W.P.; Ren, H.Z.; Cui, Y.K. Spatiotemporal Variation of Vegetation Productivity and Its Feedback to Climate Change in Northeast China over the Last 30 Years. Remote Sens. 2021, 13, 951. [Google Scholar] [CrossRef] [Scilit]
- Dang, C.Y.; Shao, Z.F.; Huang, X.; Zhuang, Q.W.; Cheng, G.; Qian, J.X. Climate warming-induced phenology changes dominate vegetation productivity in Northern Hemisphere ecosystems. Ecol. Indic. 2023, 151, 110326. [Google Scholar] [CrossRef] [Scilit]
- Wang, L.J.; Li, P.; Peng, Y.; Ren, P.X.; Chen, Y.Z.; Zhou, X.L.; Yang, Z.C.; Zou, Z.Y.; Peng, C.H. The Widely Increasing Sensitivity of Vegetation Productivity to Phenology in Northern Middle and High Latitudes. Geophys. Res. Lett. 2023, 50, e2022GL102283. [Google Scholar] [CrossRef] [Scilit]
- Fang, J.; Shugart, H.H.; Wang, L.B.; Lutz, J.A.; Yan, X.D.; Liu, F. Optimal representation of spring phenology on photosynthetic productivity across the northern hemisphere forests. Agric. For. Meteorol. 2024, 350, 109975. [Google Scholar] [CrossRef] [Scilit]
- Liang, J.Z.; Fan, L.P.; Zhou, Y.K.; Li, W.F. Spatiotemporal Patterns and Climate Attributions of Seasonal Stability of Vegetation Growth in Northern China. Remote Sens. 2026, 18, 773. [Google Scholar] [CrossRef] [Scilit]
- Walther, S.; Voigt, M.; Thum, T.; Gonsamo, A.; Zhang, Y.G.; Köhler, P.; Jung, M.; Varlagin, A.; Guanter, L. Satellite chlorophyll fluorescence measurements reveal large-scale decoupling of photosynthesis and greenness dynamics in boreal evergreen forests. Glob. Change Biol. 2016, 22, 2979–2990. [Google Scholar] [CrossRef] [Scilit] [PubMed]
- Zheng, P.P.; Henderson, M.; Liu, B.H.; Chen, M.Y.; Deng, K.X.; Gu, R.T.; Gong, X.J. Moisture legacy effects shape vegetation productivity across East Asia ecosystems, 2001–2020. Front. Plant Sci. 2025, 16, 1649987. [Google Scholar] [CrossRef] [Scilit] [PubMed]
- Jin, J.X.; Guo, F.S.; Sippel, S.; Zhu, Q.S.; Wang, W.F.; Gu, B.J.; Wang, Y. Concurrent and lagged effects of spring greening on seasonal carbon gain and water loss across the Northern Hemisphere. Int. J. Biometeorol. 2023, 67, 1331–1344. [Google Scholar] [CrossRef] [Scilit] [PubMed]
- Yan, W.; Wang, H.S.; Jiang, C.; Sun, O.J.; Chu, J.M.; Zhang, A.Z. Afforestation boosted gross primary productivity of China: Evidence from remote sensing. J. For. Res. 2025, 36, 40. [Google Scholar] [CrossRef] [Scilit]
- Liu, Y.X.Y.; Wang, Y.; Yang, Y.P.; Jiang, H.; Jing, W.L. Impacts of hydrometeorological controls on vegetation productivity: Evidence from satellite observations and reanalysis. Ecol. Indic. 2024, 161, 111952. [Google Scholar] [CrossRef] [Scilit]
- Chen, S.Y.; Zhang, Y.L.; Wu, Q.L.; Liu, S.H.; Song, C.H.; Xiao, J.F.; Band, L.E.; Vose, J.M. Vegetation structural change and CO2 fertilization more than offset gross primary production decline caused by reduced solar radiation in China. Agric. For. Meteorol. 2021, 296, 108227. [Google Scholar] [CrossRef] [Scilit]
- Hu, L.; Fan, W.J.; Ren, H.Z.; Liu, S.H.; Cui, Y.K.; Zhao, P. Spatiotemporal Dynamics in Vegetation GPP over the Great Khingan Mountains Using GLASS Products from 1982 to 2015. Remote Sens. 2018, 10, 488. [Google Scholar] [CrossRef] [Scilit]
- Wang, M.M.; Zhao, J.; Wang, S.Q.; Chen, B.; Li, Z.P. Detection and attribution of positive net ecosystem productivity extremes in China’s terrestrial ecosystems during 2000–2016. Ecol. Indic. 2021, 132, 108316. [Google Scholar] [CrossRef] [Scilit]
- Shi, C.Y.; Zhou, Y.K.; Cui, N.; Niu, L.J.; Yao, H.J. Divergent responses of vegetation productivity to soil moisture and vapor pressure deficit across China: Spatiotemporal patterns and climatic attribution. J. Geogr. Sci. 2025, 35, 1405–1431. [Google Scholar] [CrossRef] [Scilit]
- Zhao, W.R.; Jin, J.L.; Bao, Z.X.; Wu, J.R.; Zhang, Q.X.; Yu, C.; Wang, G.Q. Direct and indirect effects of climatic factors on ecosystem carbon and water fluxes and water use efficiency across different climatic zones in China. Ecol. Indic. 2025, 175, 113565. [Google Scholar] [CrossRef] [Scilit]
- Sun, S.B.; Du, W.L.; Song, Z.L.; Zhang, D.B.; Wu, X.C.; Chen, B.Z.; Wu, Y.T. Response of Gross Primary Productivity to Drought Time-Scales Across China. J. Geophys. Res.-Biogeosci. 2021, 126, e2020JG005953. [Google Scholar] [CrossRef] [Scilit]
- Xu, P.P.; Cao, Y.C.; Fang, W.; He, W.; Wang, Z.; Yang, H.; Song, L.S. High water demand limits carbon sink and transpiration in tall forests during extreme drought in Southwest China. Agric. For. Meteorol. 2025, 369, 110444. [Google Scholar] [CrossRef] [Scilit]
- Li, Y.Z.; Zhuang, Q.W.; Zhao, H.F.; Zhang, W.Q.; Cai, P.; Zhang, Y.; Lv, J. Evaluation of the resistance and resilience of terrestrial ecosystems to drought in southwest China. J. Hydrol. 2025, 646, 132101. [Google Scholar] [CrossRef] [Scilit]
- Wang, L.; Yue, Y.M.; Shi, L.; Wang, W.Y.; Cui, J.W.; Li, Q.; Liang, B.Y.; Xu, C.Y.; Liu, H.Y.; Brandt, M.; et al. Human disturbance intensity reduces drought resistance without prolonging recovery in karst forests of southwest China. GISci. Remote Sens. 2026, 63, 2610841. [Google Scholar] [CrossRef] [Scilit]
- Liu, Y.; Ding, Z.; Chen, Y.A.; Yan, F.Q.; Yu, P.J.; Man, W.D.; Liu, M.Y.; Li, H.; Tang, X.G. Restored vegetation is more resistant to extreme drought events than natural vegetation in Southwest China. Sci. Total Environ. 2023, 866, 161353. [Google Scholar] [CrossRef] [Scilit] [PubMed]
- Zhao, W.T.; Wang, H.S.; Ding, P.R. Energy drives, atmospheric dryness modulates: Multi-timescale climatic control of gross primary productivity in an old-growth Korean pine forest. Int. J. Biometeorol. 2026, 70, 90. [Google Scholar] [CrossRef] [Scilit] [PubMed]
- Yi, K.; Li, R.; Scanlon, T.M.; Lerdau, M.T.; Berry, J.A.; Yang, X. Impact of atmospheric dryness on solar-induced chlorophyll fluorescence: Tower-based observations at a temperate forest. Remote Sens. Environ. 2024, 306, 114106. [Google Scholar] [CrossRef] [Scilit]
- Zhao, H.X.; Zhou, Z.Y.; Zhang, F.; Bourque, C.P.A.; Jia, X.; Li, X.H.; Liu, P.; Yu, H.Q.; Tian, Y.; Jin, C.; et al. Sensitivity of gross primary production and evapotranspiration to heat and drought stress in a young temperate plantation in northern China. For. Ecosyst. 2025, 12, 100248. [Google Scholar] [CrossRef] [Scilit]
- Wang, W.J.; Song, H.Q.; Xia, H.M.; Wang, D.; Wang, Q.F. Gross primary productivity is more sensitive to droughts than to heatwaves in China. Clim. Dyn. 2025, 63, 369. [Google Scholar] [CrossRef] [Scilit]
- Zhang, Y.Y.; Jiang, F.; Zhou, Y.L.; Dong, G.Y.; Wu, D.Q.; He, W.; Wang, J.; Wu, M.S.; Wang, H.M.; Zhang, L.Y.; et al. Warm and wet spring compensated for the reduction in carbon sinks due to an extreme summer heatwave-drought event in 2022 in southern China. Agric. For. Meteorol. 2026, 379, 111060. [Google Scholar] [CrossRef] [Scilit]
- Zhang, R.Q.; Xiong, Q.; Wu, L.; Wang, P.; Kong, J.Y.; Shi, X.; Sun, Z.Y. Water supply following drought: Effects on drought legacy and resilience in a tropical forest—A case study in Xishuangbanna, China. Ecol. Inform. 2024, 79, 102422. [Google Scholar] [CrossRef] [Scilit]
- Wang, Z.K.; Chen, W.; Piao, J.L.; Cai, Q.Y.; Chen, S.F.; Xue, X.; Ma, T.J. Synergistic effects of high atmospheric and soil dryness on record-breaking decreases in vegetation productivity over Southwest China in 2023. npj Clim. Atmos. Sci. 2025, 8, 6. [Google Scholar] [CrossRef] [Scilit]
- Liu, H.Y.; Ding, Q.; Li, Y.C.; Fan, L.; Zhao, L.; Ma, M.G. Improved Biome-BGC model for simulating spatiotemporal dynamics of gross primary productivity in evergreen broadleaf forests of the karst region. Environ. Model. Softw. 2025, 184, 106563. [Google Scholar] [CrossRef] [Scilit]
- Wang, Y.; She, X.J.; Zhu, C.J.; Chen, J.Z.X.; Kong, D.B.; Shi, W.Y.; Guan, X.B.; Xie, Q.Y.; Gao, X.J.; Li, W.; et al. Unveiling the accuracy of global GPP products in data-scarce mountain ecosystems of Southwest China. Int. J. Appl. Earth Obs. Geoinf. 2025, 144, 104908. [Google Scholar] [CrossRef] [Scilit]
- Xiao, L.Y.; Wu, X.Q.; Guo, C.Q.; Lu, Z.C.; Khan, M.A.; Zheng, C.H.; Zhou, J.X. Thriving amidst adversity: Responses of karst vegetation to extreme compound droughts. Agric. For. Meteorol. 2025, 369, 110444. [Google Scholar] [CrossRef] [Scilit]
- Sun, X.Y.; Zhang, X.Y.; Wang, G.X.; Hu, Z.Y.; Song, C.L.; Lin, S.; Sun, J.Y.; Sun, S.Q. An Increasing Effect of Soil Moisture on Semiempirical Water-Use Efficiency Models From Wet to Dry Climate Regions. J. Geophys. Res. Biogeosci. 2023, 128, e2022JG007270. [Google Scholar] [CrossRef] [Scilit]
- Fu, Z.; Ciais, P.; Makowski, D.; Bastos, A.; Stoy, P.C.; Ibrom, A.; Knohl, A.; Migliavacca, M.; Cuntz, M.; Sigut, L.; et al. Uncovering the critical soil moisture thresholds of plant water stress for European ecosystems. Glob. Change Biol. 2022, 28, 2111–2123. [Google Scholar] [CrossRef] [Scilit] [PubMed]
- Cheng, Y.M.; Liu, L.; Cheng, L.; Fa, K.; Liu, X.C.; Huo, Z.L.; Huang, G.H. A shift in the dominant role of atmospheric vapor pressure deficit and soil moisture on vegetation greening in China. J. Hydrol. 2022, 615, 128680. [Google Scholar] [CrossRef] [Scilit]
- Qi, G.Z.; She, D.X.; Xia, J.; Song, J.X.; Jiao, W.Z.; Li, J.Y.; Liu, Z.Q. Soil moisture plays an increasingly important role in constraining vegetation productivity in China over the past two decades. Agric. For. Meteorol. 2024, 356, 110193. [Google Scholar] [CrossRef] [Scilit]
- Liu, J.G.; Wang, Q.R.; Zhan, W.W.; Lian, X.; Gentine, P. When and where soil dryness matters to ecosystem photosynthesis. Nat. Plants 2025, 11, 1390–1400. [Google Scholar] [CrossRef] [Scilit] [PubMed]
- Javadian, M.; Scott, R.L.; Woodgate, W.; Richardson, A.D.; Dannenberg, M.P.; Smith, W.K. Canopy temperature dynamics are closely aligned with ecosystem water availability across a water- to energy-limited gradient. Agric. For. Meteorol. 2024, 357, 110206. [Google Scholar] [CrossRef] [Scilit]
- Chen, T.Q.; Li, H.; Huang, J.J. Drivers and thresholds of carbon and water flux dynamics in a semi-humid urban forest ecosystem. Agric. For. Meteorol. 2026, 378, 110933. [Google Scholar] [CrossRef] [Scilit]
- Xu, S.; McDowell, N.G.; McVicar, T.R.; Miralles, D.G.; Sitch, S.; Sanchez-Martinez, P.; Fisher, J.B.; Friedlingstein, P.; Beck, H.E.; McCabe, M.F. Warming climate amplifies vapor pressure deficit limits on gross primary productivity. Nat. Commun. 2026. [Google Scholar] [CrossRef] [Scilit] [PubMed]
- Huang, C.; Huang, J.F.; Xiao, J.F.; Li, X.; He, H.S.; Liang, Y.; Chen, F.S.; Tian, H.Q. Global convergence in terrestrial gross primary production response to atmospheric vapor pressure deficit. Sci. China Life Sci. 2024, 67, 2016–2025. [Google Scholar] [CrossRef] [Scilit] [PubMed]
- Wang, Y.; Tong, X.J.; Zhang, J.S.; Li, J.; Meng, P.; Wang, W.F.; Wang, Y.T.; Yang, M.X.; Liu, Q.Y. Hydrothermal integration and synergy regulate carbon exchange in forest ecosystems of eastern China. Agric. For. Meteorol. 2026, 377, 110888. [Google Scholar] [CrossRef] [Scilit]
- Kong, L.L.; Jian, S.Q.; Wang, J.Y. Sensitivity of Vegetation Carbon Sink Potential to Climate Change in China. Earth Syst. Environ. 2026. [Google Scholar] [CrossRef] [Scilit]
- Yu, X.J.; Zhang, L.X.; Zhou, T.J.; Zheng, J.H.; Guan, J.Y. Higher atmospheric aridity-dominated drought stress contributes to aggravating dryland productivity loss under global warming. Weather Clim. Extrem. 2024, 44, 100692. [Google Scholar] [CrossRef] [Scilit]
- Chen, W.J.; Zhang, W.R.; Zhu, Q.L.; Guo, X.W.; Zhang, J.L.; Jin, C. Contrasting Effects of Hydrothermal Drivers on Gross Primary Productivity and Ecosystem Respiration. Forests 2026, 17, 205. [Google Scholar] [CrossRef] [Scilit]
- Yang, H.; Tang, J.; Chang, X.Q.; Wang, J.Q.; Gong, W.S.; Wang, D.J.; Xing, Y.Q. Permafrost degradation: A critical driver of aboveground carbon sink loss in China’s boreal forests. Catena 2026, 255, 109912. [Google Scholar] [CrossRef] [Scilit]
- Cao, Y.W.; Xu, Z.H.; Yang, Y.Y.; Zhang, C.F.; Qin, N. From site to region: Performance evaluation of remote sensing-derived GPP products across China. Adv. Space Res. 2026, 77, 6811–6831. [Google Scholar] [CrossRef] [Scilit]
- Zhang, J.R.; Xiao, J.F.; Tong, X.J.; Zhang, J.S.; Meng, P.; Li, J.; Liu, P.R.; Yu, P.Y. NIRv and SIF better estimate phenology than NDVI and EVI: Effects of spring and autumn phenology on ecosystem production of planted forests. Agric. For. Meteorol. 2022, 315, 108819. [Google Scholar] [CrossRef] [Scilit]
- Wu, J.B.; Xiao, X.M.; Guan, D.X.; Shi, T.T.; Jin, C.J.; Han, S.J. Estimation of the gross primary production of an old-growth temperate mixed forest using eddy covariance and remote sensing. Int. J. Remote Sens. 2009, 30, 463–479. [Google Scholar] [CrossRef] [Scilit]
- Hu, Y.H.; Jia, W.Q.; Wang, J.; Wang, L.H.; Li, Y.J. Spatiotemporal Dynamics and Driving Factors of Vegetation Gross Primary Productivity in a Typical Coastal City: A Case Study of Zhanjiang, China. Remote Sens. 2025, 18, 89. [Google Scholar] [CrossRef] [Scilit]
- Reyes-Muñoz, P.; Kovács, D.; Verrelst, J. Tower-to-global upscaling of terrestrial carbon fluxes driven by MODIS-LAI, Sentinel-3-LAI and ERA5-Land data. Ecol. Indic. 2025, 177, 113597. [Google Scholar] [CrossRef] [Scilit] [PubMed]
- Xu, J.H.; Chen, T.X.; Chen, X.; Zhou, S.J.; Gu, Z.; Li, W.H.; Cui, Y.Y.; Wang, S.Z.; Liu, S.C. Estimating GPP in China using different site-level datasets, vegetation classification and vegetation indices. Ecol. Process. 2025, 14, 65. [Google Scholar] [CrossRef] [Scilit]
- Zhai, L.L.; Zan, M.; Zhou, J.; Zhao, Z.Q.; Ke, J.; Ye, M.; Yuan, R.L.; Zhao, Y.T. Driving mechanisms of forest age and climate on carbon sinks in Xinjiang forests. Front. Plant Sci. 2026, 17, 1775711. [Google Scholar] [CrossRef] [Scilit] [PubMed]
- Chen, H.G.; Wang, M.L.; Meng, F.H.; Sa, C.; Luo, M.; Chi, W.F.; Chonokhuu, S. Threshold Dynamics of Vegetation Carbon Sink Loss Under Multiscale Droughts in the Mongolian Plateau. Atmosphere 2025, 16, 964. [Google Scholar] [CrossRef] [Scilit]
- Amir, M.; Chen, B.; Chen, J.H.; Wang, S.Q.; Zhu, K.; Chen, S.L.; Xia, Y. Exploring the Significance of Chlorophyll Fluorescence-Based Photosynthetic Capacity in Gross Primary Productivity Simulations Across Diverse Ecosystems in China. J. Geophys. Res. Biogeosci. 2025, 130, e2023JG007889. [Google Scholar] [CrossRef] [Scilit]
- Liu, G.H.; Wang, Y.S.; Chen, Y.A.; Tong, X.Q.; Wang, Y.D.; Xie, J.; Tang, X.G. Remotely Monitoring Vegetation Productivity in Two Contrasting Subtropical Forest Ecosystems Using Solar-Induced Chlorophyll Fluorescence. Remote Sens. 2022, 14, 1328. [Google Scholar] [CrossRef] [Scilit]
- Cao, Y.; Zhong, D.Y.; Shang, R.; Ke, Q.H.; Zhang, M.X.; Xie, D.; Liu, S.T.; Zhao, C.S.; Wei, R.D.F. Afforestation as a mitigation strategy: Countering climate-induced risk of forest carbon sink in China. Carbon Balance Manag. 2025, 20, 18. [Google Scholar] [CrossRef] [Scilit] [PubMed]
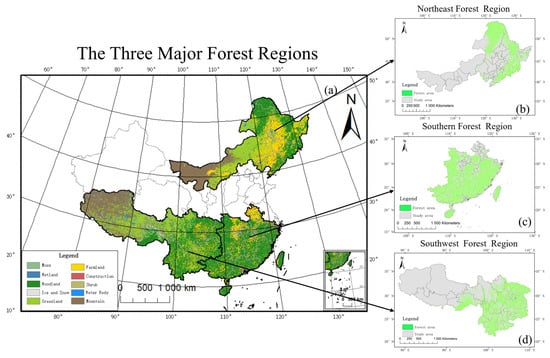
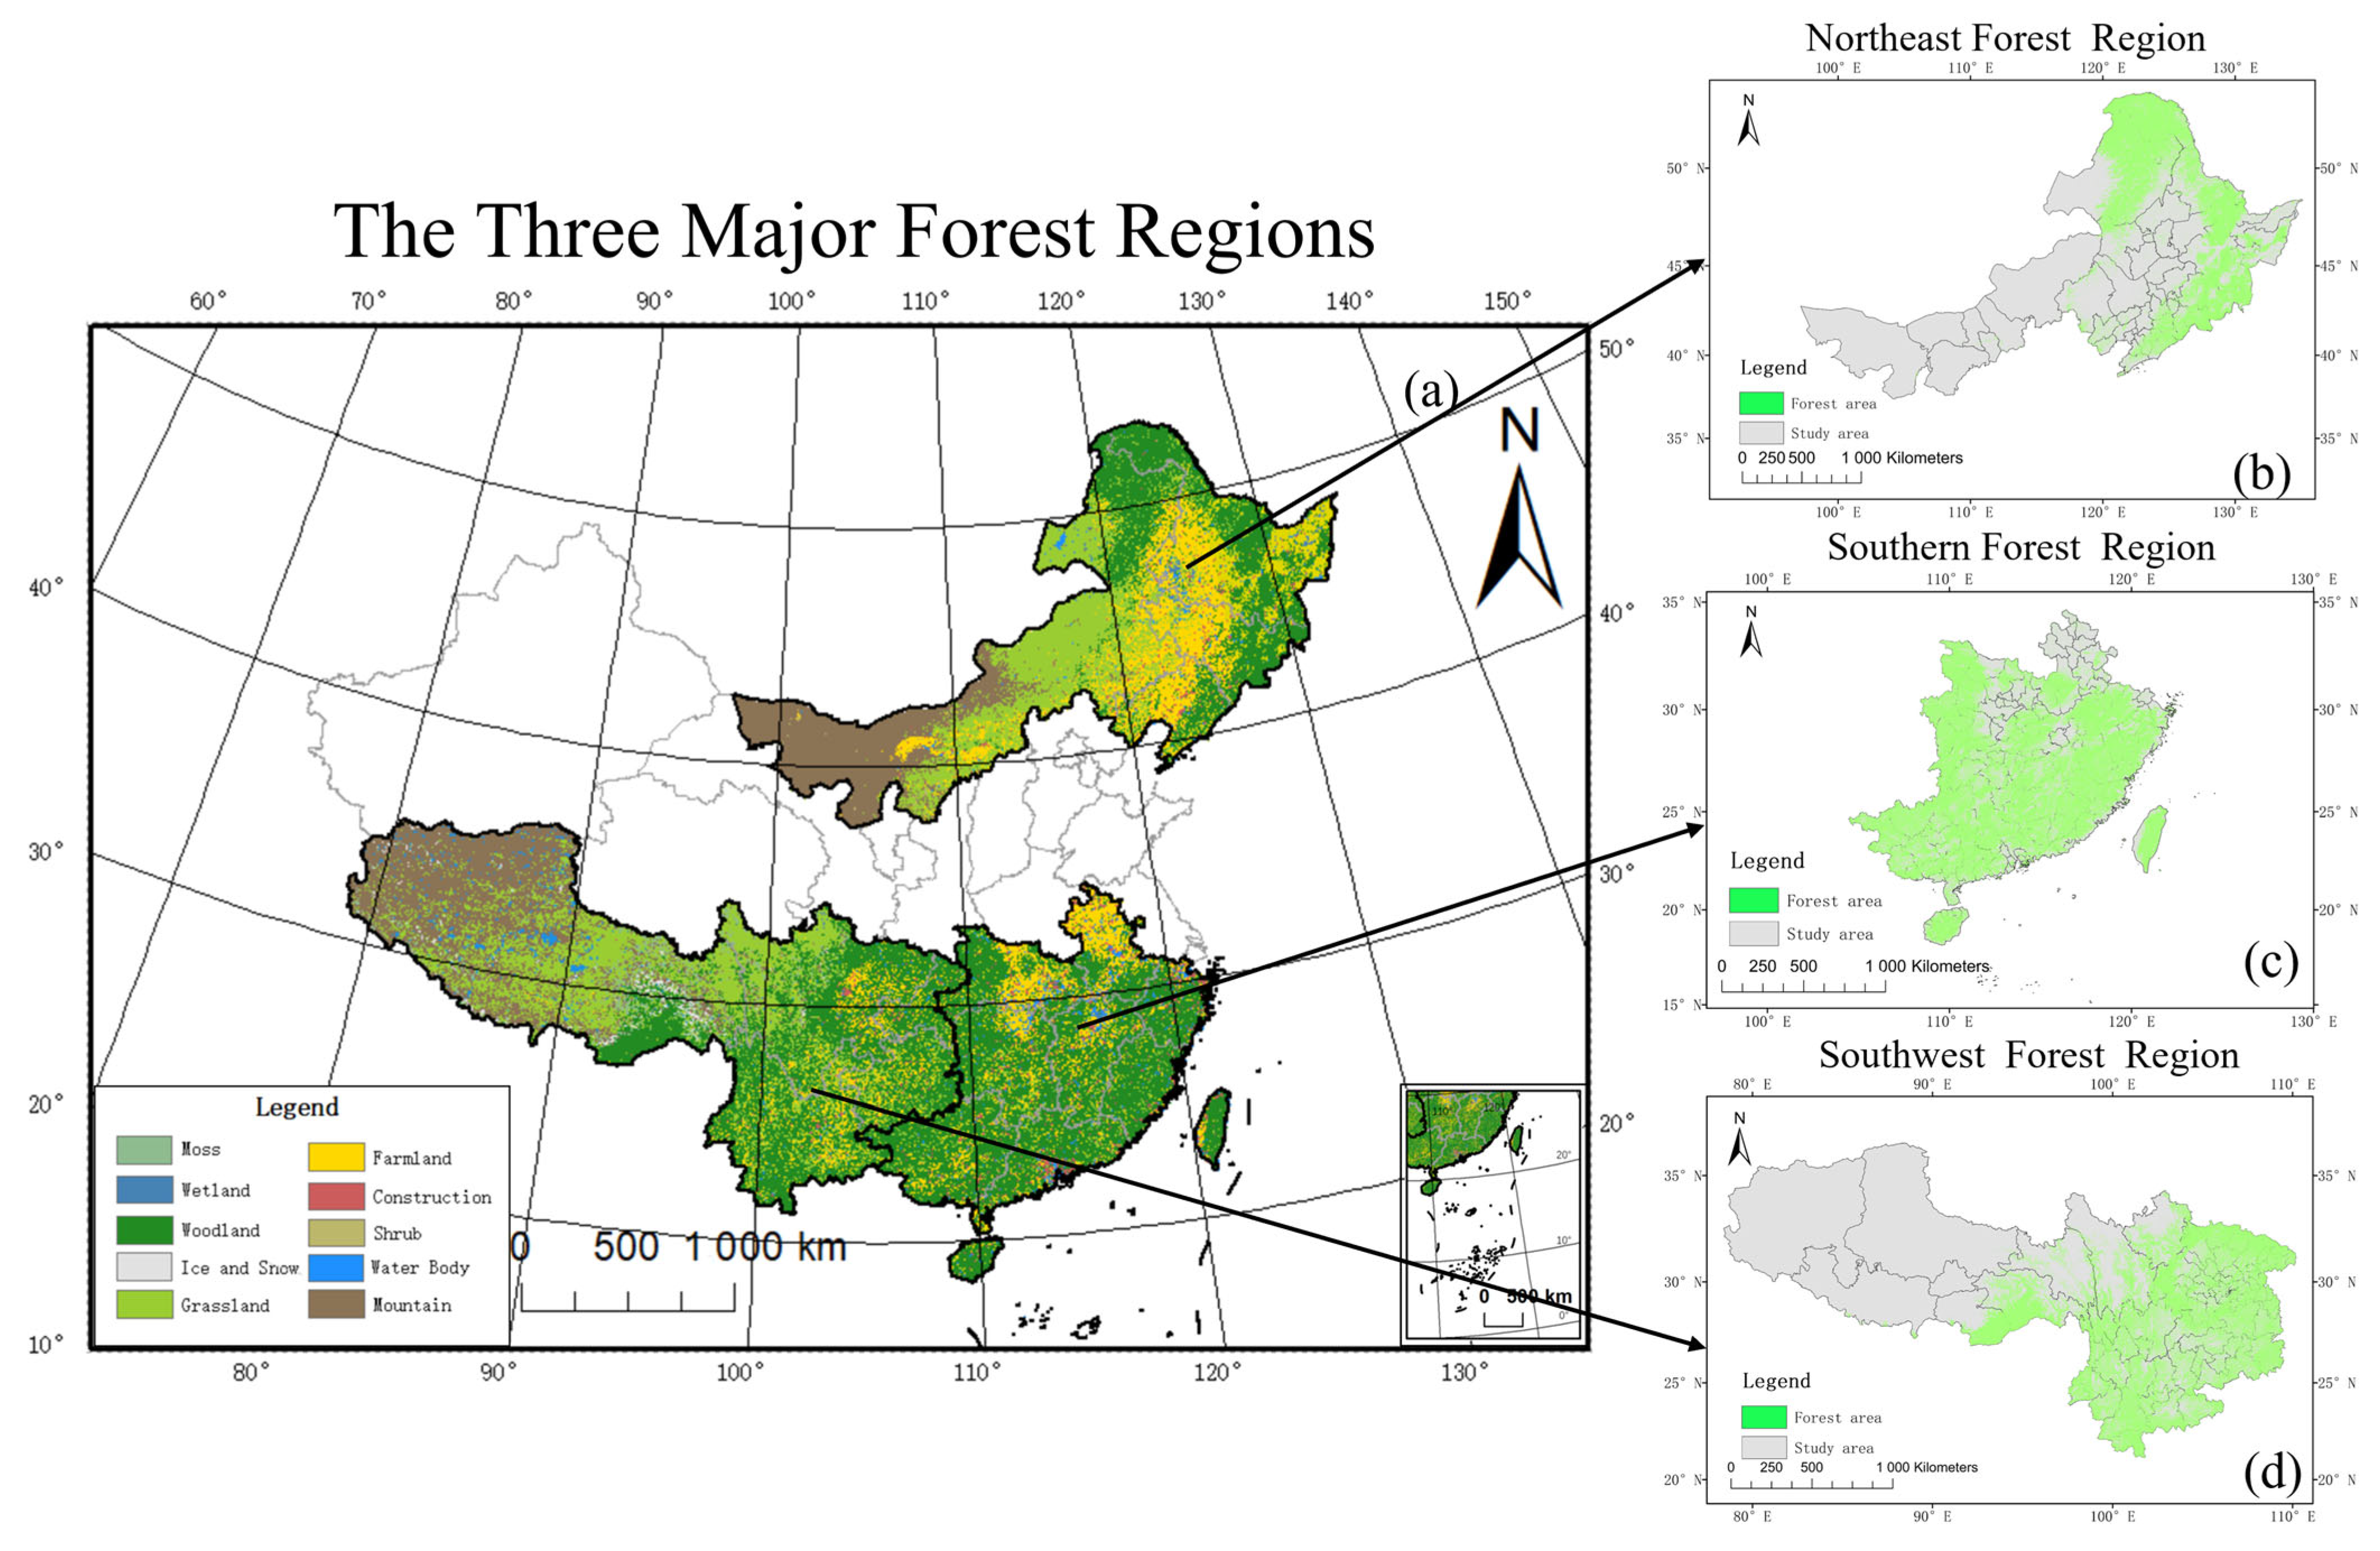
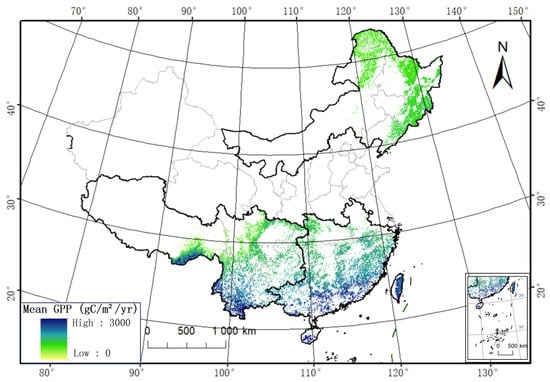
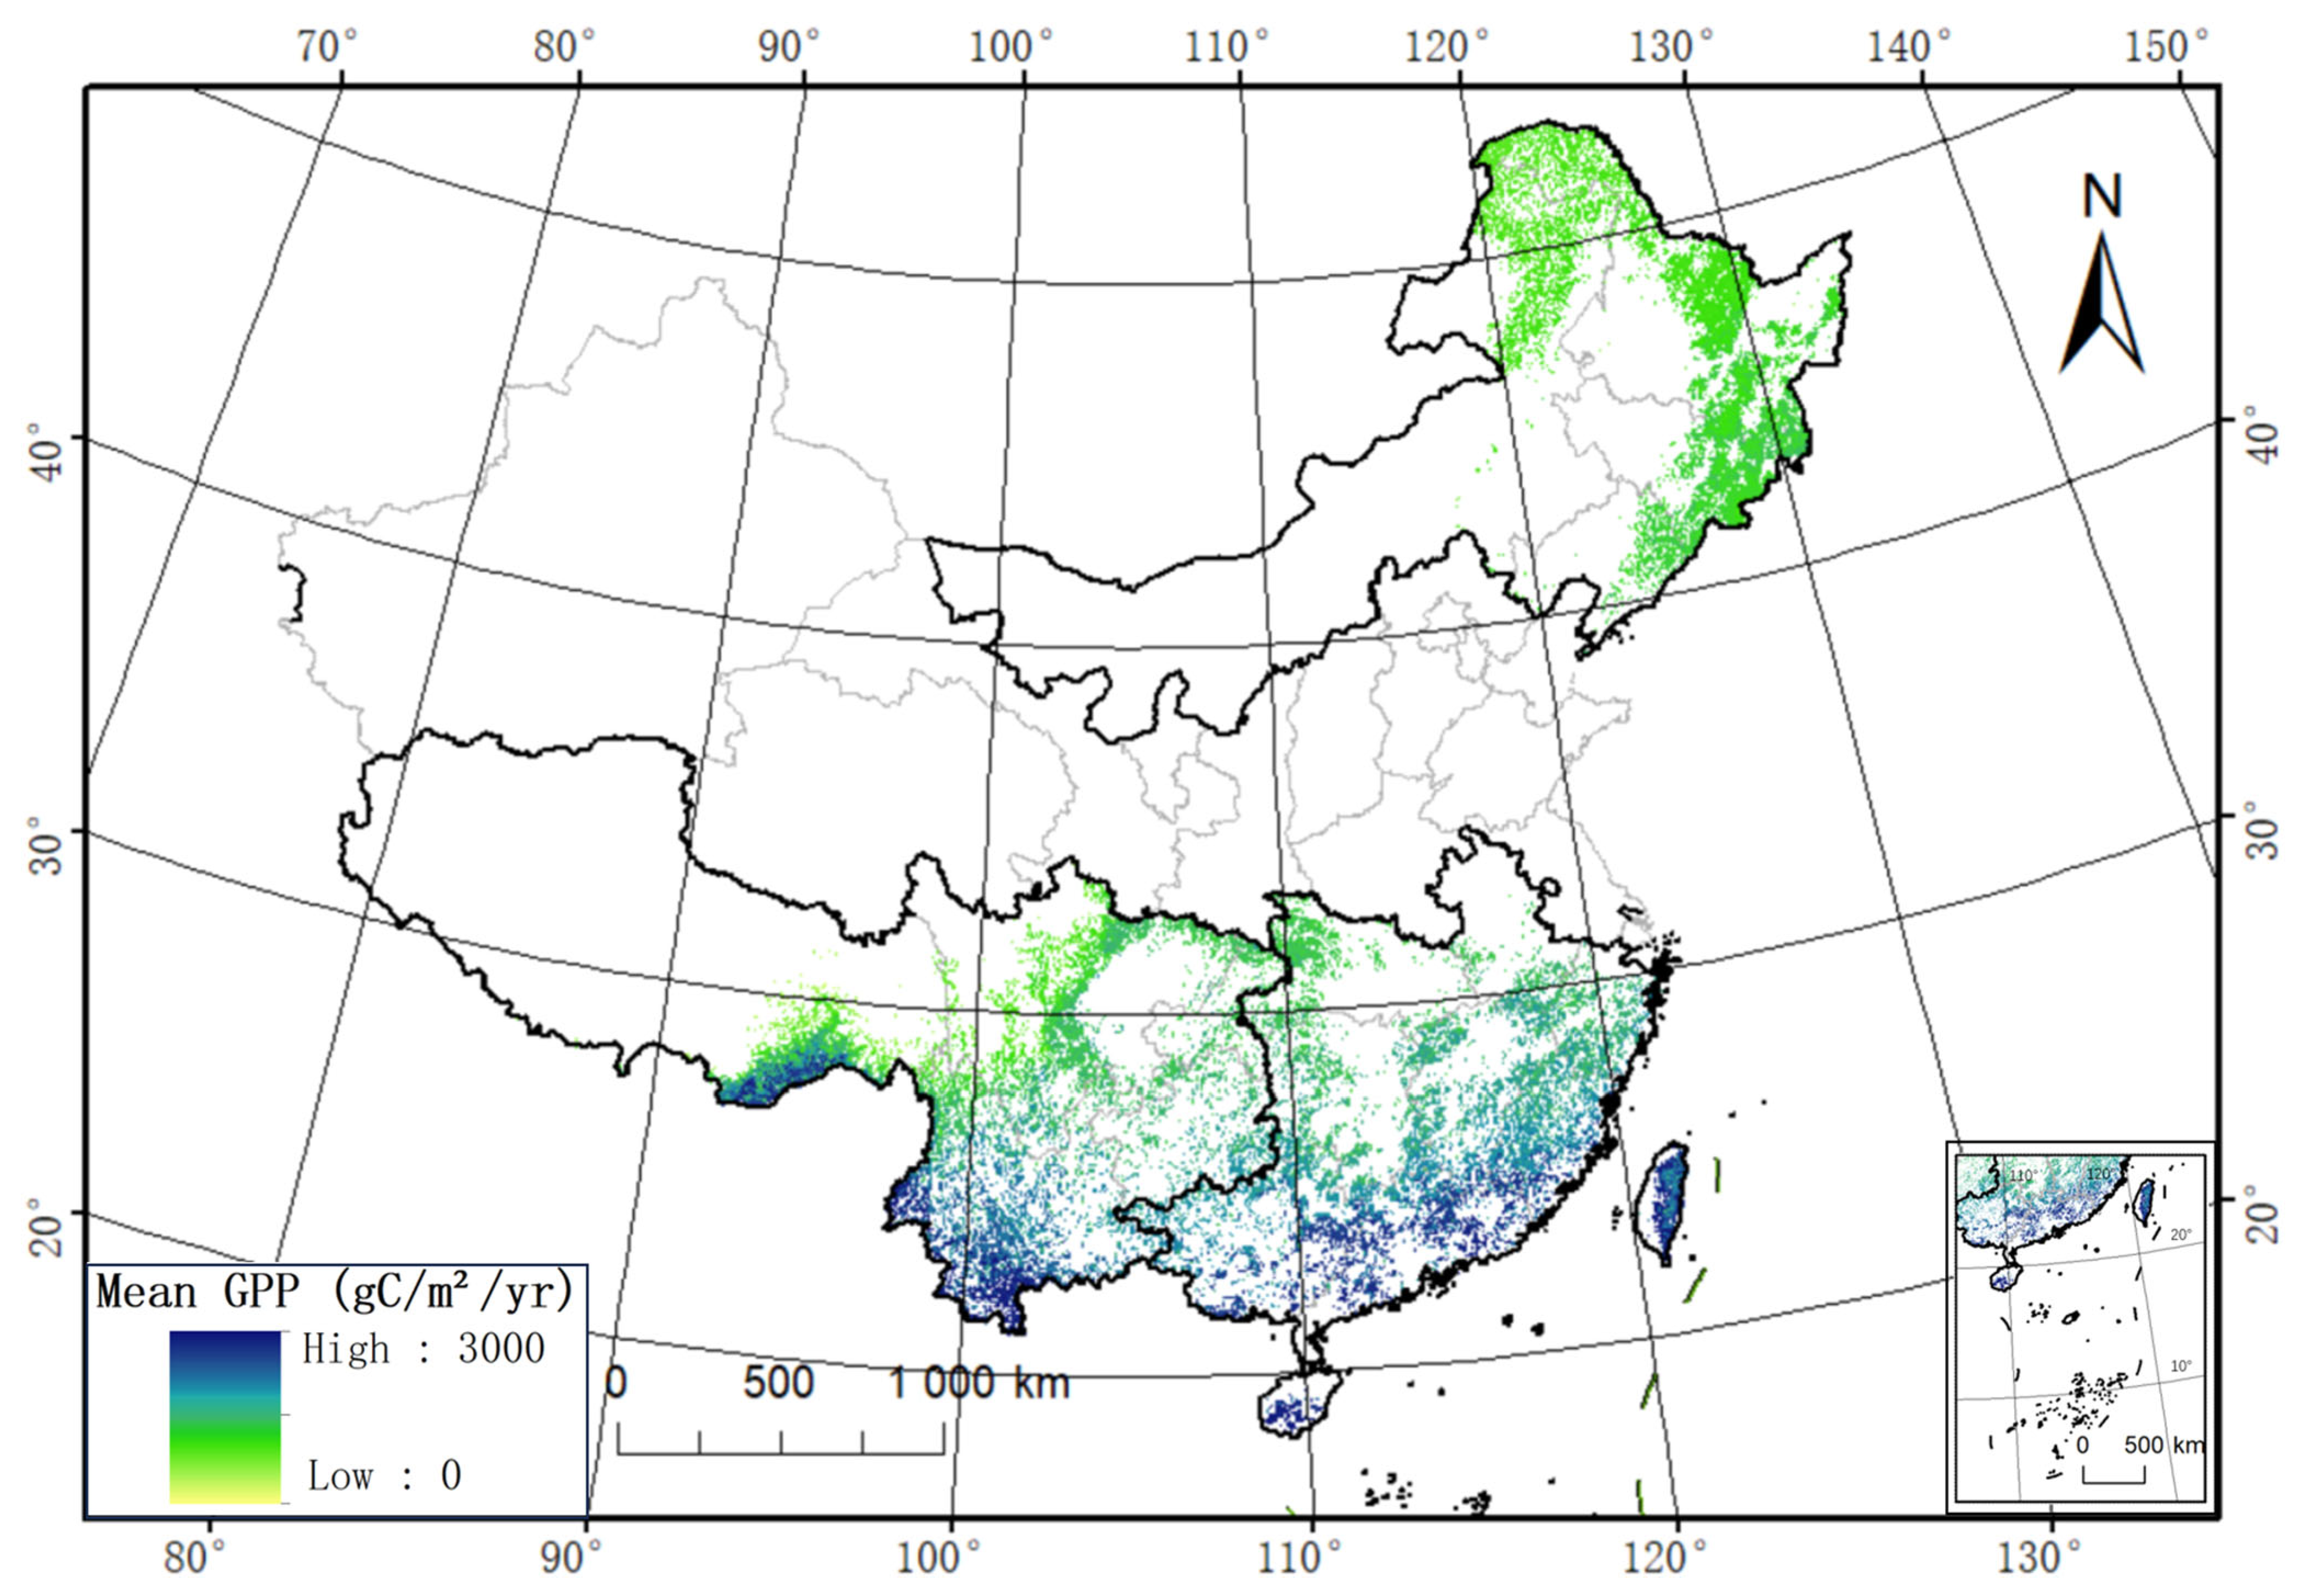
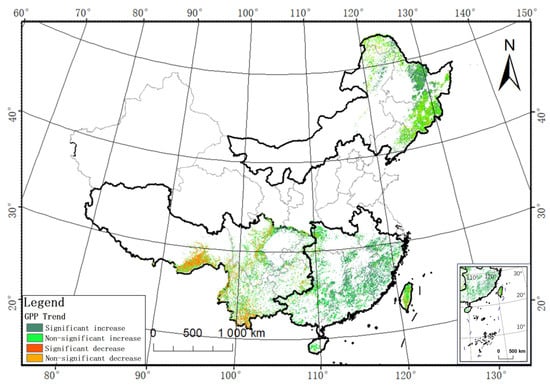
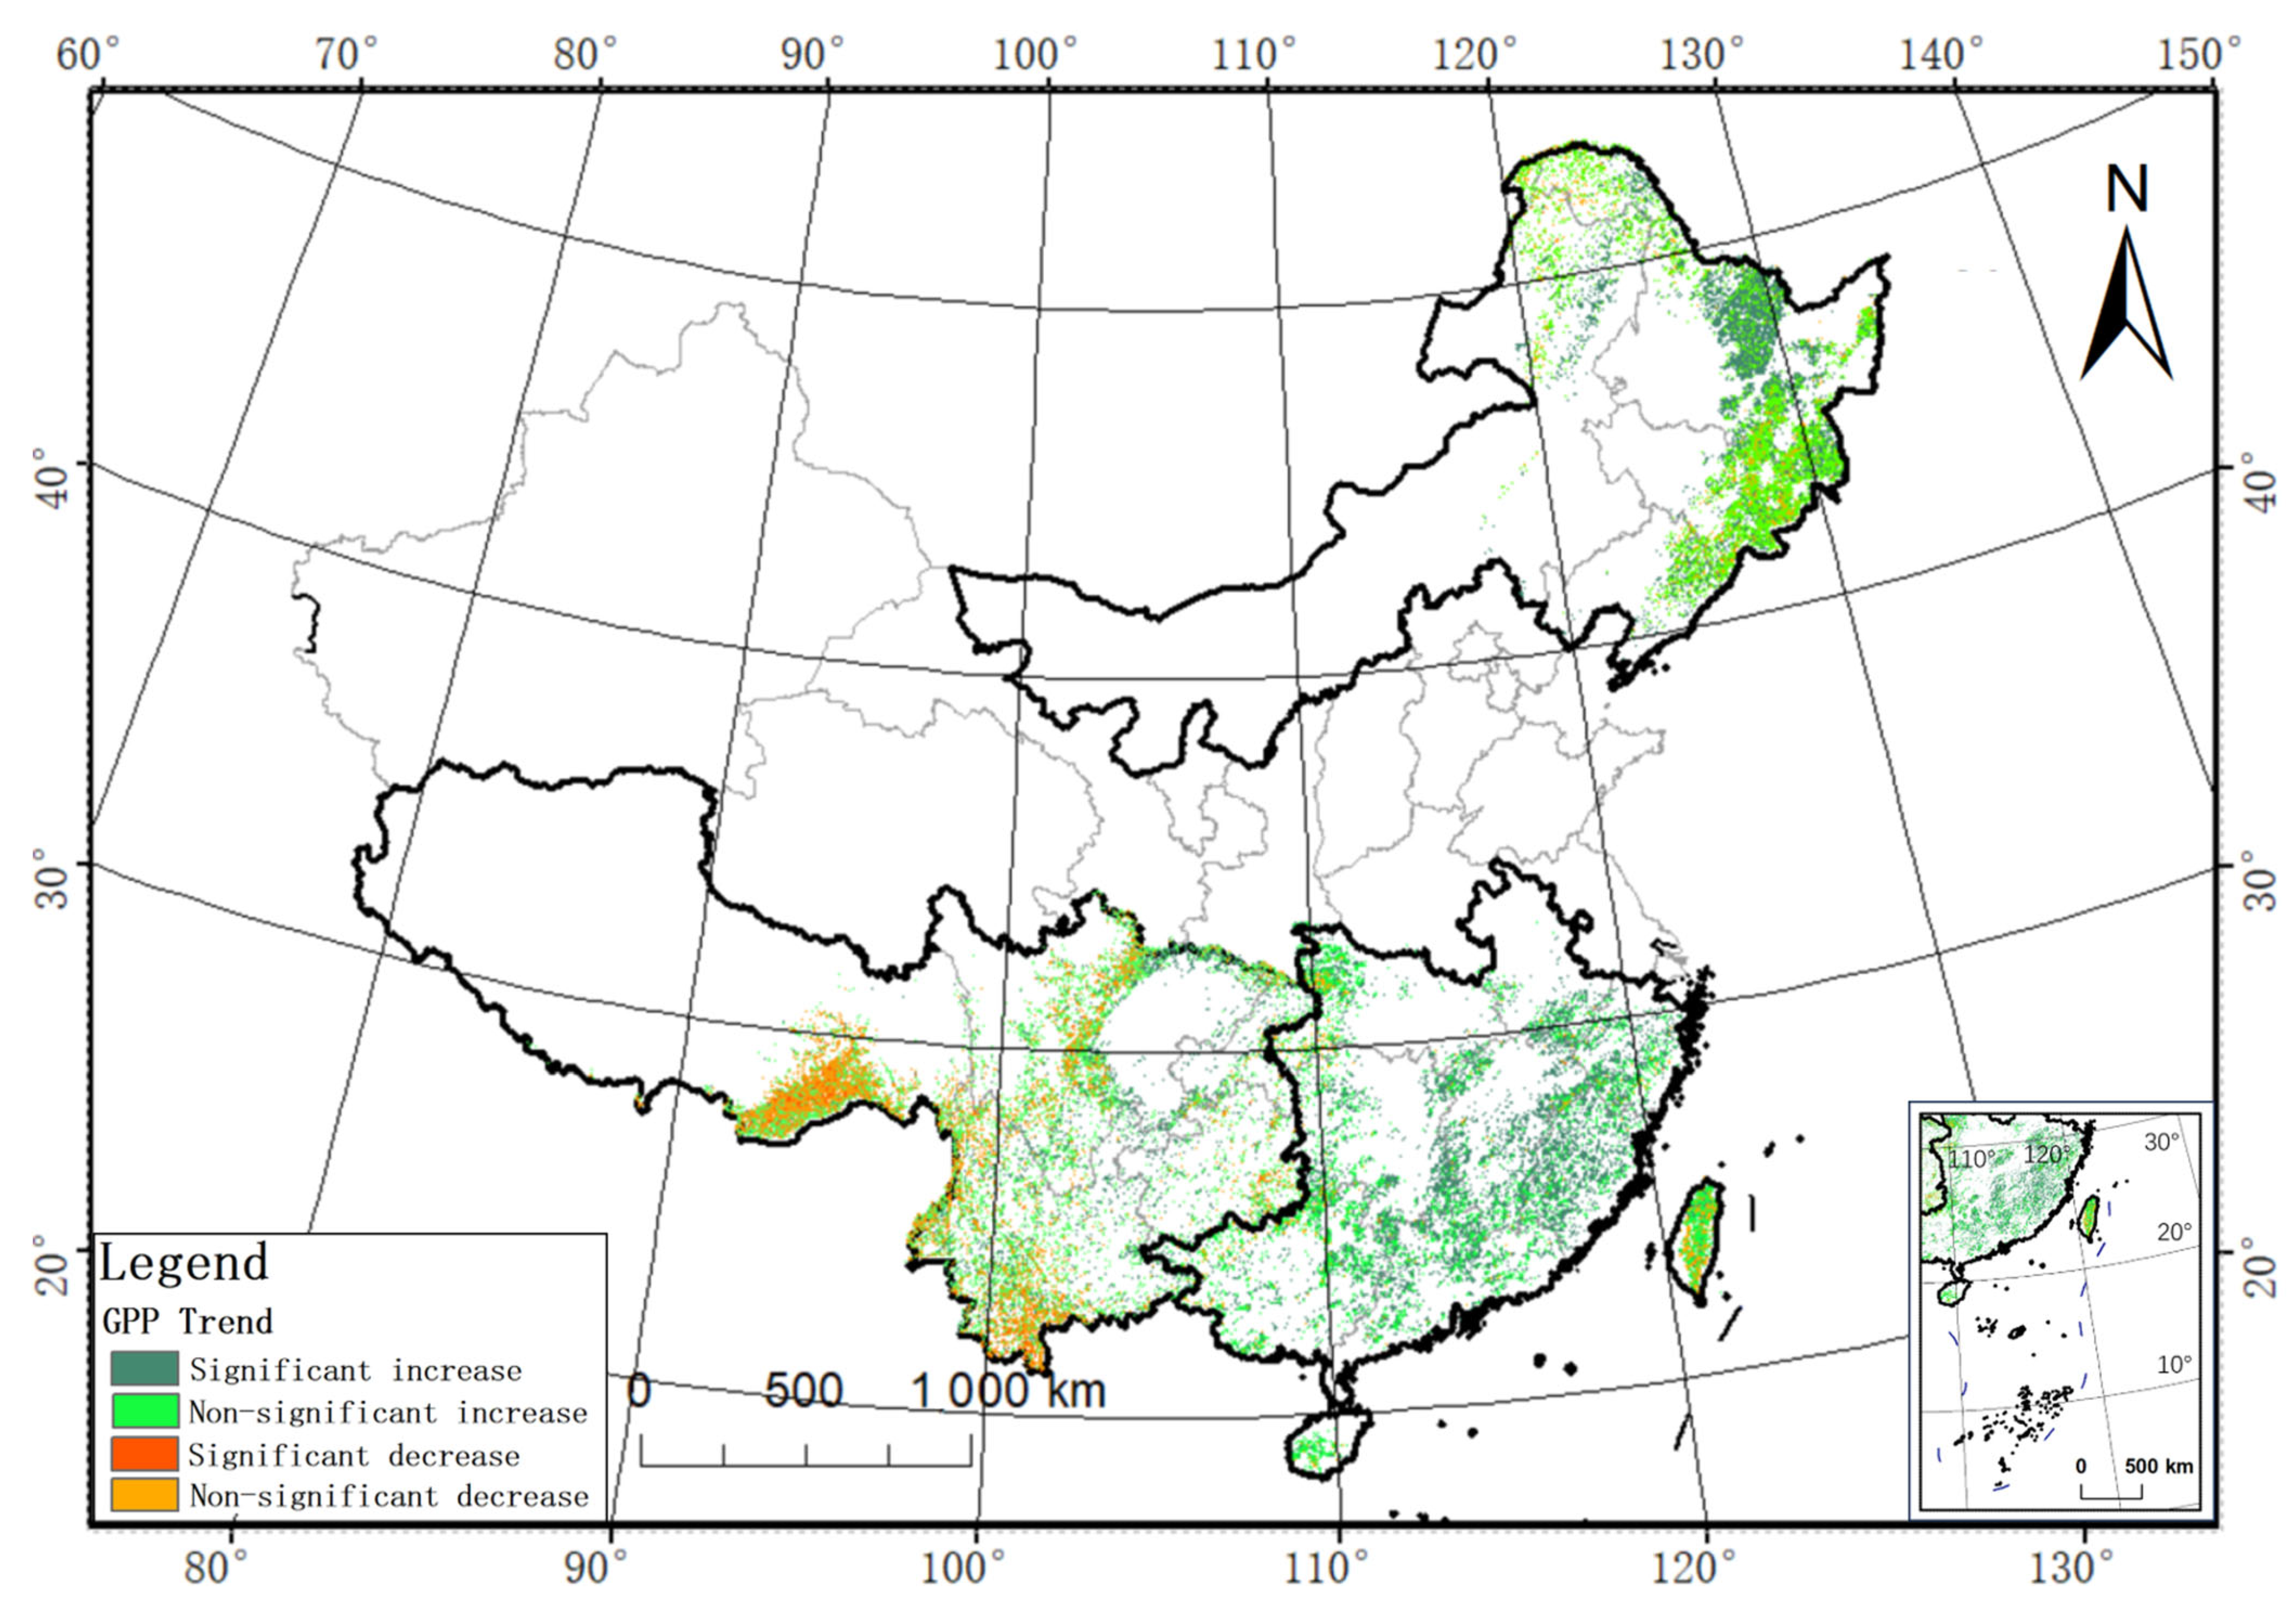
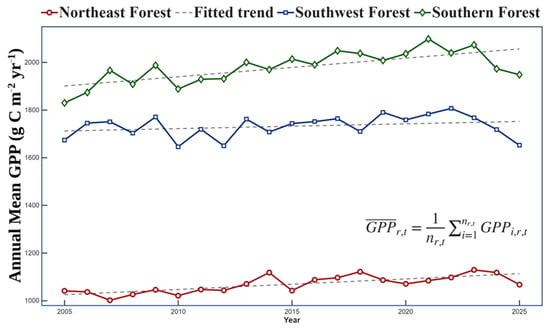
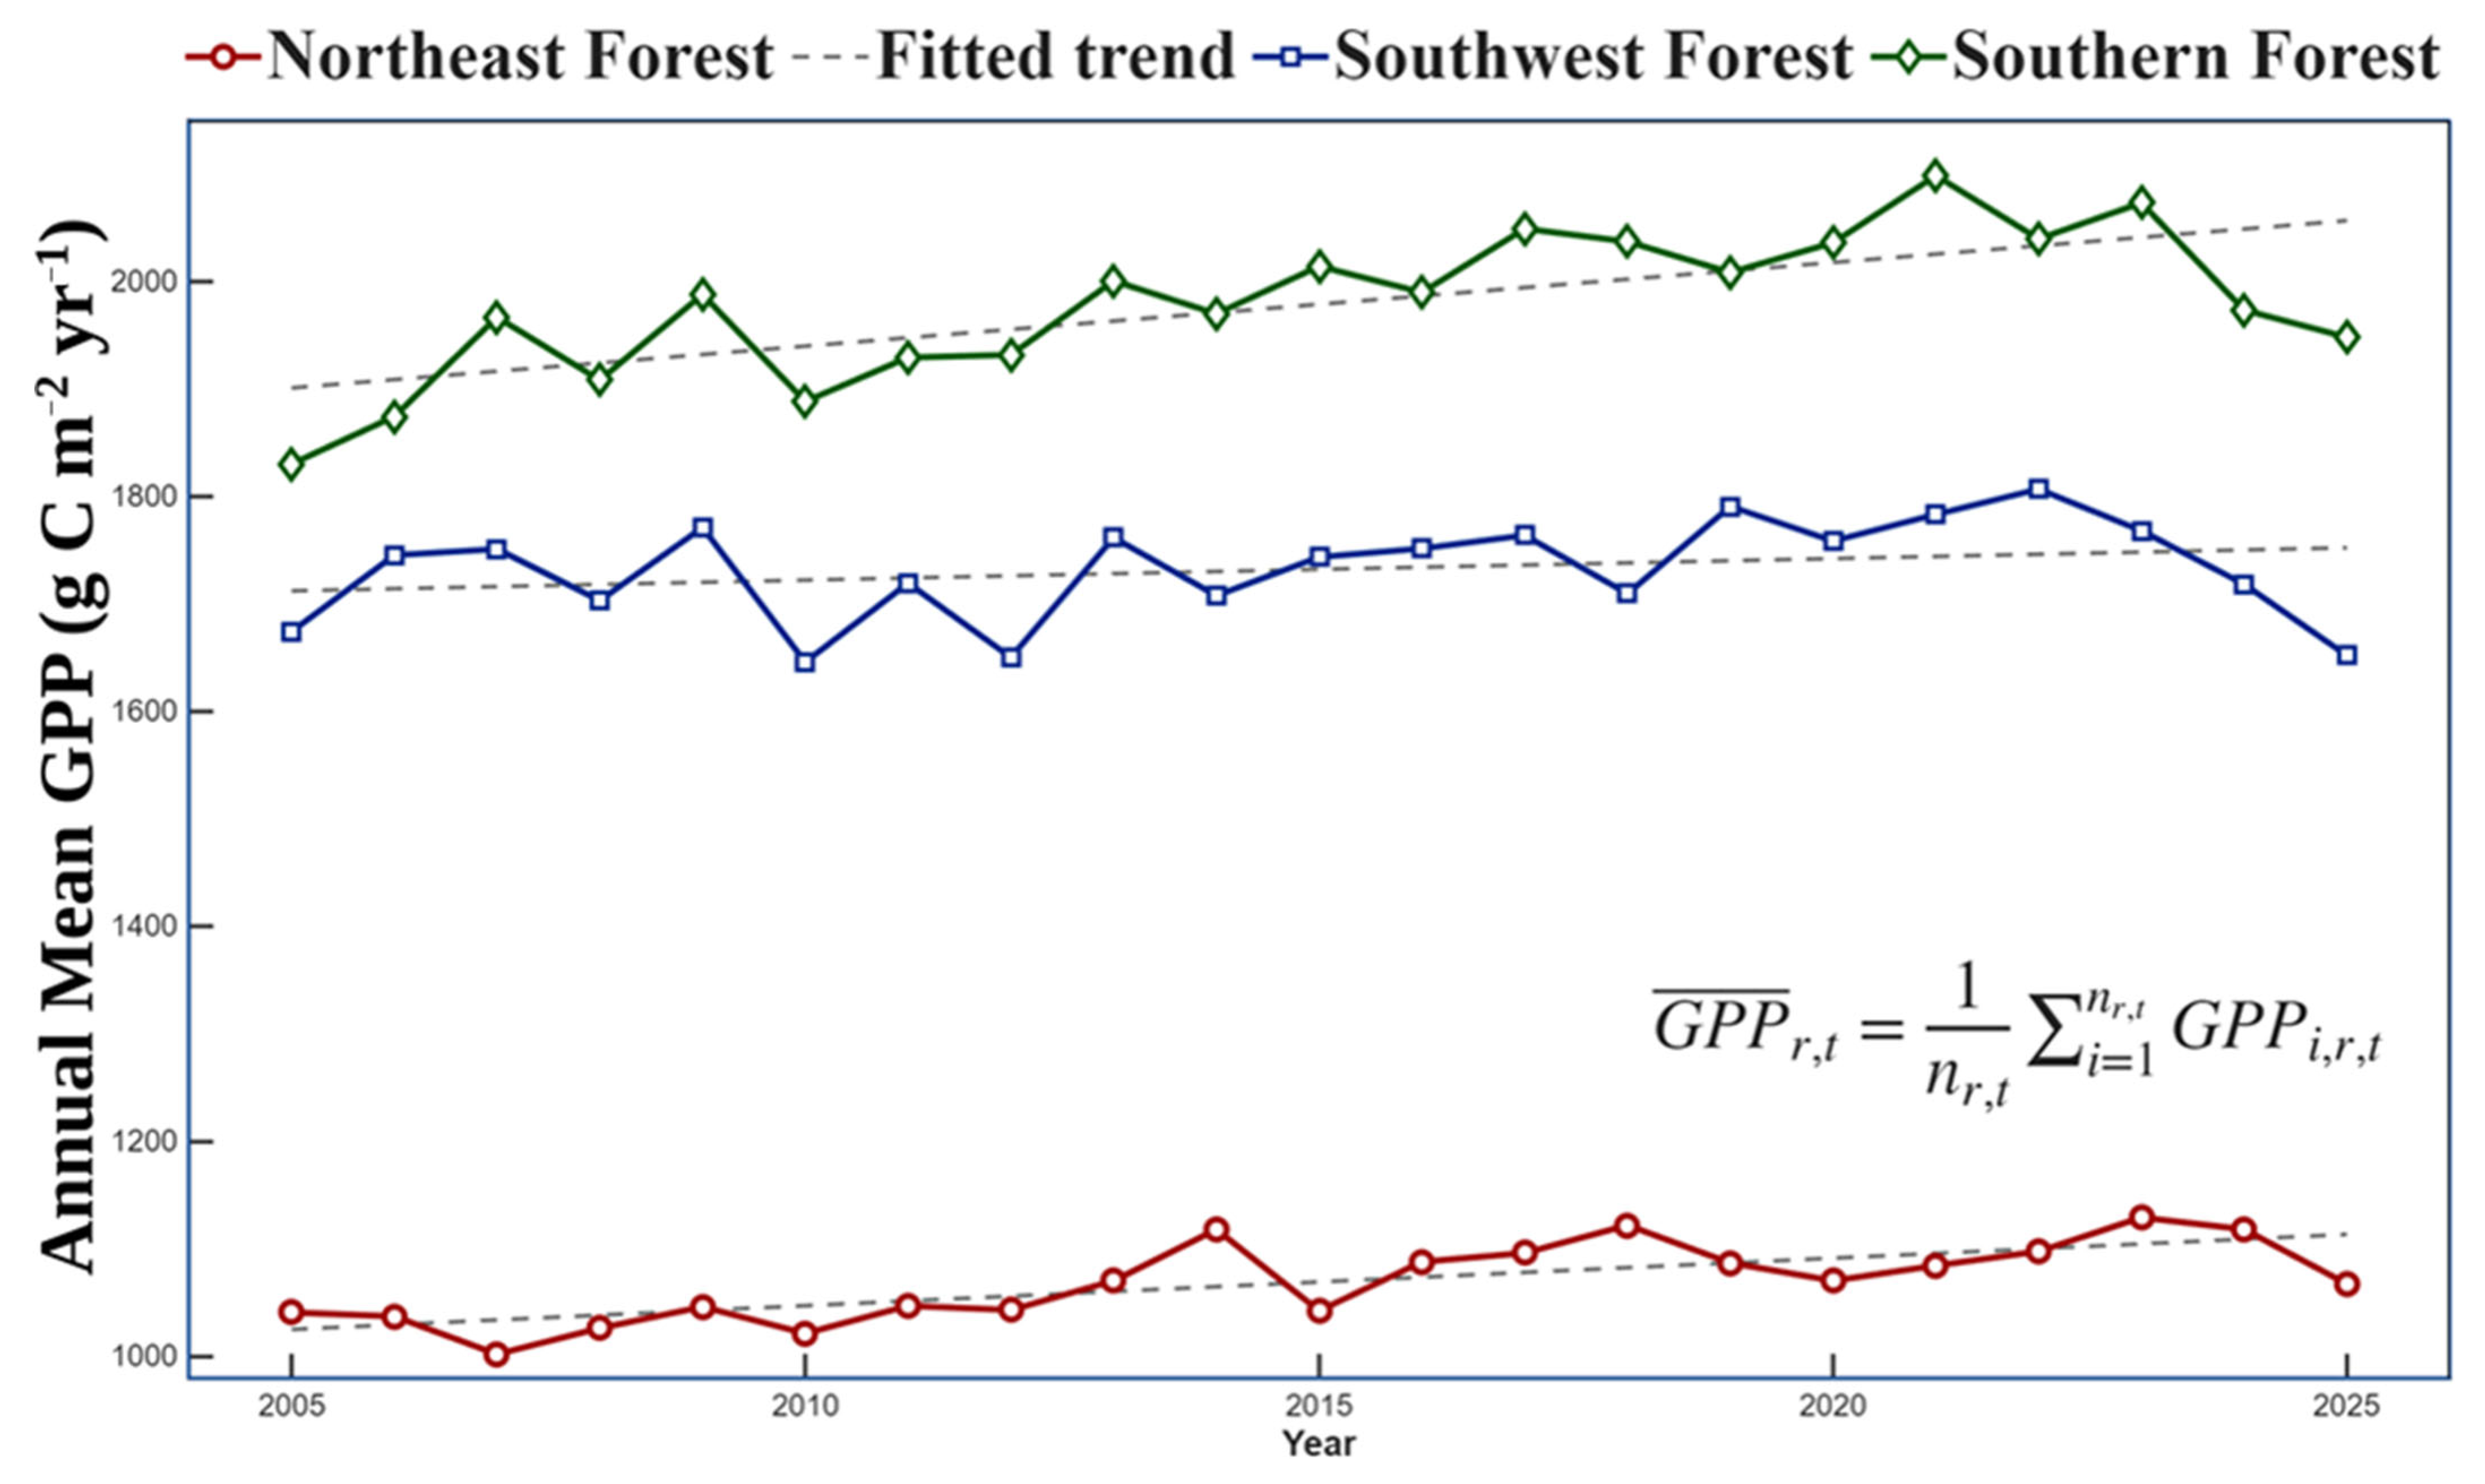
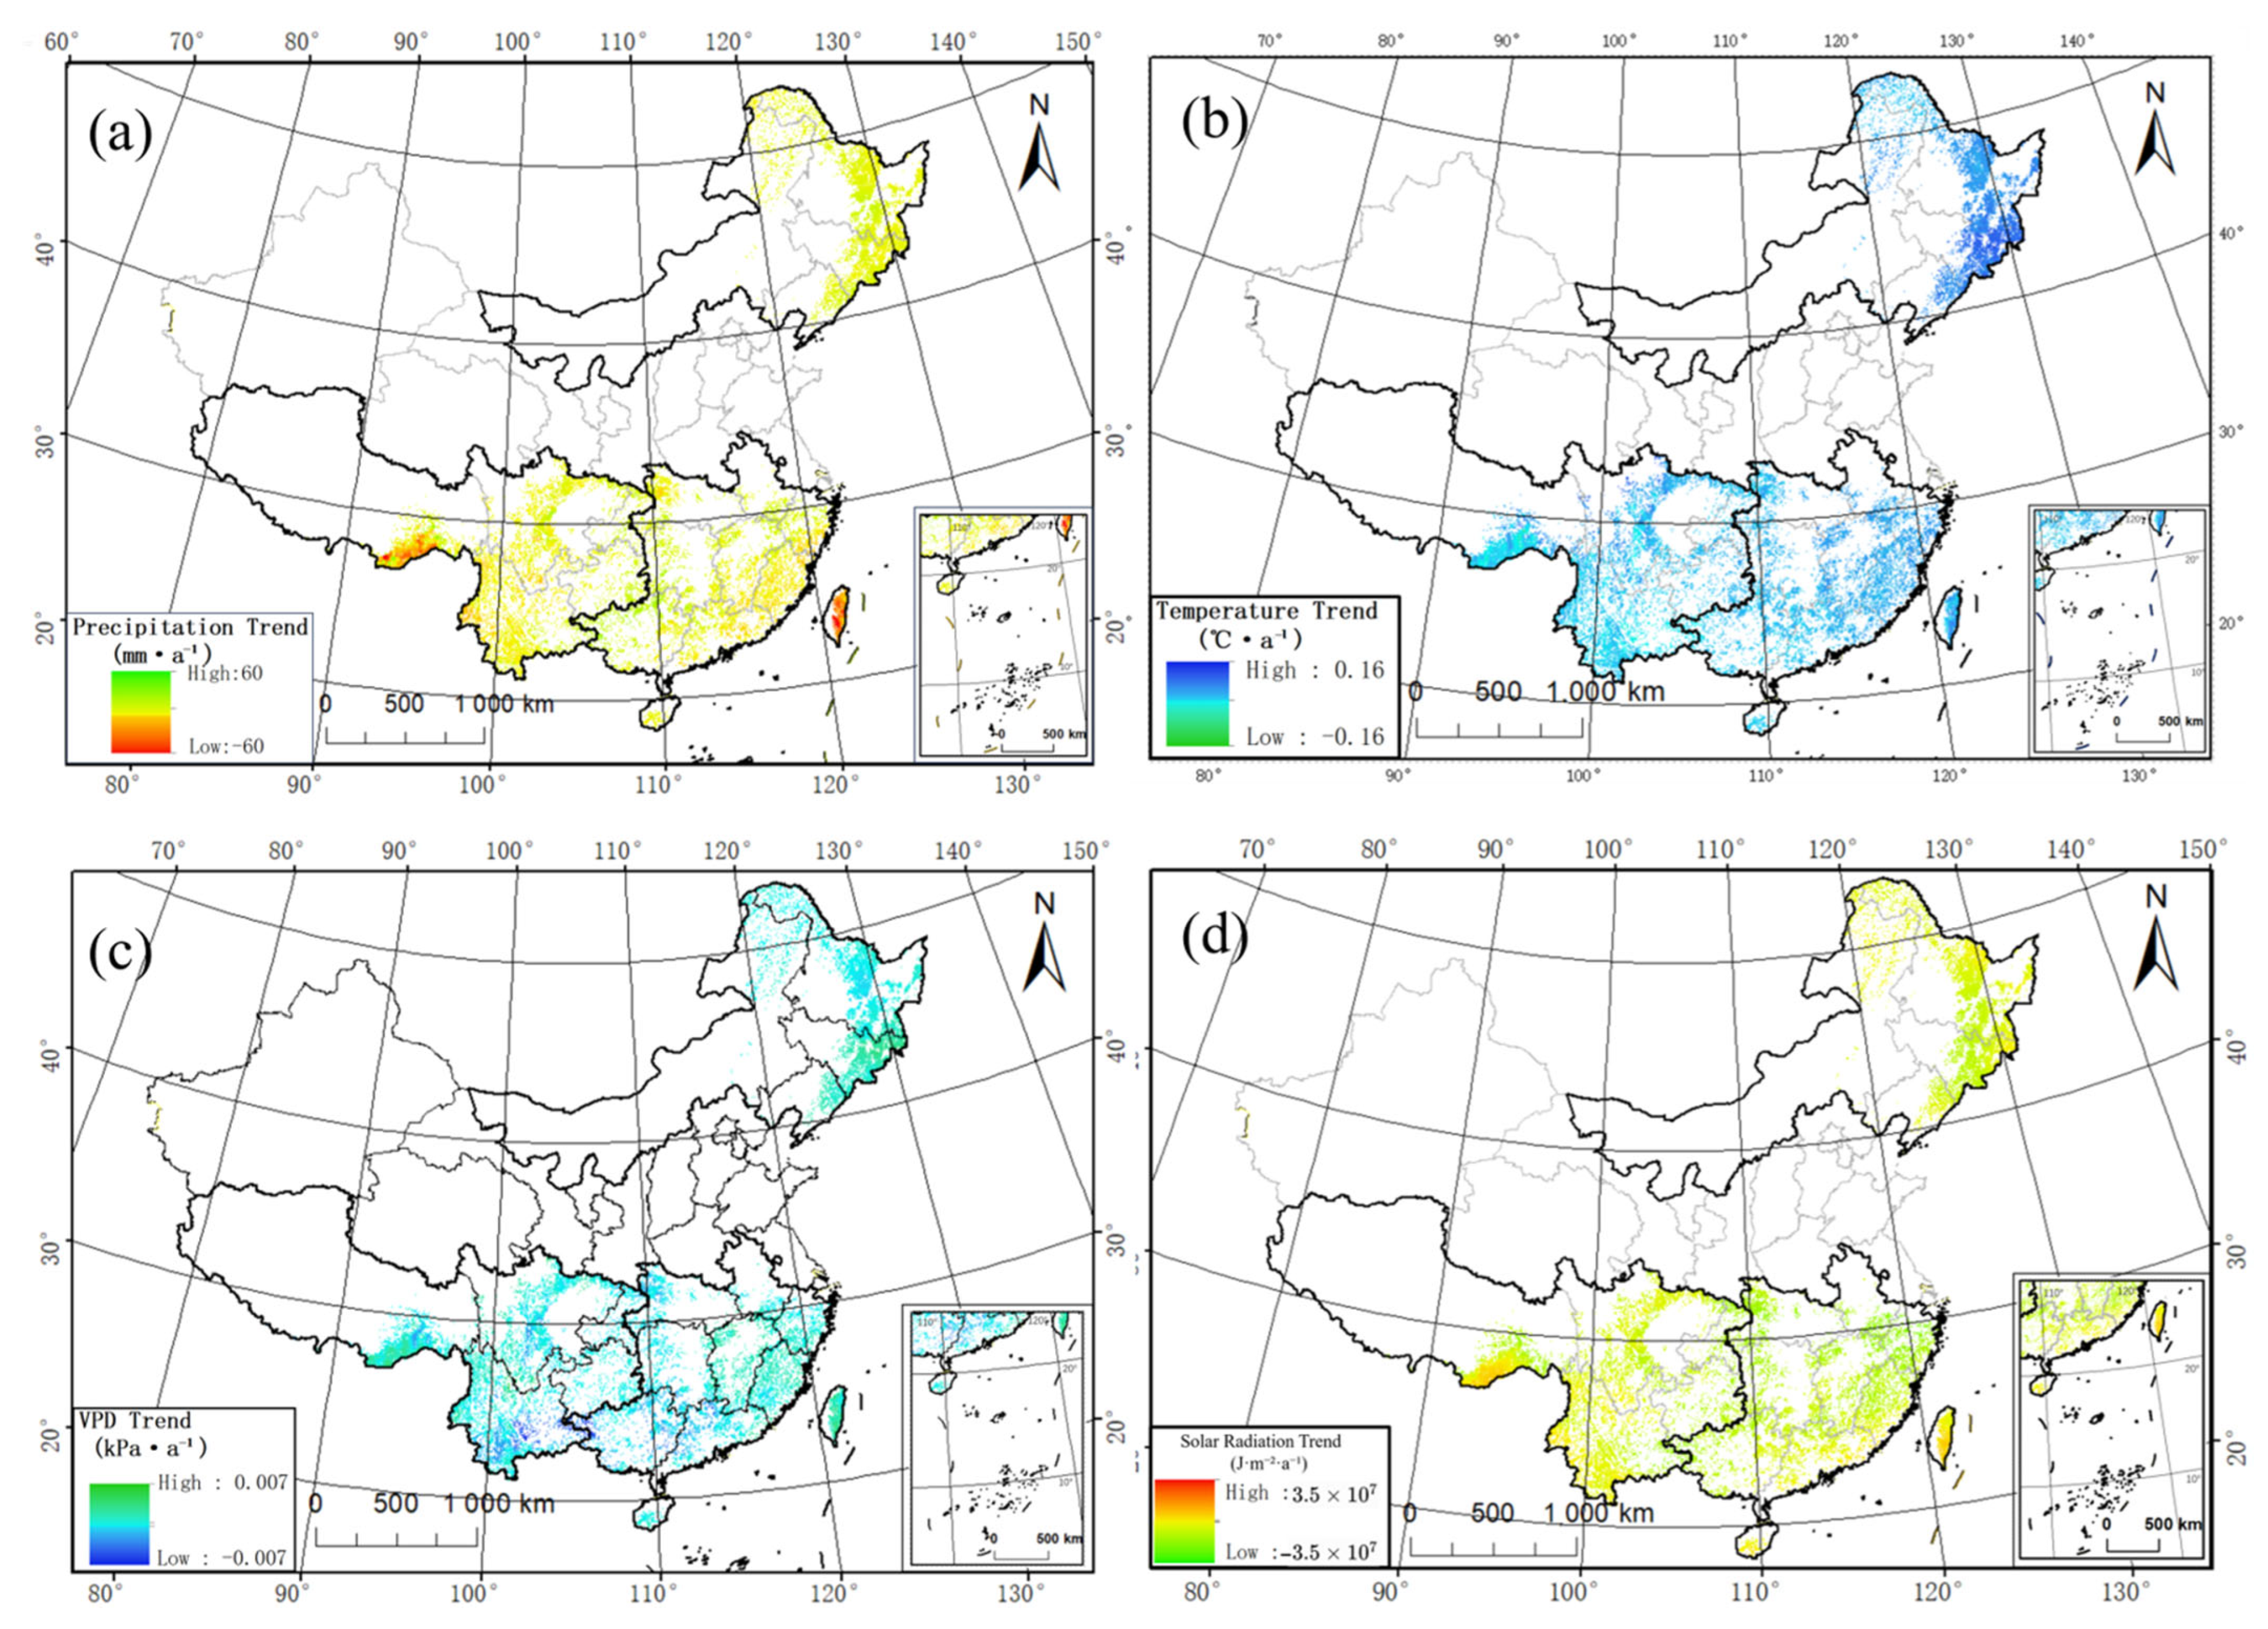
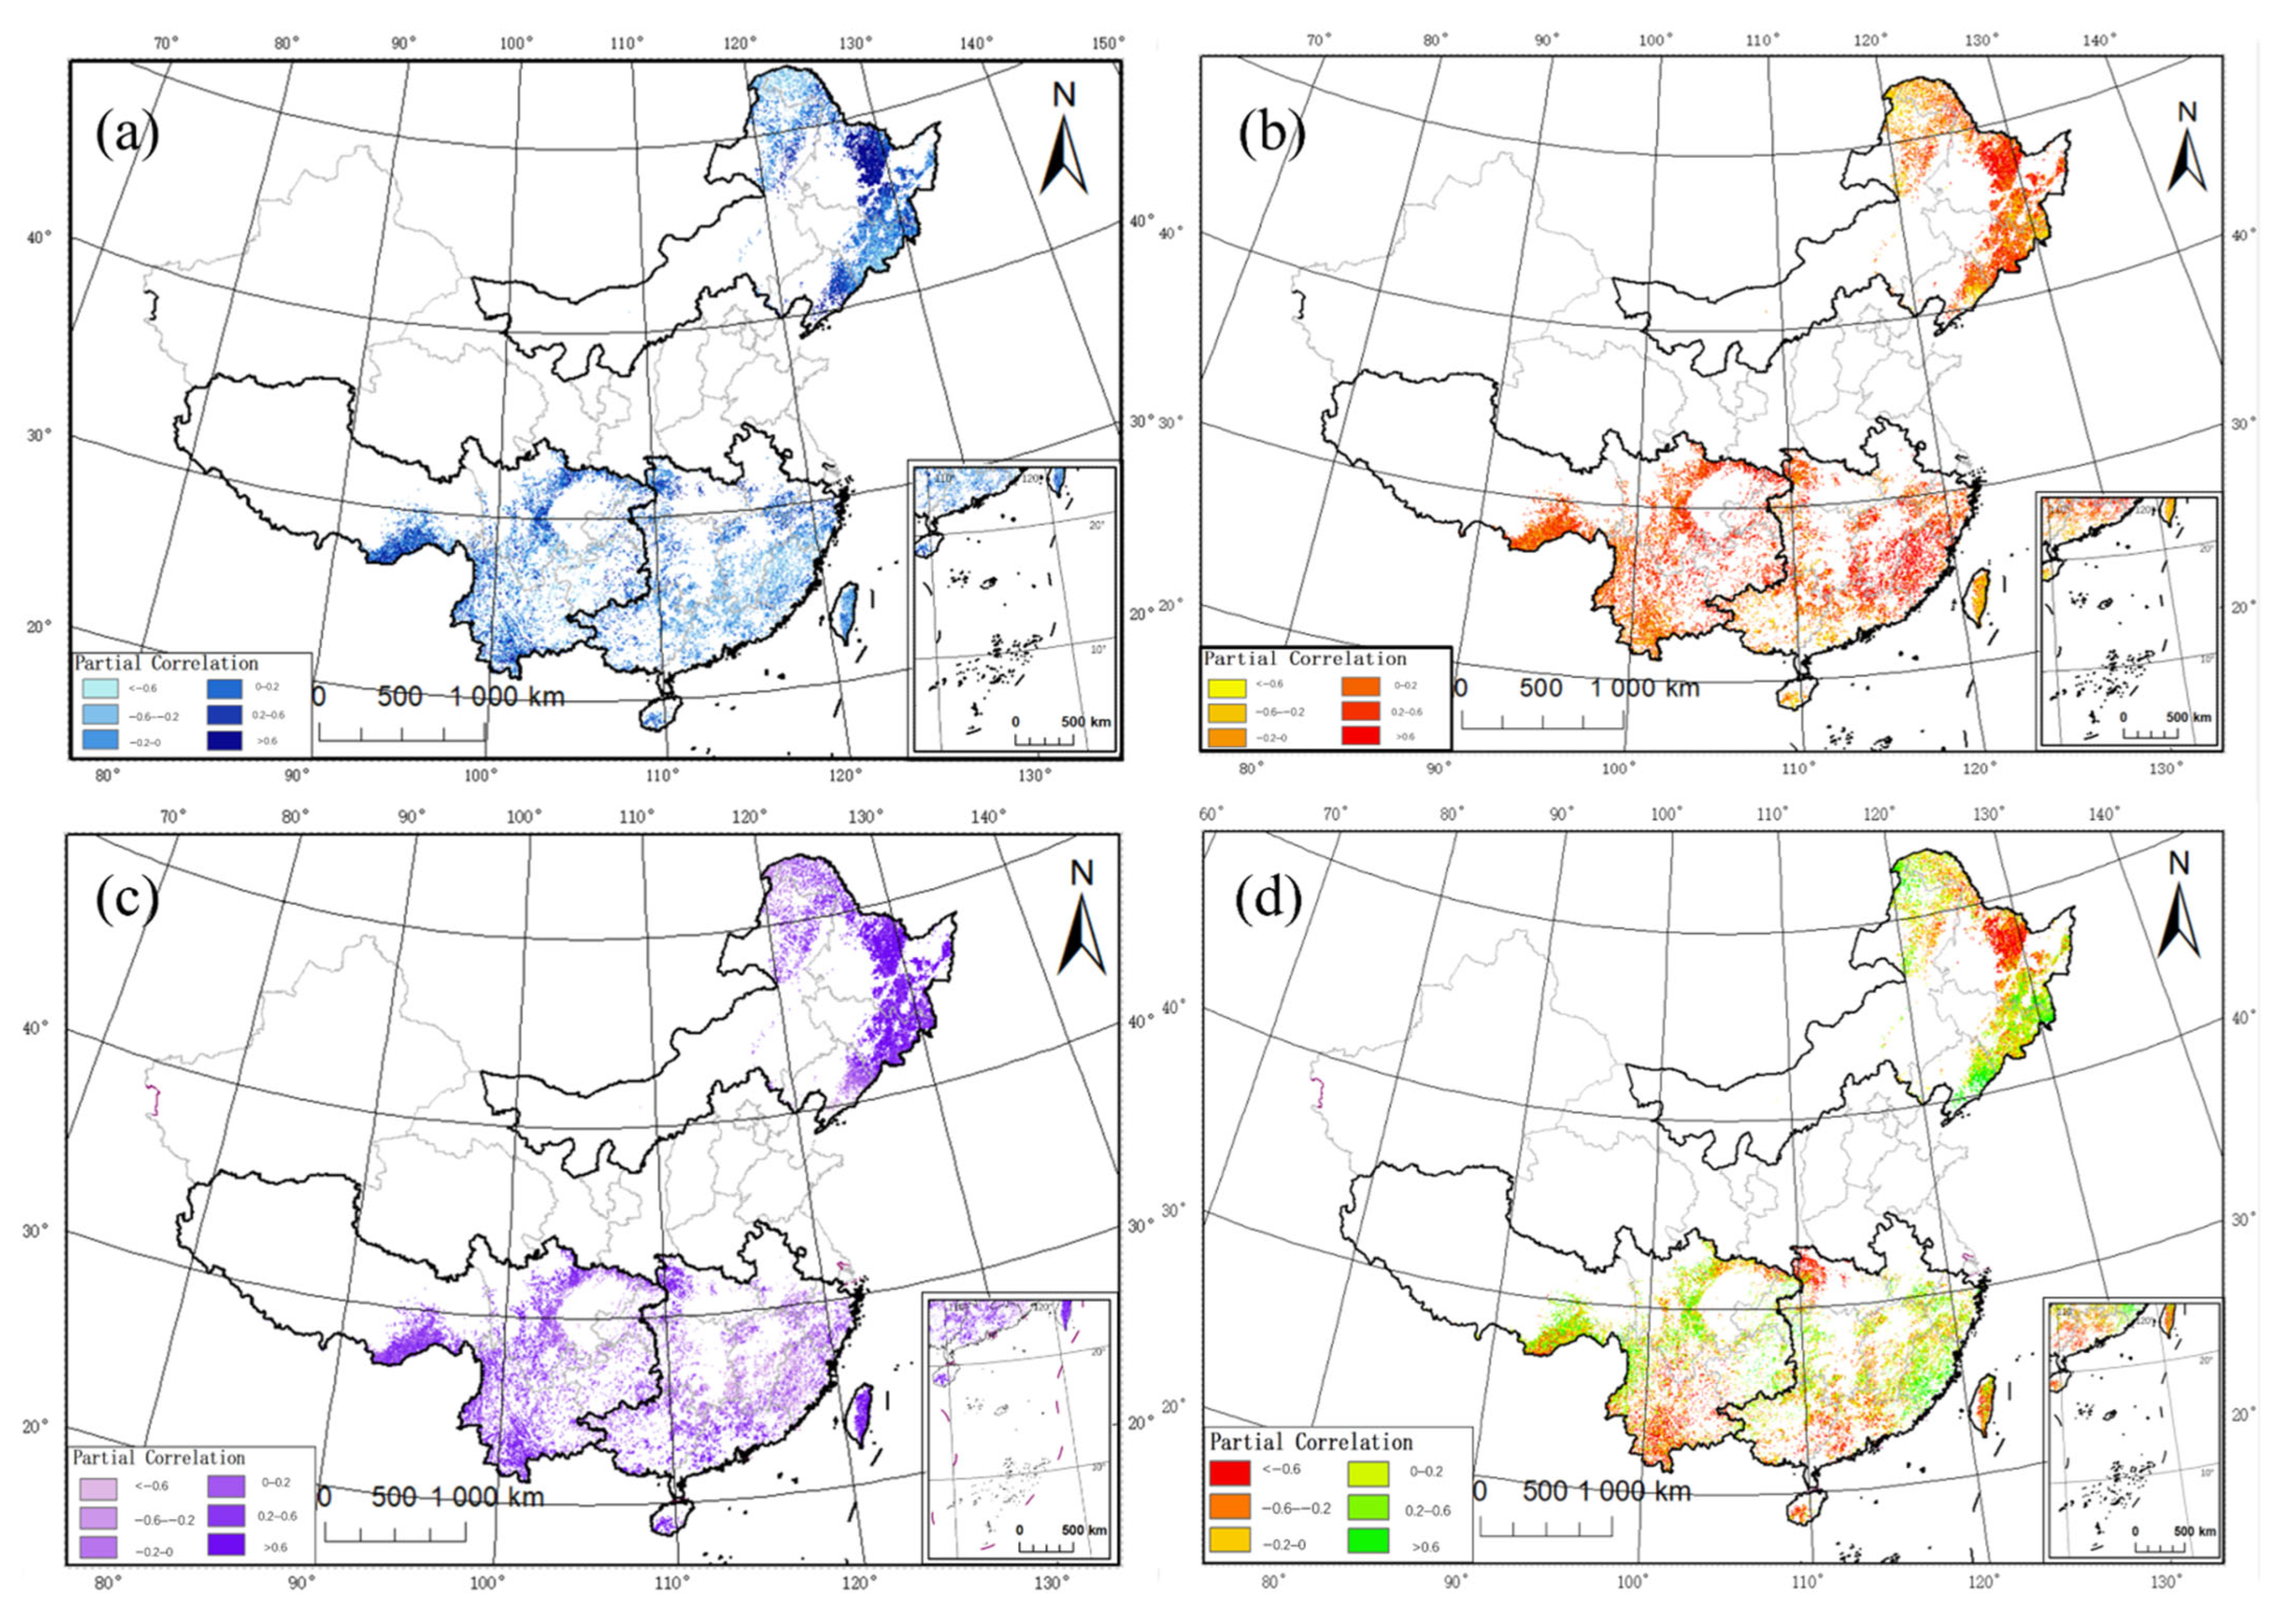
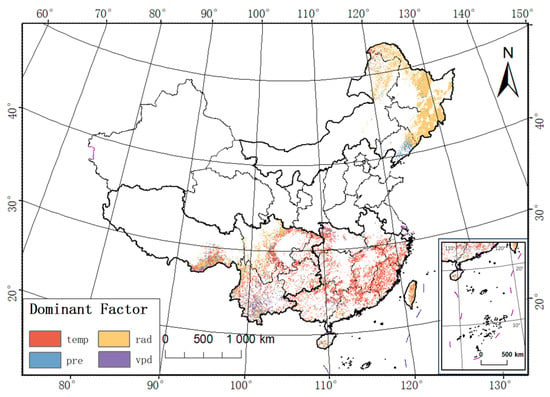
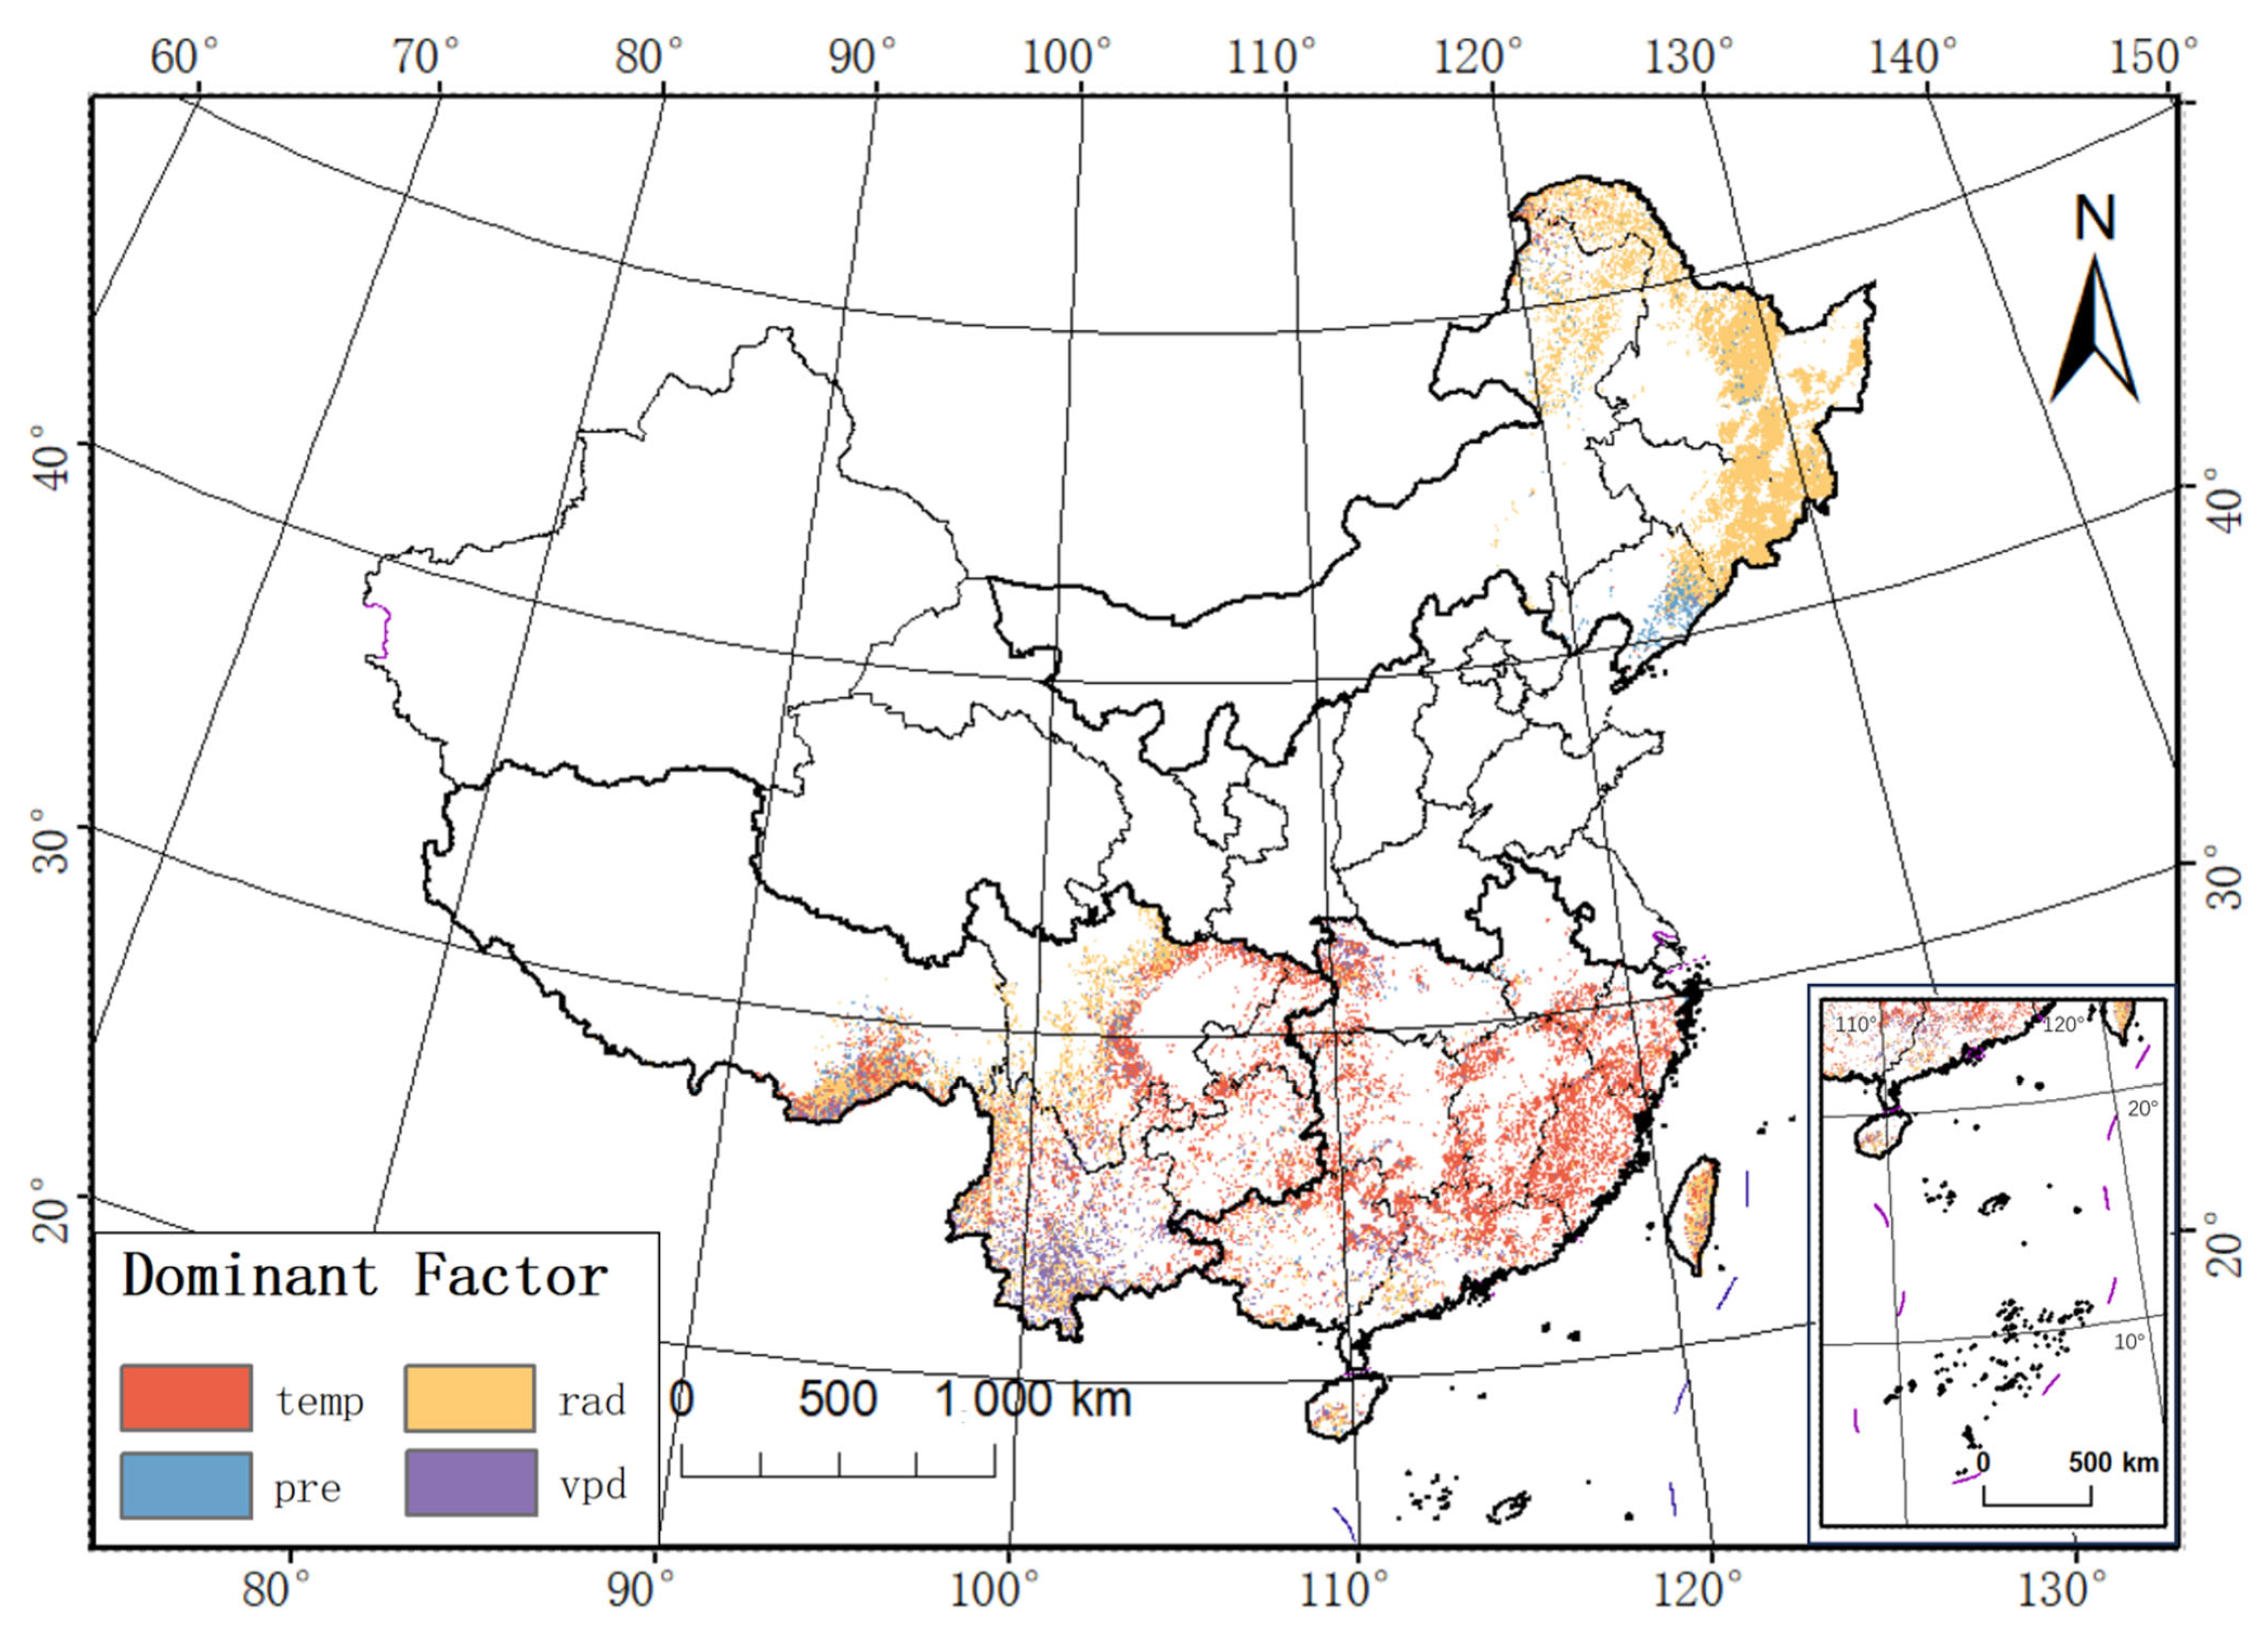
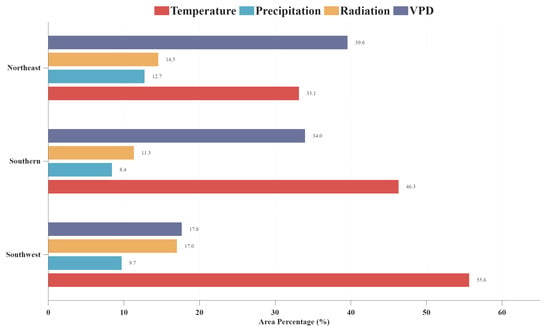
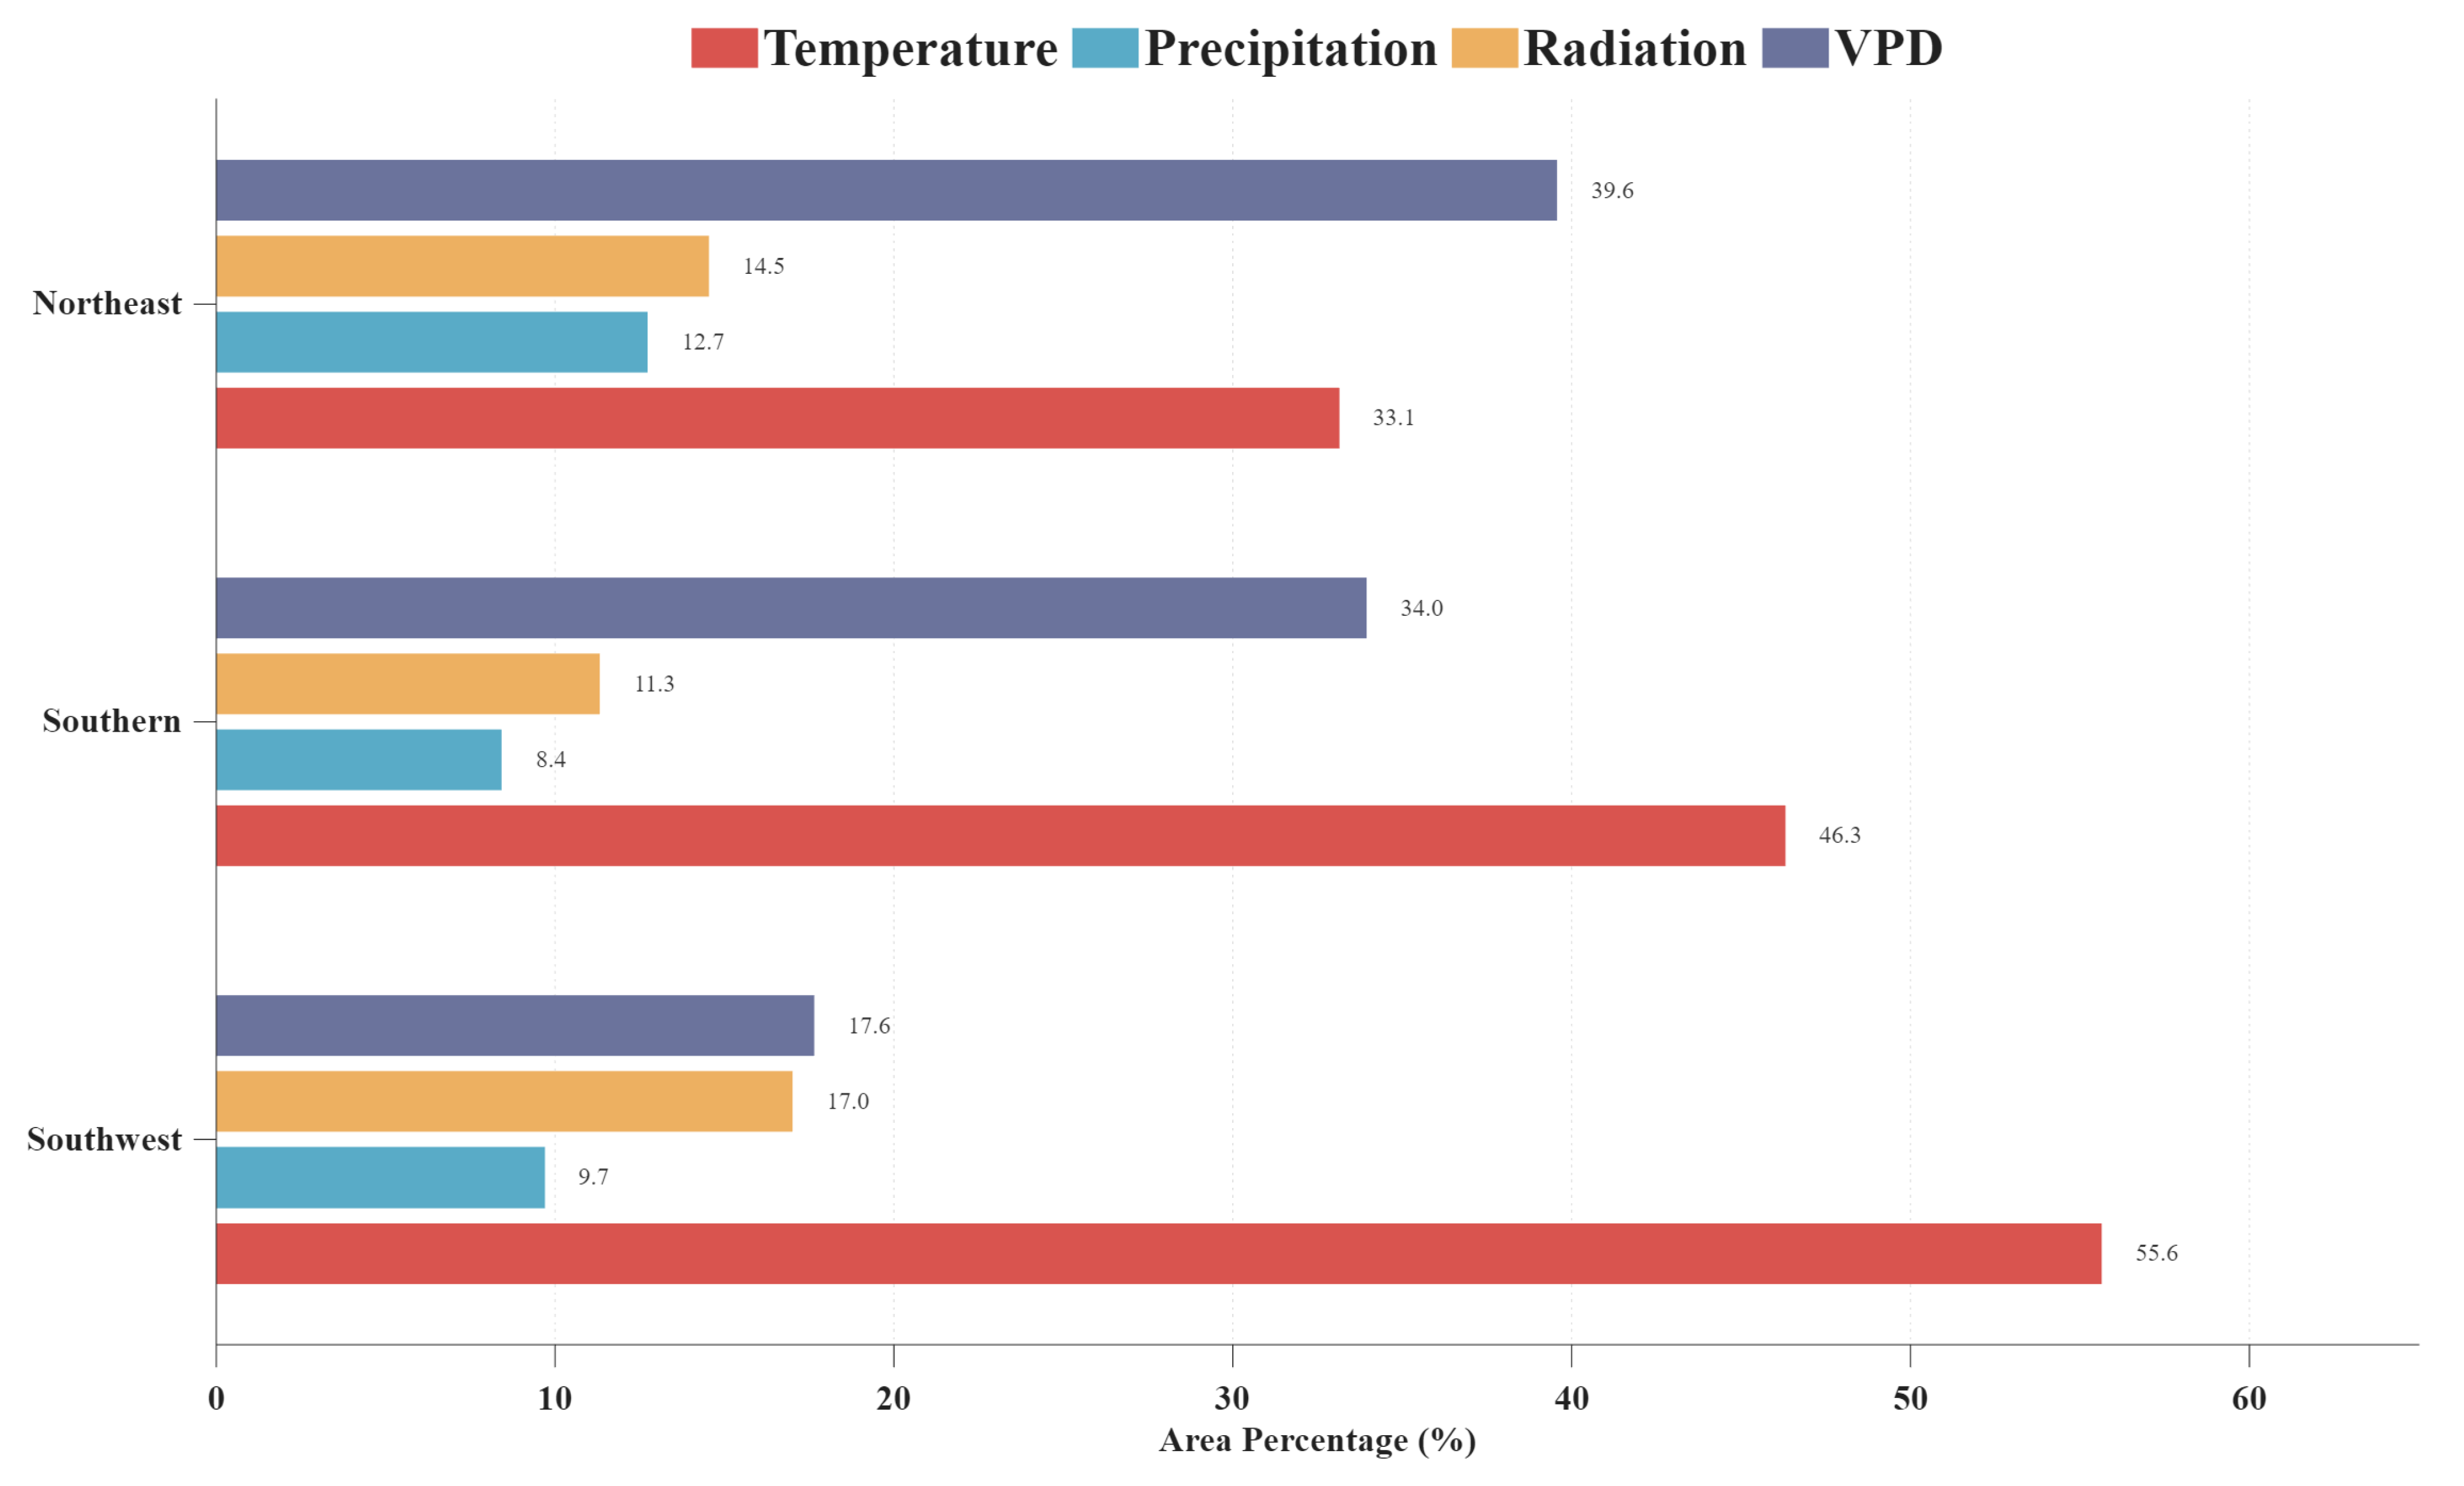
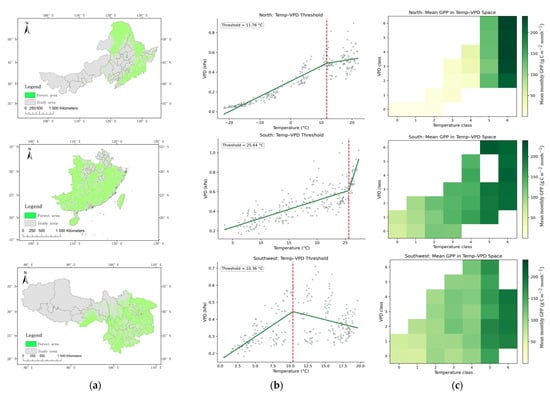
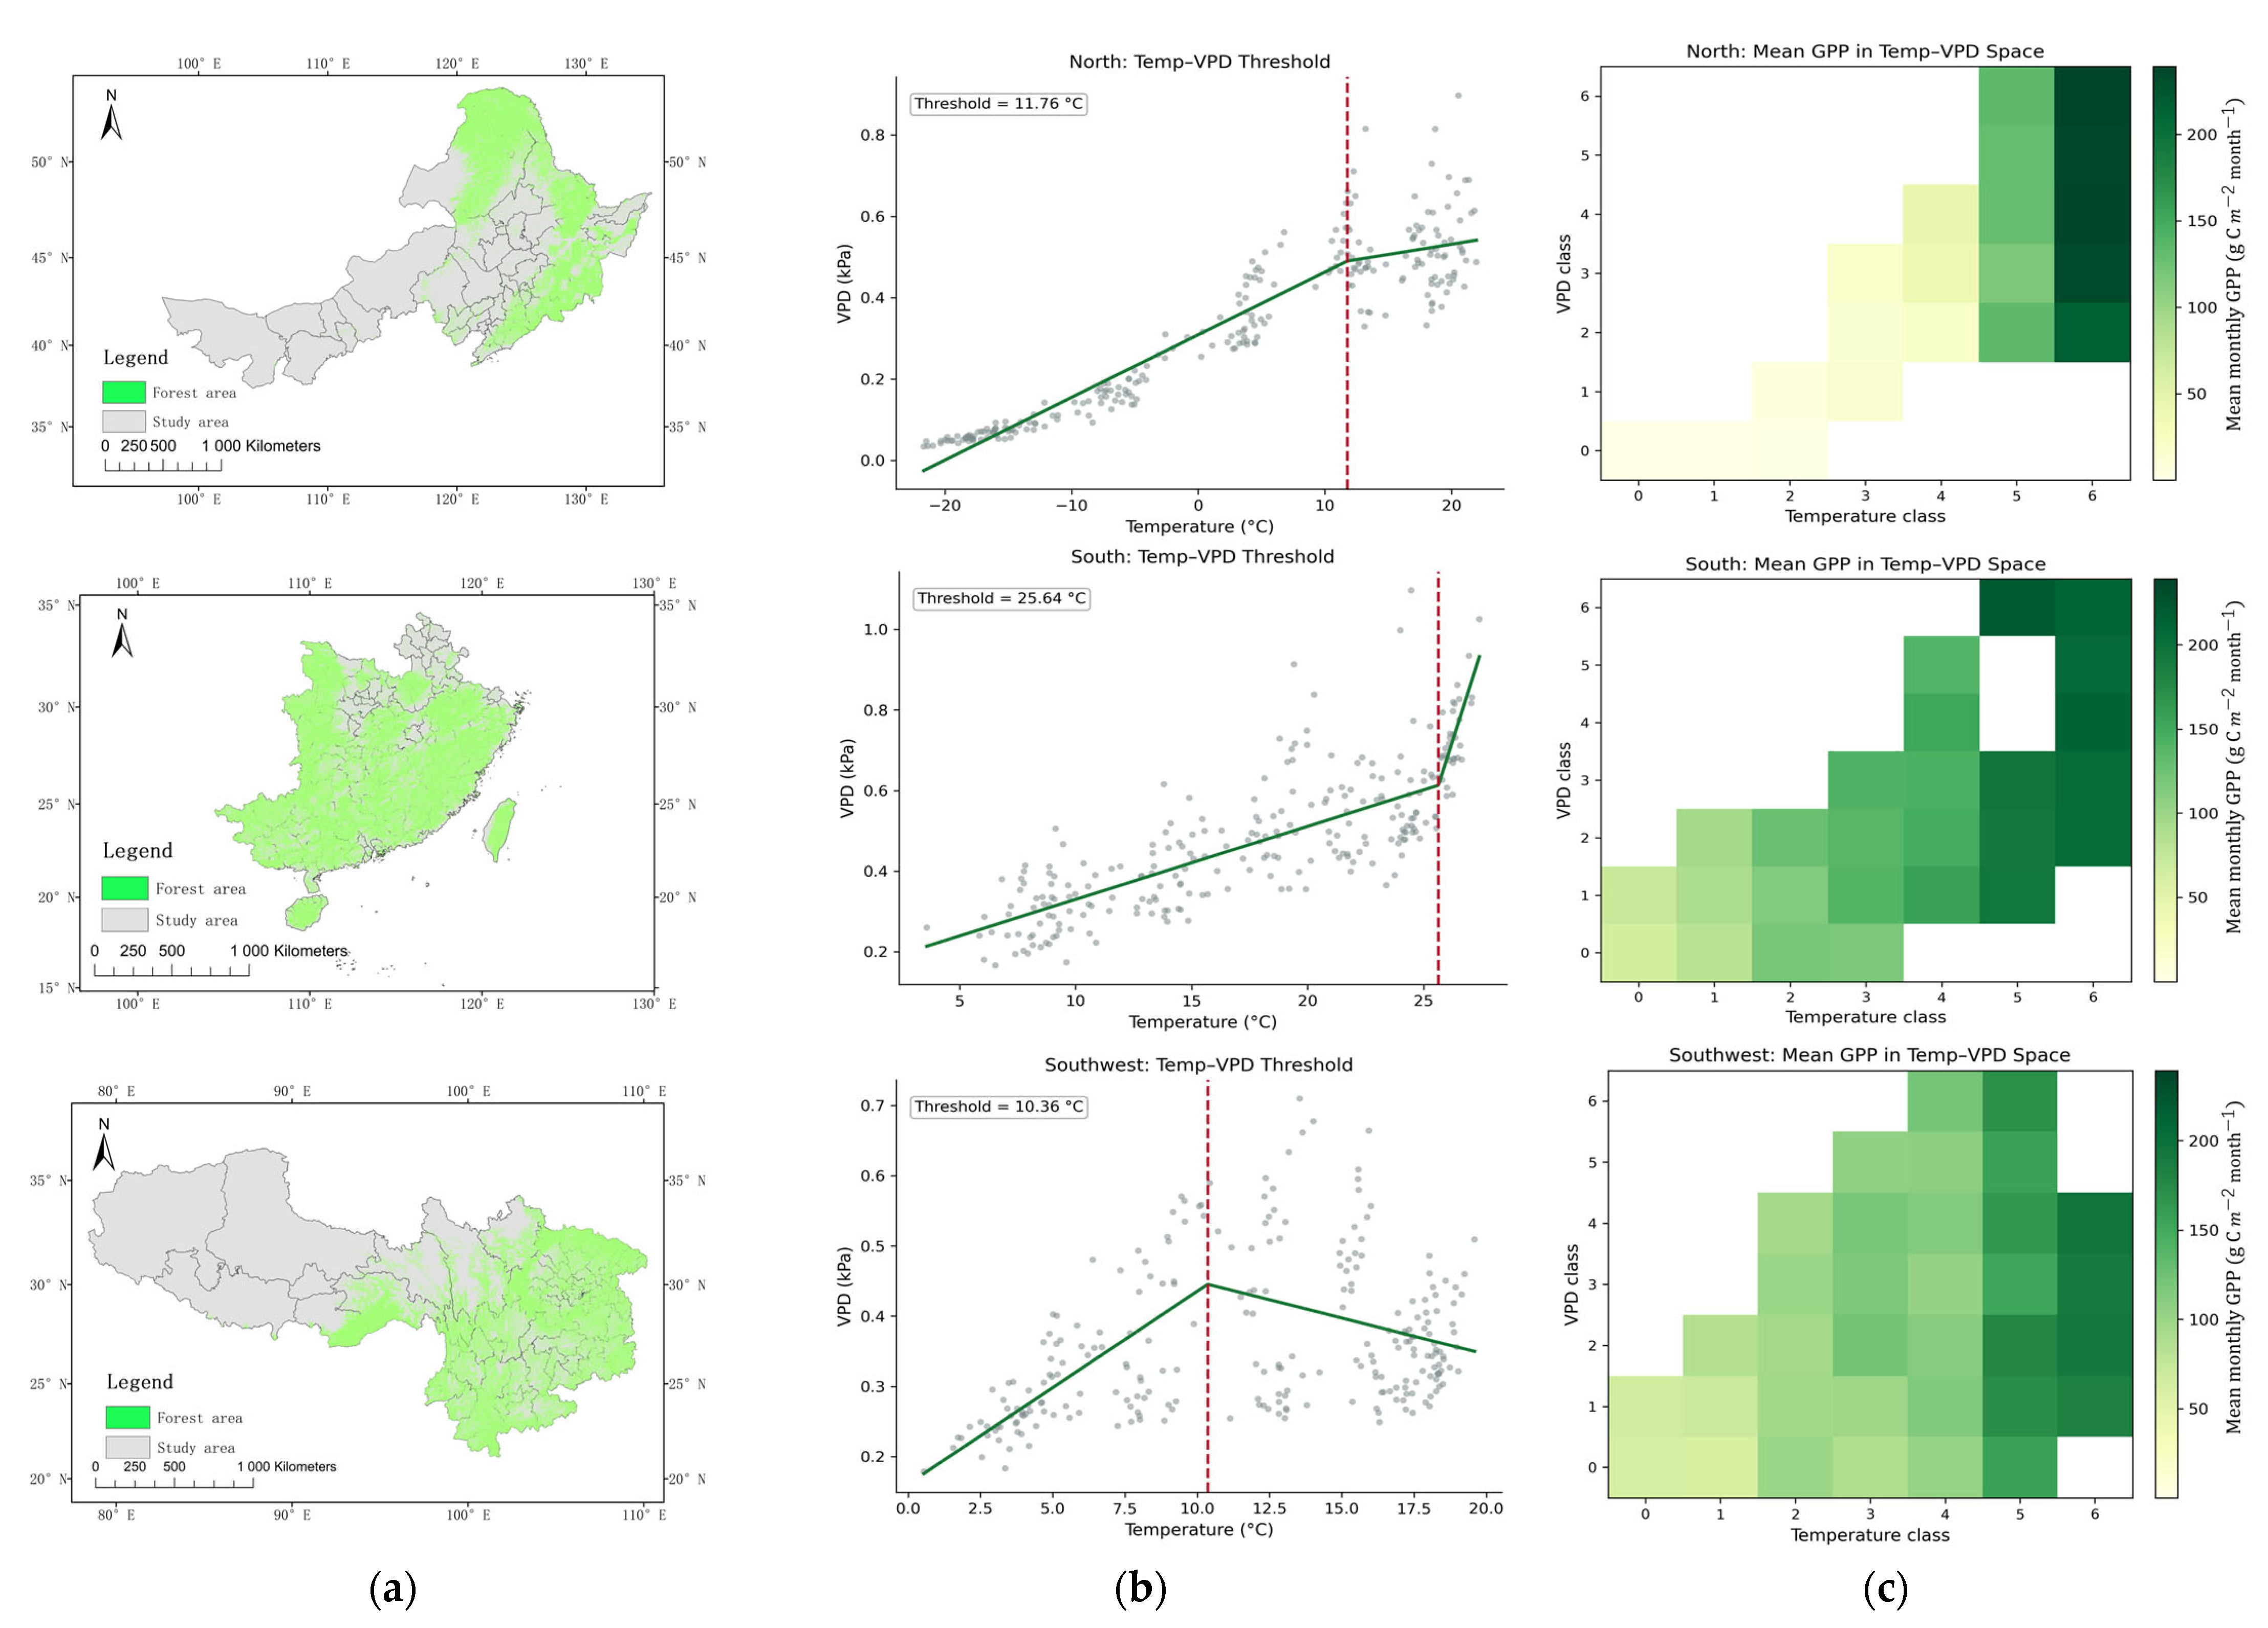

Disclaimer/Publisher’s Note: The statements, opinions and data contained in all publications are solely those of the individual author(s) and contributor(s) and not of MDPI and/or the editor(s). MDPI and/or the editor(s) disclaim responsibility for any injury to people or property resulting from any ideas, methods, instructions or products referred to in the content. |
© 2026 by the authors. Licensee MDPI, Basel, Switzerland. This article is an open access article distributed under the terms and conditions of the Creative Commons Attribution (CC BY) license.