


Highlights
What are the main findings?
- Positive ΔNDCI anomalies are systematically concentrated in shallow marginal and inflow zones across all four freshwater systems, identifying littoral areas as primary hotspots for eutrophication-related optical signals regardless of climatic setting, while ΔNDTI patterns vary by system.
- A nominally significant warming trend was detected only at Egirdir Lake (JJA LST: +0.170 °C yr−1, Mann–Kendall τ = 0.53, p = 0.029), interpreted cautiously as a physically plausible signal consistent with regional climate trends, while no significant monotonic trends were identified in NDCI or NDTI across any system.
What are the implications of the main findings?
- The proposed multi-indicator Δ-mask framework offers a scalable, cost-effective approach for satellite-based water-quality-related optical surveillance in data-scarce environments without requiring concurrent in situ measurements.
- Integrating satellite-based chlorophyll-a-related, turbidity-related, and thermal optical monitoring into national water management frameworks—such as Türkiye’s National Water Plan (2026–2036)—enables anticipatory governance and early warning against eutrophication-related optical deterioration.
Abstract
This study presents a multi-indicator remote sensing framework for assessing satellite-derived water-quality-related and trophic-state-related dynamics across four freshwater systems in Türkiye Egirdir Lake, Sapanca Lake, Catalan Dam, and Yuvacik Dam between the baseline (2015–2018) and recent (2023–2025) periods. Rather than providing a regulatory or use-specific satellite-based assessment of water-quality-related indicators, the study evaluates optically and thermally detectable surface water indicators derived from Sentinel-2 MSI and Landsat 8/9 imagery processed in Google Earth Engine. The Normalized Difference Chlorophyll Index (NDCI), the Normalized Difference Turbidity Index (NDTI), and land surface temperature (LST, applied to water surfaces) were used to detect change patterns through period-mean difference mapping (Δ-mask) and interannual time series analysis. Results reveal distinct spatial and temporal dynamics broadly consistent with the interplay of climatic, hydrological, and anthropogenic drivers. In the southern Mediterranean systems, positive ΔNDCI anomalies in littoral and inflow zones were associated with increasing summer LST, with Egirdir Lake exhibiting a statistically significant warming trend of +0.170 °C yr−1 (Mann–Kendall τ = 0.53, p = 0.029), interpreted cautiously as a physically plausible signal consistent with regional climate trends, suggesting elevated thermally mediated eutrophication-related optical risk. In the northern Marmara systems, satellite-observed patterns were more strongly associated with anthropogenic nutrient loading and morphological constraints, with turbidity-related optical increases concentrated in western and marginal zones despite relatively stable thermal conditions. As concurrent in situ measurements were unavailable, cross-sensor consistency checks and literature-based benchmarking were applied as alternative validation strategies. Across all four systems, positive ΔNDCI anomalies were systematically concentrated in shallow marginal and inflow zones, while ΔNDTI patterns varied by system, underscoring the role of littoral dynamics as early indicators of optically detectable water-quality deterioration and trophic-state-related change. The proposed framework offers a scalable, cost-effective approach for freshwater quality surveillance in data-scarce environments and provides direct support for integrated water resource management under Türkiye’s National Water Plan (2026–2036).
1. Introduction
Climate change has profoundly altered global environmental, social, and economic systems, posing increasing challenges for water-dependent sectors through intensified warming, shifting precipitation regimes, and rising evapotranspiration rates [1,2,3,4]. These changes reduce freshwater availability and intensify competition among water users, particularly in semi-arid regions such as Türkiye, where anthropogenic pressures further exacerbate climate-induced water scarcity [5,6]. Consequently, the resilience of agriculture, ecosystems, and industrial production is increasingly threatened, highlighting the urgent need for integrated and adaptive water management strategies [7,8]. In aquatic ecosystems, these pressures frequently manifest through water quality degradation, eutrophication, and harmful algal bloom formation [9,10].
Effective assessment of aquatic ecosystem degradation requires distinguishing between two complementary but interconnected frameworks: water quality assessment, which evaluates the suitability of water resources for specific uses based on physical, chemical, and bacteriological parameters [11,12,13,14], and trophic state assessment, which characterises nutrient enrichment and biological productivity within aquatic systems [15]. In practice, satellite-derived optical indicators such as the Normalized Difference Chlorophyll Index (NDCI), the Normalized Difference Turbidity Index (NDTI), and land surface temperature (LST, here applied to water surfaces) provide effective proxies for both frameworks simultaneously. Among these, chlorophyll-a (Chl-a) serves as an indicator of phytoplankton-related optical signals and trophic status [16], while turbidity reflects suspended particulate dynamics affecting light penetration, primary productivity, and habitat quality [17,18]. LST further regulates thermal stratification, oxygen solubility, evaporation, and biogeochemical cycling processes within aquatic systems [19,20]. The combined evaluation of these parameters therefore provides a more holistic perspective on aquatic ecosystem functioning and vulnerability under changing climatic and hydrological conditions [21,22,23,24].
Traditionally, these indicators have been quantified through field campaigns and laboratory analyses, approaches that are labour-intensive, costly, and often limited in spatial and temporal coverage [25]. The increasing demand for continuous and spatially extensive inland water monitoring has consequently made remote sensing an indispensable environmental observation tool [26]. Optical sensors such as Sentinel-2 provide high-spatial-resolution (10–20 m) imagery with red-edge bands and are particularly effective for detecting chlorophyll-a-related optical signals in lakes and reservoirs [27]. Similarly, thermal sensors onboard Landsat platforms enable LST retrieval, offering important insights into thermal stratification, evaporation dynamics, and aquatic metabolism. Spectral indices such as NDTI, derived from red and green reflectance bands, have also been widely used to characterise turbidity-related optical dynamics and suspended sediment variability [28].
Remote sensing approaches provide substantial advantages over conventional ground-based monitoring by enabling consistent, repetitive, and large-scale assessment of water stress dynamics [29,30,31,32]. NDCI offers a robust proxy for chlorophyll-a-related optical responses and phytoplankton productivity [21,33], whereas NDTI reflects suspended sediment-related optical signals and turbidity variations linked to hydrological variability and anthropogenic inputs [34,35]. LST further quantifies surface energy exchange and heat accumulation processes associated with evaporation and water loss [36,37]. Beyond water-quality-related applications, Earth observation technologies have also been widely applied in ecological and hydrological studies, including ecological interaction analysis [38], precipitation mapping [39], hydrological model integration [40], flood mapping [41], reservoir monitoring [42], soil moisture assessment [43,44], water storage analysis [45], and drought monitoring [30]. Collectively, these satellite-based approaches provide an integrated, spatially explicit, and cost-effective framework for assessing water-quality-related and trophic-state optical dynamics across diverse hydroclimatic regions [28,32].
In the scientific literature, NDCI, based on the reflectance difference between the red (665 nm) and red-edge (705 nm) bands has emerged as one of the most reliable indicators for chlorophyll-a-related optical signal estimation in inland waters, with previous studies demonstrating strong correlations with in situ measurements often exceeding 90% accuracy [21,27,46]. Similarly, NDTI has been widely used to characterise spatial variability in suspended sediment-related optical signals and water clarity [22,28], while Landsat-derived LST products have been extensively validated for hydrological and ecological applications [47,48]. Despite these advances, important methodological limitations remain in the current literature. Most previous studies have focused primarily on static assessments, with limited attention given to detecting subtle temporal changes in relatively high-quality inland water systems where absolute index values often remain within similar trophic or turbidity classes. Under such conditions, emerging ecological shifts may remain undetected using conventional classification-based approaches.
Against this background, this study investigates four contrasting freshwater systems in Türkiye, namely Catalan Dam, Yuvacik Dam, Egirdir Lake, and Sapanca Lake, representing humid northern Marmara and semi-arid southern Mediterranean hydroclimatic regimes. Sentinel-2-derived NDCI and NDTI indices were integrated with Landsat 8/9-derived LST observations within a pixel-based Δ-mask change detection framework to quantify differences between a baseline period (2015–2018) and a recent period (2023–2025). By focusing on ΔIndex dynamics rather than absolute values alone, the study enables the detection of subtle but ecologically meaningful changes in optical signals that may remain obscured under conventional threshold- or classification-based approaches.
By jointly analysing chlorophyll-a-related, turbidity-related, and thermal optical dynamics across contrasting hydroclimatic regions, this study provides new insights into the vulnerability and resilience of inland water systems under changing environmental conditions. The simultaneous integration of NDCI, NDTI, and LST within a unified multi-temporal, pixel-based Δ-mask change detection framework represents a methodological advancement over conventional single-index or single-site approaches. This framework enables the identification of subtle yet spatially explicit variations in water-quality-related and trophic-state optical signals, even within relatively high-quality aquatic systems. Furthermore, the additional application of Mann–Kendall trend analysis and Sen’s slope estimation provides a dual-scale analytical perspective capable of capturing both long-term directional tendencies and short-term spatial anomalies within the same methodological framework. Collectively, these approaches contribute to a more comprehensive understanding of how climatic, hydrological, and anthropogenic drivers interact to shape water-quality-related optical dynamics, with direct implications for sustainable water resource management and targeted strategies aimed at mitigating eutrophication-related optical risks under Türkiye’s National Water Plan (2026–2036).
2. Materials and Methods
2.1. Study Area
This study focuses on four major freshwater systems in Türkiye, namely Catalan Dam, Yuvacik Dam, Egirdir Lake, and Sapanca Lake, strategically selected to represent contrasting climatic, hydrological, and anthropogenic environments. Distributed across the Mediterranean, Marmara, and Lakes District regions, these systems encompass a broad spectrum of hydroclimatic conditions ranging from humid temperate environments to semi-arid continental regimes. Their combined selection therefore provides an appropriate framework for evaluating spatially variable water-quality-related and trophic-state optical dynamics under differing environmental pressures. Each freshwater system constitutes a critical regional water resource supporting multiple socio-economic functions, including municipal water supply, agricultural irrigation, industrial activities, and ecosystem services. Despite these shared functions, the four systems are exposed to distinct regional stressors shaped by local climatic conditions and land-use characteristics. In the heavily urbanised Marmara Basin, Yuvacik Dam and Sapanca Lake experience substantial anthropogenic pressures associated with industrialisation, urban expansion, wastewater inputs, and surface runoff. In contrast, the Mediterranean and Lakes District systems, represented by Catalan Dam and Egirdir Lake, are increasingly influenced by diffuse agricultural runoff, irrigation-driven nutrient loading, intensified evaporation, and long-term water level decline associated with climate variability and water abstraction pressures. The simultaneous assessment of these contrasting freshwater systems enables a more comprehensive understanding of how climatic forcing, hydrological variability, and anthropogenic stressors interact to influence inland water-quality-related optical dynamics across different hydroclimatic regions of Türkiye. The geographical locations of the four study sites are presented in Figure 1, while their Köppen–Geiger climatic classifications and general climatic characteristics are summarised in Table 1.
Figure 1.
Geographical locations of the four study sites within Türkiye: Catalan Dam, Egirdir Lake, Sapanca Lake, and Yuvacık Dam.
Table 1.
Köppen–Geiger climate classification and key meteorological characteristics of the four study sites [49].
The four study systems represent two climatically distinct regions of Türkiye. Catalan Dam and Egirdir Lake are located within the Mediterranean climatic domain (Köppen: Csa), characterised by hot, dry summers and mild, wet winters associated with the seasonal migration of subtropical high-pressure systems. Mean annual temperatures range from 12.2 °C at Egirdir Lake (915 m a.s.l.) to 18.4 °C at Catalan Dam, while precipitation is concentrated predominantly between November and March. In contrast, Sapanca Lake and Yuvacik Dam are situated within the humid temperate climatic domain (Köppen: Cfa) of the eastern Marmara region, where precipitation occurs throughout the year under the influence of moisture-bearing air masses originating from the Black Sea and the Sea of Marmara. Annual precipitation in these northern systems ranges between approximately 720 mm and 1039 mm.
At the synoptic scale, both climatic regions are influenced by large-scale atmospheric oscillations, particularly the North Atlantic Oscillation (NAO) and the Mediterranean Oscillation (MO), which strongly modulate interannual precipitation variability, thermal stratification, runoff generation, and inflow dynamics. Negative NAO phases generally enhance winter precipitation and inflow conditions across the study regions, whereas positive phases intensify drought severity, reduce dilution capacity, and increase nutrient residence times within inland waters. These teleconnection-driven climatic fluctuations contribute substantially to interannual variability and therefore represent an important consideration when interpreting satellite-derived water-quality-related optical dynamics throughout the study period.
Catalan Dam, constructed between 1982 and 1997 on the Seyhan River, is a zoned earth-fill multi-purpose reservoir located approximately 22 km north of Adana Province in southern Türkiye [50]. With a structural height of 70 m, a surface area of 81.86 km2, and a total storage capacity of approximately 2.12 billion m3, the reservoir constitutes one of the most important hydrological infrastructures within the region. The dam provides flood protection, supports hydroelectric energy generation through an installed capacity of 169 MW producing approximately 596 GWh annually, and supplies the majority of the municipal drinking water for Adana Province, which hosts nearly 1.84 million inhabitants [50]. The reservoir is situated adjacent to the Çukurova Plain, one of Türkiye’s most productive agricultural regions, where intensive irrigation and fertiliser application increase nutrient inflows and turbidity risks. Surface irrigation practices dominating the region are associated with substantial water losses and diffuse nutrient transport, contributing to elevated inflow-zone eutrophication potential [50]. Combined with prolonged dry summers and high evaporation rates characteristic of the Mediterranean climate, these anthropogenic and climatic pressures increase the vulnerability of the reservoir to chlorophyll-a-related optical variability, turbidity fluctuations, and thermal stress [50,51].
Yuvacik Dam, located in the Başiskele district of Kocaeli Province at the foothills of the Samanlı Mountains, represents one of the principal drinking-water reservoirs of northwestern Türkiye [52]. The reservoir encompasses a catchment area of approximately 258 km2 and is primarily fed by the Kirazdere, Kazandere, and Serindere streams [53]. With a useful storage capacity of approximately 51.1 million m3 and an annual treated water capacity of 142 million m3, Yuvacik serves as the main potable water source for Kocaeli Province, a highly industrialised and densely populated region with approximately 2.10 million inhabitants [48,52]. Climatically, the catchment is characterised by humid temperate conditions with annual precipitation approaching 1039 mm, the highest among the four study systems, concentrated mainly during autumn and winter [52]. Despite these favourable hydrological conditions, rapid urbanisation, industrial expansion, wastewater discharge, and increasing freshwater demand place substantial pressure on reservoir water quality. Elevated nutrient and pollutant inputs associated with anthropogenic activities increase the susceptibility of the system to eutrophication and harmful algal bloom formation [47]. Inadequate wastewater treatment infrastructure and high freshwater withdrawal rates further reduce the resilience of the reservoir under intensifying environmental stress [53]. Consequently, maintaining the ecological integrity and water quality of Yuvacik Dam remains critically important for regional water security and public health protection [52].
Sapanca Lake, situated within a tectonic depression between Kocaeli and Sakarya Provinces, is a natural freshwater lake of major ecological and socio-economic importance within the Marmara Basin [54]. The lake covers an area of approximately 45–47 km2, extending nearly 16 km in length and 5 km in width, with an average depth of 36 m and a maximum depth reaching 61 m. The basin experiences humid temperate climatic conditions characterised by mean annual temperatures of approximately 14.3 °C and annual precipitation ranging between 720 and 806 mm, distributed relatively evenly throughout the year with a winter maximum [54,55]. Hydrologically, the lake receives inflow from tributaries including the Karacay and Kurtköy streams and discharges into the Sakarya River through the Çark Stream. In addition to supporting fisheries, biodiversity, and recreational activities, Sapanca Lake functions as a major drinking-water source for both Kocaeli and Sakarya Provinces [54]. Its strategic importance has increased further during climate-induced drought periods. For example, severe drought conditions during 2025 reduced storage levels in the nearby Yuvacik Dam to nearly 2% capacity, necessitating sustained emergency water transfers from Sapanca Lake to Kocaeli’s municipal water network until early 2026 [52]. Simultaneously, rapid industrialisation, urban expansion, and land-use change within the catchment intensify pollutant loading and nutrient enrichment pressures [55]. High water distribution losses and insufficient wastewater recovery infrastructure further exacerbate water-quality-related optical degradation and eutrophication-related risk [54,55]. These interacting climatic and anthropogenic pressures highlight the necessity of continuous environmental monitoring to preserve the ecological stability and water-supply function of Sapanca Lake.
Egirdir Lake, located in Isparta Province within Türkiye’s Lakes District, is a tectonic-karstic freshwater lake recognised as the country’s fourth-largest lake and second-largest freshwater reserve [56]. The lake covers approximately 482–517 km2 and consists of two interconnected sub-basins, Hoyran in the north and Egirdir in the south [57]. With an average depth of approximately 8–9 m and a maximum depth of 14 m, the lake is relatively shallow compared to the other study systems and is situated at an elevation of approximately 915 m above sea level. Climatically, the basin experiences a Mediterranean regime with continental influence (Köppen: Csa), characterised by dry summers, wet winters, and mean annual temperatures of approximately 12.2 °C [56]. Egirdir Lake plays a central role in regional water security by supplying drinking water to Isparta Province, which hosts approximately 449,777 inhabitants [49], while simultaneously supporting extensive agricultural production, including large-scale apple and peach orchards irrigating nearly 45,000 hectares of farmland [56]. Ecologically, the lake also constitutes an important wetland and bird habitat. However, intensive agricultural activities surrounding the lake generate substantial diffuse pollution through fertiliser and pesticide runoff [58]. Surface irrigation practices associated with low irrigation efficiency contribute additional nutrient loading and inflow-zone eutrophication risk [58]. Furthermore, the lake has experienced substantial long-term water level decline associated with reduced precipitation, prolonged drought conditions, and unsustainable groundwater abstraction for irrigation purposes [56]. The combination of shallow morphology, extensive littoral zones, semi-arid climatic conditions, and increasing anthropogenic pressure makes Egirdir Lake particularly vulnerable to evaporation losses, sediment resuspension, seasonal algal dynamics, and climate-driven limnological variability.
2.2. Satellite Datasets and Processing
The dataset used in this study is based on multispectral and thermal satellite imagery derived from the Sentinel-2 and Landsat 8/9 missions, processed within the Google Earth Engine (GEE) cloud computing environment. Imagery covering Catalan Dam, Yuvacik Dam, Sapanca Lake, and Egirdir Lake was analysed for the 2015–2025 period, with particular emphasis placed on two comparison intervals: a baseline period (2015–2018) and a recent period (2023–2025). This temporal framework enabled multi-temporal change detection across contrasting hydroclimatic regions of Türkiye.
To ensure data quality and inter-period comparability, cloud contamination was minimised through scene-level filtering using a maximum cloud cover threshold of 10% applied to image metadata. Additional pixel-level masking was performed using QA60 band bitwise flags to remove cirrus and opaque cloud pixels. Sentinel-2 Level-2A surface reflectance products and Landsat Collection 2 Level-2 datasets were selected to maintain atmospheric correction consistency across the analysis workflow [59,60]. All satellite scenes were spatially clipped to the defined areas of interest (AOIs) within GEE, and seasonal median composites were generated for each analysis period to minimise residual cloud contamination, atmospheric noise, and sensor-related anomalies [61].
Sentinel-2 MSI-derived indices (NDCI and NDTI) were processed and exported at 20 m spatial resolution, corresponding to the native spatial resolution of the red-edge bands used in index calculations. Landsat 8/9-derived land surface temperature (LST) products were processed at the native 30 m thermal band resolution. The two satellite systems were applied to complementary but distinct analytical objectives: Sentinel-2 for optical water-quality-related index retrieval and Landsat for thermal analysis. Accordingly, the datasets were not spatially co-registered at the individual pixel level. Instead, spatial aggregation to the water-body scale was performed independently for each dataset using polygon-based mean reduction within GEE, thereby minimising the practical influence of spatial resolution mismatch on lake-scale summary statistics.
To ensure that only stable water surfaces were included in the analysis, a permanent water mask derived from the JRC Global Surface Water dataset (occurrence > 5%) was consistently applied across both Sentinel-2 and Landsat datasets [62]. To verify that marginal-zone optical anomalies were not artefacts associated with mixed shoreline pixels, an additional sensitivity analysis was conducted for Egirdir Lake by comparing ΔNDCI maps generated using JRC occurrence thresholds of >5%, >25%, and >50%. The resulting spatial anomaly patterns remained nearly identical across all three thresholds, demonstrating the robustness of the water-masking strategy. Nevertheless, it is acknowledged that fixed occurrence thresholds may still include transitional shoreline pixels exposed during low-water-level conditions, particularly in morphologically dynamic systems such as Egirdir Lake. The use of seasonal median composites rather than individual scenes substantially reduces the influence of such pixels by suppressing transient non-aquatic spectral signals during the aggregation process. A summary of the satellite datasets, their spatial and temporal resolutions, and corresponding data providers is presented in Table 2.
Table 2.
Data sets used in the study.
The annual number of available Sentinel-2 JJA images after cloud filtering (<10%) for each study site over the 2015–2025 period is presented in Figure 2. Image availability increases substantially from 2017 onwards, reflecting the launch of Sentinel-2B in March 2017 and the resulting reduction in revisit time from 10 to 5 days. The notably low image counts in 2015 and 2016 reflect the limited operational period of Sentinel-2A prior to full constellation deployment.
Figure 2.
Annual number of available Sentinel-2 JJA images after cloud filtering (<10%) for each study site (2015–2025). The increase from 2017 onwards reflects the launch of Sentinel-2B and the resulting reduction in revisit time from 10 to 5 days.
Data preprocessing and parameter settings: All Sentinel-2 and Landsat 8/9 scenes were processed and filtered within the GEE environment. To delineate water bodies while minimizing contamination from mixed land–water boundary pixels, a maximum cloud cover threshold of 10% and a strict Normalized Difference Water Index (NDWI = (Green − NIR)/(Green + NIR)) threshold of >0.00 were applied, where positive NDWI values indicate open water surfaces and values equal to or less than zero correspond to non-water surfaces [58]. While no spatial buffer was explicitly implemented, sensitivity testing with alternative NDWI thresholds (0.02–0.05) confirmed no significant differences in the extracted spatiotemporal patterns of NDCI, NDTI, or LST. Thermal and spectral composites were generated using a median reducer to effectively eliminate the influence of residual atmospheric noise, cloud shadows, and sensor anomalies, with mean values concurrently evaluated to ensure statistical consistency. Crucially, in the absence of concurrent in situ validation data, all derived indices were interpreted within a relative spatial and temporal framework. This approach emphasizes seasonal dynamics and interannual variability rather than absolute physical magnitudes, aligning with established methodologies in limnological remote sensing [21,22,63].
Sentinel-2 Multispectral Instrument (MSI): Optical imagery from the Sentinel-2A and Sentinel-2B satellites was used to estimate chlorophyll-a-related optical signals, turbidity-related optical dynamics, and open-water extent. Sentinel-2 MSI consists of 13 spectral bands spanning the visible, red-edge, and near-infrared regions, which are particularly suitable for aquatic environmental applications. The spectral bands used in this study are summarised in Table 3.
Table 3.
Sentinel-2 MSI spectral bands used for index calculations.
Among these, Band 4 (Red) and Band 5 (Red Edge 1) were used to calculate the NDCI, which serves as a proxy for chlorophyll-a-related optical signals [21]. Similarly, Band 4 (Red) and Band 3 (Green) were used to derive the NDTI, a widely applied index for characterising turbidity-related optical dynamics associated with suspended sediment and algal variability [64]. To delineate water bodies and minimise mixed land–water boundary contamination, the NDWI derived from Band 3 (Green) and Band 8 (NIR) was applied for robust water masking [63]. All reflectance values were scaled to surface reflectance units (0–1) using a multiplication factor of 0.0001. To ensure temporal consistency throughout the 2015–2025 analysis period, a −1000 quantification value offset was additionally applied to harmonise Sentinel-2 scenes processed after January 2022 under Processing Baseline 04.00. Cloud and cirrus contamination were removed using QA60 bitmask flags, and all scenes were subsequently clipped to the boundaries of each respective water body.
Thermal information was derived from Landsat 8 and Landsat 9 (OLI/TIRS Collection 2 Level-2) products, which provide 30 m spatial resolution and a 16-day revisit interval. The Thermal Infrared Sensor (TIRS) Band ST_B10 (10.6–11.2 μm) was used to retrieve land surface temperature (LST) values. Landsat Collection 2 Level-2 Surface Temperature products are generated from atmospherically corrected thermal infrared data and incorporate surface emissivity corrections derived from the ASTER Global Emissivity Database (GED) [65]. Therefore, no additional emissivity correction or brightness temperature conversion based on Planck’s Law was required. LST values were converted to degrees Celsius (°C) using the standard USGS scaling Equation (1);
To remove residual noise, cloud shadow anomalies, and mixed land–water boundary pixels, all pixels falling outside a physically realistic thermodynamic range for regional surface waters (−5 °C to 45 °C) were explicitly masked. Finally, all thermal data were spatially aligned and clipped to the exact areas of interest (AOIs) defined by the optical datasets to ensure strict spatial consistency for inter-comparison. The spectral indices and thermal parameters applied in this study, along with their mathematical expressions and primary reference sources, are summarized in Table 4.
Table 4.
Remote sensing indices used in the study.
The ecological meaning of derived NDCI and NDTI values was assessed using literature-based interpretive thresholds [21,66], summarised in Table 5 and Table 6. As no concurrent in situ chlorophyll-a, turbidity, or suspended sediment measurements were available, these thresholds were applied as indicative intervals for relative water-quality-related optical interpretation rather than direct quantitative retrievals or field-equivalent values.
Table 5.
Literature-based interpretive classification of NDCI values.
Table 6.
Literature-based interpretive classification of NDTI values.
It should be noted that the summer mean NDTI values observed across the four study systems (ranging from −0.30 to −0.44) fall substantially below the ‘very clear’ class boundary, reflecting the optically clear nature of these freshwater bodies. Within such negative NDTI ranges, the literature-based classification thresholds serve as indicative reference intervals rather than directly applicable calibration targets. Small but consistent ΔIndex changes of 0.01–0.03 are interpreted within a relative framework as directional optical shifts rather than absolute turbidity measurements, consistent with the approach described in Section 2.4.
2.3. Methodology
Chlorophyll-a-related optical signals, turbidity-related optical dynamics, and surface water temperature were analysed across four freshwater systems in Türkiye, namely Catalan Dam, Yuvacik Dam, Sapanca Lake, and Egirdir Lake, using satellite-derived indices designed to capture variations in phytoplankton-related spectral responses, suspended particulate optical properties, and surface thermal conditions throughout the 2015–2025 study period. Sentinel-2 MSI surface reflectance imagery (10–20 m spatial resolution; 5-day revisit interval) was used to calculate the Normalized Difference Chlorophyll Index (NDCI) as a proxy for chlorophyll-a-related optical signals. Turbidity-related optical dynamics were represented using the Normalized Difference Turbidity Index (NDTI), derived from red and green reflectance bands. In parallel, Landsat 8/9 Collection 2 Level-2 thermal imagery was used to derive land surface temperature (LST, here applied to water surfaces) values from the ST_B10 thermal band, which were subsequently converted to degrees Celsius using standard USGS scaling coefficients.
To ensure that all analyses were restricted exclusively to open-water surfaces, the Normalized Difference Water Index (NDWI) was applied for water-body delineation and removal of mixed land–water boundary pixels. All satellite scenes were spatially clipped to predefined lake and reservoir boundaries (AOIs) and processed within the Google Earth Engine (GEE) environment. Sentinel-2 imagery was filtered to retain only scenes with cloud cover below 10%, and seasonal median composites were generated to minimise atmospheric contamination, residual cloud effects, and temporal outliers. Landsat thermal datasets were similarly aggregated using median-based compositing procedures to reduce short-term variability and minimise potential thermal data gaps. The overall methodological workflow, including satellite data acquisition, preprocessing, index calculation, spatial analysis, and interpretation procedures, is illustrated in Figure 3. This integrated framework enabled the generation of spatial distribution maps and pixel-based statistics designed to: (i) characterise spatial heterogeneity in optical and thermal conditions within each freshwater system; (ii) evaluate hydroclimatic contrasts between the Marmara systems (Sapanca Lake and Yuvacik Dam) and the Mediterranean/Lakes District systems (Catalan Dam and Egirdir Lake); and (iii) support the interpretation of eutrophication-related optical dynamics under varying climatic, hydrological, and anthropogenic pressures.
Figure 3.
Multi-indicator remote sensing methodology flowchart.
2.4. Temporal Aggregation
To capture both seasonal variability and long-term temporal dynamics, the remote sensing indices derived from Sentinel-2 and Landsat 8/9 datasets were aggregated at annual and seasonal scales for each freshwater system. Four climatological seasons were defined as follows: DJF (December–January–February), MAM (March–April–May), JJA (June–July–August), and SON (September–October–November). Within each temporal interval, all valid low-cloud scenes were composited using a median reducer, followed by spatial averaging across the area of interest (AOI) using the reduceRegion(mean) function within the Google Earth Engine (GEE) environment. This aggregation strategy minimises the influence of residual cloud contamination, atmospheric artefacts, shoreline edge effects, and short-term sensor anomalies, thereby improving spatial and temporal consistency in the derived optical and thermal parameters. Seasonal and annual mean values of chlorophyll-a-related optical signals (NDCI), turbidity-related optical dynamics (NDTI), and land surface temperature (LST; here applied to water surfaces following standard remote sensing terminology) were subsequently exported as CSV datasets for statistical evaluation and graphical analysis. These aggregated datasets formed the basis for temporal trend assessment, inter-lake comparison, and the interpretation of spatiotemporal variability presented in the Section 3.
To evaluate long-term changes in optical and thermal conditions, change detection analysis was performed by comparing multi-temporal composite maps generated for a baseline period (2015–2018) and a recent period (2023–2025). Continuous change detection approaches based on temporal spectral dynamics have been shown to outperform conventional post-classification methods because classification-related uncertainties may accumulate when independently classified maps are compared [61]. Accordingly, temporal variations were quantified using a change index (ΔIndex), calculated as the difference between the recent-period and baseline-period composite maps, as expressed in Equation (2);
where Index_recent represents the median composite of the 2023–2025 period and Index_baseline represents the median composite of the 2015–2018 period. To interpret the direction and magnitude of change, ΔIndex values were classified into three categories, decrease, stable, and increase, based on the predefined threshold values in Table 7.
Table 7.
Interpretation of change classes used to evaluate temporal variations in spectral indices.
3. Results
3.1. Interannual Variability and Period-Based Comparison of Summer Mean NDCI and NDTI
Summer mean NDCI and NDTI values were summarised for both the baseline period (2015–2018) and the recent period (2023–2025) to evaluate temporal shifts in chlorophyll-related and turbidity-related optical dynamics across the four freshwater systems. In addition to period-based averages, the years corresponding to the minimum and maximum index values were identified for each lake and reservoir to characterise interannual variability. Summary statistics for summer mean NDCI and NDTI values are presented in Table 8a,b, respectively.
Table 8.
(a) Period-based summary of summer mean NDCI values. (b) Period-based summary of summer mean NDTI values.
Table 8a,b demonstrate that both the magnitude and direction of temporal change in summer mean NDCI and NDTI varied among the four freshwater systems. Egirdir Lake exhibited modest positive shifts in both NDCI (+0.009) and NDTI (+0.034), indicating slightly elevated chlorophyll-related and turbidity-related optical signals during the recent period. Nevertheless, absolute index magnitudes remained largely within the optically clear to low-productivity range. Similarly, Sapanca Lake showed small positive increases in both indices (+0.002 NDCI and +0.012 NDTI), suggesting moderate intensification of optical responses, potentially associated with increasing anthropogenic nutrient inputs and catchment pressures.
Among all study systems, Catalan Dam exhibited the most pronounced increase in NDCI (+0.029), reflecting a shift toward less negative chlorophyll-related optical conditions. This pattern is consistent with the spatial ΔNDCI anomalies identified in the previous analyses and may indicate increasing thermally driven eutrophication-related optical responses within inflow and marginal reservoir zones. In contrast, NDTI values at Catalan Dam remained comparatively stable, with only a marginal positive shift (+0.003), suggesting limited long-term change in turbidity-related optical dynamics.
Yuvacik Dam was the only system exhibiting a decline in summer mean NDCI (−0.011), accompanied by a substantial decrease in NDTI (−0.035). These patterns indicate reduced chlorophyll-related and turbidity-related optical signals during the recent period. The observed optical behaviour may reflect the combined influence of hydromorphological constraints, altered hydraulic residence conditions, and changing inflow dynamics within the narrow reservoir morphology. The interannual variability of summer mean NDCI and NDTI values across all four freshwater systems is further illustrated in Figure 4 and Figure 5.
Figure 4.
Summer mean NDCI and NDTI time series for (a) Egirdir Lake and (b) Sapanca Lake (2015–2025). Shaded zones indicate the baseline (2015–2018) and recent (2023–2025) periods.
Figure 5.
Summer mean NDCI and NDTI time series for (a) Yuvacik Dam and (b) Catalan Dam (2015–2025). Shaded zones indicate the baseline (2015–2018) and recent (2023–2025) periods.
3.2. Multi-Temporal Change Detection of Water Quality Indicators (ΔNDCI and ΔNDTI)
The spatial distribution of ΔNDCI between the baseline (2015–2018) and recent (2023–2025) periods was examined through a comparative analysis of the four freshwater systems in Figure 6.
Figure 6.
Spatial distribution of ΔNDCI across the four study sites (2015–2018 vs. 2023–2025).
Distinct spatial patterns of chlorophyll-related optical change were observed among the study systems, reflecting the combined influence of climatic forcing, hydromorphological structure, and anthropogenic nutrient inputs. In the southern systems, Catalan Dam exhibited predominantly negative ΔNDCI values across the central reservoir body, whereas localised positive anomalies were concentrated mainly within inflow regions and shoreline margins. These positive marginal signals likely reflect spatially restricted phytoplankton-related optical responses associated with tributary-derived nutrient inputs and shallow-water thermal amplification.
Egirdir Lake displayed the strongest spatial contrast among all systems. While central open-water areas were characterised by stable or declining ΔNDCI conditions (≤−0.015), strongly positive anomalies (0.015–1.000) were concentrated within northern littoral and eastern marginal zones. This pronounced spatial dichotomy highlights the sensitivity of shallow nearshore regions to nutrient accumulation, wind-driven circulation, and localised phytoplankton-related optical dynamics.
In the northern systems, Sapanca Lake exhibited a clear north–south spatial contrast. Lower ΔNDCI values in the southern sector are interpreted as reflecting stronger hydrodynamic mixing and dilution associated with orographic precipitation inputs, whereas relatively elevated values along the northern shoreline are consistent with diffuse urban and anthropogenic nutrient loading from densely populated catchment areas. Yuvacik Dam, by contrast, displayed predominantly negative ΔNDCI conditions across the open-water reservoir surface, with positive anomalies largely restricted to shoreline margins. This spatial configuration likely reflects the influence of narrow reservoir morphology and constrained lateral mixing processes limiting widespread chlorophyll-related optical accumulation.
Despite regional climatic differences, positive ΔNDCI anomalies were consistently concentrated within shallow littoral zones, inflow regions, and nearshore margins across all four freshwater systems. This recurring spatial pattern emphasises the importance of marginal aquatic zones as primary hotspots of eutrophication-related optical variability under changing hydrological and climatic conditions.
The spatial distribution of ΔNDTI between the baseline (2015–2018) and recent (2023–2025) periods revealed turbidity-related optical dynamics that both paralleled and diverged from the chlorophyll-related patterns observed in Figure 6, indicating the influence of distinct physical and optical processes across the study systems presented in Figure 7.
Figure 7.
Spatial distribution of ΔNDTI across the four study sites (2015–2018 vs. 2023–2025).
Catalan Dam exhibited predominantly negative ΔNDTI values (≤−0.015) across most of the reservoir surface, indicating a general reduction in turbidity-related optical signals relative to the baseline period. Positive anomalies were confined primarily to shoreline margins and upstream inflow areas, suggesting localised sediment transport associated with episodic tributary inflows.
Egirdir Lake displayed the most pronounced ΔNDTI response among all study systems. In contrast to the spatially confined ΔNDCI anomalies, strongly positive ΔNDTI signals (0.015–1.000) extended across most of the lake surface, while only limited central regions retained stable or negative values. This lake-wide increase in turbidity-related optical signals suggests substantial influence from inorganic suspended matter associated with wind-induced sediment resuspension and catchment-derived sediment transport. The resulting divergence between ΔNDCI and ΔNDTI patterns indicates partial decoupling between chlorophyll-related and turbidity-related optical dynamics within the lake.
Sapanca Lake exhibited strong positive ΔNDTI anomalies across western and central sectors, whereas negative values dominated the eastern basin. This west-to-east contrast is consistent with spatially heterogeneous sediment loading linked to urbanisation intensity, tributary inflows, and anthropogenic catchment pressures concentrated along the western shoreline. Yuvacik Dam, in contrast, displayed the most spatially homogeneous ΔNDTI distribution among all systems, characterised by strongly negative values across nearly the entire reservoir surface. These conditions suggest reduced sediment-related optical activity and effective sediment retention during the recent period.
Overall, the observed turbidity-related optical dynamics appear to be broadly consistent with an interacting combination of basin morphology, catchment sediment supply, hydrological variability, and wind-induced resuspension processes. The marked divergence between ΔNDCI and ΔNDTI patterns, particularly evident in Egirdir Lake and Sapanca Lake, further highlights the importance of integrated multi-index approaches for remote sensing-based freshwater assessment, as no single optical indicator alone can fully characterise the complexity of limnological and biogeochemical dynamics within inland water systems.
3.3. Seasonal Thermal Dynamics (LST) and Their Influence on Water Quality
The seasonal and annual LST records spanning 2013–2025 reveal distinct thermal regimes across the four freshwater systems, with summer (JJA) temperatures emerging as the dominant seasonal driver of water quality variability. A period-based summary of JJA LST statistics for the baseline (2015–2018) and recent (2023–2025) periods is presented in Table 9.
Table 9.
Summary of summer (JJA) land surface temperature statistics for the baseline (2015–2018) and recent (2023–2025) periods across the four freshwater systems.
All four freshwater systems exhibited positive changes in JJA LST between the baseline and recent periods, although both the magnitude and temporal trajectory of warming varied substantially among sites (Figure 8). Catalan Dam recorded the highest absolute summer temperatures (33.4–36.9 °C) together with the strongest warming signal (+1.20 °C), reflecting the pronounced thermal forcing associated with its Mediterranean climatic setting. This warming pattern is spatially consistent with the localised positive ΔNDCI anomalies detected along shallow shoreline and inflow regions, suggesting increasing susceptibility to thermally enhanced eutrophication-related optical responses.
Figure 8.
Seasonal and annual land surface temperature dynamics across the four freshwater systems (2013–2025). Summer (JJA) values are highlighted as the primary thermal driver of water quality related optical variability. Shaded zones indicate the baseline (2015–2018) and recent (2023–2025) periods.
Egirdir Lake displayed a similarly pronounced warming signal (+1.14 °C), with peak summer temperatures reaching 27.9 °C during 2024. The observed thermal intensification corresponds temporally and spatially with the positive ΔNDCI anomalies identified within northern littoral and eastern marginal zones, supporting the interpretation that shallow-water thermal amplification may contribute to localised phytoplankton-related optical variability.
Yuvacik Dam exhibited a more moderate but still detectable increase in JJA LST (+0.75 °C), concentrated primarily within the recent analysis period. Summer temperatures reached a maximum of 32.0 °C in 2025, representing the highest value recorded for this reservoir during the study period. These warming conditions are consistent with the emergence of marginal chlorophyll-related optical anomalies identified in the ΔNDCI analysis, despite the generally negative open-water chlorophyll-related optical patterns observed across the reservoir.
In contrast, Sapanca Lake remained comparatively thermally stable throughout the study period, with only a negligible increase in JJA LST (+0.02 °C). This relative thermal stability supports the interpretation that the optical and water-quality-related dynamics observed at this site are influenced more strongly by anthropogenic nutrient loading and catchment pressures than by direct thermal forcing mechanisms.
Overall, a clear thermal contrast was identified between the southern Mediterranean systems and the northern Marmara systems. Catalan Dam and Egirdir Lake were characterised by higher absolute summer temperatures and more pronounced warming signals, whereas Sapanca Lake and Yuvacik Dam exhibited relatively lower and more stable thermal conditions. These contrasting thermal regimes provide important context for interpreting the site-specific optical dynamics identified in the ΔNDCI and ΔNDTI analyses and further demonstrate the value of integrating LST within multi-indicator remote sensing frameworks for freshwater quality monitoring and climate-related risk assessment.
3.4. Trend Analysis of Summer Water Quality Indices and Surface Temperature
To assess the direction and statistical significance of long-term changes in the remotely sensed optical and thermal indicators, the Mann–Kendall non-parametric trend test, together with Sen’s slope estimator, were applied to the complete annual summer mean time series (2015–2025; n = 10–11 observations per system) for NDCI, NDTI, and JJA LST across all four freshwater systems. Unlike the period-based comparison presented in Section 3.1, this analysis incorporated the full interannual record, thereby enabling a more robust evaluation of monotonic trend direction and temporal change magnitude throughout the entire observation period.
The Mann–Kendall test is widely used in hydrological and environmental analyses because it evaluates monotonic trends without requiring assumptions of normal data distribution, making it particularly suitable for relatively short environmental time series containing potential outliers and missing observations [67,68]. Sen’s slope estimator further provides a robust median-based estimate of the rate of temporal change per unit time [69]. The resulting trend statistics are illustrated in Figure 9 and summarised in Table 10.
Figure 9.
Mann–Kendall trend test and Sen’s slope estimates for summer mean NDCI, NDTI, and JJA LST (2015–2025).
Table 10.
Results of Mann–Kendall trend test and Sen’s slope estimator for summer mean NDCI, NDTI, and JJA LST across the four freshwater systems (2015–2025).
The analysis revealed that statistically significant monotonic trends were absent for summer mean NDCI and NDTI across all four freshwater systems throughout the study period (p ≥ 0.05 in all cases), indicating substantial interannual variability relative to the magnitude of the period-based differences identified in Section 3.1. This finding does not contradict the temporal shifts observed between baseline and recent periods, but instead suggests that the detected optical changes are not yet sufficiently consistent to produce statistically detectable monotonic trends at the annual timescale. Such behaviour is commonly reported in short- to medium-term remote sensing studies of freshwater systems, where natural hydrological variability frequently obscures gradual climatic or anthropogenic signals.
The only statistically significant monotonic trend identified across all variables and study sites was the increase in JJA LST at Egirdir Lake (Kendall’s τ = 0.527, p = 0.029), with Sen’s slope indicating a warming rate of approximately +0.170 °C yr−1. This result provides nominal but physically plausible statistical support for sustained summer warming, interpreted cautiously given the short observational record, and is consistent with the spatial thermal and chlorophyll-related optical patterns identified in Section 3.2 and Section 3.3, where positive ΔNDCI anomalies were concentrated primarily within shallow littoral regions exposed to intensified summer thermal forcing.
Although not statistically significant at the p < 0.05 level, positive LST trends were also observed at Yuvacik Dam (+0.103 °C yr−1) and Catalan Dam (+0.156 °C yr−1). The absence of statistical significance at these sites is likely associated with the relatively short observation period combined with the high interannual thermal variability characteristic of Mediterranean and transitional hydroclimatic environments. Nevertheless, the consistently positive Sen’s slope estimates across these systems suggest that thermal intensification may represent an emerging long-term driver of freshwater optical and ecological variability.
Overall, the trend analysis indicates that thermal forcing, particularly within the southern Mediterranean systems, represents the most consistently detectable directional signal across the dataset. In contrast, chlorophyll-related and turbidity-related optical indicators remain strongly influenced by year-to-year hydrological and climatic variability, which currently limits the detectability of long-term monotonic optical trends at the temporal resolution considered in this study.
4. Discussion
This study applied an integrated multi-indicator remote sensing framework combining ΔNDCI, ΔNDTI, and LST to evaluate spatiotemporal water-quality-related and trophic-state optical dynamics across four contrasting freshwater systems in Türkiye between the baseline (2015–2018) and recent (2023–2025) periods. The results indicate that chlorophyll-related optical signals, turbidity-related optical dynamics, and summer thermal conditions are collectively influenced by interacting climatic, hydrological, morphological, and anthropogenic drivers that differ systematically between the southern Mediterranean systems and the northern Marmara systems.
In the southern systems, agricultural intensification within the Cukurova Plain represents a persistent source of nutrient and sediment loading to Catalan Dam [50], while increasing summer thermal forcing at Egirdir Lake is consistent with previously documented eutrophication-related optical responses associated with agricultural runoff and domestic wastewater inputs [56,58]. In contrast, the northern systems are more strongly affected by urbanisation and industrialisation processes. Elevated nutrient pressures associated with expanding urban and industrial activity are evident at Sapanca Lake [54], whereas the optical dynamics observed at Yuvacik Dam appear more closely related to reservoir morphology, hydrological regulation, and recent thermal intensification [52]. Given the absence of concurrent in situ observations, these relationships should be interpreted as physically and environmentally consistent associations rather than direct causal linkages. The principal spatial and thermal responses identified in this study are summarised in Table 11.
Table 11.
Summary of ΔNDCI, ΔNDTI, and JJA LST trends across the four freshwater systems, with identified dominant drivers of water quality variability (2015–2018 vs. 2023–2025).
The integrated spatial analysis demonstrated that positive ΔNDCI anomalies were consistently concentrated within shallow littoral zones, shoreline margins, and inflow regions across all four freshwater systems, regardless of climatic setting. This recurring spatial configuration highlights the ecological sensitivity of marginal aquatic environments and supports the interpretation that littoral dynamics represent primary hotspots of water-quality-related optical deterioration and early eutrophication-related responses.
In contrast, ΔNDTI patterns varied considerably among systems, reflecting differences in sediment transport, hydrodynamic behaviour, basin morphology, and suspended particulate dynamics. Egirdir Lake exhibited widespread positive ΔNDTI anomalies extending across most of the lake surface, whereas Sapanca Lake showed positive turbidity-related optical responses concentrated mainly within western basin sectors. By comparison, Yuvacik Dam and Catalan Dam were characterised predominantly by negative ΔNDTI anomalies, indicating comparatively reduced turbidity-related optical activity during the recent period. These contrasting behaviours demonstrate that turbidity-related optical responses are broadly consistent with interacting hydrological and geomorphological processes that differ substantially among freshwater systems.
The southern systems, particularly Catalan Dam and Egirdir Lake, exhibited clear thermal forcing signatures, where increasing summer LST corresponded spatially with positive chlorophyll-related optical anomalies concentrated within shallow inflow and marginal regions. Conversely, the northern systems appeared to be influenced more strongly by anthropogenic nutrient inputs, hydrological variability, and morphological controls. This pattern was especially evident at Sapanca Lake, where turbidity-related optical dynamics became partially decoupled from chlorophyll-related optical behaviour, suggesting complex interactions between urban runoff, sediment transport, and optical water properties.
The pronounced divergence between ΔNDCI and ΔNDTI observed at Egirdir Lake warrants particular attention within the context of remote sensing signal interpretation. Shallow lacustrine systems such as Egirdir Lake, characterised by an average depth of approximately 8–9 m and extensive littoral morphology, are highly susceptible to wind-driven sediment resuspension processes. These processes generate substantial concentrations of inorganic suspended solids (ISSs), which can produce spectrally confounding signals throughout the VIS–NIR spectrum, including the chlorophyll-sensitive red-edge wavelengths used in NDCI calculations. Under highly turbid conditions dominated by inorganic particulates, NDCI values may underestimate phytoplankton-related optical signals because of spectral interference from non-algal suspended particles, while NDTI may simultaneously overestimate turbidity-related optical responses by capturing both inorganic and organic suspended fractions.
The lake-wide positive ΔNDTI anomalies identified at Egirdir Lake are therefore interpreted as reflecting a combined contribution of phytoplankton-related optical responses and inorganic sediment resuspension, particularly within shallow northern and western littoral regions exposed to strong wind fetch conditions. Long-term declines in water level, previously documented between 1988 and 2019 [56], likely intensified this process further by exposing progressively shallower nearshore areas to resuspension and expanding the spatial extent of optically complex waters.
To evaluate whether declining water extent systematically amplified turbidity-related optical signals through enhanced lakebed reflectance contamination, an additional sensitivity analysis was conducted specifically for Egirdir Lake, representing the shallowest and morphologically most vulnerable system in the dataset. The analysis was restricted to the 2015–2021 period because Sentinel-2 imagery, which provides the spectral bands required for NDTI derivation at suitable spatial resolution, has only been available since 2015, while JRC Global Surface Water annual records are currently available only through 2021 (GSW v1.4), precluding water surface area analysis beyond this date.
Pearson and Spearman correlation analyses between annual summer mean NDTI values and corresponding water surface area revealed moderate negative but statistically non-significant relationships (Pearson r = −0.616, p = 0.141; Spearman ρ = −0.559, p = 0.192). These results indicate that decreasing water extent did not systematically amplify NDTI values through enhanced lakebed reflectance contamination, suggesting that bottom reflectance and shallow-water exposure were not dominant drivers of the observed turbidity-related optical dynamics during the study period, as shown in Figure 10. This finding is particularly important because Egirdir Lake represents the highest-risk case for shallow-water spectral interference among all analysed systems. The remaining systems, namely Sapanca Lake, Catalan Dam, and Yuvacik Dam, are either substantially deeper or morphologically less susceptible to widespread shallow-water interference, implying comparatively lower sensitivity to lakebed-related spectral noise.
Figure 10.
Relationship between summer mean NDTI and water surface area at Egirdir Lake (2015–2021), indicating no significant lakebed reflectance effect on NDTI values.
Nevertheless, in the absence of concurrent in situ suspended sediment concentration (SSC) measurements, the precise partitioning of organic and inorganic contributions to the observed NDTI signal cannot be fully quantified. This limitation highlights the need for future field campaigns integrating satellite observations with SSC measurements, water-level records, and optical field spectroscopy to further refine signal interpretation within optically complex shallow-water environments.
The Mann–Kendall trend analysis further confirmed the absence of statistically significant monotonic trends in summer mean NDCI and NDTI across all four freshwater systems during the 2015–2025 observation period, reflecting substantial interannual variability at the current temporal resolution. The only statistically significant monotonic trend identified was the increase in JJA LST at Egirdir Lake (τ = 0.53, p = 0.029; Sen’s slope = +0.170 °C yr−1), providing nominal but physically plausible statistical support for sustained thermal intensification, interpreted cautiously given the short observational record, and consistent with the spatial warming patterns identified in Section 3.2 and Section 3.3. Positive but statistically non-significant warming rates were also observed at Yuvacik Dam (+0.103 °C yr−1) and Catalan Dam (+0.156 °C yr−1), suggesting that thermal forcing may emerge as an increasingly important driver of freshwater optical dynamics as longer observational records become available.
Although the Mann–Kendall analysis provides a robust non-parametric framework for evaluating monotonic temporal trends, it is important to recognise that the observed differences between baseline and recent periods may also partly reflect the influence of large-scale synoptic and teleconnection-related climate variability rather than long-term directional climate change alone. The study period encompassed both positive and negative phases of the North Atlantic Oscillation (NAO) and Mediterranean Oscillation (MO), which are known to influence precipitation regimes, hydrological inflows, thermal stratification, and drought dynamics across the Marmara and Mediterranean regions. In addition, the strong 2015–2016 El Niño event may have contributed to anomalous hydrometeorological conditions during the baseline period, potentially affecting thermal regimes and optical water-quality-related responses across several systems.
While separating transient synoptic-scale climate forcing from longer-term climatic trends lies beyond the scope of the present study, the absence of statistically significant monotonic trends in NDCI and NDTI is consistent with the high interannual variability typically associated with oscillatory hydroclimatic forcing mechanisms. Importantly, the statistically significant warming trend identified at Egirdir Lake persisted across multiple ENSO and NAO phases during the study period, strengthening confidence in its interpretation as a sustained warming signal rather than a transient climatic anomaly. Future analyses incorporating large-scale climate indices as explanatory covariates would considerably strengthen causal attribution of observed optical and thermal dynamics.
Overall, the findings confirm the utility of satellite-based multi-index approaches as scalable, spatially explicit, and cost-effective tools for freshwater quality surveillance in data-scarce environments. The systematic concentration of optical anomalies within littoral and transitional zones across all climatic settings highlights the importance of spatially resolved monitoring frameworks capable of identifying early-stage eutrophication-related optical responses that conventional point-based monitoring approaches may fail to detect.
In alignment with Türkiye’s National Water Plan (2026–2036), the integration of remote sensing-based optical water-quality monitoring into national freshwater surveillance systems could substantially strengthen anticipatory water governance capacity under increasing climatic stress and anthropogenic pressure. The sector-specific pressures, recommended water-efficiency measures, and corresponding monitoring applications identified for the four freshwater systems are summarised in Table 12.
Table 12.
Sector-specific water quality pressures, recommended efficiency measures, and remote sensing monitoring roles applicable to freshwater systems in data-scarce environments.
5. Conclusions
This study applied an integrated multi-indicator remote sensing framework combining ΔNDCI, ΔNDTI, and LST to assess spatiotemporal water-quality-related and trophic-state optical dynamics across four contrasting freshwater systems in Türkiye. The results demonstrated that chlorophyll-related optical anomalies are consistently concentrated within shallow littoral and inflow regions, identifying these marginal zones as primary hotspots of eutrophication-related optical variability. In contrast, turbidity-related optical dynamics varied substantially among systems, reflecting differences in sediment transport, hydromorphology, wind-driven resuspension, and anthropogenic pressure.
Among all analysed variables, the only statistically significant monotonic trend identified during the 2015–2025 period was the increase in JJA LST at Egirdir Lake (+0.170 °C yr−1; τ = 0.53, p = 0.029), providing nominal but physically plausible support for sustained thermal intensification, interpreted cautiously given the short observational record. The southern Mediterranean systems exhibited stronger thermal forcing signatures, whereas the northern Marmara systems were influenced more strongly by urbanisation, nutrient loading, and morphological constraints.
The additional sensitivity analysis conducted for Egirdir Lake further indicated that decreasing water extent did not systematically amplify NDTI values through lakebed reflectance contamination, strengthening confidence in the interpretation of the observed turbidity-related optical dynamics in shallow-water environments.
Overall, the findings confirm that satellite-based chlorophyll-related, turbidity-related, and thermal monitoring approaches provide scalable and cost-effective tools for freshwater quality surveillance in data-scarce regions. The proposed framework is transferable to other freshwater systems exposed to similar climatic and anthropogenic pressures and may support anticipatory water governance under accelerating climate change, particularly within the scope of Türkiye’s National Water Plan (2026–2036).
6. Limitations and Future Work
Despite the demonstrated utility of the proposed framework for freshwater quality surveillance, several methodological limitations should be acknowledged. First, the absence of concurrent in situ measurements limited direct quantitative validation of the satellite-derived indices and prevented formal causal attribution between optical dynamics and environmental drivers. Nevertheless, the applied NDCI, NDTI, and LST products are widely established and extensively validated proxies within the remote sensing literature [21,22,47].
Differences in spatial resolution between Sentinel-2 (10–20 m) and Landsat 8/9 (30 m) may also restrict the detection of fine-scale spatial heterogeneity, particularly in morphologically complex systems such as Catalan Dam, although polygon-based aggregation substantially reduced potential scale mismatch effects. In shallow systems such as Egirdir Lake, lakebed reflectance and sediment resuspension may additionally introduce spectral uncertainty into NDTI retrievals under optically complex conditions. However, the additional sensitivity analysis conducted in this study indicated that decreasing water extent did not systematically amplify NDTI values through lakebed reflectance contamination during the observation period.
Additional uncertainty arises from cloud-cover filtering, which reduced temporal observation density during some seasonal periods, particularly in autumn and winter. Furthermore, Landsat-derived LST represents surface skin temperature rather than bulk water temperature and may therefore be influenced by short-term atmospheric and wind-mixing conditions. Finally, the relatively short observation period (2015–2025; n = 10–11 years) limits the statistical power of long-term trend analyses and may partly overlap with large-scale climatic oscillations such as ENSO, NAO, and the Mediterranean Oscillation, whose effects cannot be fully separated from long-term climate-change signals within the present framework.
Future studies should prioritise concurrent in situ monitoring campaigns integrating chlorophyll-a, suspended sediment concentration (SSC), and water-temperature measurements to strengthen validation and process attribution. Expanding the framework to additional freshwater systems and integrating higher-resolution satellite platforms may further improve the detection of fine-scale optical dynamics. Coupling remote sensing observations with hydrological and nutrient transport models would additionally support mechanistic interpretation of observed water-quality-related changes and improve climate adaptation planning for vulnerable freshwater systems.
Author Contributions
Conceptualization, A.K. and V.L.; methodology, A.K.; software, A.K.; validation, A.K. and B.F.; formal analysis, A.K.; investigation, A.K.; resources, A.K.; data curation, A.K.; writing—original draft preparation, A.K.; writing—review and editing, A.K., B.F. and V.L.; visualization, A.K.; supervision, V.L.; project administration, A.K. All authors have read and agreed to the published version of the manuscript.
Funding
This research received no external funding.
Data Availability Statement
The satellite imagery used in this study is publicly available through Google Earth Engine (GEE). Sentinel-2 Level-2A (Surface Reflectance) data can be accessed via the Copernicus Open Access Hub (https://dataspace.copernicus.eu) accessed on 15 February 2026 and Landsat Collection 2 Level-2 data are available through the USGS Earth Explorer (https://earthexplorer.usgs.gov) accessed on 15 February 2026. The JRC Global Surface Water dataset is accessible through GEE (https://developers.google.com/earth-engine/datasets/catalog/JRC_GSW1_4_GlobalSurfaceWater) accessed on 15 February 2026. The Google Earth Engine scripts used for data processing and index computation are available from the corresponding author upon reasonable request.
Acknowledgments
The authors acknowledge the European Space Agency (ESA) and the United States Geological Survey (USGS) for providing open-access Sentinel-2 and Landsat satellite data, and Google for the Google Earth Engine cloud computing platform.
Conflicts of Interest
The authors declare no conflicts of interest.
Abbreviations
The following abbreviations are used in this manuscript:
| NDCI | Normalised Difference Chlorophyll Index |
| NDTI | Normalised Difference Turbidity Index |
| NDWI | Normalised Difference Water Index |
| LST | Land Surface Temperature |
| JJA | June–July–August (summer season) |
| GEE | Google Earth Engine |
| Chl-a | Chlorophyll-a |
| Δ-mask | Period-mean difference map |
| ΔNDCI | Change in Normalised Difference Chlorophyll Index |
| ΔNDTI | Change in Normalised Difference Turbidity Index |
| AOI | Area of Interest |
| JRC | Joint Research Centre |
| MSI | Multispectral Instrument |
| TIRS | Thermal Infrared Sensor |
| QA | Quality Assurance |
| APC | Article Processing Charge |
| USGS | United States Geological Survey |
| ESA | European Space Agency |
| MAM | March–April–May (spring season) |
| SON | September–October–November (autumn season) |
| DJF | December–January–February (winter season) |
| TNWP | Türkiye National Water Plan |
References
- Rawat, A.; Kumar, D.; Khati, B.S. A review on climate change impacts, models, and its consequences on different sectors: A systematic approach. J. Water Clim. Change 2024, 15, 104–126. [Google Scholar] [CrossRef] [Scilit]
- Mishra, A.K.; Özger, M.; Singh, V.P. Association between uncertainties in meteorological variables and water-resources planning for the state of Texas. J. Hydrol. Eng. 2010, 16, 984–999. [Google Scholar] [CrossRef] [Scilit]
- Trenberth, K.; Dai, A.; van der Schrier, G.; Jones, P.D.; Barichivich, J.; Briffa, K.R.; Sheffield, J. Global warming and changes in drought. Nat. Clim. Change 2014, 4, 17–22. [Google Scholar] [CrossRef] [Scilit]
- IPCC. Climate Change 2023: Synthesis Report; Lee, H., Romero, J., Eds.; IPCC: Geneva, Switzerland, 2023; pp. 35–115. [Google Scholar] [CrossRef] [Scilit]
- Sen, Z. Applied Drought Modeling, Prediction, and Mitigation; Elsevier: Amsterdam, The Netherlands, 2015. [Google Scholar]
- Lesk, C.; Rowhani, P.; Ramankutty, N. Influence of extreme weather disasters on global crop production. Nature 2016, 529, 84–87. [Google Scholar] [CrossRef] [Scilit]
- Fang, B.; Kansara, P.; Dandridge, C.; Lakshmi, V. Drought monitoring using high spatial resolution soil moisture data over Australia in 2015–2019. J. Hydrol. 2021, 594, 125960. [Google Scholar] [CrossRef] [Scilit]
- Tang, T.; Ge, J.; Shi, H.; Wang, L.; Cao, J.; Lee, X. Drought frequency, intensity, and exposure have increased due to historical land use and land cover changes. Commun. Earth Environ. 2025, 6, 398. [Google Scholar] [CrossRef] [Scilit]
- Gobler, C.J. Climate Change and Harmful Algal Blooms: Insights and perspective. Harmful Algae 2020, 91, 101731. [Google Scholar] [CrossRef] [Scilit]
- Wiley, D.Y.; McPherson, R.A. The Role of Climate Change in the Proliferation of Freshwater Harmful Algal Blooms in Inland Water Bodies of the United States. Earth Interact. 2024, 28. [Google Scholar] [CrossRef] [Scilit]
- Mohseni, F.; Saba, F.; Mirmazloumi, S.M.; Amani, M.; Mokhtarzade, M.; Jamali, S.; Mahdavi, S. Ocean water quality monitoring using remote sensing techniques: A review. Mar. Environ. Res. 2022, 180, 105701. [Google Scholar] [CrossRef] [Scilit] [PubMed]
- Chorus, I.; Bartram, J. (Eds.) Toxic Cyanobacteria in Water: A Guide to Their Public Health Consequences, Monitoring and Management; WHO & E & FN Spon: London, UK, 1999. [Google Scholar]
- Deng, Y.; Zhang, Y.; Pan, D.; Yang, S.X.; Gharabaghi, B. Review of Recent Advances in Remote Sensing and Machine Learning Methods for Lake Water Quality Management. Remote Sens. 2024, 16, 4196. [Google Scholar] [CrossRef] [Scilit]
- Ngamile, S.; Madonsela, S.; Kganyago, M. Trends in remote sensing of water quality parameters in inland water bodies: A systematic review. Front. Environ. Sci. 2025, 13, 1549301. [Google Scholar] [CrossRef] [Scilit]
- Carlson, R.E. A trophic state index for lakes. Limnol. Oceanogr. 1977, 22, 361–369. [Google Scholar] [CrossRef] [Scilit]
- Spaulding, S.A.; Platt, L.R.C.; Murphy, J.C.; Covert, A.; Harvey, J.W. Chlorophyll a in lakes and streams of the United States (2005–2022). Sci. Data 2024, 11, 611. [Google Scholar] [CrossRef] [Scilit]
- Hall, R.O., Jr.; Yackulic, C.B.; Kennedy, T.A.; Yard, M.D.; Rosi-Marshall, E.J.; Voichick, N.; Behn, K.E. Turbidity, light, temperature, and hydropeaking control primary productivity in the Colorado River, Grand Canyon. Limnol. Oceanogr. 2015, 60, 512–526. [Google Scholar] [CrossRef] [Scilit]
- Lunt, J.; Smee, D.L. Turbidity alters estuarine biodiversity and species composition. ICES J. Mar. Sci. 2020, 77, 379–387. [Google Scholar] [CrossRef] [Scilit]
- Olivia, M.; Annabel, C.N.; Chen, P.W.; Hsieh, C.; Chang, F.H.; Ho, P.C.; Chien, C.T.; Chao, C.F.; Mukhanov, V.; Tsai, A.Y. Dramatic effect of extreme rainfall event and storm on microbial community dynamics in a subtropical coastal region. Sci. Total Environ. 2025, 964, 178560. [Google Scholar] [CrossRef] [Scilit] [PubMed]
- Klanten, Y.; MacIntyre, S.; Fitzpatrick, C.; Vincent, W.F.; Antoniades, D. Regime shifts in lake oxygen and temperature in the rapidly warming high Arctic. Geophys. Res. Lett. 2024, 51, e2023GL106985. [Google Scholar] [CrossRef] [Scilit]
- Mishra, S.; Mishra, D.R. Normalized difference chlorophyll index: A novel model for remote estimation of chlorophyll-a concentration in turbid productive waters. Remote Sens. Environ. 2012, 117, 394–406. [Google Scholar] [CrossRef] [Scilit]
- Dogliotti, A.I.; Ruddick, K.G.; Nechod, B.; Doxaran, D.; Knaeps, E. A single algorithm to retrieve turbidity from remotely-sensed data in all coastal and estuarine waters. Remote Sens. Environ. 2015, 156, 157–168. [Google Scholar] [CrossRef] [Scilit]
- Maberly, S.C.; O’Donnell, R.A.; Woolway, R.I.; Cutler, M.E.J.; Gong, M.; Jones, I.D.; Merchant, C.J.; Miller, C.A.; Politi, E.; Scott, E.M.; et al. Global lake thermal regions shift under climate change. Nat. Commun. 2020, 11, 1232. [Google Scholar] [CrossRef] [Scilit]
- Miura, Y.; Shamsudduha, M.; Suppasri, A.; Sano, D. A Global Multi-Sensor Dataset of Surface Water Indices from Landsat-8 and Sentinel-2 Satellite Measurements. Sci. Data 2025, 12, 1253. [Google Scholar] [CrossRef] [Scilit]
- Yang, H.; Kong, J.; Hu, H.; Du, Y.; Gao, M.; Chen, F. A Review of Remote Sensing for Water Quality Retrieval: Progress and Challenges. Remote Sens. 2022, 14, 1770. [Google Scholar] [CrossRef] [Scilit]
- Chen, L.; Liu, L.; Liu, S.; Shi, Z.; Shi, C. The Application of Remote Sensing Technology in Inland Water Quality Monitoring and Water Environment Science: Recent Progress and Perspectives. Remote Sens. 2025, 17, 667. [Google Scholar] [CrossRef] [Scilit]
- Toming, K.; Kutser, T.; Laas, A.; Sepp, M.; Paavel, B.; Nõges, T. First Experiences in Mapping Lake Water Quality Parameters with Sentinel-2 MSI Imagery. Remote Sens. 2016, 8, 640. [Google Scholar] [CrossRef] [Scilit]
- Powers, S.M.; Barnard, M.A.; Macleod, M.S.; Miller, L.A.; Wagner, N.D. Spatially intensive patterns of water clarity in reservoirs determined rapidly with sensor-equipped boats and satellites. J. Geophys. Res. Biogeosci. 2023, 128, e2023JG007650. [Google Scholar] [CrossRef] [Scilit]
- Lakshmi, V.; Le, M.-H.; Goffin, B.; Besnier, J.; Pham, H.; Do, H.; Fang, B.; Mohammed, I.; Bolten, J. Regional analysis of the 2015–2016 drought over the Lower Mekong River Basin using NASA satellite observations. J. Hydrol. Reg. Stud. 2023, 46, 101362. [Google Scholar] [CrossRef] [Scilit]
- Le, M.-H.; Kim, H.; Moon, H.; Zhang, R.; Lakshmi, V.; Nguyen, L.B. Assessment of drought conditions over Vietnam using the Standard Precipitation Evapotranspiration Index, MERRA-2 reanalysis, and dynamic land cover. J. Hydrol. Reg. Stud. 2020, 32, 100767. [Google Scholar] [CrossRef] [Scilit]
- AghaKouchak, A.; Farahmand, A.; Melton, F.S.; Teixeira, J.; Anderson, M.C.; Wardlow, C.R.; Hain, C.R. Remote sensing of drought: Progress, challenges and opportunities. Rev. Geophys. 2015, 53, 452–480. [Google Scholar] [CrossRef] [Scilit]
- Karimi, B.; Hashemi, S.H.; Aghighi, H. Application of Landsat-8 and Sentinel-2 for retrieval of chlorophyll-a in a shallow freshwater lake. Adv. Space Res. 2024, 74, 117–129. [Google Scholar] [CrossRef] [Scilit]
- Besnier, J.; Getirana, A.; Beaudoing, H.; Lakshmi, V. Characterizing the 2019–2021 drought in the La Plata Basin with GLDAS and SMAP. J. Hydrol. Reg. Stud. 2024, 52, 101679. [Google Scholar] [CrossRef] [Scilit]
- Tran, T.; Do, S.; Nguyen, B.; Tran, V.; Grodzka-Łukaszewska, M.; Sinicyn, G.; Lakshmi, V. Investigating future flood and drought shifts in the transboundary Srepok River Basin using CMIP6 projections. IEEE J. Sel. Top. Appl. Earth Obs. Remote Sens. 2024, 17, 7516–7529. [Google Scholar] [CrossRef] [Scilit]
- Singh, R.; Saritha, V.; Pande, C.B. Monitoring of wetland turbidity using multi-temporal Landsat-8 and Landsat-9 satellite imagery in the Bisalpur wetland, Rajasthan, India. Environ. Res. 2024, 241, 117368. [Google Scholar] [CrossRef] [Scilit] [PubMed]
- Hashimoto, H.; Dungan, J.L.; White, M.A.; Yang, F.; Michaelis, A.R.; Running, S.W.; Nemani, R.R. Satellite-based estimation of surface vapor pressure deficits using MODIS land surface temperature data. Remote Sens. Environ. 2008, 112, 142–155. [Google Scholar] [CrossRef] [Scilit]
- Lakshmi, V.; Kir, E.G.; Fang, B. Precipitation Data Accuracy and Extreme Rainfall Detection for Flood Risk Analysis in the Akçay Sub-Basin. Remote Sens. 2025, 17, 3199. [Google Scholar] [CrossRef] [Scilit]
- Hong, S.; Lakshmi, V.; Small, E. Relationship between vegetation biophysical properties and surface temperature: Results using satellite data. J. Clim. 2007, 20, 5593–5606. [Google Scholar] [CrossRef] [Scilit]
- Dandridge, C.; Lakshmi, V.; Bolten, J.; Srinivasan, R. Evaluation of satellite-based rainfall estimates in the Lower Mekong River Basin. Remote Sens. 2019, 11, 2709. [Google Scholar] [CrossRef] [Scilit]
- Aryal, A.; Tran, D.; Kumar, B.; Lakshmi, V. Evaluation of Satellite-derived Precipitation Products for Streamflow Simulation of Mountainous Himalayan Watershed. Remote Sens. 2023, 15, 4762. [Google Scholar] [CrossRef] [Scilit]
- Fayne, J.; Bolten, J.; Doyle, C.; Fuhrmann, S.; Rice, M.; Houser, P.; Lakshmi, V. Flood mapping in the Lower Mekong Basin using MODIS observations. Int. J. Remote Sens. 2017, 38, 1737–1757. [Google Scholar] [CrossRef] [Scilit]
- Kansara, P.; Li, W.; El-Askary, H.; Lakshmi, V.; Piechota, T.; Struppa, D.; Sayed, M. An assessment of the filling process of the Grand Ethiopian Renaissance Dam and its impact on downstream countries. Remote Sens. 2021, 13, 711. [Google Scholar] [CrossRef] [Scilit]
- Mladenova, I.; Lakshmi, V.; Jackson, T.; Walker, J.; Merlin, O.; de Jeu, R. Validation of AMSR-E soil moisture using L-band radiometer data from the National Airborne Field Campaign. Remote Sens. Environ. 2011, 115, 2096–2103. [Google Scholar] [CrossRef] [Scilit]
- Fang, B.; Lakshmi, V.; Bindlish, R.; Jackson, T.; Liu, P. Evaluation and Validation of a High Spatial Resolution Satellite Soil Moisture Product over the Continental United States. J. Hydrol. 2020, 588, 125043. [Google Scholar] [CrossRef] [Scilit]
- Do, S.; Akhtar, F.; Goffin, B.; Aryal, A.; Tran, T.; Lipscomb, M.; Lakshmi, V. Assessing terrestrial water storage variations in Afghanistan using GRACE and FLDAS-Central Asia Data. J. Hydrol. Reg. Stud. 2024, 55, 101906. [Google Scholar] [CrossRef] [Scilit]
- Mishra, D.R.; Schaeffer, B.A.; Keith, D. Performance evaluation of normalized difference chlorophyll index in northern Gulf of Mexico estuaries. GISci. Remote Sens. 2014, 51, 175–198. [Google Scholar] [CrossRef] [Scilit]
- Duan, S.B.; Li, Z.L.; Zhao, W.; Wu, P.; Huang, C.; Han, X.J.; Shang, G. Validation of Landsat land surface temperature product in the conterminous United States. Int. J. Digit. Earth 2020, 14, 640–660. [Google Scholar] [CrossRef] [Scilit]
- Taşoğlu, E.; Öztürk, M.Z.; Yazıcı, Ö. High Resolution Köppen-Geiger Climate Zones of Türkiye. Int. J. Climatol. 2024, 44, 5248–5265. [Google Scholar] [CrossRef] [Scilit]
- Turkish Statistical Institute (TÜİK). The Results of Address Based Population Registration System, 2025; Turkish Statistical Institute: Ankara, Türkiye, 2026. Available online: https://data.tuik.gov.tr/Bulten/Index?p=The-Results-of-Address-Based-Population-Registration-System-2025-53899&dil=2 (accessed on 20 May 2026).
- Donmez, C.; Sari, O.; Berberoglu, S.; Cilek, A.; Satir, O.; Volk, M. Improving the Applicability of the SWAT Model to Simulate Flow and Nitrate Dynamics in a Flat Data-Scarce Agricultural Region in the Mediterranean. Water 2020, 12, 3479. [Google Scholar] [CrossRef] [Scilit]
- Kokpinar, M.A.; Altan-Sakarya, A.B.; Kumcu, S.Y.; Gogus, M. Assessment of sediment yield estimations for large watershed areas in Turkey. Hydrol. Sci. J. 2015, 60, 2189–2203. [Google Scholar] [CrossRef] [Scilit]
- Kalıpcı, E.; Varol, S.; Cüce, H. Evaluation of water quality and trophic condition of Yuvacik (Kocaeli-Turkey) drinking water dam reservoir. Mugla J. Sci. Technol. 2020, 6, 128–139. [Google Scholar] [CrossRef] [Scilit]
- Uysal, G.; Sensoy, A.; Sorman, A.A.; Akgun, T.; Gezgin, T. Basin/reservoir system integration for real time reservoir operation. Water Resour. Manag. 2016, 30, 1653–1668. [Google Scholar] [CrossRef] [Scilit]
- Akıner, M.E.; Akıner, İ. Water Quality Analysis of Drinking Water Resource Lake Sapanca and Suggestions for the Solution of the Pollution Problem in the Context of Sustainable Environment Approach. Sustainability 2021, 13, 3917. [Google Scholar] [CrossRef] [Scilit]
- Batina, A.; Krtalić, A. Integrating Remote Sensing Methods for Monitoring Lake Water Quality: A Comprehensive Review. Hydrology 2024, 11, 92. [Google Scholar] [CrossRef] [Scilit]
- Yücel, A.; Markovic, M.; Atilgan, A.; Rolbiecki, R.; Ertop, H.; Jagosz, B.; Ptach, W.; Łangowski, A.; Jakubowski, T. Investigation of Annual Lake Water Levels and Water Volumes with Şen Innovation and Mann-Kendall Rank Correlation Trend Tests: Example of Lake Eğirdir, Turkey. Water 2022, 14, 2374. [Google Scholar] [CrossRef] [Scilit]
- Karaman, M. The tectonic evolution of Lake Eğirdir, West Turkey. Geologos 2010, 16, 223–234. [Google Scholar] [CrossRef] [Scilit]
- Gunes, K.; Masi, F.; Ayaz, S.C.; Tufekci, H.; Besiktas, M.; Sarikaya, O.V.; Aydoner, C. Land Based Sources Pollution Management in a Sub-Basin Catchment Area of A Freshwater Lake: A Case Study. Environ. Eng. Manag. J. 2021, 20, 1003–1010. [Google Scholar] [CrossRef] [Scilit]
- Markert, K.N.; Schmidt, C.M.; Griffin, R.E.; Flores, A.I.; Poortinga, A.; Saah, D.S.; Muench, R.E.; Clinton, N.E.; Chishtie, F.; Kityuttachai, K.; et al. Historical and operational monitoring of surface water dynamics in the lower Mekong basin using Landsat and Google Earth Engine. Remote Sens. 2018, 10, 909. [Google Scholar] [CrossRef] [Scilit]
- Pahlevan, N.; Mangin, A.; Balasubramanian, S.V.; Smith, B.; Alikas, K.; Arai, K.; Barbosa, C.; Belanger, S.; Binding, C.; Bresciani, M.; et al. ACIX-Aqua: A global assessment of atmospheric correction methods for Landsat-8 and Sentinel-2 over lakes, rivers, and coastal waters. Remote Sens. Environ. 2021, 258, 112366. [Google Scholar] [CrossRef] [Scilit]
- Gorelick, N.; Hancher, M.; Dixon, M.; Ilyushchenko, S.; Thau, D.; Moore, R. Google Earth Engine: Planetary-scale geospatial analysis for everyone. Remote Sens. Environ. 2017, 202, 18–27. [Google Scholar] [CrossRef] [Scilit]
- Pekel, J.F.; Cottam, A.; Gorelick, N.; Belward, A.S. High-resolution mapping of global surface water and its long-term changes. Nature 2016, 540, 418–422. [Google Scholar] [CrossRef] [Scilit]
- McFeeters, S.K. The use of the Normalized Difference Water Index (NDWI) in the delineation of open water features. Int. J. Remote Sens. 1996, 17, 1425–1432. [Google Scholar] [CrossRef] [Scilit]
- Lacaux, J.P.; Tourre, Y.M.; Vignolles, C.; Ndione, J.A.; Lafaye, M. Classification of ponds from high-spatial resolution remote sensing. Remote Sens. Environ. 2007, 106, 66–74. [Google Scholar] [CrossRef] [Scilit]
- USGS. Landsat Collection 2 Level-2 Science Products; U.S. Geological Survey: Reston, VA, USA, 2022. Available online: https://www.usgs.gov/landsat-missions/landsat-collection-2-level-2-science-products (accessed on 1 June 2026).
- Tewkesbury, A.P.; Comber, A.J.; Tate, N.J.; Lamb, A.; Fisher, P.F. A critical synthesis of remotely sensed optical image change detection techniques. Remote Sens. Environ. 2015, 160, 1–14. [Google Scholar] [CrossRef] [Scilit]
- Mann, H.B. Nonparametric tests against trend. Econometrica 1945, 13, 245–259. [Google Scholar] [CrossRef] [Scilit]
- Kendall, M.G. Rank Correlation Methods, 4th ed.; Charles Griffin: London, UK, 1975. [Google Scholar]
- Sen, P.K. Estimates of the regression coefficient based on Kendall’s tau. J. Am. Stat. Assoc. 1968, 63, 1379–1389. [Google Scholar] [CrossRef]
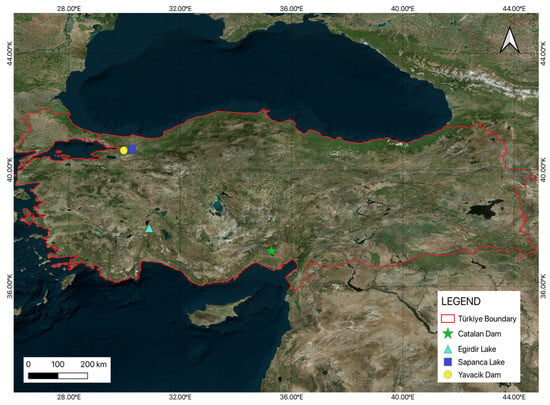
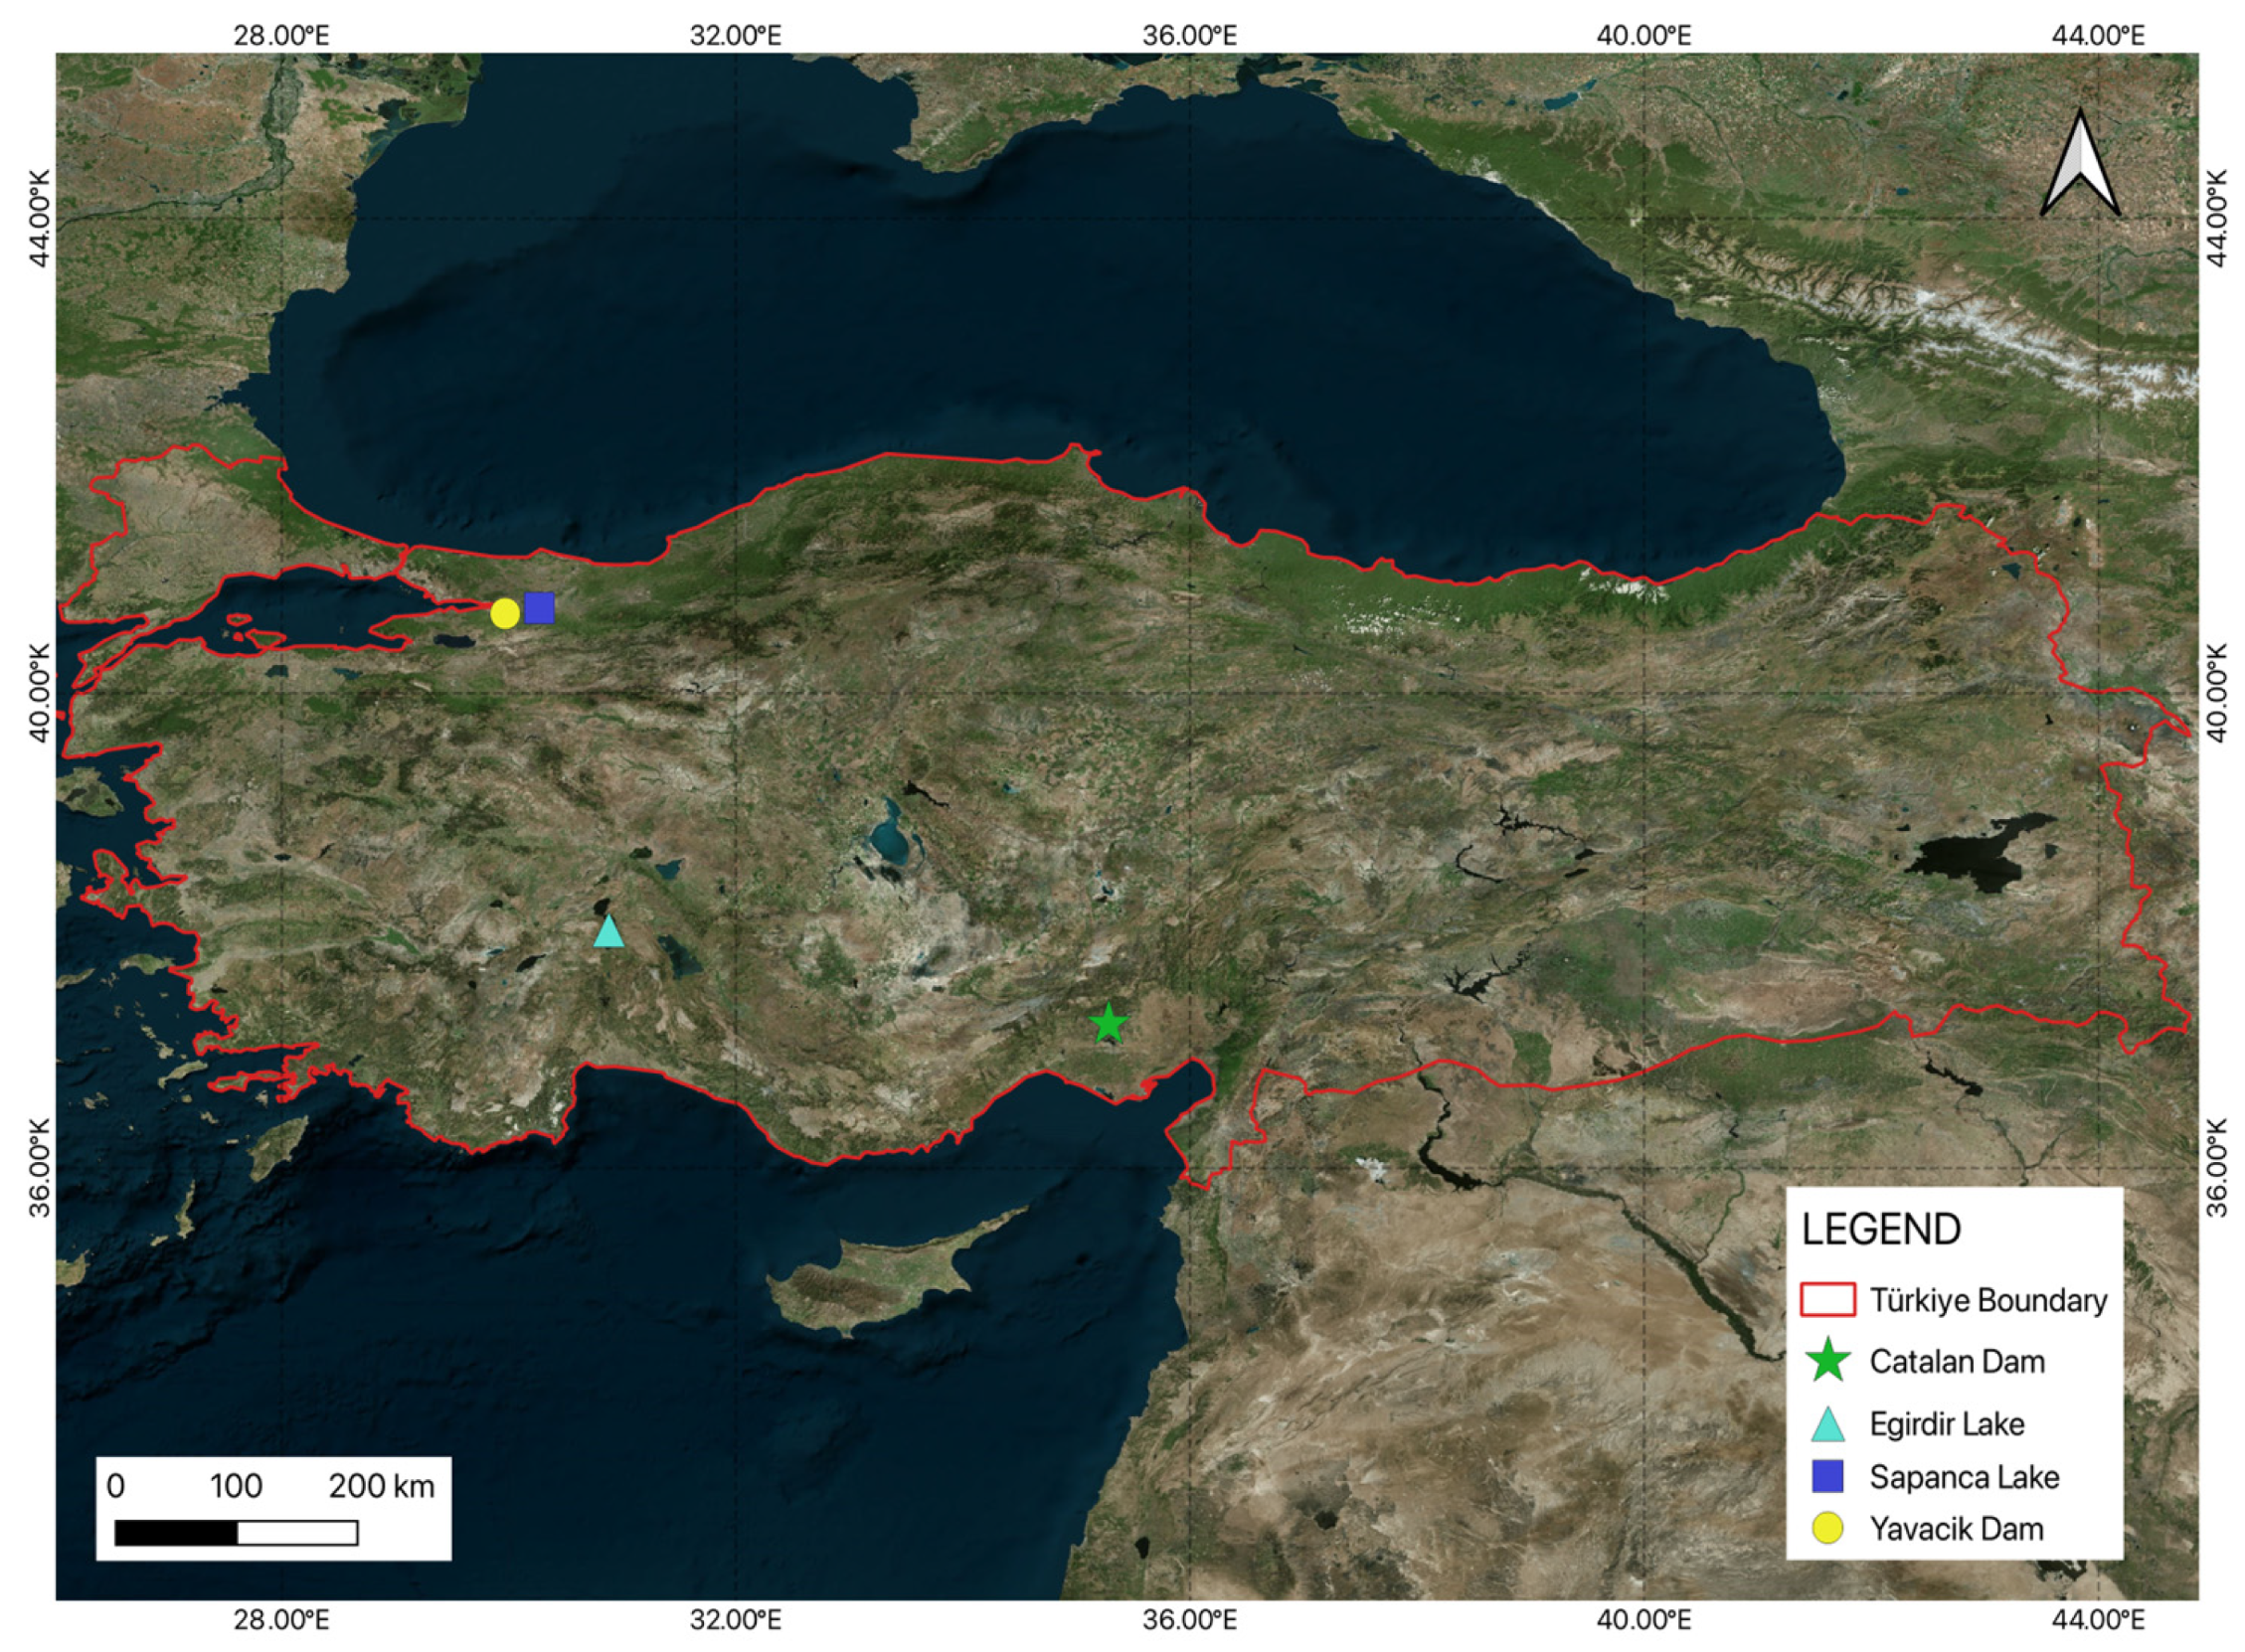
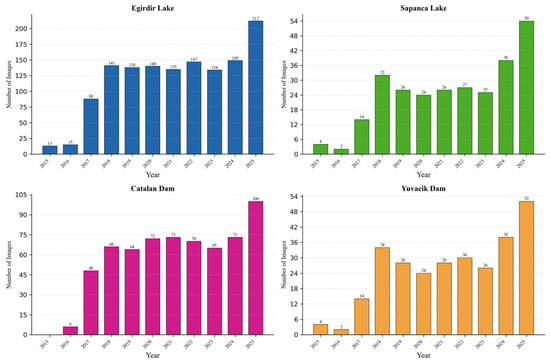
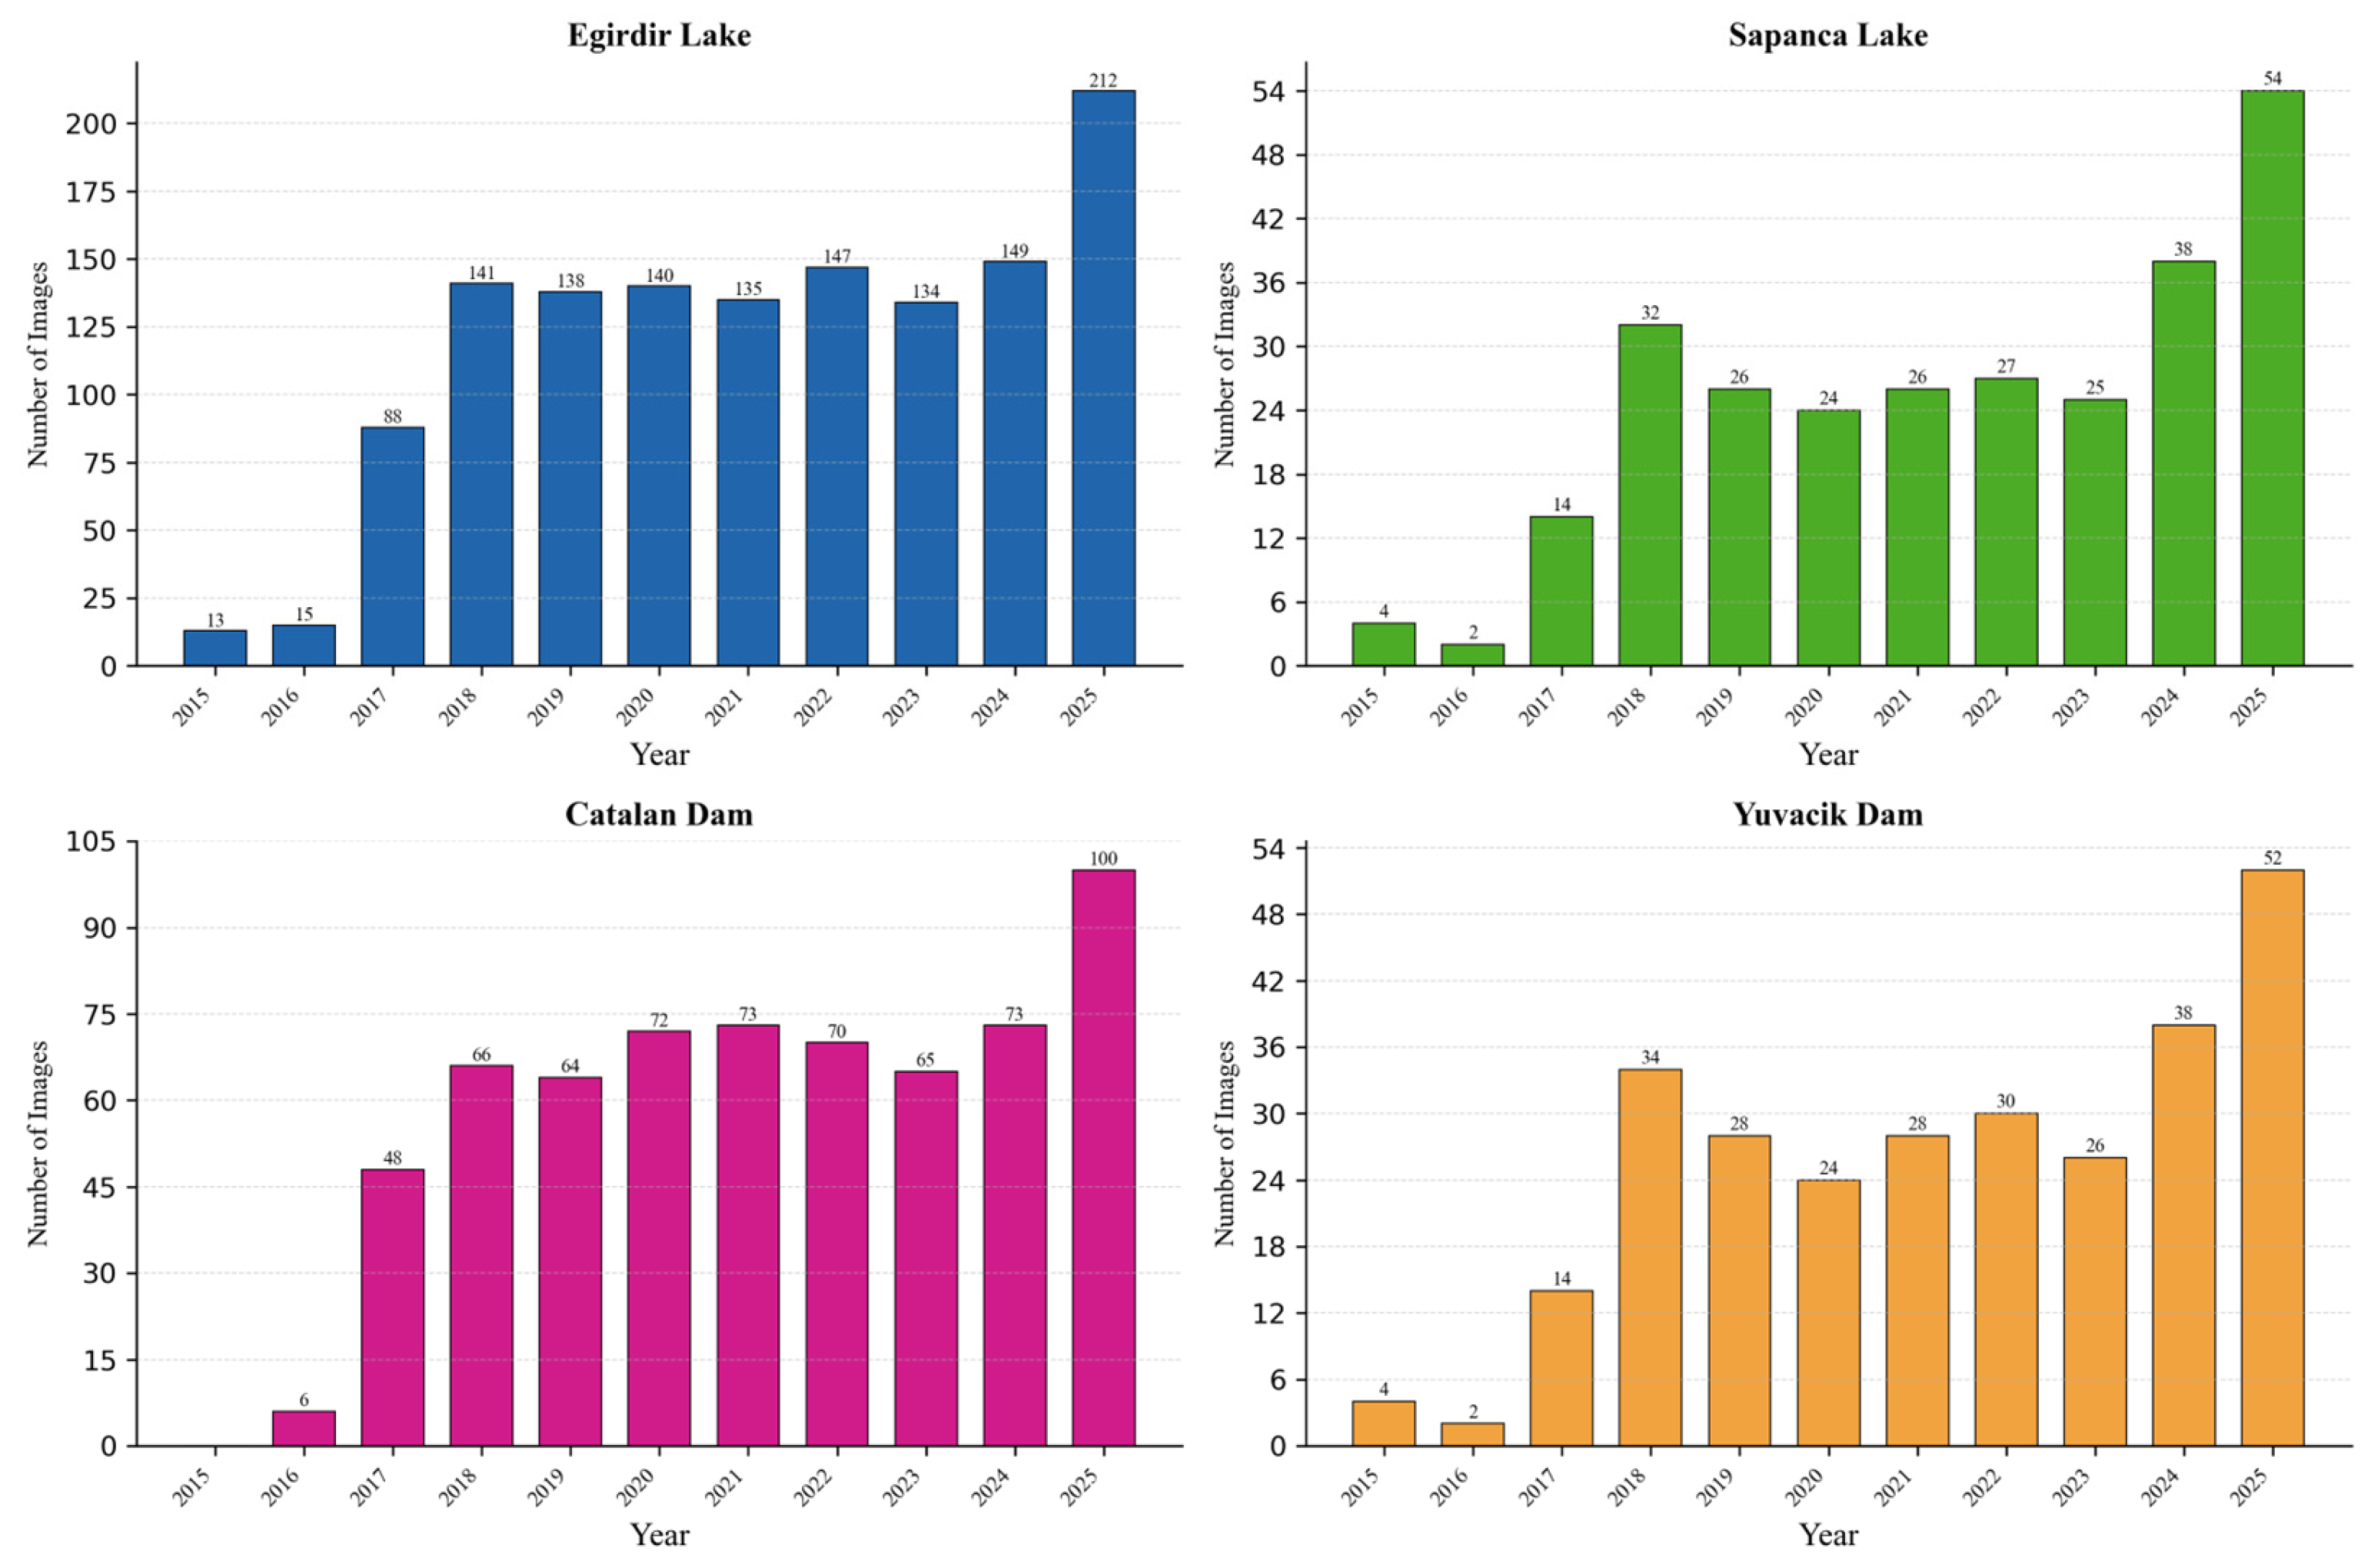
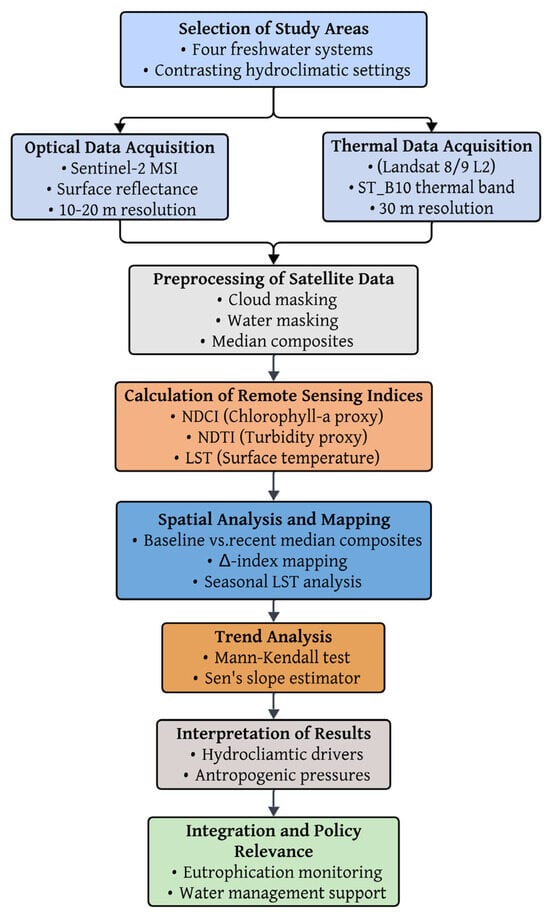
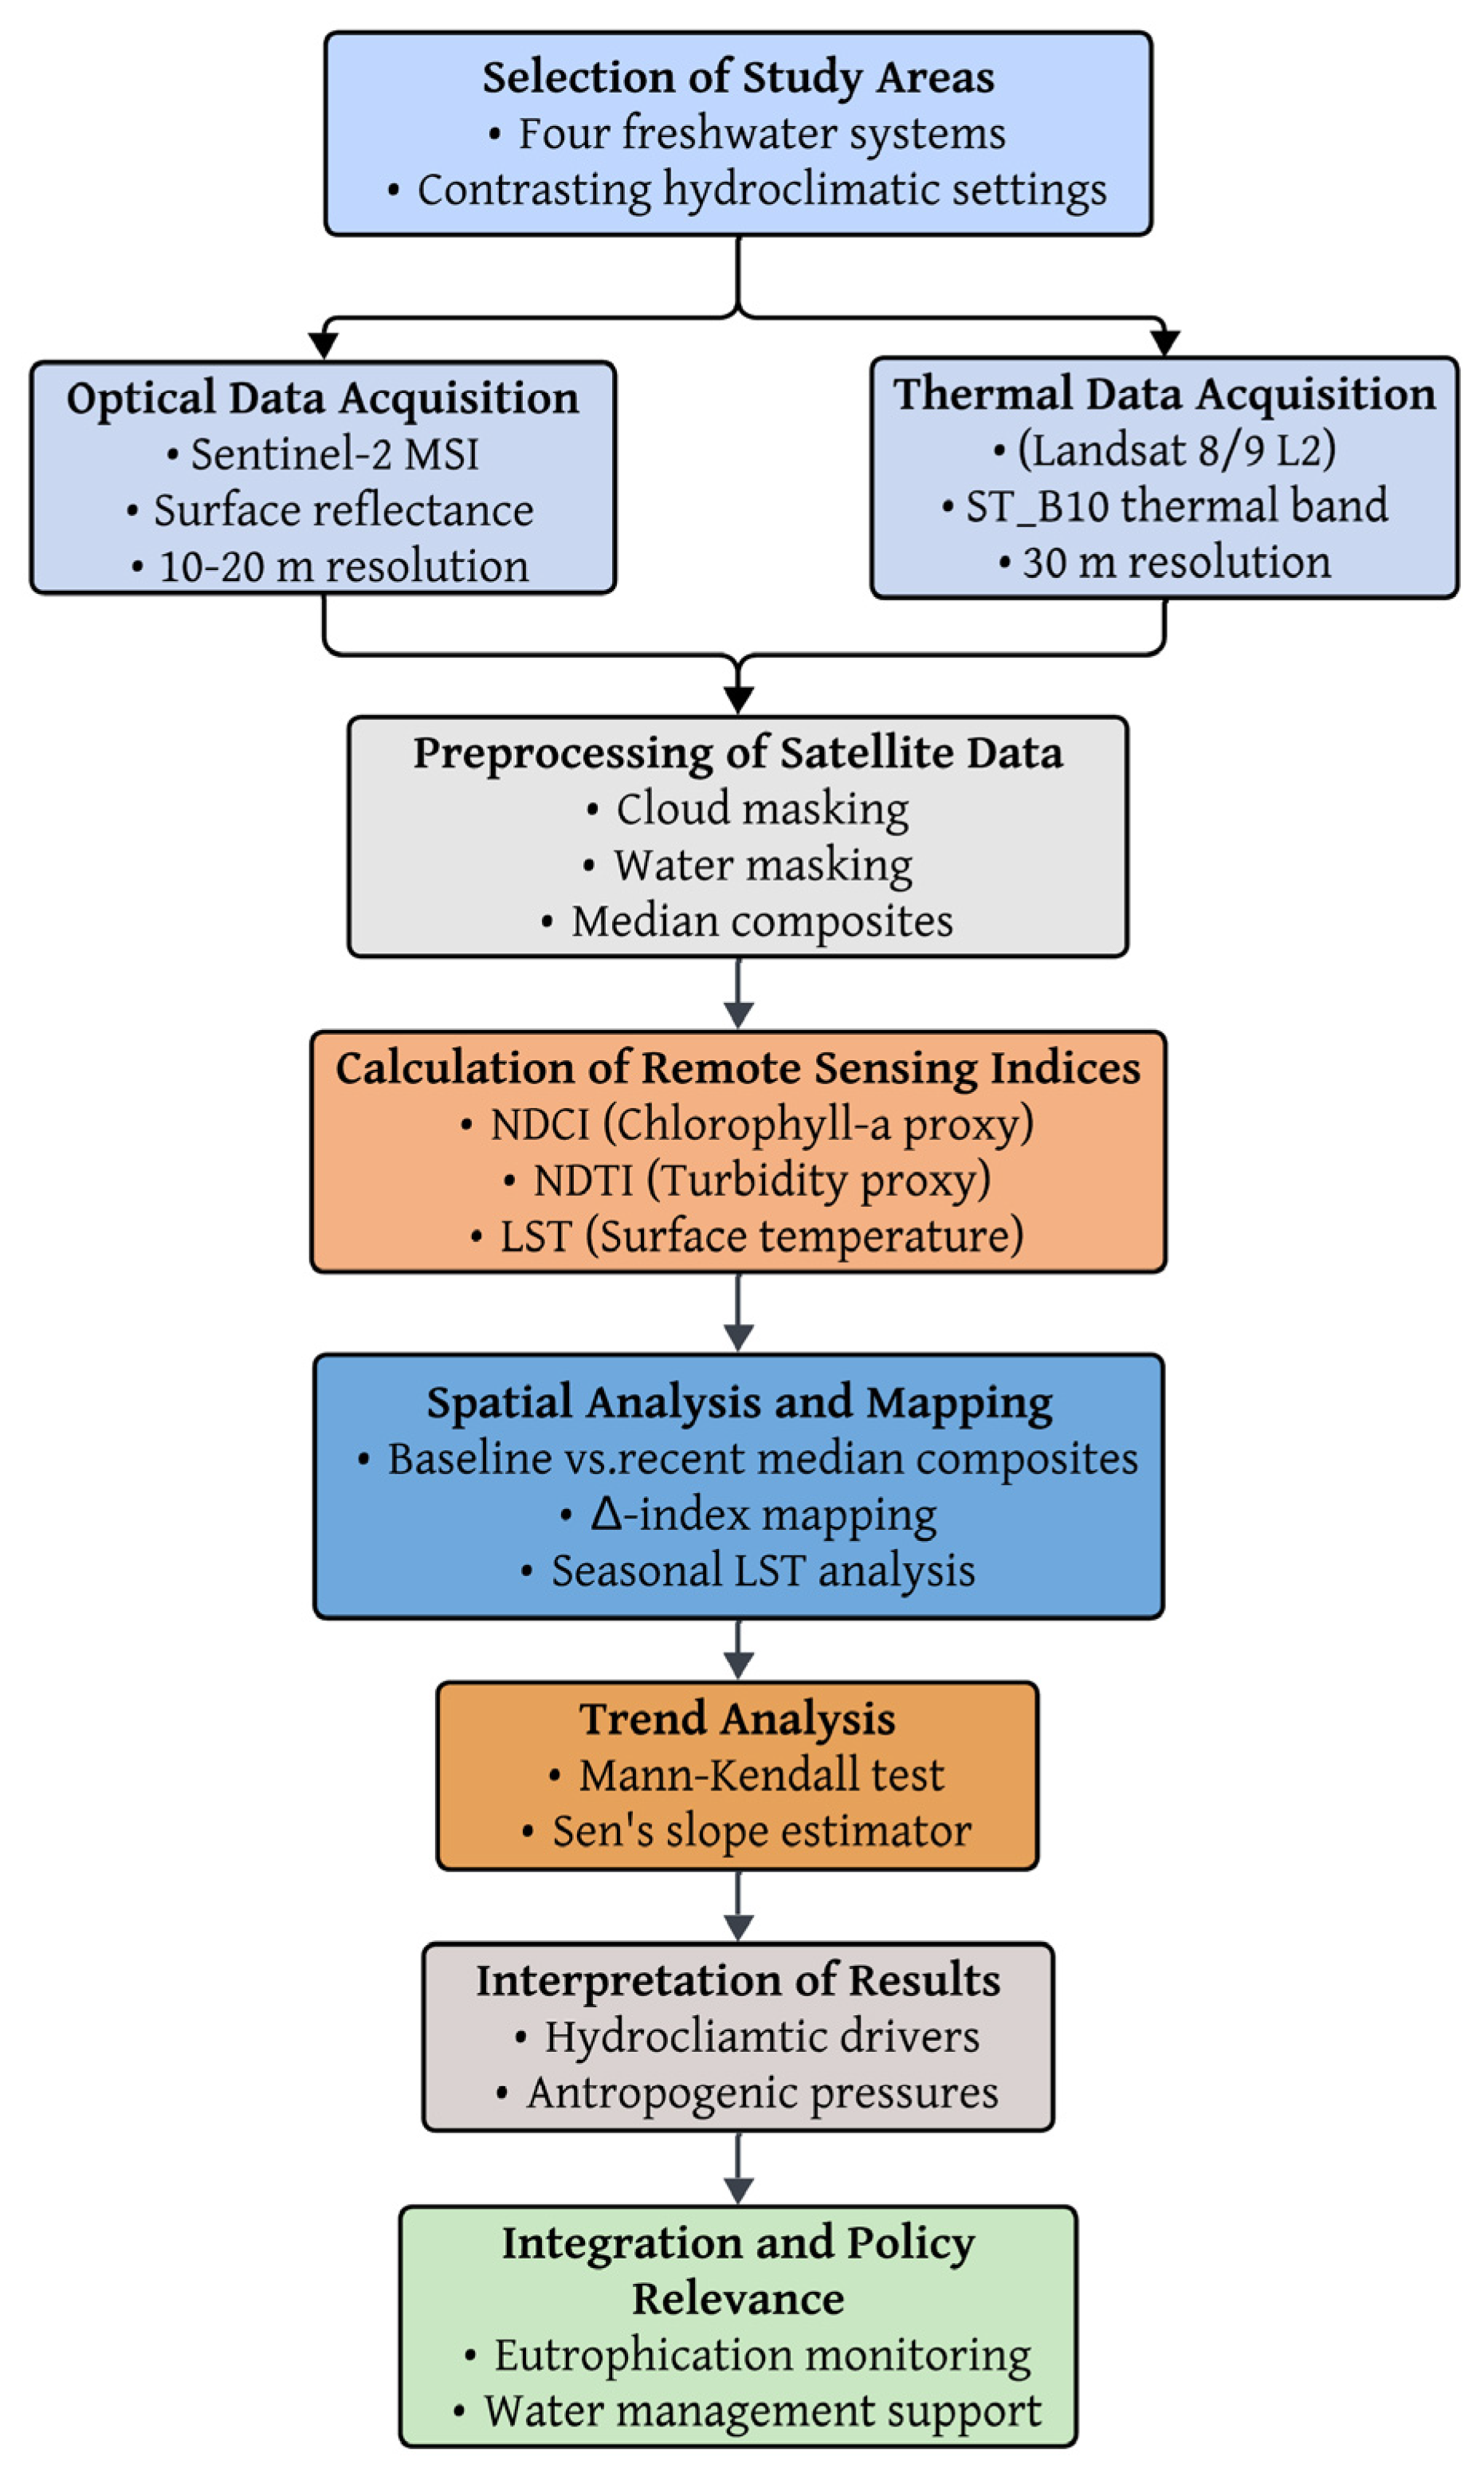
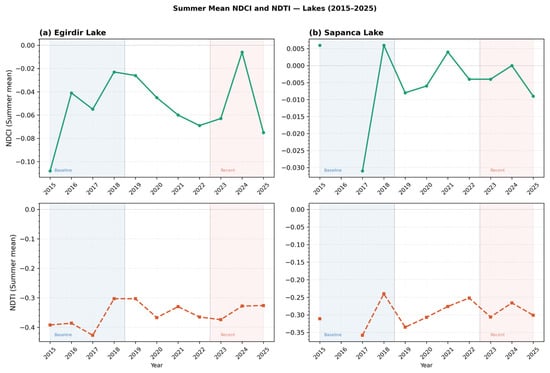
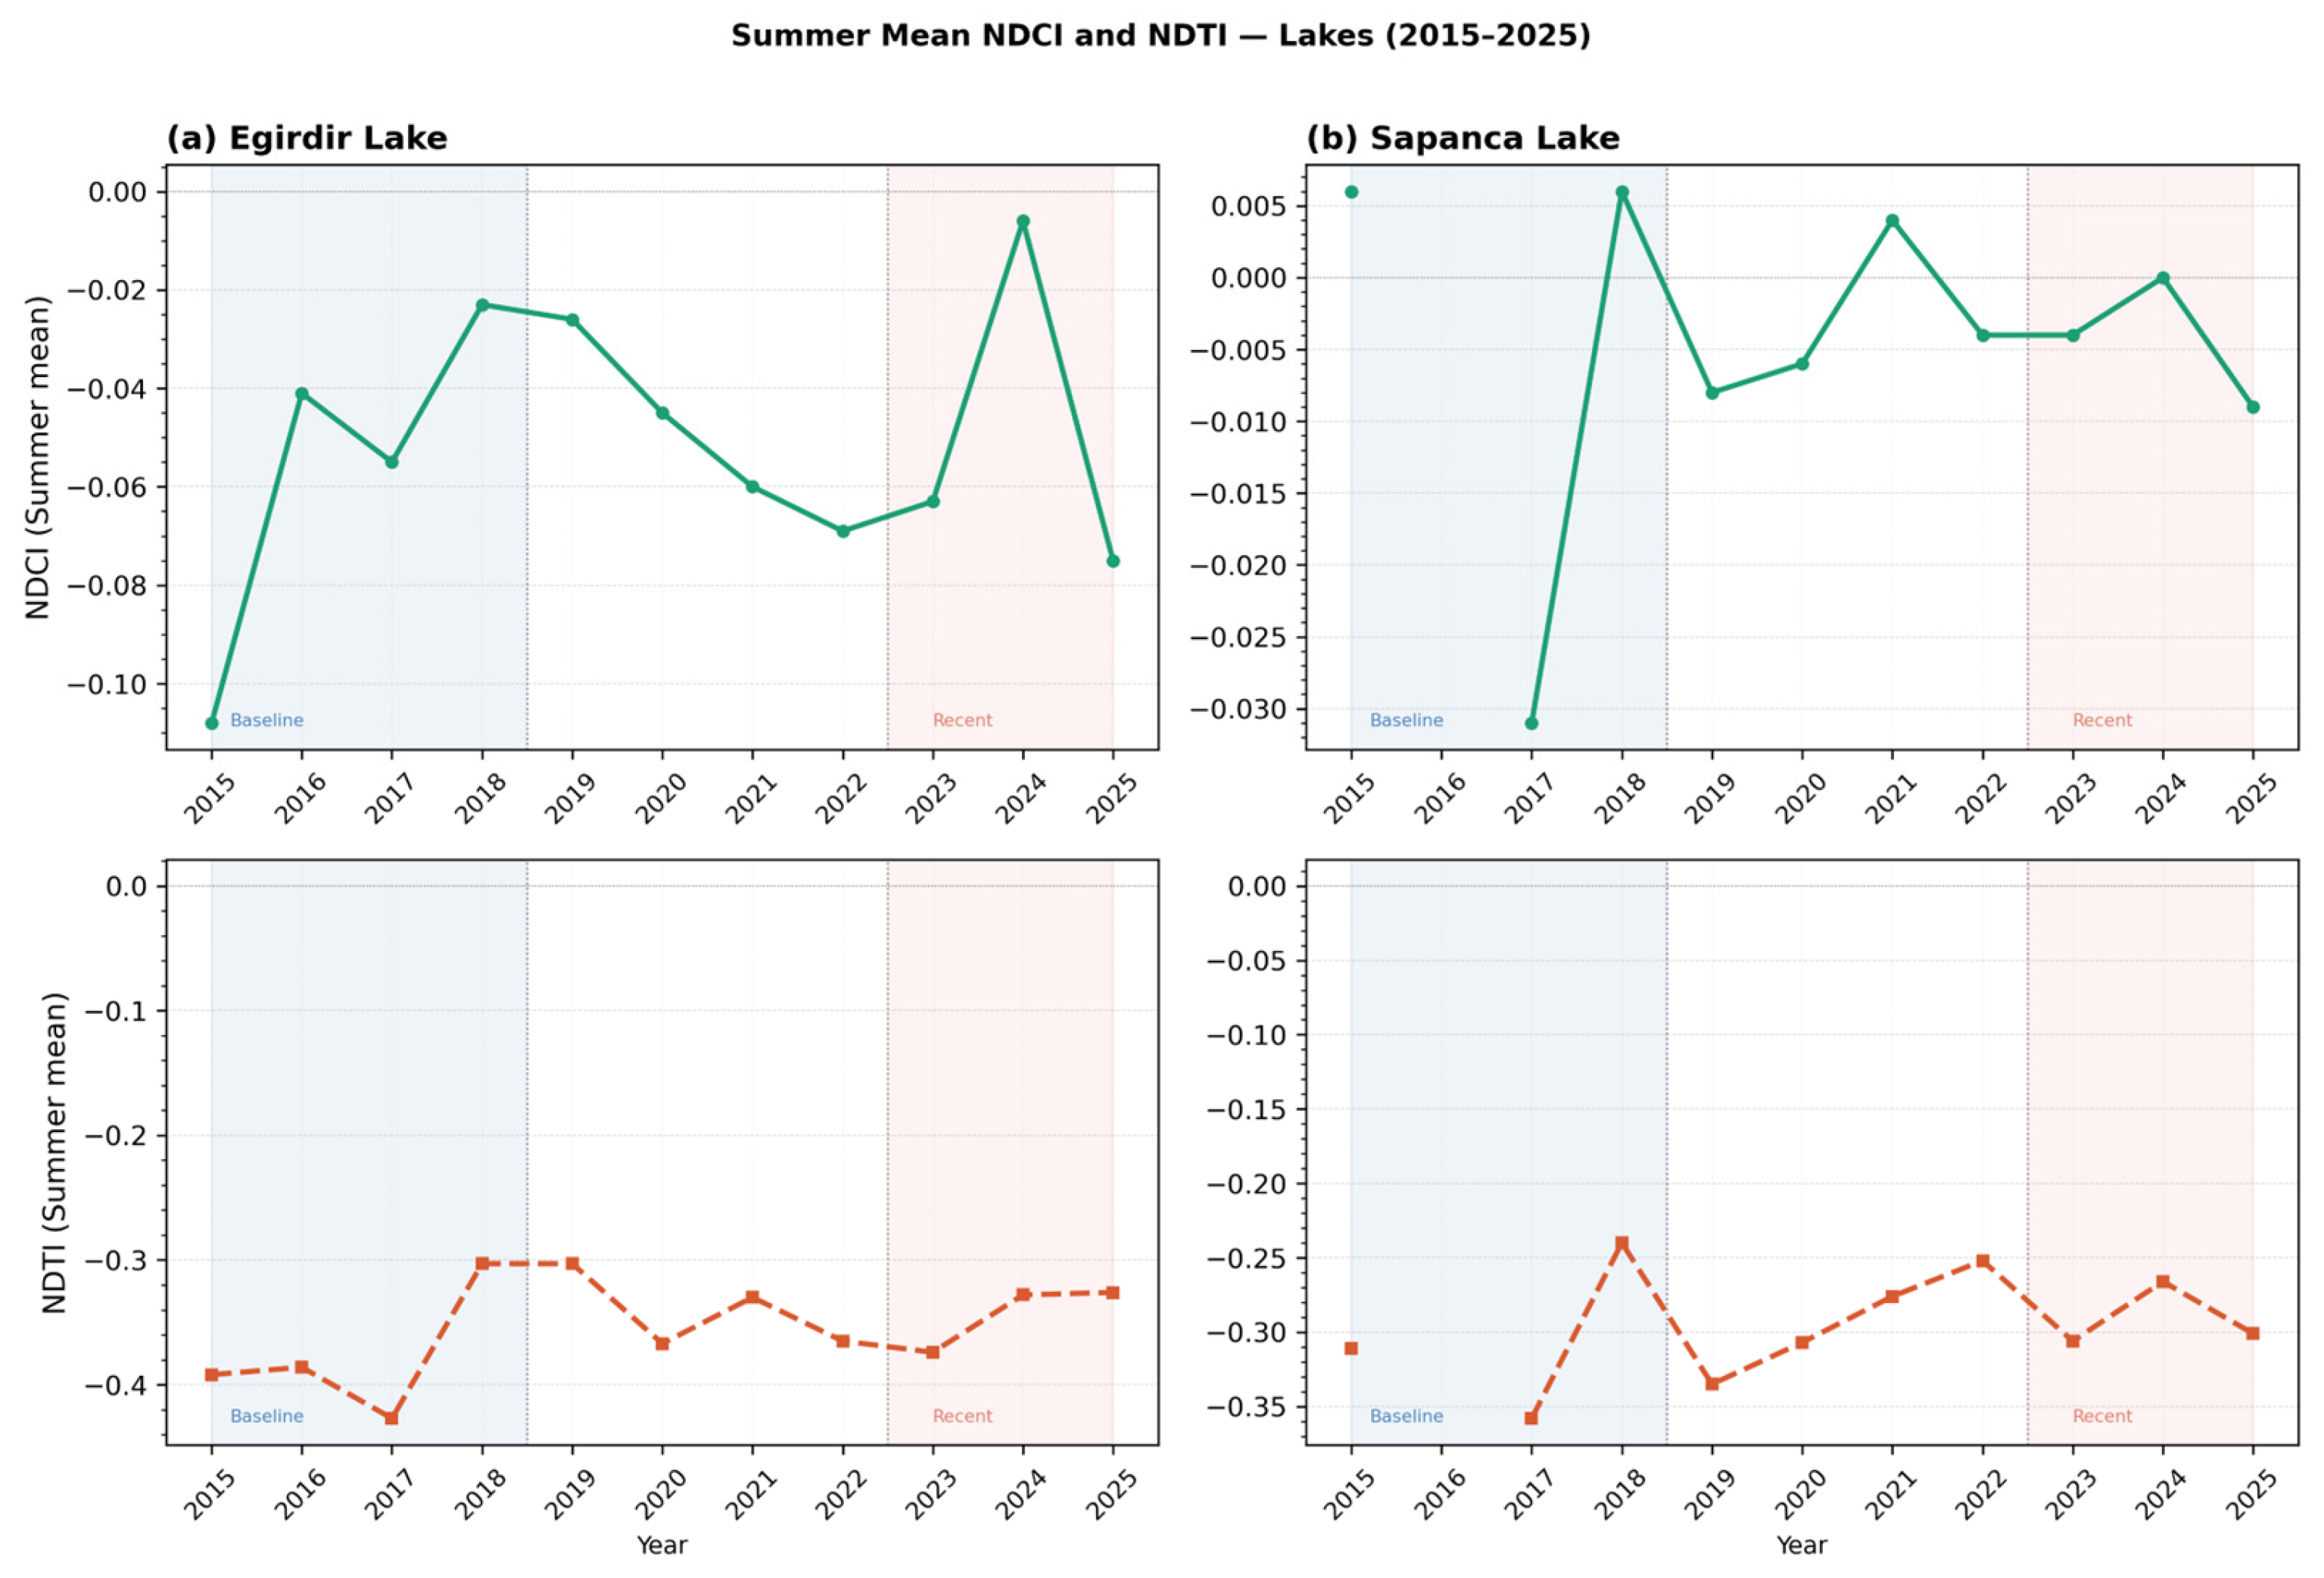
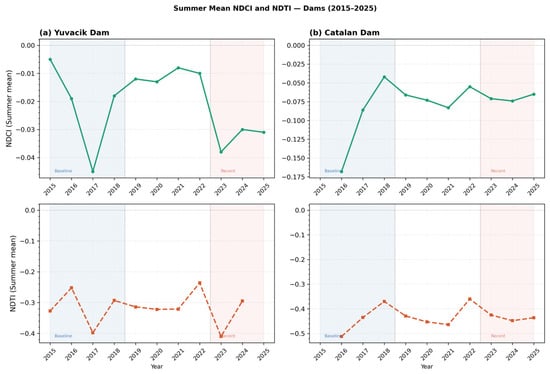
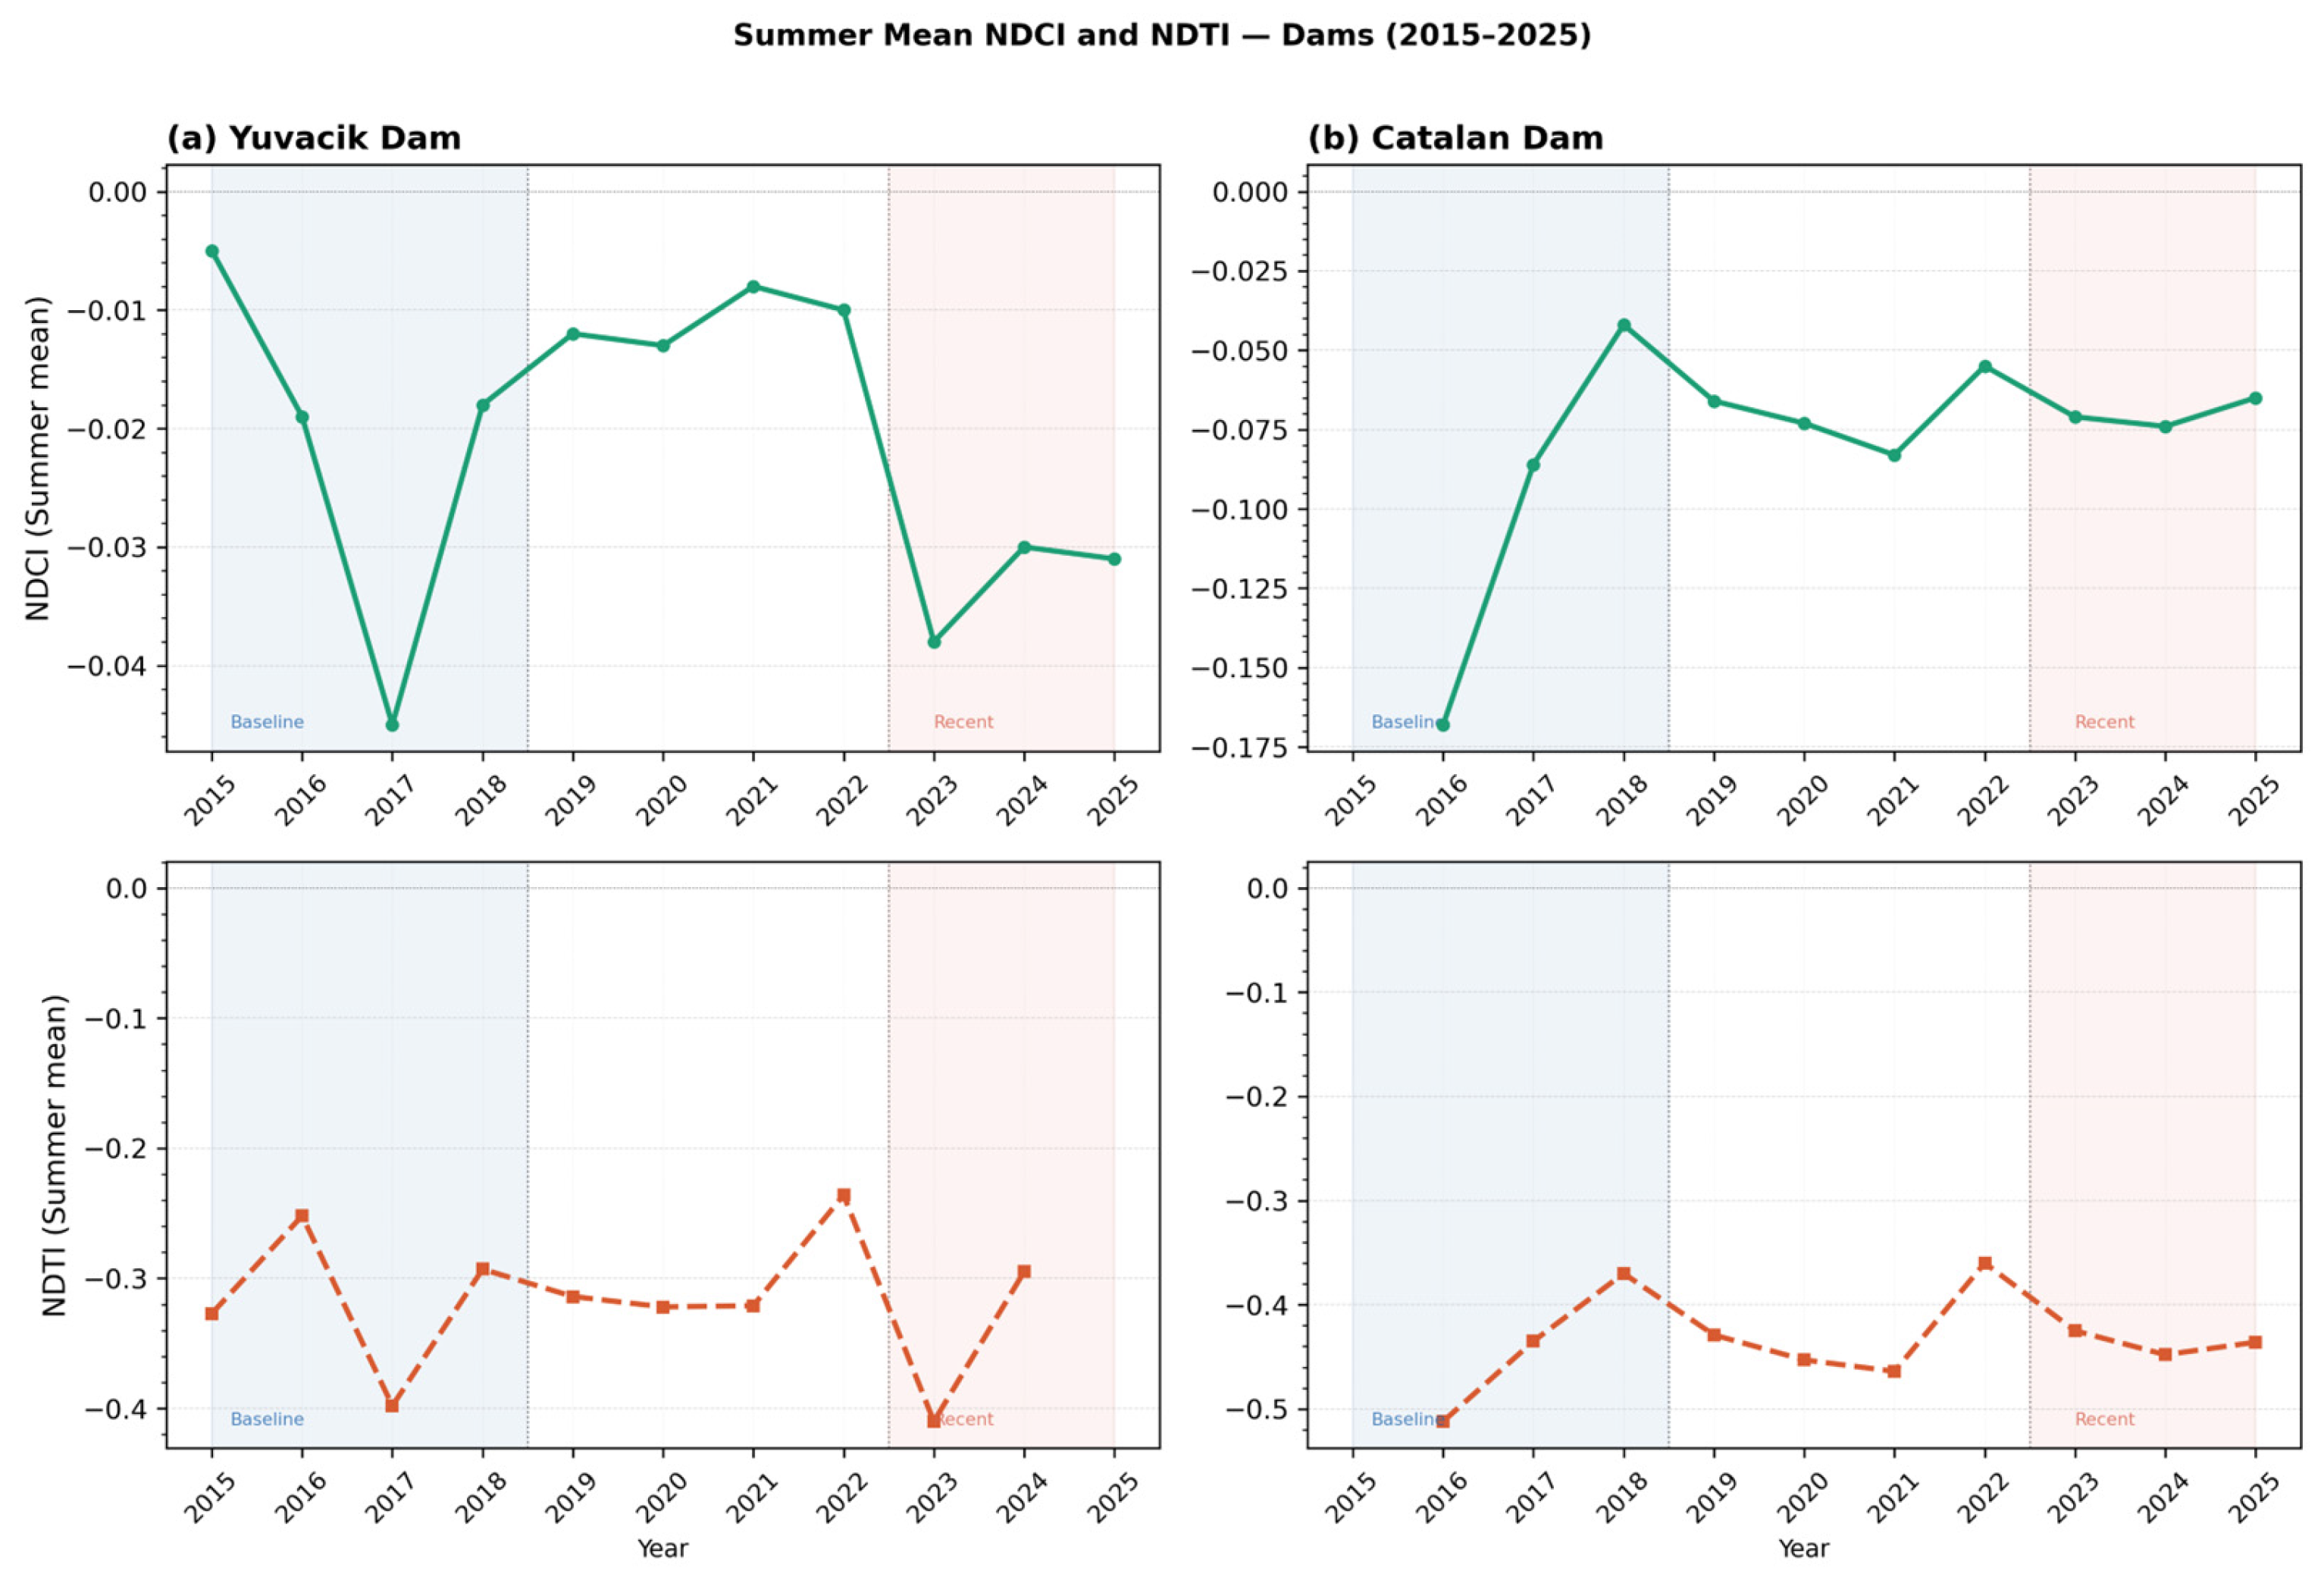
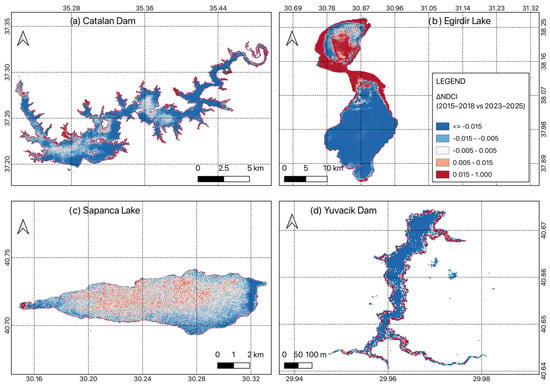
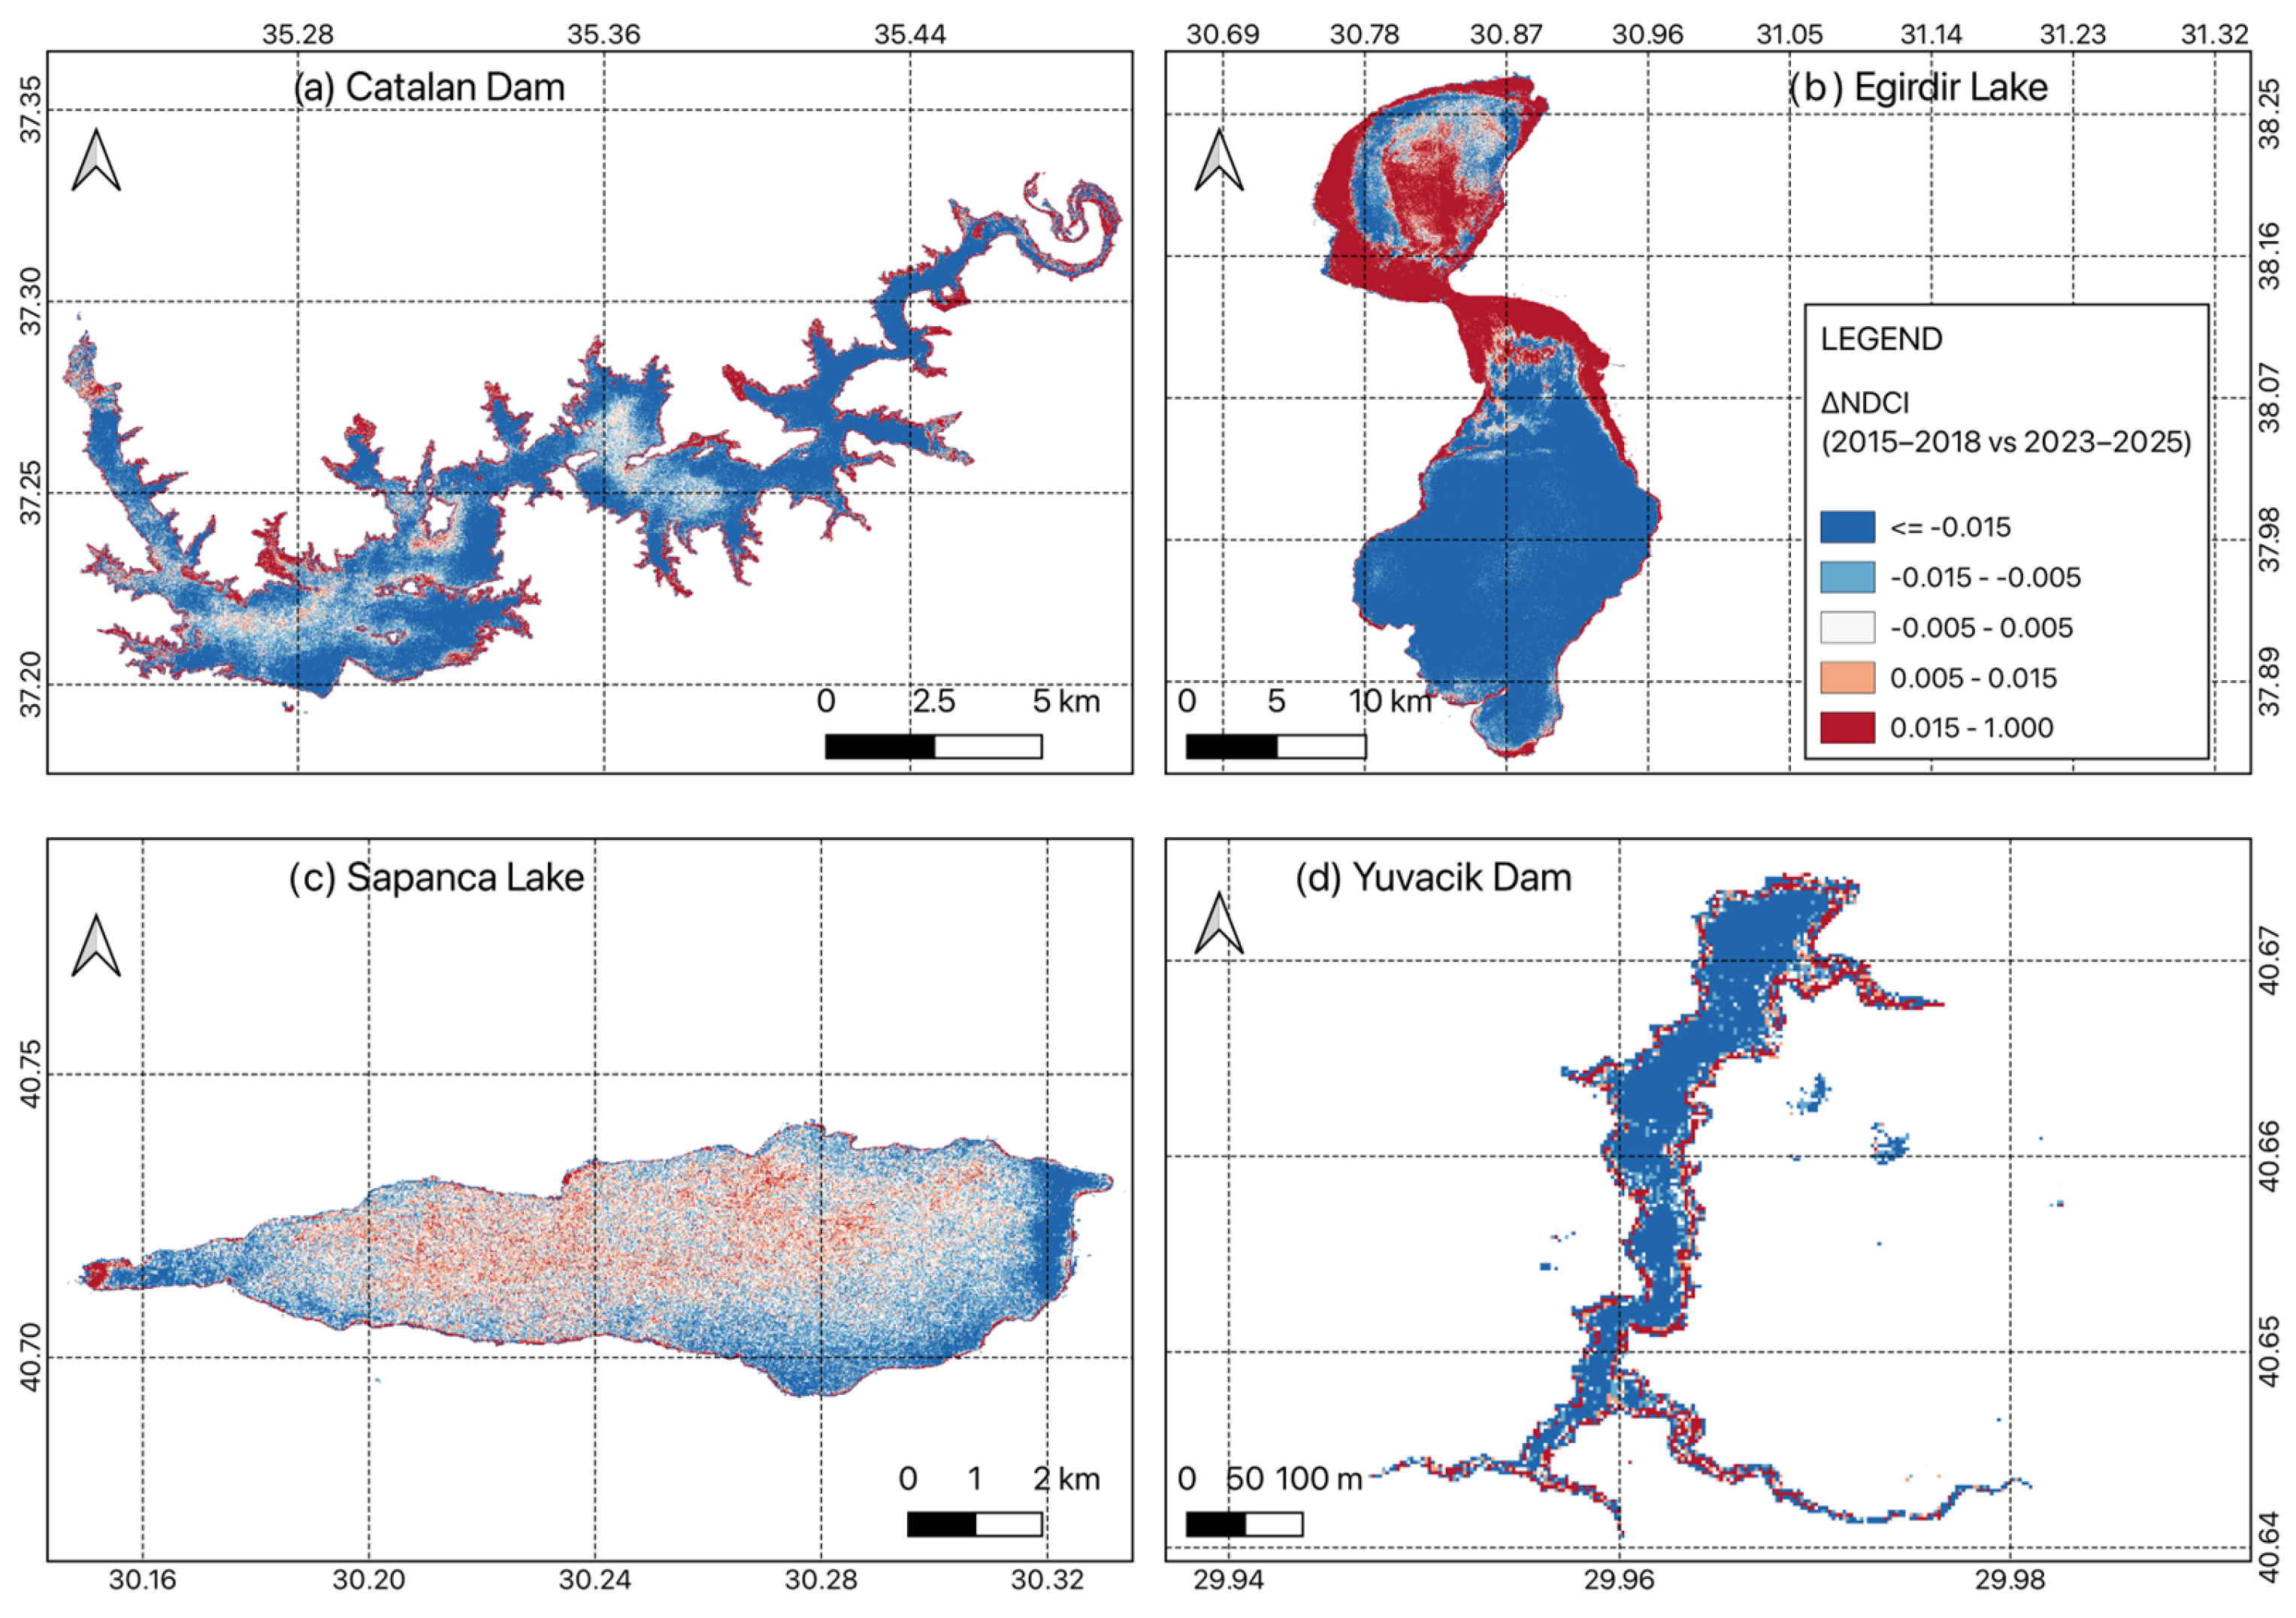
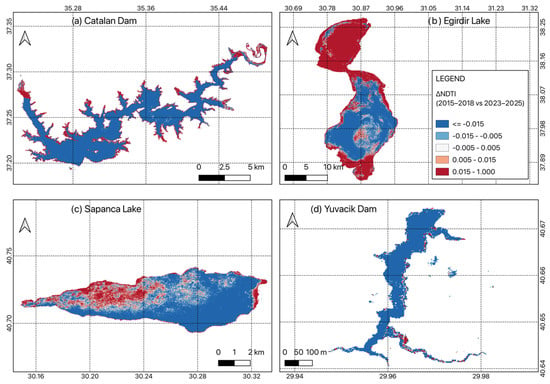
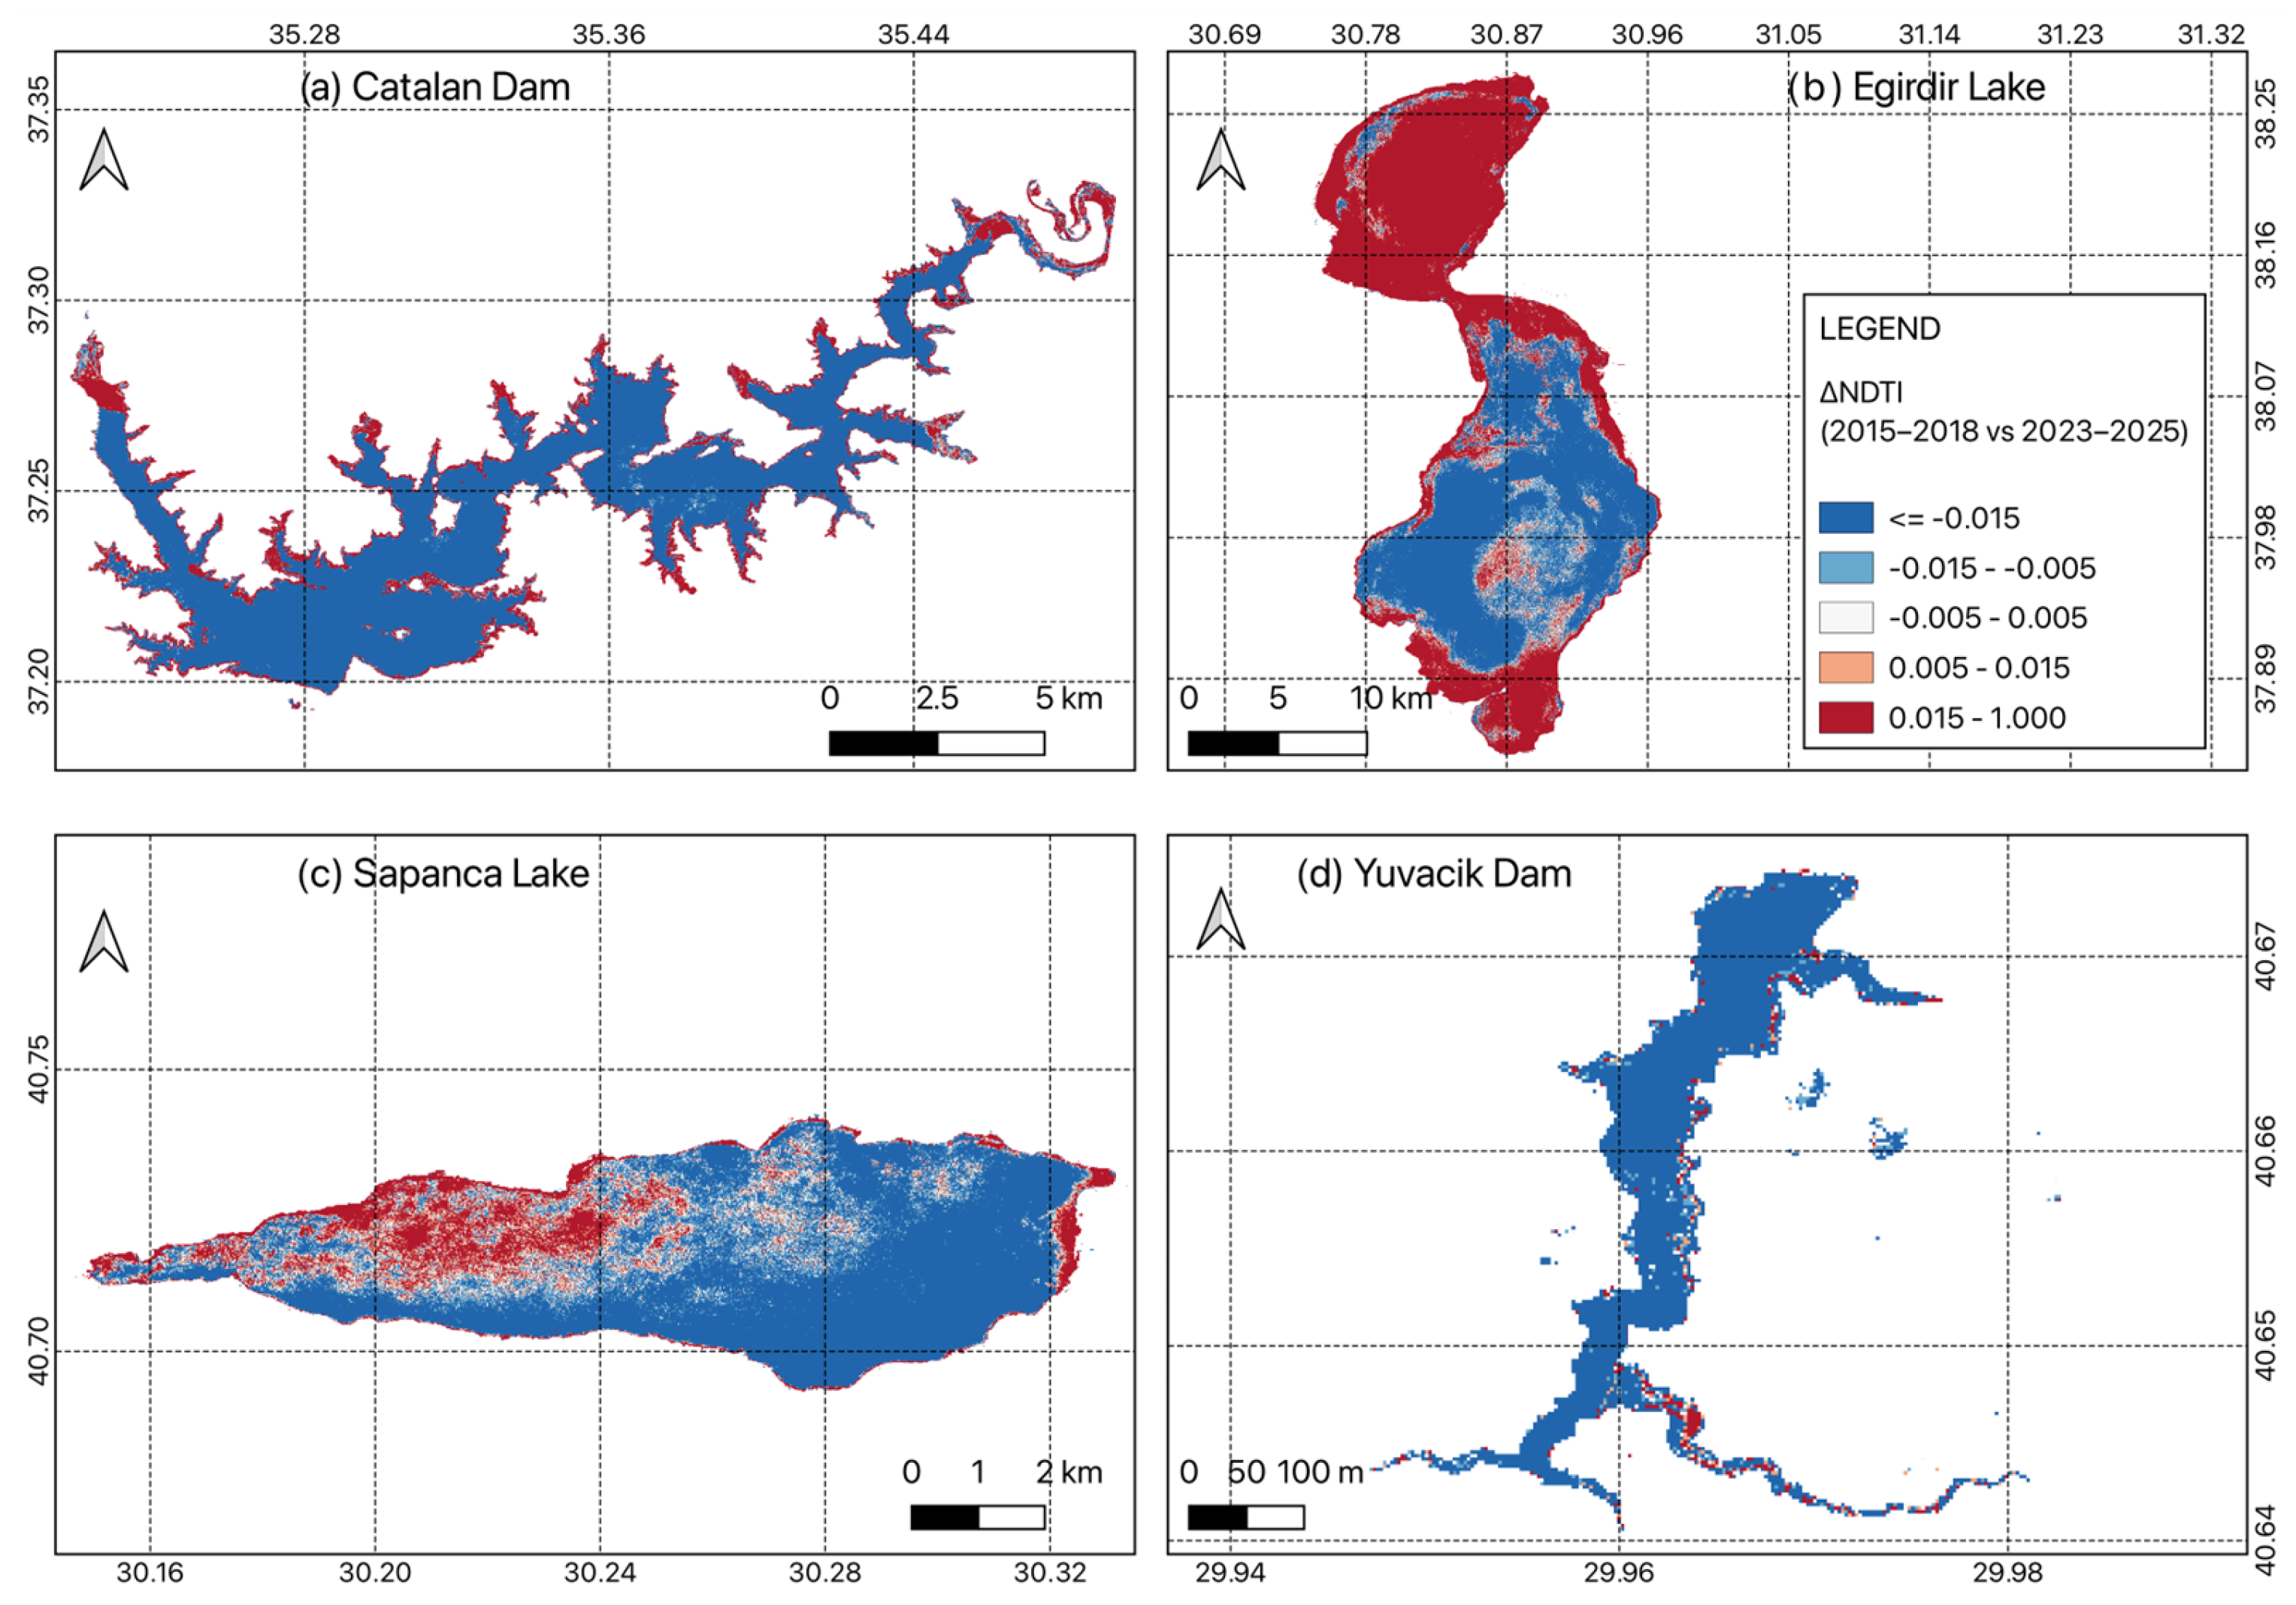
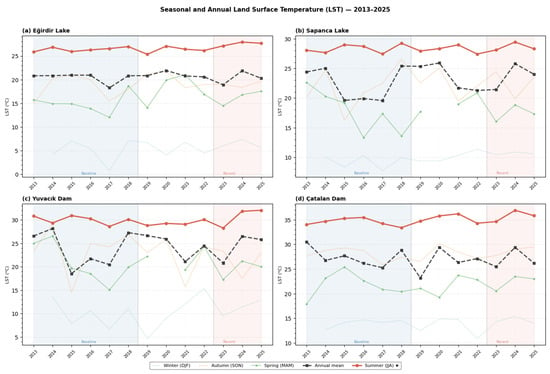
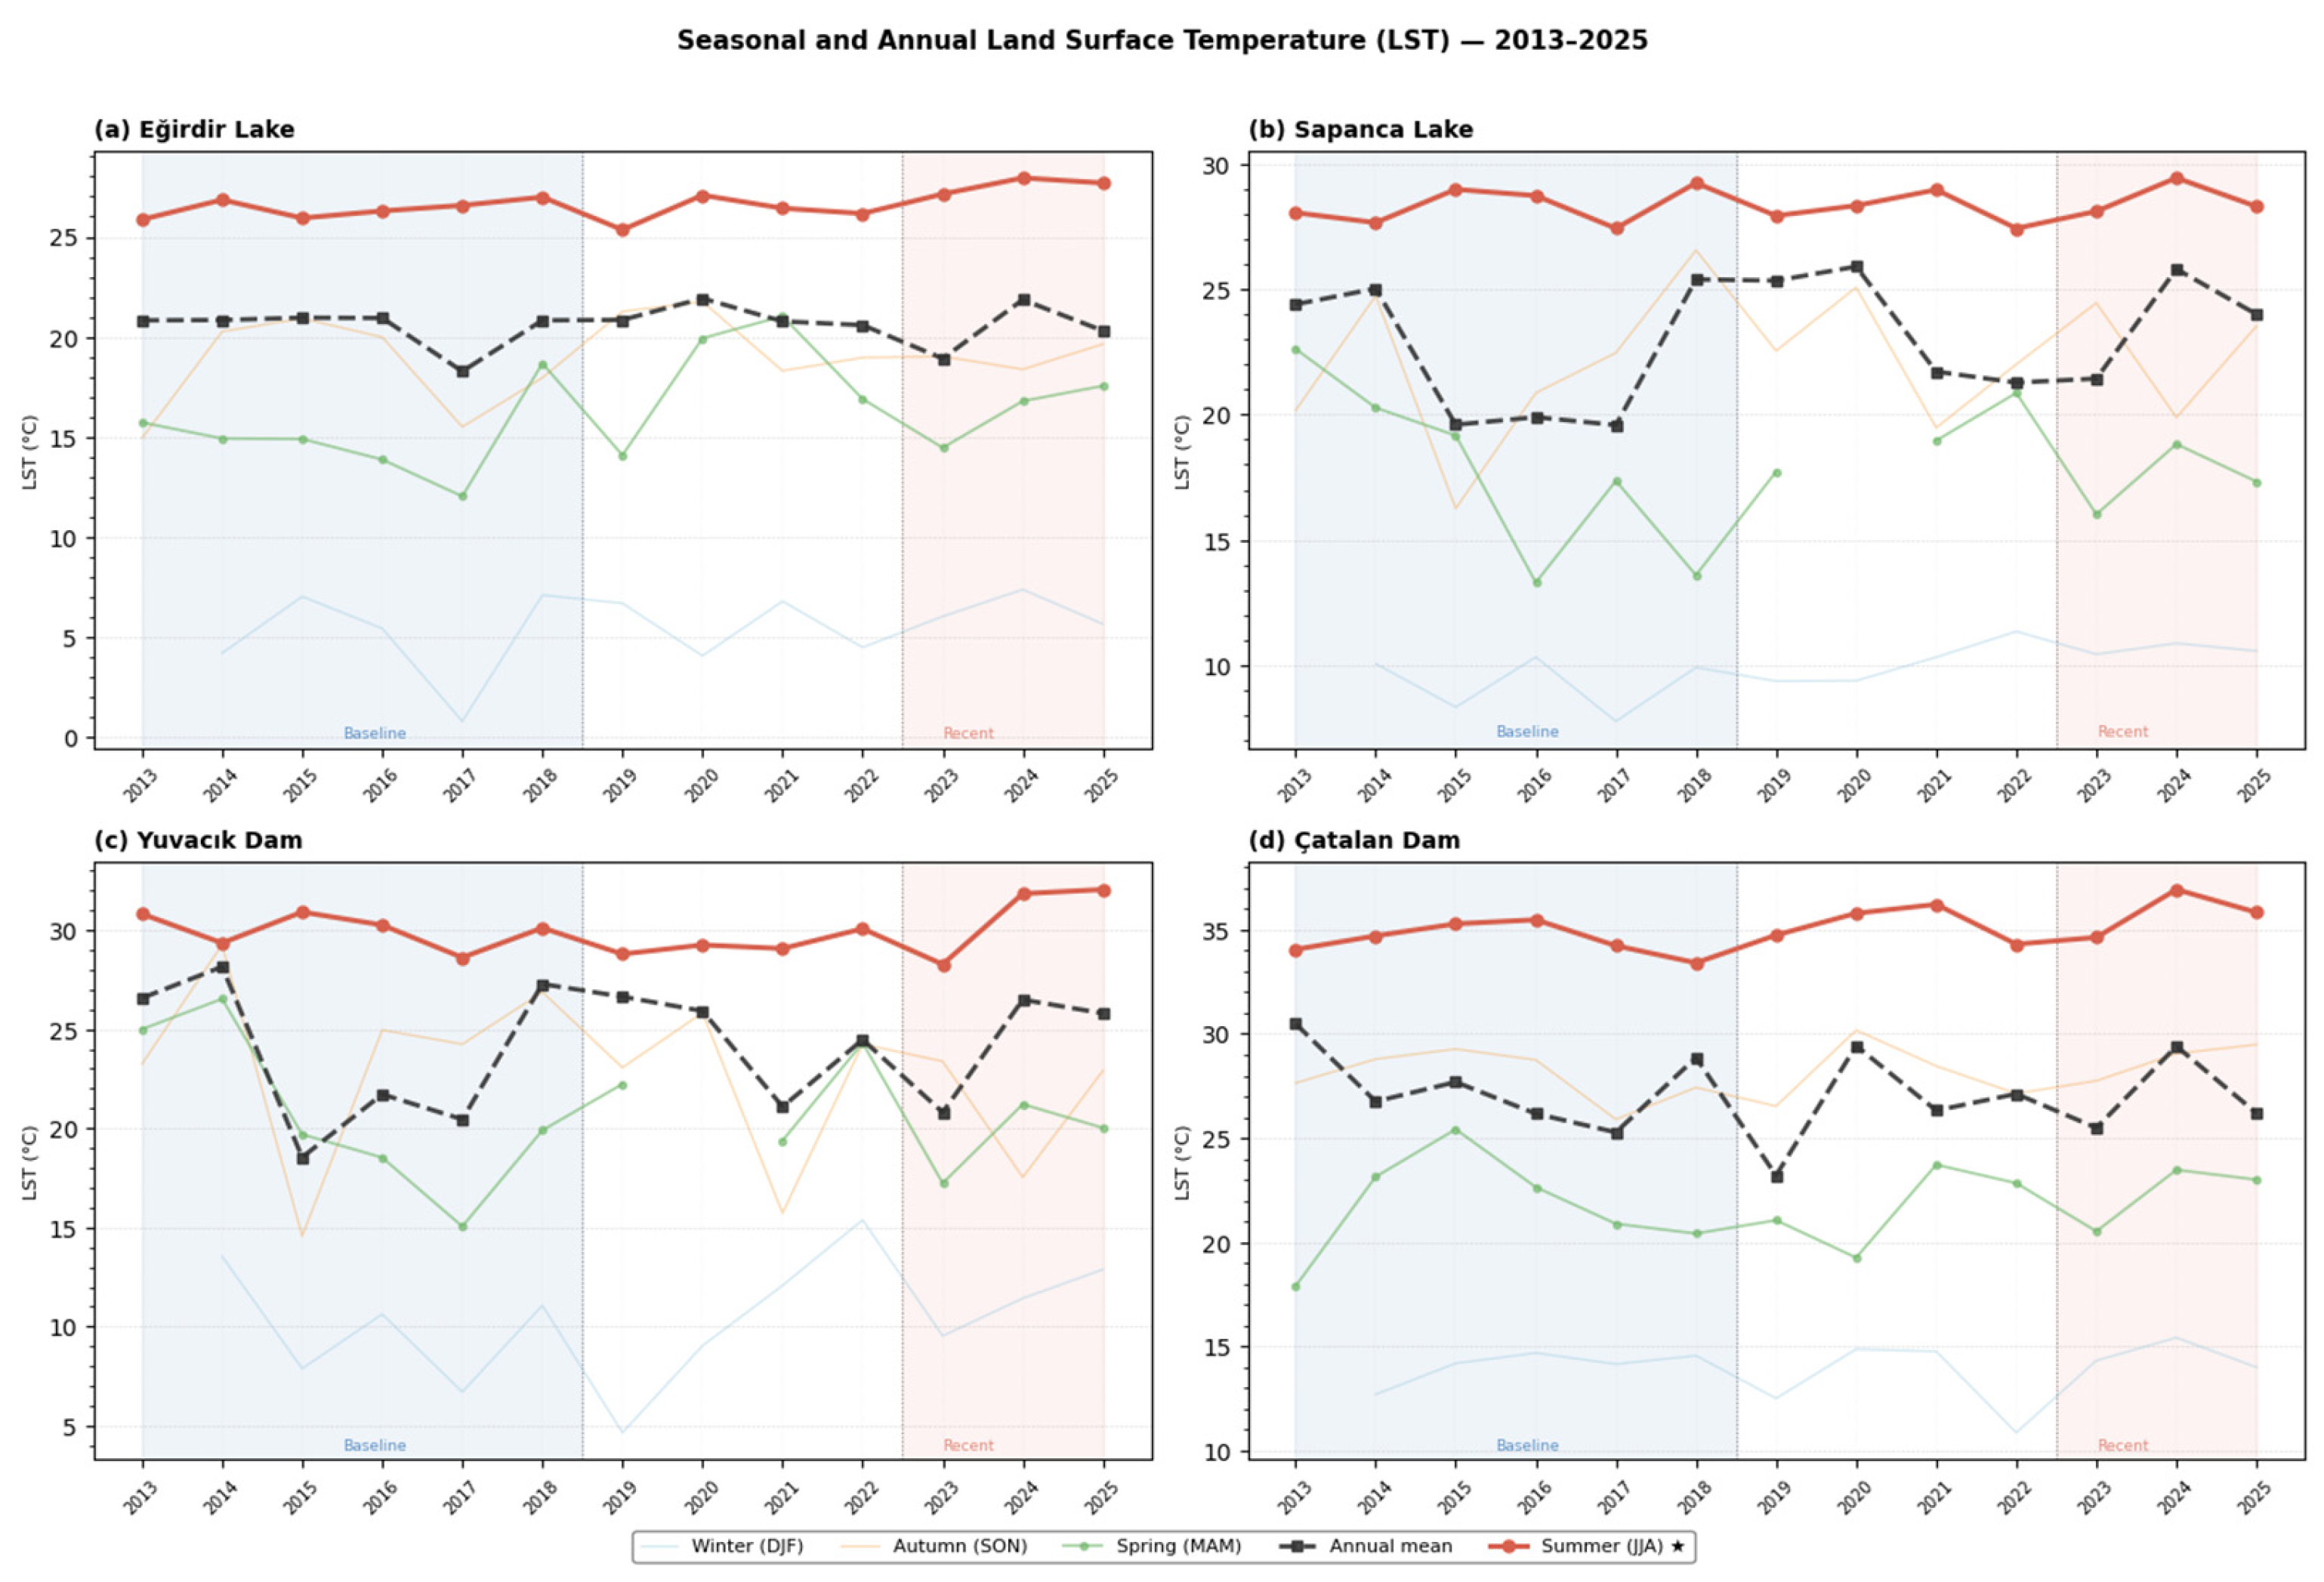
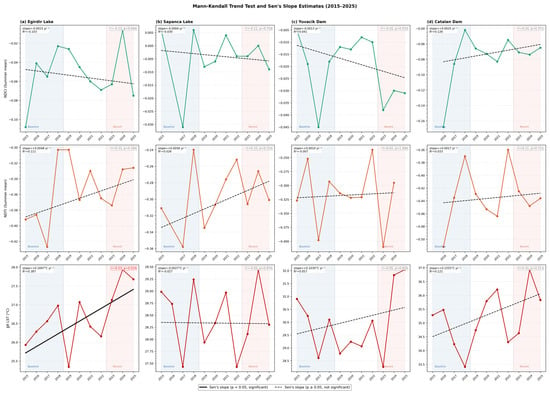
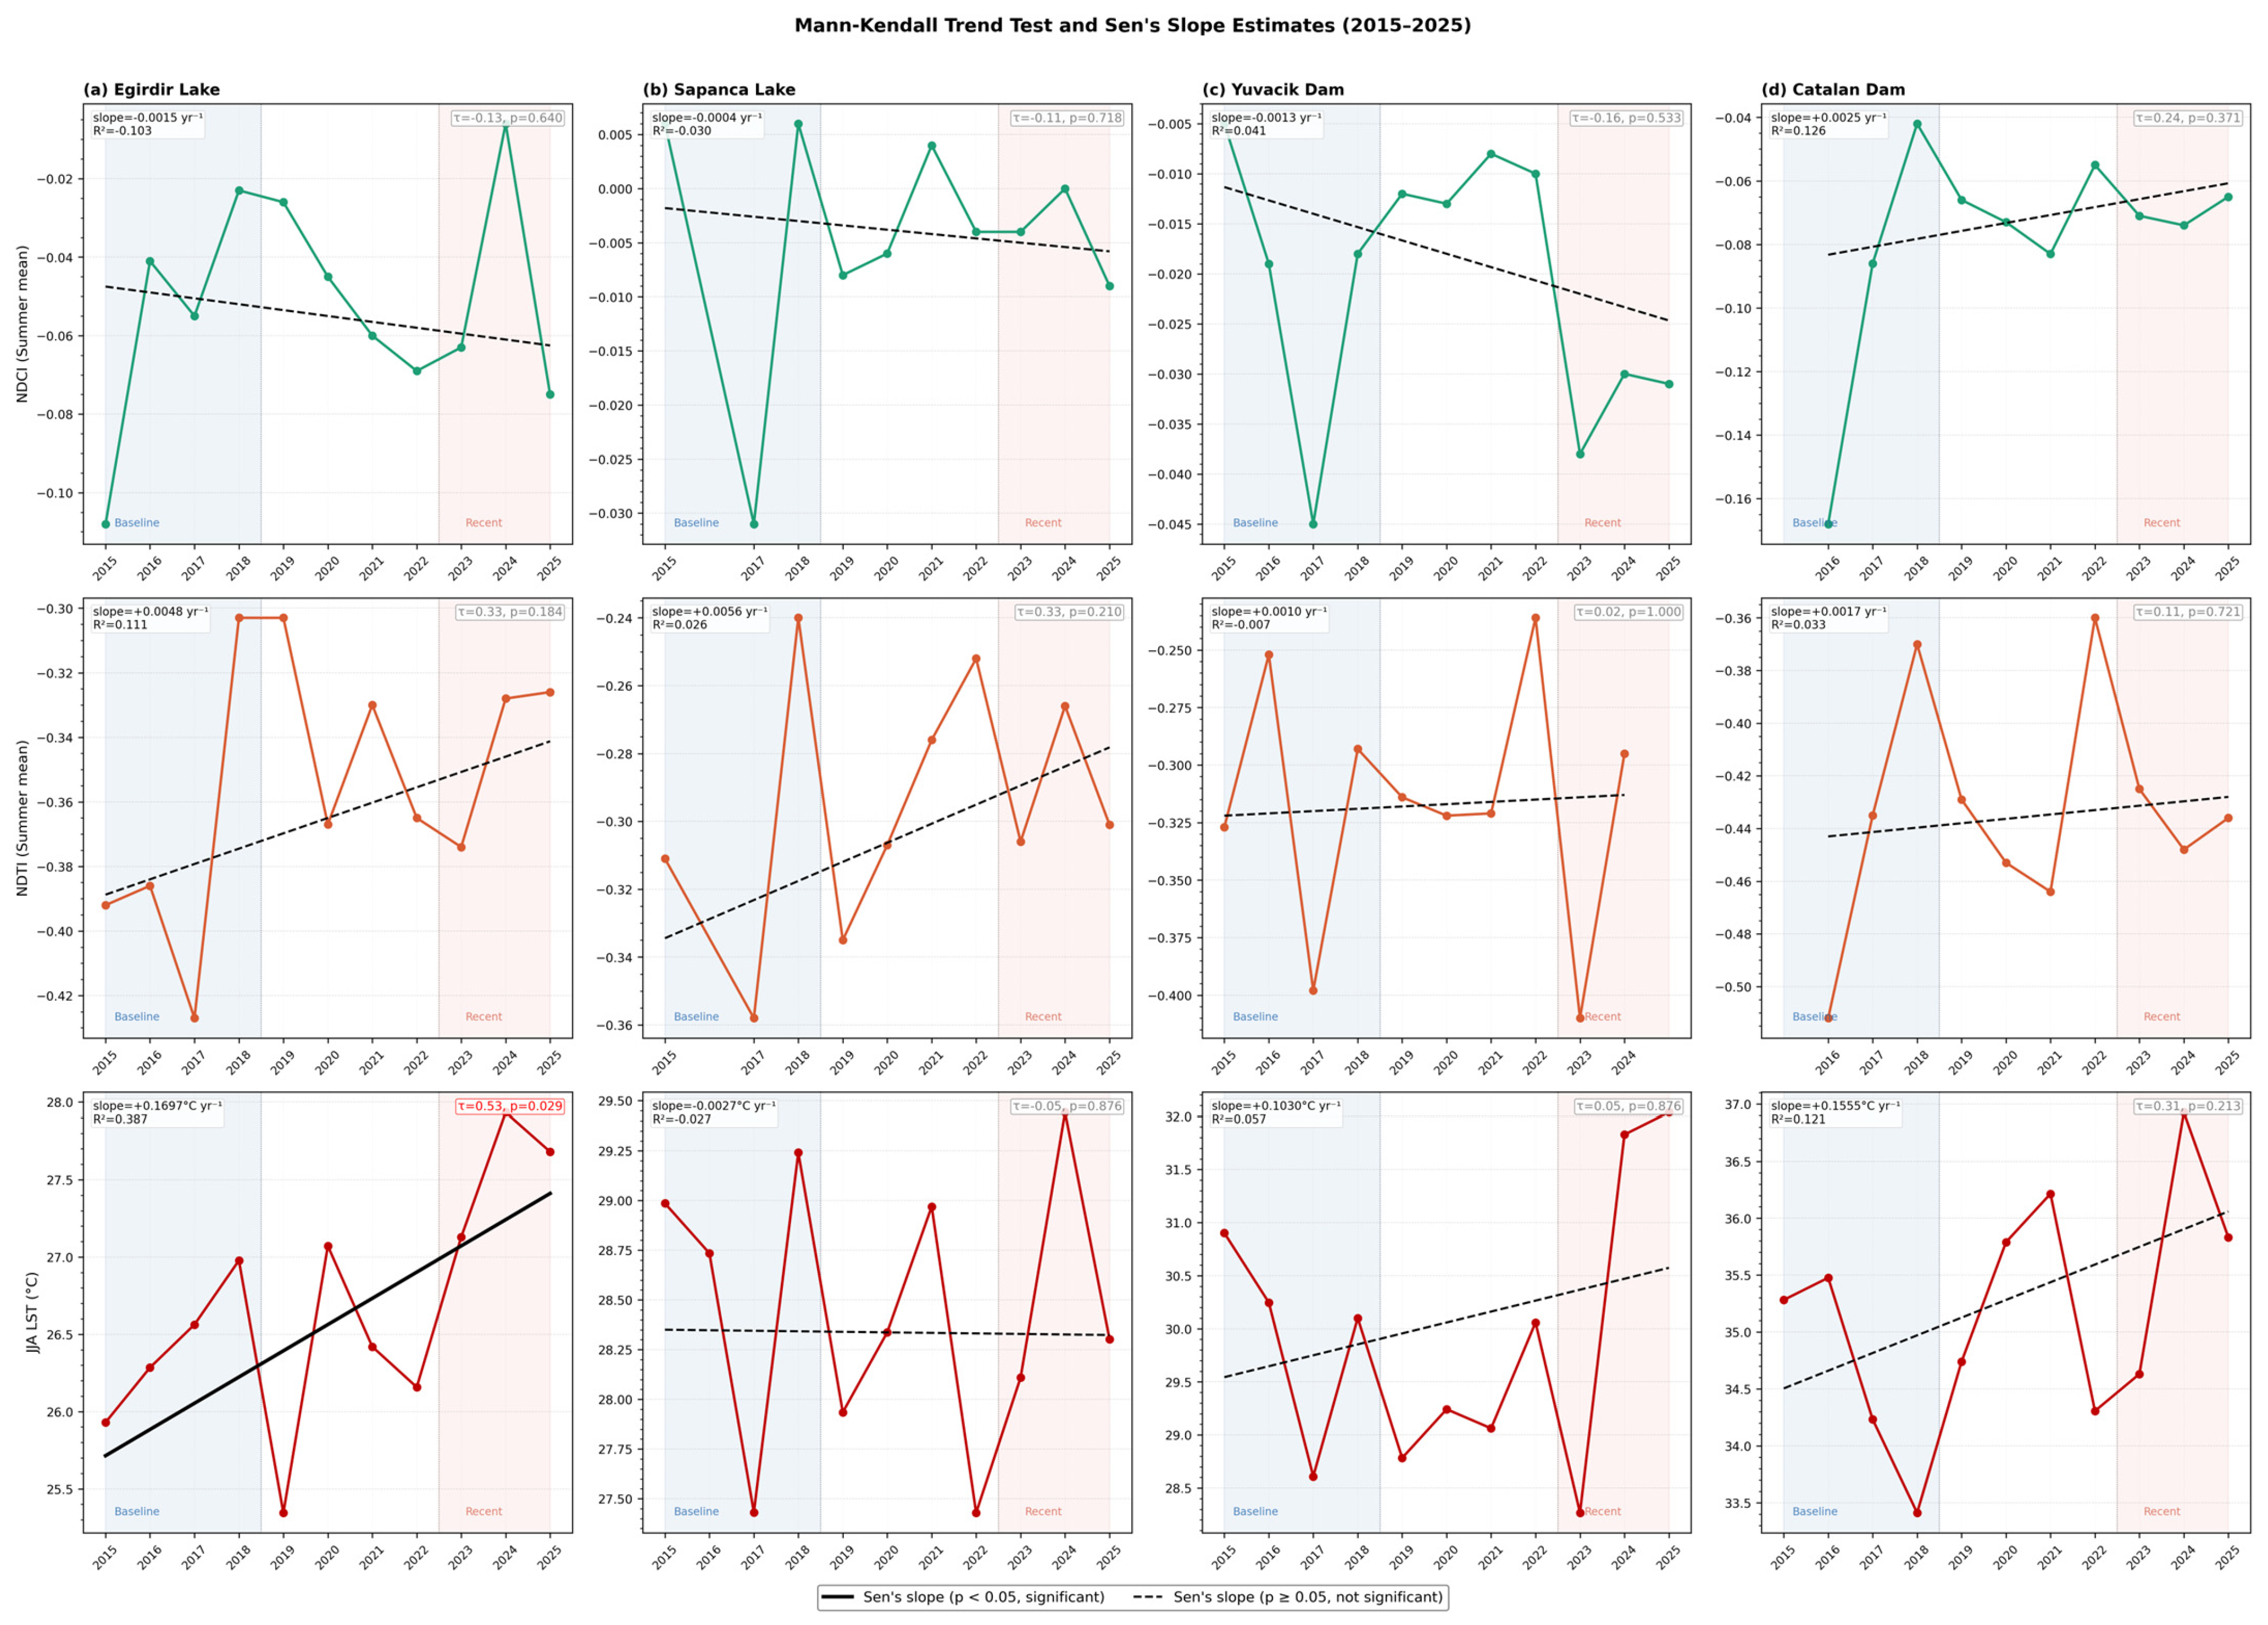
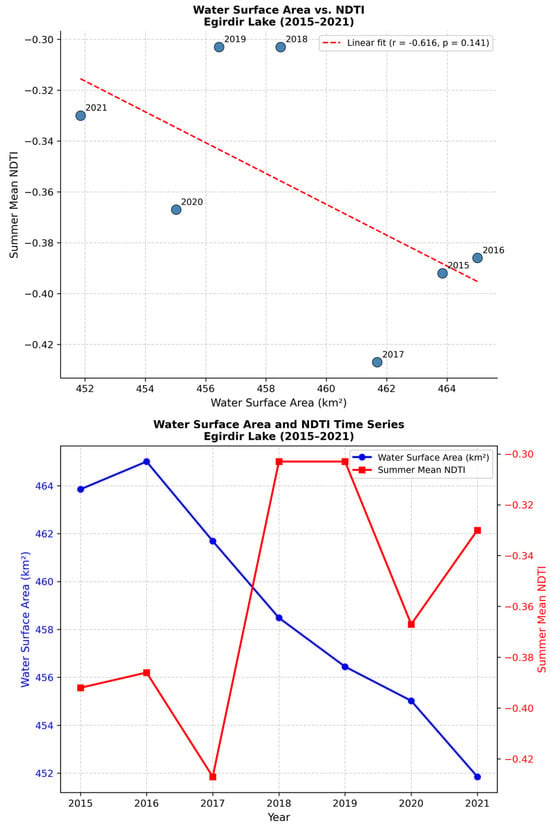
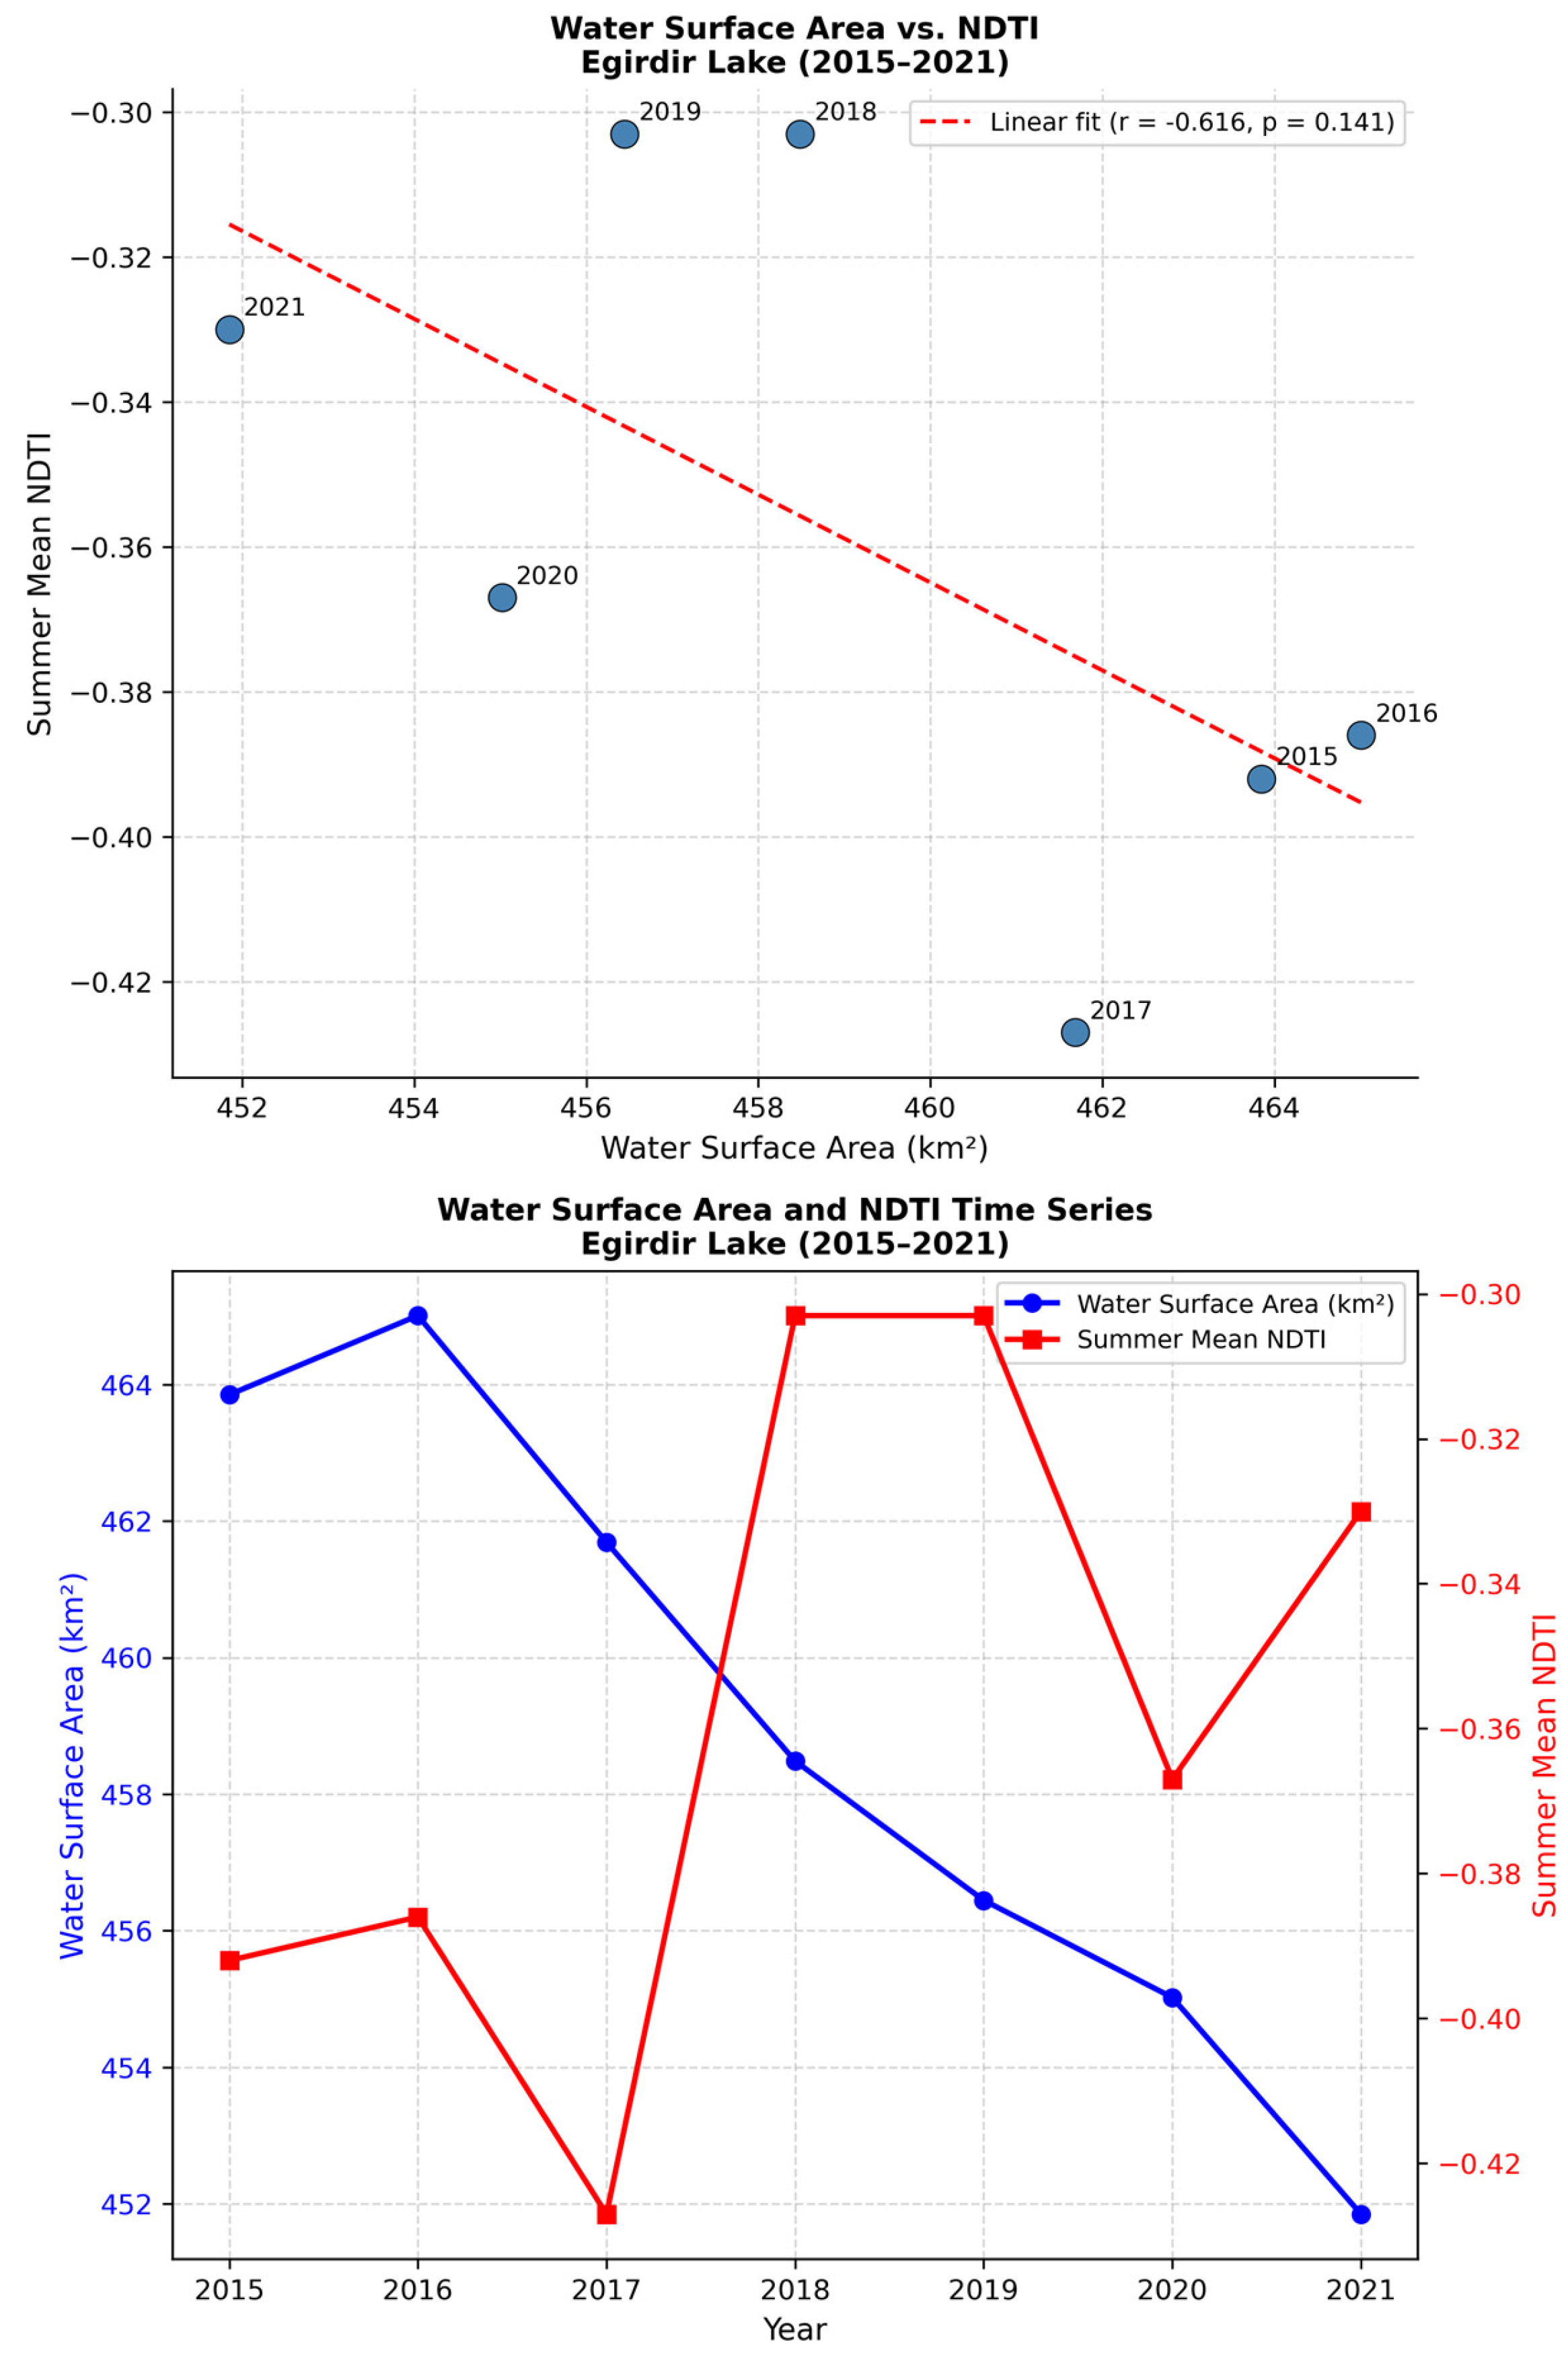

Disclaimer/Publisher’s Note: The statements, opinions and data contained in all publications are solely those of the individual author(s) and contributor(s) and not of MDPI and/or the editor(s). MDPI and/or the editor(s) disclaim responsibility for any injury to people or property resulting from any ideas, methods, instructions or products referred to in the content. |
© 2026 by the authors. Licensee MDPI, Basel, Switzerland. This article is an open access article distributed under the terms and conditions of the Creative Commons Attribution (CC BY) license.